Article

FLAC3D Modeling of Shear Failure and Fracture of Anchor Bolts in Surrounding Rock: A Study on Stress-Bearing Ring Reinforcement

1
Key Laboratory of Xinjiang Coal Resources Green Mining, Xinjiang Key Laboratory of Coal-Bearing Resources Exploration and Exploitation, Xinjiang Engineering Research Center of Green Intelligent Coal Mining, Xinjiang Institute of Engineering, Urumqi 830023, China
2
School of Mines, China University of Mining and Technology, Xuzhou 221116, China
3
School of Geology and Mining Engineering, Xinjiang University, Urumqi 830047, China
*
Authors to whom correspondence should be addressed.
Symmetry 2025, 17(11), 1885; https://doi.org/10.3390/sym17111885 (registering DOI)
Submission received: 7 October 2025 / Revised: 28 October 2025 / Accepted: 1 November 2025 / Published: 6 November 2025
(This article belongs to the Special Issue Symmetry and Geotechnical Engineering)

Abstract

To address the challenge of simulating shear failure in anchor bolts within FLAC3D, a shear failure criterion, Fs(i)Fsmax(i), is proposed based on the PILE structural element. Through secondary development using the FISH programming language, a modified mechanical model of the PILE element is established and integrated into the FLAC3D-FISH framework. Comparative analyses are conducted on shear tests of bolt shafts and on anchor bolt support performance under coal–rock interface slip conditions, using both the original PILE model and the modified mechanical model. The results demonstrate that the shear load–displacement curve of the modified PILE model clearly reflects shear failure characteristics, satisfying a quantitative shear failure criterion. Upon failure, both the shear force and axial force of the structural element at the failure point drop abruptly to zero, enabling effective simulation of shear failure in anchor bolts within the FLAC3D environment. Using the modified model, the distribution of principal stress differences in the surrounding rock after roadway excavation is analyzed. Based on this, the concept of a stress-bearing ring in the surrounding rock is introduced. The reinforcing effects of bolt length, spacing, and ultimate load capacity on the stress-bearing ring in weak and fractured surrounding rock are investigated. The findings reveal that: (1) shear failure initiates in bolt shafts near the coal–rock interfaces, occurring earlier near the coal–floor interface than near the coal–roof interface; (2) the stress-bearing ring in weak and fractured surrounding rock shows a discontinuous and uneven distribution. However, with support improvements—such as increasing bolt length, reducing spacing, and enhancing failure load—the surrounding rock gradually forms a continuous stress-bearing ring with more uniform thickness and stress distribution, migrating inward toward the roadway surface.

1. Introduction

Over 80% of underground coal mine roadways in China are coal roadways or semi-coal roadways, which are primarily supported by anchor bolts and anchor cables [1,2,3]. Anchor bolt support plays a critical role in maintaining the stability of the surrounding rock in these roadways. Accurately modeling the bearing capacity of anchor bolts in numerical simulations is essential for the effective design of bolt-anchored support systems. Previous research by both domestic and international scholars has primarily focused on the tensile failure of anchor bolts [4,5,6,7]. However, with increasingly complex engineering conditions in recent years, shear failure in anchor bolts has become more prevalent, as illustrated in Figure 1. As a result, the deformation and failure of anchor bolts under combined tensile and shear loading have received growing attention.
Li et al. systematically investigated the deformation and mechanical behavior of anchored joints under combined tensile–shear loading, revealing the internal anchoring mechanisms in jointed rock masses based on the interaction between the rock/grout and anchor bolts [8,9,10]. Xu et al. through an analysis of the shear mechanical model of anchor bolts in jointed rock masses, established a formula for the shear strength of reinforced joints by introducing the concept of an “equivalent shear area.” They also examined the influence of factors such as anchor bolt strength, surrounding rock strength, and bolt diameter on anchoring performance [11]. Li et al. using classical beam theory and the minimum complementary energy variational method, derived theoretical formulas describing the variation in axial force in anchor bolts under shear loading. They proposed a method for calculating the shear resistance of anchor bolts and analyzed the effects of surrounding rock strength and bolt diameter on axial force, shear force, and shear resistance [12]. Wu et al. conducted shear tests on anchored joints with varying surface roughness under different normal stresses, analyzing the effects of joint roughness and normal stress on anchoring performance [7,13]. Meng et al. studied the impact of anchor bolt elongation on anchoring behavior and employed acoustic emission technology to investigate the damage evolution of anchored joints during the shear process [14]. Wu et al. also systematically examined the causes of fracture in high-strength anchor bolt shafts, taking into account factors such as the service environment, operational conditions, and the microstructural characteristics of the fractures [15,16,17]. Si et al. conducted laboratory experiments to investigate the mechanical response and deformation–failure characteristics of full-scale anchor bolts under combined tensile–shear loading [18,19].
The aforementioned studies have significantly advanced our understanding of the characteristics and mechanisms of shear failure in anchor bolts, providing valuable guidance for the design of rock support systems in engineering practice. FLAC3D numerical simulation serves as a critical link between theoretical and experimental research and its practical application in engineering projects [15,20]. Accurately modeling the bearing capacity of anchor bolts in numerical simulations is essential for effective support design. The PILE structural element, commonly used to simulate anchor bolts, offers high computational efficiency and can be customized via the user-defined FISH language. This allows for modification of the mechanical behavior of both the anchor bolt and the anchoring interface to accommodate diverse simulation requirements, making it widely adopted in practice. However, the built-in PILE structural element in FLAC3D lacks the ability to simulate critical behaviors such as bending yield and shear failure of anchor bolts, which is inconsistent with actual engineering conditions. Although some researchers have attempted to address this limitation-for example, Lou et al. developed a simplified piecewise linear model based on shear stress–strain curves obtained from double-shear tests to enhance the PILE element [18,21]; Tu et al. proposed a comprehensive mechanical model for anchor bolt deformation under shear loading, embedding it into the PILE structural element based on experimental data [22]; and Chen et al. modified the PILE element to simulate both shear fracture and combined tensile–shear fracture, applying the improved model to analyze surrounding rock stability in layered roadway structures [23]—these efforts, while refining shear modeling to some extent, generally consider shear force in isolation, without accounting for the complex interaction of forces acting on anchor bolts in real-world conditions.
Moreover, the mechanical behavior of anchor bolts and the stress-bearing structure of surrounding rock exhibit inherent symmetry. During roadway excavation and reinforcement, stress redistribution forms geometrically and mechanically symmetric patterns, reflecting the balanced transfer of tensile and shear forces. Recognizing this symmetry enhances the interpretation of simulation results and clarifies the coordinated deformation and mutual reinforcement between the support system and surrounding rock.
To address the limitation of FLAC3D in simulating shear failure of anchor bolts, this paper proposes a shear failure criterion for anchor bolts based on the PILE structural element. A revised mechanical model for the PILE element shaft is developed through secondary programming using the FISH language and integrated into the main FLAC3D framework. Comparative analyses are performed between shear tests using the original PILE element model and the revised mechanical model, as well as bolt support simulations under coal–rock interface slip conditions. The results confirm that the shear load–displacement curve of the revised PILE model reflects distinct characteristics of shear failure, thereby enabling the simulation of anchor bolt shear failure within FLAC3D. Furthermore, using the revised bolt support model, the distribution characteristics of the principal stress difference in the surrounding rock after roadway excavation are analyzed. The concept of a stress-bearing ring in the surrounding rock is introduced, and the effects of bolt length, spacing, and failure load on the development of this stress-bearing ring in weak and fractured surrounding rock are investigated.

2. Modification and Implementation Process of PILE Structural Elements

2.1. Existing PILE Structural Element Models in FLAC3D and Their Associated Issues

(1) Basic composition and principles of PILE structural elements.
A single PILE structural element consists of two structural nodes and a connecting member, which effectively simulates the interaction between the normal and axial directions of the surrounding solid elements. As such, the PILE element can accurately represent both axial tension and normal shear behavior of anchor bolts. Its mechanical model is illustrated in Figure 2. As shown in Figure 2, the transfer of forces and bending moments between the PILE element and the surrounding solid elements is realized through a tangential-normal coupled spring–slider system. The key geometric and mechanical parameters involved include the rod radius, axial stiffness, normal stiffness, normal cohesion, internal friction angle, and stiffness of the grouting material. Additionally, tangential cohesion, tangential friction angle, tangential stiffness of the grouting material, and the diameter of the drilled hole are also considered.
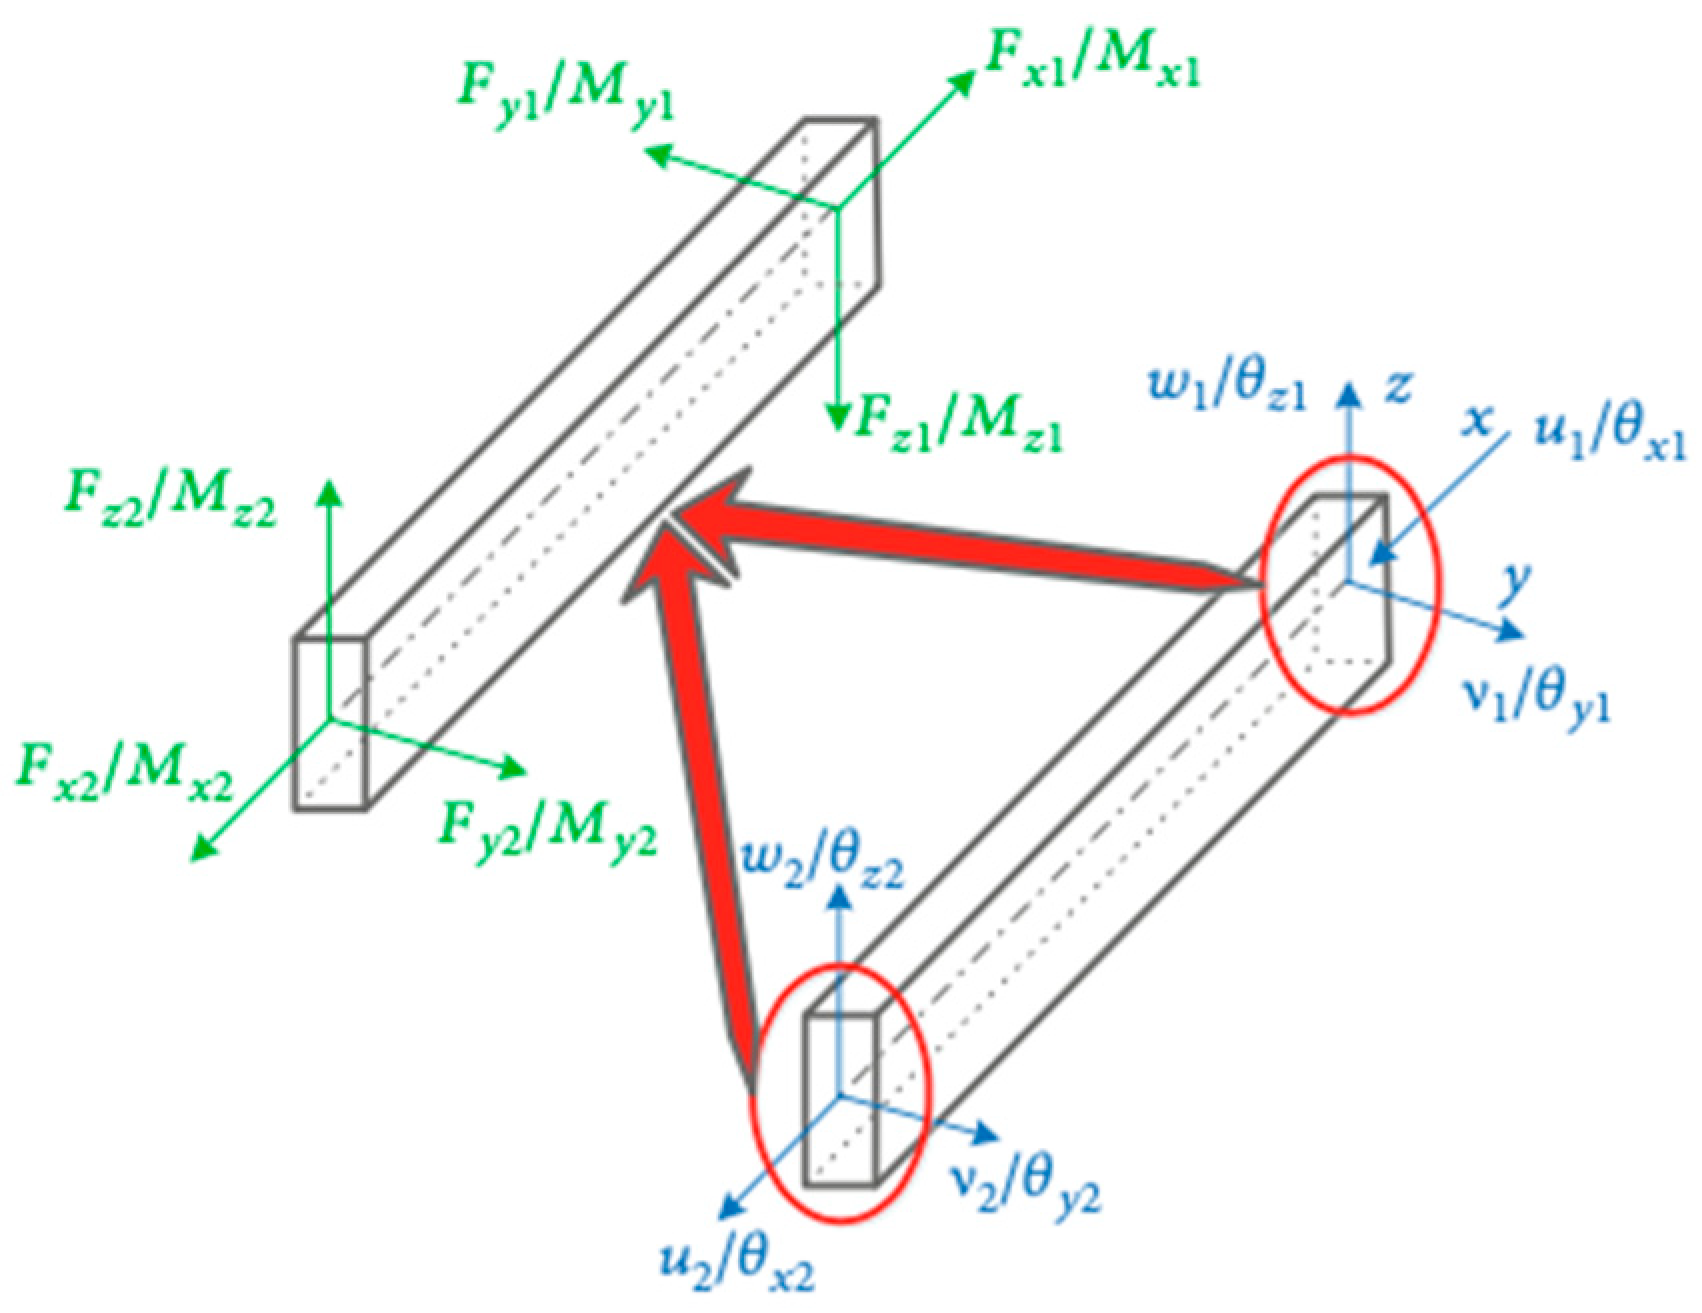
The line segment connecting the two structural nodes is referred to as the structural member, which is responsible for storing the axial and shear forces within the structural element. To clearly define the forces acting on the member, each structural element is assigned a local coordinate system, as illustrated in Figure 3. In this system, the x-direction represents the axial direction, oriented from node 1 to node 2, while the y and z directions are orthogonal to the axial direction and represent the shear directions. Each structural node possesses six degrees of freedom: three translational and three rotational. Additionally, every structural element is assigned a unique component identification number (CID). By assembling multiple such elements, a complete anchor system can be accurately simulated.
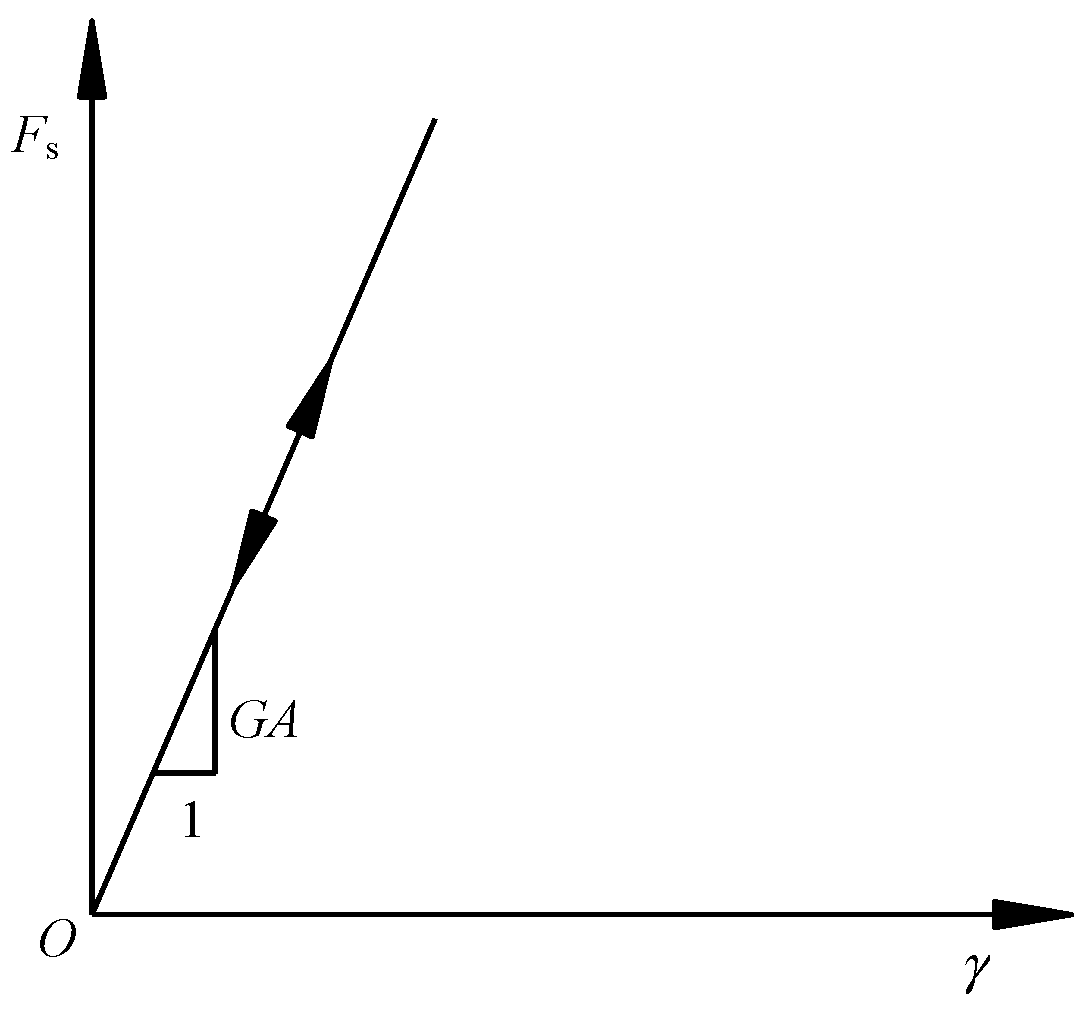
The normal shear mechanical model of the PILE element is illustrated in Figure 4. This model exhibits a single elastic stage, which can be expressed as follows:
F s = A G γ
In the formula, Fs represents the shear force acting on the shaft, A is the cross-sectional area, G is the shear modulus, and γ is the shear strain.
(2) Axial mechanical model of the PILE element shaft and implementation of tensile rupture
When simulating an anchor using PILE elements, the plastic tensile strain (εpl) of each structural member can be recorded. The corresponding calculation expression is given below:
ε pl = ε pl a x + d 2 θ pl L
In the formula, εpl represents the plastic tensile strain, d is the diameter of the member, L is the length of the member, θpl is the average rotation angle of the member.
As shown in Equation (2), the plastic tensile strain is the sum of the axial plastic strain and the bending plastic strain. During the numerical simulation process, users can define a custom tensile failure strain (tf-strain). When the plastic tensile strain of the member exceeds the tensile failure strain, the force and bending moment in the member suddenly drop to zero, indicating tensile failure. The tensile rupture mechanical model of the PILE element is illustrated in Figure 5.
When used to simulate anchor rods, the PILE structural element exhibits the following characteristics:
(1) It is a linear element capable of simulating both axial tension and compression, as well as shear forces acting perpendicular to the rod axis.
(2) By specifying a tensile failure strain, the PILE element can represent tensile failure; however, it cannot simulate shear failure of the anchor rod.

2.2. The Revised Model of PILE Structural Elements and the Implementation Process of Its Modification Program

(1) Revised model of PILE elements
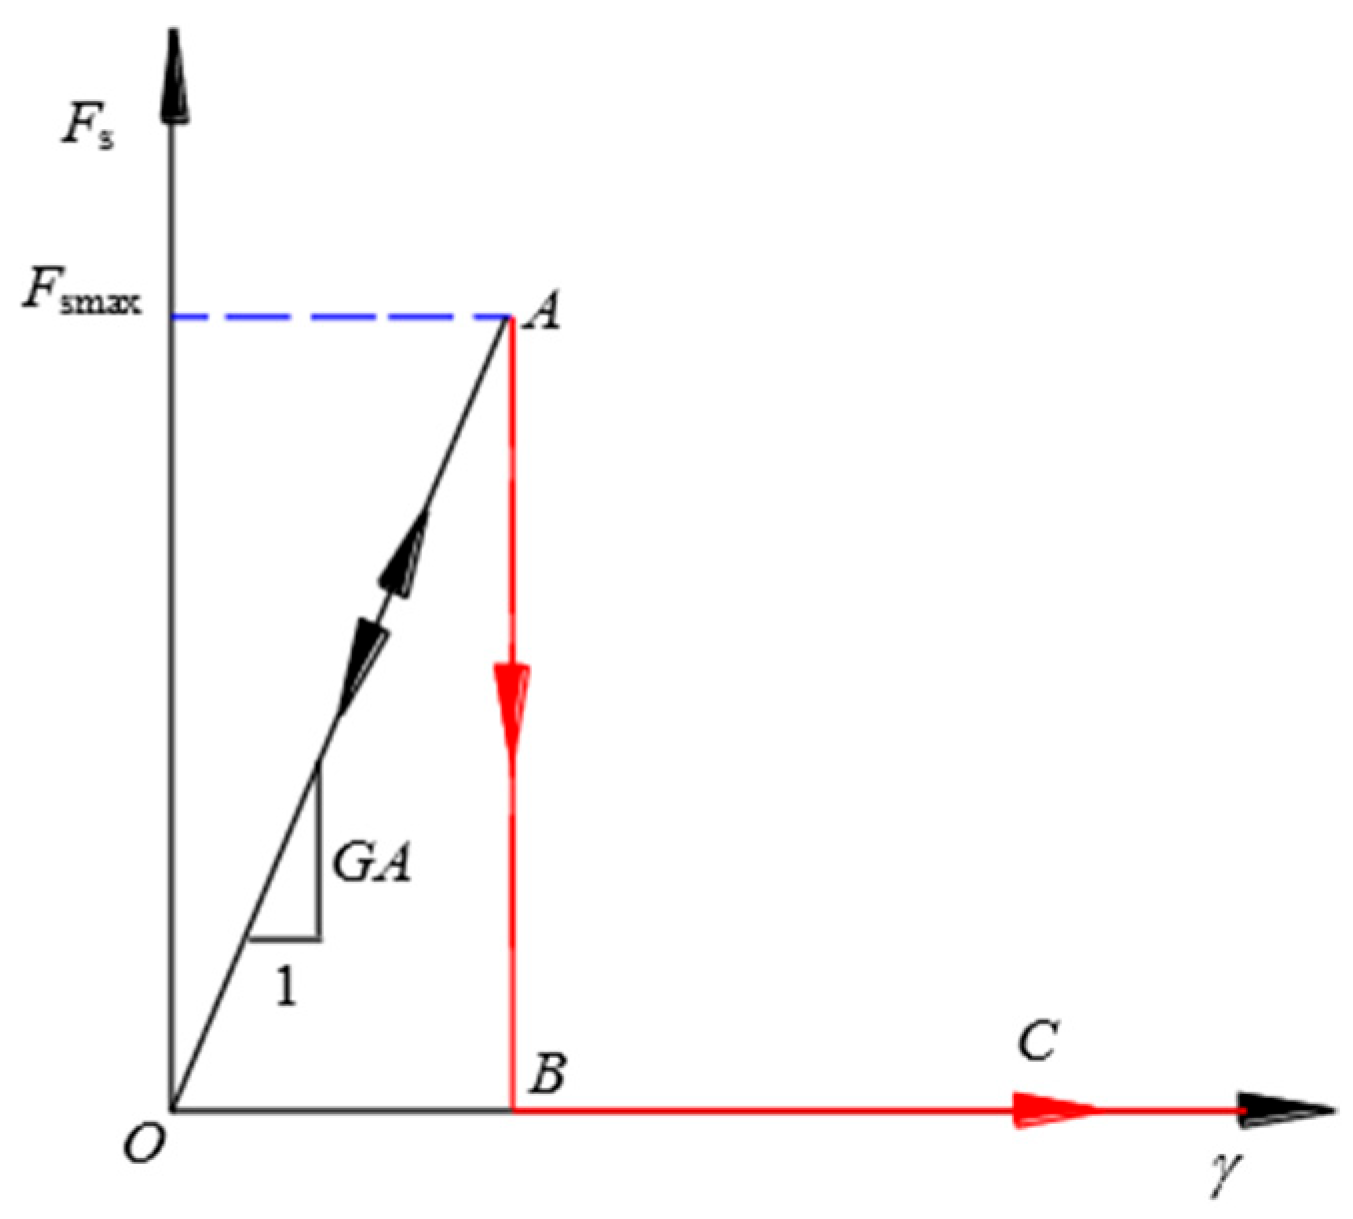
Yang et al. conducted shear tests on anchor rods and cables, obtaining shear force–displacement curves [24]. Their results showed that, prior to shear failure, the shear force increased approximately linearly with the increase in shear displacement. Once the shear force reached its peak value, the rod experienced shear failure. Based on this observation, a failure condition Fs(i)Fsmax(i) was introduced into the existing PILE element in FLAC3D to enable the simulation of shear failure. Here, Fs(i) is the shear force of the element with CID equal to i, which can be obtained through monitoring, while Fsmax(i) is the shear failure load for the same element, which must be specified manually. The modified mechanical model is illustrated in Figure 6. The evolution of shear force in the member is divided into two stages, with the corresponding mechanical expressions given below:
F s = A G γ                     ( F s < F smax ) 0                                 ( F s F smax )
The shear response of the element is divided into two stages:
(1) Shear elastic stage (segment OA): This stage follows the original mechanical model, where the shear force increases linearly with displacement.
(2) Shear failure stage (segment A-B-C): In this stage, once failure occurs, the shear force, axial force, and bending moments in the failed member drop to zero. Additionally, their increments also become zero, indicating complete loss of load-bearing capacity.
(2) The process of implementing the revised model program for PILE elements
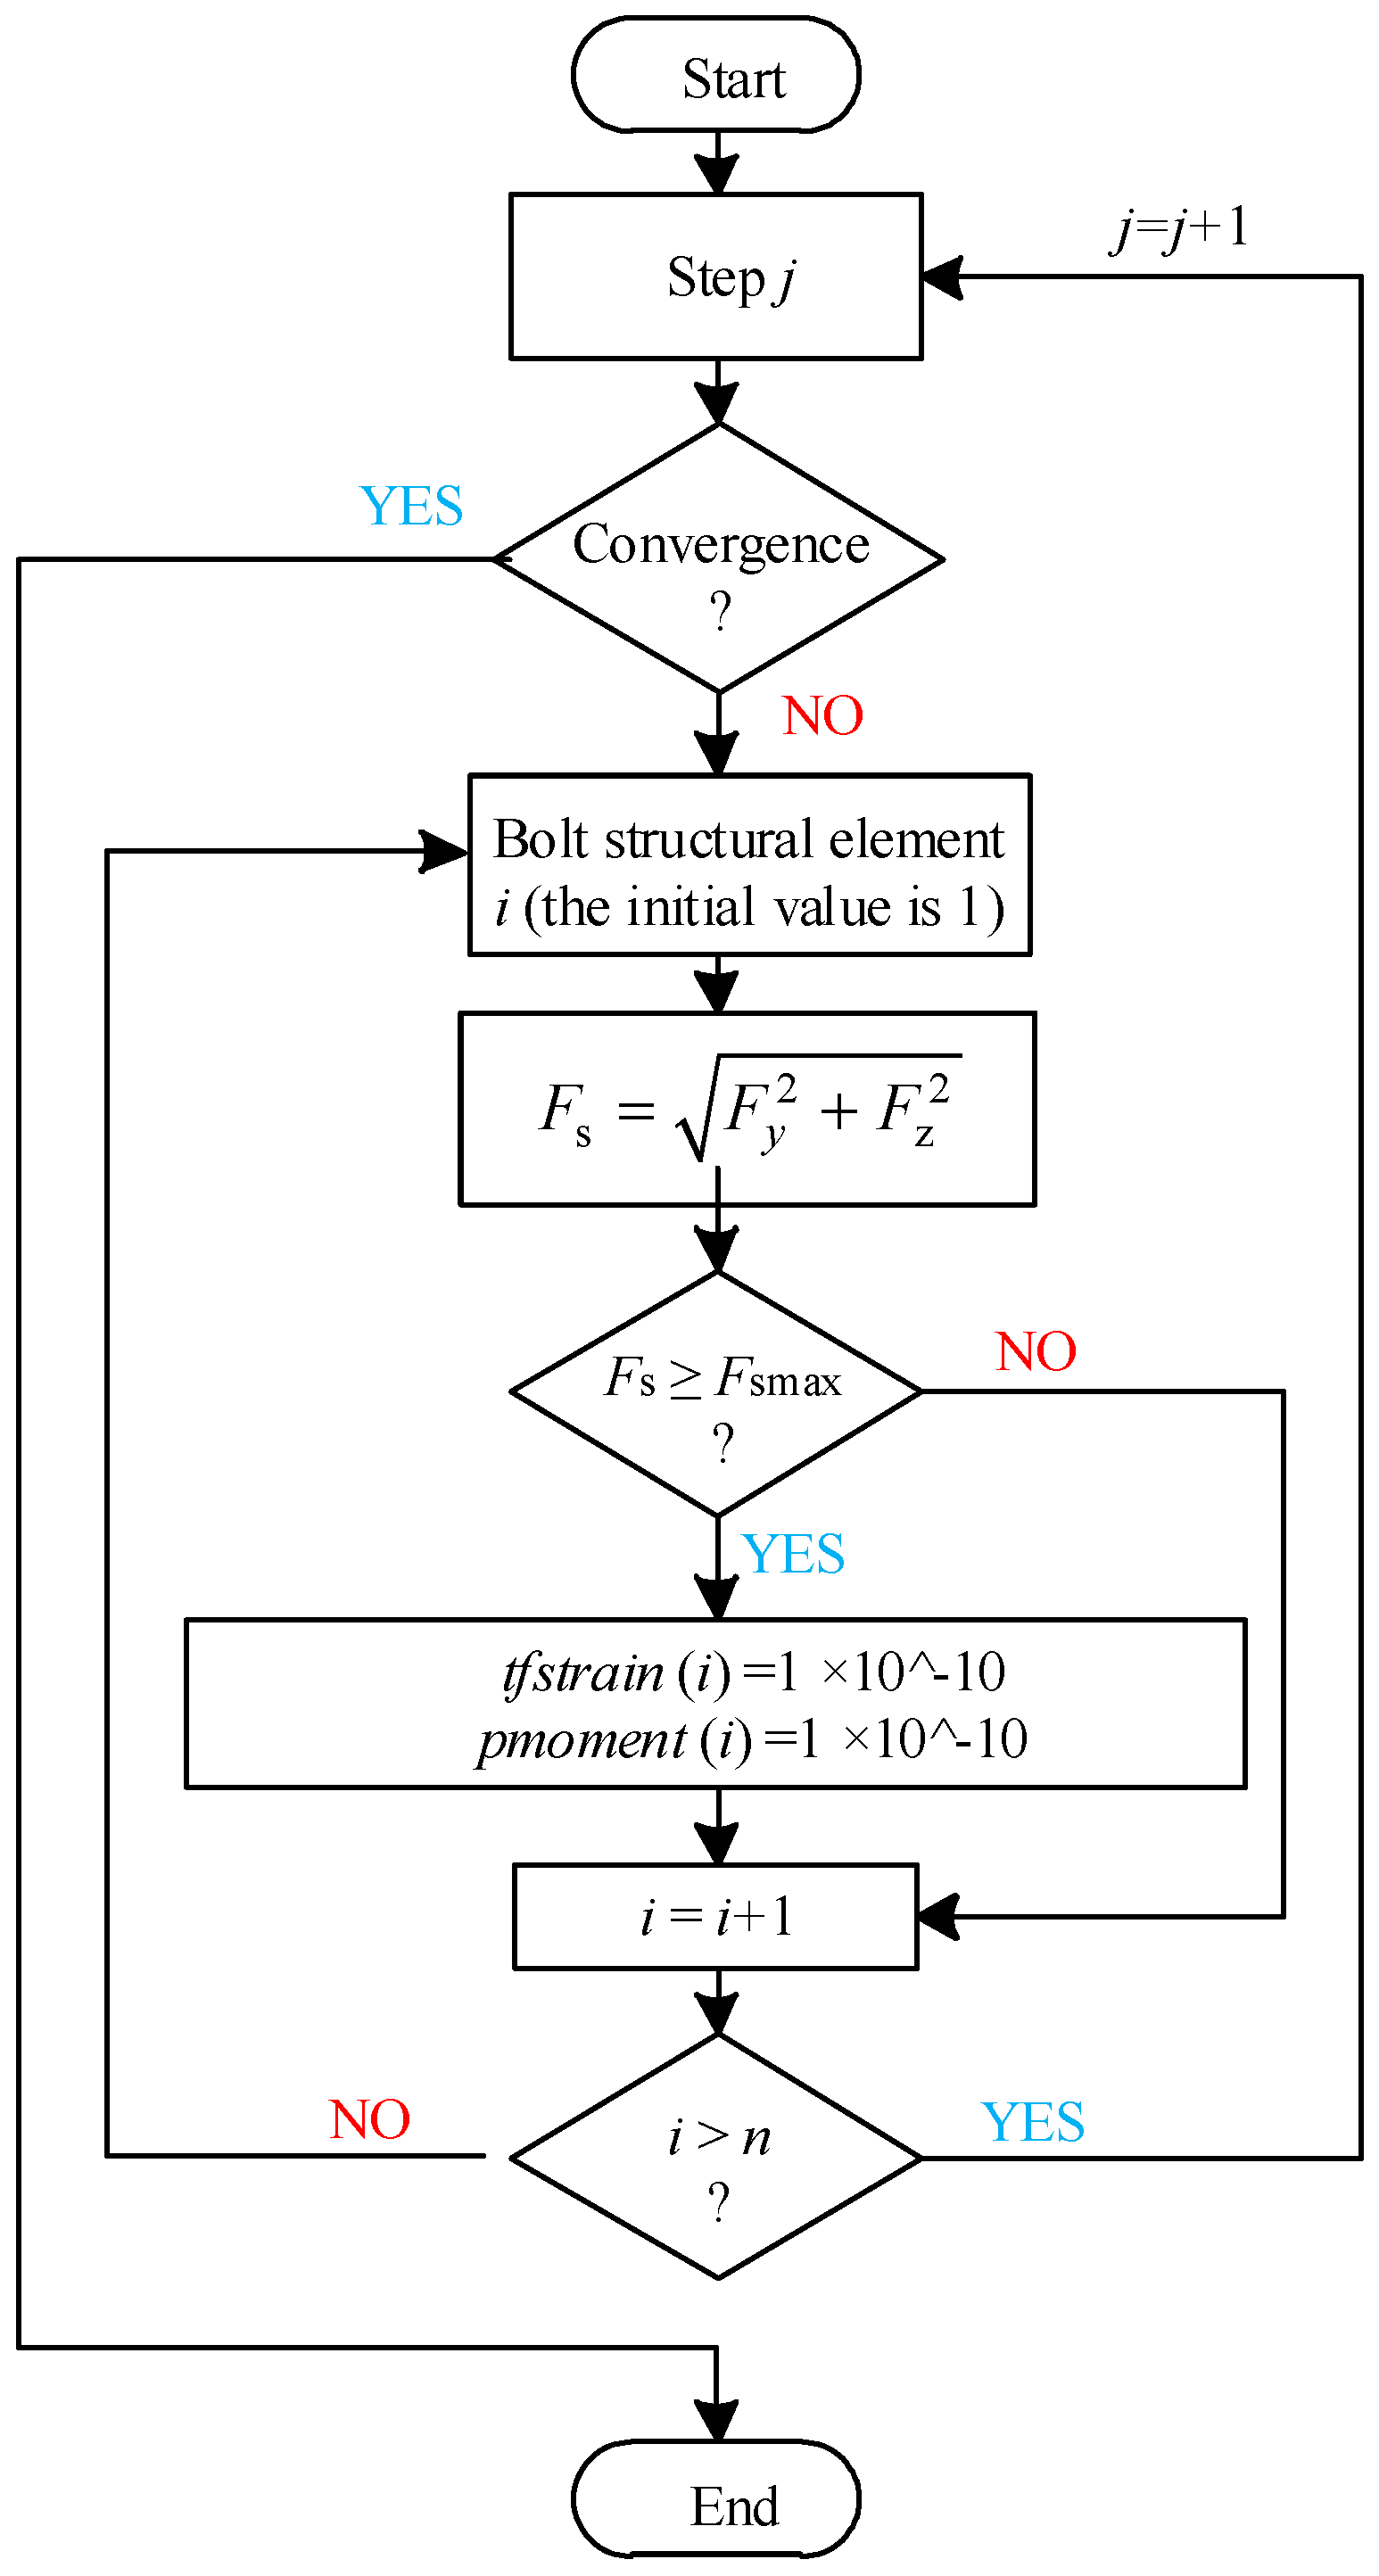
The implementation process of the revised mechanical model for PILE elements is illustrated in Figure 7. Taking the j-th calculation step as an example, the flowchart can be described as follows:
(1) At the j-th calculation step, the maximum unbalanced force ratio is used as the convergence criterion. If convergence is achieved, the calculation terminates.
(2) If the program has not yet converged, it begins with the first structural element (CID = 1). The shear force Fs of the structural element is computed as the square root of the sum of the squares of the two shear force components (Fy and Fz) in the local coordinate system.
(3) It is then determined whether the shear force of the structural element is greater than or equal to its ultimate shear load capacity. If this condition is met, the tensile failure strain tf-strain(i) and plastic bending moment pmoment (i) of the element are assigned a value slightly greater than zero (taken as 1.0 × 10⁻¹⁰ in this study), effectively reducing the forces and bending moments in the element to zero. This represents shear failure of the anchor rod. The calculation then proceeds to the next element (CID = i + 1). If the condition is not met, it also proceeds directly to the element with CID = i + 1.
(4) Finally, it is checked whether the CID of the current element exceeds n (the total number of PILE elements). If so, the calculation proceeds to the next step; otherwise, the procedure for the next element is repeated.
The core concept of this flowchart is as follows: when the anchor rod has not experienced shear failure, the tensile failure strain and plastic bending moment of the structural element remain at their default values. Numerical results indicate that when both the tensile failure strain and plastic bending moment are set to zero—their default state—they exert no constraint on the structural element. Upon shear failure of the anchor rod, these parameters are assigned extremely small positive values (infinitesimally close to zero) to simulate failure behavior.
Using FLAC3D’s built-in functions, the shear forces of structural elements can be monitored, and element parameters can be dynamically updated. Specifically, the Fish functions sp_force (sp_pnt, 1, 2) and sp_force (sp_pnt, 1, 3) (as shown in Table 1) allow monitoring of the shear force components in the y and z directions for each element at every calculation step. The resultant shear force on the element’s cross-section can then be calculated. When this resultant shear force exceeds the ultimate shear load capacity, the tensile failure strain and plastic bending moment of the element are updated using the functions sp_tfstr (sp_pnt) and sp_pmom (sp_pnt), respectively, thereby achieving instantaneous shear failure of the anchor rod.

2.3. Verification and Application of the Revised PILE Structural Element Model

To verify the feasibility of the revised PILE structural element model in FLAC3D and to assess the validity of the modified mechanical model, a pure shear test was conducted to investigate the shear failure characteristics of the anchor rod.
The test utilized anchor cables with a diameter of 28 mm, a shear load capacity of 279 kN, and a tensile load capacity of 558 kN, as described by Yang et al. [24]. The mechanical model for the rod shear test is illustrated in Figure 8. The lower part of the rod was fixed using solid element meshes with dimensions of 0.3 m × 0.3 m × 0.3 m. Boundary conditions included a fixed base, a free boundary at the top, and normal displacement constraints on the remaining sides. The rod, with a total length of 0.35 m, was divided into 14 PILE structural element components, assigned CID numbers from 1 to 14. To analyze the differences between the revised and original mechanical models of the PILE element—and to evaluate the rationality of the revised model—two separate mechanical models were used for simulation in this section. The corresponding parameters are listed in Table 2 and Table 3.
During the test, a constant velocity was applied in the z-direction (the local coordinate system of the PILE element) to the shared structural node between elements with CID 11 and 12, at a rate of 1.0 × 10⁻⁶ m per step. The simulation was terminated after 100,000 steps, and the results were subsequently analyzed.
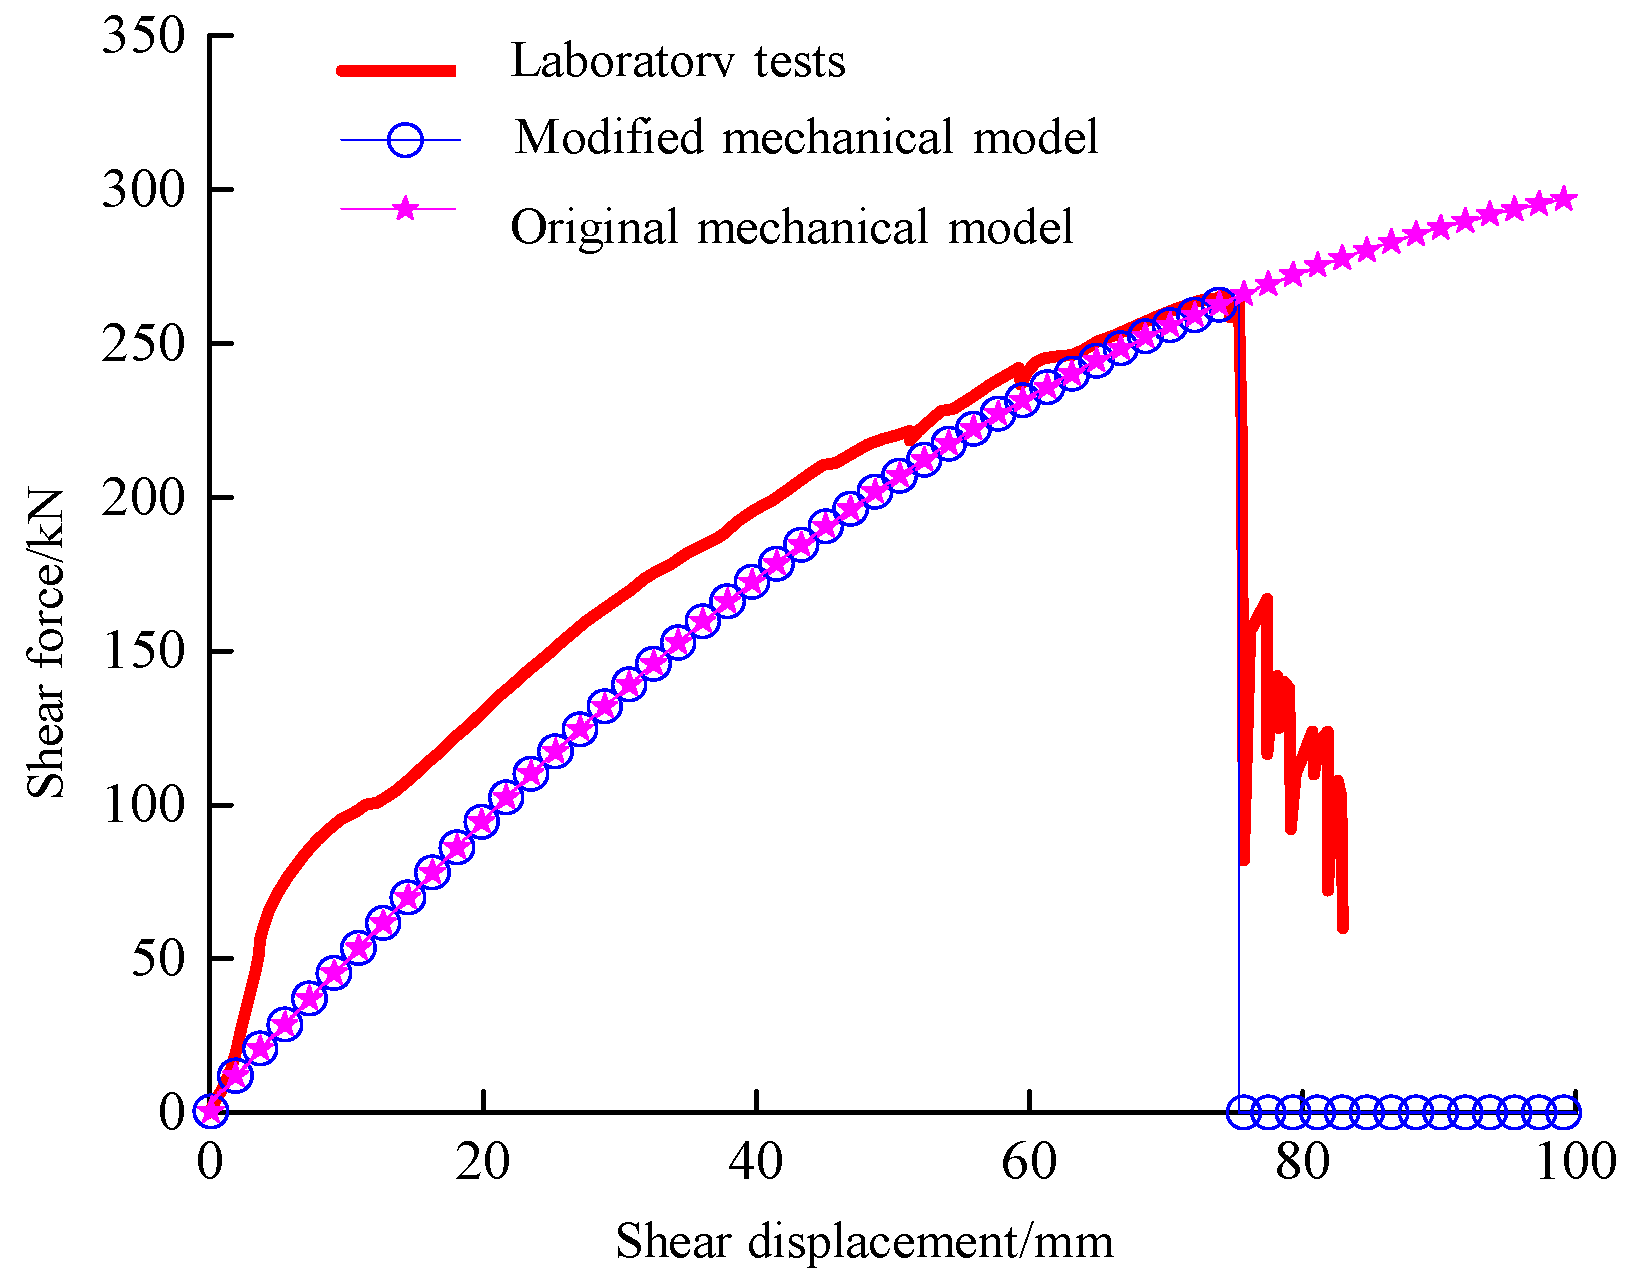
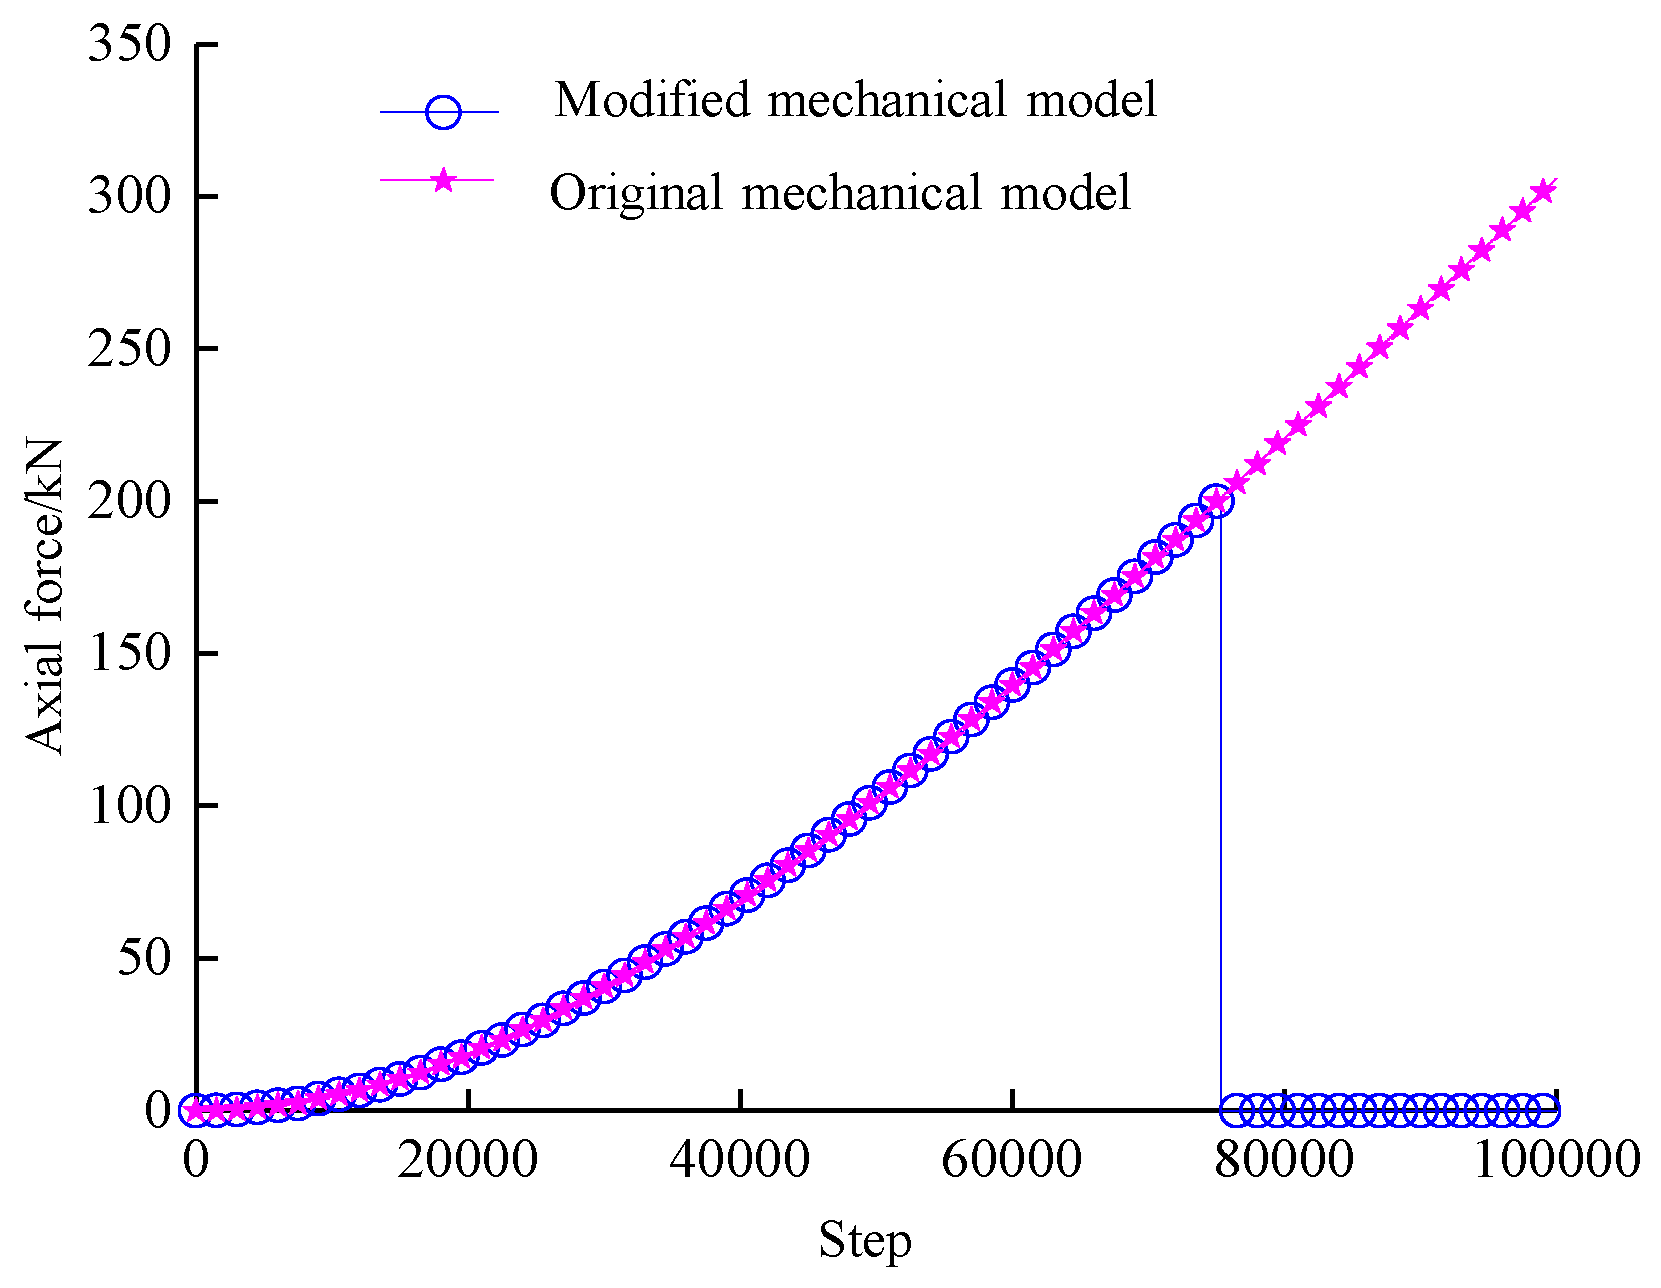
The shear force–displacement curve of the rod is presented in Figure 9. The laboratory data correspond to the complete shear force–displacement response of anchor cable shear failure, as reported by Li et al. [25]. For ease of analysis, the joint shear force provided in the original study has been converted to the equivalent shear force acting on the rod. The variation in axial force in the structural element with CID 11 as a function of the number of calculation steps is shown in Figure 10.
As shown in Figure 9, the original model exhibits only an elastic stage, with the shear load increasing linearly from 0 to 329 kN. In contrast, the revised model captures both the elastic stage and the shear failure stage. When the shear load is below 279 kN, the model remains in the elastic stage, during which the shear force increases nearly linearly with shear displacement. Upon reaching the shear load capacity of 279 kN, the rod enters a shear failure state, causing the shear force to drop abruptly to zero and remain constant thereafter. The shear force–displacement curve of the revised model shows good agreement with the laboratory data, indicating the model’s validity. Figure 10 illustrates that, prior to shear failure in the structural element with CID 11 in the revised model, the axial force reaches 154 kN. Upon failure, the axial force immediately drops to zero. In contrast, in the original model, the axial force does not reach the tensile capacity of 558 kN and continues to increase with the number of calculation steps.
In summary, the revised model effectively simulates local failure of the anchor rod element by evaluating the condition Fs(i)Fsmax(i), producing the expected results and offering a closer representation of actual conditions.

3. Mechanism of Action of the Revised PILE Structural Element on the Surrounding Rock of Roadway

3.1. Proposal of the Concept of Surrounding Rock Stress-Bearing Ring

The numerical calculation model is illustrated in Figure 11. The model dimensions are 46 m × 46 m × 3.4 m (width × height × thickness), and it includes a circular roadway with a radius of 2.3 m. A uniformly distributed load of 25 MPa is applied to the top surface of the model. The application of overlying pressure is primarily determined by the burial depth of the coal seam in engineering practice. Normal displacement constraints are imposed on all other boundaries. The influence of gravity is neglected by setting gravitational acceleration to zero, and the lateral pressure coefficient is taken as 1. The Mohr–Coulomb yield criterion is adopted for the simulation. The entire model assumes a single lithology, with rock mechanical properties defined as follows: bulk modulus of 2.0 GPa, shear modulus of 1.2 GPa, cohesion of 1.2 MPa, internal friction angle of 30°, and tensile strength of 0.6 MPa [20,24].
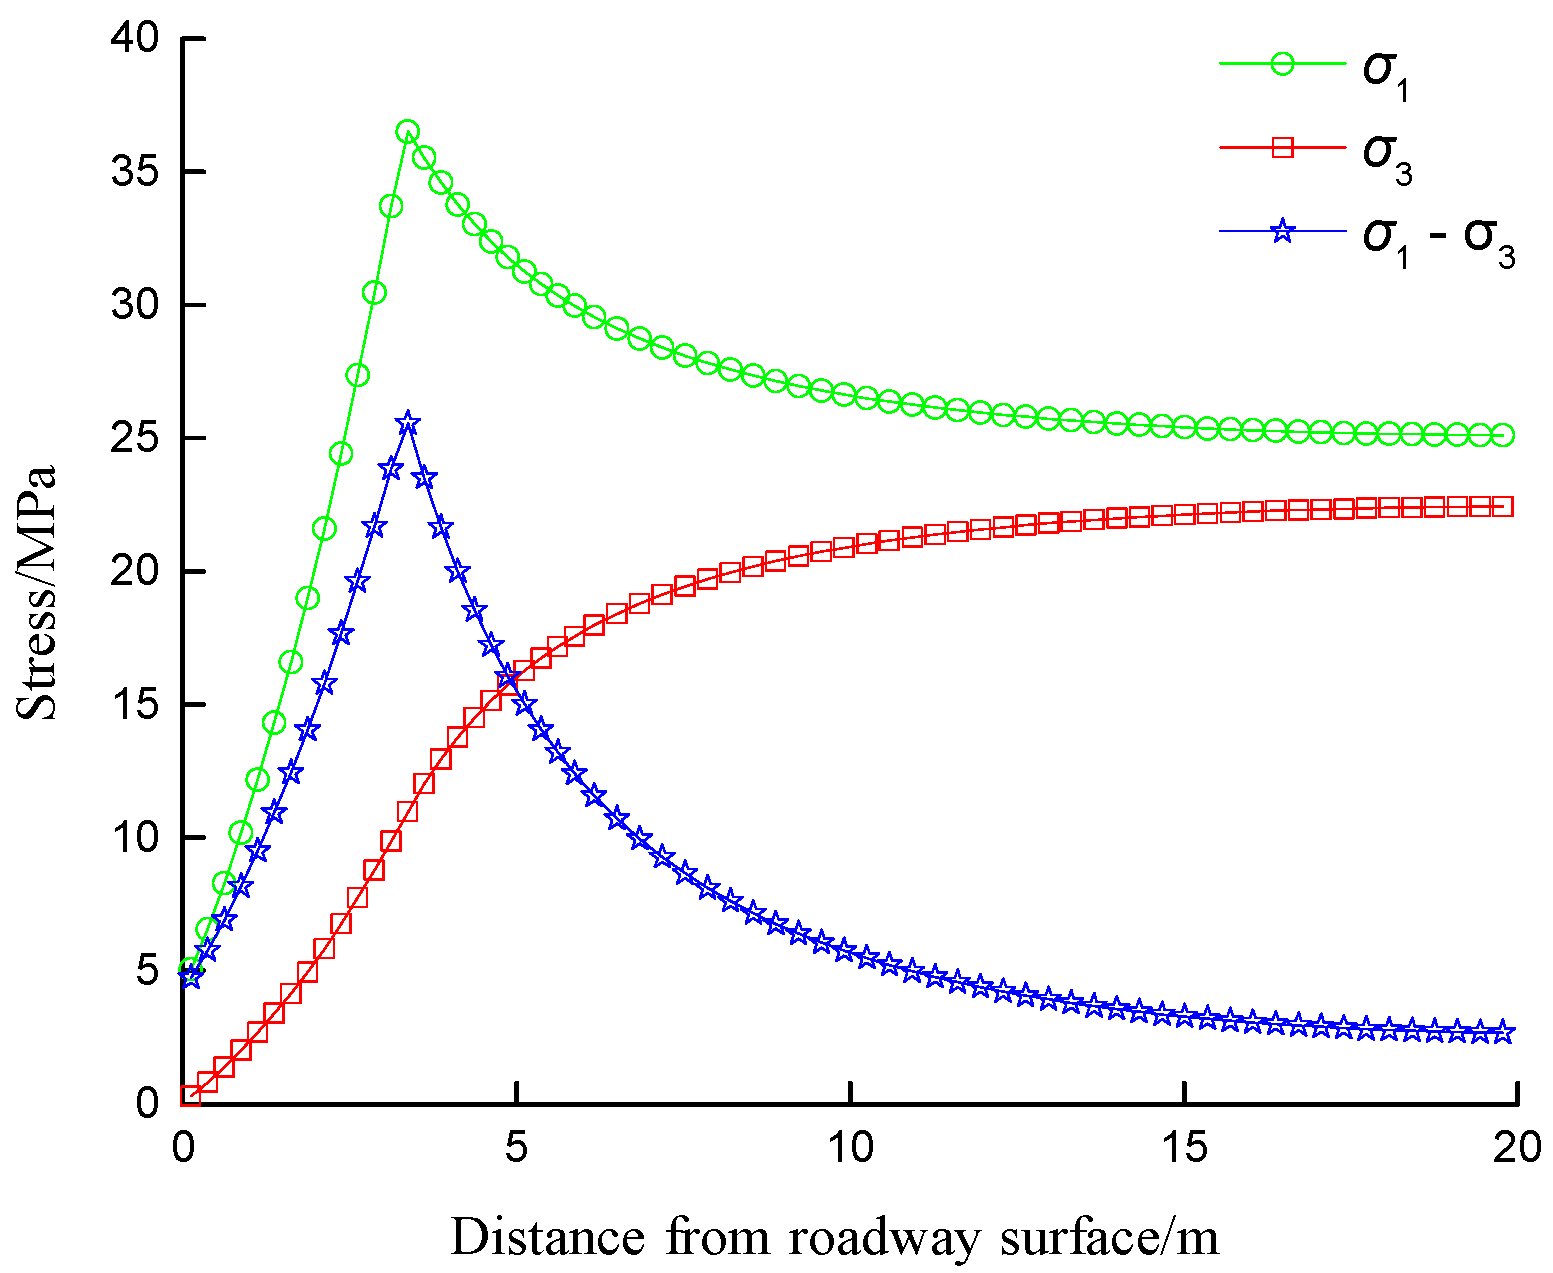
Following roadway excavation, the stress within the surrounding rock undergoes redistribution. The contour plots of the maximum principal stress, minimum principal stress, and principal stress difference are shown in Figure 12. To enable quantitative analysis of the stress distribution characteristics, a horizontal measurement line is established extending from the roadway centerline to the right. Principal stress values are extracted from the solid elements along this line. The variation in principal stresses and the principal stress difference along the radial direction of the roadway is presented in Figure 13, where the abscissa value of 0 corresponds to the roadway surface. This measurement line is also used for principal stress data extraction in subsequent analyses.
Based on the analysis of Figure 12 and Figure 13, it is evident that within the excavation-affected zone, the maximum principal stress in the surrounding rock initially increases with distance from the roadway surface and then decreases, while the minimum principal stress increases monotonically. As a result, the principal stress difference also first increases and then decreases, reaching a peak value of 25.6 MPa at a distance of 3.4 m from the roadway surface. Figure 12c shows a blue contour line with a value of 22 MPa encircling a red high-stress ring. Since the principal stress difference reflects the elastoplastic behavior of the surrounding rock under loading and indirectly indicates shear stress distribution, a “stress-bearing ring” concept is introduced based on its distribution characteristics. This stress-bearing ring is defined as the region enclosed by a specific contour line in the principal stress difference plot. The closer the contour value is to the peak principal stress difference, the more significant the corresponding stress-bearing ring. A thicker stress-bearing ring with higher, more uniformly distributed stress values, especially when located closer to the roadway surface, indicates a stronger self-supporting capacity of the surrounding rock. Positioning the tips of anchor rods within this ring can help ensure the long-term stability of the roadway.

3.2. The Influence of Anchor Bolt Parameters on the Stress-Bearing Ring of Surrounding Rock

(1) Influence of anchor bolt length on the stress-bearing ring of the surrounding rock.
Using BHRB500 high-strength anchor bolts with a diameter of 22 mm and a breaking load of 255 kN, arranged at a spacing of 800 mm × 800 mm, the anchoring length of the anchor bolts was initially set to 1.0 m. Anchor bolt lengths of 0 m, 2.5 m, and 5.0 m were considered. The distribution characteristics of the stress-bearing ring in the surrounding rock for these three different bolt lengths are shown in Figure 14, where the outer contour value defining the stress-bearing ring is 16.8 MPa. The variation pattern of the principal stress difference corresponding to these cases is presented in Figure 15.
As shown in Figure 14, without rock bolt support (rock bolt length of 0 m), a continuous and closed stress-bearing ring does not form around the surrounding rock, resulting in a discontinuous distribution pattern. In this case, the inner boundary of the stress-bearing ring lies approximately 5.7 m from the roadway surface. When the rock bolt length is increased to 2.5 m, a complete stress-bearing ring develops around the surrounding rock; however, some local areas within the ring remain relatively thin, and the distance from the inner boundary of the ring to the roadway surface decreases to 4.6 m. With a rock bolt length of 5.0 m, the thickness of the stress-bearing ring becomes more uniform, and its position remains essentially unchanged. Figure 15 shows that rock bolt support increases the peak principal stress difference by 0.7 to 2.3 MPa. Therefore, applying rock bolt support and appropriately increasing its length promotes the formation of a stable stress-bearing ring in the surrounding rock. When the rock bolt length reaches 5.0 m, the bolt ends are uniformly anchored within the stress-bearing ring, contributing to the long-term stability of the roadway.
(2) Influence of rock bolt spacing on the stress-bearing ring of the surrounding rock.
With a rock bolt length fixed at 5.0 m, three different rock bolt spacings—800 mm, 1200 mm, and 1600 mm—were examined while keeping other parameters constant. The distribution characteristics of the stress-bearing ring under these conditions are shown in Figure 16. As illustrated, increasing the rock bolt spacing from 800 mm to 1200 mm and then to 1600 mm causes the stress-bearing ring to gradually shift outward, eventually extending beyond the anchorage range of the rock bolts. This results in increasing discontinuity in the stress-bearing ring. Therefore, reducing rock bolt spacing is advantageous for the formation of a stable stress-bearing ring in the surrounding rock.
(3) Influence of rock bolt breaking load on the stress-bearing ring of the surrounding rock.
With a rock bolt length of 5.0 m and spacing of 800 mm, the breaking loads of the rock bolts were set to 100 kN, 200 kN, and 400 kN, representing low-strength, high-strength, and high-prestress high-strength rock bolts commonly used in coal mine roadways. All other parameters were kept constant. The distribution characteristics of the stress-bearing ring in the surrounding rock under these three different breaking loads are presented in Figure 17.
As shown in Figure 17, low-strength rock bolts fail to form a closed stress-bearing ring in the surrounding rock, with the ring extending beyond the anchorage range of the bolts. High-strength rock bolts enable the formation of an almost complete stress-bearing ring, although small local gaps remain at the top and bottom. High-prestress high-strength rock bolts produce a uniformly thick stress-bearing ring, with all bolts anchored securely within them. Therefore, for controlling roadways with complex surrounding rock conditions, high-prestress high-strength rock bolts offer the most effective support.
Based on the above analysis, rock bolt support significantly strengthens the stress-bearing ring of the surrounding rock. This enhancement can be achieved by increasing rock bolt length-using extendable bolts or cable anchors as equivalents to lengthen the support-reducing rock bolt spacing through methods like full-section support, and selecting rock bolts with higher breaking loads, such as high-prestress high-strength bolts. These measures collectively contribute to a more effective reinforcement of the surrounding rock’s stress-bearing ring.

4. Practical Reinforcement Effects of Rock Bolt Support on the Stress-Bearing Ring of Surrounding Rock

4.1. Overview of the Target Roadway and Characteristics of Surrounding Rock Deformation

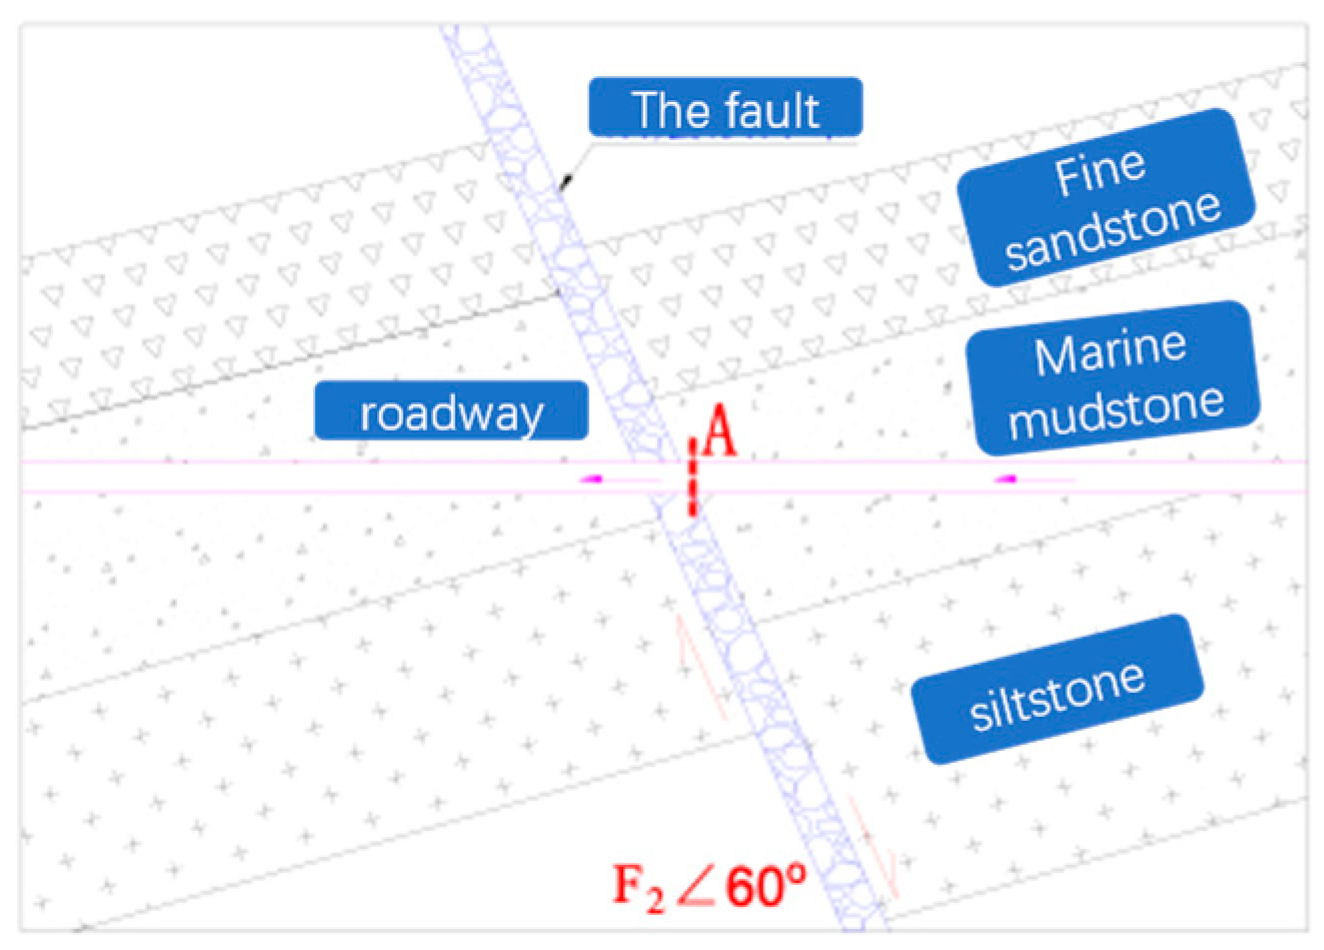
Renlou Coal Mine is located in the Linhuan mining area in the southern part of the Huaibei Coalfield. It lies on the southeastern wing of the Tongting Anticline and is bounded to the south by the F3 Fault. The geological structure is monoclinic, dipping eastward. Within the mining area, there are 35 large- and medium-scale faults with throws greater than 5 m, including four faults with throws exceeding 100 m, making the mine geologically complex. The main haulage roadway is situated at the −520 m level, aligned at N304°, and constructed with a gradient of 3.5‰. After advancing 900 m, the excavation is expected to intersect the F2 fault set from the footwall side. Preliminary drilling reveals that this fault set includes the F2 and F2-1 faults. The F2 fault is a compressive-torsional normal fault with a dip direction of 290°, a dip angle of 55°, and a throw of 100 m. The F2-1 fault, an associated structure, has a dip direction of 305°, a dip angle of 75°, and a throw of 12 m, as shown in Figure 18. The cross-section of the haulage roadway features a straight-wall semi-circular arch, with a width of 5.2 m and a height of 4.4 m. A combined support system of bolts, mesh, and shotcrete is used. Field observations indicate that within the F2 fault zone, both horizontal and vertical stresses are compressive and significantly higher than those on either side of the faults. The stress distribution in the rock mass between the two faults is mainly controlled by the F2 fault, forming a zone of elevated vertical stress. During roadway excavation, when the fault fracture zone is encountered, severe floor heave is observed.
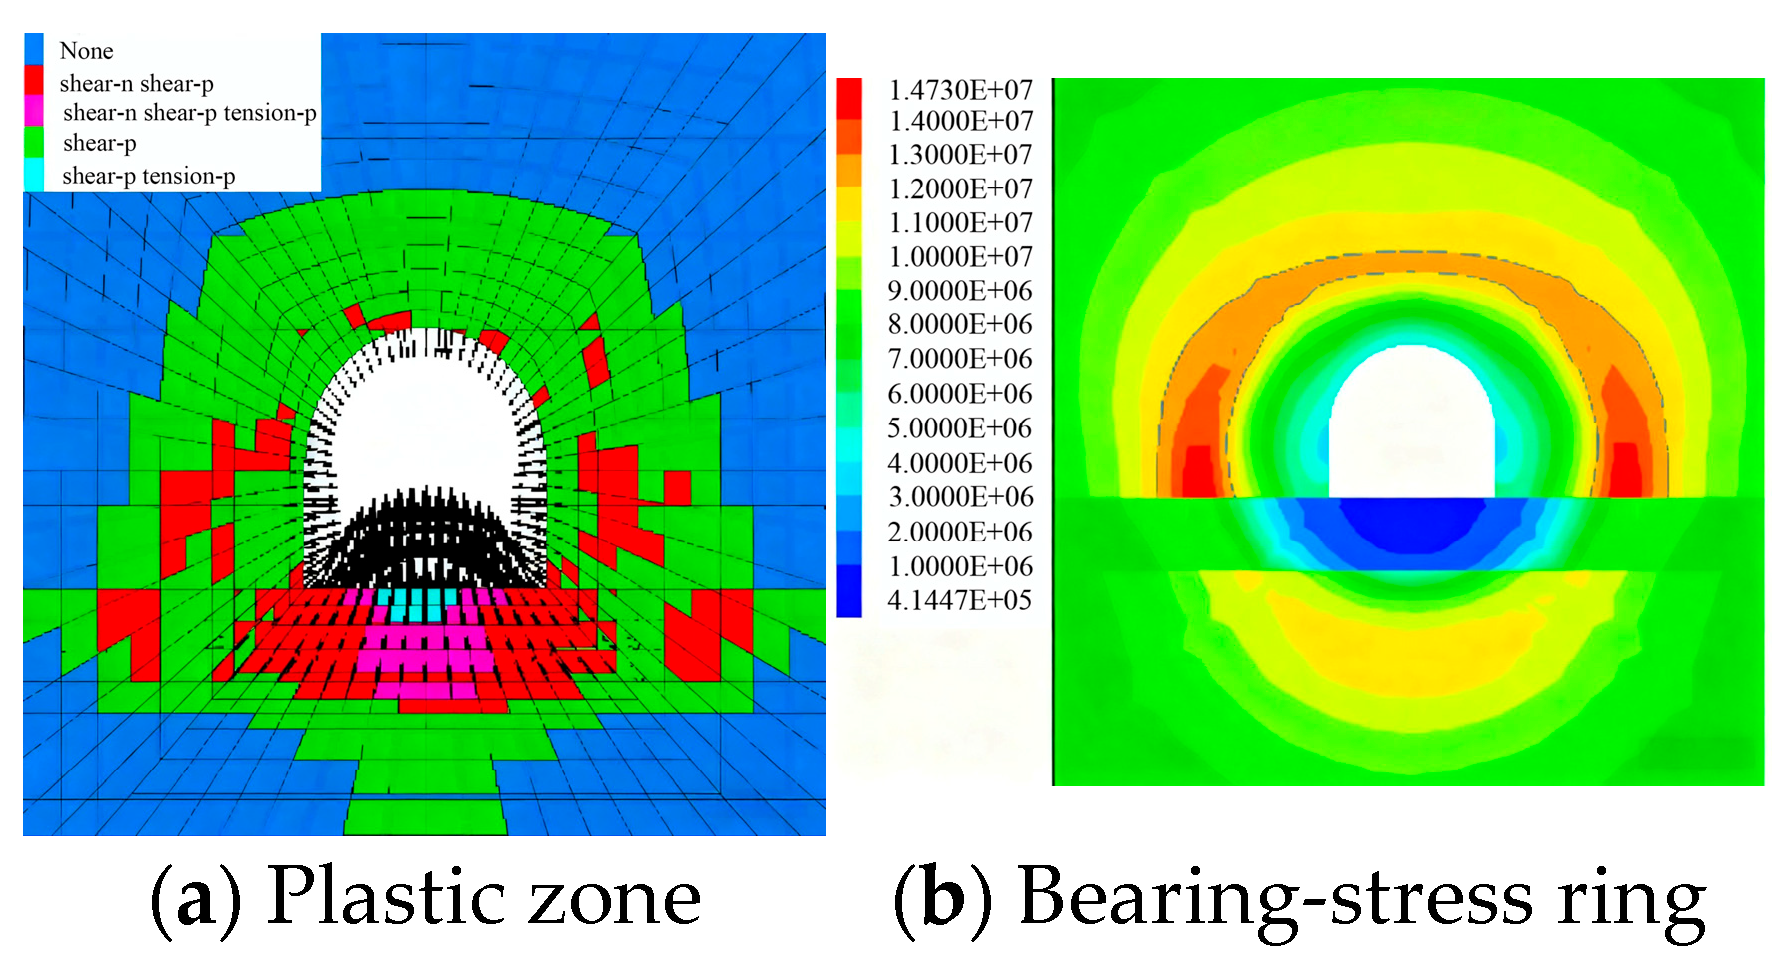
To analyze the characteristics of roadway floor heave in fault zones, FLAC3D numerical simulation software was used to study the distribution of the plastic zone and the stress-bearing ring in the surrounding rock at the location where the roadway intersects the fault fracture zone, as shown in Figure 19. The results indicate that floor heave is significantly more pronounced than deformation of the roof and sidewalls. The plastic failure zone gradually expands from the roof toward the floor. A stress-bearing ring forms in the roof and sidewalls, but its thickness is uneven. The sidewalls exhibit a relatively thick and highly stressed ring, while toward the roof, both the thickness and stress decrease, and the ring shifts closer to the roadway surface. The fault fracture zone itself acts as a stress-relieved area, with stress values in most regions falling below 1 MPa, indicating an almost complete loss of load-bearing capacity. The absence of a stress-bearing ring in the floor is the fundamental cause of the severe floor heave observed in this zone.

4.2. Control Mechanism and Technical Scheme for Controlling the Target Main Roadway

Based on the overall support strategy of “floor stabilization and sidewall reinforcement” and the staged floor reinforcement concept of a “strong-weak-strong” composite bearing structure, the key technologies for controlling floor heave deformation and failure in the main haulage roadway are identified as follows:
(1) Full-Section Prestressed Cable Support: This method expands the anchorage range of the roof and sidewalls, effectively controls the development of the plastic zone in the surrounding rock, enhances the overall support strength, and fully utilizes the inherent stability of the deep rock mass. It helps form a high-stress-bearing ring around the roof and sides with uniform thickness and stress distribution. Ordinary cables installed in the floor disrupt plastic slip lines, hinder the sliding of rock masses within the active Rankine zone, and help limit the expansion of the plastic zone in the floor rock. Additionally, grouted cables can reinforce the deep floor strata by improving the strength of the mudstone layer, thereby enhancing the overall stability of the floor surrounding rock.
(2) Prefabricated Inverted Arch: The inverted arch, working in conjunction with the shallow weak rock mass and the deeper stable rock mass, forms a staged “strong-weak-strong” reinforced load-bearing zone. This structure enhances the floor’s bending resistance, buffers long-term damage caused by high stress, reduces the extent of the stress-relief zone around the roadway, and mitigates the compression mold effect on both roadway sides. As a result, it helps prevent the plastic flow of crushed rock mass from migrating toward the free surface. When combined with the reinforcing effect of grouted cables in the floor, the system effectively controls the progressive large deformation associated with floor heave.
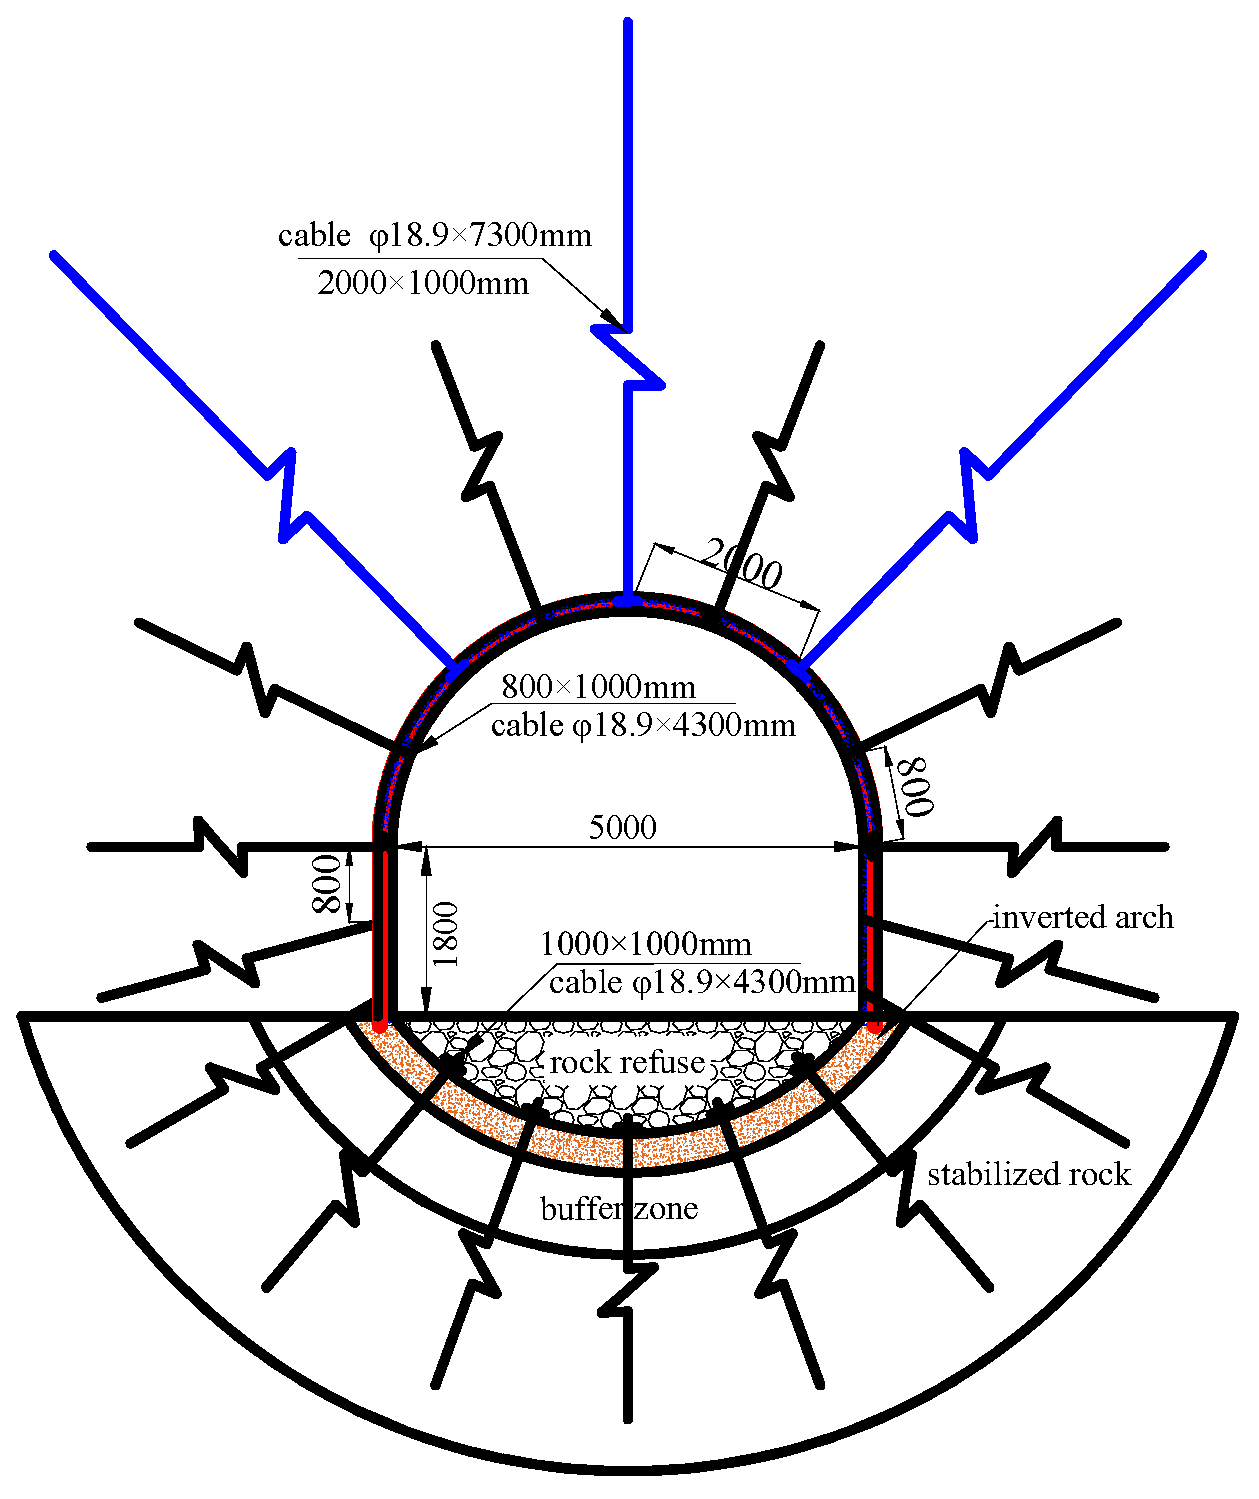
The cross-sectional design of the combined support system, incorporating full-section prestressed cables and a prefabricated inverted arch, is shown in Figure 20.
(1) Cable Specifications:Short cables: φ18.9 mm × 4300 mm, equipped with 250 mm × 250 mm × 14 mm anchor cable trays. ② Long cables: φ18.9 mm × 7300 mm, equipped with 300 mm × 300 mm × 14 mm anchor cable trays.
(2) Layout:Roof: Short cables are installed at a spacing of 1000 mm × 1000 mm, while long cables are arranged at 2000 mm × 1000 mm. ② Sides: Short cables are placed at 800 mm × 1000 mm intervals. Corner cables are positioned 200 mm above the floor and inclined at a 30° angle to the roadway sides. ③ Floor: Short cables are arranged at 1000 mm × 1000 mm spacing. Grouted and ordinary cables are alternately arranged in a “3-2-3” pattern. All cables are connected using steel ladder beams welded from #14 steel bars. Each cable is installed with one Z2370 and one CK2350 resin capsule and tensioned to a prestressing force of no less than 150 kN.
(3) Prefabricated Inverted Arch: Based on field investigations and results from numerical simulation back-analysis, the over-excavation depth of the inverted arch is determined to be 1750 mm. Prefabricated C30 concrete blocks are used for paving. Given the cementation and swelling characteristics of the mudstone floor, quicklime is applied prior to arch construction to seal water-conducting fracture channels between the floor and the deep rock mass, thereby improving the floor’s surrounding rock environment. After the inverted arch is completed, delayed grouting is carried out for the grouted cables in the floor to further enhance the strength of the deep rock mass.
Field monitoring results show that the combined bolting and grouting support system—featuring full-section anchor cables and prefabricated inverted arch blocks—effectively control large deformations and floor heave in the main haulage roadway. This approach offers a valuable reference for roadway support in similarly complex geological conditions.

5. Conclusions

(1) Based on the distribution characteristics of the principal stress difference in circular roadways, the concept of a stress-bearing ring in the surrounding rock is proposed: the area enclosed by a specific contour line in the principal stress difference map defines the stress-bearing ring. This ring represents the key load-bearing zone of the surrounding rock, and anchoring rock bolts within it ensures the long-term stability of the roadway. The closer the contour value is to the peak principal stress difference, the more significant the stress-bearing ring.
(2) In weak and fractured surrounding rock, the stress-bearing ring tends to be discontinuous and unevenly distributed around the roadway. Through rock bolt support—by increasing bolt length, reducing spacing, and enhancing breaking load—a complete, more uniform stress-bearing ring can be formed. The thickness and stress distribution of the ring gradually become more consistent, the stress values increase, and the overall ring shifts inward toward the roadway surface, allowing rock bolts to be effectively anchored within it.
(3) The distribution of the stress-bearing ring was studied at a location where the roadway exposes a fault fracture zone under unsupported conditions. It was identified that the absence of a stress-bearing ring in the floor is the fundamental cause of severe floor heave. Based on this, a combined support system of inverted arch full-section rock bolts, anchor cables, and steel ladder beams was proposed. After installation, the stress-bearing rings in the roof and sidewalls shift inward toward the roadway surface, and a stress-bearing ring forms in the floor. The ring’s thickness distribution becomes uniform, the internal stress increases, and rock bolts can be effectively anchored within the stress-bearing ring, thereby controlling floor heave effectively.

Author Contributions

R.W. and H.W.: Conceptualization, Methodology, Software, Writing—Original draft preparation. J.B.: Conceptualization, Methodology, Funding acquisition. Q.Z. and W.Z.: Supervision, Methodology, Funding acquisition. All authors have read and agreed to the published version of the manuscript.

Funding

This research was funded by Xinjiang Uygur Autonomous Region Tianchi Elite Talent Innovation Leadership Program: 2024XGYTCYC03; Urumqi City Hongshan Sci-Tech Innovation Elite Talents Youth Top Talents Program: B241013004; National Key Research and Development Program Young Scientists Project: 2024YFC2910600; Xinjiang Institute of Engineering Doctoral Start-up Fund: 2023XGYBQJ14; Internal Project of Key Laboratory of Xinjiang Coal Resources Green Mining, Ministry of Education: KLXGY-Z2603; Xinjiang Uygur Autonomous Region Key R&D Project Task Special-Department and Department Linkage Project: 2022B01051-3, 2022B01051; Xinjiang Tianshan Yingcai Cultivation Plan-Youth Top-notch Talent Project: 2024TSYCCX0051; Youth Project of the Natural Science Foundation of Xinjiang Uygur Autonomous Region: 2025D01C259; Key Research and Development Program of Xinjiang Uygur Autonomous Region: 2025B04017-002; Natural Science Foundation of Xinjiang Uygur Autonomous Region: 202501A63.

Data Availability Statement

The original contributions presented in this study are included in the article. Further inquiries can be directed to the corresponding authors.

Acknowledgments

The authors thank the editor for providing helpful suggestions for improving the quality of this manuscript.

Conflicts of Interest

The authors declare no conflicts of interest.

References

  1. Kang, H.P. Sixty years development and prospects of rock bolting technology for underground coal mine roadways in China. J. China Univ. Min. Technol. 2016, 45, 1071–1081. [Google Scholar]
  2. Kang, H.P. Seventy years development and prospects of strata control technologies for coal mine roadways in China. Chin. J. Rock Mech. Eng. 2021, 40, 1–30. [Google Scholar]
  3. Kang, H.P. Development and prospects of support and reinforcement materials for coal mine roadways. Coal Sci. Technol. 2021, 49, 1–11. [Google Scholar]
  4. Li, W.; Zhang, C.; Tu, S.; Chen, W.; Ma, M. Face stability analysis of a shield roadway excavated along inclined strata. Undergr. Space 2023, 13, 183–204. [Google Scholar] [CrossRef]
  5. Zhu, Q.; Li, T.; Du, Y.; Zhang, H.; Ran, J.; Li, W.; Zhang, S. Failure and stability analysis of deep soft rock roadways based on true triaxial geomechanical model tests. Eng. Fail. Anal. 2022, 137, 106255. [Google Scholar] [CrossRef]
  6. Tu, S.; Li, W.; Zhang, C.; Chen, W. Effect of inclined layered soils on face stability in shield roadwaying based on limit analysis. Tunn. Undergr. Space Technol. 2023, 131, 104773. [Google Scholar] [CrossRef]
  7. Wu, W.; Wang, T.; Bai, J.; Liu, J.; Wang, X.; Xu, H.; Feng, G. Failure characteristics and cooperative control strategies for gob-side entry driving near an advancing working face: A case study. Processes 2024, 12, 1398. [Google Scholar] [CrossRef]
  8. Li, W.T.; Wang, L.Y.; Zhang, C.A.; Yang, X.Z.; Mei, Y.C.; Shao, X.; Sun, B.J. Numerical investigation study on tensile-shear failure behavior of rock bolts in inclined strata mining roadways. Eng. Fail. Anal. 2024, 162, 108393. [Google Scholar] [CrossRef]
  9. Jiang, R.; Dai, F.; Liu, Y.; Li, A. Fast Marching Method for Micro-seismic Source Location in Cavern-Containing Rockmass: Performance Analysis and Engineering Application. Engineering 2021, 7, 1023–1034. [Google Scholar] [CrossRef]
  10. Li, A.; Liu, Y.; Dai, F.; Liu, K.; Wei, M. Continuum analysis of the structurally controlled displacements for large-scale underground caverns in bedded rock masses. Tunn. Undergr. Space Technol. 2020, 97, 103288. [Google Scholar] [CrossRef]
  11. Xu, S.; Liu, J.; Yang, X. Pseudo-dynamic analysis of a 3D roadway face in inclined weak strata. Undergr. Space 2023, 12, 156–166. [Google Scholar] [CrossRef]
  12. Li, W.T.; Yang, N.; Li, T.C.; Zhang, Y.H.; Wang, G. A new approach to simulate the supporting arch in a roadway based on improvement of the beam element in FLAC3D. J. Zhejiang Univ.-Sci. A (Appl. Phys. Eng.) 2018, 18, 179–193. [Google Scholar] [CrossRef]
  13. Wu, W.D.; Bai, J.B.; Feng, G.R.; Wang, X.Y. Investigation on the mechanism and control methods for roof collapse caused by cable bolt shear rupture. Eng. Fail. Anal. 2021, 130, 105724. [Google Scholar] [CrossRef]
  14. Meng, Q.B.; Xin, X.K.; Song, Z.M.; Cheng, Z.M.; Song, Y. Theoretical analysis and numerical simulation of energy absorption and control effect of bolt support. J. Cent. South Univ. (Sci. Technol.) 2024, 55, 3426–3440. [Google Scholar]
  15. Wu, Y.Z.; Kang, H.P. Failure mechanism study on tail of high strength bolt. J. China Coal Soc. 2013, 38, 1537–1541. [Google Scholar]
  16. Hao, D.; Wu, Y.; Chen, H.; Chu, X.; Li, Y. Instability mechanism and prevention technology of roadway in close distance and extra thick coal seam under goaf. J. China Coal Soc. 2019, 44, 2682–2690. [Google Scholar]
  17. Zhang, Y.; Su, G.; Li, Y.; Wei, M.; Liu, B. Displacement back-analysis of rock mass parameters for underground caverns using a novel intelligent optimization method. Int. J. Geomech. 2020, 20, 04020035. [Google Scholar] [CrossRef]
  18. Si, L.; Lou, J.; Yang, J.; Yuan, G. Deformation and stress characteristics of anchor bolt under axial impact. J. China Coal Soc. 2022, 47, 3645–3653. [Google Scholar]
  19. Si, L.P. Experimental study on mechanical properties of rock bolts under tension and shear loads. J. Min. Strat. Control. Eng. 2022, 4, 033038. [Google Scholar]
  20. Song, Y.B.; Yan, S.; Bai, J.B.; Hao, S.B.; Chen, Y. Implementation of shear broken failure of bolts in FLAC3D and its application. Chin. J. Rock Mech. Eng. 2017, 36, 1899–1909. [Google Scholar]
  21. Lou, J.; Lu, Z.; Dong, S.; Fu, Y.; Peng, X.; Li, J.; Yang, L. Dynamic response characteristics of rock bolt support system under low-energycyclic impact: Experimental study. J. Min. Strat. Control. Eng. 2024, 6, 053037. [Google Scholar]
  22. Tu, M.; Guo, F.; Zhang, X.; Wang, C. Axial force-breaking energy accumulation and dissipation evolution and energy absorption protection mechanism of anchor cable wire. J. China Coal Soc. 2024, 49, 3353–3365. [Google Scholar]
  23. Chen, S.; Feng, F.; Li, X.; Wang, C.; Li, D.; Rostami, J.; Zhu, Y. Research progress and key issues of laboratory test and numerical simulation for slabbing failure in hard rock under complex mining conditions. J. China Univ. Min. Technol. 2023, 52, 868–888. [Google Scholar]
  24. Yang, N.; Li, W.T.; Xuan, C.; Zhang, Y.; Li, D.; Li, T.; Wang, G. Improvement of breakable anchor bolt element in FLAC3D and its application in deep coal roadway. J. Min. Saf. Eng. 2017, 34, 251–258. [Google Scholar]
  25. Li, X.; Aziz, N.; Mirzaghorbanali, A.; Nemcik, J. Behavior of fiber glass bolts, rock bolts and cable bolts in shear. Rock Mech. Rock Eng. 2016, 49, 2723–2735. [Google Scholar] [CrossRef]
Figure 1. The breakage of the anchor cable and anchor bolt.
Symmetry 17 01885 g001
Figure 2. Mechanical model of the interaction between PILE elements and surrounding rock.
Symmetry 17 01885 g002
Figure 3. Local coordinate system of the PILE element.
Symmetry 17 01885 g003
Figure 4. Shear mechanical model of PILE element.
Symmetry 17 01885 g004
Figure 5. Tensile broken model of PILE element.
Symmetry 17 01885 g005
Figure 6. Modified mechanical model of PILE element.
Symmetry 17 01885 g006
Figure 7. Process of implementation of the PILE element modification.
Symmetry 17 01885 g007
Figure 8. Diagram of anchor bolt shear test.
Symmetry 17 01885 g008
Figure 9. Shear load–displacement curves of anchor bolts.
Symmetry 17 01885 g009
Figure 10. Curves of axial force of element (CID = 11) varied with calculation steps.
Symmetry 17 01885 g010
Figure 11. Numerical calculation model.
Symmetry 17 01885 g011
Figure 12. Principal stress and their difference distribution of surrounding rock.
Symmetry 17 01885 g012
Figure 13. Curves of surrounding rock stress along the radius.
Symmetry 17 01885 g013
Figure 14. Effect of anchor bolt length on surrounding rock bearing-stress ring.
Symmetry 17 01885 g014
Figure 15. Effect of rock bolt length on principal stress difference.
Symmetry 17 01885 g015
Figure 16. Effect of rock bolt spacing on surrounding rock bearing-stress ring.
Symmetry 17 01885 g016
Figure 17. Effect of rock bolt breaking load on surrounding rock bearing-stress ring.
Symmetry 17 01885 g017
Figure 18. Cross-fault roadway schematic diagram.
Symmetry 17 01885 g018
Figure 19. Deformation characteristics of surrounding rock in roadways crossing faults.
Symmetry 17 01885 g019
Figure 20. Design scheme of the combined support of the roadway.
Symmetry 17 01885 g020
Table 1. Part of the PILE functions.
The Name of the FunctionChangeabilityPurposes
sp_force(sp_pnt, 1, 2)noMonitoring unit shear force in the y-direction
sp_force(sp_pnt, 1, 3)noMonitoring unit shear force in the z-direction
sp_tfstr(sp_pnt)yesElement tensile failure strain assignment
sp_pmom(sp_pnt)yesElement plastic moment assignment
Table 2. Geometric and Mechanical Parameters of Anchor Bolts.
Elastic Modulus/GPaPoisson’s RatioRod Area
/m2
Moment of Inertia in the
y-Direction/m4
Moment of
Inertia in the
z-Direction/m4
Polar Moment of Inertia
/m4
Pull Breakage StrainPlastic Bending Moment
/(N·m)
2000.36.16 × 10−43.02 × 10−83.02 × 10−86.03 × 10⁻⁸
Table 3. Geometric and Mechanical Parameters of Grout.
Anchor SolidCircumference/mmTangential Cohesion
/MPa
Tangential Internal Friction Angle/(°)Tangential Stiffness
/(N·m−2)
Normal Cohesion
/MPa
Normal Internal Friction Angle/(°)Normal
Stiffness
/(N·m−2)
Free section9100020001.0 × 1010
Anchoring section912.0452.0 × 10720001.0 × 1010
Disclaimer/Publisher’s Note: The statements, opinions and data contained in all publications are solely those of the individual author(s) and contributor(s) and not of MDPI and/or the editor(s). MDPI and/or the editor(s) disclaim responsibility for any injury to people or property resulting from any ideas, methods, instructions or products referred to in the content.