Article

Symmetrical Flow Optimization: Reciprocal Lane Reconfiguration and Signal Coordination for Construction Zone Intersections

1
Department of Transportation College, Jilin University, Changchun 130000, China
2
Department of School of Mathematics, Jilin University, Changchun 130000, China
*
Author to whom correspondence should be addressed.
Symmetry 2025, 17(11), 1856; https://doi.org/10.3390/sym17111856
Submission received: 25 July 2025 / Revised: 13 October 2025 / Accepted: 16 October 2025 / Published: 4 November 2025
(This article belongs to the Section Mathematics)

Abstract

In construction work at urban intersections, construction barriers can severely obstruct the view of right-turning vehicles, thereby posing safety hazards and increasing delays. Taking the intersection of Nanhu Avenue and Dongling South Street in Changchun City as an example, this paper innovatively proposes relocating the right-turn lane to the left, merging the right-turn traffic flow into the left-turn phase, and implementing dynamic left-turn relocation strategies for vehicles turning left in the opposite direction to separate traffic flows. This study provides detailed channelization design schemes for relocating the right-turn lane to the left and merging the left- and right-turn lanes. To optimize traffic efficiency and environmental benefits, a multi-objective signal timing optimization model was constructed to minimize the total intersection delay, maximize traffic capacity, and minimize carbon emissions. The model was analyzed using the non-dominated genetic algorithm (NSGA-II) to determine the effective green light duration for each phase, the pre-signal control scheme, and the length of the dynamically shifted left-turn lane, followed by VISSIM traffic simulation. The results show that compared with the traditional intersection, the optimized design reduced the delay for straight-through vehicles at the north entrance from 118 s to 21 s (a decrease of 82%). The delays for all phases at the south entrance decreased by 20–50%, and delays for straight and left-turn vehicles at the west and east entrances also decreased. The overall total delay decreased from 53.3 s to 41.1 s (a 23% reduction), validating the effectiveness and applicability of the method and model proposed in this work.

1. Introduction

With the rapid development of urban transportation in all aspects, urban roads need to be constructed or renovated to adapt for economic development. To ensure safety and convenience, construction areas are usually be enclosed, resulting in the reduction in road capacity and thus severe traffic congestion. In addition, the construction enclosure creates an insufficient right-turning vehicle sight distance and low traveling speed, which then produce straight right conflict. This issue has posed increasingly obvious impacts on the operation of urban traffic flow [1]. The research on roads and intersections in construction zones involves traffic flow characteristics, traffic organization and road capacity, and other aspects. For example, Chien, S. I. J. et al. concluded that the traffic volume, lane closure, traffic control and construction location could affect the speed of vehicle operation [2]. Rouphail and Tiwari found that the average speed of vehicles and the distance from the construction zone was proportional to the distance, and inversely proportional to the intensity of construction operations [1]. For the congestion problem caused by the reduced capacity of intersections and roads with construction zones, traffic control, diversion and induction, and a short-time channelization design within the construction period were used. However, these methods only spatially redistribute the traffic volume on the road and road network resources and do not consider the available space generated at the intersection and the impact of the construction zone intersection barrier on the right-turn vehicles [3]. In an urban road traffic system, signal-controlled intersections are an important node in the formation of urban traffic flow conflict, and the size of its operational efficiency directly affects the capacity of the entire road network. Left-turn traffic flow due to the intersection cannot be effectively released, and as stranded delay is one of the main causes of intersection congestion, intersection left-turn traffic organization and management methods have become an important way to improve the operational efficiency of signalized intersections.
At present, commonly used methods for intersections with construction zones include traffic diversion, road function reclassification, and road space resource reclassification. Many studies have been carried out on the impact range of construction zones, road capacity, vehicle speed, safety, etc. [4]. Previous studies on right-turning vehicles at intersections with construction zones have mainly focused on the analysis of vehicle operation characteristics, traffic safety assessment, traffic flow management, and other aspects, and have not put forward effective solutions to the problem of insufficient sight distance for right-turning vehicles. In Hangzhou, part of the road will be set in the right-turn lane on the left side of the road, and the left-turn vehicle set in the right side of the road, to prevent the turning vehicle and straight non-motorized vehicle accidents. This effectively avoids accidents caused by visual blind spots, and traffic accidents have dropped significantly. Chongqing has a similar precedent. To solve the problem of straight-left conflict, there are left-turn-only lanes and left-turn-only phases, far-led U-turns, shifted left-turns, and other programs. Among them, the shifting left-turn, as a new type of scheme to solve the straight-left conflict, has achieved an obvious optimization effect in practical application in foreign countries, and the effect is often more obvious in large intersections. However, there is not a unified and complete theory in China [5].
Regarding both the reduction in straight-left conflicts under the limited space and time resources of side streets and the insufficient right-turn sight distance generated by construction barriers, it is necessary to design the dynamic organization of space-time resources within the intersection. Right-turn left can not only reduce the straight-left conflict, but also can increase the safety of right-turning vehicles. Signal control for right-turning vehicles can make all vehicles entering the intersecting roadway be controlled by signals, thus providing the conditions for setting up dynamic shifted left-turns on branch roads [6]. Setting pre-signal and signal control separation of traffic can protect the intersection of the main road capacity and right-turning vehicles with adequate sight distance and the dynamic use of branch road lane space. This can effectively solve the problem of intersection congestion [7]. Therefore, the design of a dynamic shifted left-turn organization scheme applicable to the branch road for the actual situation of the intersection has an obvious improvement effect on the enhancement in intersection operation efficiency [8]. However, despite these advancements, there remains a notable gap in the integrated application of right-turn left placement and dynamically shifted left-turn strategies specifically tailored for construction zone intersections. Recent studies such as Zhao et al. (2015) and Bie et al. (2017) have explored displaced left-turn intersections and pre-signal controls, but none have comprehensively addressed the combined effect of these strategies under the constraints of construction barriers and limited sight distance [9,10]. This study fills this gap by proposing a synergistic approach that combines right-turn left placement with dynamic shift left-turn controls, optimized through a multi-objective signal timing model, to enhance both the efficiency and safety in construction-affected intersections.
Although this study focused on a typical four-leg intersection under construction zone constraints, the proposed strategies of right-turn left placement and dynamic shifted left-turn possess broader applicability. The right-turn left placement strategy can be adapted to T-intersections or other asymmetric layouts where right-turn sight distance is restricted by relocating the right-turn lane adjacent to the left-turn lane and coordinating it within the signal phase. Similarly, the dynamic shifted left-turn concept could be extended to intersections with heavy left-turn volumes but limited space for dedicated lanes, utilizing pre-signals and opposing lane borrowing. Future applications would require adjustments based on specific geometric configurations, traffic volumes, and signal phasing capabilities, but the core principles of reallocating lane functions and dynamically separating conflicts remain valid. This discussion underscores the potential for wider implementation beyond the current case study.
In this study, the intersection of Dongling South Street and Nanhu Avenue was selected as the main object. The information on the intersection’s channelization scheme, signal timing strategy, geometric characteristics of the construction zone, and traffic flow data were collected. The impact of the construction zone on the operational characteristics of the intersection was explored, and various aspects such as intersection dimensions, traffic flow, signal phase settings and channelization layout were analyzed. The traffic optimization strategy of using left-positioned right-turn lanes and implementing dynamic shift left-turns during the morning peak hours was proposed to improve the intersection’s traffic efficiency and safety. According to the physical dimensions and the channelization situation of the target intersection, the channelization scheme and traffic facility design of the intersection with dynamically shifted left-turn and right-turn lane left placement during peak hours were carried out. Intersection-related design drawings were prepared. Afterward, the intersection capacity and vehicle delay were analyzed and calculated, the total delay minimum target signal timing optimization model was constructed, and the signal cycle and each phase timing scheme was solved [11]. Vissim simulation software (version 4.3) was used to compare the operation data before and after the intersection optimization and carry out simulation evaluation and analysis. Finally, the whole intersection optimization design process was summarized (Figure 1).

2. Survey and Analysis of the Intersection Traffic Status

2.1. Intersection Traffic Status Survey

2.1.1. Intersection Location Survey

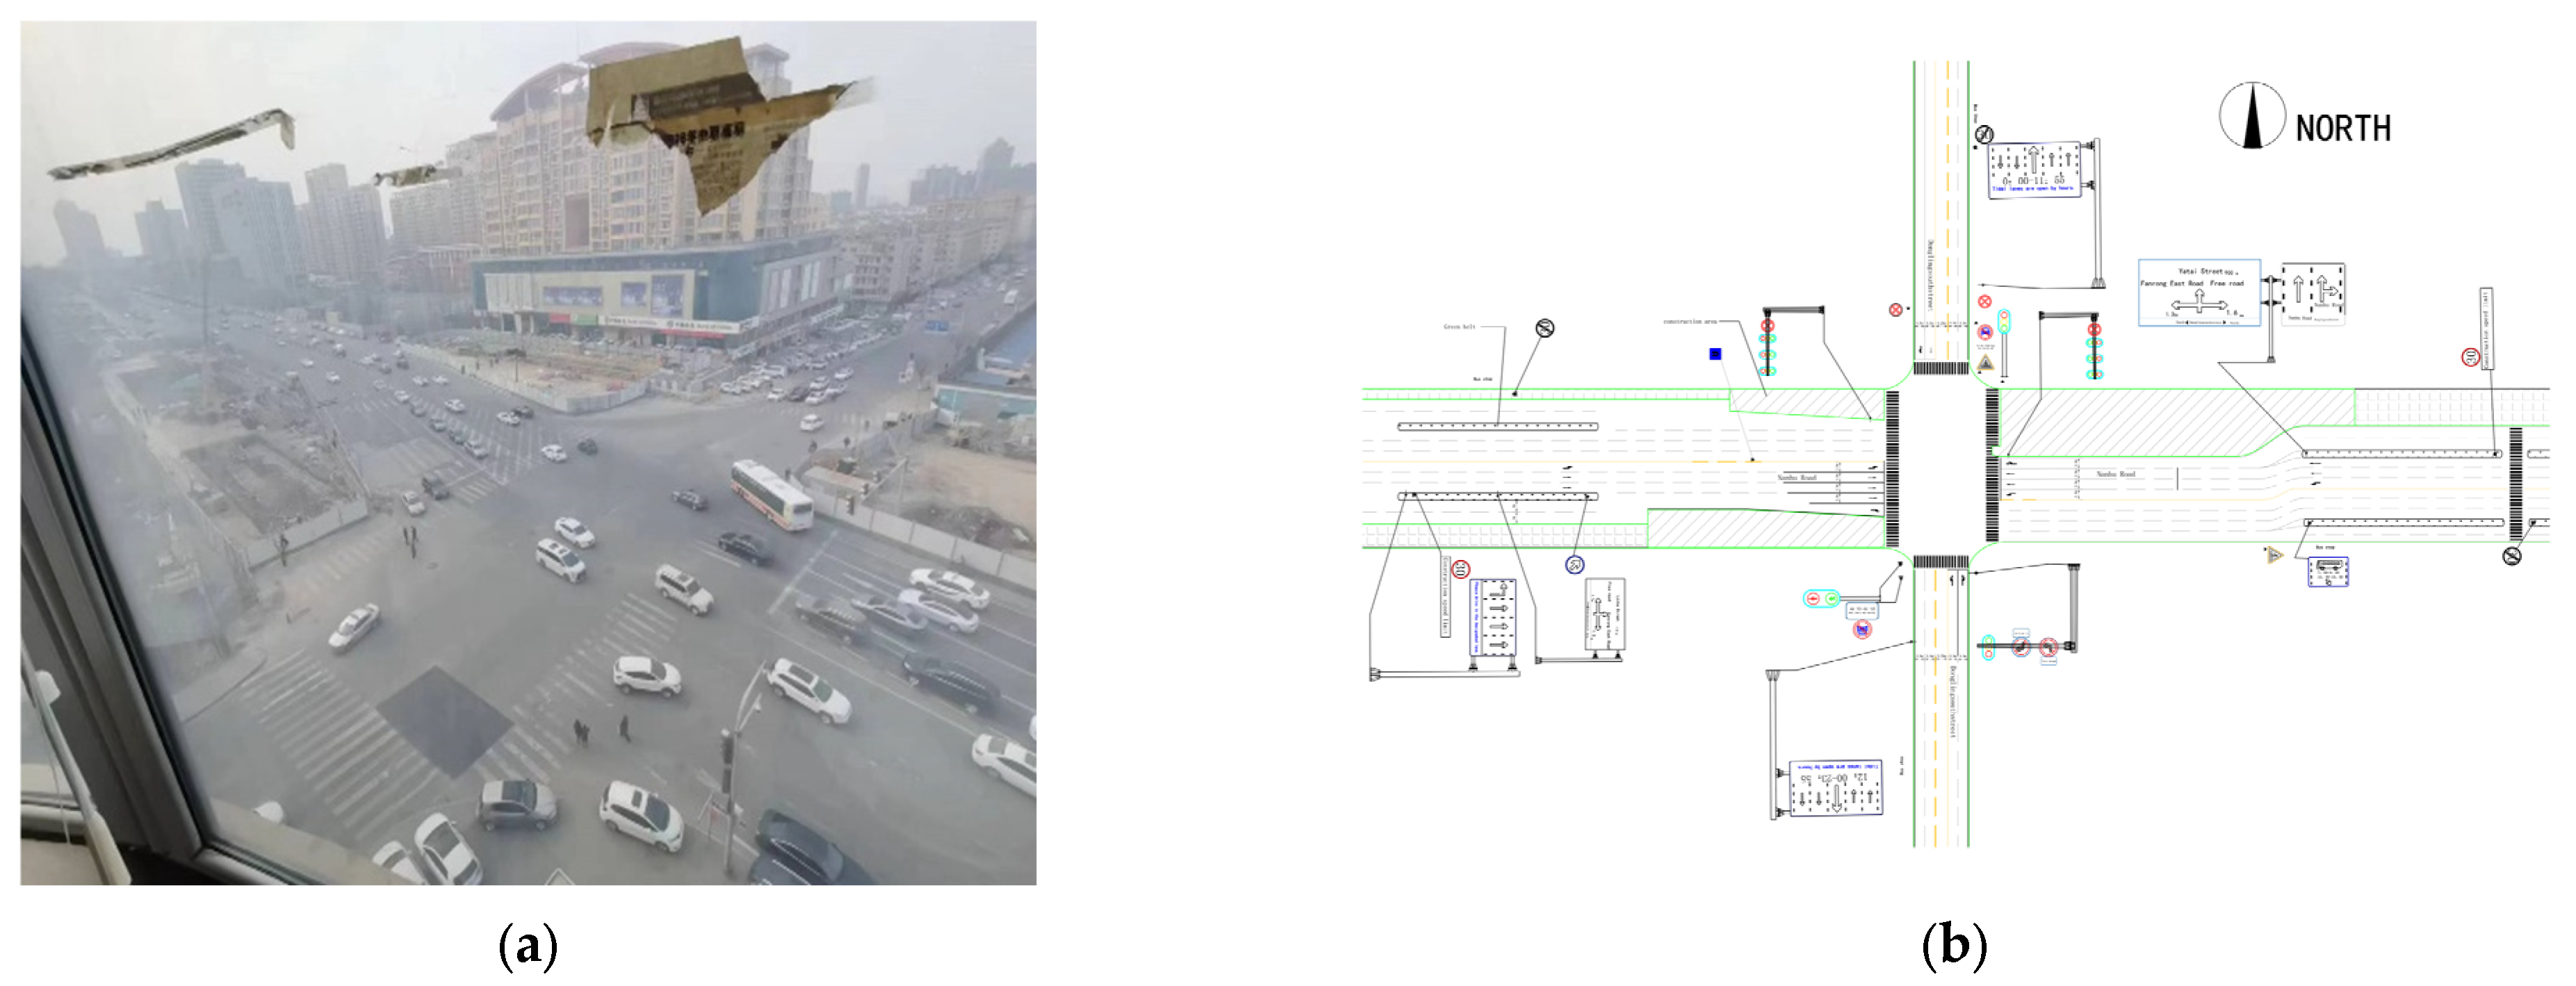
The intersection of Dongling South Street and Nanhu Avenue is in the central area of Changchun’s Nanguan District. North and south of the intersection is Dongling South Street, along which there is a large amount of residential land, which generates a large amount of passenger and vehicular traffic. The east–west direction is Nanhu Road, which is an urban artery running east–west through Changchun. Due to the straight-left mixing of traffic on South East Ridge Street, the intersection experiences severe internal conflicts during the morning and evening peak periods. In 28 March, 3 April, and 8 April 2024, the traffic status of the intersection of Dongling South Street and Nanhu Avenue was investigated, and the intersection channelization, signal timing scheme, geometric information of the construction zone, and traffic flow operation status, and the intersection operation status were analyzed (Figure 1). The construction zone extended from the intersection to about 80 m to 120 m from the west side and east side of the intersection. There were three construction zones with barriers occupying the roadway, which reduced the original two-way ten lanes to two-way eight lanes. The construction zone occupied the shoulder of the road, and there was no center median. The west side of the import road has five lanes, including the rightmost road for the exhibition of wide lanes, right-turn special exit, set up ahead of the right-turn lane, the exit road direction with four lanes, the east side of the import road is four lanes, and the exit road is also four. The north–south direction is East Ridge South Street, and the entrance and exit lanes have no median to separate two-way traffic. There are tidal lanes, 23:55–12:00 for south to north vehicles, 12:00–23:23:55 for north to south vehicles, while the north to south direction prohibits social vehicles to turn left, buses can turn left. According to the tidal lanes, the import lanes are all two lanes, and this north–south road is five lanes in both directions. The intersection data are shown in Table 1 and Table 2, and the actual and channelization maps are shown in Figure 2a,b. To ensure the simulation model accurately reflected the real-world conditions, calibration was performed using field-collected traffic data. Key parameters including vehicle composition, desired speed distributions, and driver behavior (such as lane-changing and car-following behavior) were adjusted to match the observed traffic flows and delays. The calibrated model showed a deviation of less than 10% in vehicle delay compared with the field measurements, ensuring the validity of the simulation results.

2.1.2. Intersection Signal Control Programs

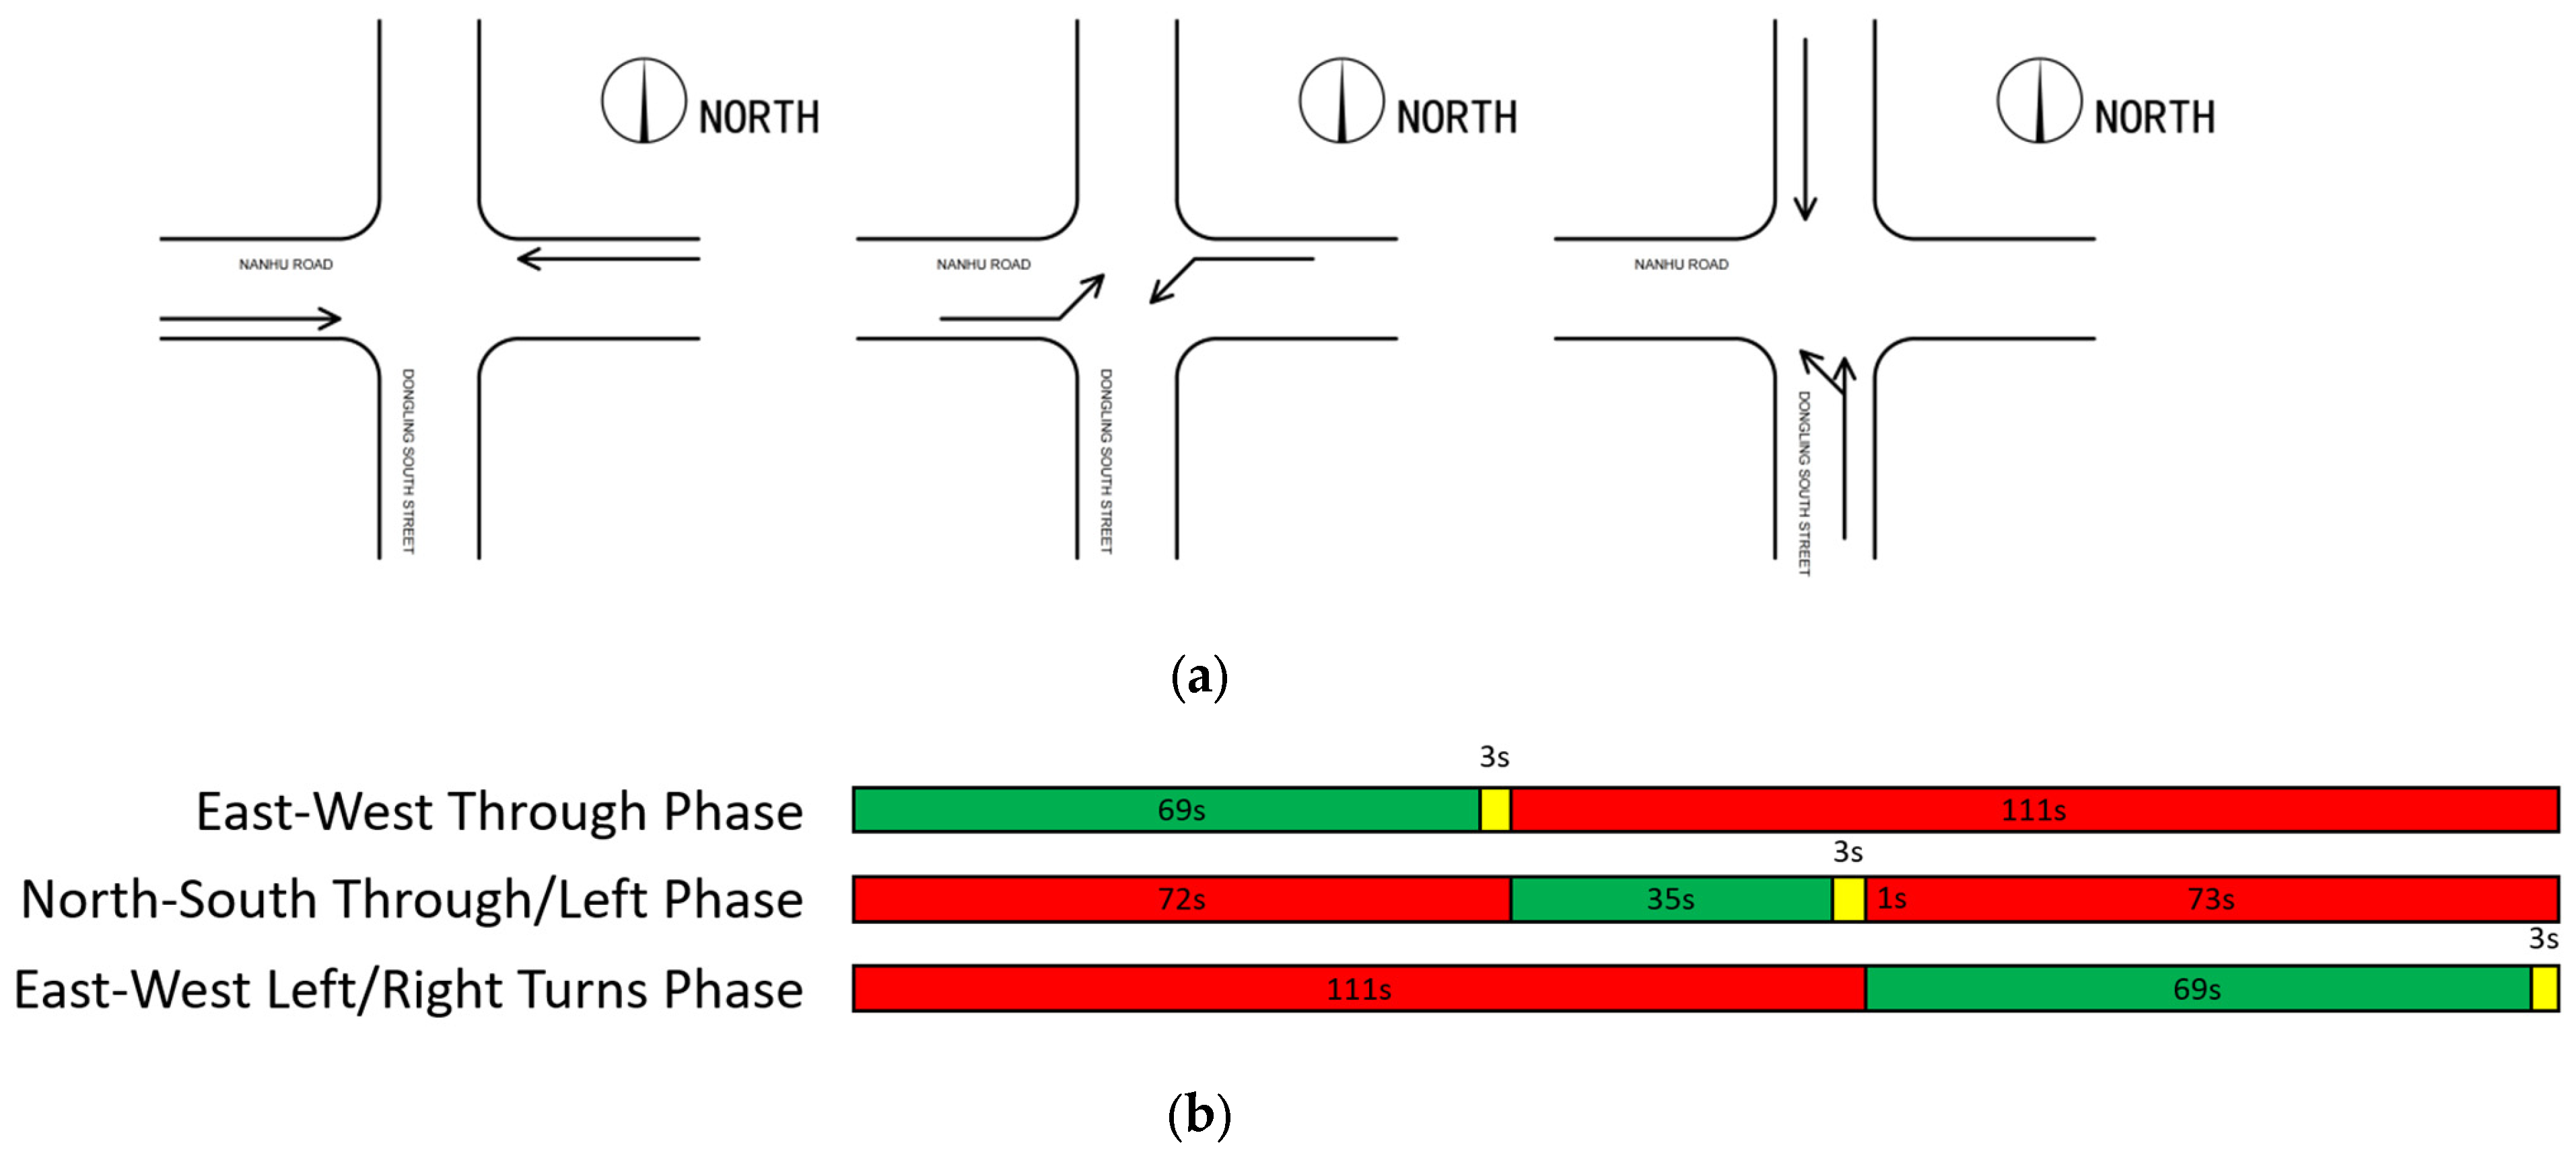
To ensure the robustness of the traffic demand assumptions, video data were collected on three weekdays during the morning peak (7:30–8:30 a.m.) and additionally during the evening peak (5:00–6:00 p.m.) and a weekend midday period (12:00–1:00 p.m.). The coefficients of variation for traffic volumes across these periods were calculated and found to be below 15%, indicating stable demand patterns and support the use of morning peak data as representative for simulation and optimization purposes. During the morning peak period, the intersection uses single-point fixed signal timing (Figure 3). Since the number of straight and left turns on Dongling South Street (north–south direction) is clearly less than that on Nanhu Avenue (east–west direction), there are no dedicated left-turn lanes and left-turn phases in the north–south direction. Straight and left-turning vehicles share a common phase, with a short time of green. Nanhu Avenue (east–west) has a larger traffic volume, with a dedicated left-turn phase.
A field traffic flow survey of the intersection was conducted using the video recording method, selecting the weekday morning peak 7:30–8:30 h for video recording of the intersection. The survey section was divided into four cycles at fifteen-minute intervals, and the vehicle operation of each inlet road was obtained as shown in Supplementary Tables S1–S6 (note: engineering vehicles were fewer and categorized as large vehicles). According to the known data, the vehicle input, vehicle type ratio, road speed limit and signal control, etc., and the design and simulation of the current intersection operation status quo are shown in Figure 4, the collection of delays is shown in Supplementary Table S7, and the delay unit is seconds (s). The data showed that the east–west inlet left-turn delay was larger, and east–west straight due to the construction zone occupying the roadway speed limit and the impact of right-turning vehicles also produced a large delay. Due to the construction zone occupying the roadway, the east–west direction generates many mandatory lane changes (i.e., lane changing behaviors performed by drivers to avoid obstacles in the driving process).

2.2. Comprehensive Analysis of the Status of Intersection Operation

2.2.1. Analysis of Traffic Operational Impacts from Occupancy Construction

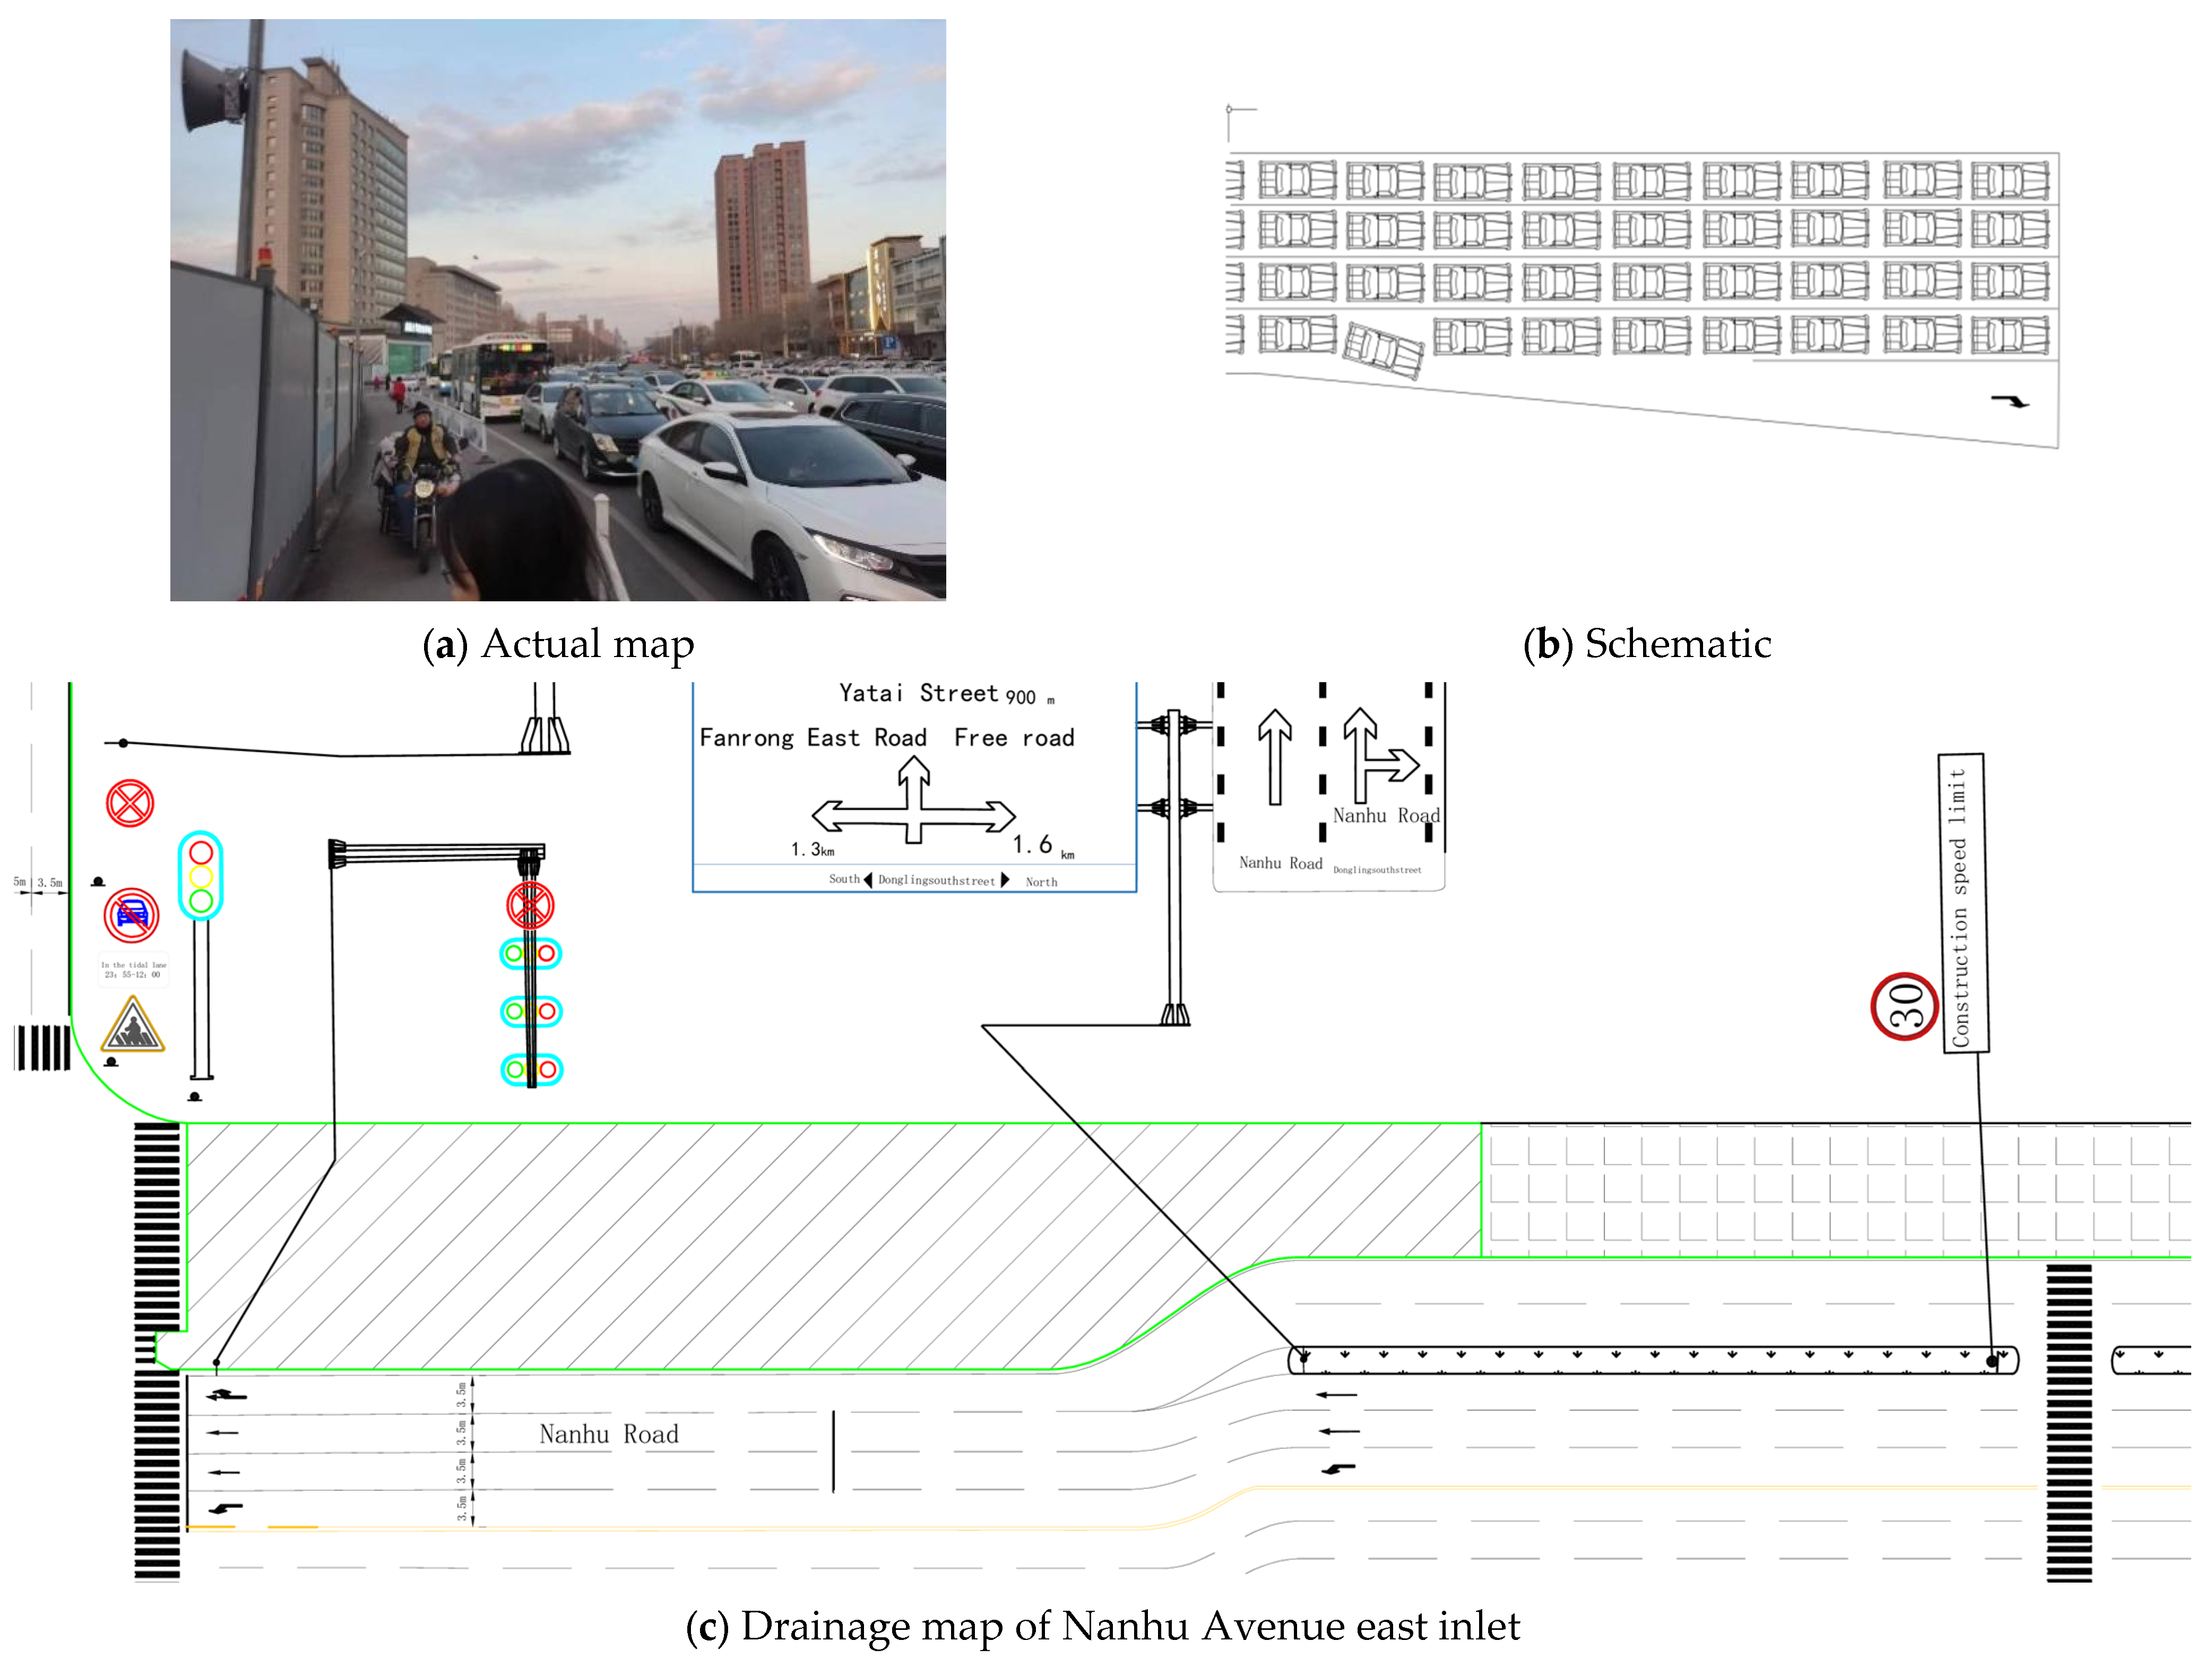
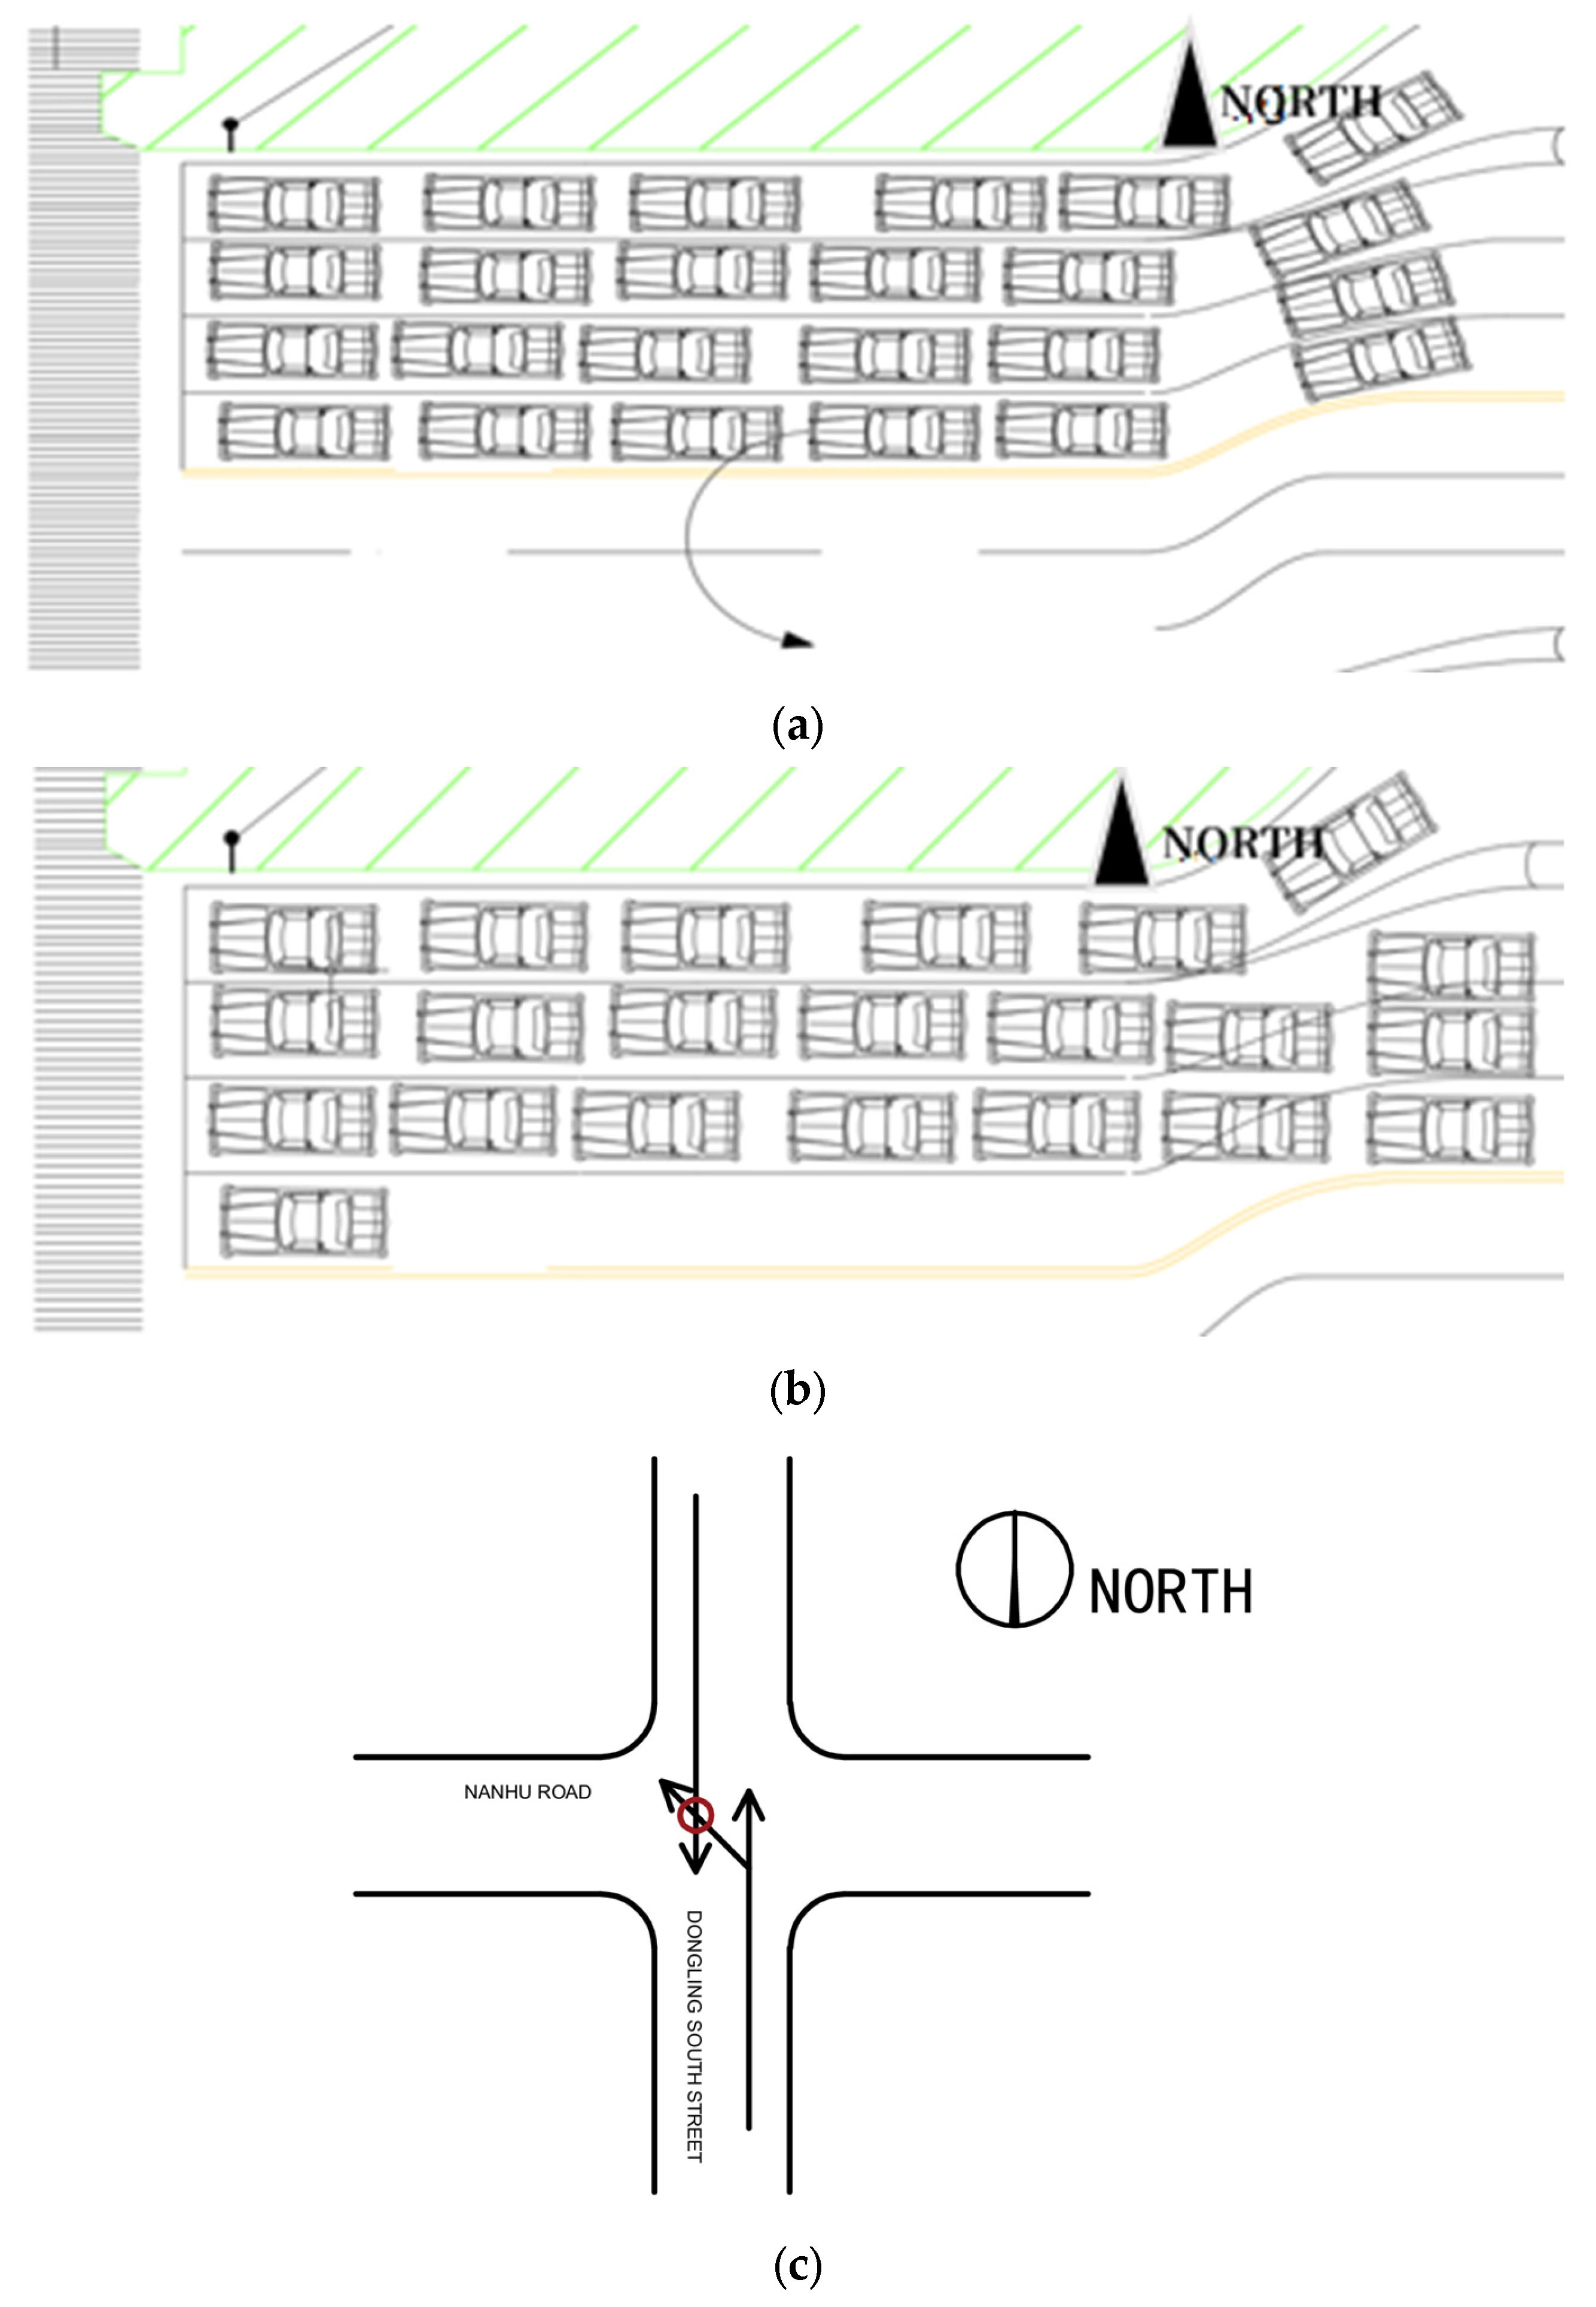
On the west import lane of the intersection, the current channelization plan considers that right-turning vehicles will need to move straight ahead to make a turn in the construction zone [12]. When the queue of straight-through vehicles reaches seven vehicles, right-turning vehicles cannot enter (Figure 5a,b). During the morning and evening peak periods, the early right-turn option does not solve the problem due to the high volume of traffic operating on Nanhu Avenue. In addition, the construction zone barrier obscures the turning visibility of right-turning vehicles, which increases the operating delay for right-turning vehicles significantly. On the east entrance roadway of the intersection, the irregular construction occupation area causes right-turning vehicles to nearly lose their turning vision and right-turning vehicles to operate slower (Figure 5c) [13]. The two lanes of the roadway auxiliary merge into the rightmost straight-right lane, and right-turning vehicles from the other lanes also merge into that lane, resulting in increased pressure on this straight-right shared roadway, which in turn affects straight vehicles [14]. Considering the right-turning vehicles and the construction zone, the east–west inlet lane of the intersection needs to be separated from the right-turning traffic.

2.2.2. Intersection Left-Turn Traffic Operation Analysis

Analysis of Left-Turn Traffic Operation on Nanhu Road
According to the analysis of the field survey data, there is a large traffic volume of left-turn-only lane on Nanhu Road (east–west direction). Many vehicles turn around on the east and west imports, and the west imports are farther away from the central guardrail from the intersection and are set up at 50 m from the intersection to allow for turnaround [15]. East inlet left-turn and U-turn vehicles cannot enter the left-turn lane due to the queuing of straight vehicles; the queuing of left-turn vehicles will also make the U-turn vehicles unable to perform a normal U-turn (Figure 6). According to the observation data during the morning peak period, during the fifteen-minute period of 7:30–7:45, the number of vehicles turning around in the east entrance was 41, and during 7:45 and 8:00, the number of vehicles turning around in the east entrance was 32, which is a large demand for turning around. The hourly flow rate of the east entrance with a dedicated left-turn lane reached only 148 pcu/h. According to the relevant norms at home and abroad, the actual situation does not meet the relevant norms for the installation of left-turn-only lanes. Both the roadway channelization bends caused by the construction zone and the U-turn vehicles had a greater impact on the left-turn vehicles.
East Ridge South Street Left-Turn Traffic Operations Analysis
On East Ridge South Street, left turns are prohibited on the north inlet roadway during the morning peak period, and on the south inlet roadway during the morning peak period. The number of left-turning vehicles arriving in one cycle reaches more than 15 vehicles, and even reaches 25 vehicles, which satisfies more than three arrivals in one cycle. According to the measured data, left-turning vehicles reach 434 pcu/h during the morning peak period (to meet 200 pcu/h), and left-turn-only lanes should be installed. For East Ridge South Street, the north entrance road during 0:00–12:00 should use the traffic organization of the ban on the left, with the rest of the time using straight-left mixed traffic organization [16]. The South Inlet Road is a straight-left mixed traffic organization throughout the day, and the north and south directions share a signal phase. Due to the large volume of left-turning traffic during the morning peak period, serious conflicts with straight vehicles are generated, as seen in Figure 6c. This reduces the intersection capacity and increases the risk factor. Tidal lanes are installed on South East Ridge Street Road, with southbound to northbound traffic from 23:55 to 12:00 and northbound to southbound traffic from 12:00 to 23:55

2.3. Intersection Traffic Organization Optimization Design Ideas

Due to the existence of the construction zone enclosure, more U-turn vehicles, and larger left-turn traffic demand at the south inlet in the morning peak, coupled with the road space limitation of its five-lane road and the no-left setup at the north inlet, the traffic efficiency is low. Therefore, it is necessary to carry out a traffic organization optimization design for the intersection of Dongling South Street and Nanhu Avenue [17]. A right-turn-only phase needs to be set up to control right-turning vehicles. In this paper, considering the construction area barrier occupying the road and the driver’s sight distance problem, it is proposed to place the right-turn lane on the right side of the left-turn lane (right-turn left setting). Considering the relative traffic volume of right-turning vehicles and straight vehicles set up left and right shared lanes, east–west right-turning vehicles and left-turning vehicles in the same inlet road share a phase, together with the pre-signal and other phases. However, Dongling South Street (north–south) is only a five-lane road and a secondary road with limited reconstruction conditions, so the shifted left-turn method currently proposed is not applicable. Drawing on the ideas of shifting left-turn and borrowing left-turn and the actual situation of the road, a dynamic shifting left-turn is proposed for five lanes of secondary roads. Using the unused space generated by the construction zone occupying the road, the shifted left-turn waiting area was set up to reduce the queue length, reduce the impact on the opposite traffic flow, and combined with the above right-turn traffic flow analysis study to give a dynamic traffic organization scheme.
Dynamic shifted left-turn lanes are used for shifted left-turn vehicle traffic and intersecting roadway turning vehicle traffic. Through the reasonable phase-phase sequence design, the separation of traffic flows in time can be realized, thus reducing the requirement of shifted left-turns on road space. Considering the conflict between the turning vehicles and the vehicles traveling straight in the same direction, and combined with the study of turning radius, the intersecting roadway inlet lanes were designed to be inclined to increase the turning radius and safety distance.
For a comprehensive consideration of the actual situation of the intersection, this paper investigated the Nanhu Road east and west imports of the right-turn left. For the left-turn lane U-turn vehicle obstruction problem, in the original left-turn lane on the right, set up left and right combined lanes, and the U-turn position for the rear. For the direction of Dongling South Street, use the dynamic shift left-turn, with reference to the idea of shifting left-turns in the east and west inlet channelization design based on signal control, phase-phase sequence, and sign marking design for the dynamic use of the intersection south of the import and export road space [18]. This separates the conflict between turning vehicles and shifted left-turn vehicles on Nanhu Road from space and time, and improves the intersection efficiency and safety. Since the proposed optimized design does not conform to the conventional design, it is necessary to carry out the design of the relevant signs and markings to remind the road users and improve the safety and practical effect of the optimized scheme. Based on channelization design, there was a main three-phase signal timing scheme: the first phase for the east and west inlet road straight, the second phase for the north and south inlet road straight and left turn, and the third phase for the east and west inlet vehicle turn. The pre-signal should be turned on during the first phase of the main signal to allow the left-turning vehicles to enter the opposite lane and wait for the left-turn, and during the second phase of the main signal, it is released together with the north and south inlet straight vehicles, and the red light of the pre-signal should be turned on before the opposite straight vehicles arrive at the pre-signal. By studying the constraint relationship between the main pre-signal and establishing a signal timing optimization model with the objectives of minimizing the total delay at the intersection and total emission at the intersection and maximizing the capacity of the intersection, the corresponding signal timing scheme and related parameters can be obtained by solving the global optimal solution.

3. Intersection Drainage and Traffic Facilities Design

3.1. Analysis of Drainage Design Conditions

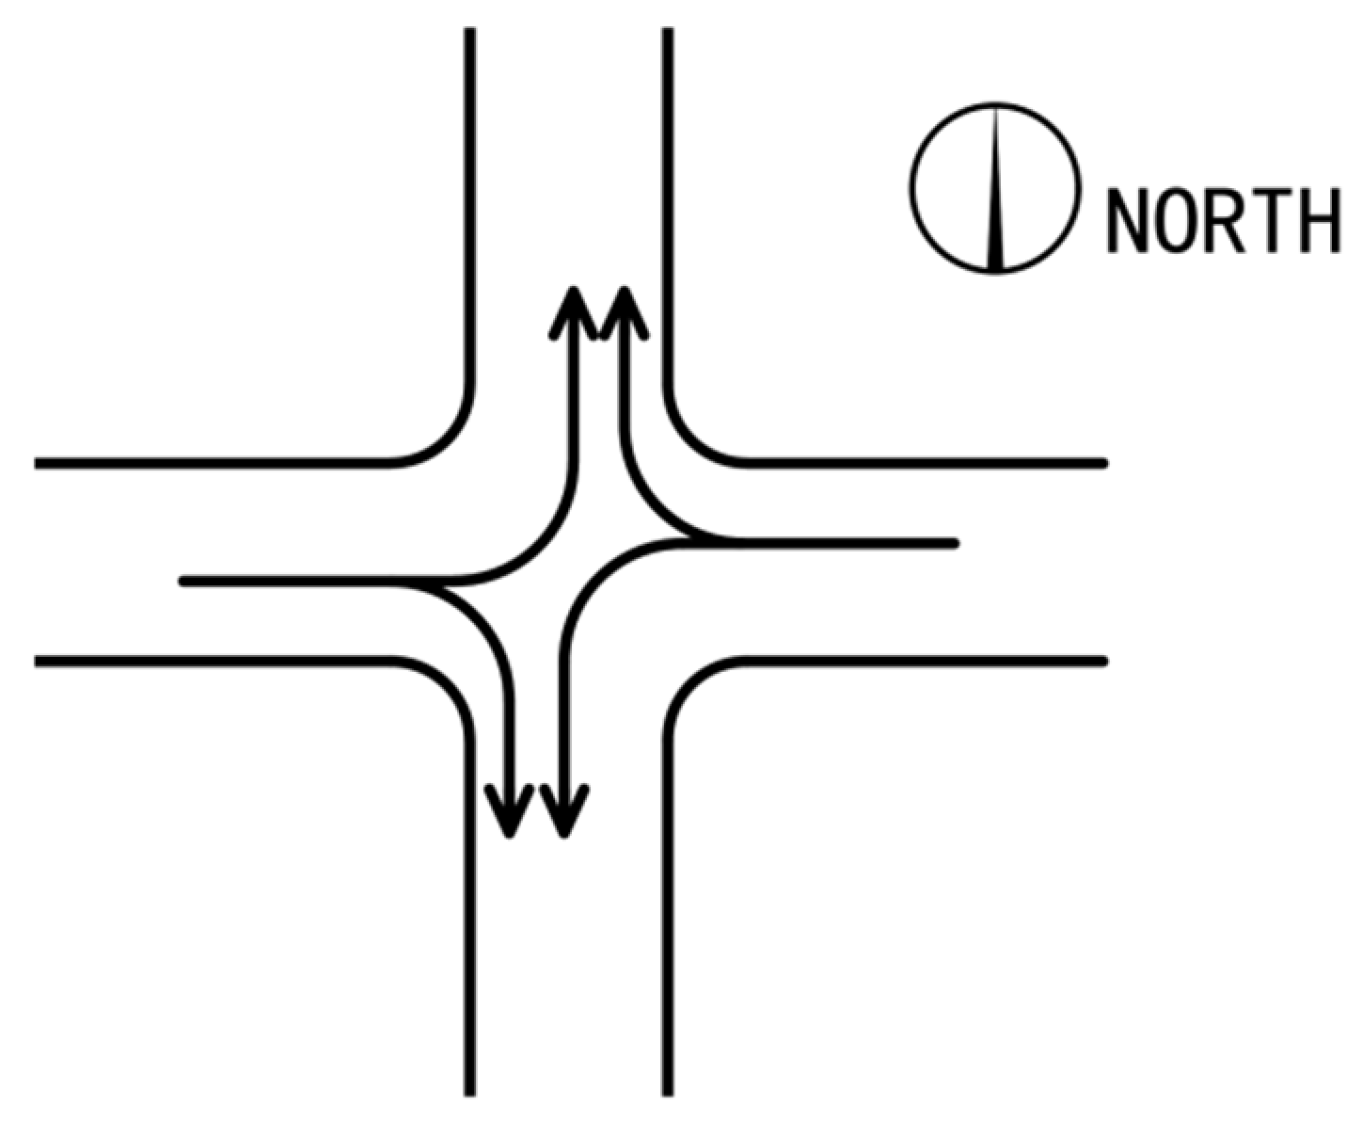
Right-turn left placement refers to the relocation of the right-turn lane to the left side of the left-turn lane to improve sight distance and reduce conflicts. This design is inspired by practices in cities like Hangzhou and Chongqing [6]. Borrowed left-turn indicates a strategy where left-turning vehicles temporarily use the opposite lane during a specific signal phase, controlled by a pre-signal. The dynamic shift left-turn represents an adaptive form of a borrowed left-turn where the use of opposite lanes is dynamically controlled based on real-time traffic conditions. For east–west right-turn left placement and left-right merge, the right-turn lane is adopted for left placement to achieve the separation of straight-right conflicts and to give right-turning vehicles in the construction area a sufficient safe sight distance. Based on adopting the right-turn left position, the left and right shared lanes are set up and placed next to the left-turn lane, sharing a phase with the east–west left-turn vehicles (Figure 7). The left-most left-turning vehicles can pass as usual, and the adjacent left-right shared lanes have no conflict points for left-turning vehicles with right-turning vehicles and right-turning vehicles in the opposite direction [10].
The left and right shared lanes are released at the same time as the left-turning vehicles in one phase, and the north–south exit lanes should be three or more. In fact, the tidal lanes used in the current channelization do not meet the conditions [19]. The optimized borrowed left-turn scheme can by reasonably controlling the setting position of the pre-signal (the queuing position of the north–south direction left-turning vehicles on the tidal lanes) and the phase sequence of the traffic flow. This can satisfy this condition, and vehicles can enter the exit lane without conflict and complete the lane change merge in sufficient distance.
The points to be considered for setting up a dynamic shifted left-turn and shifted left-turn waiting area in the north–south direction are as follows [20]:
(1) Road conditions
A five-lane dynamic shift left-turn lane is proposed. For the secondary road, set a dynamic shift left-turn lane through channelization and phase control, straight-left at the same time release, reduce the secondary road straight-left conflict at the same time, but also avoid setting a traditional four-phase control scheme, increasing the delay on the main road traffic. For intersecting lanes of right-turning vehicles, the right-turn-left program using signal control and shifting left-turning vehicles occupying the road at the time of separation fully reduces the secondary road straight-left conflict at the same time, and the main road operation also plays a positive role.
(2) Waiting for the turn area set up
Set up the left-turn waiting for the turn area; the south entrance left-turn waiting for the turn area can be parked with two to three cars. For morning and evening peak, a cycle to arrive at the left-turn vehicles in 15 vehicles-25 vehicles, the set up to turn area can shorten the borrowed left-turn to take up the opposite lane length and reduce the left-turn vehicle turning time at the same time to be set up in accordance with the location of the construction zone set up.
(3) Dynamic shift left-turn lane length setting
The dynamic shift left-turn on secondary roads proposed in this paper needs to be set according to the actual traffic volume of the left-turning vehicle, the length of the borrowed opposite lane, and the bit of the vehicle turning left into the opposite lane.
(4) Continuity and safety of straight-left traffic on secondary roads
When the green light for the east–west (primary road) straight phase is on, the left-turning vehicles in the north–south direction (secondary road) will be controlled by the pre-signalized green light, which will allow them to enter the opposite lanes and queue up. Once the east–west straight ahead green light stops, the north–south straight ahead and left-turning vehicles will be given a release signal at the same time. At this time, the pre-signal red light will come on to ensure that new left-turning vehicles will no longer enter the opposite lane while allowing left-turning vehicles already in the queue and straight ahead vehicles in the opposite direction to pass safely.
(5) Vehicle turning radius
The left-turning vehicle is set on the leftmost side, and the corresponding turning radius is calculated for the actual situation of the intersection, and the turning radius of the intersection improved in this paper is sufficient.

3.2. Drainage Plan

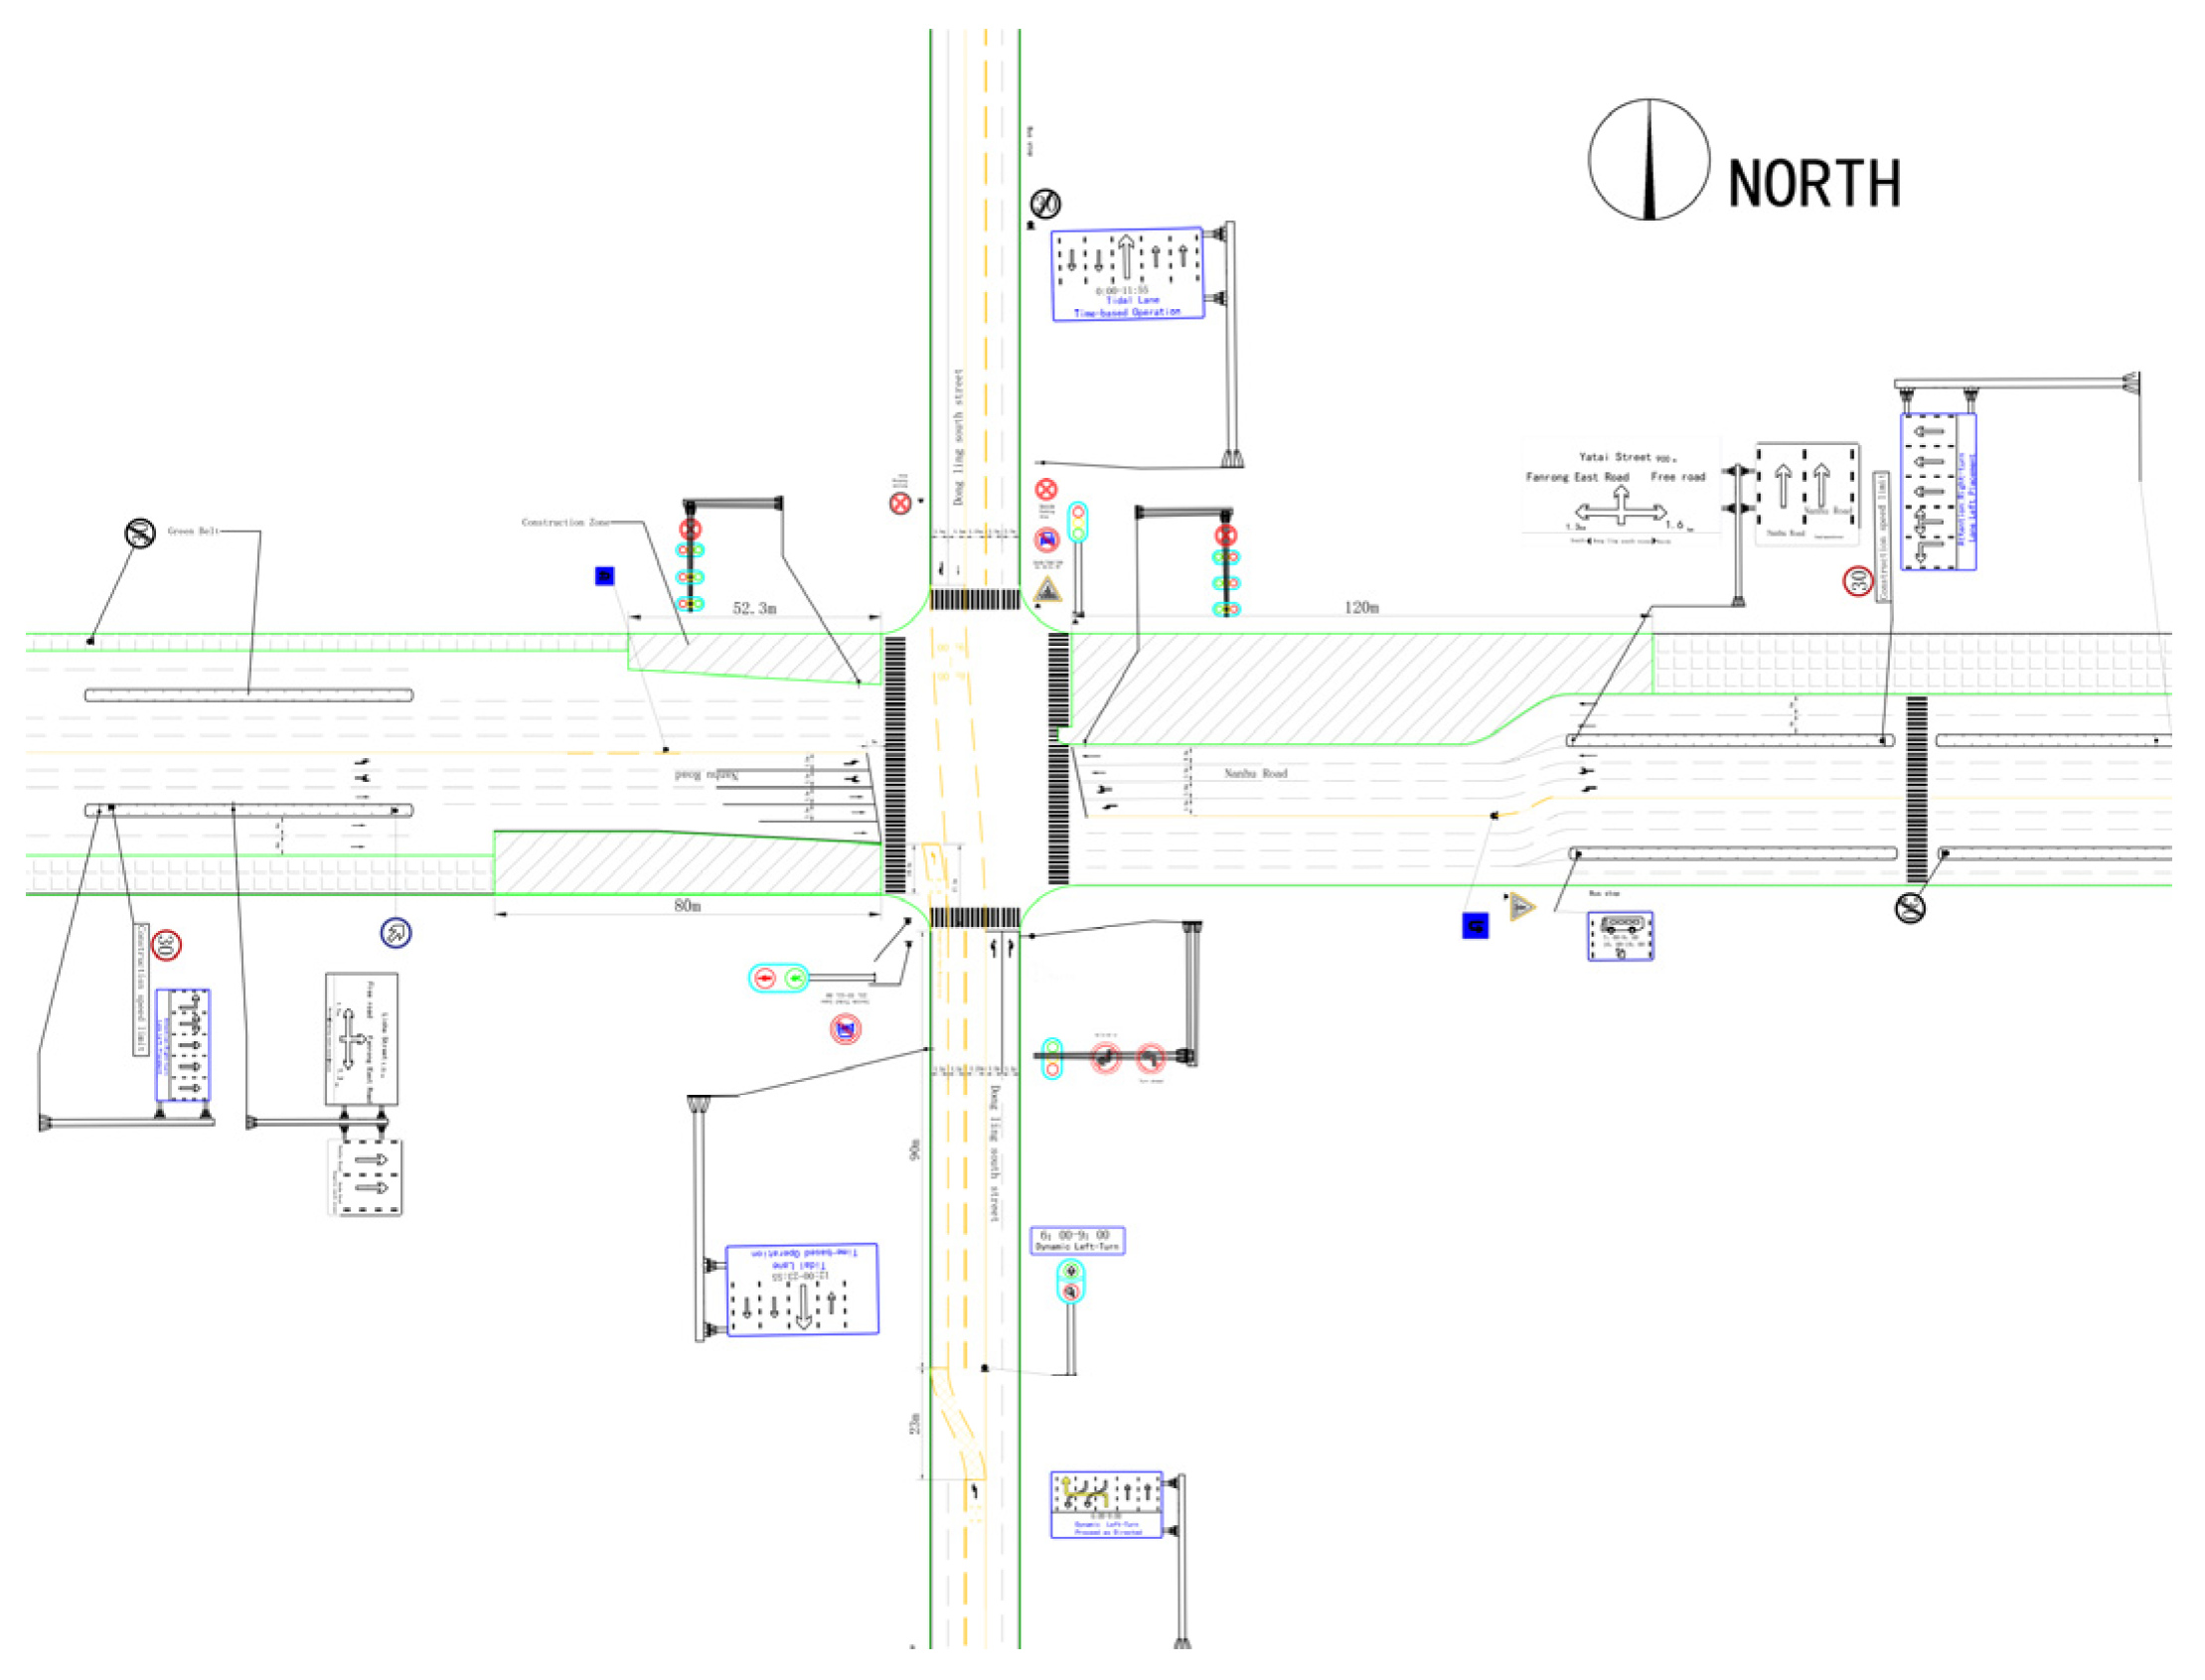
Considering the above setup points, our optimized drainage design is shown in Figure 8.
According to this paper’s analysis of the channelization setup conditions and channelization scheme, the roadway function was divided.
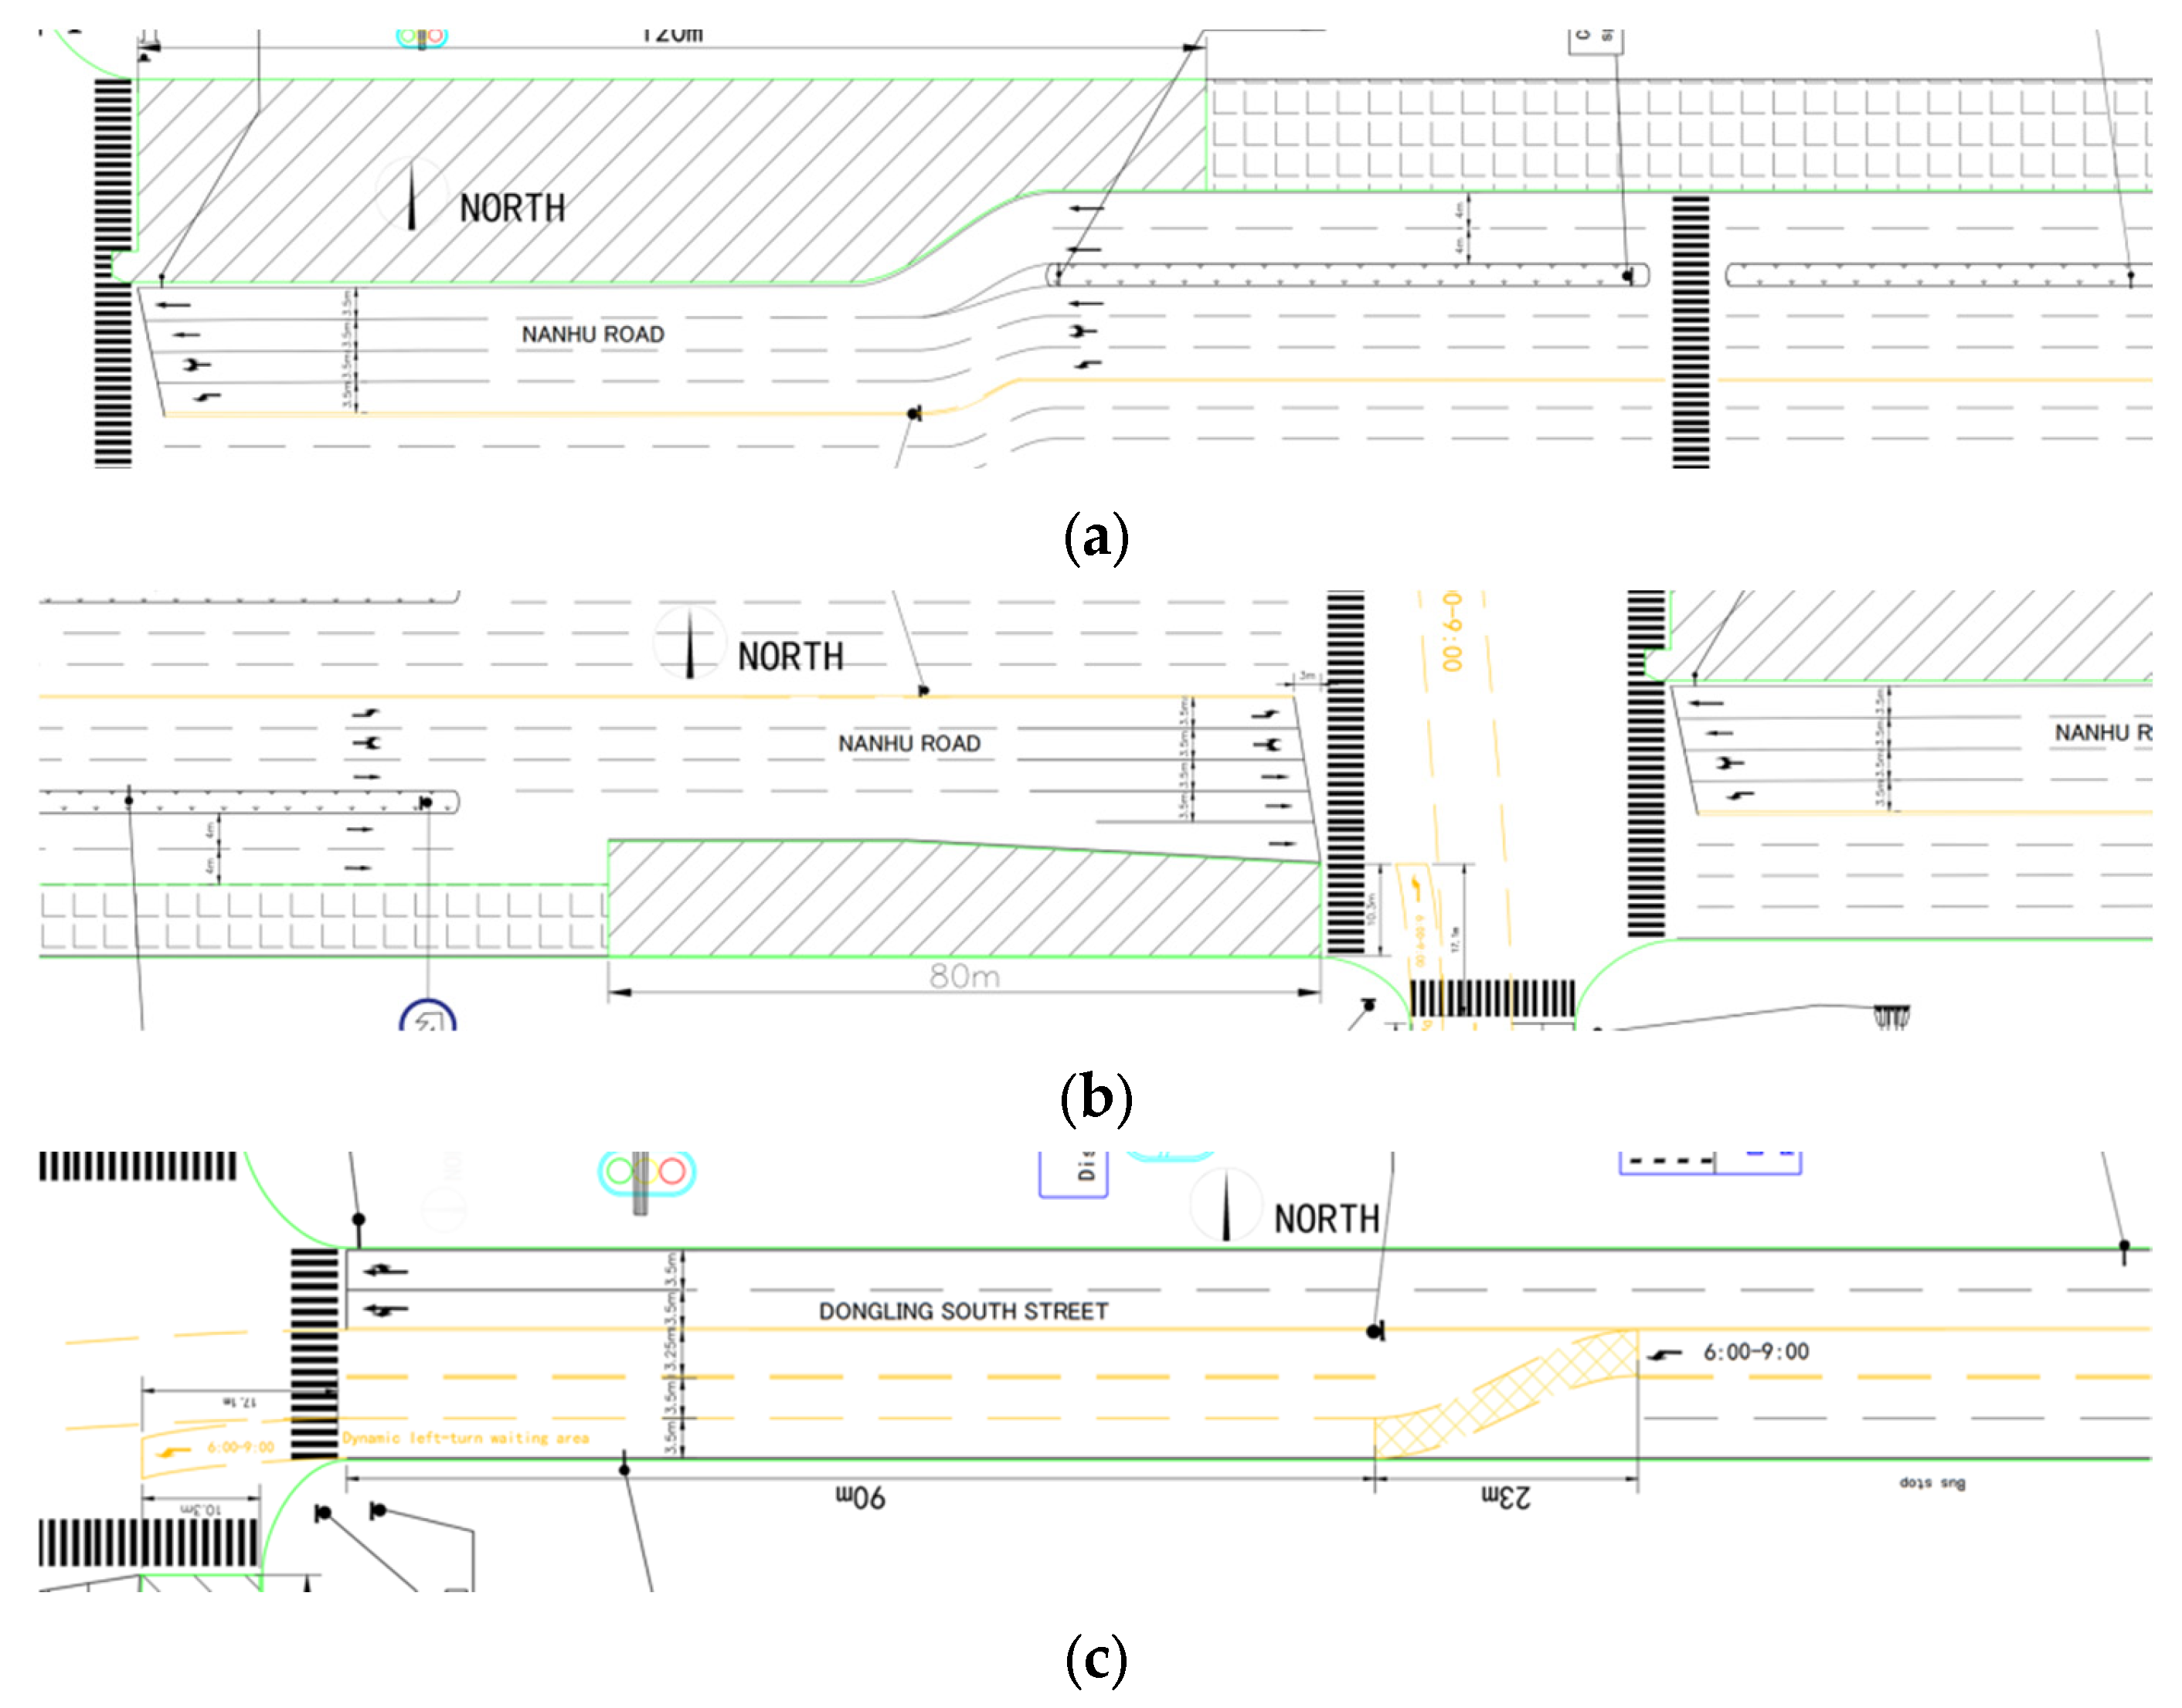
(1) Nanhu Road east and west imports to take the right-turn left and left and right merger, the east imports four imports of four lanes from the center line to the outside of the four lanes, the lane function is a left-turn-only lane, a left- and right-turn to the shared lanes, and two straight lanes. The innermost lane allows vehicles to make a U-turn, and the U-turn position is about 80 m from the stop line at the turning point. The west import has five import lanes, five lanes from the center line to the outside, lane functions are a left-turn-only lane, a left- and right-turn shared lane, and three straight lanes. The innermost lane allows vehicles to make a U-turn, and the U-turn location is at the turnaround point about 60 m from the stop line. The length of the openings at the turnaround are all 15 m (see Figure 9).
(2) East Ridge South Street on the north and south inlet lanes: the north inlet lanes do not make improvements to the design, the south inlet lanes are set up to dynamically shift left-turns, based on the existing channelization, the outermost exit lane of the south inlet is set up to dynamically shift left-turns, in the second phase of the main signal part of the time, the outermost exit lane is used for left turns on the south inlet, and during the third phase, the outermost exit lane is reused for turning vehicles to exit the intersection (Figure 9c).

3.3. Drainage Program Detail Design

(1) Shift left-turn waiting area design [9]
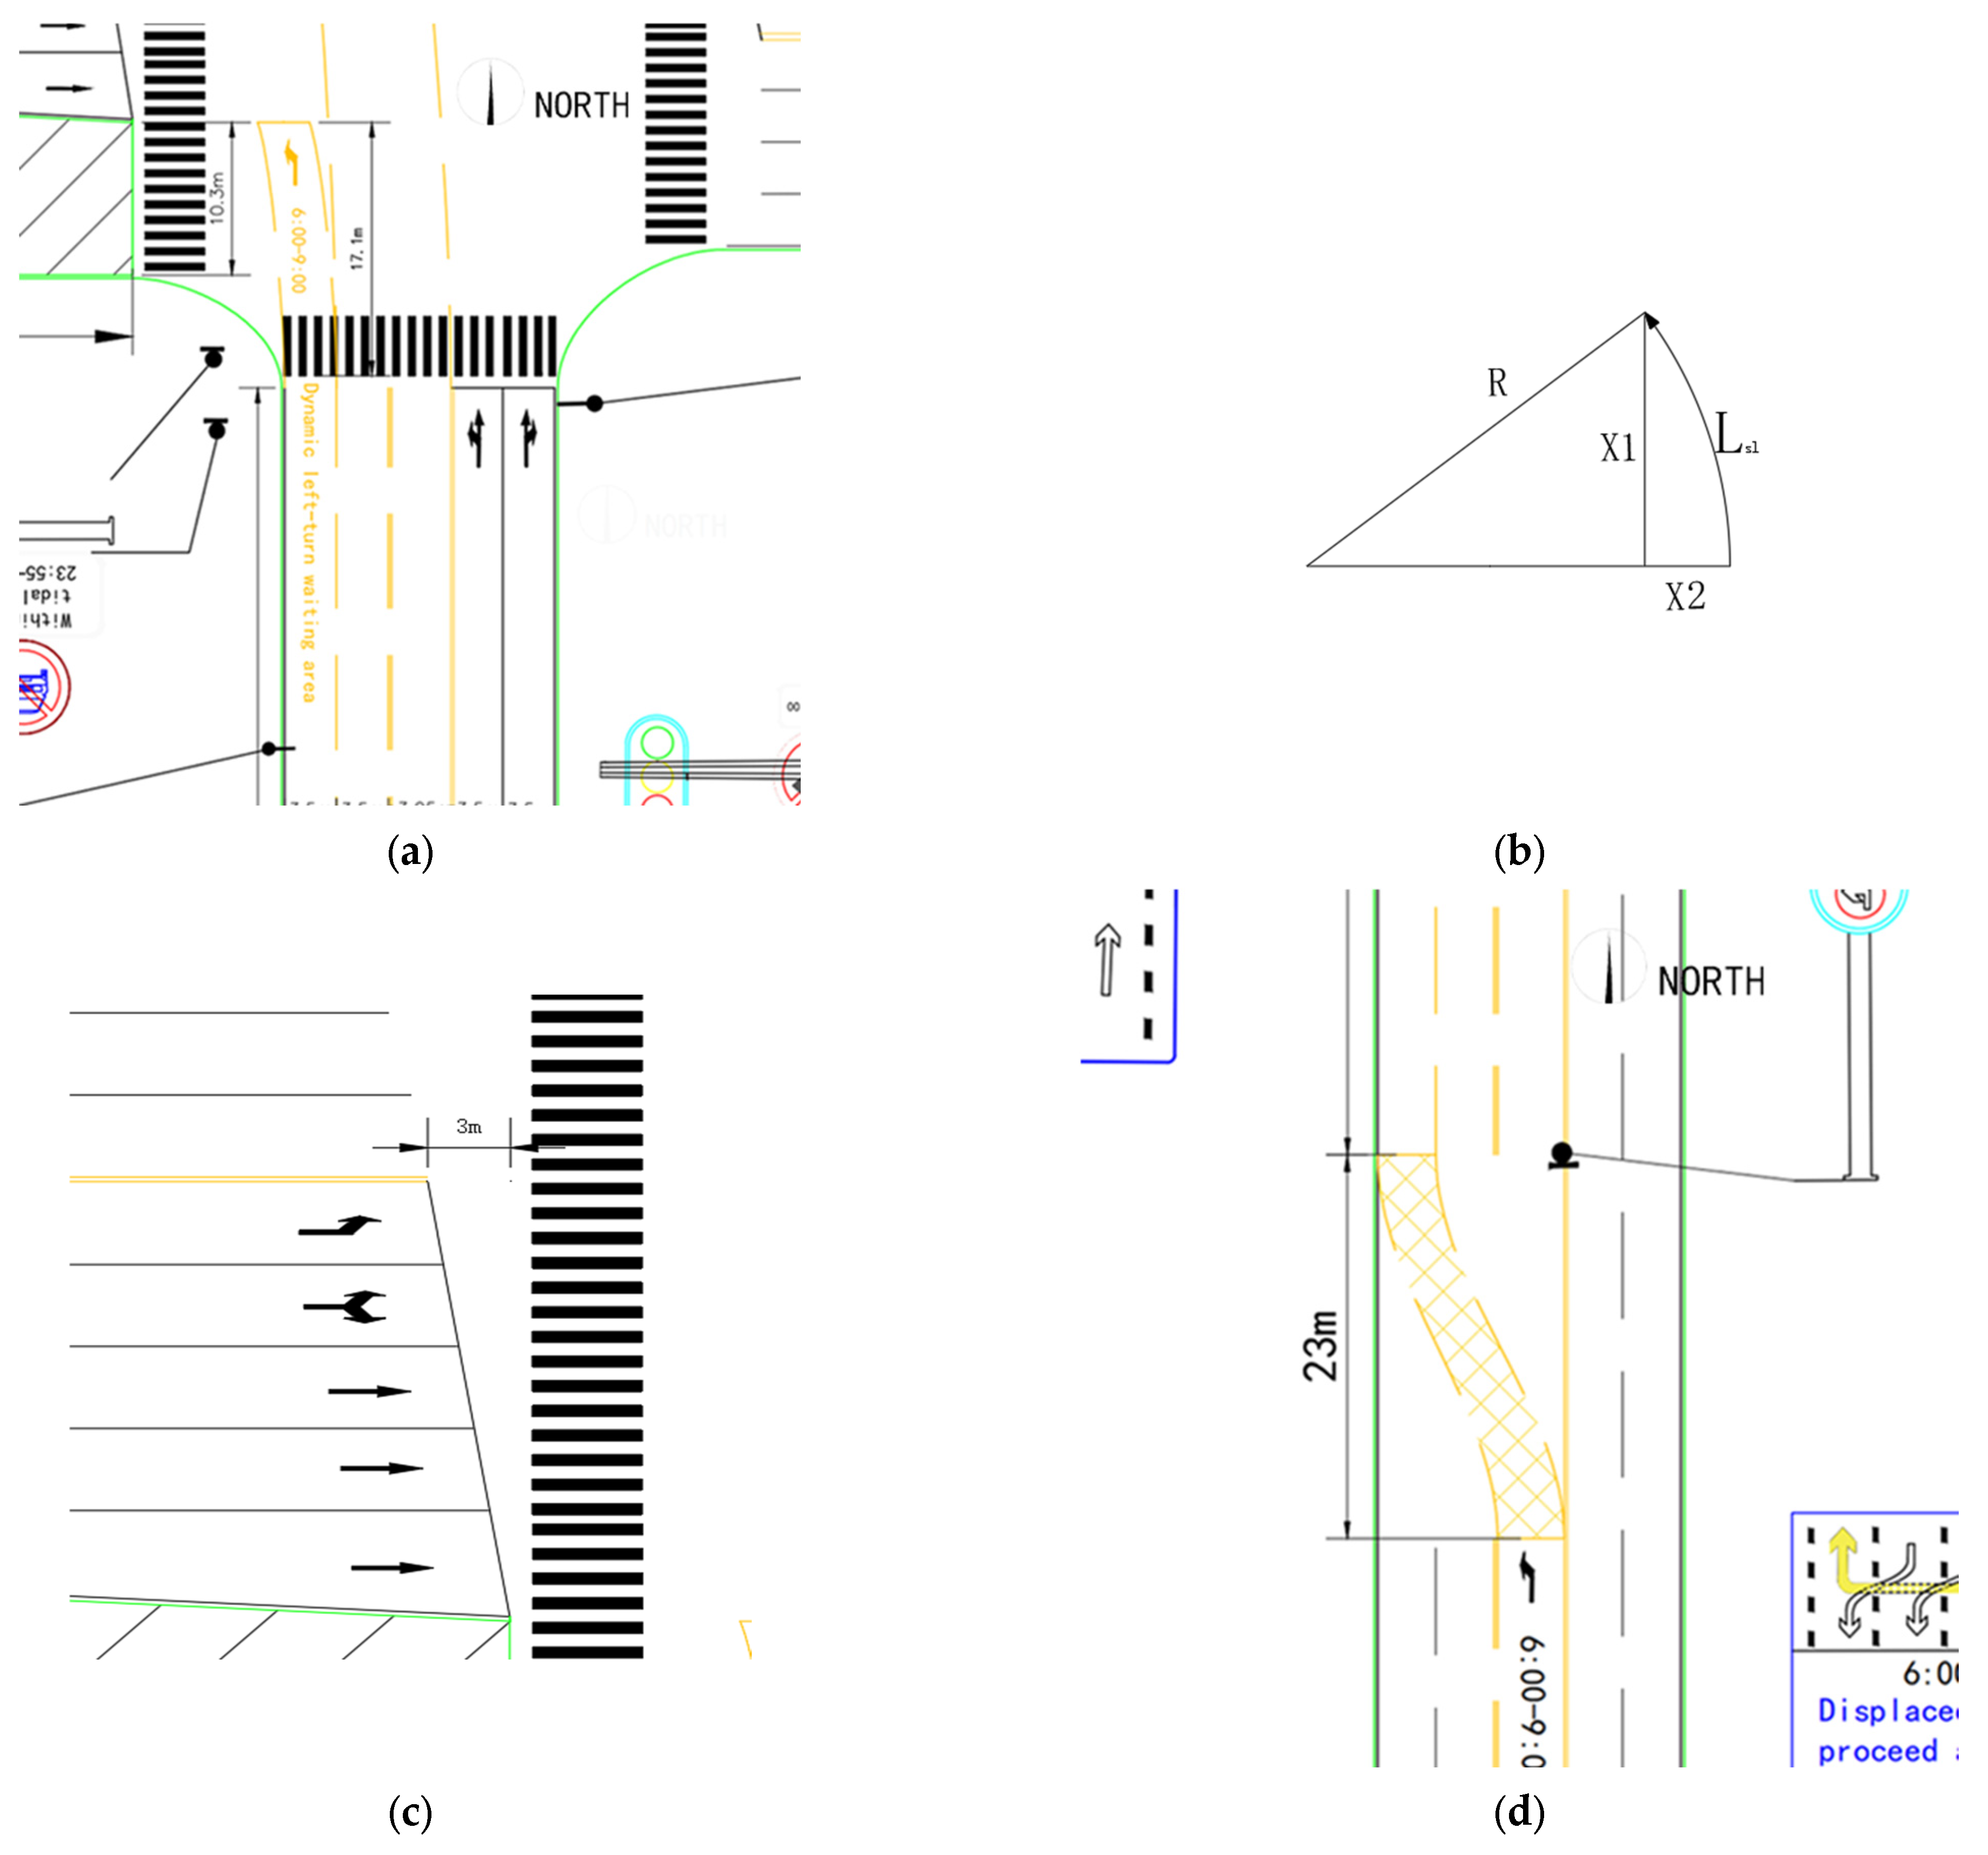
The south inlet dynamic shift left-turn can be used to set up a left-turn waiting area in the construction zone. For the South East Ridge Street and Nanhu Road intersection of the south inlet road shift left-turn waiting area, see Figure 10a, according to the actual measurements, the dynamic shift left-turn waiting area (S1), with a length of 17 m stop line in front of the waiting area space, is enough to park two to three left-turn vehicles.
Considering the turning radius R of the left-turning vehicle, the turning radius of the turning vehicle needs to satisfy Equation (1), and at the same time, in order to avoid conflicts with the opposite right-turning vehicle and pedestrians and enter the inside lane as much as possible, this paper chose to design the east–west roadway stop line to be tilted.
R > R m i n = V 2 127 μ + i
R is the radius of the circular curve in the turning area to be turned, R m i n is the minimum turning radius of the traveling vehicle that turns left to the circular curve in the turning area to be turned, μ is the lateral force coefficient, V is the speed of the traveling vehicle on the calculated road, and i is the lateral gradient of the calculated lane group.
To assess the turning performance of road intersections more accurately, this paper adopted the method of taking the middle value of the design speed of each grade of road, and set the turning design speed as 50% of the road design speed. Based on this method, this paper obtained the specific values of turning speeds for each class of road intersection listed in Supplementary Table S8. Combined with Equation (1), the calculated vehicle turning radii are shown in Supplementary Table S9.
When the turning radius satisfies Equation (2), the turning radius of the left-turning vehicle from the south inlet into the inner three lanes of the west exit is about 50 m, which satisfies the minimum turning radius. At the same time, it can be obtained that the south inlet left-turn distance L 1 is about 30 m.
X 2 + ( R Y ) 2 = R 2
(2) East and west inlet lane tilt design
Based on comprehensive actual and existing research, this paper designed an east and west inlet at the innermost side of the left-turn lane stop line backward indentation of 3 m (Figure 10).
(3) Dynamic shift left-turn vehicle conversion section lane length L 1
Relevant research has shown that the left-turn vehicle changes lanes in the process of an S-type trajectory. According to the actual situation of the road (Figure 10d), using the secondary road design speed of 50 km/h, 70% of 3 m/h, L 1 can be calculated according to Equation (3).
L 1 = V 1 × Δ w 3
where V 1 is the lane change speed, m/s and Δ w is the lane change width, m. According to the actual data, Δ w is 7 m and V 1 is 35 km/h, so L 1 was rounded to 23 m.
(4) Dynamic shifted left-turn lane length L 2 Referring to the idea of the shifted left-turn, the unfavorable factors of too long and too short were considered based on meeting the demand of left-turn vehicles. As the dynamic shift left-turn is set in the secondary road, the north–south straight-left phase signal time should not be too long and too short. Therefore, the length of the dynamic shift left-turn lane should satisfy Equations (4) and (5):
S 1 + L 2 = K × N × S ¯
N = Q l e f t × T 3600 × n #
where S 1 is the length of the shifted left-turn waiting area, 17 m; L 2 is the length of the dynamic shifted left-turn (m); S 1 is the length of the left-turn waiting area, m; N is the left-turn traffic volume in one cycle, vehicles; Q l e f t is the left-turn hourly flow rate in the morning peak, pcu/h; T is the signal cycle time of the intersection, s; n is the number of lanes in that phase; S ¯ is the average stopping spacing (7.6 m); K is the vehicle arrival non-uniformity coefficient (1.5).

4. Signal Control Scheme Optimization Design

4.1. Signal Control Scheme Optimization Design

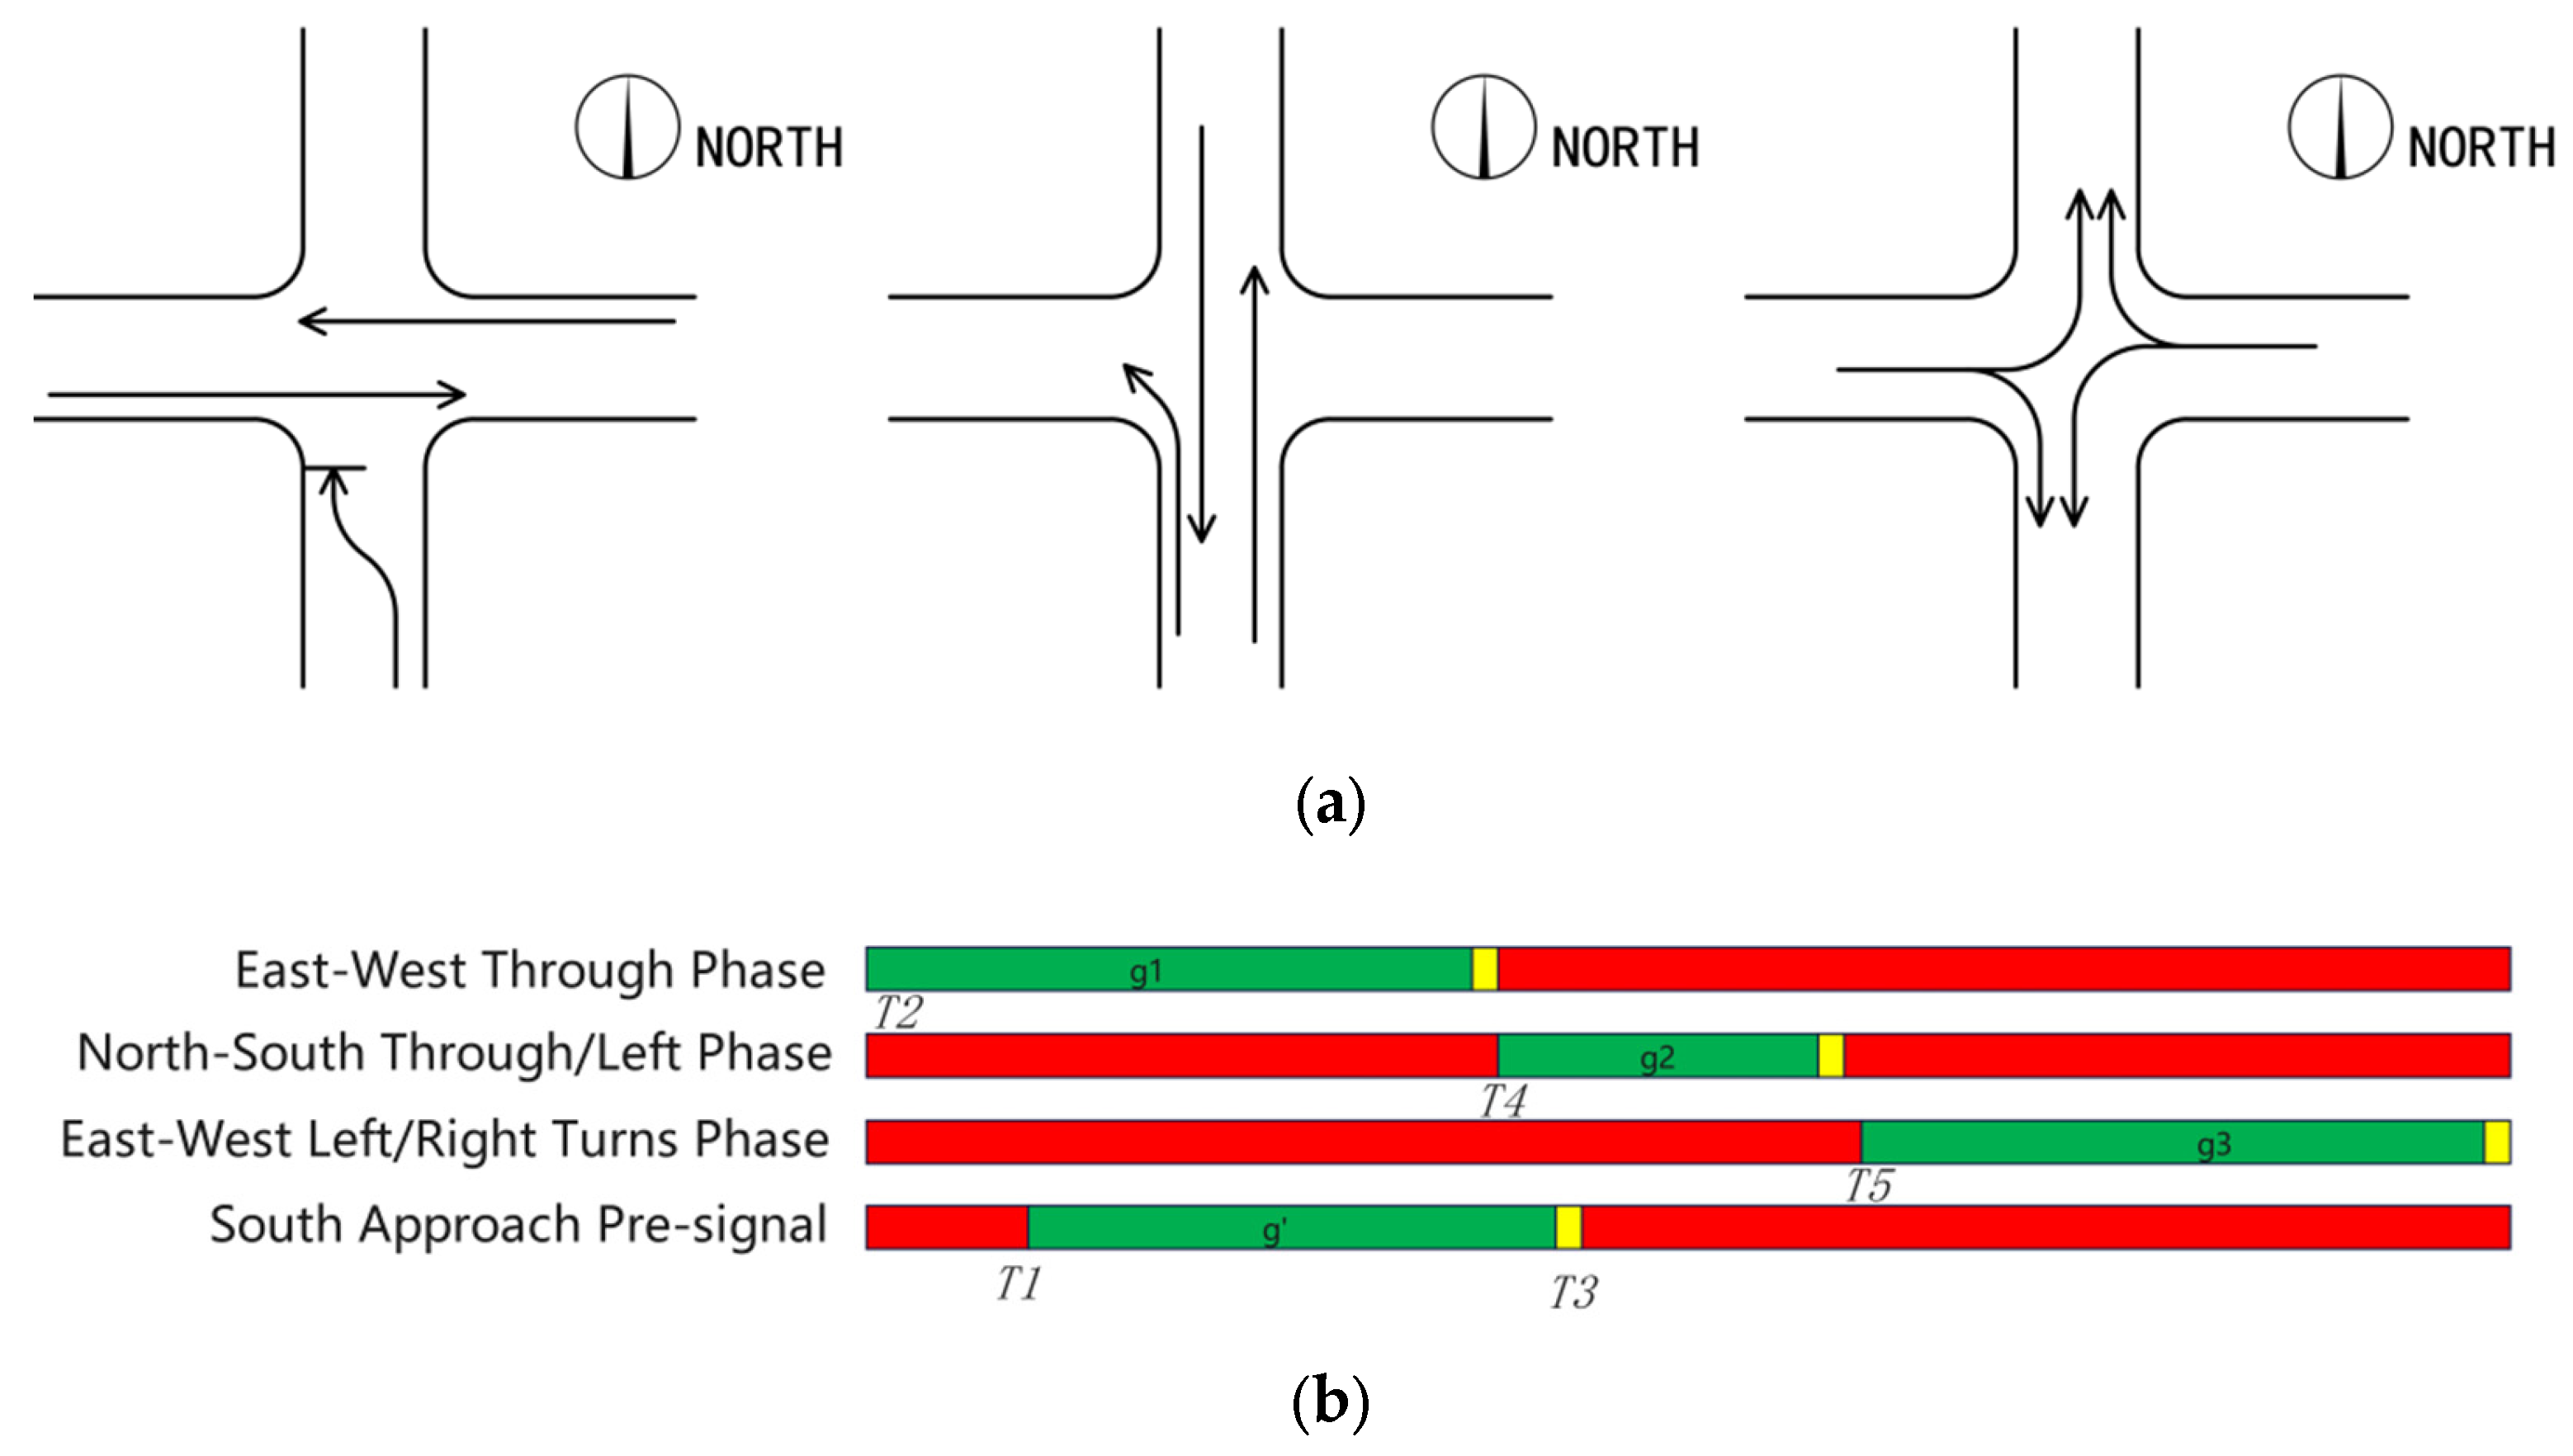
Chinese national regulations mainly include a straight lane basic capacity of 1650 pcu/h/lane. Therefore, the signal control scheme optimization needs to consider this capacity. Based on the improvement of the channelization scheme, a three-phase signal control scheme was adopted, with the first phase for straight traffic in the east–west direction, the second phase for straight traffic and left turns in the north–south direction, and the third phase for left- and right-turns in the east–west phase. Set up the pre-signal; during the pre-signal green light, let the left-turn vehicles into the dynamic shift left-turn lanes to be left-turn vehicles away, and through signal control, let the intersecting road vehicles into the lane (Figure 11a). Based on the determination of the phase sequence, the signal control scheme is shown in Figure 11b.

4.2. Pre-Signal Constraints

The timeline is interpreted as follows (Figure 12):
1. East–west through phase (main signal): This is the first phase of the main signal cycle, during which vehicles on Nanhu Avenue travel straight. The pre-signal on the south approach is activated within this phase.
2. Pre-signal green activation (T1): The pre-signal green light starts at time T1, which is calculated as T1 = T2 + t1, where T2 is the start of the east–west through phase and t1 is the time required for the last turning vehicle from the intersecting road (e.g., a right-turning vehicle from the west exit) to clear the dynamic shift left-turn area. This delay ensures that left-turning vehicles from the south entrance do not conflict with turning vehicles from the intersecting stream.
3. Pre-signal green termination (T3): The pre-signal green light ends at time T3, which must occur before the onset of the north–south through/left phase on the main signal (T4). This is governed by T3 = T4 + t2, where t2 is the time required for the first opposing straight vehicle (from the north entrance) to arrive at the conflict point after its signal turns green. Terminating the pre-signal green at T3 prevents new southbound left-turning vehicles from entering the opposing lane and ensures a safe clearance interval.
4. North–south through/left phase (main signal): During this phase, vehicles queued in the dynamic shift left-turn lane (which entered during the pre-signal green time) are discharged simultaneously with the southbound through traffic, completing the left-turn maneuver safely without conflict with opposing flows.
The effective green time for the pre-signal (g′) is therefore the interval between T1 and T3, which is constrained by the duration of the east–west through phase and the critical time intervals t1 and t2, as specified in Equation (10). This coordinated timing strategy ensures the safe and efficient operation of the dynamic shift left-turn maneuver.
In order to avoid conflict between the turning vehicles and left-turning vehicles on intersecting roads, the green light of the south inlet pre-signal should be activated after the left-turning and right-turning vehicles on the intersecting roads pass through the switching road section (Equation (6)). Through signal control, the east and west import left- and right-turn vehicles, in the third phase of the intersection, can reach the north and south exit road. Assuming that in the last second of the yellow light, the last turning vehicle reaches the south exit lane, the vehicle passes through the dynamic shift left-turn and changes road section, then the south exit lane left-turning vehicle enters the dynamic shift left-turning lane in order to ensure its safety, so it can be based on Equation (7) to calculate the time of the vehicle passing.
T 1 = T 2 + t 1
t 1 = L 1 + L 2 V 2
where T 1 is the south inlet pre-signal green light start time (s), T 2 is the east and west inlet straight green light start time (s), t 1 is the intersecting road turn of the last vehicle through the dynamic shift left-turn area time (s), L 1 is the dynamic shift left-turn lane length (m), L 2 is the change of the road section length (m), and V 2 is the vehicle in the East Ridge Street exit section of the driving speed. To ensure sufficient safety, the design speed was 25 km/h.
At the same time, in order to ensure that the opposite direction of the straight traffic flow and left-turning vehicles entering the dynamic shift left-turn lane will not conflict, the pre-signal green light stop time needs to ensure that the opposite direction of the straight traffic arrives at the lane change area before. Therefore, the pre-signal green stop time should satisfy Equations (8) and (9).
T 3 = T 4 + t 2
t 2 = L 2 V s + L 3 V 3
where T 3 is the pre-signal green light stop moment (s), T 4 is the north–south straight-left phase green light on the moment (s), t 2 is the opposite direction of the first straight car to arrive at the pre-signal time (s), V s is the East Ridge South Street road design speed (m/s), L 3 is the north–south length of the intersection, m, according to the actual survey (55 m), and V 3 is the vehicle traveling speed through the intersection (30 km/h).
In summary, the pre-signal green time should be less than the sum of the green time of the east–west straight phase and the green interval time and the difference between t 2 and t 1 , so it is necessary to meet Equation (10).
g = g 1 + I 1 + t 2 t 1
where g is the pre-signal green light duration (s), A is the pre-signal yellow light duration (s), g 1 is the east–west straight green light duration (s), and I 1 is the green light interval (s).

4.3. Main Signal Constraints

The minimum and maximum green times, all-red time, and yellow time were set in accordance with the Chinese National Standard GB 50647-2011 (Code for Design of Urban Road Traffic Planning and Signaling) and the Highway Capacity Manual (HCM 2016) [21,22]. Specifically, the minimum green time was set to 15 s to ensure pedestrian crossing safety, and the maximum green time was limited to 60 s to prevent excessive waiting times. In the intersection signal timing design, first of all, it is necessary to ensure that the effective green light duration of each phase is between the pre-set shortest green light duration and the longest green light duration, and cannot be negative. In light of the object of study in this paper, for each lane group and phase, there was a one-to-one correspondence, and each inlet lane of each direction of traffic had a dedicated release phase. Therefore, the constraints on the effective green light duration of the phase are shown in Equations (11) and (12).
g m a x g e i g m i n
g m i n 0
Here, g e i is the effective green light time of each phase (s), g m i n is the lower limit of green light duration (s), and g m a x is the upper limit of green light duration, s.
Second, the duration of the north–south inlet straight-left phase is needed to ensure that all left-turning vehicles in the dynamically shifted left-turning lane pass through the intersection, and according to the theory of traffic wave, the equation of the wave speed of the traffic flow is shown in Equation (13).
V w = V x K 1 V y K 2 K 1 K 2 V x = V f 1 φ x V y = V f 1 φ y φ i = K i K j
where V w is the wave velocity (m/s), V f is the free stream velocity (m/s), V i is the velocity of state i, K i is the density of state i c, K j is the blocking density (vehicle/m), and φ i is the normalized density of state i (vehicle/m).
Associating the above equation and making unknown substitutions can be obtained as the propagation of wave velocity of the traffic wave, as shown in Equation (14).
V w = V f [ 1 ( 1 + φ x ) ] = V f φ y = ( V f V y )
The north–south straight-left phase should be greater than the time of dissipation wave transfer to the last vehicle with the last left-turning vehicle through the intersection. Here, V f takes V 3   = 30 km/h. It may be assumed that the left-turn vehicle row full in the dynamic shift left-turn lane can be obtained to start the wave passed to the last car time t 3 (Equation (15)), the last left-turn car through the intersection time t 4 (Equation (16)), and the north–south straight-left phase effective green time g e 2 should meet Equation (17).
t 3 = S 1 + L 2 V 3
t 4 = L 2 + L s l V 3
g e 2 t 3 + t 4
where t 3 is the time for the initiating wave to pass to the last vehicle in the row (s), t 4 is the time required for the last left-turning vehicle to pass through the intersection (s), V 3 is the operating speed of the vehicle at the intersection (m/s), L s l is the turning distance of the left-turning vehicle of the south inlet in the intersection (m) (the actual data are about 30 m), and g e 2 is the effective green time of the south inlet of the intersection in the straight-left phase (s).
It is also necessary to ensure that the last vehicle can pass through the waiting area after the pre-signal stops (i.e., the remaining passing time of the north–south straight phase after the red light of the pre-signal is activated should ensure that all vehicles can pass through). When t 3 t 2 , the traffic wave has not yet reached the last vehicle. At this time, it is necessary to ensure that the green light time of the north–south straight phase should be greater than the sum of the remaining distance of the start-up wave passing to the last one and the time required for the last left-turning vehicle to pass through the intersection. When t 3 t 2 , the start wave has been transmitted to the last vehicle in the dynamically shifted left-turn lane, and the effective green time for the north–south phase should be greater than or equal to the sum of the time that the first straight ahead vehicle in the opposite direction arrives at the pre-signal and the time required for the last left-turning vehicle to pass through the intersection (Equation (18)).
t 3 + t 4 g e 2 ,   t 3 t 2 t 2 + t 4 g e 2 ,   t 3 t 2    
Finally, the total signal cycle duration (T) of the intersection should be controlled between the minimum cycle and the maximum cycle, and the cycle should include the effective green time of all phases and the total loss time in one cycle, where the total loss time includes the all-red time and the before and after loss time, which was taken as 9 s in this paper, and the specific requirements are shown in Equation (19).
T m i n i ω g e i + L t T m a x
where T m i n is the minimum signal period (s), L T o t a l is the total loss time in one cycle including the all-red time R with the pre- and post-loss time L t (9 s), and T m a x is the maximum signal period (s).

4.4. Delay Calculations

Average Vehicle Delay Calculation

Vehicle delay is widely used as a key metric in assessing intersection efficiency and congestion [23]. In this paper, the HCM2010 delay calculation formula was used for calculation (Equation (20)).
d i m = d i 1 m · P F i m + d i 2 m + d i 3 m
where d i m is the average delay of lane group i at intersection m (s/pcu), P F i m is the signal linkage correction factor, which is taken as 1 in the case of an isolated intersection, d i 1 m is the equalization delay of lane group i (s/pcu), d i 2 m is the additional delay of lane group i (s/pcu), and d i 3 m is the initial queuing delay of lane group i (s/pcu) [24].
In this paper, the research object was an isolated intersection (i.e., m = 1) and the signal linkage correction factor PF = 1, where the equalization delay, additional delay, and initial queuing delay can be calculated in accordance with Equations (21)–(24).
d 1 = T 1 g e i T 2 2 1 g e i T min 1 , X i
X i = μ δ μ P i μ q i Q i
where g e i is the effective green time of lane group i (s), Q i is the capacity of lane group i (pcu/h), δ μ is the conversion coefficient of μ-type motor vehicles relative to the standard vehicles, X i is the saturation degree of lane group i, P i μ is the proportion of μ-type motor vehicles, and T is the signal period of the intersection (s).
d 2 = T 4 X i 1 + X i 1 2 + 8 K I i X i Q i
where T is the analyzed duration, which was taken as 0.25 h; K is the delay correction factor under different signal controls, which was taken as 0.5 for fixed-period signals; and I i is the incremental delay correction factor for merging and diverging regulation upstream of lane group i, which was taken as the value of 1 for isolated intersections.
d 3 = 3600 T q i t i · N i 1 + N i 2 N i 3 2 + N i 2 2 N i 3 2 2 Q i N i 1 2 2 Q i
where N i 1 is the initial number of queued vehicles in lane group i at the beginning of the observation during the analysis time (pcu), N i 3 is the number of queued vehicles at the end of the analysis only if q > Q and there is no initial queuing (pcu), N i 2 is the number of queued vehicles in lane group i at the end of the analysis (pcu), and t i is the time when the lane group is unable to satisfy the traffic demand during the analysis time (h). In this paper, it was assumed that the channelization modification of the lane groups had no initial queuing delay, so d 3 = 0 [21].

4.5. Delay Calculation Corrections

Dynamically shifted left-turns were set up in the south inlet lane, and their delays were affected by the pre-signal, and according to the phase-phase sequences used in this paper, the delays of the left-turning vehicles in the south inlet needed to be corrected [25]. When comparing conventional intersections with dynamically shifted left-turn intersections, the design of dynamically shifted left-turns gives left-turning vehicles an additional number of stops, which leads to additional delays, and the additional delays are set as a factor k. Although left-turning vehicles need to travel an additional distance in the switching roadway segment to enter the shifted left-turn lane, inside the intersection, vehicles can move through the intersection more quickly because the shifted left-turn design makes the travel path shorter [26]. These two aspects offset each other when compared with other delay factors, with the main increases in delay being the additional stopping delay due to the pre-signal setup and the extra waiting time for left-turning vehicles to pass. Therefore, the increased delay for left-turning vehicles on the southbound approach can be calculated using Equation (25).
λ = 3600 Q L e f t t 5 = L 1 + L 2 + S 1 + L s l V d t d = g e 2 t 2 t 5 q ¯ = t d λ × T T d ¯ = g 3 + I + t 1 d 4 = d ¯ × q ¯ + k
where λ is the vehicle arrival interval (s), t d is the time required for a left-turning vehicle to pass through the intersection unimpeded from the pre-signal stop line (s), V d is the average speed of the dynamically shifted left-turning vehicle unimpeded, m/s, and in this paper, 40 km/h was taken, t d is the time of the delay generated (s), g e 2 is the effective green time of the north–south straight-left-turning phases (s), q ¯ is the average number of vehicles arriving, vehicles, and T is the analysis duration, taken as 0.25 h, g 3 is the green time for the east–west inlet left and right-turn phases (s), d ¯ is the added delay per failed vehicle, s, k is the number of stops delay equivalent, and d 4 is the added delay of the pre-signal (s).

4.6. Modeling and Solving

The NSGA-II algorithm was implemented with a population size of 100 and run for 200 generations using simulated binary crossover (probability = 0.9) and polynomial mutation (probability = 0.1). These parameters were selected based on preliminary sensitivity analyses to balance the convergence speed and solution diversity. The convergence was monitored using hypervolume indicator.
(1) Total delay minimization model
The intersection total delay minimization was selected as the objective function to optimize the intersection signal timing [27]. In this paper, the total delay of the intersection is shown in Equation (26).
T D = i ω μ ϑ δ μ d i P i , μ q i + d 4
where δ μ is the conversion factor of μ motor vehicles to standard vehicles, P i , μ is the share of μ motor vehicles in the total vehicles, and q i is the traffic volume of lane group i (vehicles/h).
(2) Minimum model for total emissions
Carbon monoxide accounts for a relatively large portion of vehicular emissions, and its emissions are usually calculated by the following relational equation (Equation (27) using the emission model established):
E C O = i N E F P C U × e q i × L 0 + 1 3600 E F I P C U × e q i × d i
where E C O denotes the emission of carbon monoxide, d i is the average delay time of vehicles in stage i, and e q i is the sum of traffic volume of all inlet roads in stage i. The emission factor is the unit emission factor converted to the standard vehicle traveling condition, and the value of E F P C U is 5 g (pcu-km). E F I P C U is the unit emission factor converted to the standard vehicle driving condition with the value of 5 g (pcu-km), and E F I P C U is the unit emission factor converted to the standard vehicle idling condition with the value of 45 g/(pch-hr). L 0 denotes the length of the entrance lane.
(3) Capacity maximization model
The capacity of a signalized intersection needs to be estimated for each entrance lane. The capacity of a one-way entrance lane is equal to the sum of the capacities of the lanes in that lane. The capacity of an entrance lane is multiplied by the green ratio of its signal phase, which is calculated based on the saturated flow rate of the lane. The specific expression is shown in Equation (28):
C A P i = j S i j λ i = j S i j g i T
where C A P i is the capacity of the ith entrance lane, and λ i is the green ratio of the signal phase of the ith entrance lane.
(4) Modeling and solving
From the previous section, combined with the constraints of the main signal, pre-signal, and the length of the dynamically shifted left-turn lane, the signal timing optimization model for solving the total delay of an intersection is shown in Equation (29). Here, the weighting distribution among delays, capacity, and carbon emissions was set at 0.3:0.4:0.3. This weighting distribution was determined after being calculated and evaluated using the AHP arithmetic mean method. After evaluating and analyzing the weighting distribution, such as those biased toward capacity (0.2:0.6:0.2) and those biased toward total delay and emissions (0.4:0.2:0.4), a comparison of the results indicates that the 0.3:0.4:0.3 weighting distribution exhibited the best overall performance. It could effectively guide the NSGA-II algorithm to explore the inflection point region on the Pareto front, achieving the best marginal benefits by obtaining a significant improvement in capacity alongside considerable reductions in total delay and emissions.
m i n T D = i ω μ ϑ δ μ d i P i , μ q i + d 4 E C O = i N E F P C U × e q i × L 0 + 1 3600 E F I P C U × e q i × d i C A P i = j S i j λ i = j S i j g i T   s . t . g = g 1 + I 1 + t 2 t 1 M A X t 2 t 3 + t 4 g e 2   g e i 0 g m i n g e i g m a x C m i n i ω g e i + L t C m a x
By analyzing the constraints, the core decision variables of this signal optimization timing model were determined to be the effective green time of intersections and pre-signals. The model aims to minimize the traffic delay and thus optimize the efficiency of traffic flow. In this paper, MATLAB R2024a was used to solve this model, and the optimal solutions of the effective green time of each phase and pre-signal were obtained, with g e 1 = 40   s ,   g e 2 = 34 ,   g e 3 = 16   s ,   g e = 36   s , L 2 = 93   m , and the optimized signal timing scheme is shown in Figure 13.
NSGA-II (non-dominated sorting genetic algorithm II) [28] was developed by Srinivas and Deb in 2000 based on the NSGA algorithm [29]. NSGA-II is superior to other algorithms [30]. Compared with NSGA, this algorithm has significant advantages: first, it adopts a fast non-dominated sorting algorithm, which greatly reduces the computational complexity; second, it introduces the crowding degree and crowding degree comparison operator, which replaces the manually-specified shareQ share radius, and is used as a criterion for comparing individuals of the same level in the fast sorting process, so that individuals in the quasi-Pareto domain cover the entire Pareto domain and are more evenly distributed, which is effective for the improvement of NSGA. The individuals in the quasi-Pareto domain can cover the entire Pareto domain and be more evenly distributed, which effectively maintains the diversity of the population. Third, the integration of the elite strategy broadens the sampling space, avoids the loss of the optimal individuals, and improves the computing speed and robustness of the algorithm [31]. The NSGA-II algorithm was implemented with a population size of 100 and run for 200 generations using simulated binary crossover (probability = 0.9) and polynomial mutation (probability = 0.1). The convergence was monitored using a hypervolume indicator.

4.6.1. Fast Undominated Sorting

The concept of fast undominated sorting builds on the Pareto dominance relation. Suppose there are k objective functions, denoted as fi (x) (i = 1,2, …, k), and j is any integer in 1,2, …,k that is not equal to i. If for any objective function, individual x1 satisfies fi (x1) < fi (x2), then x1 is said to dominate x2; if for any objective function, fi (x1) ≤ fi (x2) holds, and there exists at least one objective function such that fj (x1) < fj (x2), then x1 weakly dominates x2; if there exists a part of the objective function that satisfies fj (x1) ≤ fi (x2), at the same time if there exists a part of the objective function satisfying fi (x1) ≤ fi (x2) and another part satisfying fj (x1) > fj (x2), then x1 and x2 do not dominate each other.
Each individual in the population contains two parameters: ni and Si, where ni denotes the number of individuals in the population that dominate individual i, and Si is the set of individuals dominated by individual i. The process of fast non-dominated sorting is as follows:
(1) Through cyclic comparison, filter out all ni = 0 individuals in the population, set their non-dominant rank to 1, and include them in the nondominant set rank1.
(2) For each individual in rank1, subtract the value of nj from the value of each individual j in the set of dominated individuals by 1. If nj = 0 after the subtraction of nj, then put the individual j into the set of rank2, and give it a non-dominated rank of 2. For each individual in rank2, subtract the value of nj from the value of nj and give it a non-dominated rank of 1.
(3) Repeat the above operation for the individuals in rank2 until all individuals are assigned the corresponding non-dominated rank.
The non-dominated rank is also called the Pareto rank. Among them, individuals with Pareto rank 1 are called non-dominated solutions or Pareto optimal solutions because they are not dominated by other individuals, and the curve formed by these solutions is called the Pareto front.

4.6.2. Crowding Degree Calculation

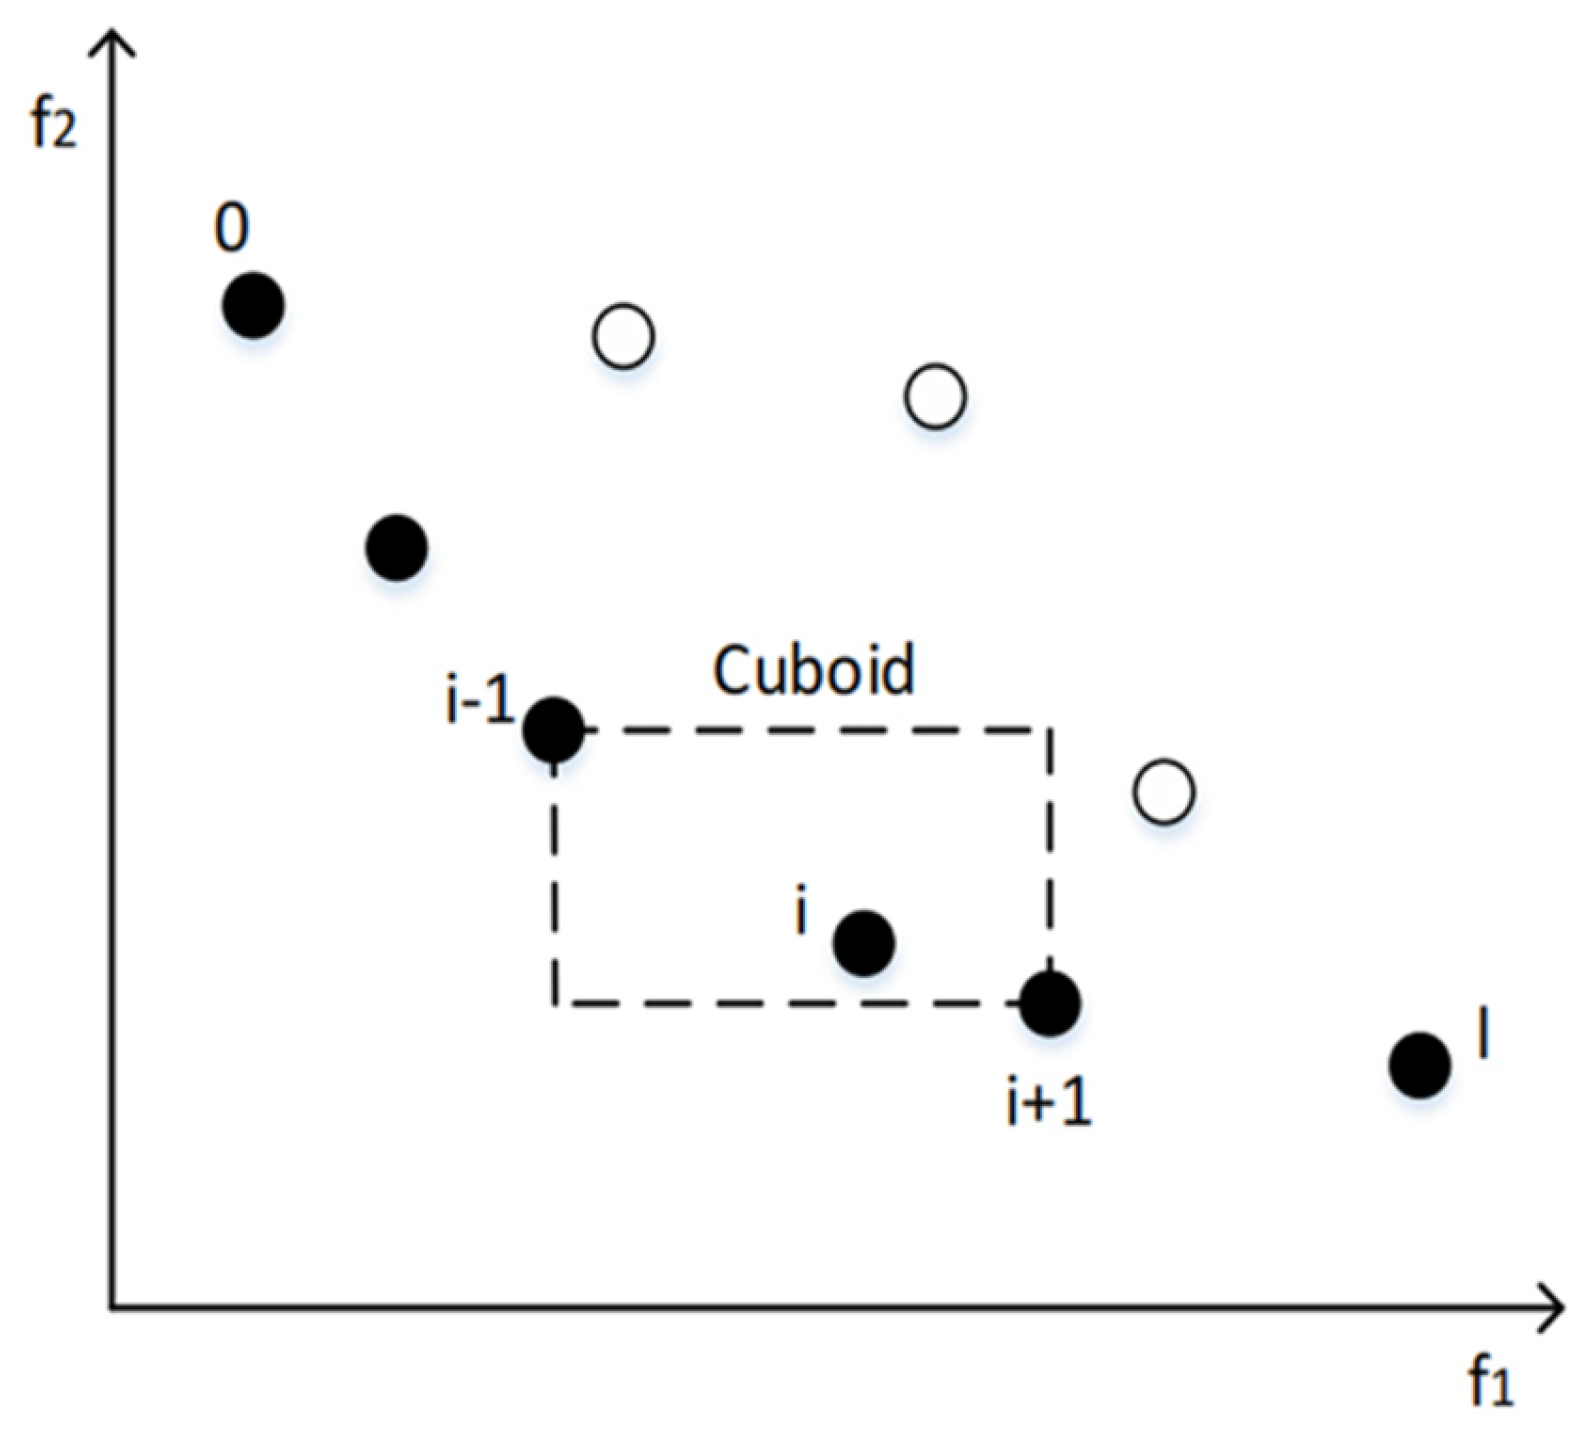
In NSGA-II, the concept of crowding distance was introduced to assess the quality difference of the solutions within the same frontier [28]. The core idea is to make the obtained Pareto-optimal solutions as dispersed as possible in the objective space, making it more likely to achieve a uniform distribution on the Pareto-optimal frontier. NSGA-II uses the crowding degree comparison instead of the sharing function to maintain the diversity of the population, which not only eliminates the need for additional parameters, but also reduces the time complexity.
To understand the crowding degree from the geometric level, let us take two objective functions as an example: the black and white dots in the figure represent the two non-dominated frontiers, respectively. For solution i, the two points i − 1 and i + 1 closest to i are selected from the same non-dominated frontier. These three points are used as vertices to form a rectangle (cuboid), and the average length of the sides of this rectangle is the crowding distance of solution i (Figure 14).

4.6.3. Elite Strategy

The NSGA-II algorithm introduces the elite strategy, which aims to retain high-quality individuals and eliminate low-quality individuals. This strategy expands the screening scope of the next generation of individuals by fusing the parent and offspring individuals to form a new population. This is illustrated by the following examples (in the figure, P represents the parent population and the number of individuals is n; Q represents the offspring population) [28] (Figure 15 and Figure 16):
(1) The parent and child populations are merged to form a new population, and subsequently non-dominated sorting is executed on the new population.
(2) When generating a new parent, the non-dominated individuals with Pareto rank 1 are first included in the new parent set, followed by the individuals with Pareto rank 2, and so on.
(3) If the number of individuals in the set is still less than n after all the individuals of rank k are added to the set of the new parent but the number of individuals of rank k + 1 is more than n, then calculate the crowding degree of all individuals of rank k + 1 and arrange them in the descending order of crowding degree, and at the same time, eliminate all individuals with a rank higher than k + 1.
(4) According to the sorting result in step 3, select individuals from rank k + 1 in turn until the number of individuals in the set of new parents reaches n, and the remaining individuals are eliminated.
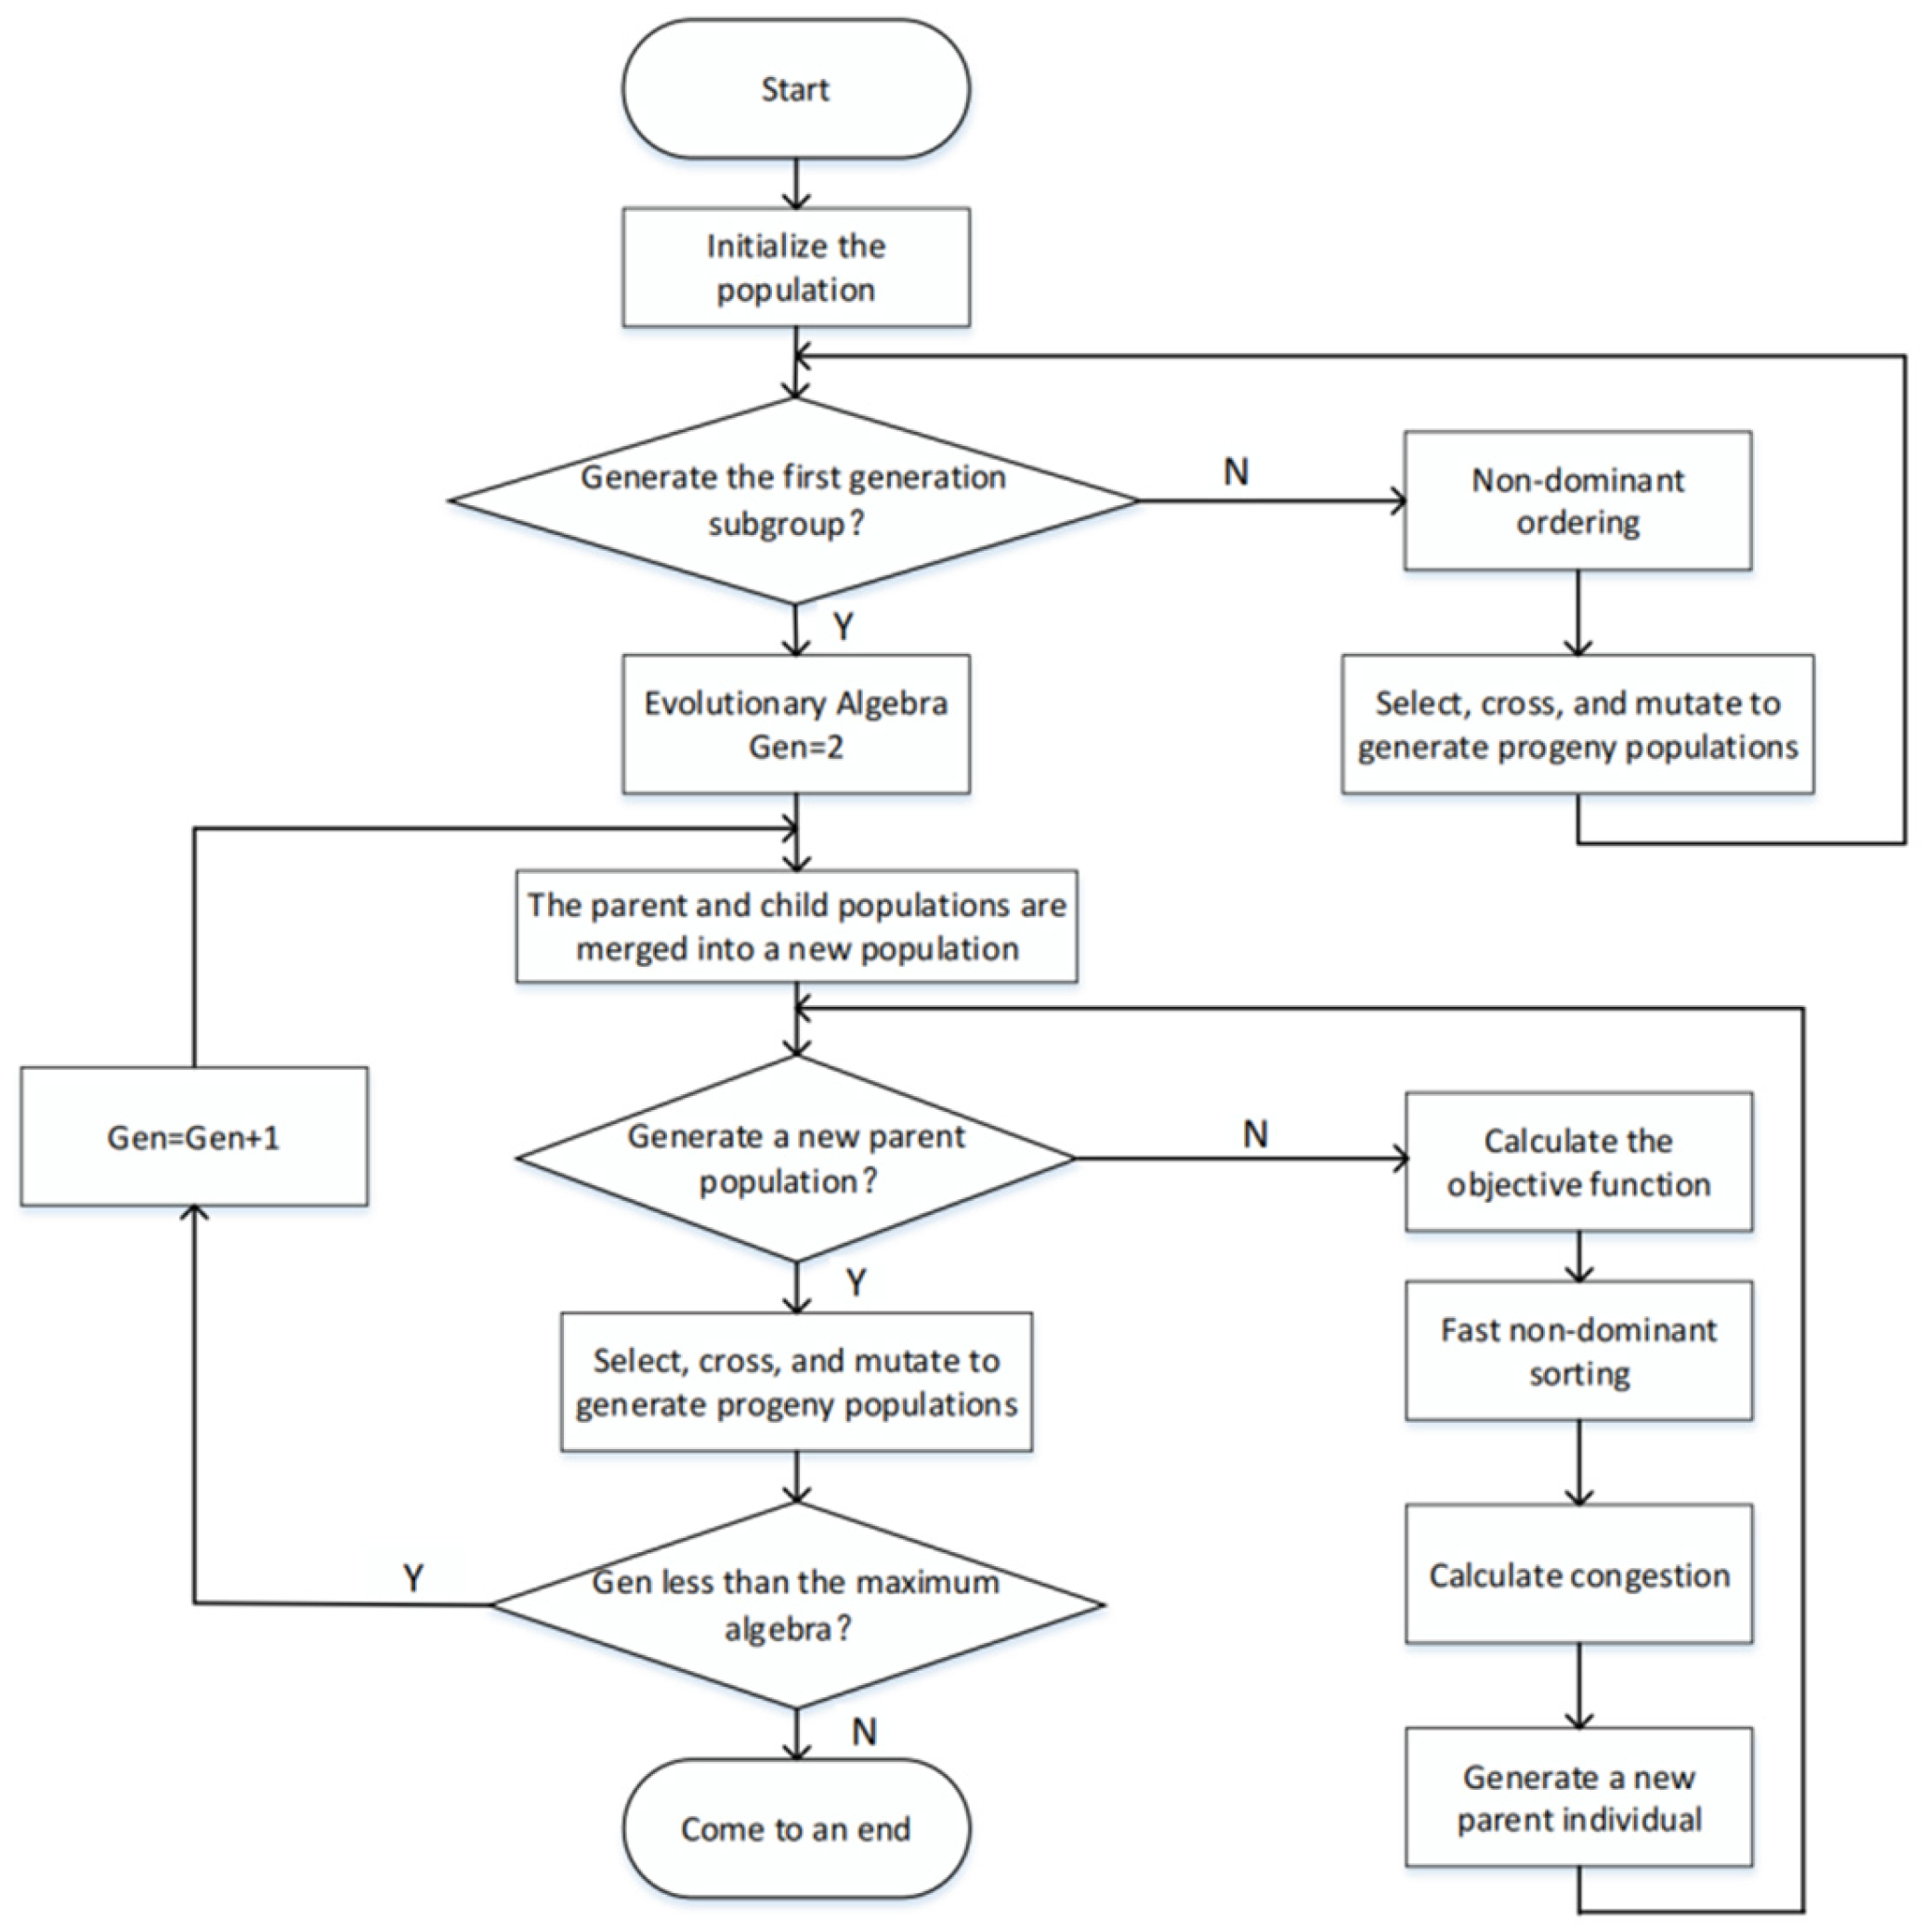
The overall flow of the algorithm is as follows.
Figure 16. Flowchart of the NSGA-II algorithm.
Symmetry 17 01856 g016

5. Simulation Verification and Evaluation

5.1. Overview

This section verifies the validity of the design scheme of the right-turn-left and dynamic shift-left established above, and simulates the actual intersection before and after the optimization of the traffic organization via left-turn using VISSIM software (version 4.3), respectively. The output results were compared and analyzed to verify that the above design scheme is of practical significance in alleviating the serious traffic congestion problem of straight-left conflict at an intersection.

5.2. Simulation Environment Determination

Setting Simulation Parameters

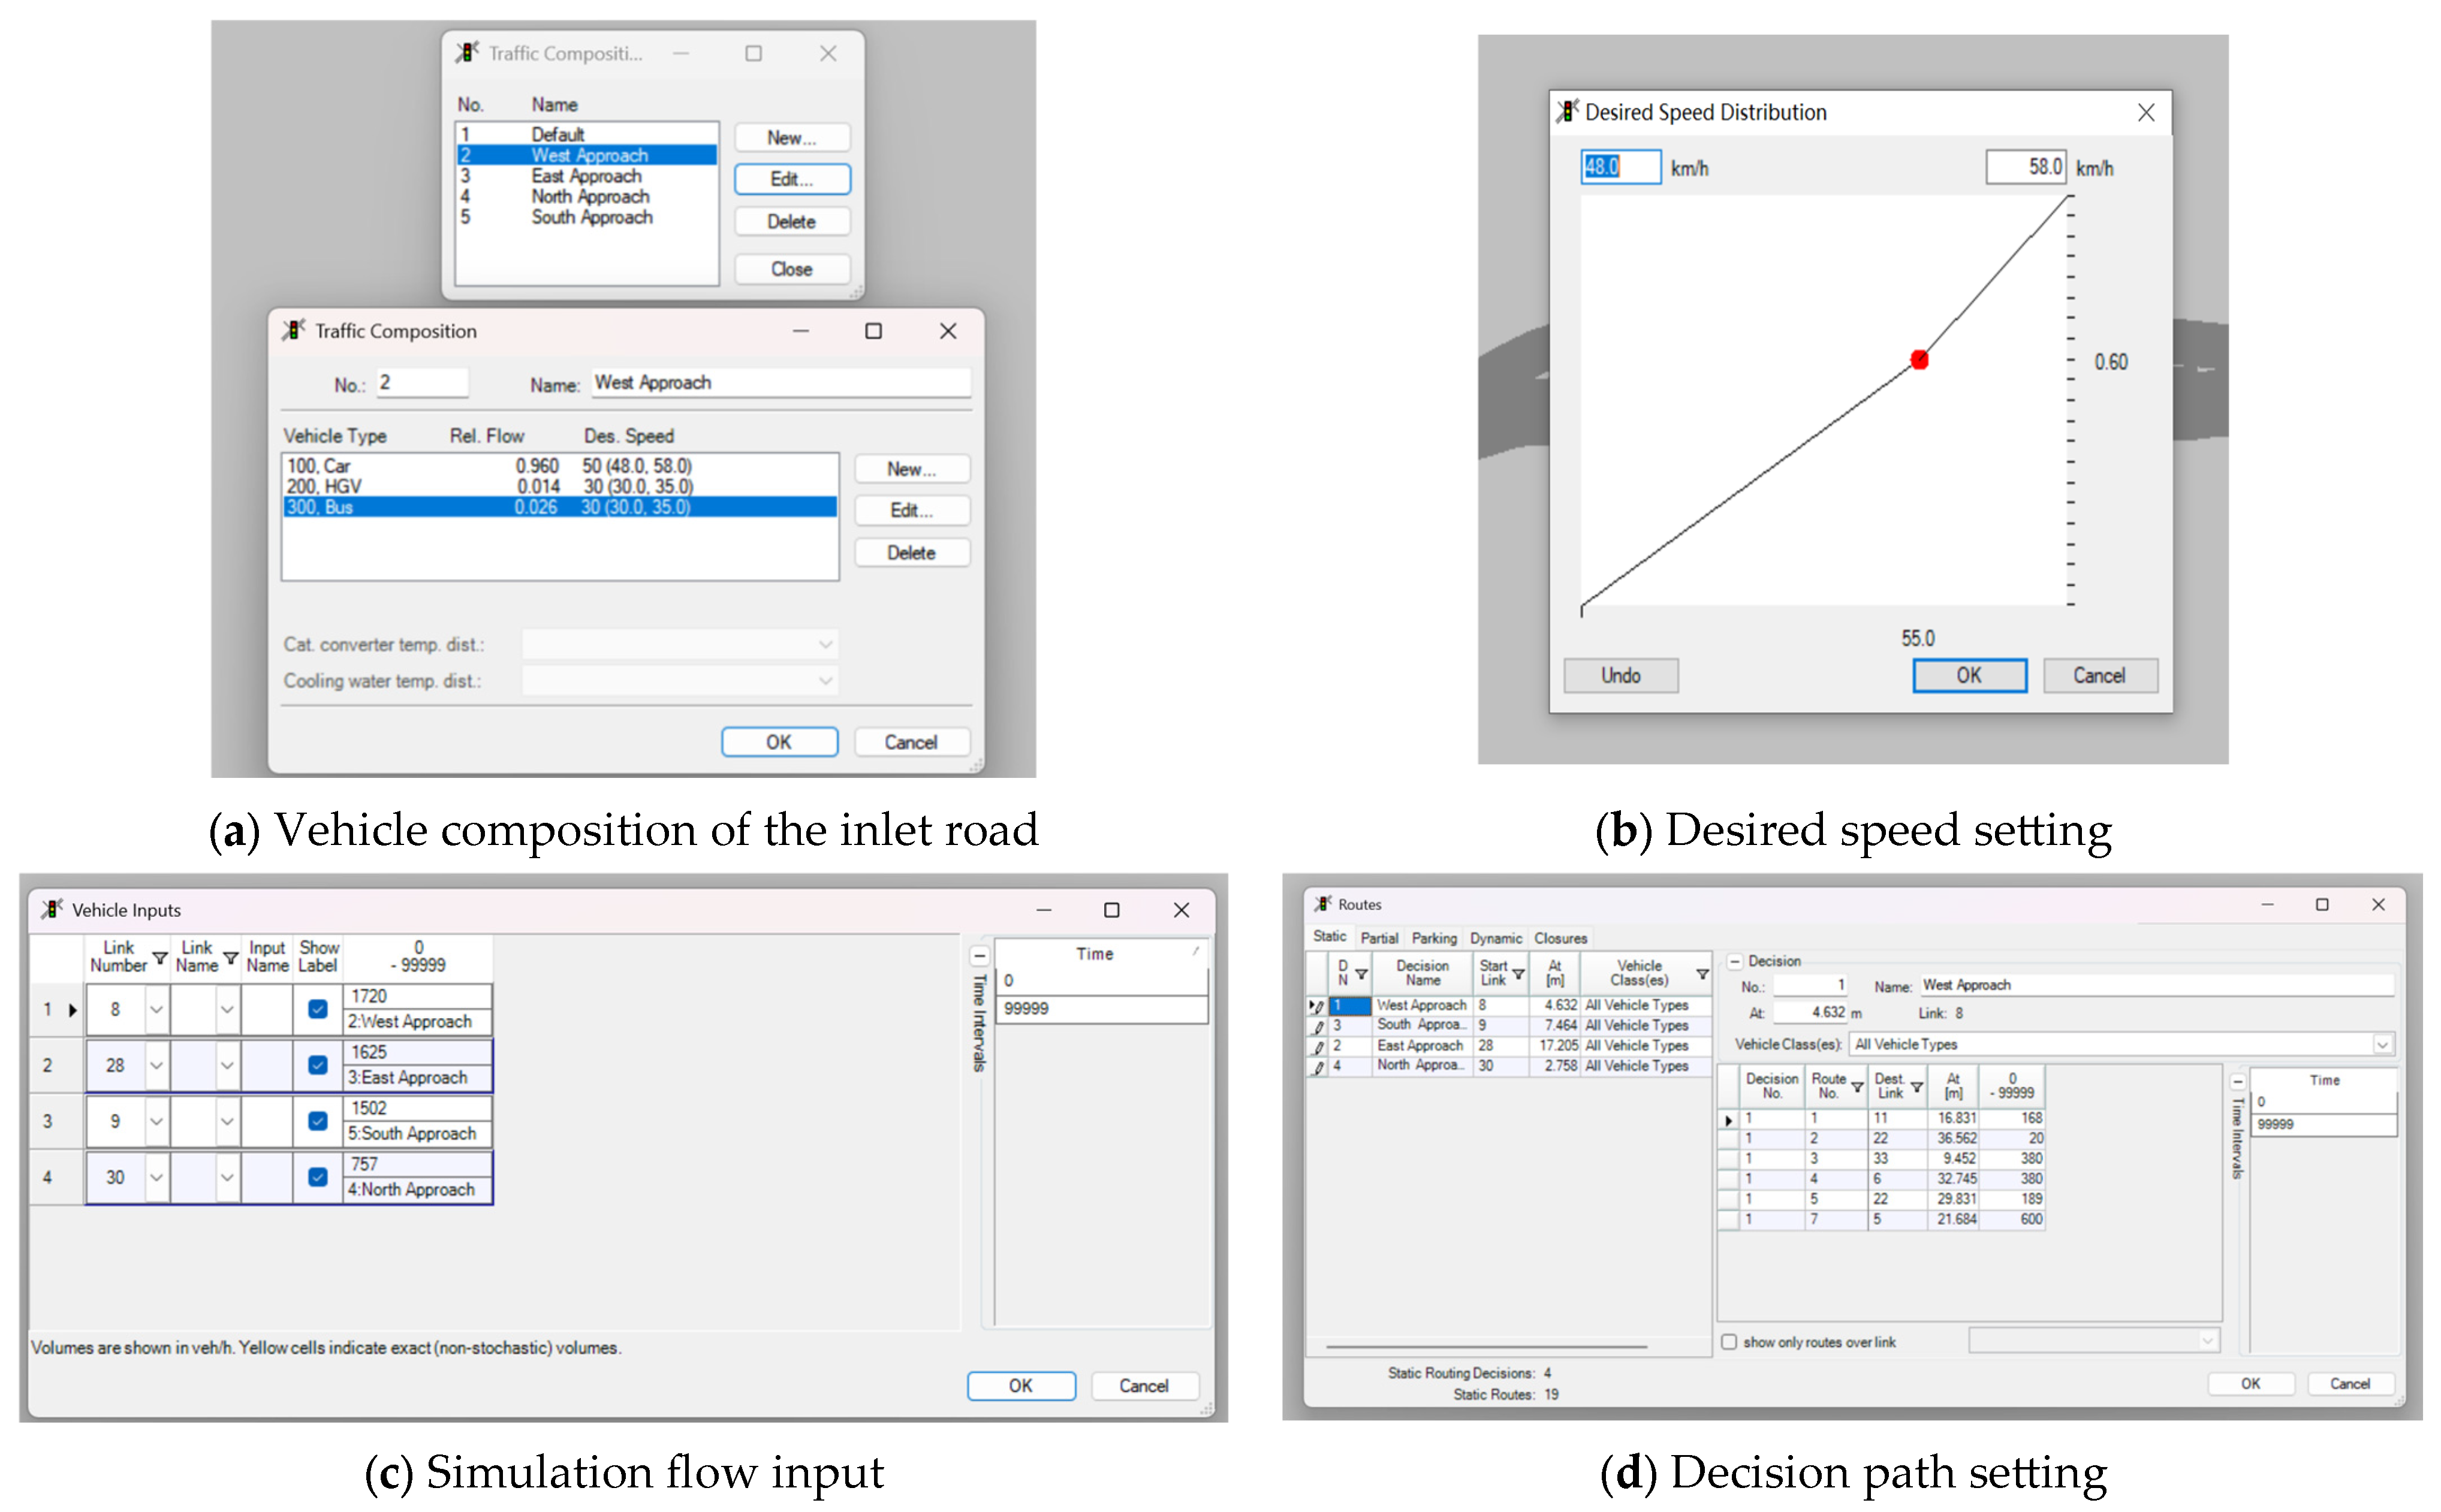
(1) Setting vehicle composition and desired vehicle speed
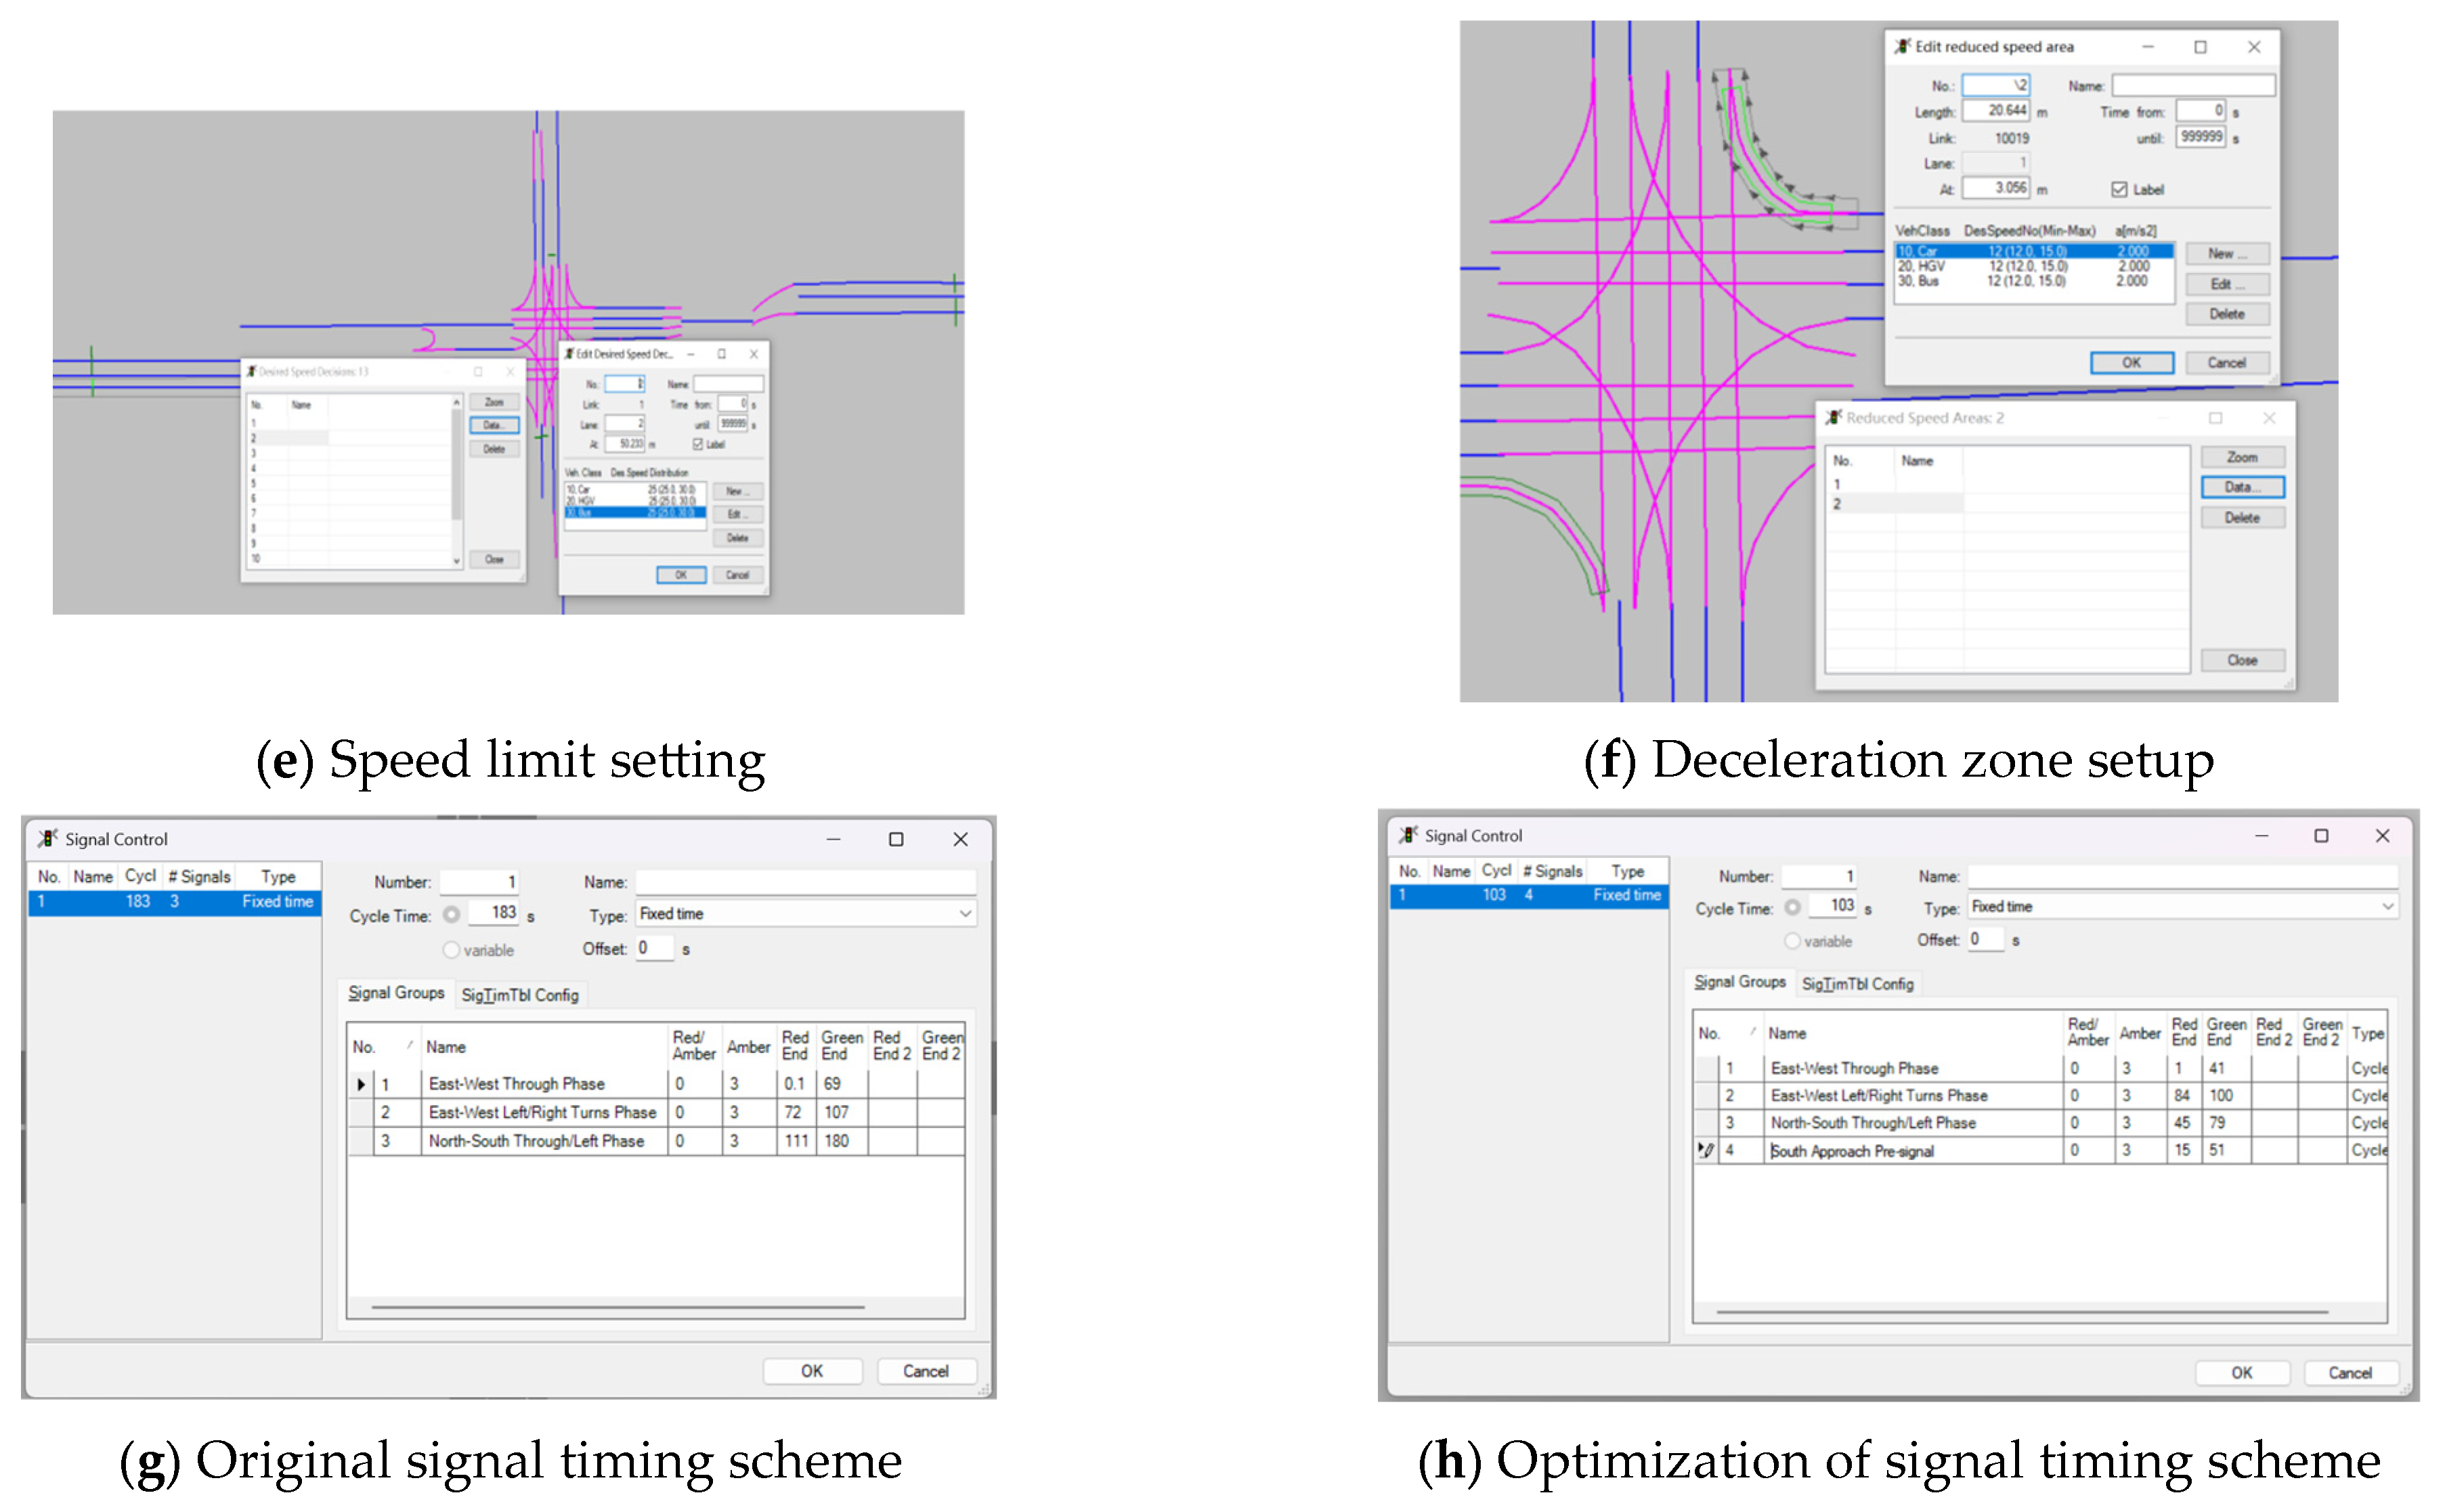
In the simulation model, this paper first defined the composition of vehicles traveling on Nanhu Avenue. In order to simplify the simulation process, this paper categorized them into three categories: small vehicles, medium-sized vehicles, and large vehicles [32]. Based on the data obtained from the actual survey, the proportions of these vehicle categories were input into the simulation system. When setting the desired speed of vehicles, this paper set the desired speed interval of 48–58 km/h for small vehicles, and 30–35 km/h for medium-sized and large vehicles [33]. For the northbound vehicles on Dongling South Street, this paper also calculated the vehicle type ratio based on the survey data and set the corresponding desired speed range. The desired speed range for small vehicles was 40–45 km/h, while the desired speed ranges for medium and large vehicles were both 30–35 km/h (see Figure 17 for details of the settings). The desired speed range of 48–58 km/h represents the free-flow speed on Nanhu Avenue outside the construction zone. Within the construction zone, speed limits of 30 km/h were enforced through the use of deceleration areas in the VISSIM model, ensuring that vehicles reduce their speed appropriately upon entering the work zone. This approach accurately reflects real driver behavior and compliance with temporary speed limits.”
(2) Input the traffic flow in each direction route planning
According to the data obtained from the actual survey on each direction of traffic flow input, and through the decision-making path to determine the proportion of their respective turning, the flow input is shown in Figure 17c, and the decision-making path setup is shown in Figure 17d.
(3) Speed limit setup in the construction zone
There exists a speed limit road section (30 km/h) on Nanhu Road. At the same time, the right-turning vehicles pass slower due to the blocking of sight distance and the equivalent setup of the deceleration zone (Figure 17e,f). After the improvement, the sight distance for right turns was sufficient and no deceleration zone was set.
(4) Edit the signal control machine
In light of the VISSIM signal control machine in the red light end time setting restrictions (cannot be directly set to 0), so this paper in the actual editing used the value of 1 as the start input. At the same time, this paper set the yellow light time to 3 s. According to the pre-designed scheme, the parameters of the signal control machine before and after optimization were edited (Figure 17g,h).
(5) Conflict area setting
According to the actual observation, under the original intersection organization scheme, it is set so that the south left-turn has the priority right of way; the right-turning vehicles in each inlet lane of the north inlet need to give way to the straight vehicles; and at the west inlet early right-turn, the right-turning vehicles give way to the straight vehicles first (Figure 18a). Improvements to avoid the production of conflict may produce conflict, as set for the south left-turn priority (see Figure 18b).

5.3. Comparative Analysis of the Simulation Effect

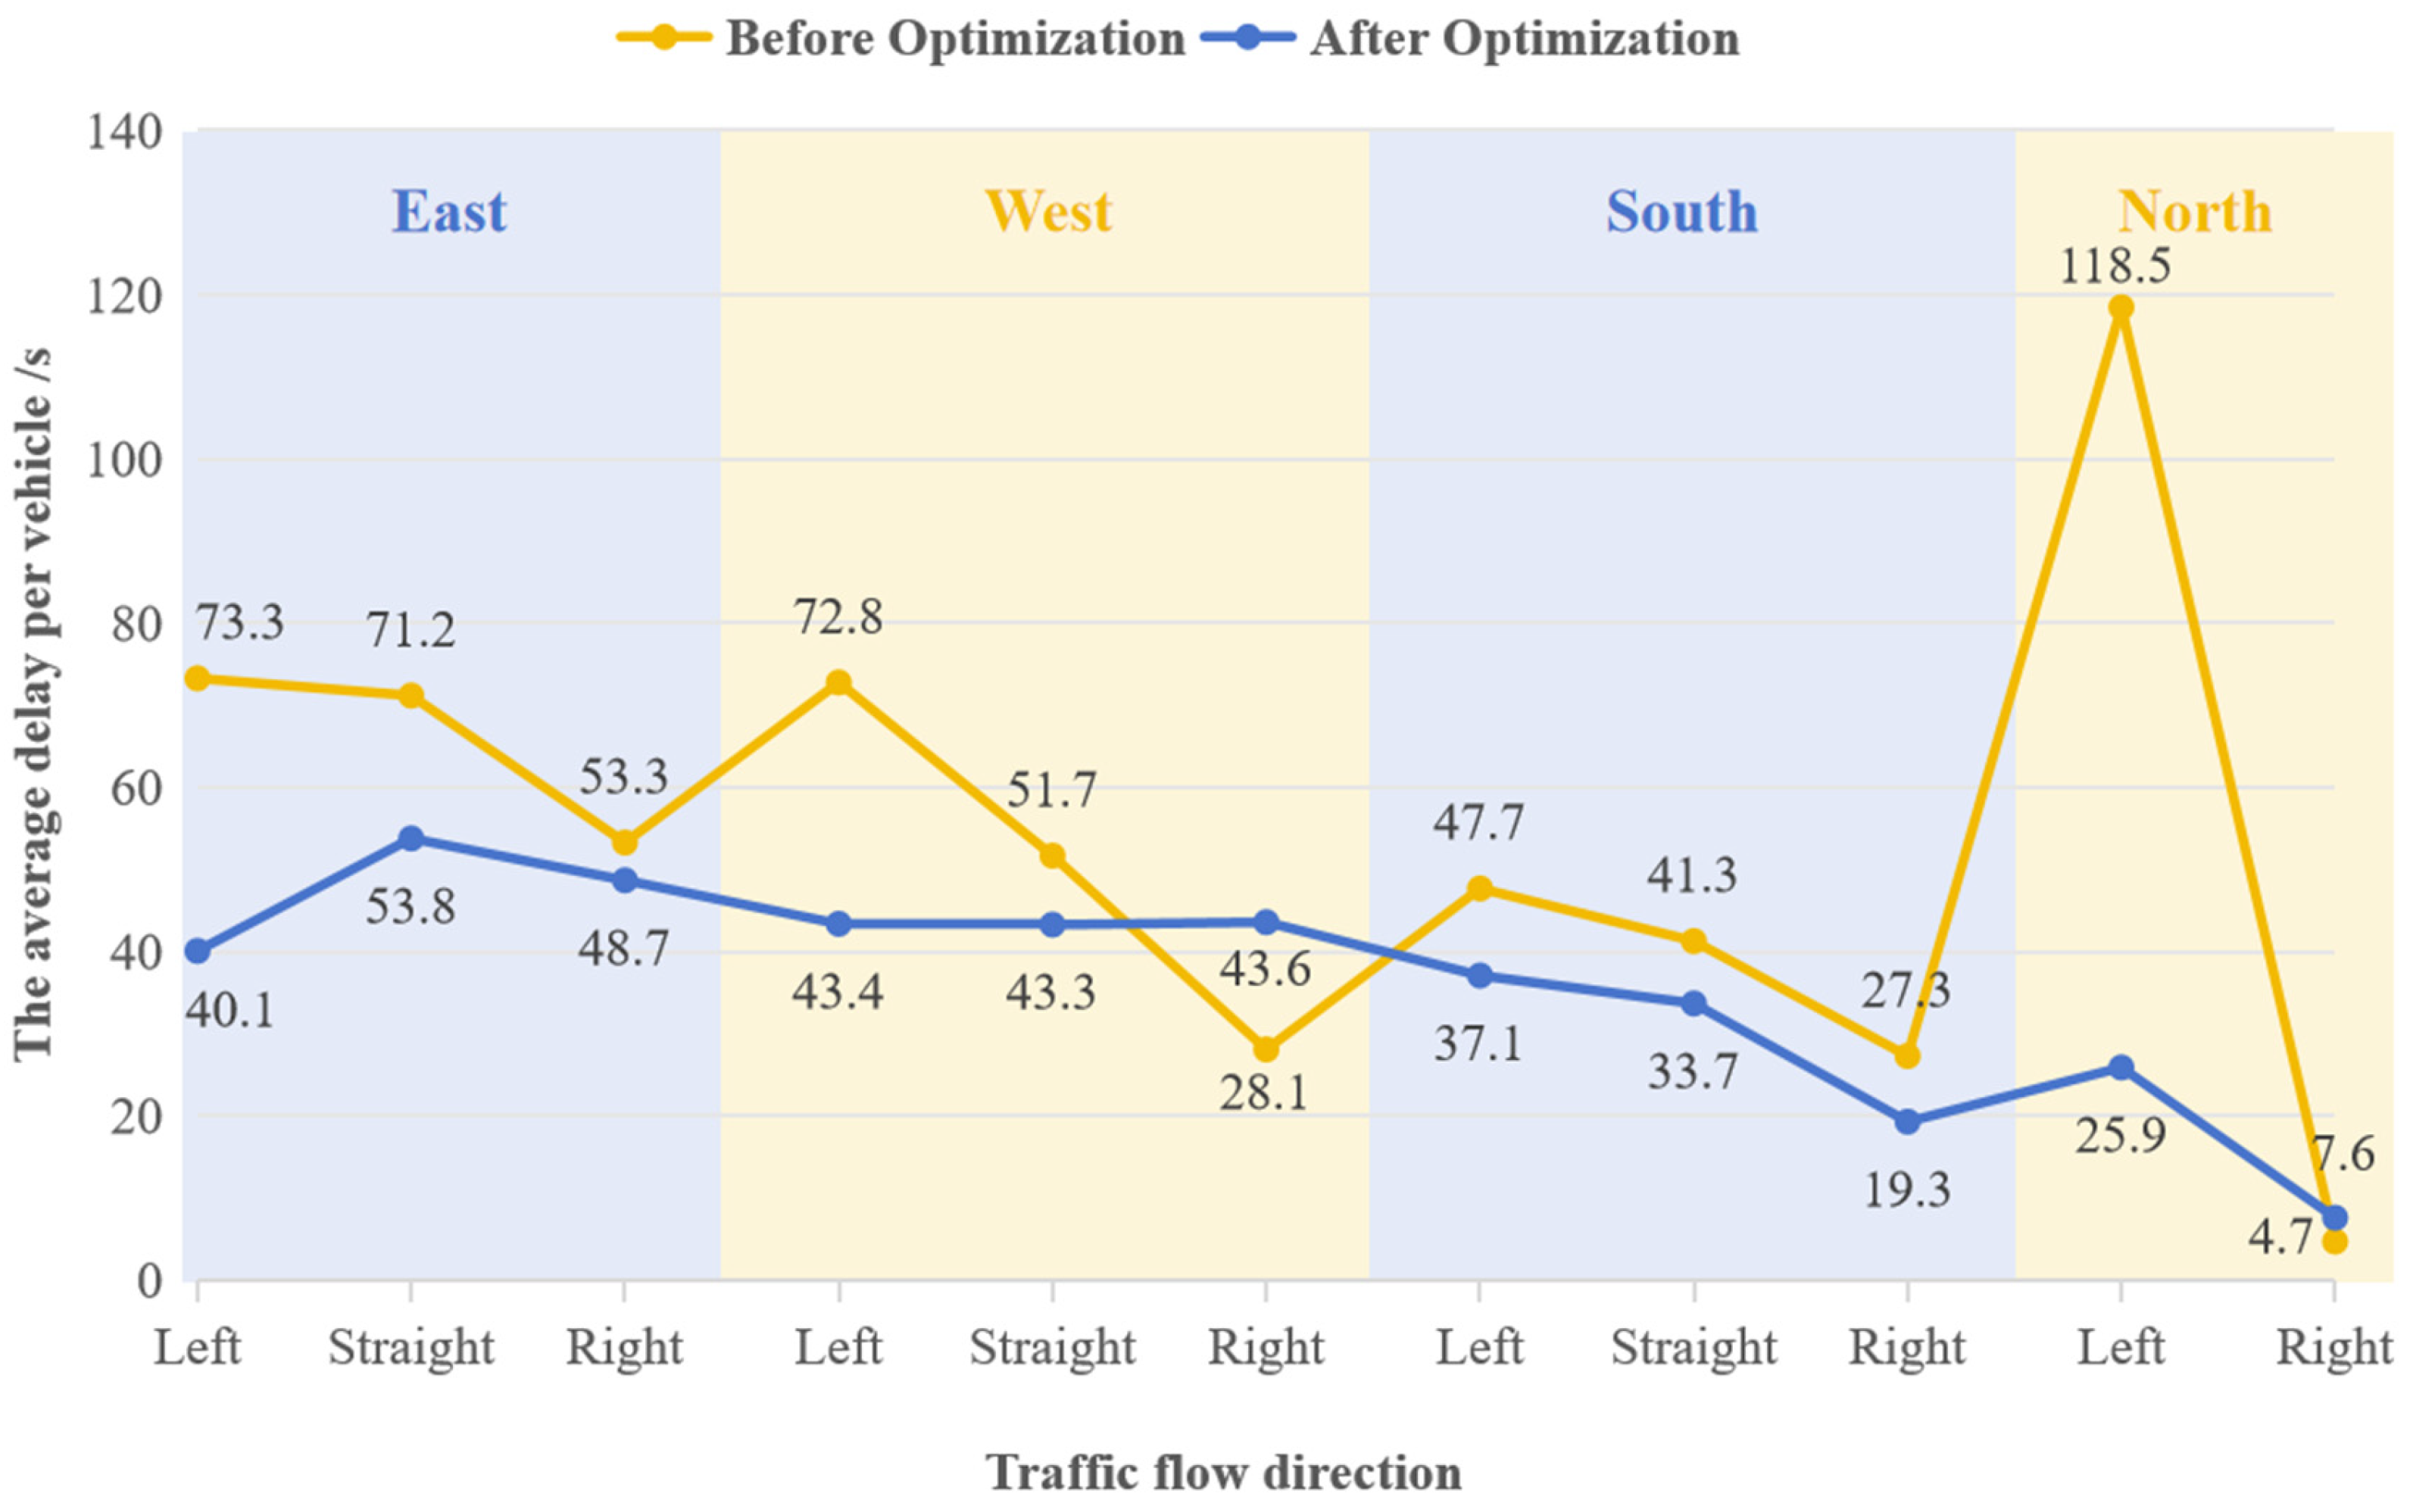
The output optimized organization scheme under the intersection of all directions of the traffic flow vehicle average delay statistics, as shown in Table 3, were improved before and after the delay was made into the bar chart shown in Figure 19 [34]. A comprehensive sensitivity analysis was conducted by varying the traffic demand by ±20% and adjusting the driver compliance levels (90–100%). The results demonstrated that the proposed scheme consistently outperformed the baseline under all tested scenarios. Specifically, under a 20% increase in traffic demand, the total delay increased by 12.3%, while the baseline scenario experienced a 28.7% increase. Similarly, under reduced compliance (90%), the delay increase was contained within 15%, indicating the robustness of the model. However, under extreme congestion or very low compliance, the benefits diminished, suggesting the need for adaptive signal control in such conditions. These findings confirm that the proposed method remains effective under a range of realistic traffic fluctuations, though its performance is contingent on reasonable driver adherence to the new lane configurations and signals.
Due to the setting of the right-turn left and dynamic shift left-turn in this paper, compared with the original organization scheme, after optimization, the delay of the north inlet straight vehicle was reduced from 118 s to 25 s and the delay was decreased by 78%; the delay in the south inlet and the east inlet in each phase was reduced by 20–50%; the delay of the west inlet straight-left was decreased; and the delay of the right-turning vehicle was unavoidably increased due to the design of the road channelization and controlled by the signal light, but was far away from the right-turning vehicles subject to signalization due to the roadway channelization design, which inevitably increased the delay, but away from the construction zone increased the safety, and the increase in delay was not significant; the total delay of the intersection is reduced by 35%. In summary, compared with the original intersection organization design, the optimized traffic organization scheme in this paper significantly reduced the vehicle queue length and the average delay time of each inlet road, thus significantly improving the efficiency of traffic operation. At the same time, the scheme also fully considers the traffic safety factors to ensure the full realization of the optimization objectives. Regarding safety, the proposed design reduces right-turn conflicts with pedestrians and straight-moving vehicles by relocating right-turn lanes and controlling them via signals. Although the simulation primarily focused on efficiency, the reduction in conflict points and improved sight distance suggest a positive safety impact. Future work will include SSAM (surrogate safety assessment model) analysis for quantitative safety evaluation. The simulation results for these metrics showed a deviation of less than 10% when compared with the field-measured data collected during the morning peak period. This close alignment confirms the model’s accuracy in replicating real-world traffic conditions, thereby enhancing the reliability of the evaluation for the proposed optimization scheme.
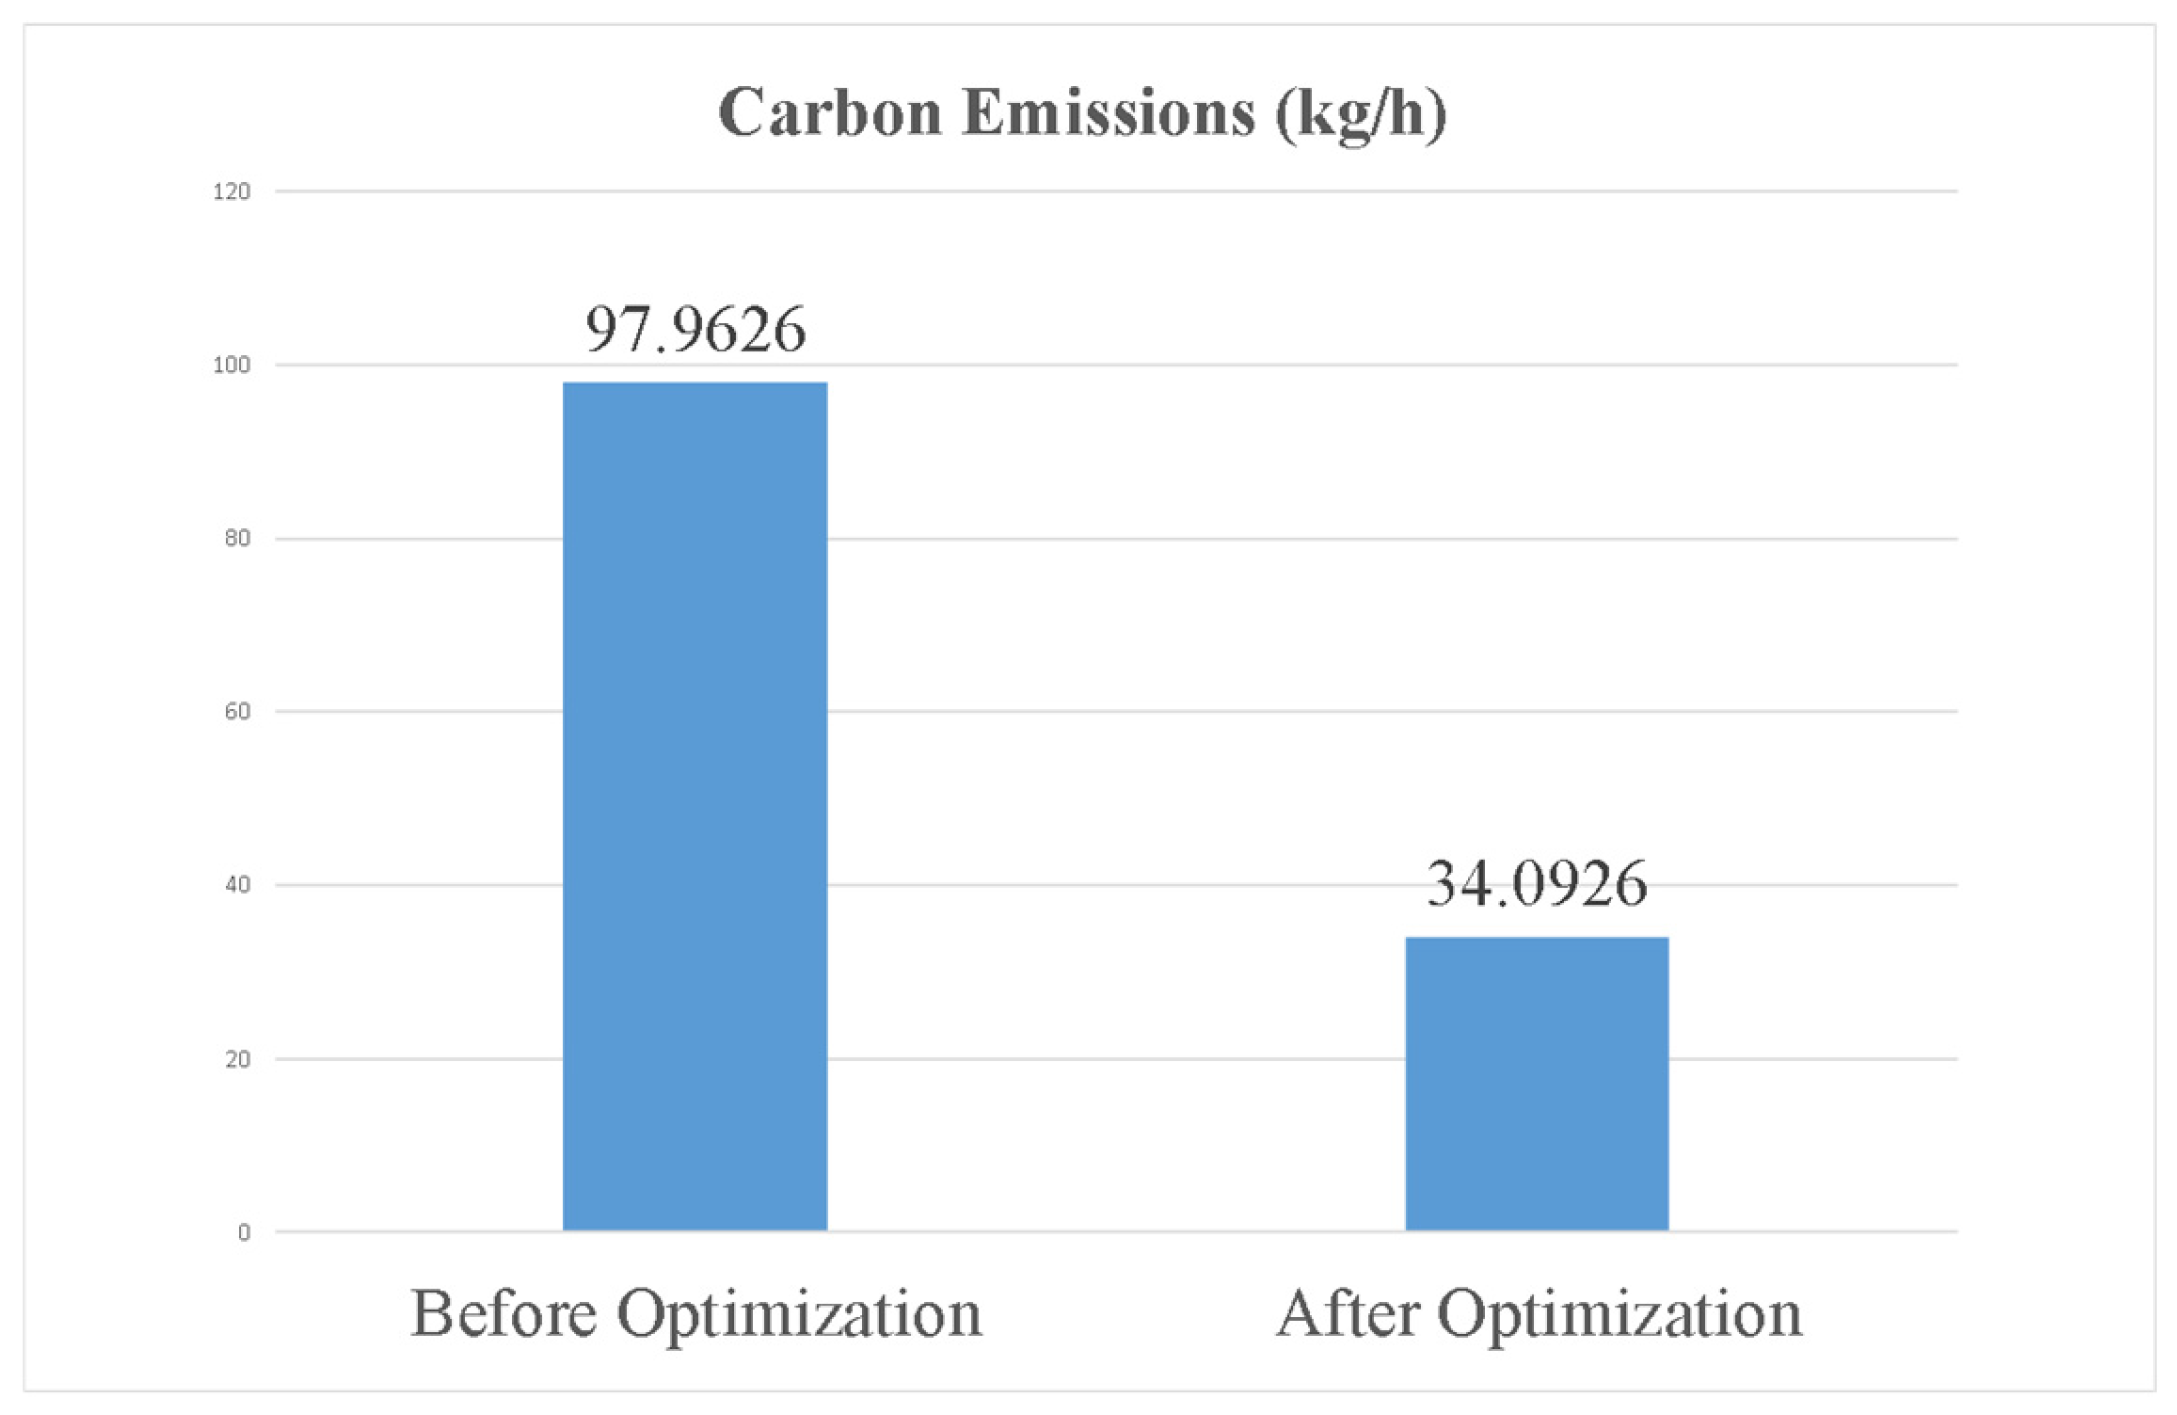
Using the emission model established in Section 4.6 (Equation (27)), the total CO emissions before and after optimization were calculated based on the simulated traffic flows and delays. The results indicate that the total CO emissions decreased from approximately 97.9626 kg/h to 34.0926 kg/h (Figure 20). This reduction was primarily attributed to the decreased vehicle idling time and more efficient traffic flow distribution achieved through the dynamic shift left-turn strategy and signal coordination. The emissions reduction further validates the environmental benefits of the proposed optimization method, aligning with the multi-objective optimization goal of minimizing both delay and emissions.

6. Conclusions

This paper provides an in-depth study of dynamic traffic organization and signal timing optimization schemes for intersections in construction zones. Through field investigation and simulation analysis, the status of intersection operation was comprehensively evaluated. For the impact of a construction zone, this paper proposed dynamic organization optimization measures such as a channelization scheme, phase sequence optimization, and pre-signal design to enhance the intersection operation efficiency. To optimize the intersection access efficiency and environmental benefits, this paper further constructed a multi-objective signal timing optimization model with the objectives of minimizing the total intersection delay, maximizing the access capacity, and minimizing the carbon emissions, and solved it by using the fast non-dominated genetic algorithm (NSGA-II). The resulting optimal solution as evaluated by VISSIM simulation, which verified the effectiveness of the optimization scheme and significantly reduced the vehicle delay. The design ideas of right-turn-left placement under an occupied construction enclosure, stop line tilt design, and related sign design were proposed to provide new ideas for right-turn traffic operation under occupied construction. Taking the actual situation of the intersection of Dongling South Street and Nanhu Avenue as an example, on the basis of right-turn-left placement of the east–west inlet, the feasibility of dynamic shifting of the north–south inlet for left-turning under the condition of limited space was explored, and a dynamic organization scheme was comprehensively designed for the large-scale intersection where the main road and the secondary road intersect during the road-occupying construction. Considering the influence of the pre-signal and main signal, the delay calculation equation was revised to increase the delay caused by the pre-signal, the main pre-signal constraint relationship was proposed according to the traffic wave theory, the timing optimization model was established and solved, and then the relevant parameters were obtained. This study primarily focused on vehicular traffic. Future research will incorporate pedestrian and bicycle flows into the optimization model, especially considering the visibility and access issues in construction zones.

Supplementary Materials

The following supporting information can be downloaded at: https://www.mdpi.com/article/10.3390/sym17111856/s1, Table S1: Traffic volume (pcu) on eastbound lanes for each cycle at the intersection; Table S2: Traffic volume (pcu) on westbound lanes for each cycle of the intersection; Table S3: Traffic volume (pcu) on the southbound lanes of the intersection by cycle; Table S4: North Inlet Lane Traffic Volumes by Cycle at Intersection (pcu); Table S5: Discount factors by model; Table S6: Inlet-to-Equivalent Traffic Volumes at this Intersection During the Morning Peak Period; Table S7: Delays at all inlets; Table S8: Bending speeds at intersections of various classes of roads km/h; Table S9: Turning radius of a car.

Author Contributions

Conceptualization, T.C. and M.T.; Methodology, T.C. and H.X.; Software, Q.W.; Validation, Z.C.; Formal analysis, Y.W.; Investigation, H.Y.; Data curation, T.C. and Z.C.; Writing—original draft preparation, T.C.; Writing—review and editing, M.T. and H.X. All authors have read and agreed to the published version of the manuscript.

Funding

This research received no external funding.

Data Availability Statement

Data will be available on reasonable request.

Conflicts of Interest

The authors declare no conflicts of interest.

References

  1. Enberg, A.; Mannan, M.S. Capacity and Traffic Flow Characteristics at A Freeway Work Zone in Finland. In Proceedings of the Third International Symposium on Highway Capacity, Copenhagen, Denmark, 22–27 June 1998; pp. 397–421. [Google Scholar]
  2. Chien, S.; Schonfeld, P. Optimal Work Zone Lengths for Four-Lane Highways. J. Transp. Eng. 2001, 127, 124–131. [Google Scholar] [CrossRef]
  3. Shaaban, K.; Elnashar, D. Evaluation of Work Zone Strategies at Signalized Intersections. J. Traffic Logist. Eng. 2013, 1, 202–206. [Google Scholar] [CrossRef]
  4. Jiang, Y. Traffic Capacity, Speed, and Queue-Discharge Rate of Indiana’s Four-Lane Freeway Work Zones. Transp. Res. Rec. 1999, 1657, 10–17. [Google Scholar] [CrossRef]
  5. Meng, Q.; Weng, J. Evaluation of rear-end crash risk at work zone using work zone traffic data. Accid. Anal. Prev. 2011, 43, 1291–1300. [Google Scholar] [CrossRef] [PubMed]
  6. Li, Y.; Bai, Y. Effectiveness of temporary traffic control measures in highway work zones. Saf. Sci. 2009, 47, 453–458. [Google Scholar] [CrossRef]
  7. Sulistianny, K.; Sutrisno, M. The solution of traffic congestion during flyover construction at Antapani intersection in Bandung. IOP Conf. Ser. Mater. Sci. Eng. 2020, 732, 012035. [Google Scholar] [CrossRef]
  8. Wang, Z.; He, W.; Zhang, X.; Wang, Y.; Wu, B.; Wang, Y. Lane-based vehicular speed characteristics analysis for freeway work zones using aerial videos. Can. J. Civ. Eng. 2021, 48, 274–283. [Google Scholar] [CrossRef]
  9. Bie, Y.; Liu, Z.; Wang, Y. A real-time traffic control method for the intersection with pre-signals under the phase swap sorting strategy. PLoS ONE 2017, 12, e0177637. [Google Scholar] [CrossRef]
  10. Zhao, J.; Ma, W.; Head, K.L.; Yang, X. Optimal operation of displaced left-turn intersections: A lane-based approach. Transp. Res. Part C 2015, 61, 29–48. [Google Scholar] [CrossRef]
  11. Al-Kaisy, A.; Hall, F. Guidelines for estimating capacity at freeway reconstruction zones. J. Transp. Eng. 2003, 129, 572–577. [Google Scholar] [CrossRef]
  12. Hajbabaie, A.; Kim, S.; Schroeder, B.J.; Aghdashi, S.; Rouphail, N.M.; Tabrizi, K. Estimation of Saturation Headway in Work Zones on Urban Streets. Transp. Res. Rec. 2017, 2615, 26–34. [Google Scholar] [CrossRef]
  13. Weng, J.; Chen, Q. Probabilistic speed–flow models in highway construction work zones. Inst. Civ. Eng.—Transp. 2023, 176, 110–116. [Google Scholar] [CrossRef]
  14. Weng, J.; Meng, Q. Modeling speed-flow relationship and merging behavior in work zone merging areas. Transp. Res. Part C Emerg. Technol. 2011, 19, 985–996. [Google Scholar] [CrossRef]
  15. Jehn, N.L.; Turochy, R.E. Development of Breakdown Probability Models and Heavy Vehicle Passenger Car Equivalents for Rural Freeway Work Zones. J. Transp. Res. Board 2020, 2674, 036119812095119. [Google Scholar] [CrossRef]
  16. Gartner, N.; Assmann, S.F.; Lasaga, F.; Hou, D.L. Multiband: A variable-bandwidth arterial progression scheme. Transp. Res. Rec. 1991, 1287, 212–222. [Google Scholar]
  17. Li, T.; Liu, Q.; Liu, H.; Hao, Q.; Yao, W. Influence of Different Proportions of CACC and ACC in the Traffic Flow. In Proceedings of the 2020 5th International Conference on Electromechanical Control Technology and Transportation (ICECTT), Nanchang, China, 15–17 May 2020; pp. 561–564. [Google Scholar]
  18. Gravelle, E.; Martínez, S. Distributed dynamic lane reversal and rerouting for traffic delay reduction. Int. J. Control 2017, 91, 2355–2365. [Google Scholar] [CrossRef]
  19. Hirose, R.; Mehran, B.; Pani, A. Investigating Combined Impact of Adverse Road-Weather Conditions and Heavy Vehicles on Saturation Headway. J. Transp. Res. Board 2022, 2676, 036119812210893. [Google Scholar] [CrossRef]
  20. Cook, D.J. Operational Effects of the Consolidated Intersection Design on Urban and Suburban Arterials. Transp. Res. Rec. J. Transp. Res. Board 2018, 2672, 96–107. [Google Scholar] [CrossRef]
  21. TRB. Highway Capacity Manual (HCM), 6th ed.; Transportation Research Board, National Academies of Sciences: Washington, DC, USA, 2016. [Google Scholar]
  22. GB 50647-2011; Code for Planning of Intersections on Urban Roads. China Planning Press: Beijing, China, 2011.
  23. Wang, Q.-L.; Chen, Y.; Dong, H.-R.; Zhou, M.; Ning, B. A new collision avoidance model for pedestrian dynamics. Chin. Phys. B 2015, 24, 034501. [Google Scholar] [CrossRef]
  24. Anvari, B. A mathematical model for driver and pedestrian interaction in shared space environments. In Proceedings of the 44th Universities Transport Study Group Conference, Aberdeen, UK, 10 December 2012. [Google Scholar]
  25. Helbing, D. Boltzmann-like and Boltzmann-Fokker-Planck equations as a foundation of behavioral models. Phys. A Stat. Mech. Its Appl. 1993, 196, 546–573. [Google Scholar] [CrossRef]
  26. Saraiva, F.O.S.; Paucar, V.L. General metaheuristic-based methodology for computation and decomposition of LMPs. Electr. Eng. 2021, 103, 793–811. [Google Scholar] [CrossRef]
  27. Zhang, X.; Fan, X.; Yu, S.; Shan, A.; Fan, S.; Xiao, Y.; Dang, F. Intersection Signal Timing Optimization: A Multi-Objective Evolutionary Algorithm. Sustainability 2022, 14, 1506. [Google Scholar] [CrossRef]
  28. Deb, K.; Pratap, A.; Agarwal, S.; Meyarivan, T. A fast and elitist multiobjective genetic algorithm: NSGA-II. IEEE Trans. Evol. Comput. 2002, 6, 182–197. [Google Scholar] [CrossRef]
  29. Srinivas, N.; Deb, K. Muiltiobjective Optimization Using Nondominated Sorting in Genetic Algorithms. Evol. Comput. 1994, 2, 221–248. [Google Scholar] [CrossRef]
  30. Sun, D.; Benekohal, R.; Waller, S. Multiobjective traffic signal timing optimization using non-dominated sorting genetic algorithm. In Proceedings of the IEEE IV2003 Intelligent Vehicles Symposium, Columbus, OH, USA, 9–11 June 2003; pp. 198–203. [Google Scholar] [CrossRef]
  31. Zhang, X.; Zang, Z.; Chen, X.; Lu, Y.; Qi, J.; Gong, J. Optimization-based trajectory planning for autonomous vehicles in scenarios with multiple reference lines. Control Eng. Pract. 2025, 163, 106407. [Google Scholar] [CrossRef]
  32. Schönauer, R.; Stubenschrott, M.; Huang, W.; Fellendorf, M.; Rudloff, C. Modeling Concepts for Mixed Traffic: Steps Toward a Microscopic Simulation Tool for Shared Space Zones. Transp. Res. Rec. 2012, 2316, 114–121. [Google Scholar] [CrossRef]
  33. Dai, R.; Ding, C.; Wu, X.; Yu, B.; Lu, G. Coupling Control of Traffic Signal and Entry Lane at Isolated Intersections Under the Mixed-Autonomy Traffic Environment. IEEE Trans. Intell. Transp. Syst. 2023, 24, 10628–10642. [Google Scholar] [CrossRef]
  34. Huang, W.; Fellendorf, M.; Schönauer, R. Social force based vehicle model for two-dimensional spaces. In Proceedings of the Transportation Research Board 91st Annual Meeting, Washington, DC, USA, 22–26 January 2012. [Google Scholar]
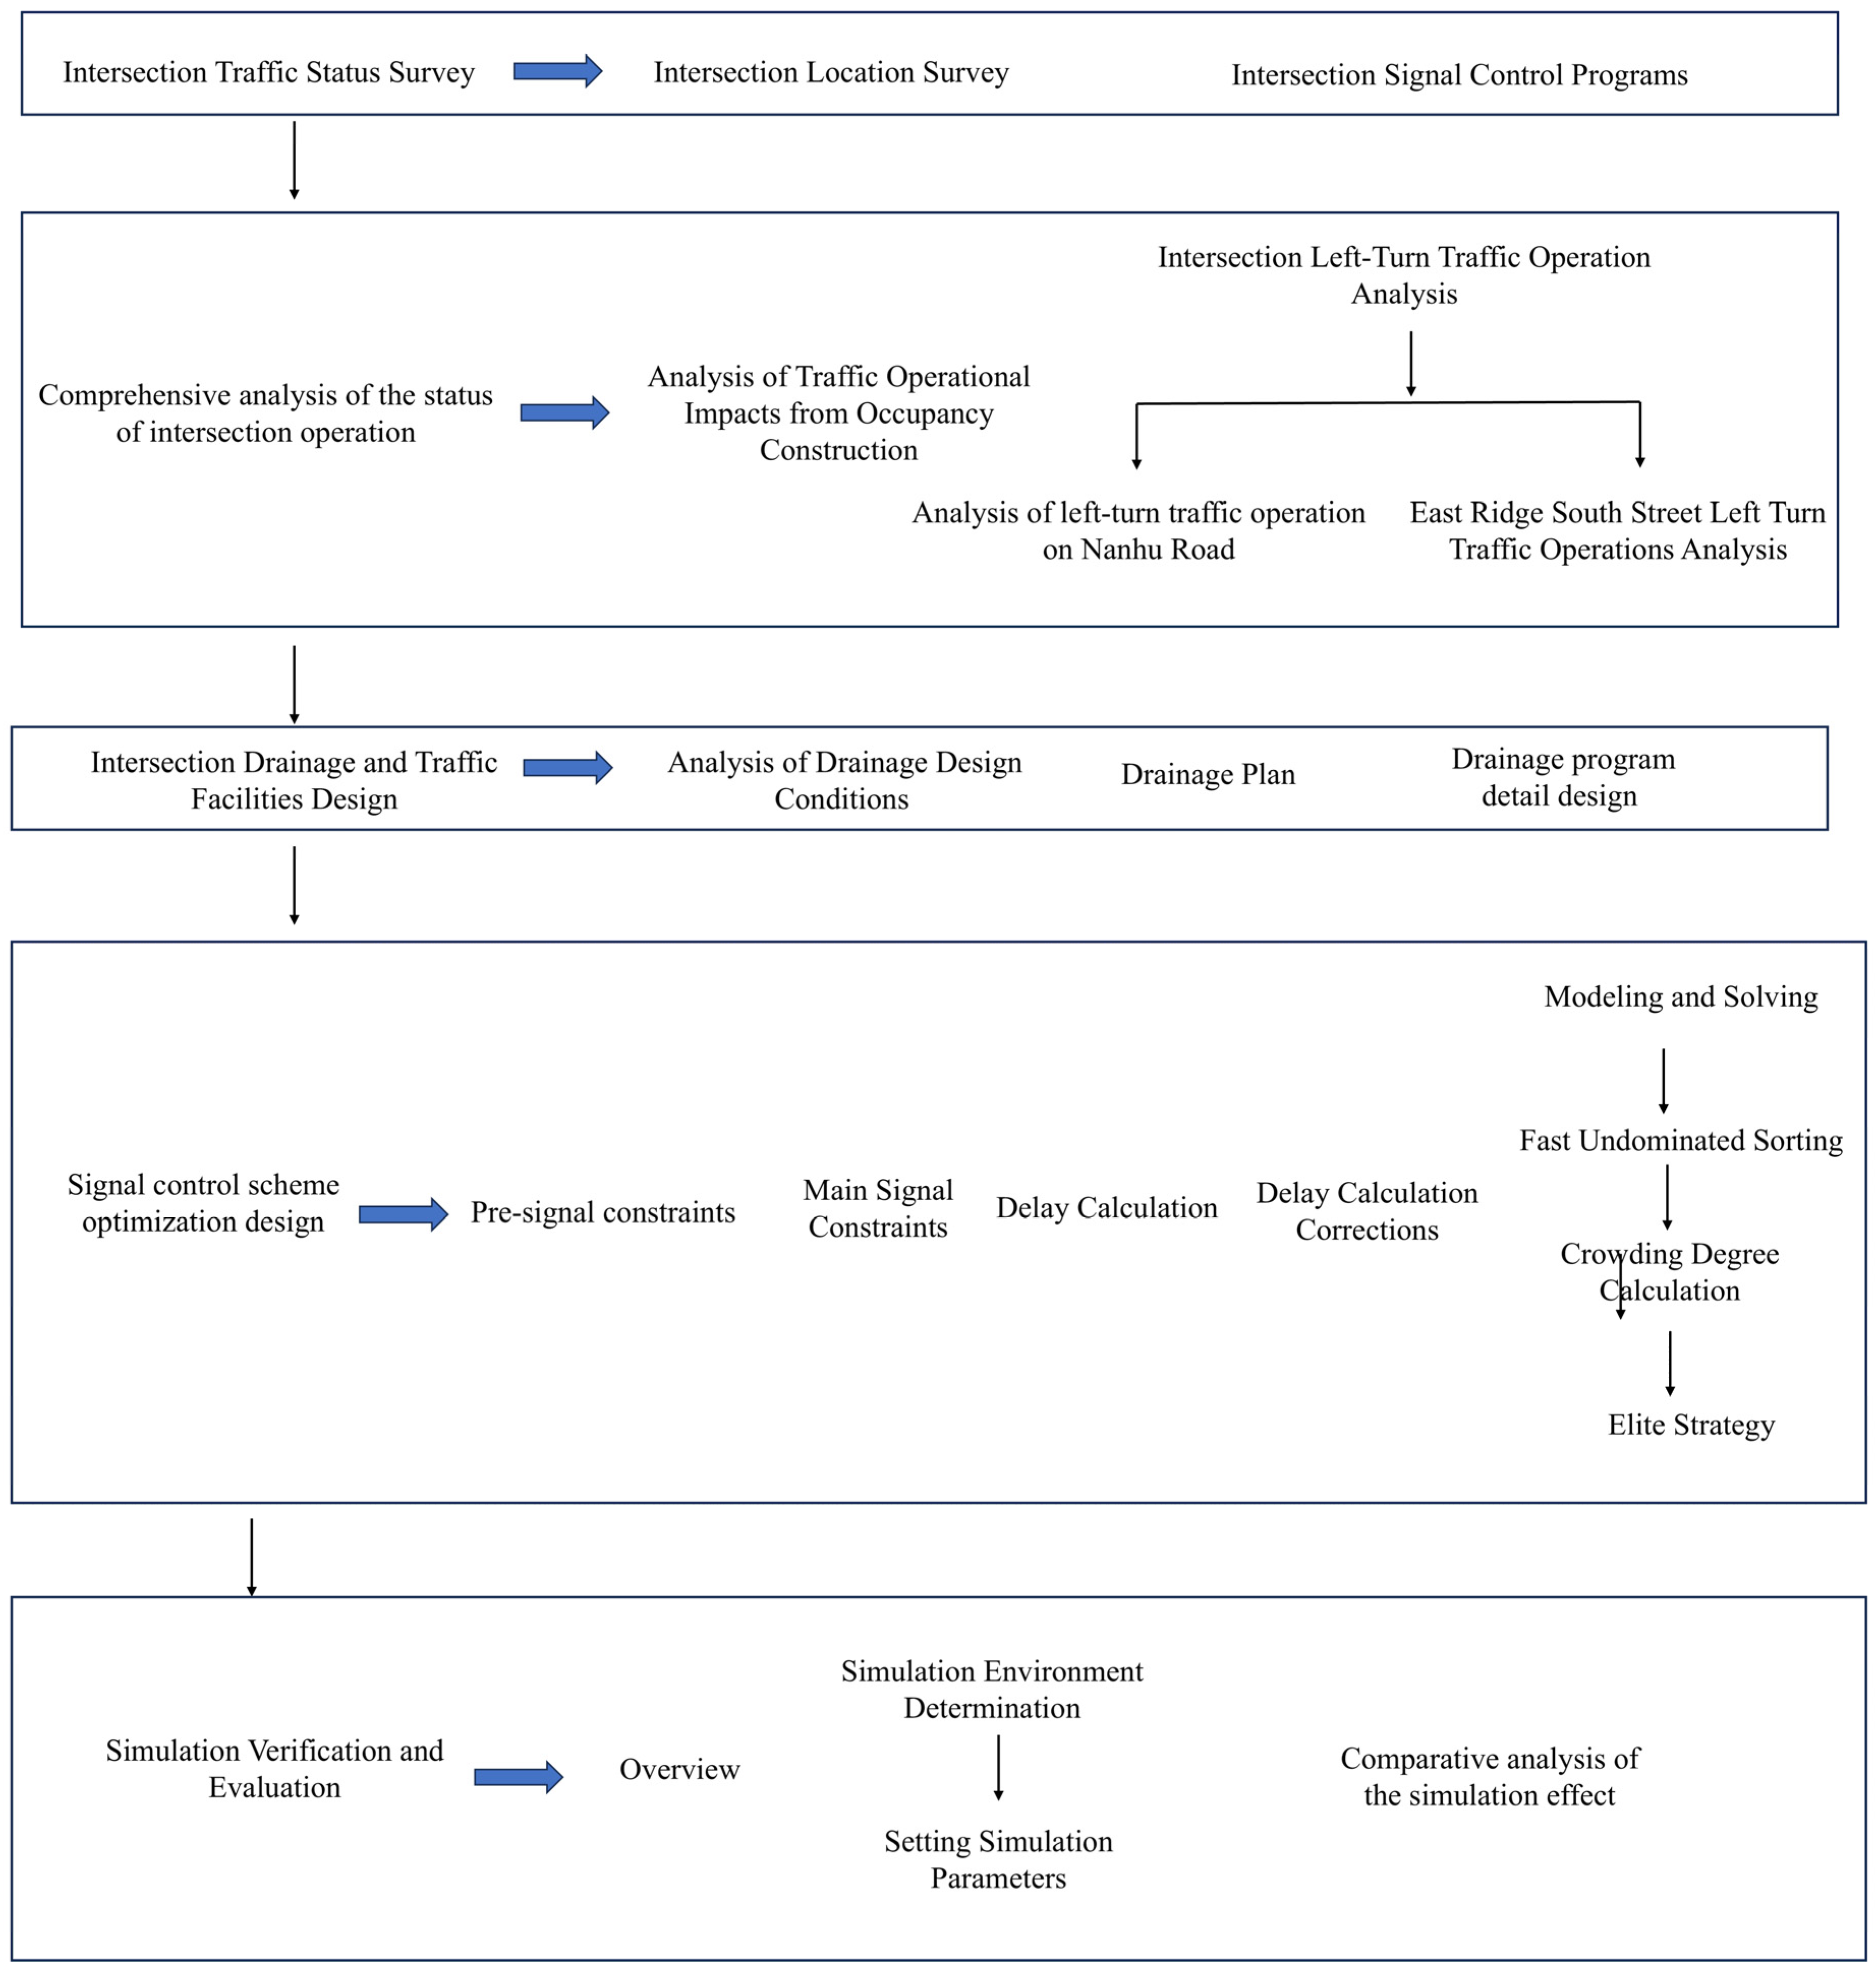
Figure 1. Overall framework diagram.
Symmetry 17 01856 g001
Figure 2. Intersection of Dongling South Street and Nanhu Avenue. (a) Actual maps; (b) Diagram of original canalization of the intersection.
Symmetry 17 01856 g002
Figure 3. Intersection signal control. (a) Intersection phase-phase sequence diagram; (b) Status of signal timing at intersections.
Symmetry 17 01856 g003
Figure 4. Simulation diagram of the intersection situation.
Symmetry 17 01856 g004
Figure 5. West import of Nanhu Avenue.
Symmetry 17 01856 g005
Figure 6. Schematic diagram of the left-turn problem for vehicles imported from the east. (a) Diagram of left-turn queue unable to turn around; (b) Schematic diagram of straight-ahead queue blocking; (c) Schematic diagram of straight-left conflict in the morning peak.
Symmetry 17 01856 g006
Figure 7. Schematic organization of vehicles turning left and right.
Symmetry 17 01856 g007
Figure 8. Optimized drainage design.
Symmetry 17 01856 g008
Figure 9. Nanhu Avenue east–west inlet improvement drainage map. (a) Nanhu Avenue east inlet drainage map; (b) Nanhu Avenue west inlet drainage map; (c) South East Ridge Street south inlet improvement drainage plan.
Symmetry 17 01856 g009
Figure 10. Drainage program design. (a) Diagram of the left-turn area at the south entrance road; (b) Turning track legend; (c) Design of the west entrance parking lane; (d) Schematic diagram of shifted left-turn at the south inlet.
Symmetry 17 01856 g010
Figure 11. Signal control scheme optimization design. (a) Improvement of phase sequences; (b) Signal control program.
Symmetry 17 01856 g011
Figure 12. Timeline diagram illustrating the coordination between the main signal phases and the south approach pre-signal.
Symmetry 17 01856 g012
Figure 13. Optimized signal timing schemes.
Symmetry 17 01856 g013
Figure 14. Crowding-distance calculation. Points marked in filled circles are solutions of the same non-dominated front.
Symmetry 17 01856 g014
Figure 15. Elite strategy implementation steps.
Symmetry 17 01856 g015
Figure 17. Simulation interface.
Symmetry 17 01856 g017aSymmetry 17 01856 g017b
Figure 18. Simulation conflict zone settings. (a) Map of current conflict zone yielding rules; (b) Improvement of rules for giving way in conflict zones.
Symmetry 17 01856 g018
Figure 19. Comparison of the average vehicle delay in each flow direction at the intersection before and after optimization.
Symmetry 17 01856 g019
Figure 20. Carbon emissions before and after optimization.
Symmetry 17 01856 g020
Table 1. Basic data of Dongling South Street and Nanhu Avenue.
RoadImportRoad ClassLane NumberLane Width
Nanhu AvenueEast ImportTrunk road43.5
West Import53.5
Dongling South StreetNorth ImportSecondary trunk road23.5
South Import23.5
Tidal carriageway13.25
Table 2. Basic data of the intersection for Dongling South Street and Nanhu Avenue.
RoadTimeImportLane MarkingLane Layout Form
Nanhu AvenueWhole dayEast ImportLeft turn/straight ahead/straight right1/2/1
West ImportLeft turn/straight ahead/right turn1/3/1
Dongling South Street23:55–12:00North ImportStraight ahead/right1/1
12:00–23:55North ImportStraight left/straight ahead/straight right1/1/1
23:55–12:00South ImportStraight left/straight ahead/straight right1/1/1
12:00–23:55South ImportStraight left/right1/1
Table 3. The improvement in all directions of the traffic average delay.
ImportTraffic Flow DirectionAverage Vehicle Delay (s)
EastTurn left40.1
Go straight53.8
Turn right48.7
WestTurn left43.4
Go straight43.3
Turn right43.6
SouthTurn left37.1
Go straight33.7
Turn right19.3
North//
Go straight7.6
Turn right43.3
Disclaimer/Publisher’s Note: The statements, opinions and data contained in all publications are solely those of the individual author(s) and contributor(s) and not of MDPI and/or the editor(s). MDPI and/or the editor(s) disclaim responsibility for any injury to people or property resulting from any ideas, methods, instructions or products referred to in the content.