Abstract
This research proposes a method based on the greatest and shortest eigen fuzzy sets of fuzzy relations to evaluate the effectiveness of policies and strategies implemented in urban settlements aimed at increasing the livability and well-being of citizens. This assessment is performed by extracting population census data collected at the beginning and end of the analyzed period and grouping them by subzone, that is, for each of the urban areas into which the urban settlement is divided. The greatest eigen fuzzy set (GEFS) and the smallest eigen fuzzy set (SEFS) are determined symmetrically as min-max and max-min solutions of fuzzy relations; they are calculated to estimate the average impact of urban strategies on generating symptoms of growth in citizen well-being during the investigated period. The method is implemented on a GIS (Geographic Information System) platform and was tested to assess the effectiveness of local policies applied between 2011 and 2021 on the growth of employment rates and educational attainment in the city of Naples (Italy), partitioned by neighborhood. Our model, unlike other fuzzy-based models for evaluating the effectiveness of actions and strategies to improve the quality of life in urban settlements, does not allow for subjective interpretations based on the knowledge or experience of different stakeholders, but relies solely on measurements over time of characteristics collected during census activities. Furthermore, it is integrated into a GIS-based platform, providing additional capabilities for identifying the urban areas where the impact of local strategies and policies has been most significant and those most critical. The test results show that the proposed framework can be a valuable tool for supporting decision makers in evaluating the effectiveness of local actions and policies aimed at improving the livability and well-being of citizens.
1. Introduction
Since the late 1970s, the symmetrical properties of the greatest eigen fuzzy set (GEFS) of a fuzzy relation with respect to the max-min composition and of the smallest eigen fuzzy set (SEFS) of a fuzzy relation with respect to the min-max composition, have been studied extensively [1,2,3,4,5].
The first applications of the GEFS and the SEFS concerned image analysis. The idea is to analyze and compare images by partitioning them into n × n windows and transforming them into fuzzy relations, computing the GEFS and SEFS of each fuzzy relation. This approach has been used for image information retrieval in [6,7,8,9,10] and for reconstructing degraded images in [11,12,13]. In [14], a GEFS- and SEFS-based image similarity measure for comparing noisy images is proposed.
Decision making methods based on GEFS and SEFS for evaluating effectiveness of health treatments in reducing symptoms of ailments are proposed in [15,16,17,18].
The idea is to construct two fuzzy relations R and S, where the component rij (sij) represents the percentage of patients who were administered the treatment for which the action of the drug on the ith symptom was equal to or greater than (equal or less than) that on the jth. The ith component of the difference between the GEFS of R and the SEFS of S represents the range of the treatment’s effectiveness in reducing the ith symptom of the disease. This method enables us to evaluate the effectiveness of the drug in reducing a particular symptom, as well as how much more effective it was in reducing that symptom compared to others.
Ref. [19] presents a variation of this approach, in which the GEFS and SEFS of spherical fuzzy relations [20] are applied to decisional analysis. A disadvantage of this approach is that it uses spherical fuzzy soft sets, which are less intuitive to manage than canonical fuzzy sets.
A generalization of the method used in [15] to evaluate the effectiveness of medical treatments is presented in [21]. This method assesses the effectiveness of actions taken to enhance an entity’s positive characteristics and exacerbate its negative ones. It is applied to evaluate the effectiveness of local policies aimed at enhancing tourism in historic centers.
The main critical point of the methods proposed in [15,21] concerns the construction of the two fuzzy relations R and S, which are formed based on subjective evaluations. In [15], the rij and sij components of the two fuzzy relations are determined by considering the percentage of cases in which the ith symptom of the disease has decreased in the same way or to a greater or lesser extent than the jth symptom. In [21], they are determined by considering the percentage of tourists who evaluated that the ith characteristic increased in the same way or to a greater (or lesser) extent than the jth characteristic.
In this work we propose a variation of the model [21] aimed at evaluating the effectiveness of local policies implemented over a period to improve citizens’ well-being and quality of life, where local policies mean all the actions and strategies undertaken during the period by local administrators.
The entity comprises an urban settlement, and symptoms are determined by measuring the growth of indices that assess citizens’ quality of life and well-being. The urban settlement is divided into urban zones, called subzones, where the presence of symptoms of well-being in residents is assessed. For example, depending on the type of analysis being conducted, subzones can be neighborhoods, districts, or municipalities within a city.
Formally, if and are the values assumed to be normalized of the ith index measured for the kth subzone at the initial time T1 and final time T2, respectively, then the corresponding symptom determined for the kth subzone is given by the difference if this difference is positive. In all other cases, it is equal to 0 as no growth in the well-being of citizens in the subzone has been detected. The two fuzzy relations R and S are calculated by determining how many subzones have a value for the ith symptom that is equal to or greater than (or equal to or less than) that of the jth symptom.
According to [21], the effectiveness of local policies in increasing the ith symptom is represented by the mean value of the ith component of the GEFS and SEFS results. This value enables decision makers to evaluate which symptoms have been most impacted by local political actions during the period under investigation.
To prevent subjective interpretation, the indices are determined based on population census measurements taken at the beginning and end of the survey period. These indices are then extracted and grouped by the urban subzones into which the settlement is divided. In this way, unlike the models in [15,21], in which the components of the fuzzy relations R and S are determined subjectively, by evaluating in which instances a symptom is present or not, or they are extracted from measures of the indices performed before and after the treatment.
Another advantage of the proposed method with respect to the GEFS and SEFS models [15,21] is that the model is integrated into a GIS-based platform for assessing the spatial distribution of symptoms by subzone. This allows decision makers to analyze which areas of the urban settlement local policies promoted during the period significantly contributed to the development of a particular symptom of well-being among citizens and in which urban areas such a symptom was not detected. This framework feature is extremely valuable for decision makers. Indeed, a single assessment of the average effectiveness of a local policy in improving residents’ well-being and quality of life is insufficient to determine the areas in which the policy has been most effective and those in which the desired outcome has not been achieved.
In summary, the proposed model enhances the precision and usability of the GEFS and SEFS fuzzy relation model [21] for evaluating the effectiveness of local policies and strategies in enhancing the well-being of citizens and tourists. In fact, in [21], the effectiveness of actions is evaluated by taking into account subjective information obtained through questionnaires administered to citizens and tourists. This represents a critical aspect and a limitation of the model, due to the uncertainty and subjectivity of this information, which is used to construct the two fuzzy relationships. In the proposed model, however, only the measurements acquired from census data obtained at the beginning and end of the study period are used. Furthermore, unlike model [21], the proposed model introduces the concept of sub-areas; the urban settlement is divided into sub-zones and the model allows us to evaluate in which sub-zones a specific symptom has been highlighted and in which others this symptom has not been detected; this allows the decision maker to perform more specific analyses by evaluating the spatial distribution of the intensity of each symptom.
The model is presented in detail in the following paragraphs. The next section discusses the basic concepts related to GEFS and SEFS of fuzzy relations. Section 3 presents the proposed method for evaluating the effectiveness of local political action in improving citizens’ well-being and quality of life. The case study used for the experiments is also described. Section 4 shows and discusses the test results. Section 5 contains the concluding remarks.
2. Theoretical Concepts
The methods for determining the GEFS and SEFS of a fuzzy relation were introduced in [1]. GEFS and SEFS are usually obtained by repeatedly applying a fuzzy relation to an initial fuzzy set until a convergence is reached.
Let X = {x1, x2,…, xn} be a numerical finite set and let F(X) the family of fuzzy sets defined on X. Let R: X × X ⟶ [0, 1] be a fuzzy relation defined on X.
A fuzzy set A ∈ F(X) satisfying the equation:
where the operator “” stands for the well-known max-min composition, is said an eigen fuzzy set of R respect to the max-min composition.
Formally, the membership function of A is given by:
In [7,8,9] it was proved that there exists at least one eigen fuzzy set A of R with respect to the max-min composition.
Given the fuzzy set A1 with membership degree: , we can define recursively the fuzzy sets:
As shown in [1], there exists an integer such that = , where for any and for any eigen fuzzy set .
The eigen fuzzy set is called the Greatest Eigen fuzzy Set (GEFS) of R.
Similarly, a fuzzy set ) satisfying the equation:
where the operator “” stands for the well-known min-max composition, is said to be an eigen fuzzy set of R respect to the min-max composition.
Formally, the membership function of B is given by
Given the fuzzy set with membership degree: , we can define recursively the fuzzy sets:
As shown in [1], there exists an integer such that = , where for any and for any eigen fuzzy set .
The eigen fuzzy set is called the Smallest Eigen fuzzy Set (GEFS) of R.
For example, let X = {x1, x2,…, x6} and let R be the 6 × 6 fuzzy relation:
The fuzzy set is given by: .
To find the GEFS of R, Equation (3) is executed, obtaining:
Then, and
The fuzzy set is given by: .
To find the SEFS of Equation (6) is executed, obtaining:
Then, and .
Some authors used GEFS and SEFS for decision problems. In [15,16,17,18] GEFS and SEFS are applied to evaluate the effectiveness of a drug administered to a group of patients.
The set X = {x1, x2,…, xn} is defined as the set of symptoms experienced by patients.
A n × n fuzzy relation R is constructed whose components rij are express how effective the drug was in eliminating the ith symptom more than, or at least equally to, the jth symptom. Moreover, a n × n fuzzy relation S is constructed whose components sij are express how much less effective or equally effective the drug was in eliminating the ith compared to the jth. The GEFS Ap of R is found using (3) an the SEFS Bq of S is found using (6).
The interval [Bqi, Api] represents the range of effectiveness of the drug in reducing the ith symptom; it provides the decision making physician with an element to evaluate the drug’s effectiveness in eliminating the symptom.
In [21] an application of GEFS and SEFS to support urban planners to evaluate the effectiveness of local tourism enhancement policies in historic centers is proposed. The symptoms consist of six characteristics of a historic urban center, some of which have a positive and others a negative impact on the cultural tourism value of the historic center. The authors apply the model proposed in [Rakus] to determine the interval [Bqi, Api] that evaluates the effectiveness of local policies in increasing or mitigating the ith feature. The two fuzzy relations R and S are built based on the opinions of tourists who, after having visited the historic center, evaluate how much one characteristic has increased or reduced compared to another.
The flaw of this approach is that it introduces uncertainty into the assessment of the effectiveness of local policies generated by tourists’ subjective interpretations. Indeed, the elements Rij and Sij of the two fuzzy relations are determined based on the frequency of tourists who believe that the ith characteristic increased over the survey period more or equally (less or equally) than the jth.
In this work we propose a model based on GEFS and SEFS to evaluate the effectiveness of local policies implemented over a period in an urban settlement in increasing symptoms that impact citizens’ well-being and quality of life. In the model, symptoms consist of increases in specific measures of citizens’ quality of life and well-being, determined from urban census data extracted at the start and end of the analysis period.
Symptoms are determined based on indices extracted from census data collected at the beginning and at the end of the survey period; this allows us to reduce the uncertainty introduced by subjective evaluations. Furthermore, symptoms are calculated for each sub-zone into which the urban settlement is divided; this allows us to determine in which areas of the urban settlement a symptom is significantly present and in which areas it has not been detected, providing the decision maker with a more detailed tool for evaluating the effectiveness of local policies than the one proposed in [21].
The model is discussed in depth in the next section.
3. Materials and Methods
The algorithm for calculating GEFS and SEFS of fuzzy relations is applied to determine the impact of local policies and strategies on increasing factors of citizen livability and well-being.
The study area consists of an urban settlement, partitioned in the city’s urban agglomerations, called subzones. The objective of the framework is to assess the average effectiveness of local policies implemented over a given period in the city in increasing citizens’ livability and well-being indicators, where local policies include the strategies and actions carried out over a period by local administrations in order to increase the well-being of citizens.
Let X = {x1, x2,…, xn} be the universe of discourse given by n symptoms, where each symptom represents a positive factor that measures the increase in a specific index that impacts on the livability and well-being of citizens. For example, assuming we want to analyze the effectiveness of local policies in increasing the economic well-being of citizens in a period, an index is given by the per capita income, and the correspondent symptom measures the increase in per capita income during the analyzed period.
Moreover, let and be, respectively, the value of the ith index measured for the kth subzone in an initial time T1 and in a final time T2.
The L1 regularization normalization technique is used to standardize data instances so that the absolute sum of the values of the index in each period is equal to 1; it, compared to other well-known normalization techniques such as Min-Max scaling and Max-Abs scaling, minimizes the effect of outliers and noise in the data. The normalization process ensures the uniformity of scale for each index.
Based on the definition of a symptom, its presence should be evaluated only in positive terms. Indeed, the presence of a symptom in a subzone that positively impacts the quality of life of its citizens is assessed by considering the growth of the corresponding normalized index. If this index has not increased in the subzone, this means that that specific symptom was not detected in that subzone during the survey period.
For this reason, the value of the symptom xi calculated for the kth subzone is given by:
This value always fluctuates in the range [0, 1]. In fact, if no increase in the ith index has been recorded in a subzone (therefore, ), then in that subzone no symptom is detected and . Otherwise, since and are normalized values, will be a positive value less than or equal to 1. This allows us to compare different symptom values with each other.
Let N be the number of subzones. Let Nij, with i≠j, be the number of subzones for which results and let Ni be the number of subzones for which .
The value:
represents how much the local policy has enhanced the ith symptom more than the jth symptom or, in the same way.
Likewise, the value
represents, in general, how much the local policy has enhanced the ith symptom.
Given the nxn fuzzy relation , the GEFS of R is given by the fuzzy set Ap eigen fuzzy set of R respect to the max-min composition, satisfying Equation (1):
where Api represents the maximum effect produced by the local policy on the ith symptom.
Let Mij, with i ≠ j, be the number of subzones for which results and let Mi be the number of subzones for which .
The value:
represents how much the local policy has enhanced the ith symptom less than the jth symptom or, in the same way.
Likewise, the value
represents, in general, how much the local policy has not enhanced the ith symptom.
Given the nxn fuzzy relation , the SEFS of S is given by the fuzzy set Bq eigen fuzzy set of S respect to the min-max composition, satisfying Equation (1):
where Bqi represents the minimum effect produced by the local policy on the ith symptom.
The two fuzzy sets Ap and Bq are obtained executing the algorithms to found, respectively, the GEFS of R and the SEFS of S.
The interval [Bpi, Aqi] represents the range of effectiveness of local policy actions in determining the increase in the value of the ith index parameter in the analyzed period.
The value:
provides an estimate of the average effectiveness of local policy actions in determining the increase in the value of the ith index in the analyzed period.
Analyzing the effectiveness of local policies for each symptom during the survey period provides decision makers with a tool for verifying which symptoms of citizen well-being were most impacted and which, instead, were most modestly impacted by local policies. In addition, the creation of thematic maps of the spatial distribution of each symptom provides information on which subzones’ local policies have had the greatest impact on the manifestation of a specific symptom.
The flow diagram in Figure 1 illustrates the model’s architecture. Census data recorded at the start and end of the survey period are acquired and aggregated by subzone. The indices needed to assess growth in citizens’ well-being and quality of life are then calculated. The symptoms are then determined for each subzone and the two fuzzy relations R and S are constructed. Having determined the GEFS of relation R and the SEFS of relation S, the average effectiveness of local policies in manifesting each symptom is established and thematic maps showing the spatial distribution of each symptom are created.
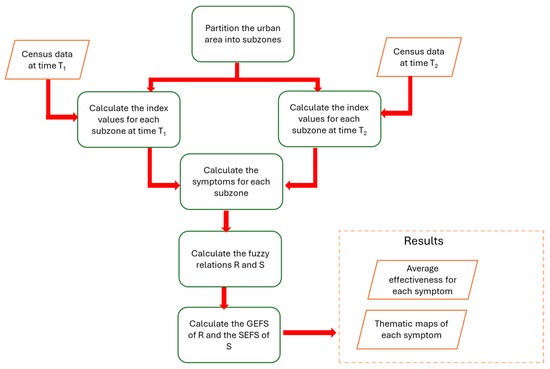
Figure 1.
The architecture of the proposed model.
The model’s steps are described below. They can be replicated by a decision maker who intends to evaluate the efficiency of local policy implementation for improving citizens’ livability.
- -
- The city is partitioned in subzones, consisting of urban areas for each of which the decision maker intends to evaluate the onset and intensity of each symptom in the analyzed period.
- -
- The decision maker determines which indices, calculated from census data, impact the evaluation of the efficiency of local policies during the period.
- -
- Each index is calculated at time T1 and time T2, acquiring, respectively, the census data measured at the beginning and end of the survey period.
- -
- After the process of normalizing the index values at time T1 and T2, the corresponding symptom is calculated by (7).
- -
- After calculating the index values for each subzone, the two fuzzy relations R and S are constructed.
- -
- The GEFS of R and the SEFS of S are calculated, and the average efficiency of local policies in producing the onset of each symptom is determined. The decision maker determines which symptoms of improved citizen livability have been most evident as a result of the implemented local policies.
- -
- Thematic maps of each symptom are created, showing the spatial distribution of the symptom value by subzone. For each symptom, the decision maker evaluates the areas of the city in which it has occurred and to what extent; similarly, they evaluate the areas in which the symptom has not manifested.
The Case Study
The model is tested on the city of Naples (Italy) to evaluate the impact of urban policies between 2011 and 2021 on the increase in employment rates and educational attainment.
The city is partitioned in 30 neighborhoods (Figure 2).
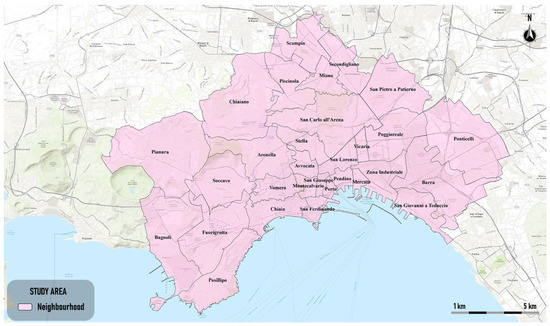
Figure 2.
The neighborhoods of Naples (Italy).
The city’s central neighborhoods are those that include the historic center, the ancient heart of the city. They include the oldest neighborhoods in the historic center and areas adjacent to it (Montecalvario, Avvocata, Pendino, Mercato, Stella, San Carlo all’Arena, San Giuseppe, and Porto), central hilltop neighborhoods (Vomero and Arenella), and central coastal neighborhoods (Posillipo, Chiaia, San Ferdinando).
The peripheral neighborhoods are those that have undergone the greatest urban development since the 1960s. They encompass neighborhoods in the north and northeast of the city (Scampia, Secondigliano, Miano, and San Pietro a Patierno), in the west (Bagnoli, Fuorigrotta, Pianura, and Soccavo), and in the eastern area (Poggioreale, Zona industriale, Ponticelli, Barra, and San Giovanni a Teduccio).
The choice of Naples as a study area is motivated by the fact that its neighborhoods have been characterized by significant differences in the social, cultural, and economic status of their residents. Over the last decade, in line with national and regional directives and regulations, several local policy strategies have been implemented aimed at increasing employment rates and educational attainment, especially in the most disadvantaged neighborhoods.
With the assistance of an expert urban planner, the following four indices were defined, deemed significant for evaluating the increase in employment rates and educational attainment:
- -
- increase in the percentage of employed residents
- -
- increase in the percentage of employed female residents
- -
- increase in the percentage of residents with a university degree
- -
- increase in the percentage of residents with at least one educational attainment.
The data are obtained from the population and housing censuses of all Italian municipalities conducted by the Italian National Institute of Statistics (ISTAT) in 2011 and 2021. They are extracted from the population and housing census datasets collected by census area and published on the website https://www.istat.it/notizia/basi-territoriali-e-variabili-censuarie (accessed on 1 January 2025) and refer to the resident population and employed female residents aged 15 and over, the resident population without a high school diploma and aged 9 years and over, and the resident population with one or more first- or second-level tertiary qualifications and aged 9 years and over. The extracted data were subsequently grouped by subzone.
Since the impact of the implemented strategies is long-term, the chosen time frame of 10 years is appropriate for assessing their actual effectiveness on increasing citizens’ employment and education levels.
ISTAT conducts a building and population census for each Italian municipality every ten years. The census is collected by census zone, which is an atomic area of a municipality, homogeneous in terms of urban characteristics.
During the preprocessing phase, data from 2011 and 2021 were acquired for all census zones of the city of Naples regarding the total number of employed working-age residents, the total number of employed working-age female residents, the number of residents with a university degree, and the number of residents with at least a primary school diploma.
The extracted data is then grouped by neighborhood and, finally, the four indices are calculated for each neighborhood. Table 1 describes the four calculated indices.

Table 1.
The four indices measuring the increase in employment rates and educational attainment.
The four indices, being all percentage values, are already expressed in normalized form in the interval [0, 1]. The Formula (9) is used to calculate the corresponding symptoms. Then, the two 4 × 4 fuzzy relations R and the GEFS and SEFS Ap and Bq are calculated.
The method was implemented on the Tool GIS ESRI ArcGIS Pro 3.5. For each symptom are built thematics maps showing its spatial distribution on the city.
In next section the results of the test are discussed; the effectiveness of the local policies on each symptom and the thematic maps representing the spatial distribution of each symptom are shown.
4. Results and Discussion
After calculating the four symptoms by (9) the two fuzzy relations R and S are built by (8) and (11), respectively.
The fuzzy relation R obtained is shown in Table 2.
Table 2.
The 4 × 4 fuzzy relation R obtained.
The GEFS of R is obtained after p = 2 iterations: it is given by:
A2 = (0.867, 0.867, 0.800, 0.800)
The fuzzy relation S obtained is shown in Table 3.
Table 3.
The 4 · 4 fuzzy relation S obtained.
The SEFS of S is obtained after q = 2 iterations: it is given by:
B2 = (0.067, 0.100, 0. 067, 0. 067)
In Table 4 the lower and upper bounds of the effectiveness of the local policies in the manifestation of each symptom are shown in promoting each of the four symptoms of growth in citizens’ well-being and quality of life.
Table 4.
Range of effectiveness and average effectiveness of the local policies.
The symptom most impacted by local policies is symptom x2, connected to the increase in the period investigated in the percentage of employable female residents aged 15 and over who are in employment. Symptom x1, which refers to the increase in the percentage of employed residents, is attributed an average effectiveness of 0.467, while both symptoms x3 and x4, which refer, respectively, to the increase in the percentage of residents with an academic qualification and to the increase in the percentage of residents with at least a primary school diploma, are attributed an average effectiveness of 0.433.
From these results, it can be deduced that the local policies implemented in the decade between 2011 and 2021 have on average produced an increase in citizens’ well-being and quality of life, impacting all four symptoms with a similar average effectiveness, slightly greater for the two symptoms related to employment than for those related to the possession of educational qualifications.
These results are consistent with those published by the municipality of Naples, which has seen employment rates rise over the decade thanks to the growth of commercial and restaurant activities and the surge in tourism. An additional contribution to the growth in employment and female employment over the decade was made by tax breaks offered by national governments to companies for hiring young people and female workers. The increase in educational attainment is more modest because, although the municipality has implemented policies to combat truancy over the past decade and, in agreement with the Campania region, has promoted incentives for university enrollment and attendance, in 2021 the school dropout rate remained at 0.40% for primary schools and 1.10% for lower secondary schools, which is higher than the national dropout rates.
In order to analyze the trend of each symptom in greater detail and examine its spatial distribution by neighborhood, thematic maps of the symptom values calculated by neighborhood were produced for each symptom.
Figure 3 shows the spatial distribution of symptom x1.
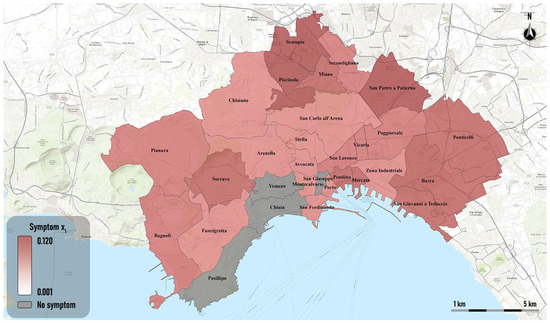
Figure 3.
Thematic map of the symptom x1.
The map shows that the highest growth in the percentage of employed residents was recorded in the peripheral neighborhoods of the eastern part of the city (Ponticelli, Barra, San Giovanni a Teduccio) and in the peripheral neighborhoods of the northern part (Piscinola, Scampia, San Pietro a Patierno). Conversely, no employment growth was recorded in the wealthier neighborhoods, such as Posillipo, Chiaia, and Vomero.
Symptom x2 shows a similar spatial trend (Figure 4). The percentage of employed women shows a more marked growth in the peripheral neighborhoods of the eastern and northern areas of the city, as well as in the two peripheral neighborhoods of the western area, Pianura and Soccavo. In the two wealthy neighborhoods Posillipo and Chiaia and in the historic center neighborhood San Giuseppe, no growth in employed women was recorded.
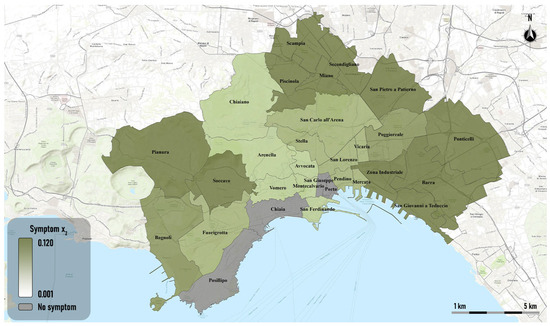
Figure 4.
Thematic map of symptom x2.
The thematic map of female employment growth shown in Figure 4 highlights that, overall, local and government incentive policies and the growth of commercial and tourism activities have generated an increase in the female employment rate, especially in the city’s peripheral neighborhoods. This growth was not limited to the wealthier neighborhoods, where female employment levels were already quite high in 2011.
Figure 5 shows the spatial trend of the x3 symptom. The percentage of graduates increased more significantly in some peripheral neighborhoods, such as the eastern neighborhoods Ponticelli and San Pietro a Patierno, the northern neighborhoods Scampia and Miano, and the western neighborhood Soccavo. Furthermore, this symptom showed no growth in the wealthy neighborhoods Posillipo, Chiaia e Vomero and in the historic center neighborhood San Giuseppe.
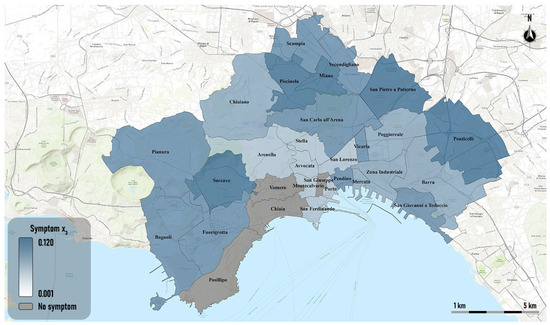
Figure 5.
Thematic map of symptom x3.
The greater growth in the percentage of university graduates recorded in the northeast and eastern neighborhoods of the city is certainly driven not only by policies encouraging university enrollment, such as tuition fee relief and tuition for young people from low-income families, but also by the strengthening of the urban rail and bus network for access to university campuses over the past decade.
As with the distribution of female employment growth, the growth in the percentage of university graduates was not seen in the wealthiest neighborhoods, as this percentage was already high in 2011.
The spatial trend of symptom x4 is shown in Figure 6. The only neighborhoods where significant growth in the percentage of residents with at least a primary school diploma was recorded were the eastern peripheral neighborhoods of San Giovanni a Teduccio, San Pietro a Patierno, and Ponticelli, and the northern neighborhoods Scampia and Miano.
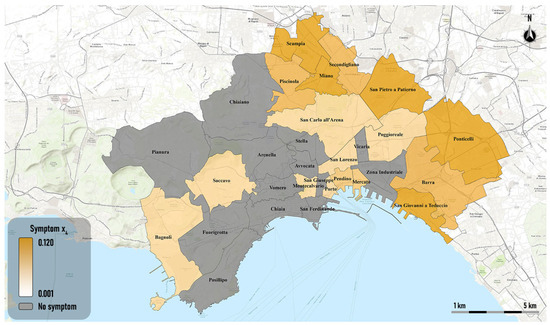
Figure 6.
Thematic map of the symptom x4.
Unlike the other three symptoms, several neighborhoods did not record any increase in residents with at least a primary school education; these include the central neighborhoods of the city and the western neighborhoods Fuorigrotta, Pianura, and Chiaiano.
The fact that the most significant growth in the percentage of residents with at least one educational attainment was recorded in the eastern and northeast peripheral neighborhoods of the city is likely due to the fight against school dropouts conducted over the last decade, especially in these neighborhoods, where school dropout rates were high. In the city center neighborhoods and in most western neighborhoods, this symptom was not observed because there were no significant dropout rates in these neighborhoods in 2011.
In a nutshell, between 2011 and 2021, local policies in Naples produced an increase in employment levels and educational attainment among residents. On average, these policies were slightly more effective in increasing employment levels and female employment than in raising the percentage of graduates and residents with at least an elementary school diploma.
The areas of the city where the greatest growth in employment levels and educational attainment were observed are in the eastern and northern outskirts.
No significant signs of growth in employment rates or educational levels were recorded in the historic center. This may be due, in addition to the fact that, as early as 2011, a significant percentage of employed and educated residents were recorded in affluent neighborhoods and the historic center, to the lack of residential construction and development in these neighborhoods. Since the end of the last century, residents have been migrating to the city’s outskirts and neighboring municipalities.
The model’s main criticism is its limitation to census data for symptom determination. Using more detailed data would increase the accuracy of the results. However, obtaining them would be very costly and would not guarantee the model’s portability across different urban contexts.
5. Conclusions
This research proposes a method of evaluating the effectiveness, over time, of local actions and policies on the well-being of urban settlement residents. The method is based on GEFS and SEFS fuzzy relations and was implemented on a GIS-based platform in which the urban settlement is divided into subzones. Unlike previous GEFS- and SEFS-based work, the proposed method is independent of subjective assessments when calculating the components of fuzzy relations. Furthermore, it enhances the evaluation of the effectiveness of local actions by generating thematic maps that facilitate the analysis of the spatial distribution of each symptom within each subzone. This enables decision makers to assess the effectiveness of local policies in producing each symptom of citizen well-being in different subzones, and to identify subzones where this symptom has not been observed.
The framework was used to evaluate the effectiveness of local policies implemented in Naples, Italy, between 2011 and 2021 in increasing employment rates, female employment and educational attainment. The subzones consist of the city’s thirty neighborhoods.
The results show that local policies produced an overall increase in well-being symptoms, with slightly greater increases in symptoms related to employment and female employment levels. This increase was more significant on the city’s outskirts, while it was found to be insignificant or non-existent in the historic center.
This framework could be a valuable tool for supporting decision makers in evaluating the effectiveness of local actions and policies in improving citizens’ well-being.
In future, we intend to generalize the model to provide more comprehensive assessments of the effectiveness of local policies in improving citizens’ well-being by considering a wide range of symptoms of both well-being and ill-being. In this perspective, fast algorithms will be tested for calculating GEFS and SEFS, even for fuzzy relations with high cardinality.
Author Contributions
Conceptualization, B.C. and F.D.M.; methodology, B.C. and F.D.M.; software, B.C. and F.D.M.; validation, B.C. and F.D.M.; formal analysis, B.C. and F.D.M.; investigation, B.C. and F.D.M.; resources, B.C. and F.D.M.; data curation, B.C. and F.D.M.; writing—original draft preparation, B.C. and F.D.M.; writing—review and editing, B.C. and F.D.M.; visualization, B.C. and F.D.M.; supervision, B.C. and F.D.M.; project administration, B.C. and F.D.M. All authors have read and agreed to the published version of the manuscript.
Funding
This research received no external funding.
Data Availability Statement
The data presented in this study and the source code created to implement the proposed method are available on request from the corresponding author.
Conflicts of Interest
The authors declare no conflicts of interest.
References
- Sanchez, E. Resolution of eigen fuzzy sets equation. Fuzzy Sets Syst. 1978, 1, 69–74. [Google Scholar] [CrossRef]
- Sanchez, E. Eigen fuzzy sets and fuzzy relations. J. Math. Anal. Appl. 1981, 81, 399–421. [Google Scholar] [CrossRef]
- Wagenknecht, M.; Hartmann, K. On the construction of fuzzy eigen solutions in given regions. Fuzzy Sets Syst. 1986, 20, 55–65. [Google Scholar] [CrossRef]
- Bourke, M.M.; Grant Fisher, D. Convergence, eigen fuzzy sets and stability analysis of relation matrices. Fuzzy Sets Syst. 1996, 81, 227–234. [Google Scholar] [CrossRef]
- Li, P.; Fang, S.-C. A survey on fuzzy relational equations, part I: Classification and solvability. Fuzzy Optim. Decis. Mak. 2009, 8, 179–229. [Google Scholar] [CrossRef]
- Nobuhara, H.; Hirota, K. Eigen fuzzy sets of various compositions and their application to image analysis. In Proceedings of the Seventh World Multi Conference on Systemics, Cybernetics and Informatics SCI’2003, Orlando, FL, USA, 27–30 July 2003. CD Proceedings. [Google Scholar]
- Nobuhara, H.; Hirota, K. A solution for eigen fuzzy sets of adjoint max-min decomposition and its application to image analysis. In Proceedings of the IEEE International Symposium on Intelligent Signal Processing, 2003, Budapest, Hungary, 6 September 2003; pp. 27–30. [Google Scholar]
- Nobuhara, H.; Hirota, K.; Bede, B. Generation of various eigen fuzzy sets by permutation fuzzy matrix and its application to image analysis. In Proceedings of the 2004 IEEE International Conference on Fuzzy Systems, Budapest, Hungary, 25–29 July 2004; pp. 1715–1719. [Google Scholar]
- Di Martino, F.; Nobuhara, H.; Sessa, S. Eigen fuzzy sets and image information retrieval. In Proceedings of the 2004 IEEE International Conference on Fuzzy Systems, Budapest, Hungary, 25–29 July 2004; pp. 1285–1390. [Google Scholar] [CrossRef]
- Di Martino, F.; Nobuhara, H.; Sessa, S. Eigen fuzzy sets and image information retrieval. In Handbook of Granular Computing; Pedrycz, W., Skowron, A., Kreinovich, V., Eds.; Wiley: New York, NY, USA, 2008; pp. 863–872. ISBN 9780470035542. [Google Scholar]
- Nobuhara, H.; Bede, B.; Hirota, K. On various eigen fuzzy sets and their application to image reconstruction. Inf. Sci. 2006, 176, 2988–3010. [Google Scholar] [CrossRef]
- Nobuhara, H.; Iyoda, E.M.; Bede, B.; Hirota, K. A solution for generalized eigen fuzzy sets equations by genetic algorithms and its application to image analysis. In Proceedings of the 2nd International IEEE Conference on ‘Intelligent Systems’, Proceedings (IEEE Cat. No.04EX791), Varna, Bulgaria, 22–24 June 2004; Volume 1, pp. 208–212. [Google Scholar] [CrossRef]
- Di Martino, F.; Sessa, S. A genetic algorithm based on eigen fuzzy sets for image reconstruction. In Applications of Fuzzy Sets Theory; Lecture Notes in Computer Science; Masulli, F., Mitra, S., Pasi, G., Eds.; Springer: Berlin/Heidelberg, Germany, 2007; Volume 4578, pp. 342–348. [Google Scholar] [CrossRef]
- Di Martino, F.; Sessa, S. A Novel Image Similarity Measure Based on Greatest and Smallest Eigen Fuzzy Sets. Symmetry 2023, 15, 1104. [Google Scholar] [CrossRef]
- Gerstenkorn, T.; Rakus, E. An application of fuzzy set theory to differentiating the effectiveness of drugs in treatment of inflammation of genital organs. Fuzzy Sets Syst. 1994, 68, 327–333. [Google Scholar] [CrossRef]
- Rakus-Andersson, E. An application of fuzzy numbers in eigen fuzzy set problem to differentiating the effectiveness of drugs. In Proceedings of the International Conference on Fuzzy Information Processing: Theories and Applications, Beijing, China, 1–4 March 2003; Springer: Berlin/Heidelberg, Germany, 2003; pp. 85–90. [Google Scholar]
- Rakus-Andersson, E. The greatest and the least eigen fuzzy sets in evaluation of the drug effectiveness levels. In Artificial Intelligence and Soft Computing—ICAISC 2006; Lecture Notes in Computer Science; Rutkowski, L., Tadeusiewicz, R., Zadeh, L.A., Żurada, J.M., Eds.; Springer: Berlin/Heidelberg, Germany, 2006; Volume 402. [Google Scholar] [CrossRef]
- Rakus-Andersson, E. Fuzzy and rough techniques in medical diagnosis and medication. In Studies in Fuzziness and Soft Computing; Springer: Berlin/Heidelberg, Germany, 2007; Volume 212, ISBN 103540497072. [Google Scholar]
- Mahmood, T.; Ullah, K.; Khan, Q.; Jan, N. An approach toward decision-making and medical diagnosis problems using the concept of spherical fuzzy sets. Neural Comput. Appl. 2019, 31, 7041–7053. [Google Scholar] [CrossRef]
- Guleria, A.; Bajaj, R.K. Eigen spherical fuzzy sets and its application in decision making problem, Scientia Iranica. Sci. Iran. 2019, 28, 516–531. [Google Scholar] [CrossRef]
- Di Martino, F.; Sessa, S. Eigen Fuzzy Sets and their Application to Evaluate the Effectiveness of Actions in Decision Problems. Mathematics 2020, 8, 1999. [Google Scholar] [CrossRef]
Disclaimer/Publisher’s Note: The statements, opinions and data contained in all publications are solely those of the individual author(s) and contributor(s) and not of MDPI and/or the editor(s). MDPI and/or the editor(s) disclaim responsibility for any injury to people or property resulting from any ideas, methods, instructions or products referred to in the content. |
© 2025 by the authors. Licensee MDPI, Basel, Switzerland. This article is an open access article distributed under the terms and conditions of the Creative Commons Attribution (CC BY) license (https://creativecommons.org/licenses/by/4.0/).