Article

3D Laser Point Cloud-Based Identification of Lining Defects in Symmetric Tunnel Structures

1
College of Civil Engineering and Architecture, Zhejiang University, Hangzhou 310058, China
2
Zhejiang Communications Investment Expressway Operation Management Co., Ltd., Hangzhou 310020, China
3
State Key Laboratory of Coastal and Offshore Engineering, Dalian University of Technology, Dalian 116081, China
*
Author to whom correspondence should be addressed.
Symmetry 2025, 17(11), 1822; https://doi.org/10.3390/sym17111822
Submission received: 20 September 2025 / Revised: 20 October 2025 / Accepted: 23 October 2025 / Published: 29 October 2025
(This article belongs to the Section Engineering and Materials)

Abstract

Tunnels, as symmetric structures, are critical components of transportation infrastructure, particularly in mountainous regions. However, tunnel linings are prone to spalling after long-term service, posing significant safety risks. Although 3D laser scanning enables remote measurement of tunnel linings, existing surface fitting methods face challenges such as insufficient accuracy and high computational cost in quantifying spalling parameters. To address these issues, this study leverages the symmetrical geometry of tunnels to propose a curvature variance-based threshold segmentation method using limited point cloud data. First, the tunnel center axis is accurately determined via Sequential Quadratic Programming and the Quasi-Newton method. Noise and outliers are then removed based on geometric properties. Triangular meshes are constructed, and curvature variance is used as a threshold to extract spalling regions. Finally, surface reconstruction is applied to quantify spalling extent. Experiments in both laboratory and fire-damaged tunnel environments demonstrate that the method accurately extracts and quantifies lining spalling, with an average error of approximately 9.70%. This study underscores the potential of the proposed approach for broad application in tunnel inspection, as it will provide a basis for assessing the structural safety of tunnel linings.

1. Introduction

Tunnels are typical symmetrical structures of concrete. Highway infrastructure has experienced significant development in recent decades, with tunnel construction playing a crucial role in improving transportation across mountainous regions [1,2]. However, during long-term service, tunnel linings are inevitably subject to defects caused by factors such as rainfall-induced leakage, fire events, and vehicular impacts [3,4]. These defects, such as spalling and surface concrete detachment, pose serious risks to traffic safety and can undermine the structural symmetry integrity of tunnels by reducing their load-bearing capacity, potentially leading to lining collapse and severe engineering failures [5,6,7]. In addition, such defects can decrease the thickness of the protective concrete cover over reinforcement and alter the overall cross-sectional geometry of the lining. Therefore, accurate defect measurement is essential for reliably evaluating the residual load capacity of a tunnel [8,9]. Precise identification of lining defects is thus a critical task in the structural health assessment of tunnels during operation [10,11].
Currently, tunnel defect identification primarily relies on manual inspection, where visual observations are used to detect defects and document their size and location [12]. However, this approach is time-consuming, highly susceptible to environmental conditions, and often fails to meet the accuracy requirements of modern tunnel assessment standards. Machine vision technology has emerged as a promising approach for detecting concrete defects. The automated detection process improves accuracy and reduces human error, offering significant advantages over traditional inspection methods [13]. Temporal fusion strategies have also been employed to integrate sequential image data, enabling more effective monitoring of concrete quality and the identification of defects [14]. In addition, computer vision algorithms have been used to automatically detect microstructural defects in concrete, enhancing the visualization of flaws that are often imperceptible to the human eye [15]. These algorithms have also been applied to monitor reinforced concrete structures, effectively identifying microcracks that may compromise structural integrity [16]. The integration of machine learning with computer vision further improves the accuracy and reliability of defect detection, reducing the human error typically associated with manual inspection [17]. Cha established a database that included 2366 images, which marked the crack of concrete, proposed the algorithm in the area of visual detection based on the Faster R-CNN algorithm, and proved the advantage of high speed and high robustness through the test of the database [18]. However, the complex lighting conditions within tunnels often result in uneven illumination and severe local overexposure in captured images, compromising measurement accuracy and limiting the effectiveness of machine vision technology in tunnel defect detection [19,20,21].
Compared to traditional machine vision methods, 3D laser scanning technology is unaffected by lighting conditions. It captures the geometric point cloud data of target objects through laser scanning and has demonstrated excellent performance in the field of non-destructive testing. Laser scanners, including Terrestrial Laser Scanners (TLSs) and LiDAR systems, can quickly and accurately acquire dense 3D point clouds that capture detailed surface geometry [22]. Alkadri et al. employed 3D laser scanning technology in the field of cultural heritage documentation and building performance assessment to investigate surface fractures and material behaviors of heritage structures [23]. Fujita et al. applied 3D laser scanning technology to acquire and attribute road surface point cloud data, enabling enhanced visualization and management for road maintenance [24]. Alkadri et al. employed 3D laser scanning technology to develop a computational workflow that analyzes point cloud data [25]. By integrating material property recognition with solar radiation simulation, it provides a comprehensive contextual analysis to support early-stage architectural design decisions. Furthermore, a defect detection method based on sparse scanning with laser ultrasonics has been validated for efficient online defect detection in additive manufacturing, capable of identifying internal and surface defects such as holes and cracks [26]. Laser scanning for defect detection has been explored across various domains. One prominent application lies in monitoring defects in composite materials. A novel 3D laser scanning approach has been developed for defect detection and measurement in automated fiber placement (AFP), utilizing laser profilometers to capture high-resolution point clouds [27]. Internal delamination defects in Carbon Fiber-Reinforced Polymer (CFRP) are detected using line laser scanning combined with infrared thermography, laying the groundwork for thermal methodologies in defect detection for advanced materials [28]. In structural health monitoring, Maru et al. highlighted the significance of LiDAR data for beam deflection monitoring via genetic algorithms, showcasing laser scanning’s potential in assessing structural condition changes [29]. Similarly, Liu et al. advanced defect identification through surface defect detection using broadband laser-generated Rayleigh waves, reflecting the evolving methodologies that leverage laser technology for precise material defect characterization [30]. In infrastructure assessment, Dai et al. introduced a workflow combining point cloud data with reflection intensity from laser scans for post-earthquake damage quantification, demonstrating the feasibility of laser scanning in real-time structural evaluations [31]. Additionally, Ham and Lee highlighted the efficiency of laser scanning in large-scale civil infrastructure safety diagnostics, positioning it as a superior alternative to traditional contact-type sensors due to its speed and accuracy [32]. However, no studies have yet applied 3D laser scanning technology to tunnel defect identification, especially in obtaining quantitative parameters such as the thickness and volume of lining spalling. These parameters are of great significance for the calculation of the residual bearing capacity of the lining components under the action of surrounding rock loads.
The 3D points, accumulated through TLSs and LiDAR, offer rich geometrical and spatial information. However, significant challenges associated with noise reduction, clustering, feature extraction, registration, and transformation of point clouds to usable models have spurred a variety of computational methodologies. Zheng et al. developed a 3D laser scanning-based method using maximum entropy analysis to monitor and predict overall tunnel deformation during construction [33]. One of the primary concerns in 3D point cloud data processing is noise reduction. Zhang proposed a markerless point cloud matching algorithm that utilizes 3D feature extraction, designed to mitigate errors arising from noisy data. Their study demonstrated the necessity of developing robust models due to the inherent inaccuracies of 3D scanners [34]. Furthermore, Yang et al. presented a technique for surface feature extraction using the Curvelet transform, which allows for effective analysis of geometrical attributes while managing the computational demands imposed by large datasets [35]. The clustering of point clouds is also of concern to researchers. Chen presented a new algorithm for 3D plane detection and segmentation, which realized accurate boundary detection on the uniform point cloud by adding the coplanar condition of segmentation [36]. Mineo proposed an algorithm of boundary detection in the 3D point cloud without setting thresholds [37]. There are a few results in point cloud data processing in the above studies, but stuck on clustering and boundary detection of point cloud data. Registration, which refers to aligning multiple point clouds into a common coordinate system, is another crucial aspect. Qi et al. innovatively employed volumetric and Multi-view Convolutional Neural Networks (CNNs) for classification tasks, pushing the boundaries of traditional alignment methods by enabling more sophisticated analyses that leverage volumetric representations of point clouds [38]. Tian et al. introduced a hybrid registration method using Principal Component Analysis (PCA) and the Iterative Closest Point (ICP) algorithm. This dual approach provides enhanced accuracy in aligning noisy point cloud data, particularly in complicated environments where point overlap is minimal [39]. In terms of practical applications, several studies illustrate the utility of point cloud data across disciplines. For instance, Li et al. explored the use of terrestrial laser scanning technology for the 3D reconstruction of ancient structures, detailing the data acquisition process, noise point removal, and the creation of usable 3D surface models [40]. Meanwhile, other studies have highlighted integration methodologies, such as those conducted by Lawani et al., which combined point cloud data with Building Information Modeling (BIM) to augment construction processes, facilitating a seamless transition from raw data to detailed structural models [41]. Moreover, advancements in machine learning have begun transforming point cloud data processing methodologies. Pl and Lakshmi’s study utilized CNNs to analyze LiDAR data for object classification. Their approach incorporated innovative features, showcasing the transition towards AI-assisted data processing approaches that enhance classification accuracy and speed [42]. Although the above research has yielded significant results in point cloud data processing, it primarily focuses on point cloud clustering and boundary detection. Due to the curved surface characteristics of tunnel linings, directly using the surface enclosed by the point cloud boundary for defect thickness and volume calculations results in substantial errors.
Recently, numerous researchers have conducted research on the fitting and reconstruction of missing regions in point clouds. Yang et al. proposed a novel surface reconstruction method using a new visibility model and dense visibility technique, which effectively preserves scene details while filtering noise and achieves state-of-the-art performance in accuracy and completeness [43]. Liu et al. developed a level-set-based continuous surface reconstruction method that accurately and robustly reconstructs patient surfaces from noisy and incomplete point clouds captured by a photogrammetry system, achieving submillimeter accuracy and faithfully preserving local geometric properties [44]. He et al. proposed a curvature-regularized variational model for implicit surface reconstruction from point clouds and developed efficient operator splitting and augmented Lagrangian methods, which demonstrated improved robustness against noise and better preservation of sharp features and concave regions compared to models without curvature constraints [45]. To achieve a sufficiently accurate reconstruction, these fitting techniques typically require point cloud data collected from a large area of the lining. This scanned region encompasses both the target regions and large intact regions, leading to prolonged computation time and hindering the efficiency of post-disaster safety assessments that must be completed before traffic resumption. Furthermore, these methods are designed for data loss caused by object occlusion during scanning, a scenario that does not apply to lining spalling.
To address this issue, this paper utilizes the symmetrical structural characteristics of tunnels to propose a point cloud spalling curve construction and defect extraction method based on curvature radius variance thresholds to effectively compute tunnel lining defect parameters. Mountain tunnels are structures characterized by small deformation, and their cross-sections are generally composed of symmetrical curves formed by three-centered or five-centered arcs. Therefore, the tunnel can be conceptualized as a structure with its alignment along the traffic direction and a generatrix formed by the cross-sectional curve. On the basis of the cross-sectional geometric features, the proposed method utilizes a limited set of points from the intact lining surface near the spalling area to reconstruct the spalling surface and extract the defect. First, several points are selected within the complete lining surface area to calculate their corresponding normal vectors. Using a sequence quadratic programming algorithm and the quasi-Newton method, the central axis of the cylindrical point cloud is determined. Next, the point cloud coordinate system is reconstructed using this axis as the polar axis, and interference points are removed using a polar radius threshold. The remaining point cloud is then subjected to triangulation, and defect points are extracted based on the curvature radius variance threshold between adjacent meshes. Finally, the dropped surface is reconstructed along the defect point cloud boundary to obtain defect depth, spalling area, and volume parameters. The effectiveness of the proposed method is evaluated using 27 damage conditions, a series of real tunnel experiments demonstrates the significant potential of this method for tunnel lining defects.

2. Methodology

2.1. Implementation Procedure

The tunnel cross-section consists of three-centered or five-centered circular curves, and each arc segment can be regarded as having a symmetrical shape. Consequently, there exists an axis in space such that every point on the corresponding arc is equidistant from this axis, thereby quickly reconstructing the spalled lining surface. In this study, a three-dimensional (3D) laser scanner is used to acquire the spatial coordinates of the tunnel lining. A subset of points is selected from the point cloud, and the normal vectors of the surface of these points are calculated. The central axis of the tunnel is determined using the Sequential Quadratic Programming (SQP) algorithm, followed by refinement via the quasi-Newton iterative method. Taking this axis as the polar axis, a new point cloud coordinate system is reconstructed. Outlier points are removed based on a radial distance threshold.
The remaining point cloud is subjected to triangulated meshing, and defective regions are extracted using the curvature radius variance threshold calculated between adjacent mesh elements. The boundary of the defective point cloud is then used to reconstruct the spalling surface, from which the spalling depth, area, and volume are calculated. The detailed procedure is outlined below:
  • Acquisition of Point Cloud
  • Input: Tunnel lining surface (physical reality).
  • Process: A 3D laser scanner is employed to obtain the spatial coordinates of the tunnel lining surface, generating the raw point cloud data.
  • Output: Raw point cloud P0 of the tunnel lining, which includes both intact surfaces and potential defect regions.
2.
Normal Vector Calculation
  • Input: Raw point cloud P0.
  • Process: A set of representative points is selected from the intact regions of P0. The ith surface normal vectors vi for these points are computed by performing Principal Component Analysis (PCA) on their local neighborhoods.
  • Output: A set of local surface normal vectors vi, which encode the local geometry of the intact lining.
3.
Tunnel Axis Determination
  • Input: The set of computed surface normal vectors vi.
  • Process: The axial direction vector u of the tunnel’s central axis is estimated using the Sequential Quadratic Programming (SQP) algorithm, optimizing for orthogonality between u and the normal vectors. The quasi-Newton method is then applied to iteratively refine the spatial position, determining the precise central axis vector w.
  • Output: The accurately determined central axis w of the tunnel.
4.
Coordinate System Reconstruction and Outlier Removal
  • Input: Raw point cloud P0 and the central axis w.
  • Process: The identified tunnel axis w is used as the polar axis to reconstruct the coordinate system. The distance (polar radius) from each point in P0 to this axis is calculated. A threshold based on the nominal tunnel radius is applied to filter out distant interference points (e.g., vehicle interference).
  • Output: Cleaned and axis-aligned point cloud P1.
5.
Mesh Construction and Defect Extraction
  • Input: Cleaned point cloud P1.
  • Process: A triangulated mesh is generated from the point cloud P1 to establish surface connectivity. The variance of the curvature radius between adjacent mesh elements is computed. A predefined variation threshold is applied to segment and extract regions with high curvature variance, which correspond to spalling defects.
  • Output: The segmented defective point cloud region P2.
6.
Surface Reconstruction and Quantitative Analysis:
  • Input: Defect point cloud P2 and the central axis w.
  • Process: The intact lining surface is reconstructed along the boundary of the defect region P2, based on the known tunnel radius derived from axis w. The spalling volume, area, and depth are then calculated by comparing the defective surface (from P2) and the reconstructed intact surface.
  • Output: Quantitative defect parameters: Spalling Depth, Area, and Volume.
A workflow diagram of the lining spalling defect measurement is illustrated in Figure 1.

2.2. Fundamental Principles

2.2.1. Estimation of Tunnel Central Axis

In the processing of point cloud data for tunnel spalling regions, the accurate extraction of the curvature characteristics of tunnel cross-sections is a critical step. This task fundamentally depends on the precise determination of the tunnel’s central axis. Therefore, obtaining an accurate representation of the tunnel axis is essential for reliable defect analysis. Due to the symmetry of the tunnel structure, the distance from the tunnel axis to any point on the lining is theoretically identical. As a result, it is possible to calculate the equation defining the central axis using a small number of measured coordinates from the lining. The detailed algorithmic process is illustrated as follows.
From the scanned 3D point cloud P0, an arbitrary point p is selected. The Euclidean distances from all other points in the point cloud to the point p are computed, and k nearest points are identified to form a new local point cloud Q. Next, the centroid of the local point cloud Q is calculated, and its covariance matrix C is constructed. The formulas for computing the centroid and covariance matrix are given as follows:
  Q   =   p 1 , p 2 , , p k P 0 p ¯ = 1 k i = 1 k p i q i = p i p ¯ ,       i = 1 , 2 , k   H = q 1 q 2 q k C = 1 k 1 H T H
where pi is one of the points in the cloud Q, and C represents its covariance matrix. p - is the centroid of the point set in the domain. H is a centralized matrix.
By performing Singular Value Decomposition (SVD) on the covariance matrix C, its eigenvalues λ1, λ2, and λ3 are obtained, and λ1 < λ2 < λ3. The eigenvector corresponding to the smallest eigenvalue λ1 is regarded as the normal vector v of the local point cloud Q.
Using the method described above, n normal vectors can be obtained, which are then used to determine the direction vector of the tunnel’s central axis. In this study, based on the orthogonality between the normal vectors of selected tunnel lining points and the tunnel axis direction vector, the direction vector of the tunnel axis is optimized using the SQP algorithm [46]. Specifically, the optimization objective is to minimize the sum of dot product absolute values between the normal vectors of selected tunnel lining points and the direction vector of the tunnel axis. The solution formula enforces the orthogonality constraint.
Objective   f u n c t i o n :                               f u = i = 1 n u T v i
Constraint   c o n d i t i o n s :                                 u 2 = 1
where vi represents the normal vector of the selected points cloud on the tunnel lining, and u denotes the direction vector of the tunnel’s central axis. This method enables the effective estimation of the tunnel axis direction, thereby providing accurate geometric features for the subsequent precise determination of the tunnel’s central axis line. The straight line L can be established using the normal vector v and the coordinates of point p.
Given a set of lines Li and the direction vector u, find the L* parallel to u that minimizes the sum of distances to Li. To determine the precise central axis of the tunnel, a local coordinate system orthogonal to the estimated tunnel axis direction vector u is established. This coordinate system is defined by two unit normal vectors, l1 and l2, which are perpendicular to u. All points and their corresponding normal vectors are projected onto the local coordinate system defined by l1 and l2, resulting in a set of linear equations in the projected 2D plane.
l 1 = u × 1 , 0 , 0 T u × 1 , 0 , 0 T if u × 1 , 0 , 0 T > ε u × 0 , 1 , 0 T u × 0 , 1 , 0 T otherwise   l 2 = u × l 1 u × l 1
The straight line L is projected onto the coordinate system, so that p is projected onto the normal plane of u to obtain p, and v is projected onto the normal plane of u to obtain v.
T w o - d i m e n s i o n a l   point   c o o r d i n a t e s :                       e t = p l 1 p l 2
T w o - d i m e n s i o n a l   v e c t o r :                       ev = v l 1 v l 2
T w o - d i m e n s i o n a l   v e c t o r :                           f tp = i = 1 n ev tp e t i
where tp = [x,y]T corresponds to the three-dimensional point tq = xl1 + yl2. n represents the number of straight lines in the projection
The objective function is defined to find a point in the local coordinate system such that the sum of Euclidean distances from this point to all projected lines is minimized. The quasi-Newton method is employed to accurately determine the optimal value, then mapped back into three-dimensional space to obtain its spatial coordinates [47]. Based on the tunnel axis direction vector u and point tq, the complete central axis w of the tunnel can be reconstructed. This provides robust geometric features that facilitate the removal of noise points in the tunnel point cloud and the extraction of spalling areas in the tunnel lining.

2.2.2. Removal of Outlier Points

Due to the relatively long duration of tunnel scanning, uncontrollable factors such as passing vehicles during the scanning process can introduce outlier points in the resulting point cloud. Therefore, it is necessary to eliminate these outliers. First, a coordinate transformation is performed using the tunnel central axis determined in Section 2.2.1, where the direction vector of the tunnel is denoted as w = [wx,wy,wz]. Based on this direction vector, a rotation matrix is constructed [48]. Specifically, the point cloud is translated and rotated so that the center axis ww coincides with the X-axis. To achieve this, with point tq as the origin, translate the coordinates of point cloud P0 to obtain point cloud P0.
p i x x t p , y y t p , z z t p P 0
Using the X-axis and vector w, the rotation axis and rotation angle can be calculated, and the rotation matrix can be derived. The related formulas are as follows:
w ini = w / w ,   x = 1 , 0 , 0
Rotation   a x i s :                                           k = w ini × x
Rotation   a n g l e :                                           α = cos 1 w ini x
We convert the rotation axis to a skew-symmetric matrix:
K = 0 k z k y k z 0 k x k y k x 0
Then, the rotation matrix can be expressed as follows:
R = I + sin α K + ( 1 cos α ) K 2       = w x w z sin α + w y 1 cos α w y sin α + w z 1 cos α w y cos α + w z 2 1 cos α w y w z 1 cos α w z w y w z 1 cos α cos α + w y 2 1 cos α
The coordinate transformation for the three-dimensional point cloud is shown in the following equation:
P 0 * = R P 0
where P 0 * represents the coordinates of the three-dimensional point cloud after the rotation transformation.
Then, establish a cylindrical coordinate system with the X-axis as the cylindrical axis. The cylindrical coordinates of the points can be expressed as (ρ,θ,z). Since outlier points typically have a larger distance from the tunnel surface, the difference in radial distance can be used to segment the point cloud using thresholds, thereby removing the outlier points to obtain the point cloud P1. This process prepares the point cloud for the subsequent extraction of the spalling region’s lining.

2.2.3. Extraction of Lining Spalling

Accurately extracting the regions of tunnel lining spalling is a critical step in quantifying tunnel defects. Since the actual surface of a tunnel is not a perfect cylindrical shape, relying solely on radial distance makes it difficult to precisely extract the spalling areas. Therefore, this paper proposes a threshold segmentation method based on curvature variance to extract the spalling defect regions of tunnel linings. The specific steps are as follows:
(1) Sequential Labeling of Point Cloud Data: After removing interference points, the point cloud data are serialized and labeled in sequence, consistent with the scanning path of the 3D laser scanner.
(2) Distance Calculation and Column Boundary Detection: Starting from the first labeled point, the distance between this point and each subsequent point is calculated sequentially along the labeled direction. This process continues until the distance between two points significantly increases compared to the previous distances, indicating the boundary of the point column. By applying this method, all point columns can be identified. Furthermore, within each column, points with significant differences in spacing are identified and marked.
(3) Triangular Grid Formation: Starting from the first point, the sum of distances between this point and two adjacent points in the next column is calculated, and the two points corresponding to the minimum distance sum are selected. These three points together form a triangular mesh. The grid division for the remaining points follows a similar approach.
(4) Curvature Calculation and Variance Analysis: The curvature for each point in all the grids is calculated. The variance of the curvature within each grid is then computed, and the curvature variance is used as the threshold for identification. Points with large curvature variance are recorded. Additionally, for any three adjacent points within the same column of the point cloud, the curvature variance is calculated, and points with large curvature variance are also recorded.
(5) Threshold Segmentation and Boundary Extraction: Points with large curvature variance, identified through threshold segmentation, should be located at the boundary of the detached region of the tunnel. By adjusting the angle in polar coordinates, the extracted spalling region is made parallel to the tunnel’s directional vector. The Alphashape algorithm is then applied to extract the boundary of the spalling region, and the area of the spalling region is calculated accordingly. Based on the neutral axis defined in Section 2.2.1, the tunnel radius can be calculated, and the tunnel curvature can be determined. The surface of the tunnel can then be reconstructed based on the curvature, and the volume of the detached area can be calculated.
The processes of point cloud grid establishment and boundary identification are illustrated in Figure 2.
Based on the distance between two points, point clouds can be divided into multiple columns Ij,
I j = k + a j k b j ,
where Ij is the jth point column index set, aj is the starting index of the column, and bj is the end index of the column.
Then, the point cloud is divided into triangular meshes, and two adjacent columns of points can be represented as IA = {a1,a2,…,am} and IB = {b1,b2,…,bn}, respectively.
Δ 2 k 1 = a i i , a i i + 1 , b j j Δ 2 k = a i i + 1 , b j j , b j j + 1
where Δk is the kth triangle vertex index. ii is the index of IA, and jj is the index of IB.
The standard deviation of the curvature radius of the triangular mesh can be expressed as follows:
σ t = 1 3 i = 1 3 ρ t i ρ ¯ t 2   ,   ρ ¯ t = 1 3 i = 1 3 ρ t i
where ρti is the curvature radius of points on the triangular grid.
The calculation of the curvature radius variance of adjacent points on point columns is similar to Equation (17). The curvature radius variance threshold method can accurately capture minute changes in point clouds, thereby obtaining accurate point clouds at the location of spalling defects.

2.3. Evaluation Metrics

The effectiveness of the proposed method is evaluated using three main indicators: the thickness, area, and volume of the spalling region.
(1)
Thickness indicator
The thickness indicator of the spalling region is quantified by the radial distance difference in the polar coordinate system. The calculation formula is as follows:
h = ρ max ρ st
where h represents the thickness of the spalling region; ρmax and ρst represent the maximum radial distance and the spalling radius, respectively.
(2)
Area indicator
Connect the points at the edges of the spalling area in sequence to form a 3D closed shape. Due to the curvature of the tunnel lining, the 3D closed shape needs to be flattened along the polar coordinate direction angle to a 2D graph for accurate calculation of the spalling area. The area of the 2D graph can be calculated using the shoelace formula, which is as follows:
A = 1 2 i = 1 n u m e x i e y i + 1 e x i + 1 e y i
where A is the area of the spalling region; num is the number of points forming the 2D graph. (exi,eyi) represents the coordinates of the ith point.
(3)
Volume indicator
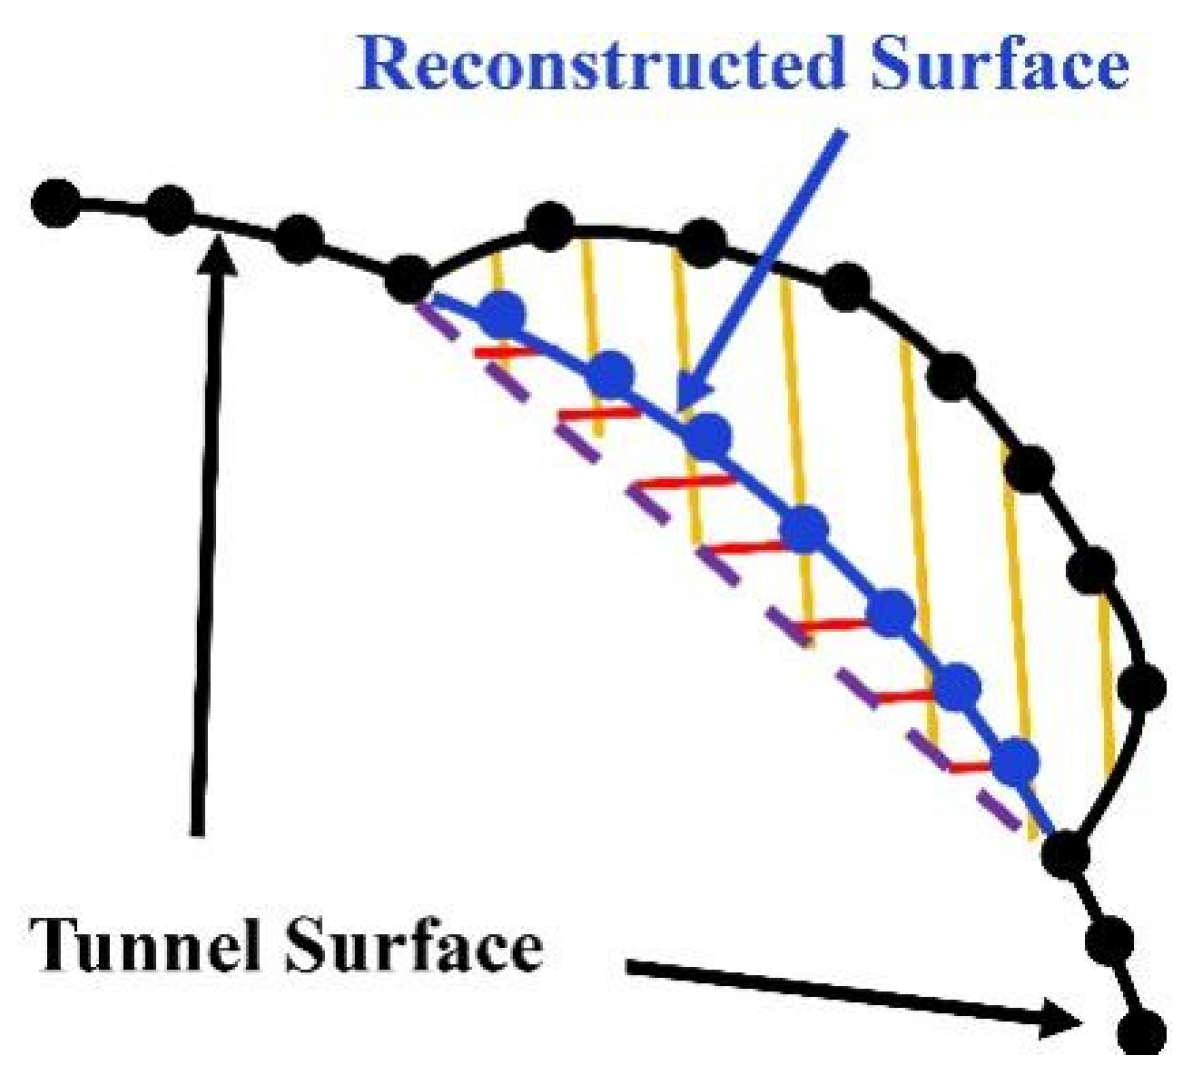
To calculate the volume of the spalling region in the concrete lining, this study performed point cloud completion on the spalling surface. In Figure 3, the black points represent the point cloud obtained from scanning, and the blue points represent the completed point cloud. The volume of the yellow area minus the volume of the red area gives the spalling volume indicator.

3. Evaluation of the Proposed Method in the Laboratory

3.1. Experiments in an Experimental Tunnel Environment

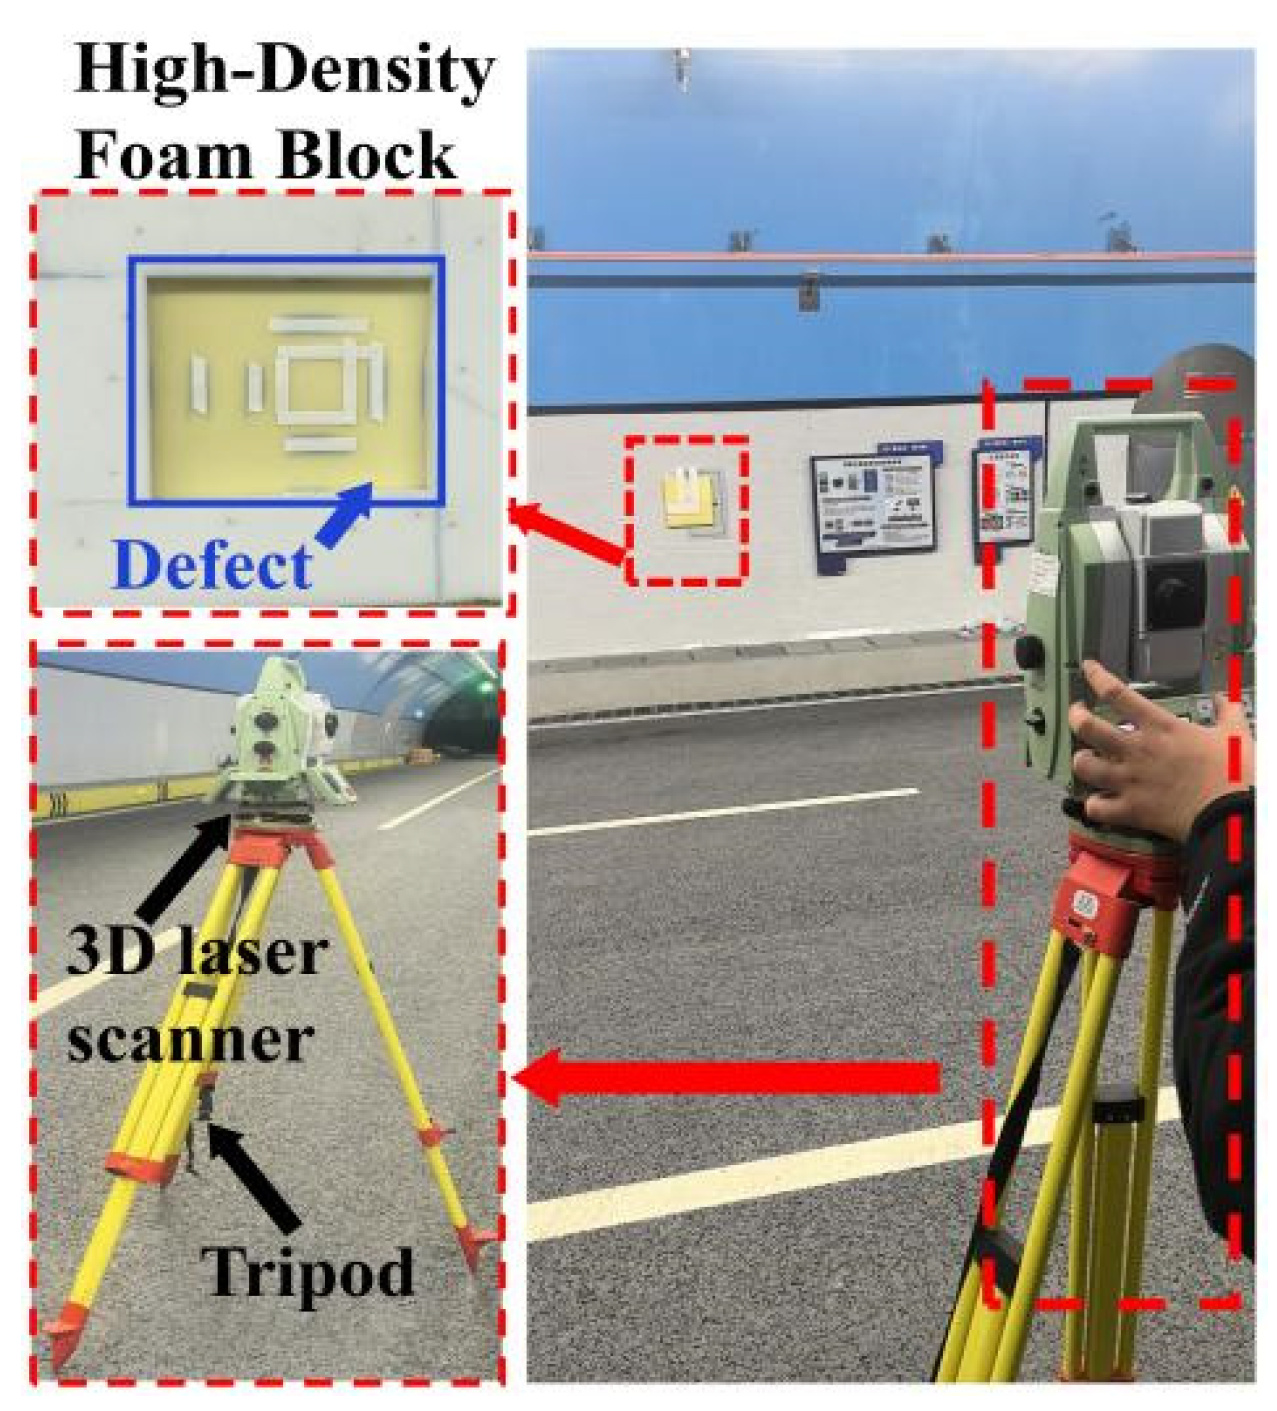
The method proposed in Section 2 is evaluated through experiments designed to identify artificial surface defects on the lining of a controlled experimental tunnel. To acquire point cloud data of the defects, 3D laser scanning is performed under conditions without vehicle interference, ensuring the accurate capture of defect morphology. The experimental setup consists of a 3D laser scanner (Leica Nova MS50, device from the Leica agent in Dalian, China) mounted on a tripod, as shown in Figure 4. Additionally, a central portion of the surface of high-density foam blocks is removed to simulate concrete lining defects. These foam blocks are adhesively bonded to the arc-shaped tunnel lining, which has a curvature radius of 560 m. The scanner is positioned at the same horizontal height as the simulated spalling defects on the foam blocks. In this paper, the proposed method is used to process point cloud data by running matlab version 2016a software.
Five distinct damage conditions are simulated by removing square sections of varying sizes from high-density foam blocks to validate the proposed method. These removed areas represent the surface defects defined in this study. The defect parameters extracted from the laser-generated point cloud vary according to the size of the removed square sections. Changes in these parameters can be used to assess the health condition of the tunnel lining.
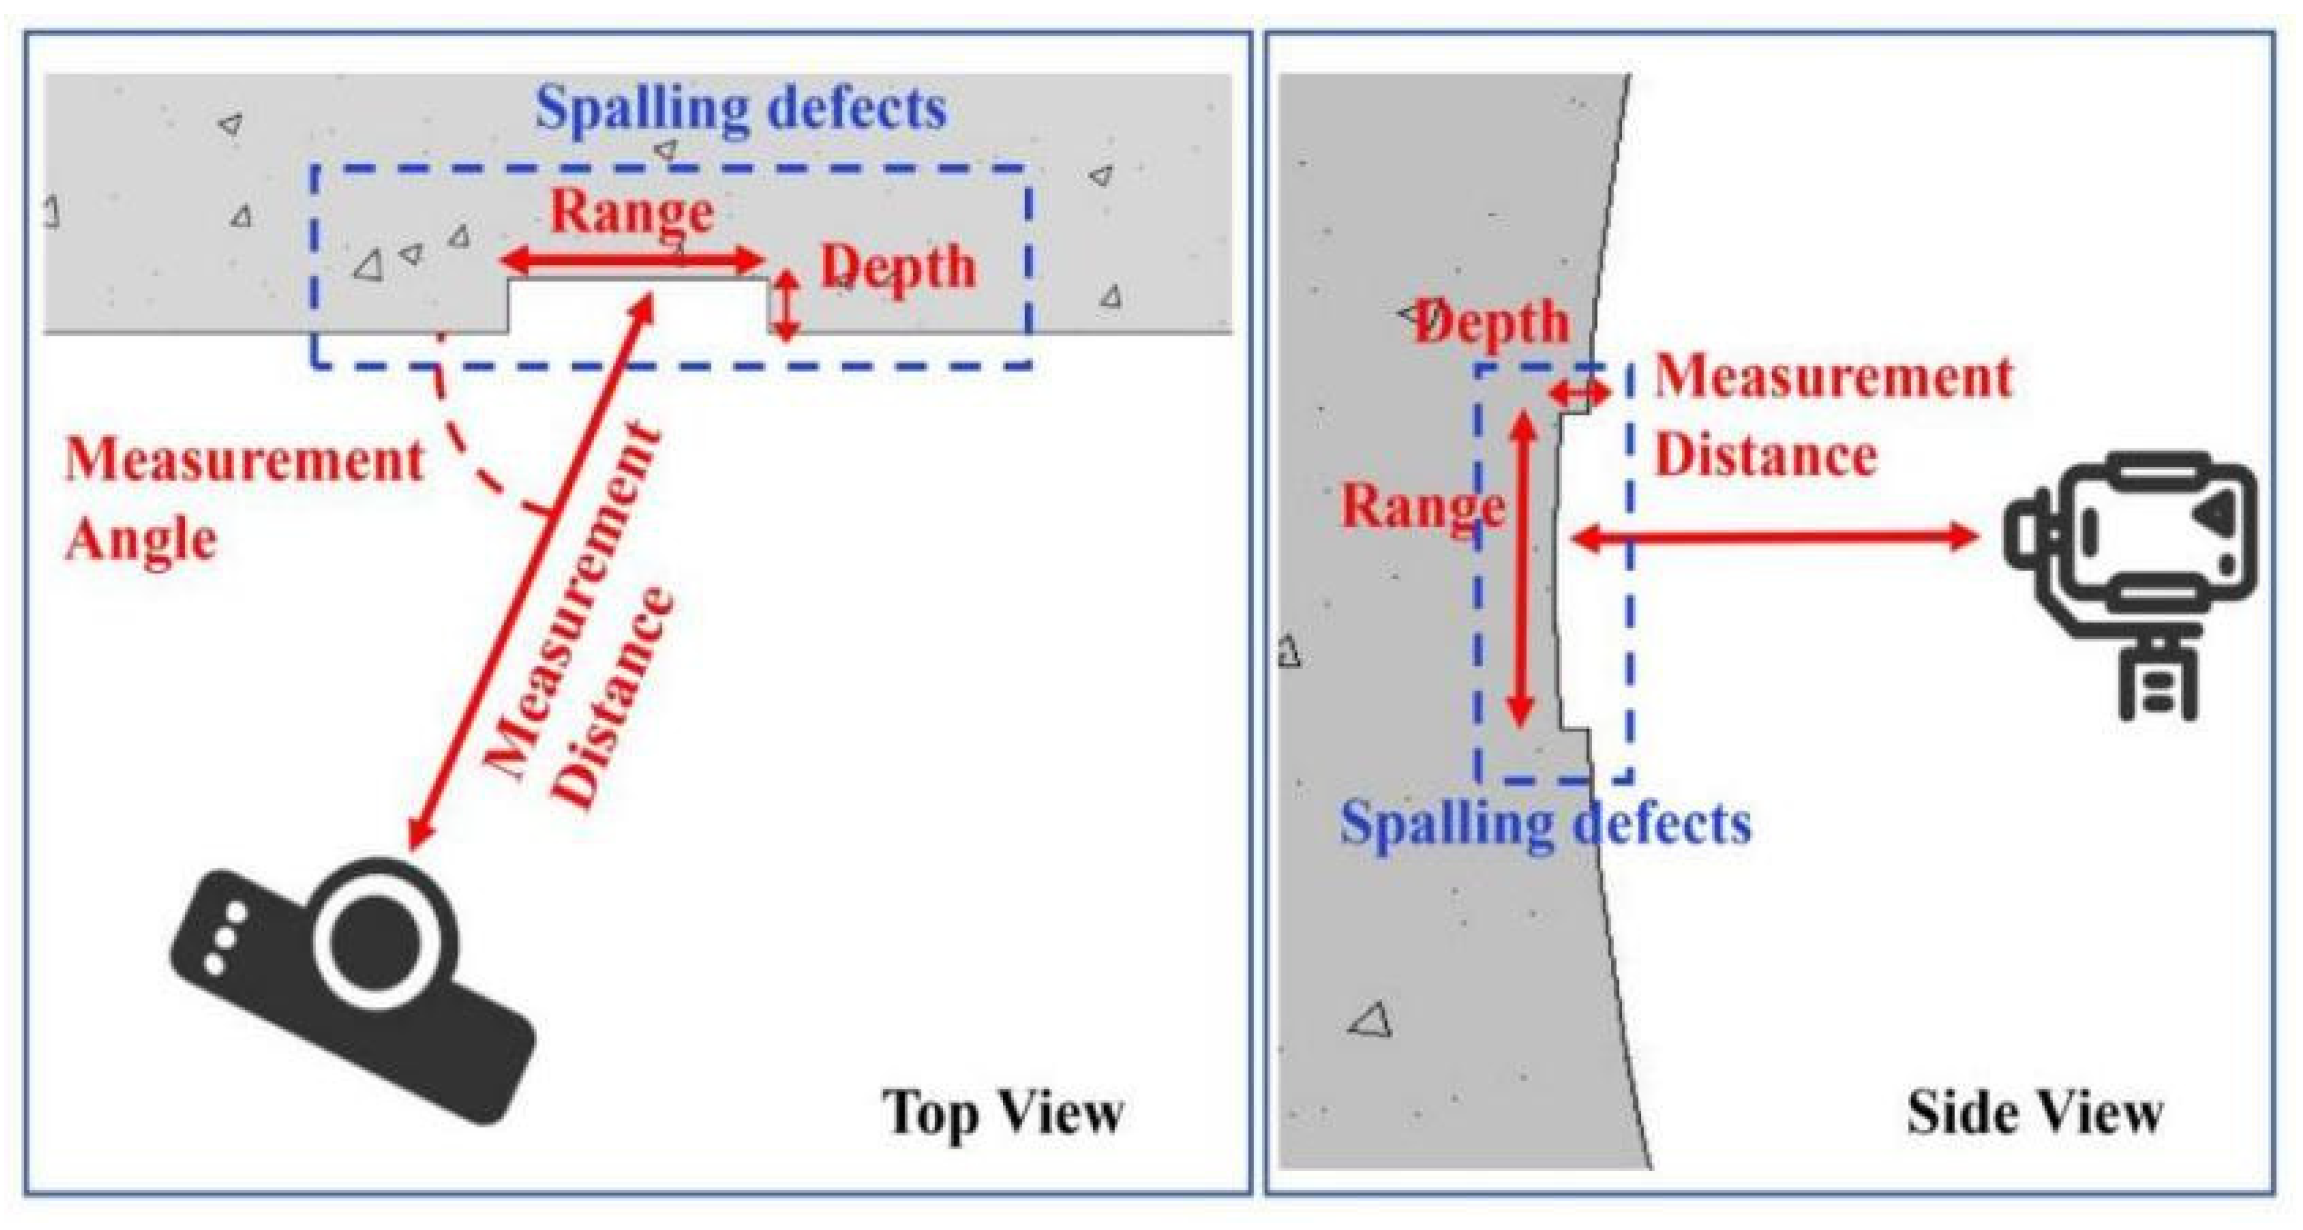
For each damage condition, the scanning frequency is set to 1000 points per second, and the scanning resolution is 0.002 mm. The experimental parameters are summarized in Table 1. This study evaluates the proposed method across different spalling ranges and depths, while also analyzing the impact of measurement distance and scanning angle on accuracy. A schematic diagram of the experimental setup is illustrated in Figure 5.

3.2. Point Cloud Processing in a Controlled Tunnel Environment

This section verifies the effectiveness of the proposed method through quantitative comparisons between computationally derived spalling defect parameters (including range and depth) and physical measurements under various conditions. To illustrate the complete processing workflow, detailed case studies are presented using point cloud data of Condition A3 in the representative scenarios.

3.2.1. Central Axis Calculation of the Tunnel

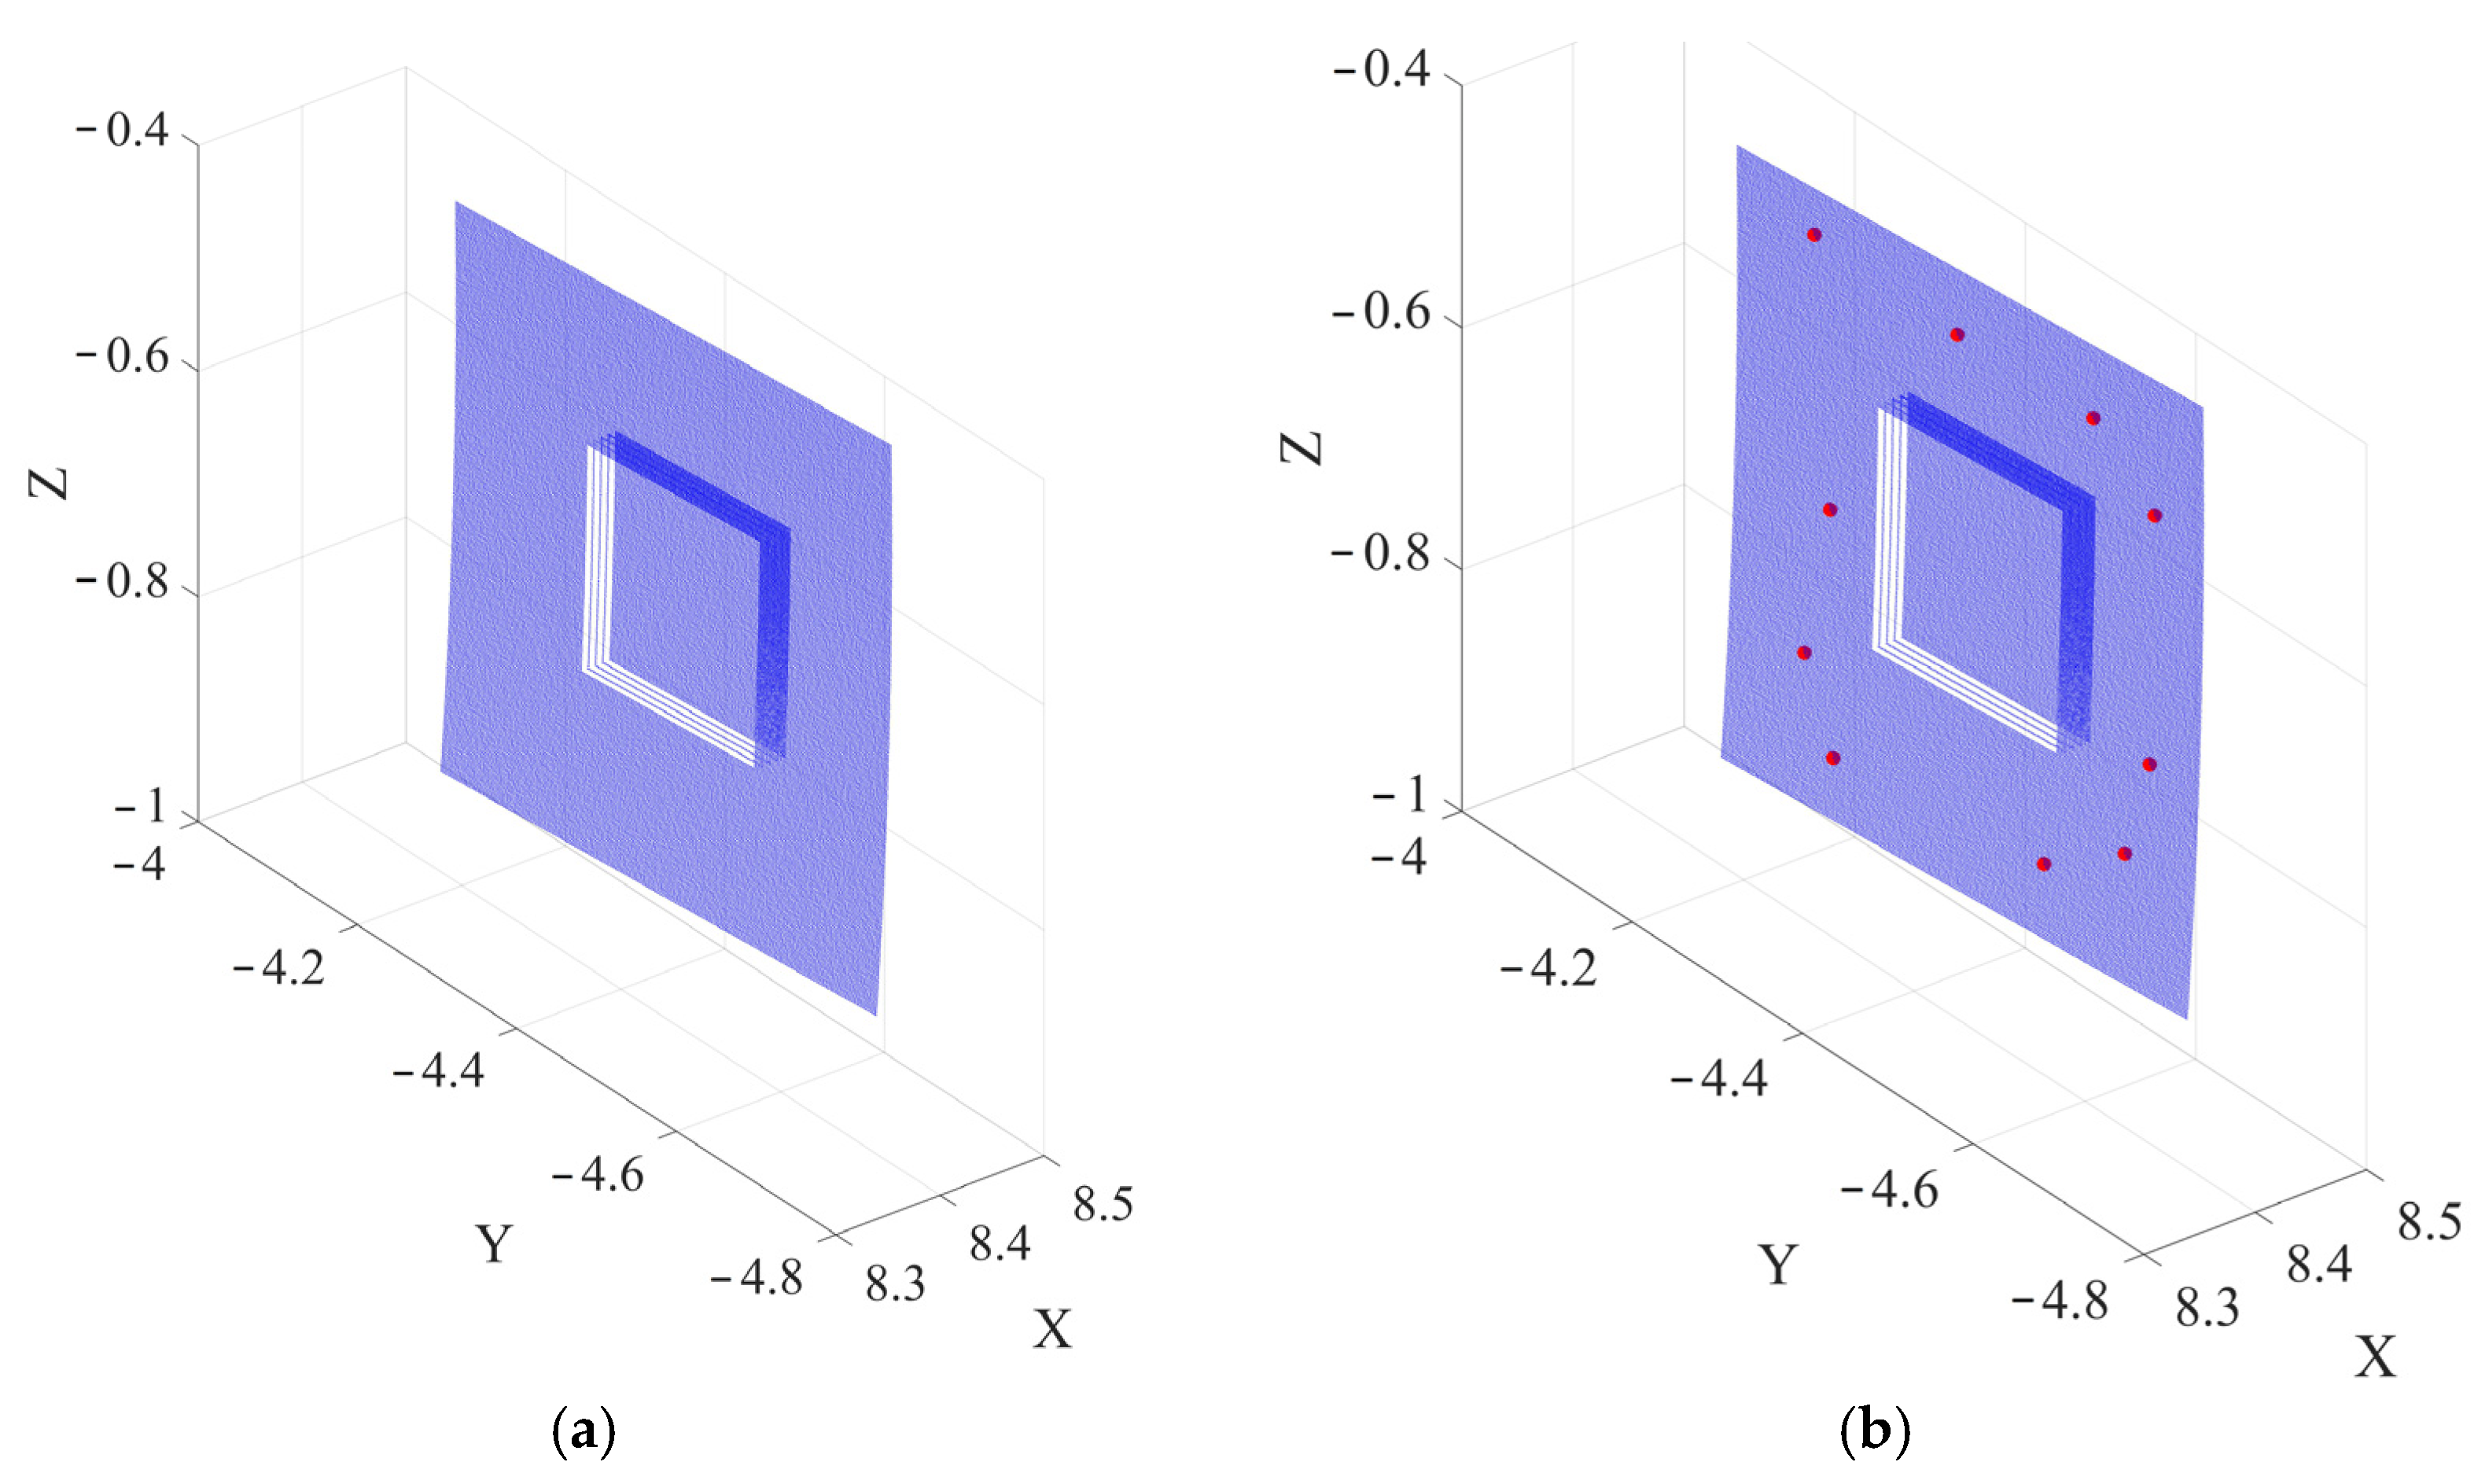
The point cloud data of the spalling defect area on the tunnel lining surface are obtained using a 3D laser scanner, as shown in Figure 6a. The figure reveals a cuboid concave region in the center of the point cloud, representing the lining spalling defect. Because the surrounding planar surface is nearly parallel to the scanner’s field of view, the point cloud in those areas appears relatively sparse. Moreover, the point cloud coordinates lack regularity in spatial distribution, making it difficult to directly extract defects—particularly irregularly shaped ones. Therefore, appropriate preprocessing of the point cloud is necessary to obtain accurate defect information.
Tunnel cross-sections are typically composed of multiple circular arcs and can be regarded as cylindrical structures extending along the lane direction. The central axis of this cylindrical tunnel can be computed using point cloud data from intact lining regions. In this study, ten points are selected from the undamaged area of the lining, as shown in Figure 6b, and their local normal vectors are calculated. These normal vectors serve as direction vectors for lines passing through their respective points, producing ten lines as illustrated by the red lines in Figure 6c. The green lines in Figure 6c represent the lines that are most nearly orthogonal to these ten red lines, which correspond to the estimated central axes of the tunnel.

3.2.2. Coordinate System Reconstruction and Mesh Generation

In this section, the point cloud is rotated and translated to reconstruct the coordinate system, aligning the tunnel’s central axis with the X-axis, as illustrated in Figure 6d. When the processed point cloud is viewed along the X-axis, the intact lining regions appear as an approximate single curve, as shown in Figure 6g. This observation confirms the cylindrical nature of the tunnel structure.
Transforming the Cartesian coordinate system into polar coordinates facilitates the direct calculation of spalling defect depth, defined as the distance from a given point to the central axis. For intact lining areas, this distance corresponds to the radius of the tunnel arc. However, while depth can be determined, the area and volume of the spalling defect remain unresolved. To address this, a triangular mesh is constructed on the point cloud to enable accurate local analysis, as shown in Figure 6e. This meshing process supports the subsequent extraction and quantification of the spalling defect area. Figure 6e shows that the meshes within the red frame and the meshes within the blue frame are derived from point clouds of the spalling defect area and the intact lining area, respectively. These two frames form two surfaces locally, indicating that there are local geometric deviations between the point cloud of the spalling defect area and the point cloud of the intact lining area. The application of triangular meshes can capture these subtle variations, enabling precise differentiation of point cloud regions within localized zones adjacent to spalling defect boundaries.

3.2.3. Defect Extraction and Surface Reconstruction

This study computes the variance of the curvature radius across point clouds within each triangular mesh, using a threshold value of 0.001 to identify meshes associated with spalling defects. The extracted spalling defect area is shown by the blue dots in Figure 6f. Due to surface spalling, the 3D laser scanner captures only interior point clouds in the defect areas. Consequently, reconstructing the missing surface portions of the point cloud is necessary to accurately calculate the spalling volume. Each interior point within the spalling region corresponds to a surface point. In the cylindrical coordinate system, these point pairs differ only in their radial coordinate, with the surface points’ radial coordinate equal to the lining radius. The reconstructed surface points are shown as red dots in Figure 6f.

3.3. Evaluation of Method Effectiveness

To evaluate the effectiveness of the proposed method, additional experiments are conducted under various spalling defect conditions, with details of each case provided in Table 1. Spalling depth is determined by calculating the difference between the maximum radial coordinate of interior points within the spalling region and the curvature radius of intact lining areas. The spalling surface is defined by both the boundary and surface points of the defect. To compute the spalling area, the surface is flattened along the cylindrical arc to eliminate curvature effects. The spalling volume is then obtained by calculating the enclosed volume between the interior points and their corresponding reconstructed surface points.
Comparison results for the area, volume, and depth parameters—derived from the proposed method and physical measurements—are presented in Table 2. In this table, “CV” denotes the calculated value, “MV” the measured value, and “ER” the associated error.
Analysis of Conditions A1 to B4 in Table 2 indicates that, at a measurement distance of 8 m and a measurement angle of 90°, the errors between calculated and measured values of depth, area, and volume parameters for spalling defects of varying sizes remain within 5%. This level of accuracy meets the requirements of typical engineering practice. Figure 1 and Figure 2 illustrate the effects of spalling defect range and depth on parameter estimation accuracy, respectively. As shown, the proposed method effectively captures the geometric characteristics of the defects.
A comparison between Conditions A3 and C1–C4 shows that variations in measurement distance have minimal impact on the accuracy of defect parameter acquisition under otherwise identical experimental conditions. Figure 3 demonstrates that high measurement accuracy is maintained even at a distance of 10 m, fulfilling engineering precision requirements.
In contrast, a comparative analysis of Conditions A3 and D1–D4 reveals that measurement angle has a pronounced effect on the calculated volume of spalling defects. Variations in angle introduce deviations in volume estimation, with the underlying mechanism illustrated in the schematic of Figure 5. Specifically, when the measurement angle deviates from 90°, occlusion by surface edges limits the scanner’s ability to capture interior point clouds, leading to incomplete data and volume underestimation. Therefore, when performing 3D laser point cloud scanning, the center line of the device should be kept as close as possible to the center line of the spalling surface.

4. Case Study on Actual Operating Tunnel

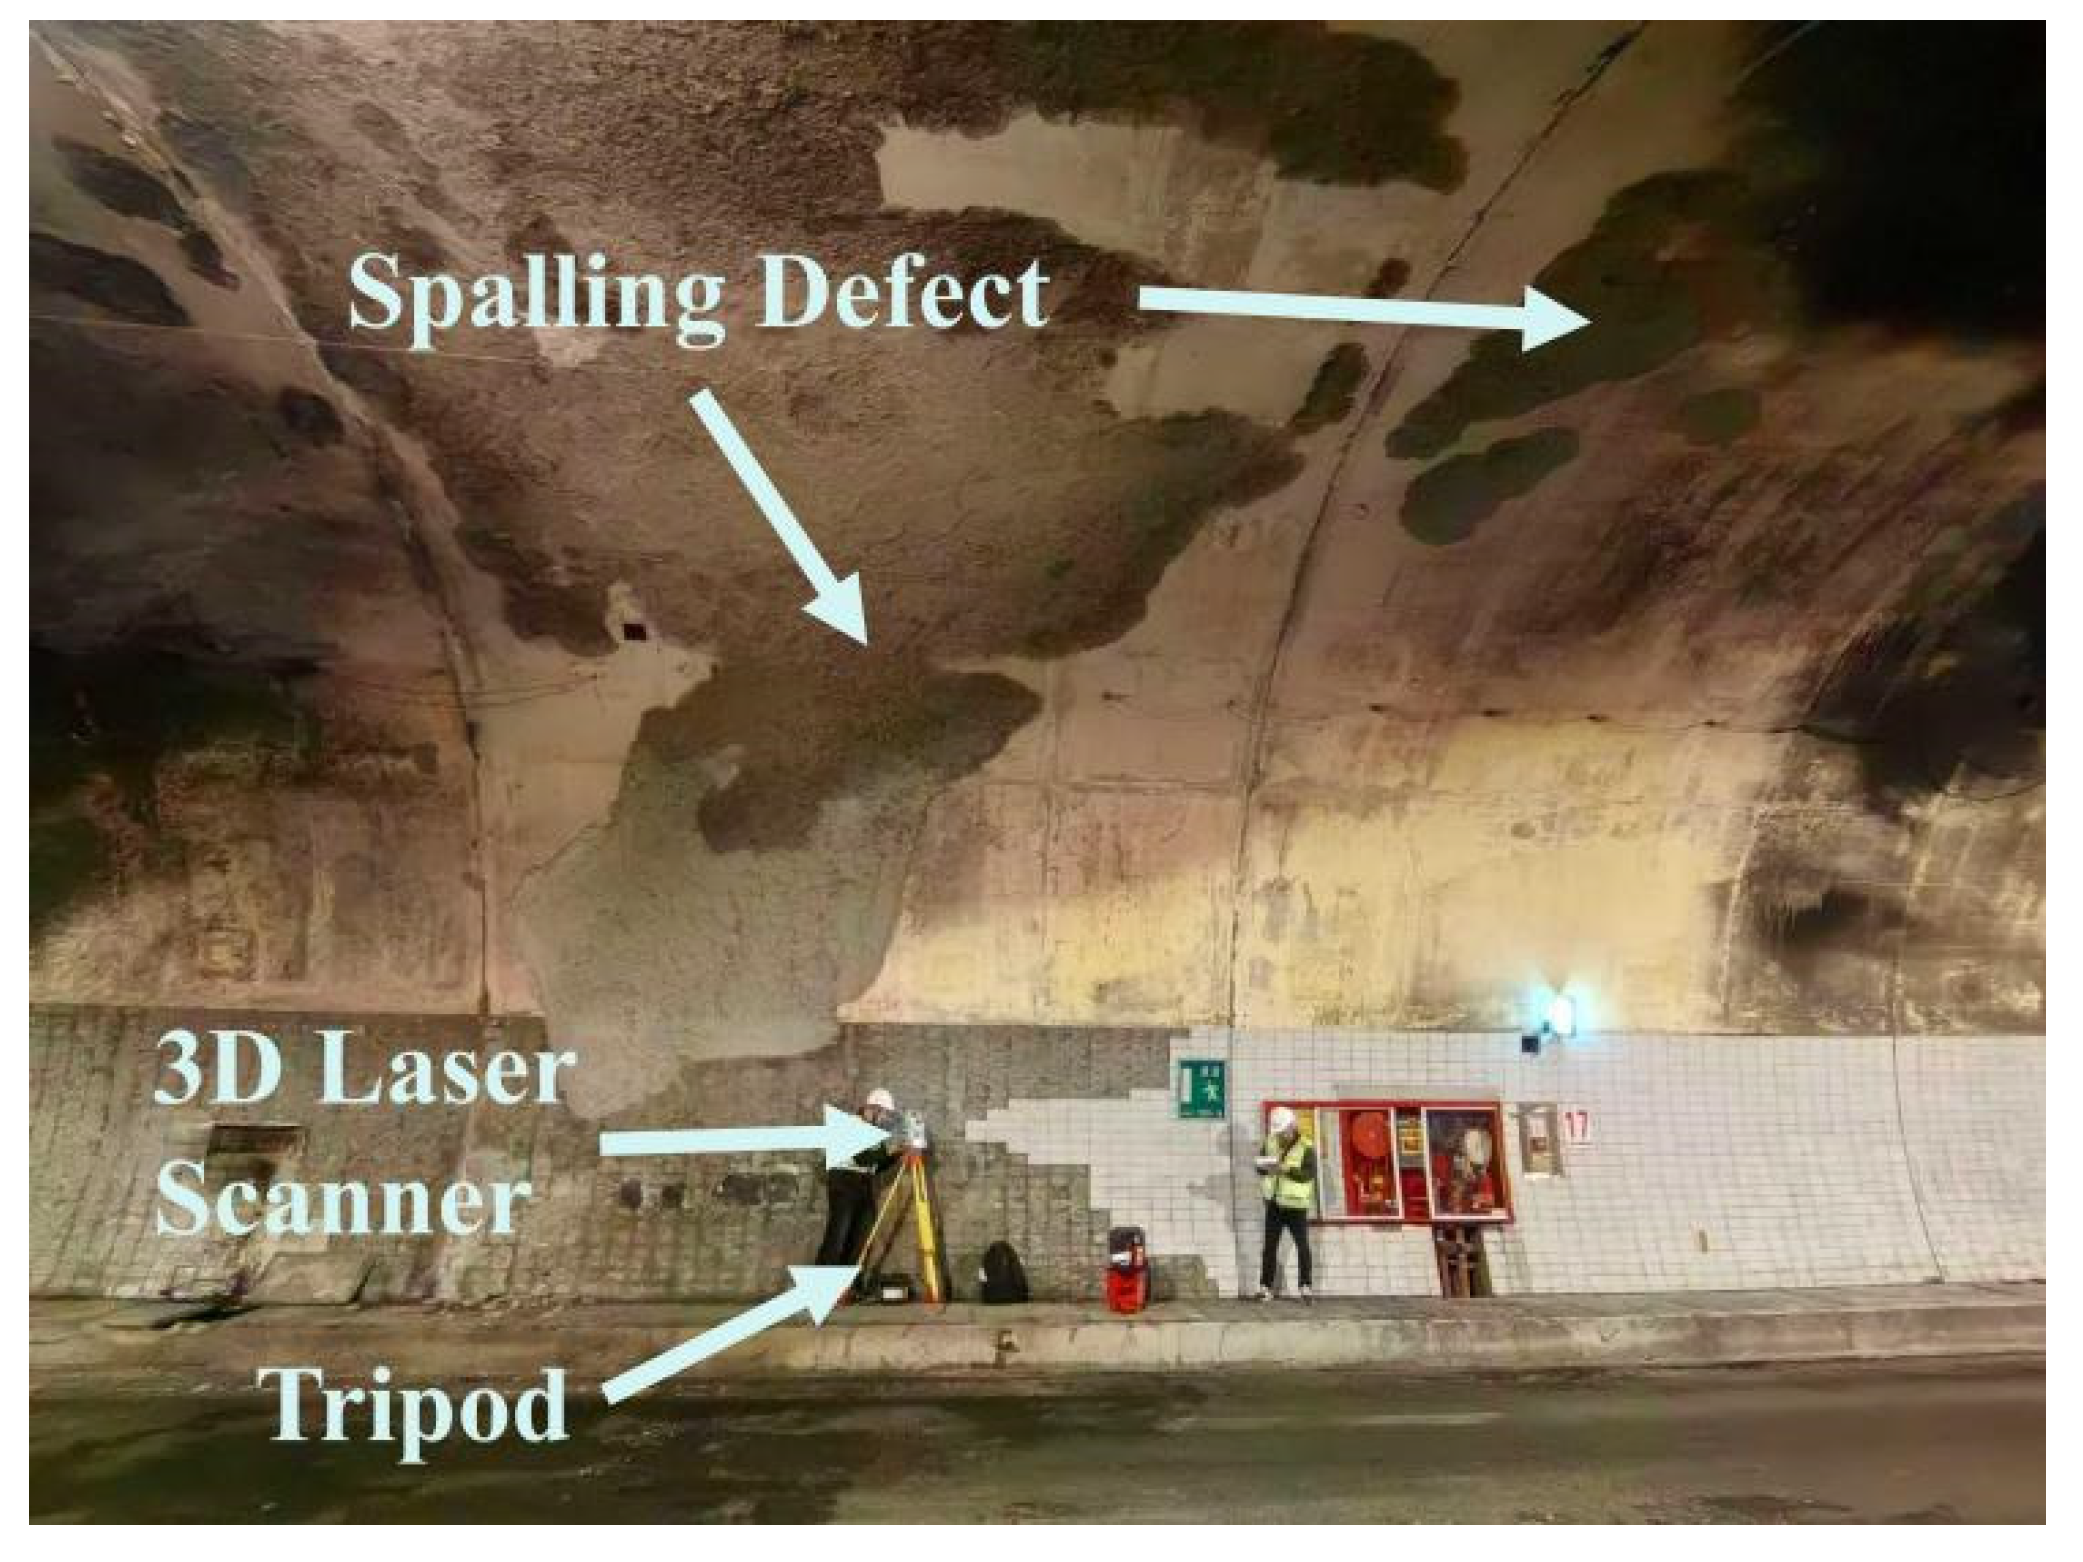
Following successful laboratory validation, the proposed method is further assessed under real-world conditions to verify its reliability in practical engineering applications. The proposed method possesses broad applicability for mountain tunnels featuring multi-circular-arc cross-sections. This paper applies and verifies the method in an operational tunnel after a fire. The experimental setup and scanning parameters used in the operational tunnel environment are consistent with those employed in the controlled tunnel experiments, as illustrated in Figure 7.
Field data are collected from an operational highway tunnel in Zhejiang Province, China. Constructed in 2009 with a total length of 1741 m, the tunnel comprises an open-cut section built using the cut-and-cover method and a concealed section constructed with the
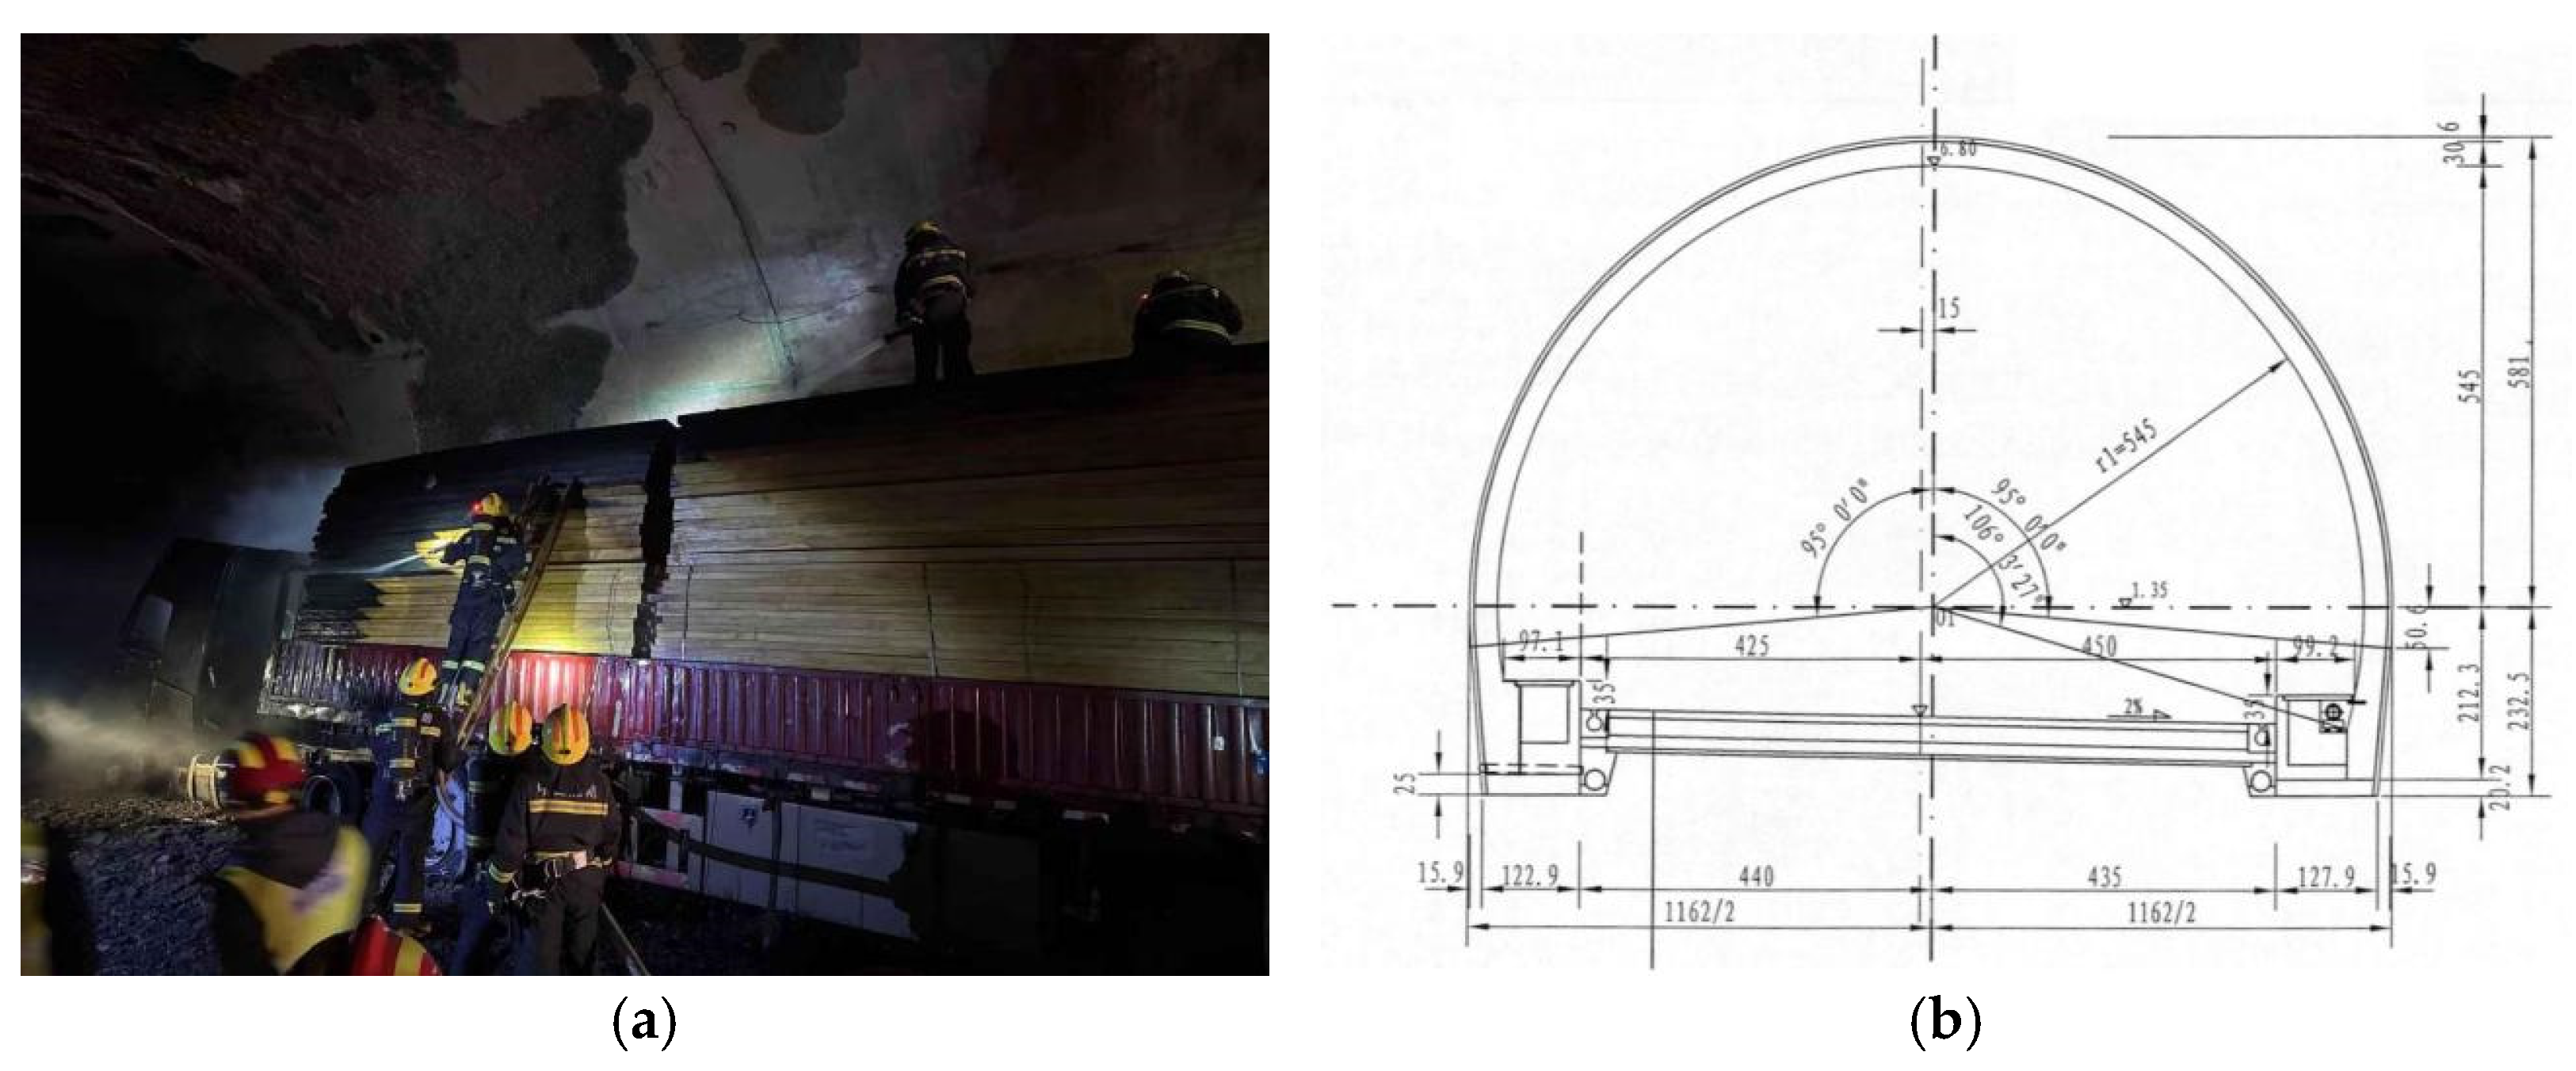
New Austrian Tunneling Method (NATM). A recent incident involving a timber-laden heavy truck catching fire inside the tunnel was successfully contained after 30 min of firefighting efforts (Figure 8a). A post-incident inspection identified 10 instances of severe vault lining spalling. The designed curvature radius of the tunnel lining at the defect locations is 545 cm, as shown in Figure 8b.
The research team employed a 3D laser scanner to acquire point cloud data from the damaged regions. The extracted spalling parameters are then compared against reference measurements obtained during subsequent lining restoration work. Figure 9 presents the complete processing workflow for a representative defect. This sequence illustrates the step-by-step processing of 3D laser point cloud data to extract and quantify a spalling defect in a real-world operational tunnel. (a) This shows a photograph of the actual spalling defect area on the tunnel lining, providing a visual reference for the subsequent point cloud analysis. (b) This shows the raw point cloud data acquired directly from the 3D laser scanner. These initial data contain significant noise and interference points, primarily caused by passing vehicles during the scanning operation, making direct defect extraction unfeasible. (c) This shows the point cloud after coordinate system reconstruction, where the tunnel’s central axis has been aligned with the X-axis. From this aligned perspective, the intact lining region approximates a continuous arc, confirming the successful geometric correction and providing a clean baseline for analysis. (d) This shows the application of a triangular mesh to the processed point cloud. This mesh enables the calculation of local curvature variance, which is the key metric for distinguishing the geometrically irregular spalling region from the smooth, intact lining surface. (e) This shows the final extracted point cloud of the spalling defect area (highlighted), successfully isolated using the curvature variance threshold. This clear segmentation is the critical step that enables the accurate calculation of the defect’s depth, area, and volume.
Table 3 presents the calculated and measured values of depth, area, and volume for 10 representative defects. The results demonstrate that the errors between calculated and measured values remained within 9.70% for depth, 9.39% for area, and 8.17% for volume. These findings validate the practical applicability of the proposed method in Engineering. It enables rapid and reliable identification of spalling defect parameters following fire-related incidents, supports timely structural integrity assessments of tunnel linings, and underscores the real-world utility of the approach.

5. Discussion

The experimental results presented in Section 3 and Section 4 demonstrate the effectiveness of the proposed curvature variance-based threshold segmentation method for identifying and quantifying tunnel lining spalling using 3D laser point cloud data. This section provides a deeper interpretation of these results, discusses their implications, and compares the proposed method with existing approaches.

5.1. Interpretation of Experimental Results

The laboratory experiments under controlled conditions (Conditions A1–B4) showed that the proposed method achieved errors of less than 5% in depth, area, and volume measurements. Experimental errors originate primarily from the sampling interval of point cloud scanning, the measurement accuracy of the equipment, and the numerical precision in calculations. This study finds that for most working conditions, maintaining a point cloud sampling interval ≤ 0.02 mm and the numerical precision of two decimal places is sufficient to confine error fluctuations within 1%.
This high level of accuracy can be attributed to the effective use of the tunnel’s symmetrical structure and the curvature variance threshold, which robustly captures local geometric deviations caused by spalling. The method’s performance remained stable across a range of spalling sizes and depths, indicating its robustness in varied defect scenarios.
In real-world tunnel inspections (Section 4), the method maintained errors below 9.70% for depth, 9.39% for area, and 8.17% for volume. Compared to laboratory conditions, the slightly higher error may be attributed to the unevenness of the spalling concrete surface, which caused local occlusions during scanning and prevented the complete acquisition of point cloud data from the recessed areas of the concrete. Nevertheless, the accuracy is sufficient for practical engineering applications, where rapid and reliable post-disaster assessment is critical.

5.2. Influence of Scanning Parameters

The results from Conditions C1–C4 and D1–D4 highlight the influence of scanning distance and angle on measurement accuracy. While varying the scanning distance (2–10 m) had a minimal impact on accuracy, changes in the scanning angle significantly affected volume estimation. This is because non-perpendicular scanning angles can lead to occlusions, preventing the scanner from capturing the full interior geometry of the spalling region. Surface depressions caused by spalling generate edge shadows whose extent depends on the scanning angle, similar to variations in light projection. Therefore, it is recommended to align the scanner as perpendicularly as possible to the spalling surface during data acquisition.

5.3. Comparison with Existing Methods

Compared to traditional machine vision-based methods, which are sensitive to lighting conditions and surface textures, the proposed 3D laser scanning approach is more reliable in the typically poorly illuminated and complex tunnel environment. Moreover, unlike surface fitting or reconstruction methods that require large intact regions and extensive computation, our method uses only a limited set of points from the intact lining near the defect, reducing computational cost and enabling faster assessment.
The use of curvature variance as a threshold for defect extraction is a novel contribution. It allows for the detection of subtle geometric changes that are not easily captured by radial distance-based methods alone. This is particularly important for early-stage spalling detection, where defects may be shallow but widespread.
A key direction for future research is to conduct a systematic performance comparison between the proposed method and other potential point cloud processing algorithms (e.g., those based on deep learning semantic segmentation or alternative surface reconstruction techniques) on a standardized dataset to provide a more comprehensive evaluation of its advantages and limitations.

5.4. Practical Implications

The proposed method provides a practical tool for infrastructure managers to quickly assess tunnel safety after incidents such as fires or collisions. By automating the extraction and quantification of spalling parameters, it reduces reliance on manual inspection, minimizes human error, and supports data-driven decision-making for maintenance and repair.

6. Conclusions

This study successfully developed and validated an automated method for identifying and quantifying tunnel lining spalling by leveraging 3D laser point cloud data and the inherent symmetrical geometry of tunnels. The core of the proposed approach lies in a curvature variance-based threshold segmentation technique, which effectively distinguishes defective regions from intact lining surfaces by detecting local geometric deviations. The implementation of this method involves a streamlined workflow: accurately determining the tunnel’s central axis using optimization algorithms, reconstructing the coordinate system to eliminate outliers, constructing triangular meshes, and finally extracting and quantifying spalling defects.
The experimental results, both in controlled laboratory settings and a real-world fire-damaged tunnel, demonstrate the method’s robustness and accuracy. The key essence of our findings can be summarized as follows:
  • Fundamental Principle Validated: The geometrical deviation caused by spalling creates a distinct and measurable signature in the point cloud, which is most effectively captured not by simple radial distance, but by the variance of local curvature within triangulated meshes. This principle proves to be a reliable indicator for precise defect boundary extraction.
  • Practical Accuracy Achieved: The method delivers parameter estimates with an average error of approximately 9.70% for depth, 9.39% for area, and 8.17% for volume in real-world conditions, a level of accuracy that is fully acceptable for practical engineering assessments and post-incident safety evaluations.
  • Operational Advantage Established: Compared to traditional manual inspection and 2D image-based methods, this approach is immune to poor lighting conditions and reduces subjective error. Furthermore, unlike some complex surface reconstruction techniques, it requires only a limited set of points from the intact lining near the defect, resulting in lower computational cost and faster processing, which is crucial for time-sensitive assessments.
  • Despite its effectiveness, the proposed method has certain limitations. First, the accuracy of volume estimation is sensitive to the scanning angle, as non-perpendicular angles may cause occlusions and incomplete data acquisition. Second, the method assumes that the tunnel cross-section consists of symmetrical circular arcs, which may not fully represent tunnels with irregular or non-standard geometries. Third, the computational efficiency of the mesh-based curvature analysis may decrease with very large-scale point clouds.
In conclusion, this study provides a practical, accurate, and efficient tool for tunnel lining health monitoring. By translating the symmetrical properties of tunnels into a robust computational workflow, it offers a significant step forward towards automated, data-driven infrastructure inspection and safety management.

Author Contributions

Conceptualization, Z.Y.; Methodology, Y.J.; Software, Z.Y. and X.S.; Validation, M.Y. and J.X.; Formal analysis, R.X.; Investigation, H.Z.; Writing—original draft, Z.Y.; Writing—review & editing, L.H. All authors have read and agreed to the published version of the manuscript.

Funding

This research was funded by the project of Zhejiang Communications Investment Expressway Operation Management Co., Ltd., grant number YFBSH202401.

Data Availability Statement

The original contributions presented in this study are included in the article. Further inquiries can be directed to the corresponding author.

Conflicts of Interest

Author Zhuodong Yang is a postdoctoral fellow jointly affiliated with Zhejiang University and Zhejiang Communications Investment Expressway Operation Management Co., Ltd. Authors Ye Jin, Xingliang Sun, Mu Yu and Jianda Xu are employed by the company Zhejiang Communications Investment Expressway Operation Management Co., Ltd. The authors declare that this study received funding from Zhejiang Communications Investment Expressway Operation Management Co., Ltd. The funder had the following involvement with the study: Methodology, Validation, Software.

References

  1. Sjölander, A.; Belloni, V.; Ansell, A.; Nordström, E. Towards automated inspections of tunnels: A review of optical inspections and autonomous assessment of concrete tunnel linings. Sensors 2023, 23, 3189. [Google Scholar] [CrossRef]
  2. Zhu, A.; Wang, B.; Xie, J.; Ma, C. MFF-YOLO: An accurate model for detecting tunnel defects based on multi-scale feature fusion. Sensors 2023, 23, 6490. [Google Scholar] [CrossRef]
  3. Attard, L.; Debono, C.J.; Valentino, G.; Di Castro, M. Tunnel inspection using photogrammetric techniques and image processing: A review. ISPRS-J. Photogramm. Remote Sens. 2018, 144, 180–188. [Google Scholar] [CrossRef]
  4. Liu, J.; Song, M.; Shu, H.; Peng, W.; Wei, L.; Wang, K. A novel FBG placement optimization method for tunnel monitoring based on WOA and deep Q-network. Symmetry 2024, 16, 1400. [Google Scholar] [CrossRef]
  5. Ye, F.; Qin, N.; Liang, X.; Ouyang, A.; Qin, Z.; Su, E. Analyses of the defects in highway tunnels in China. Tunn. Undergr. Space Technol. 2021, 107, 103658. [Google Scholar] [CrossRef]
  6. Li, S.; Qiu, Y.; Jiang, J.; Wang, H.; Nan, Q.; Sun, L. Identification of Abnormal Vibration Signal of Subway Track Bed Based on Ultra-Weak FBG Sensing Array Combined with Unsupervised Learning Network. Symmetry 2022, 14, 1100. [Google Scholar] [CrossRef]
  7. Xu, W.; Cheng, M.; Xu, X.; Chen, C.; Liu, W. Deep learning method on deformation prediction for large-section tunnels. Symmetry 2022, 14, 2019. [Google Scholar] [CrossRef]
  8. Bentz, D.P. Fibers, percolation, and spalling of high-performance concrete. Mater. J. 2000, 97, 351–359. [Google Scholar]
  9. Hertz, K.D. Limits of spalling of fire-exposed concrete. Fire Saf. J. 2003, 38, 103–116. [Google Scholar] [CrossRef]
  10. Xiong, H.; An, B.; Sun, B.; Lu, J. An improved synchrosqueezing S-transform and its application in a GPR detection task. Sensors 2024, 24, 2981. [Google Scholar] [CrossRef]
  11. Wang, T.; Shi, B.; Zhu, Y. Structural monitoring and performance assessment of shield tunnels during the operation period, based on distributed optical-fiber sensors. Symmetry 2019, 11, 940. [Google Scholar] [CrossRef]
  12. Wang, K.; Zhang, Z.; Wu, X.; Zhang, L. Multi-class object detection in tunnels from 3D point clouds: An auto-optimized lazy learning approach. Adv. Eng. Inform. 2022, 52, 101543. [Google Scholar] [CrossRef]
  13. Ren, Z.; Fang, F.; Yan, N.; Wu, Y. State of the art in defect detection based on machine vision. Int. J. Precis. Eng. Man-Green Technol. 2022, 9, 661–691. [Google Scholar] [CrossRef]
  14. Li, T.; Wang, H.; Pan, D.; Tan, J.; Hou, J.; Kong, L.; Liu, J. A machine vision approach with temporal fusion strategy for concrete vibration quality monitoring. Appl. Soft. Comput. 2024, 160, 111684. [Google Scholar] [CrossRef]
  15. Beskopylny, A.N.; Stel’makh, S.A.; Shcherban’, E.M.; Razveeva, I.; Kozhakin, A.; Meskhi, B.; Chernil’nik, A.; Elshaeva, D.; Ananova, O.; Girya, M. Computer vision method for automatic detection of microstructure defects of concrete. Sensors 2024, 24, 4373. [Google Scholar] [CrossRef]
  16. Golewski, G.L. The phenomenon of cracking in cement concretes and reinforced concrete structures: The mechanism of cracks formation, causes of their initiation, types and places of occurrence, and methods of detection—A review. Buildings 2023, 13, 765. [Google Scholar] [CrossRef]
  17. Hsieh, Y.A.; Tsai, Y.J. Machine learning for crack detection: Review and model performance comparison. J. Comput. Civil. Eng. 2020, 34, 04020038. [Google Scholar] [CrossRef]
  18. Cha, Y.J.; Choi, W.; Suh, G.; Mahmoudkhani, S.; Büyüköztürk, O. Autonomous structural visual inspection using region-based deep learning for detecting multiple damage types. Comput.-Aided Civil Infrastruct. Eng. 2018, 33, 731–747. [Google Scholar] [CrossRef]
  19. Huang, H.; Li, Q. Image recognition for water leakage in shield tunnel based on deep learning. Chin. J. Rock Mech. Eng. 2017, 36, 2861–2871. [Google Scholar]
  20. Xue, Y.; Li, Y. A fast detection method via region-based fully convolutional neural networks for shield tunnel lining defects. Comput.-Aided Civil Infrastruct. Eng. 2018, 33, 638–654. [Google Scholar] [CrossRef]
  21. Xue, Y.; Cai, X.; Shadabfar, M.; Shao, H.; Zhang, S. Deep learning-based automatic recognition of water leakage area in shield tunnel lining. Tunn. Undergr. Space Technol. 2020, 104, 103524. [Google Scholar] [CrossRef]
  22. Jang, A.; Jeong, S.; Cho, H.; Jung, D.; Ju, Y.K.; Kim, J.S.; Jung, D. Geometric and structural assessment and reverse engineering of a steel-framed building using 3D laser scanning. Comput. Concr. 2024, 33, 595–603. [Google Scholar]
  23. Alkadri, M.F.; Alam, S.; Santosa, H.; Yudono, A.; Beselly, S.M. Investigating surface fractures and materials behavior of cultural heritage buildings based on the attribute information of point clouds stored in the tls dataset. Remote Sens. 2022, 14, 410. [Google Scholar] [CrossRef]
  24. Fujita, Y.; Kobayashi, I.; Chanseawrassamee, W.; Hoshino, Y. Application of attributed road surface point cloud data in road maintenance. Jpn. Soc. Civ. Eng. Ser. F3 Civil Eng. Inform. 2014, 70, 185–192. [Google Scholar] [CrossRef]
  25. Alkadri, M.F.; Turrin, M.; Sariyildiz, S. A computational workflow to analyse material properties and solar radiation of existing contexts from attribute information of point cloud data. Build. Environ. 2019, 155, 268–282. [Google Scholar] [CrossRef]
  26. Wang, C.; Han, R.; Zhang, Y.; Wang, Y.; Zi, Y.; Zhao, J. Defect detection method based on sparse scanning with laser ultrasonics. Sci. Rep. 2025, 15, 13175. [Google Scholar] [CrossRef]
  27. Tang, Y.; Wang, Q.; Wang, H.; Li, J.; Ke, Y. A novel 3D laser scanning defect detection and measurement approach for automated fibre placement. Meas. Sci. Technol. 2021, 32, 075201. [Google Scholar] [CrossRef]
  28. Zhou, G.; Zhang, Z.; Yin, W.; Chen, H.; Wang, L.; Wang, D.; Ma, H. Characterization and depth detection of internal delamination defects in CFRP based on line laser scanning infrared thermography. Struct. Health Monit. 2024, 23, 3195–3210. [Google Scholar] [CrossRef]
  29. Maru, M.B.; Lee, D.; Cha, G.; Park, S. Beam deflection monitoring based on a genetic algorithm using lidar data. Sensors 2020, 20, 2144. [Google Scholar] [CrossRef]
  30. Liu, X.; He, J.; Cheng, Q.; Yang, S.; Li, M. Surface defect identification based on broadband laser-generated Rayleigh wave with wavenumber filtering. Meas. Sci. Technol. 2023, 34, 125205. [Google Scholar] [CrossRef]
  31. Dai, K.; Li, A.; Zhang, H.; Chen, S.E.; Pan, Y. Surface damage quantification of postearthquake building based on terrestrial laser scan data. Struct. Control. Health Monit. 2018, 25, e2210. [Google Scholar] [CrossRef]
  32. Ham, N.; Lee, S.H. Empirical study on structural safety diagnosis of large-scale civil infrastructure using laser scanning and BIM. Sustainability 2018, 10, 4024. [Google Scholar] [CrossRef]
  33. Wei, Z.; Wang, Y.; Weng, W.; Zhou, Z.; Li, Z. Research on tunnel construction monitoring method based on 3D laser scanning technology. Symmetry 2022, 14, 2065. [Google Scholar] [CrossRef]
  34. Jun, Z.L. Markerless point cloud matching algorithm based on 3d feature extraction. Int. J. Eng. Contin. 2023, 2, 38–47. [Google Scholar] [CrossRef]
  35. Yang, H.J.; Chen, J.W.; Zhang, Y.C.; Xu, X.D. Surface feature extraction based on curvelet transform from point cloud data. Appl. Mech. Mater. 2015, 719, 1236–1243. [Google Scholar] [CrossRef]
  36. Chen, H.; Liang, M.; Liu, W.; Wang, W.; Liu, P.X. An approach to boundary detection for 3D point clouds based on DBSCAN clustering. Pattern Recognit. 2022, 124, 108431. [Google Scholar] [CrossRef]
  37. Mineo, C.; Pierce, S.G.; Summan, R. Novel algorithms for 3D surface point cloud boundary detection and edge reconstruction. J. Comput. Des. Eng. 2019, 6, 81–91. [Google Scholar] [CrossRef]
  38. Qi, C.R.; Su, H.; Nießner, M.; Dai, A.; Yan, M.; Guibas, L.J. Volumetric and multi-view cnns for object classification on 3D data. In Proceedings of the IEEE Conference on Computer Vision and Pattern Recognition, Las Vegas, NV, USA, 27–30 June 2016; pp. 5648–5656. [Google Scholar]
  39. Heqiang, T.; Xiaoqing, D.; Jihu, W.; Dongmei, W. Registration method for three-dimensional point cloud in rough and fine registrations based on principal component analysis and iterative closest point algorithm. Trait. Signal 2017, 34, 57. [Google Scholar]
  40. Li, X.; Ma, X.; Liang, N.; Deng, F. 3D reconstruction of ancient structures assisted by terrestrial laser scanning technology. In Proceedings of the 2nd International Forum on Management, Education and Information Technology Application (IFMEITA 2017), Shenzhen, China, 16–17 October 2017; Atlantis Press: Dordrecht, The Netherlands, 2018; pp. 481–485. [Google Scholar]
  41. Lawani, K.; Sadeghineko, F.; Tong, M.; Bayraktar, M. Methodology for retrospectively developing a BIM model from point cloud scans using ongoing building project as case study. J. Eng. Des. Technol. 2025, 23, 1243–1261. [Google Scholar] [CrossRef]
  42. Chithra, P.; Lakshmi Bala, S. Physics-driven neural network for geometrical compression of lidar 3D point cloud data. In International Conference on Data Analytics and Management; Springer: Singapore, 2024; pp. 171–185. [Google Scholar]
  43. Zhou, Y.; Shen, S.; Hu, Z. Detail preserved surface reconstruction from point cloud. Sensors 2019, 19, 1278. [Google Scholar] [CrossRef]
  44. Liu, W.; Cheung, Y.; Sabouri, P.; Arai, T.J.; Sawant, A.; Ruan, D. A continuous surface reconstruction method on point cloud captured from a 3D surface photogrammetry system. Med. Phys. 2015, 42, 6564–6571. [Google Scholar] [CrossRef]
  45. He, Y.; Kang, S.H.; Liu, H. Curvature regularized surface reconstruction from point clouds. SIAM J. Imaging Sci. 2020, 13, 1834–1859. [Google Scholar] [CrossRef]
  46. Fliege, J.; Vaz, A.I.F. A method for constrained multi-objective optimization based on SQP techniques. SIAM J. Optim. 2016, 26, 2091–2119. [Google Scholar] [CrossRef]
  47. Byrd, R.H.; Hansen, S.L.; Nocedal, J.; Singer, Y. A stochastic Quasi-Newton method for large-scale optimization. SIAM J. Optim. 2016, 26, 1008–1031. [Google Scholar] [CrossRef]
  48. Liu, B.Z.; Zheng, C.X.; Xu, X.M.; Xu, C.; Zhang, H.D.; He, S.F. Rotation-adaptive point cloud domain generalization via intricate orientation learning. IEEE Trans. Pattern Anal. Mach. Intell. 2025, 47, 4232–4239. [Google Scholar] [CrossRef]
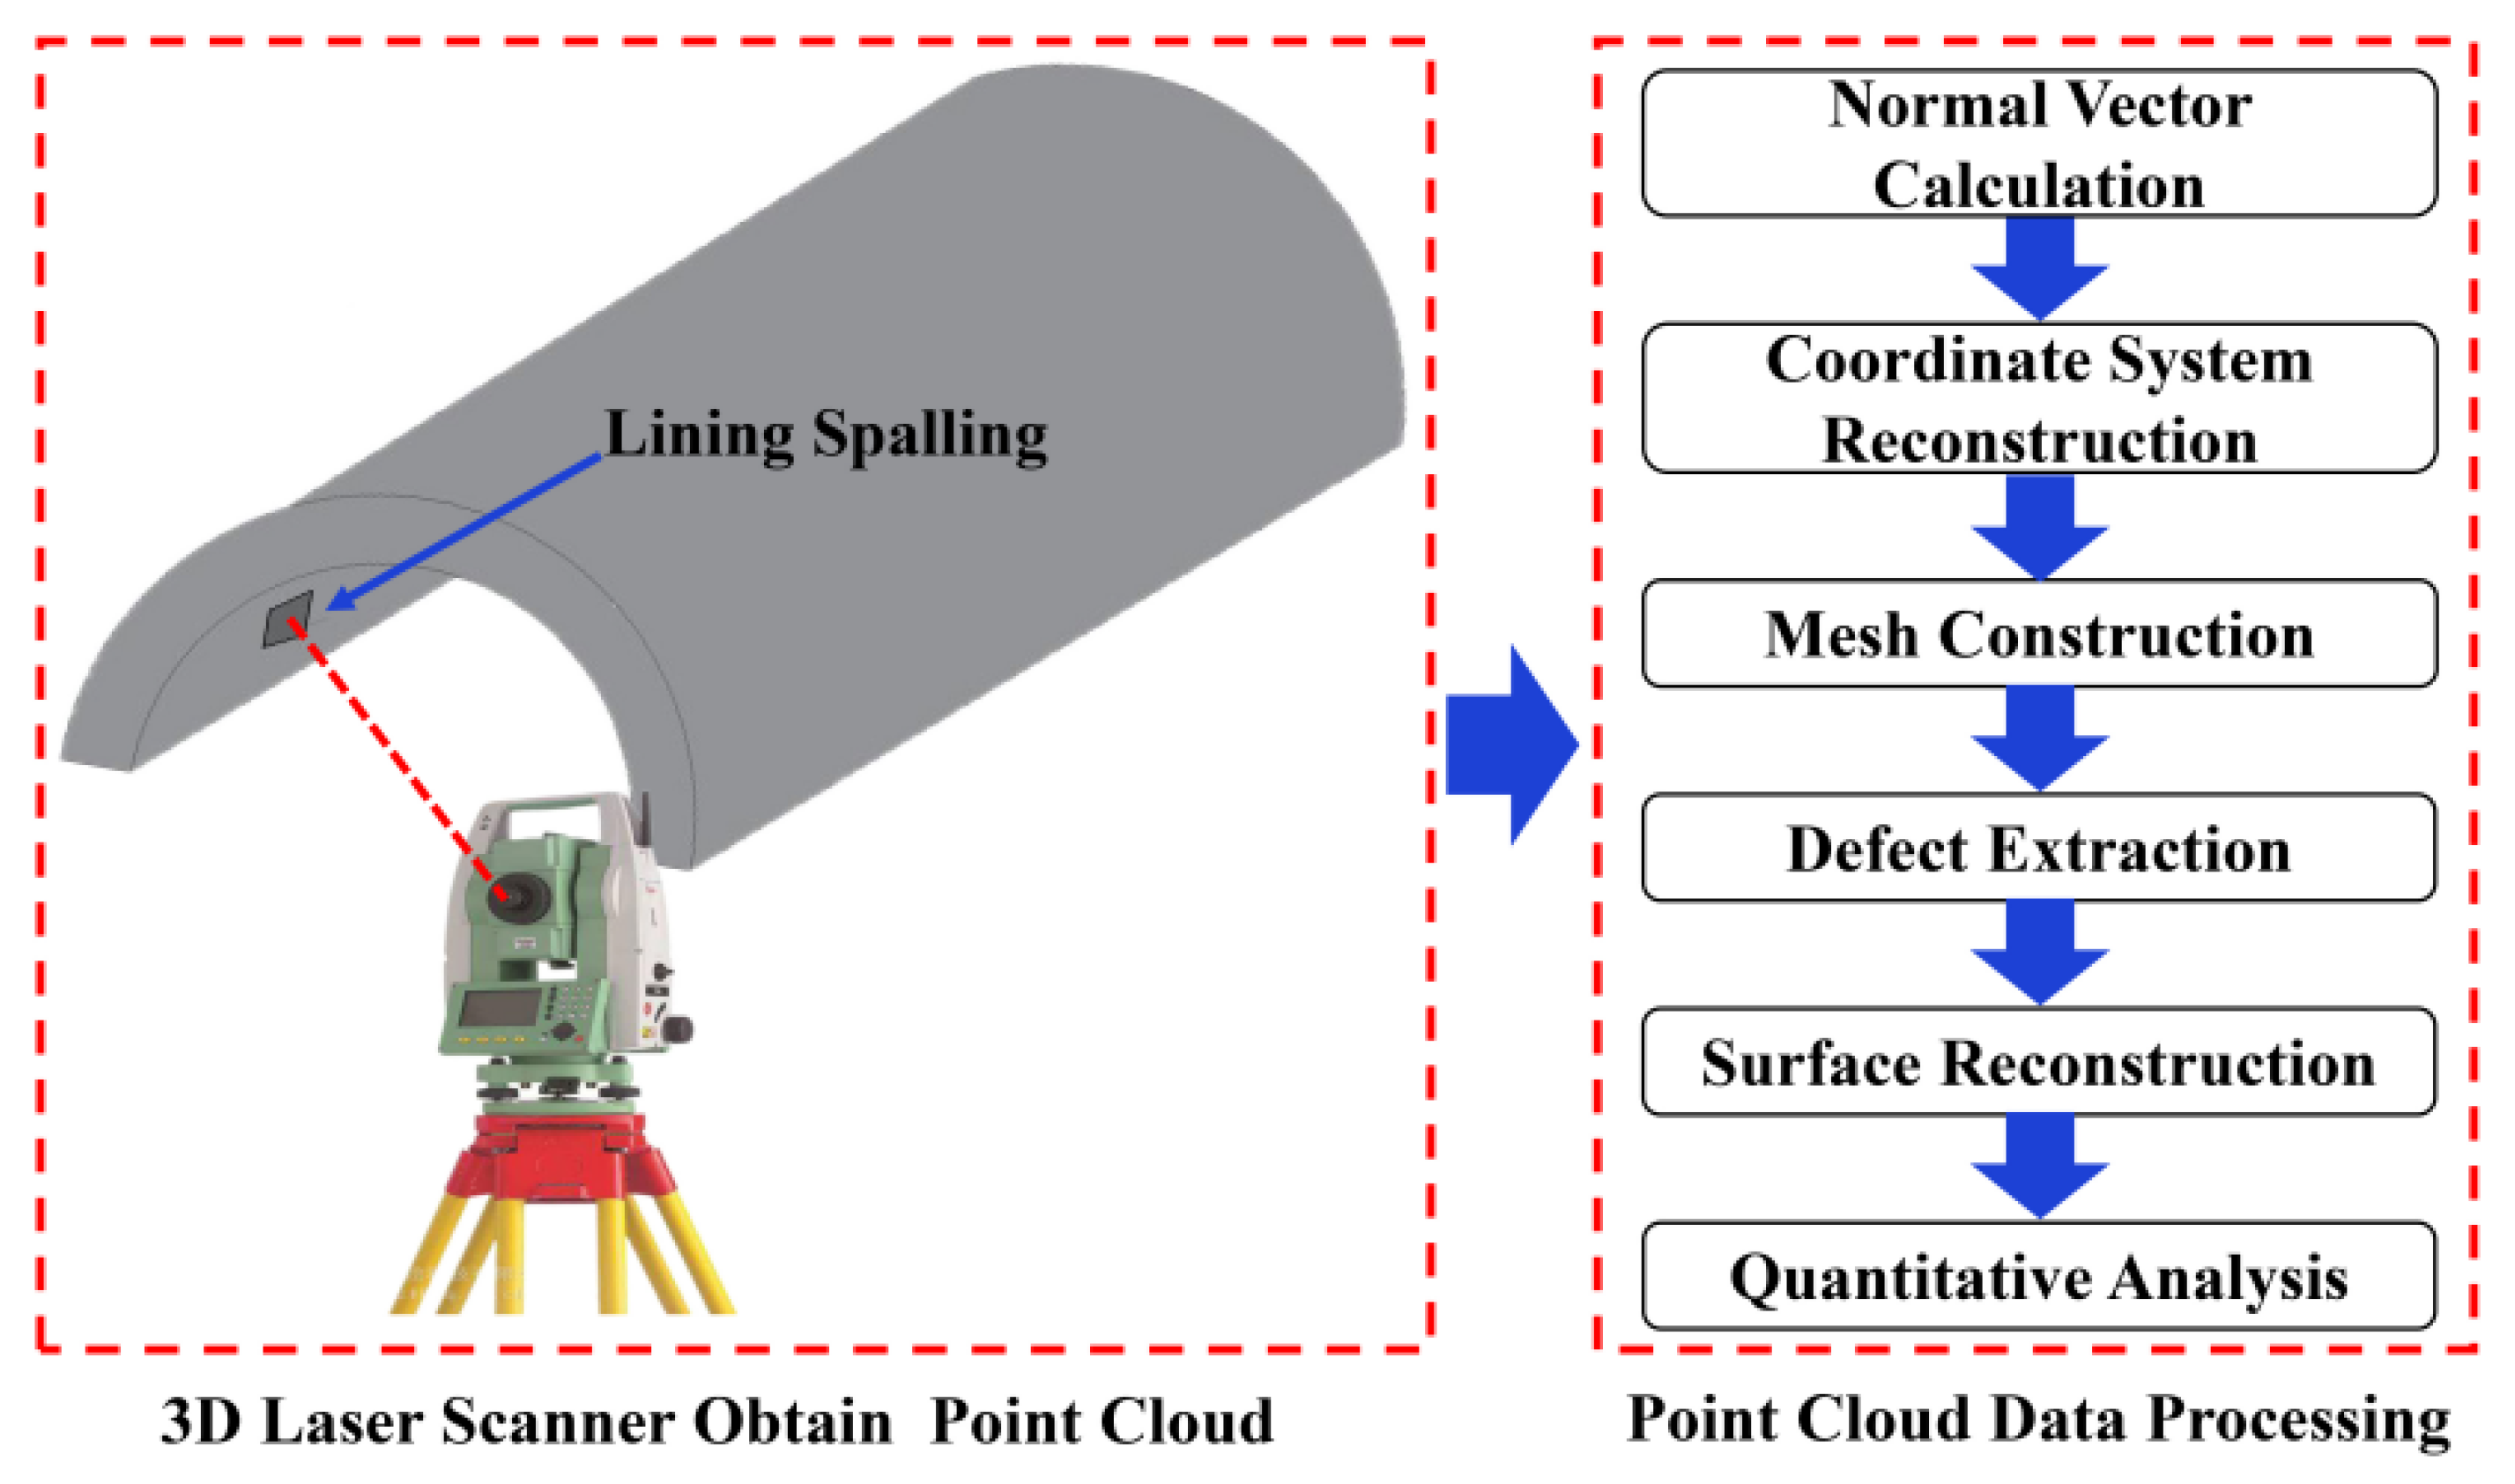
Figure 1. Workflow for lining spalling defect measurement.
Symmetry 17 01822 g001
Figure 2. Point cloud grid establishment and boundary identification process.
Symmetry 17 01822 g002
Figure 3. Schematic diagram of spalling defect volume.
Symmetry 17 01822 g003
Figure 4. Experimental setup within controlled tunnel environment.
Symmetry 17 01822 g004
Figure 5. Schematic diagram of experimental setup.
Symmetry 17 01822 g005
Figure 6. Central axis determination of the tunnel based on point cloud data. (a) Original point cloud of spalling defect; (b) selected points on undamaged lining; (c) normal vectors and the estimated central axis of the tunnel; (d) coordinate system reconstruction and alignment of the tunnel central axis; (e) triangular mesh generation on the tunnel point cloud; (f) extraction of spalling defect and reconstruction surface; (g) view along the X-axis showing the curve of the tunnel lining.
Symmetry 17 01822 g006aSymmetry 17 01822 g006b
Figure 7. Experimental setup within operational tunnel environment.
Symmetry 17 01822 g007
Figure 8. Basic information about the accident tunnel. (a) Fire rescue scene; (b) tunnel cross-section diagram.
Symmetry 17 01822 g008
Figure 9. Workflow for spalling defect quantification in the accident tunnel. (a) Spalling defect area; (b) raw point cloud data; (c) reconstruction of the coordinate system of the point cloud; (d) point cloud meshing; (e) extraction of the point cloud of the defect area.
Symmetry 17 01822 g009
Table 1. Experimental conditions in controlled tunnel environment.
ConditionRange (cm)Depth (cm)Measurement Distance (m)Measurement Angle
Condition A15 × 53890°
Condition A210 × 103890°
Condition A320 × 203890°
Condition A430 × 303890°
Condition A540 × 403890°
Condition B120 × 201890°
Condition B220 × 202890°
Condition B320 × 204890°
Condition B420 × 205890°
Condition C120 × 203290°
Condition C220 × 203490°
Condition C320 × 203690°
Condition C420 × 2031090°
Condition D120 × 203830°
Condition D220 × 203845°
Condition D320 × 203860°
Condition D420 × 203875°
Table 2. Experimental results in controlled tunnel environment.
ConditionDepth (cm)Area (cm2)Volume (cm3)
CVMVERCVMVERCVMVER
Condition A12.9332.33%24.74251.04%72.37753.51%
Condition A22.9731.00%97.611002.39%304.043001.35%
Condition A33.0331.00%397.104000.72%1250.5812004.21%
Condition A42.9830.67%915.799001.75%2589.4627004.09%
Condition A52.9731.00%1593.6916000.39%5019.8548004.58%
Condition B10.9911.00%413.574003.39%406.294001.57%
Condition B21.9821.00%388.624002.85%771.718003.54%
Condition B33.9740.75%409.504002.38%1625.2516001.58%
Condition B45.0350.60%391.284002.18%2013.2120000.66%
Condition C12.9830.67%400.044000.01%1147.6512004.36%
Condition C22.9531.67%400.434000.11%1158.3712003.47%
Condition C32.9531.67%395.174001.21%1140.9212004.92%
Condition C42.9232.67%390.124002.47%1175.4612002.05%
Condition D12.9332.33%413.854003.46%1055.90120012.01%
Condition D22.9432.00%411.874002.97%1073.98120010.50%
Condition D33.0531.67%408.094002.02%1112.4612007.30%
Condition D43.0331.00%405.314001.33%1134.8012005.43%
Table 3. Experimental results in operational tunnel environment.
ConditionDepth (cm)Area (cm2)Volume (cm3)
CVMVERCVMVERCVMVER
Defect 12.953.04 3.06%715075105.03%274229668.17%
Defect 21.221.27 4.10%22,77024,3486.93%361037513.91%
Defect 30.780.81 3.39%513452882.99%115411993.91%
Defect 44.224.58 8.42%341334350.63%250126465.79%
Defect 53.543.69 4.38%487653259.22%276228453.03%
Defect 64.254.39 3.32%171618749.23%182319657.78%
Defect 711.7812.92 9.70%631,257690,5119.39%1,338,5171,446,6598.08%
Defect 85.155.63 9.36%351735230.16%543456574.11%
Defect 93.653.83 4.96%147815806.87%113311733.58%
Defect 107.828.32 6.38%16,35817,0694.35%33,25935,9278.02%
Disclaimer/Publisher’s Note: The statements, opinions and data contained in all publications are solely those of the individual author(s) and contributor(s) and not of MDPI and/or the editor(s). MDPI and/or the editor(s) disclaim responsibility for any injury to people or property resulting from any ideas, methods, instructions or products referred to in the content.