Abstract
The performance of iterative schemes used to solve nonlinear operator equations is strongly influenced by the initial guess. Therefore, it is essential to accurately determine convergence radii and develop theoretical strategies to broaden the region where convergence is guaranteed in order to enhance the reliability and efficiency of these methods. A crucial tool for this purpose is local convergence analysis, which investigates behavior near the true solution to establish convergence criteria. This work is dedicated to extending the convergence region of a parameter-based iteration scheme of the fifth-order. We carry out a comprehensive local convergence study within the framework of Banach spaces and derive precise formulas for the convergence radius, error estimates, and convergence zones associated with the method. A notable advantage of our approach is that it relies solely on the first derivative and avoids the need for additional conditions, making it easier to apply and significantly expanding the convergence region relative to earlier approaches. The theoretical contributions are further validated through a series of numerical experiments applied to diverse classes of nonlinear equations. Furthermore, the examination of the basins of attraction and their symmetry provides a deeper understanding of the method’s dynamic characteristics, robustness, and effectiveness in tackling complex-valued polynomial equations.
Keywords:
Banach space; nonlinear equations; local convergence; convergence domain; generalized Lipschitz–Hölder-type conditions MSC:
47J25; 49M15; 65J15; 65H99
1. Introduction
A central challenge in Numerical Functional Analysis is solving nonlinear operator equations in Banach spaces. This becomes particularly crucial because the mathematical models that capture the essential characteristics of physical phenomena across various domains, such as science, engineering, and related fields, are typically nonlinear in nature. These models represent complex systems and behaviors through a set of mathematical equations that describe the relationships between multiple variables. In mathematical terms, a nonlinear model is generally formulated as follows:
where is a continuously Fréchet differentiable operator; ’s are Banach spaces for ; and is both open and convex. In order to analyze the behavior of a given physical phenomenon under a wide range of conditions, it is crucial to solve the corresponding nonlinear model. However, due to the nonlinear nature of the models, analytical or closed-form solutions to such equations is typically not attainable through direct analytical techniques. In these cases, finding explicit solutions becomes an intractable task. As a result, numerical schemes are employed to obtain approximate solutions. These schemes utilize iterative techniques to offer numerical solutions with the desired accuracy. Among these methods, Newton’s scheme (NS) is one of the most prominent and renowned techniques used to solve Equation (1). This technique approximates the solution to (1) in the following manner.
NS is particularly valued for its computational efficacy and simple iterative formula, making it a cornerstone in the development of higher-order iterative methods. Over time, a variety of iterative techniques [1,2,3,4,5,6,7,8,9] have been developed to improve the performance of NS, often by introducing more functional evaluations or incorporating additional Jacobian evaluations. In [3], by combining an iterative procedure of order with a Newton-type modification involving just one additional function evaluation, the authors derived a method of order . Modifications of NS achieving third and fourth-order convergence are presented in [4] and [5]. The method of our interest is the following fourth- and fifth-order parameter-based iteration scheme (PBIS) created by Xiao and Yin [1].
where . This scheme, for , has a convergence order equal to five.
In recent developments, there has been a marked shift towards eliminating the dependence on Taylor series expansions in the convergence analysis of iterative algorithms. Researchers such as Amat et al. [10], Argyros et al. [11,12,13,14,15], Cordero et al. [16], Hernández-Verón et al. [17], and George et al. [18], and others [19,20,21,22] have made substantial contributions to developing convergence theories independent of higher-order derivatives. In particular, they have extensively studied the local and semi-local convergence behaviors of iterative techniques, particularly those achieving third-order or higher convergence. Similarly, several works [23,24] have contributed to enhancing the practical applicability of PBIS by conducting local convergence analyses, relying on the Lipschitz and Hölder continuity properties of . Martínez et al. [23] enlarged its domain of convergence utilizing the local convergence tool. They used Lipschitz continuity of and also removed the additional condition on the boundedness of . Later, to enhance the productiveness of this iteration, Singh et al. [24] used Hölder continuity of in Banach spaces and established its convergence. Their work expanded the utility of PBIS to address the problems for which the Lipschitz criterion does not hold.
In the context of iterative schemes, one of the primary difficulties encountered is determining the exact region where the method achieves convergence. Often, this region is constrained and may be relatively small. Therefore, broadening the convergence area, without adding extra assumptions, becomes a significant objective. Another essential concern is achieving accurate error estimates at each iteration for assessing the performance of the method. In response to these challenges, we focus on extending the convergence domain of the PBIS [1] through a robust analytical framework. In particular, a detailed local convergence analysis is carried out in the framework of Banach spaces, where we derive explicit expressions for the convergence radius, error estimates, and the associated regions of convergence for PBIS. This analysis is based on generalized Lipschitz-Hölder-type continuity of , alongside suitable auxiliary functions to support the theoretical framework. The theoretical contributions are substantiated by a series of carefully designed numerical experiments covering a diverse set of nonlinear problems, confirming the robustness and applicability of the approach.
The analytical contributions of this study are particularly significant because they rely exclusively on the generalized Lipschitz-Hölder-type continuity of , avoiding the imposition of additional restrictive conditions on the boundedness of the first derivative that are often necessary in previous works. This simplification not only enhances the computational efficiency but also significantly broadens the convergence domain of PBIS compared to existing analytical techniques [23,24]. Moreover, a graphical analysis of the basins of attraction provides a deeper insight into the method’s dynamic behavior, robustness, and its potential for solving complex-valued polynomial equations.
The remainder of the paper is structured as follows. In Section 2, we provide a comprehensive theoretical framework for the local convergence of PBIS within Banach spaces, emphasizing the derivation of convergence radius and error estimates. Section 3 presents a graphical investigation of the basins of attraction to analyze the stability and convergence properties of PBIS. In Section 4, we report the results of extensive numerical experiments that validate the analytical findings and highlight the practical advantages of our approach. Finally, Section 5 concludes the paper by summarizing the contributions.
2. Analysis of Local Convergence of PBIS
We thoroughly investigate the local convergence of the PBIS in this section, beginning with the introduction of the following notations. Let , is bounded and linear}, , and , where and .
- Let the operator be such that it fulfills the following conditions:
- (Y1)
- is continuously Fréchet derivable;
- (Y2)
- there exists , such that ;
- (Y3)
- ;
- (Y4)
- ;
- (Y5)
- .
- Here, the functions and meet the following criteria:
- and are continuous functions;
- if , then and ;
- ;
- the least real number, , satisfying the equation does exist.
Let us now construct the following auxiliary functions on to be utilized in the convergence theorem.
and
From the above equation, we obtain that and for . Consequently, contains a real number that solves . Let has a zero in . We also have from (7) that and . Suppose that is the least real number, such that for . Lastly, let us introduce and on by
and
The definition of immediately implies that and . As a consequence, the minimal solution of belongs to . Now, we have
where , , and the radius is defined as
Next, we derive the subsequent result to be used in the convergence theorem.
Lemma 1.
Let and the operator possesses (Y1)–(Y4). Then, , we have
Proof.
We now proceed to state and prove Theorem 1, which establishes the local convergence of PBIS.
Theorem 1.
Let us consider the operator under the assumption that conditions (Y1)–(Y5) are satisfied. Suppose that , , and for some . Let be the sequence formed by PBIS beginning with . Then, is well defined and satisfies the following properties:
- (i)
- ;
- (ii)
- .
- Furthermore, for , we deduce that
Proof.
We aim to establish (15)–(17) in the case . The assumption , combined with condition (Y4) and Equation (11), implies that
We utilize Banach’s lemma on invertible operators [2,25] to conclude that . We also obtain that
Consequently, putting in (3), we ensure the existence of and . Furthermore, substituting into the first equation of (3), yields
Now, we establish (15) for , by employing (Y5), (4), (10), (11), (12), and (19) in (20) as follows:
Next, we shall ensure the existence of . From (Y4), (5), (10), (11), and (21), we get
This inequality yields and
As a result, exists. We put in the second equation of (3) to obtain
We use (Y5), (6), (10), (11), (19), (21), and (24) to produce
Hence, (16) holds true for . Finally, to establish (17), we set in the last equation of (3) and yield
Therefore, we derive, using (Y5), (8), (10), (11), (12), (19), (21), (23), (25), and (26), that
The above result ensures that (17) holds for . Thus, for , (15)–(17), are true. To extend (15)–(17) for , we replace the terms , , , and by , , , and , respectively, in the earlier derivations, and then utilize mathematical induction. Moreover, the inequality , along with (10), implies that and as .
3. Stability Study of PBIS Through Basins of Attraction
This section delves into the convergence dynamics and stability characteristics of PBIS by investigating its basins of attraction via graphical simulations. The basin of attraction, also known as the Fatou set, is formally defined as the set , where represents a polynomial, denotes one of its roots, and refers to the sequence created by PBIS, initiated from the initial point . is referred to as the Julia set. Martínez et al. [23] investigated the complex dynamical behavior of PBIS on an arbitrary quadratic complex-valued polynomial equation. Here, we study the dynamics of PBIS on specific higher-degree polynomials.
To visualize the regions of attraction, a domain is considered, which is discretized into a grid. This grid provides a framework for visually representing the convergence domains of PBIS when applied to various complex-valued polynomial functions, ensuring that all roots lie within the chosen region .
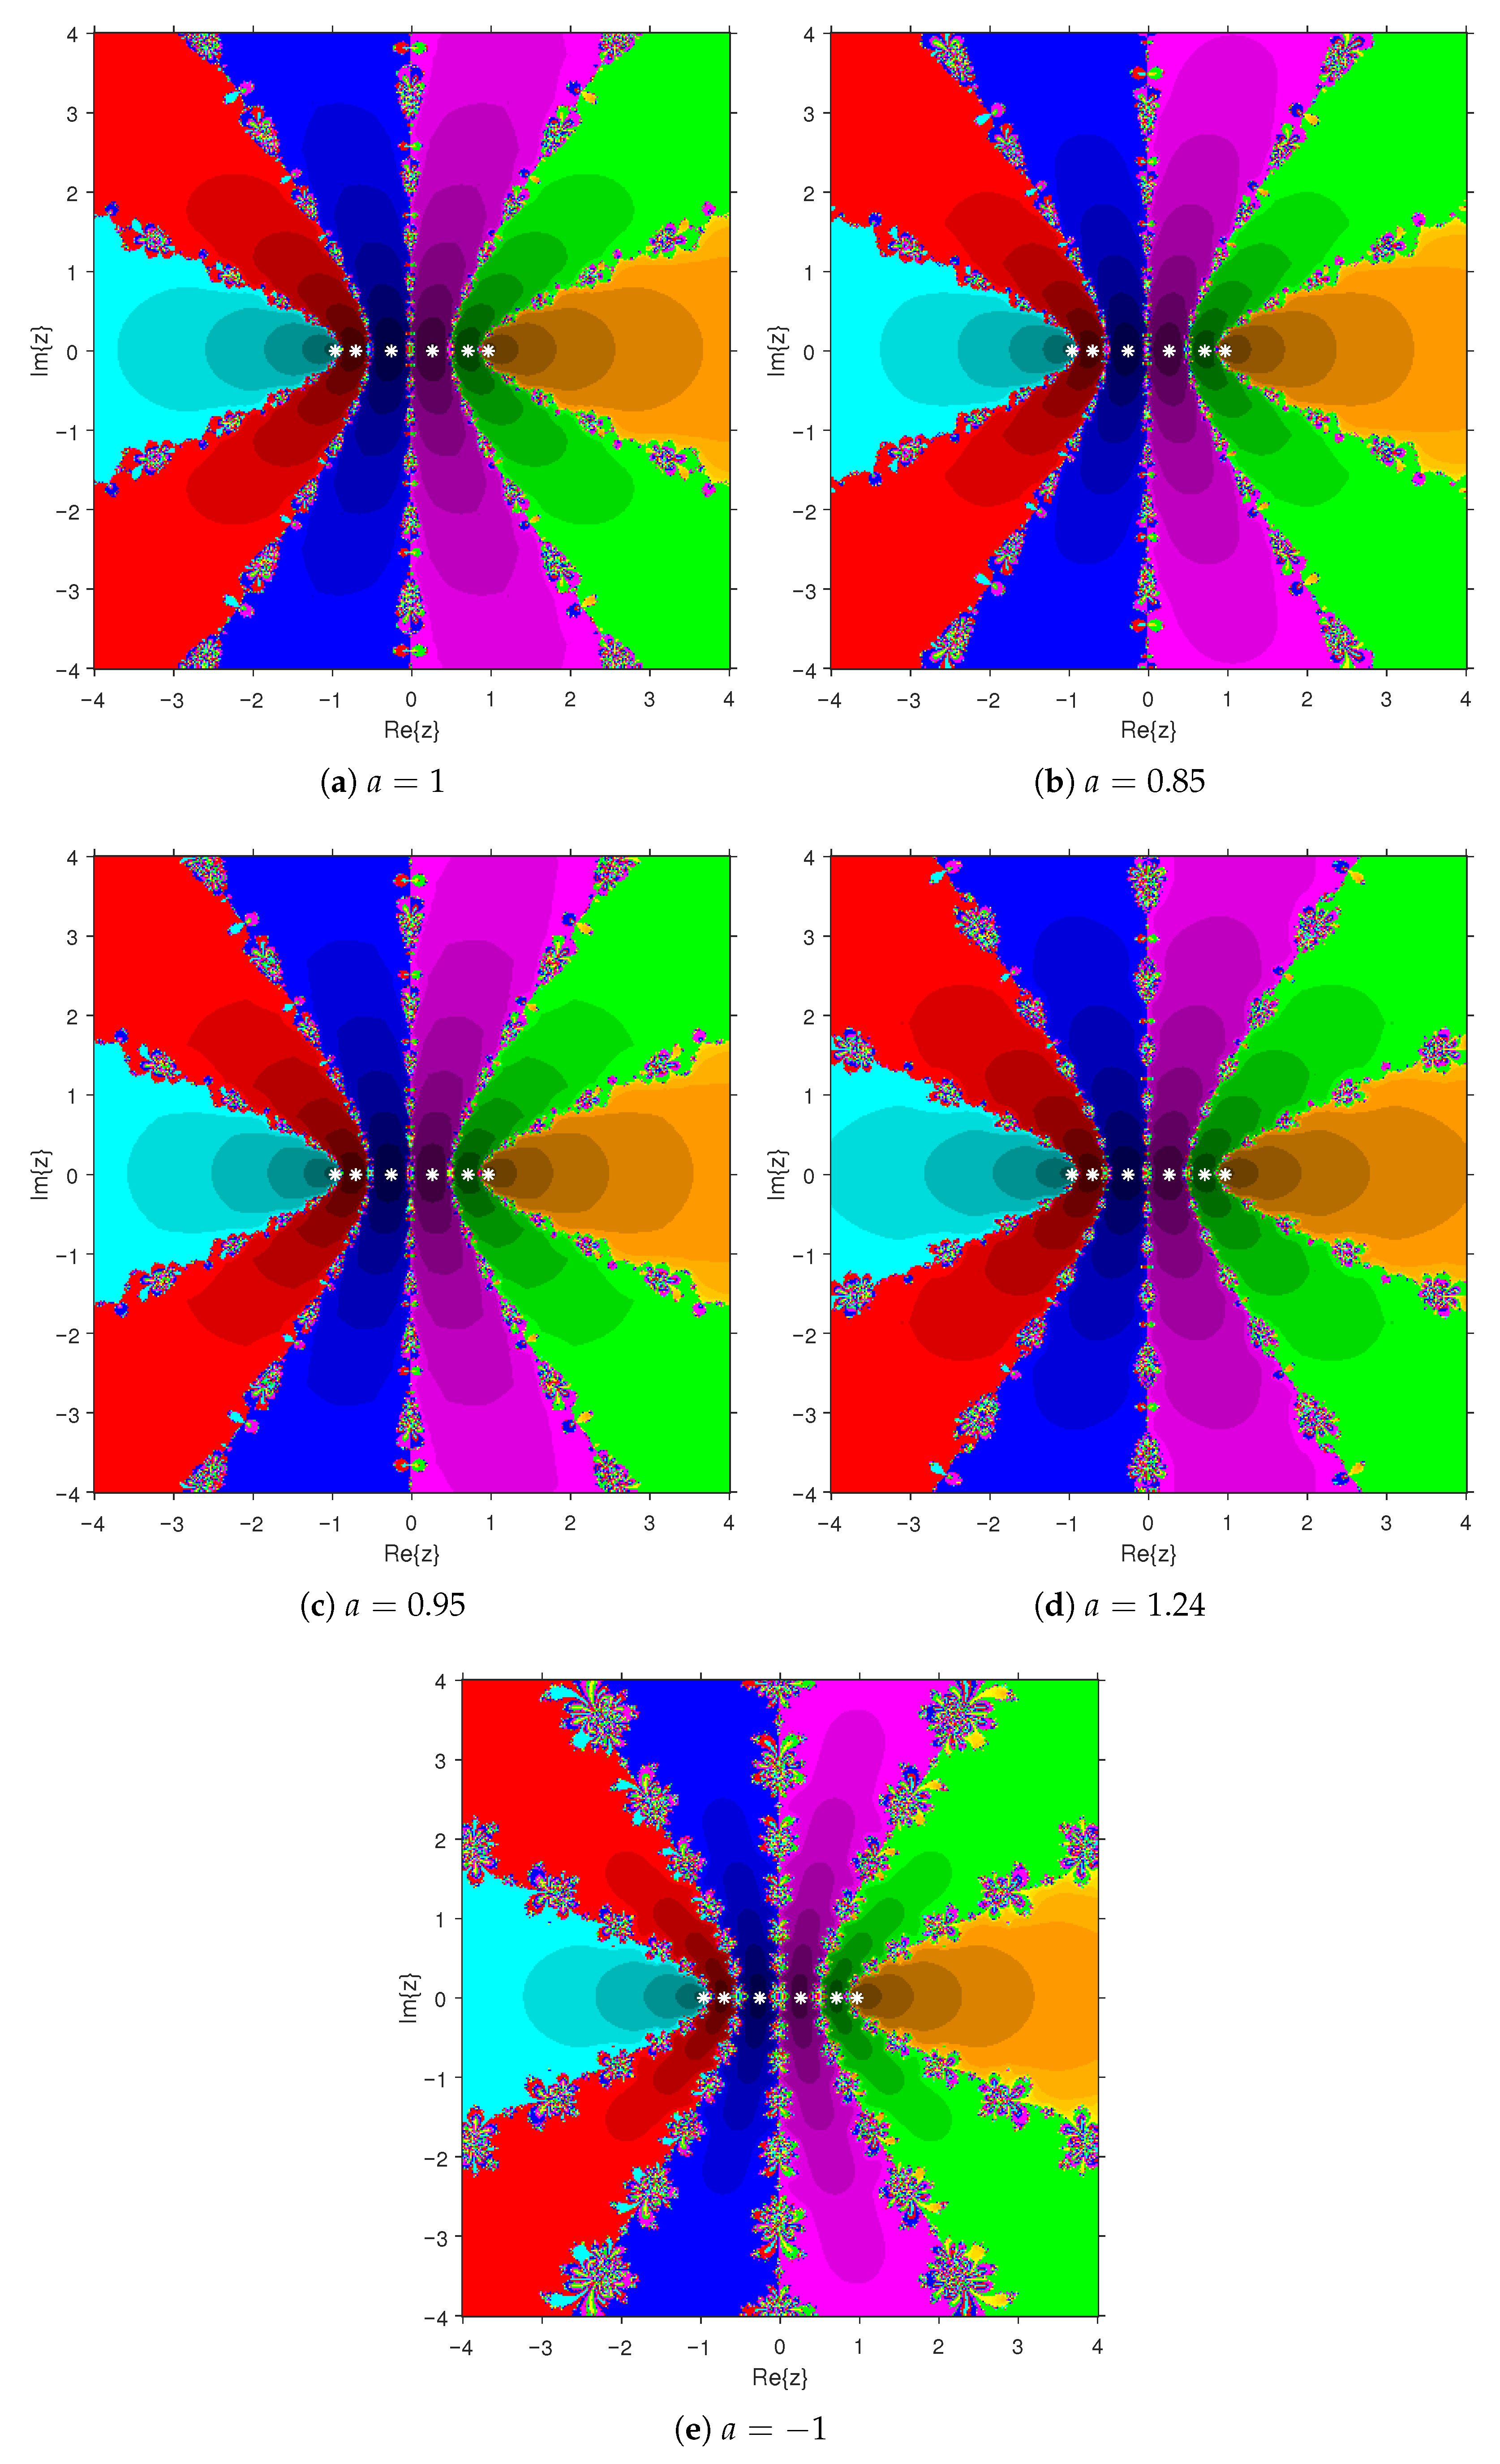
Each point on the grid serves as an initial point for PBIS, which is then applied to eight different functions, outlined in Examples 1 and 2. If the sequence formed by PBIS converges to a specific root, that point is classified within the corresponding basin of attraction and painted accordingly. The intensity of the color, ranging from light to dark, indicates the number of iterations needed to approximate the root. Points where PBIS fails to converge within the set criteria are color-coded in black. The iteration process is limited to 500 iterations or terminates earlier if the error in approximation is less than . We have considered five members of PBIS using , and . The white asterisks (*) indicate the roots in the figures. All graphical representations are created using MATLAB 2019a, providing a comprehensive view of the convergence properties and dynamics of PBIS in different regions of the complex plane.
Example 1.
The structure of basins of attraction is explored for the following of polynomials of degree three and four.
- (i)
- .
- (ii)
- .
- (iii)
- .
- (iv)
- .
- The visual representations of the attraction basins for the roots of , , , and are given in Figure 1a–e, Figure 2a–e, Figure 3a–e and Figure 4a–e, respectively. Each figure illustrates the complex dynamical behavior of PBIS applied to these polynomials and highlights the distinct regions in the complex plane that converge to different solutions. In particular, Figure 1a–e display the basins of attraction for the solutions of , where the regions shaded in yellow, green, and purple are linked to the solutions , , and , respectively. Similarly, in Figure 2a–e, the attraction regions associated with the solutions , , and 0 of are painted in orange, purple, and green, respectively. Figure 3a–e depict the basins of attraction for the solutions of . The points in the purple, orange, blue, and green areas converge to the solutions 1, 2, i, and , respectively. The points leading to the solutions , , , and of are highlighted in cyan, purple, orange, and green, respectively, in Figure 4a–e. Notice that the Figure 2a–e and Figure 4a–e reveal basin structures that are symmetric with respect to the real axis. From these figures, it is evident that the black regions, representing the Julia set, are considerably smaller for , . This observation indicates that PBIS exhibits better stability when applied to solving these equations.
Example 2.
The configuration of attraction basins is investigated for the following fifth- and sixth-degree polynomials.
- (i)
- .
- (ii)
- .
- (iii)
- .
- (iv)
- .
- The graphical illustration of the attraction basins for the roots of , , , and are given in Figure 5a–e, Figure 6a–e, Figure 7a–e and Figure 8a–e, respectively. In Figure 5a–e, the regions marked in yellow, blue, purple, red, and green are the basins of attraction related to the solutions , 1, , 2, and of , respectively. Similarly, the basins of attraction for the solutions of are illustrated in Figure 6a–e. In this case, the attraction regions corresponding to , , 0, , and of are highlighted in orange, blue, green, purple, and red, respectively. The orange, green, red, blue, purple, and cyan areas in Figure 7a–e are linked to the attraction basins of the solutions , , , i, 1, and of , respectively. For the polynomial , the corresponding basins are shown in Figure 8a–e. The attraction regions are color-coded as follows: Cyan corresponds to , blue to , red to , purple to , orange to , and green to . It is noticed that the basin patterns in Figure 6a–e and Figure 8a–e maintain symmetry about the real axis. Furthermore, a close inspection of the plots reveals that the black regions, representing the Julia set, are notably smaller for , . This observation suggests that PBIS exhibits strong convergence characteristics and enhanced numerical stability when applied to solving these polynomial equations.
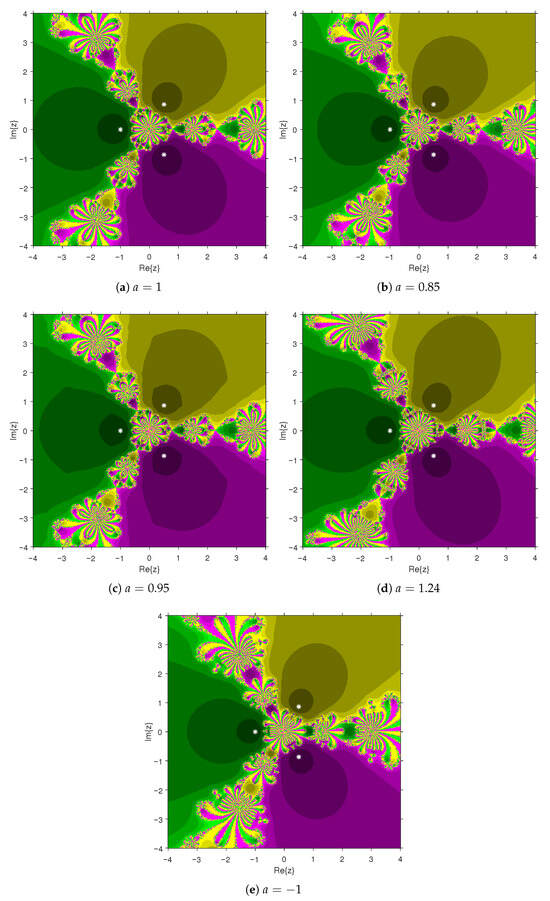
Figure 1.
Basins of attraction associated with Example 1(i), where PBIS is applied for different values of a.
Figure 1.
Basins of attraction associated with Example 1(i), where PBIS is applied for different values of a.
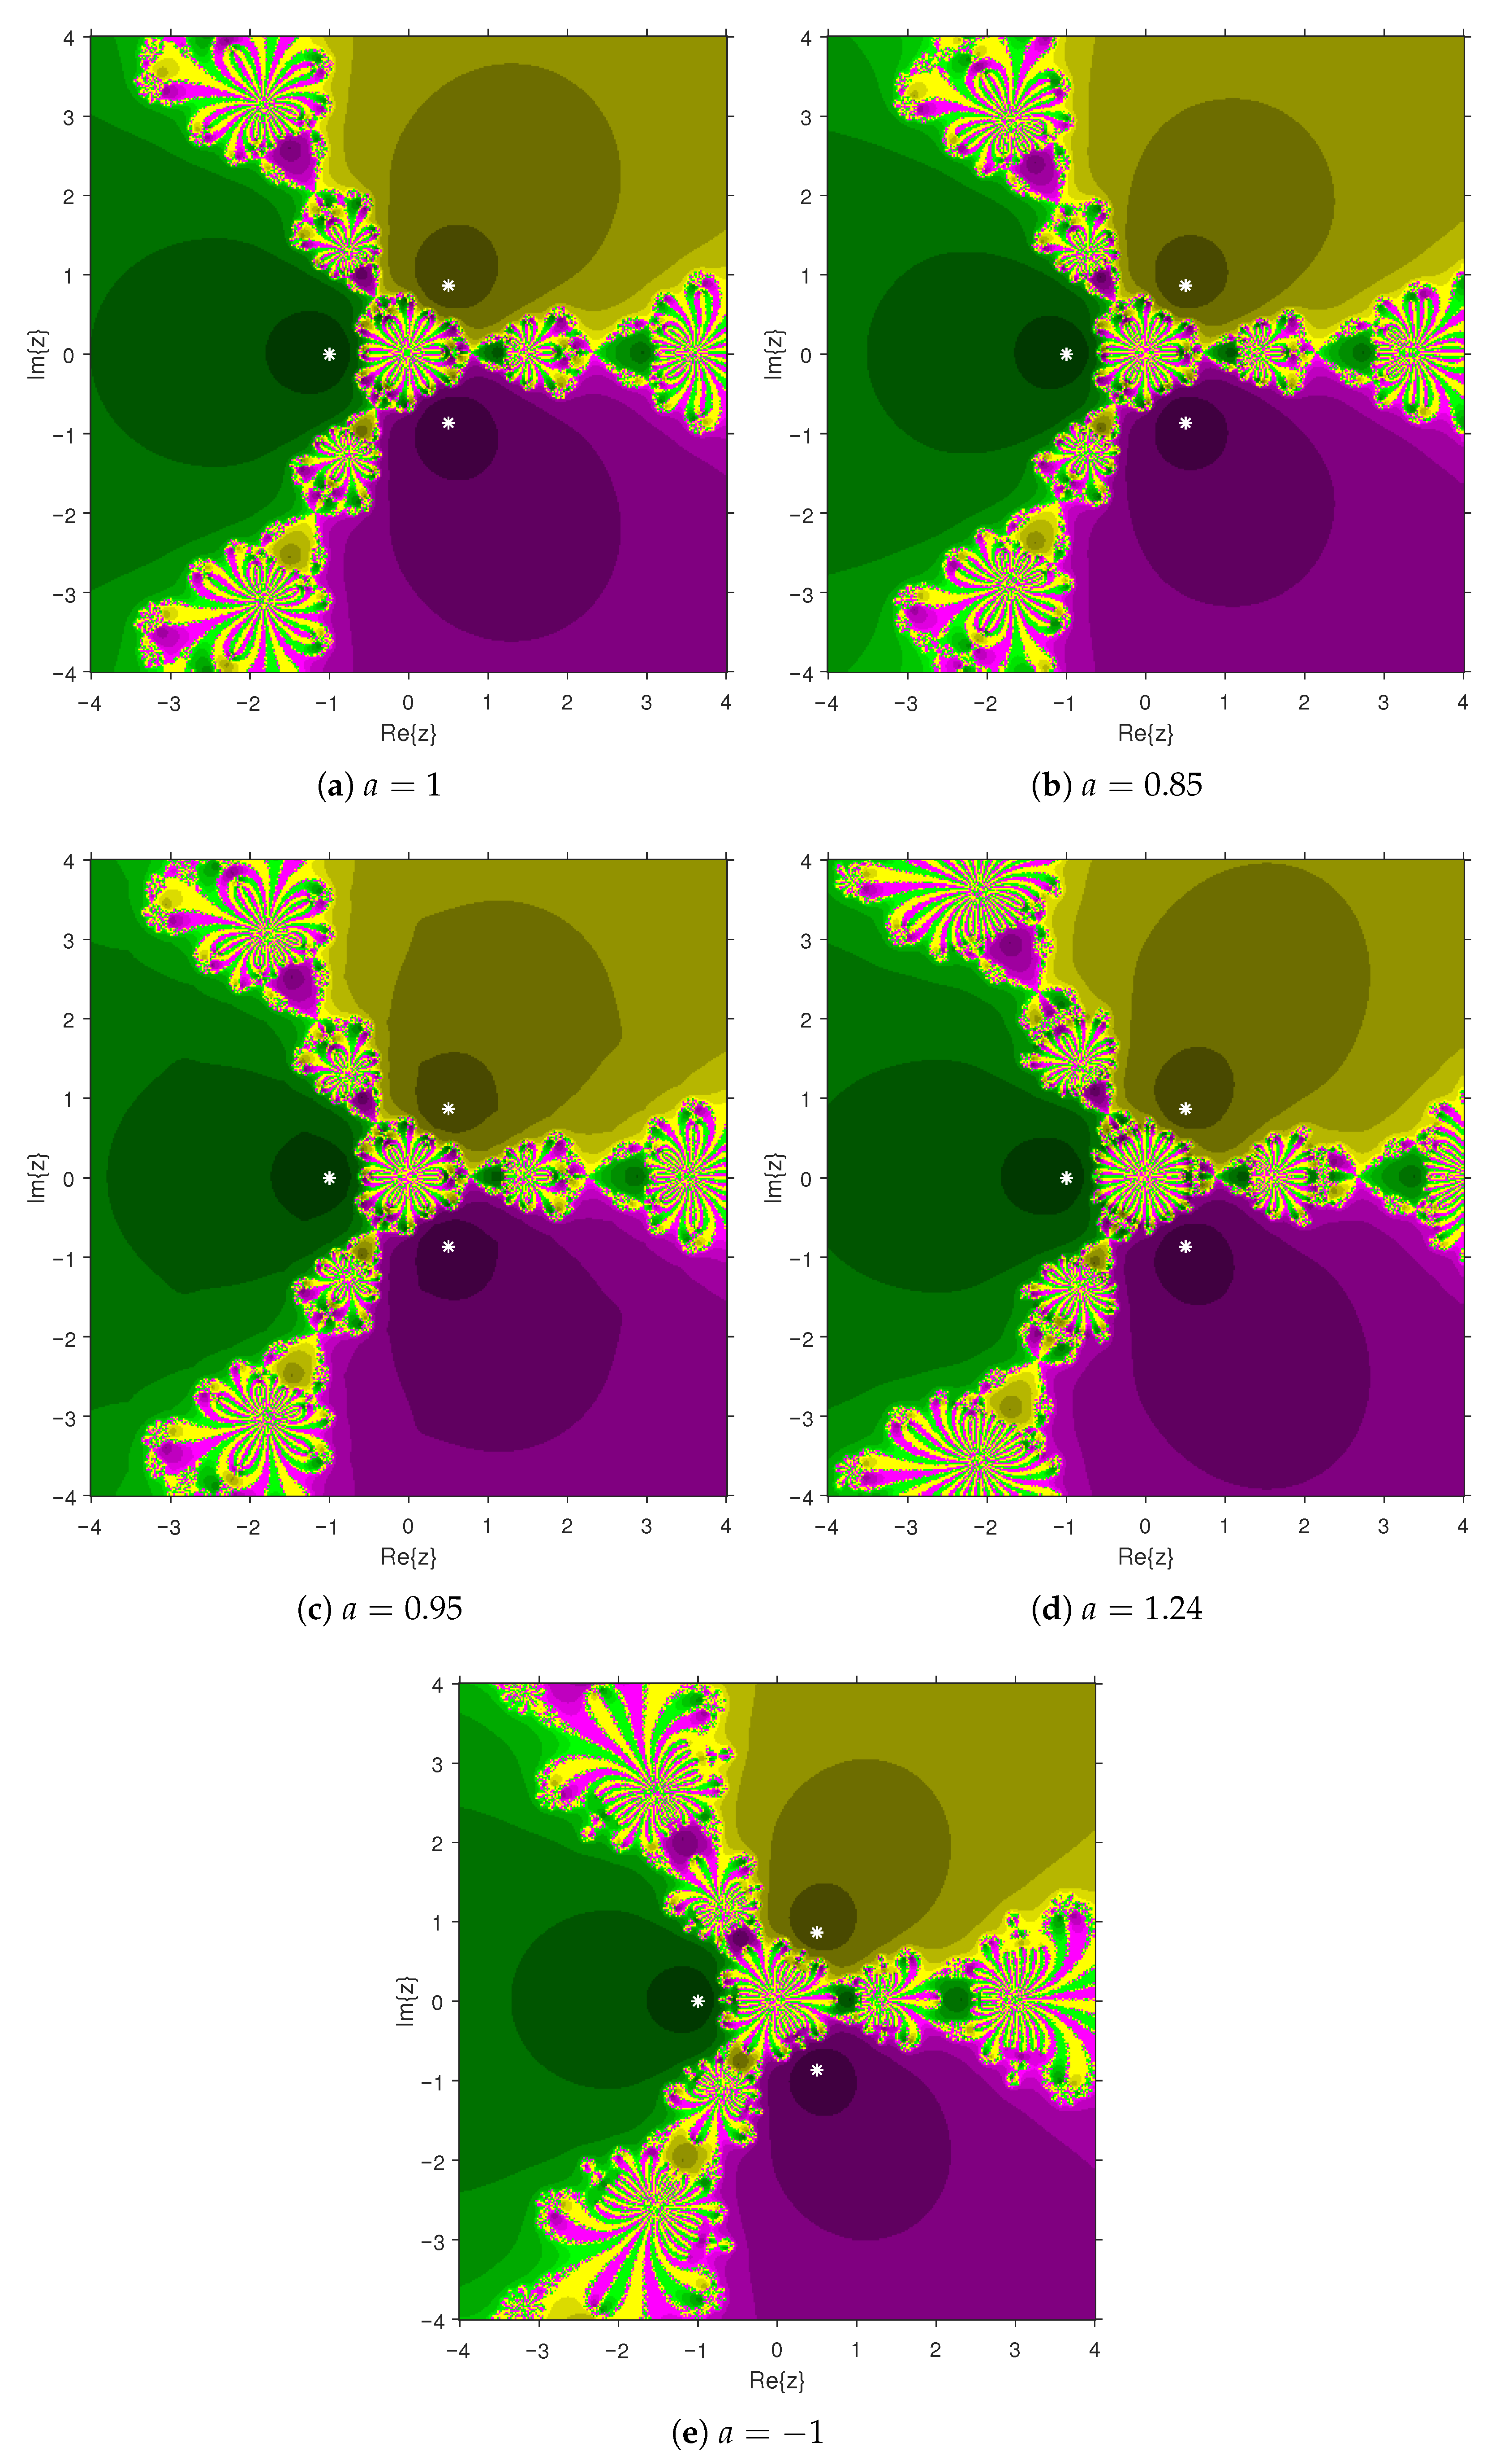
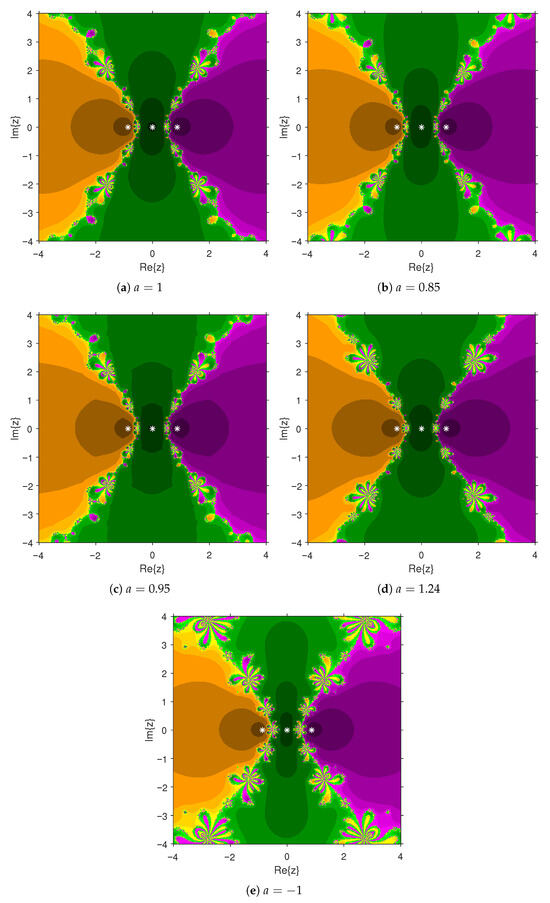
Figure 2.
Basins of attraction associated with Example 1(ii), where PBIS is applied for different values of a.
Figure 2.
Basins of attraction associated with Example 1(ii), where PBIS is applied for different values of a.
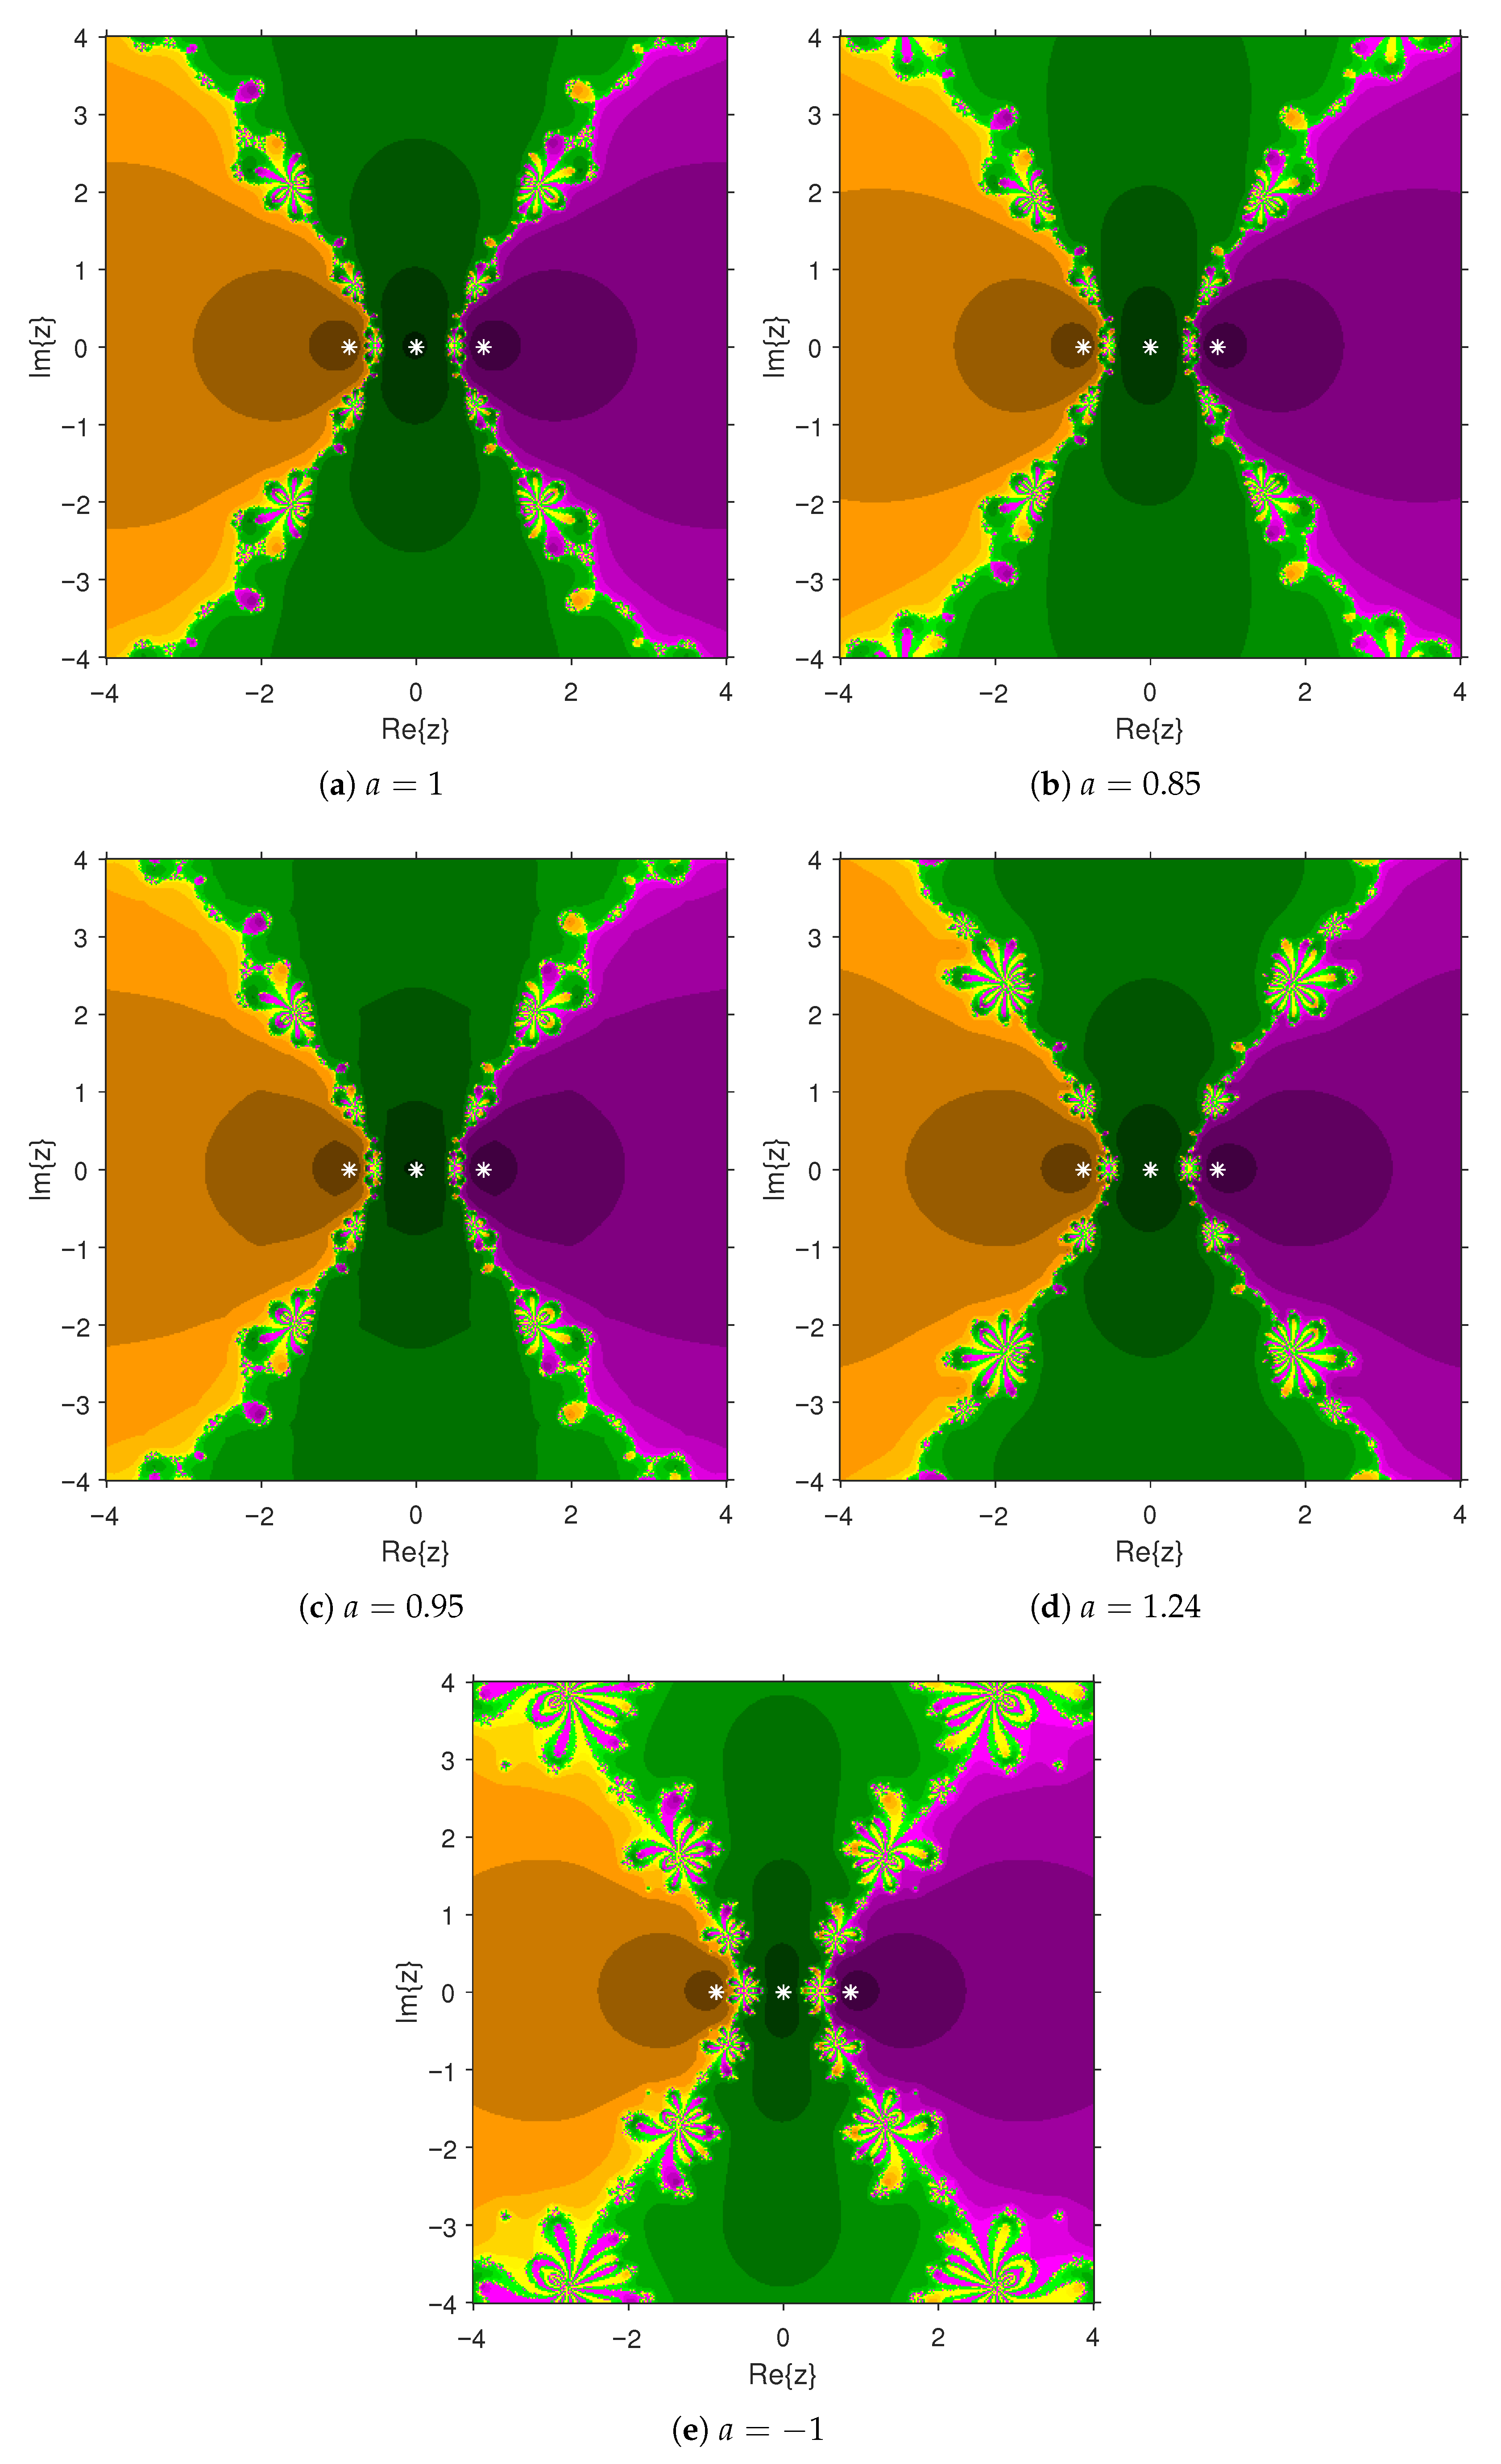
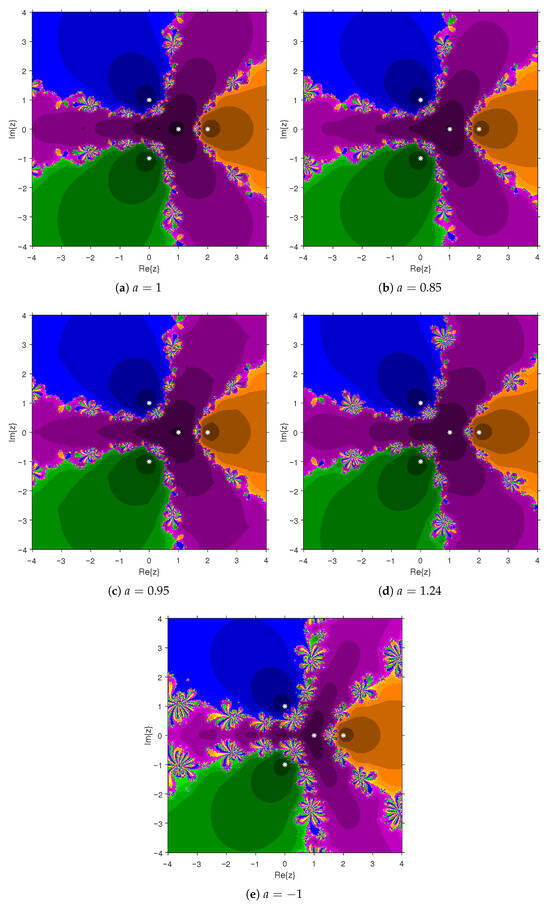
Figure 3.
Basins of attraction associated with Example 1(iii), where PBIS is applied for different values of a.
Figure 3.
Basins of attraction associated with Example 1(iii), where PBIS is applied for different values of a.
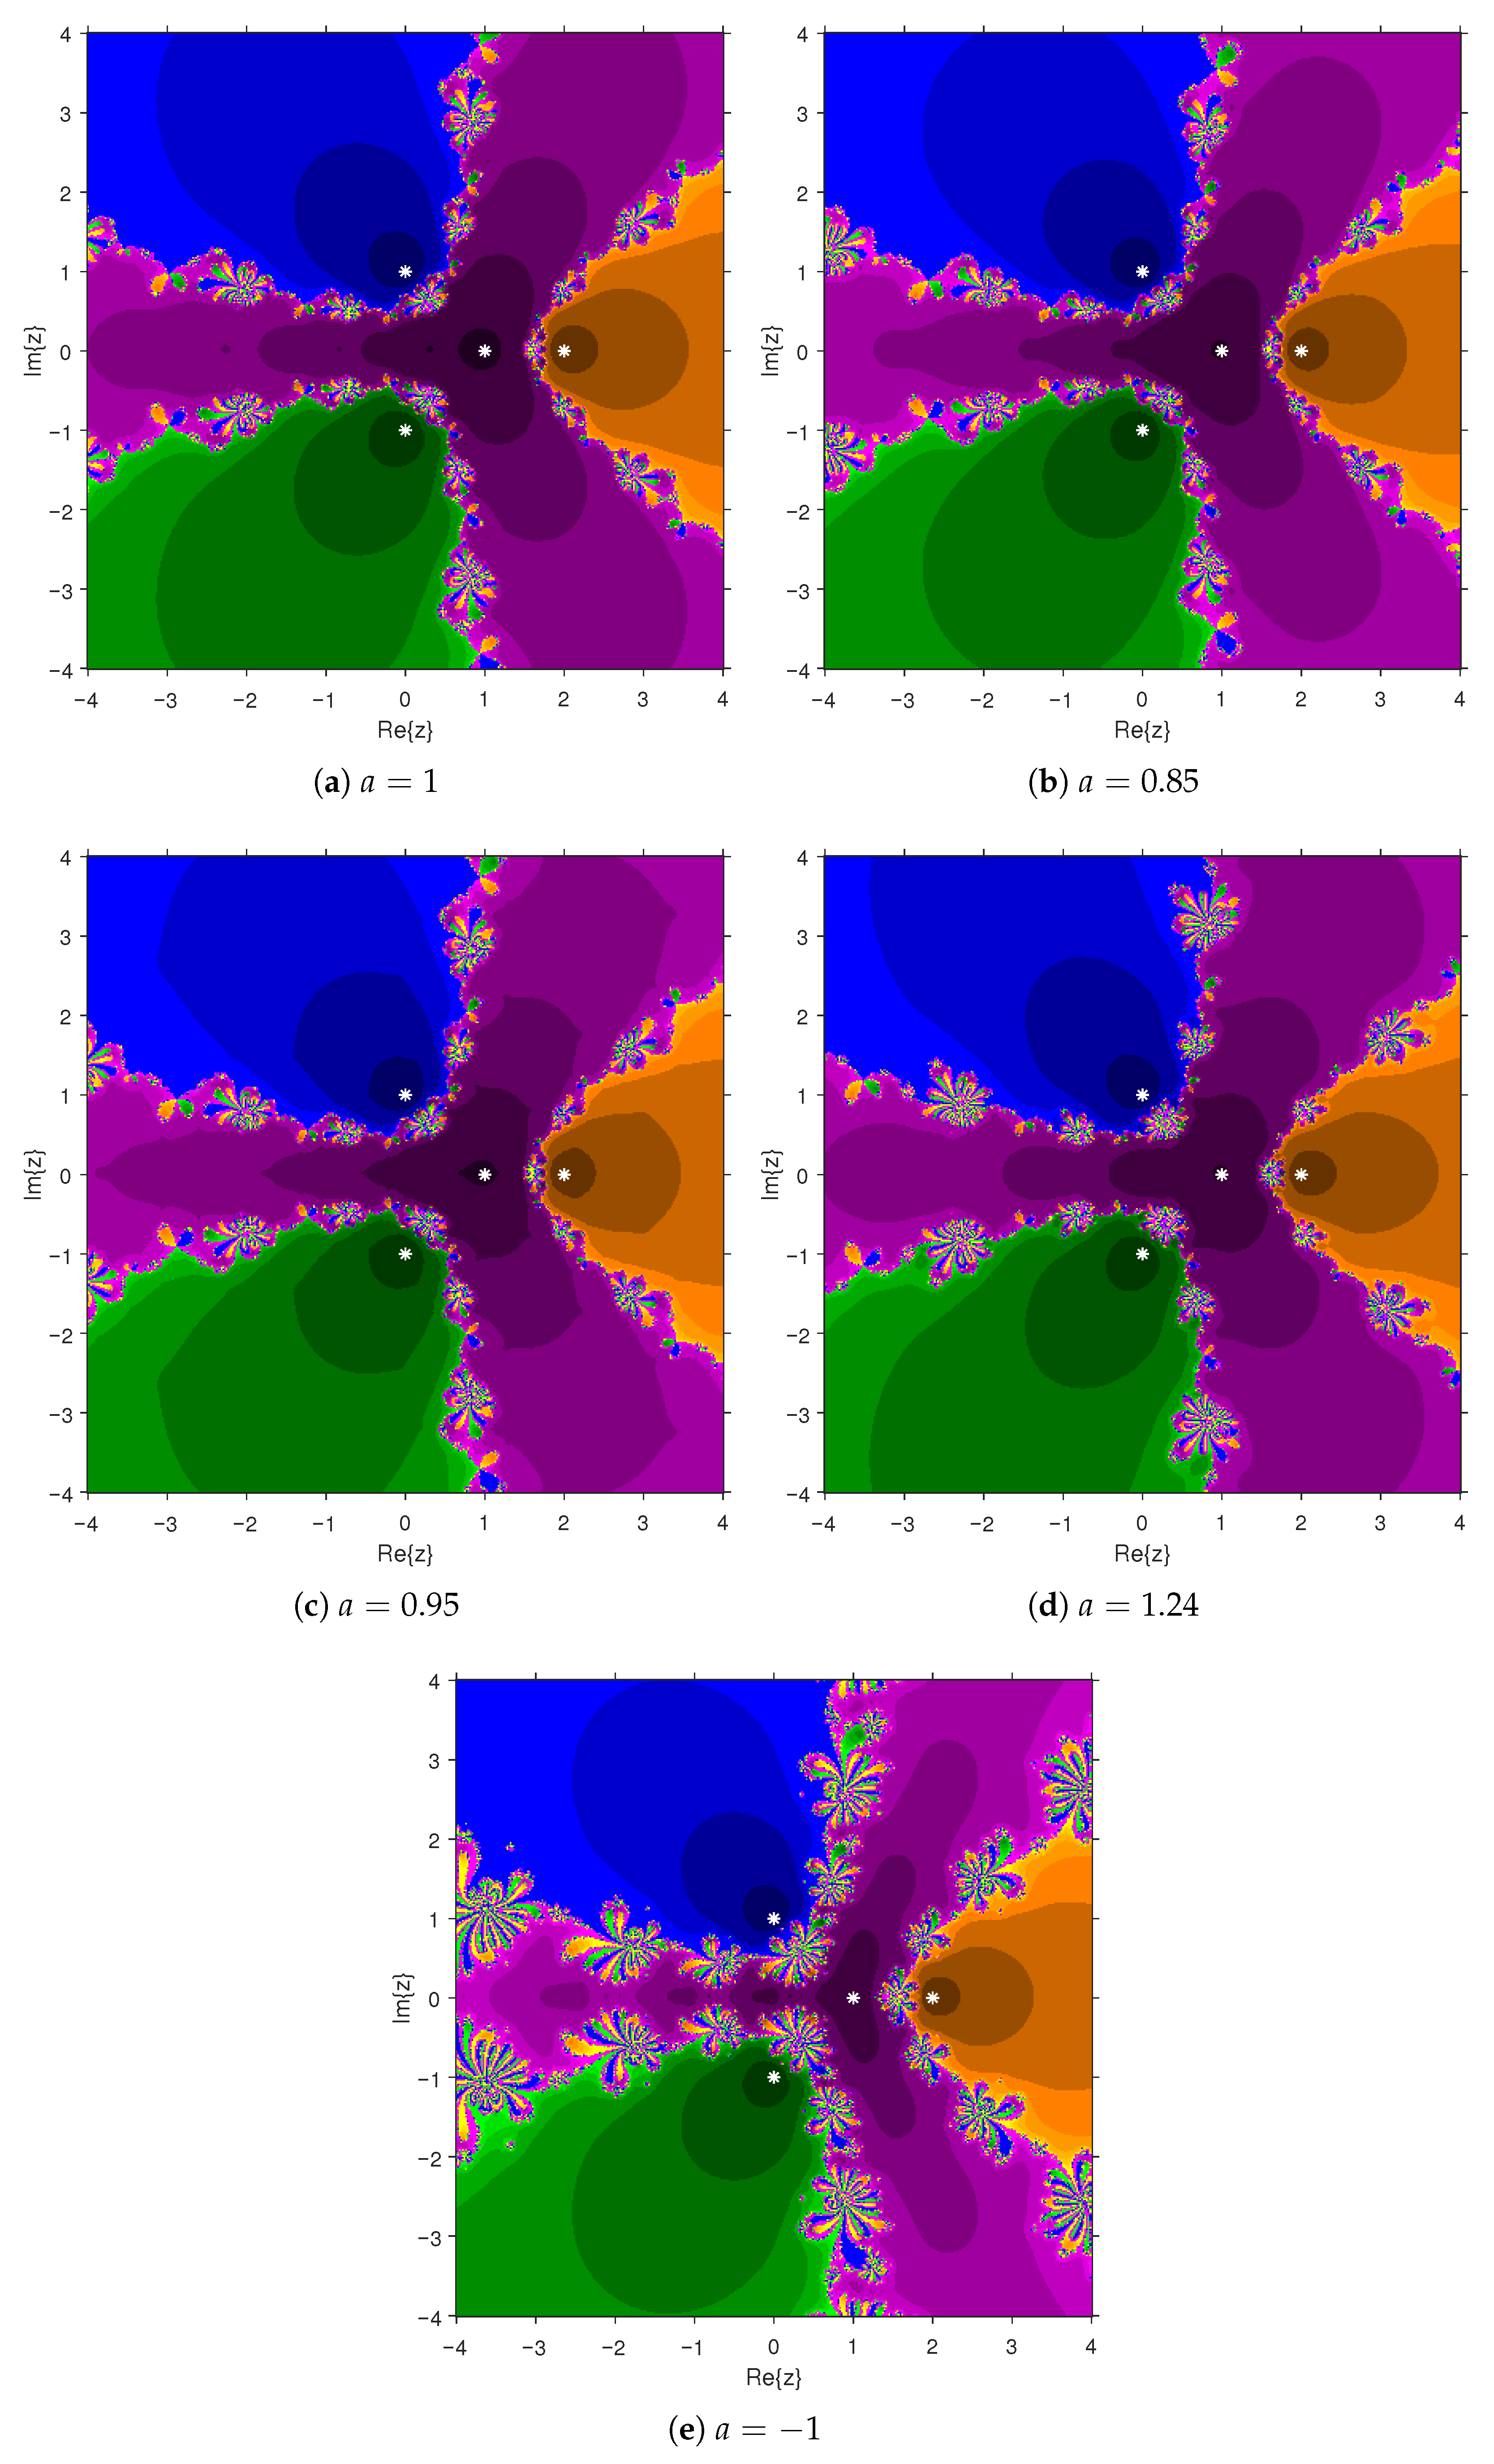
Figure 4.
Basins of attraction associated with Example 1(iv), where PBIS is applied for different values of a.
Figure 4.
Basins of attraction associated with Example 1(iv), where PBIS is applied for different values of a.
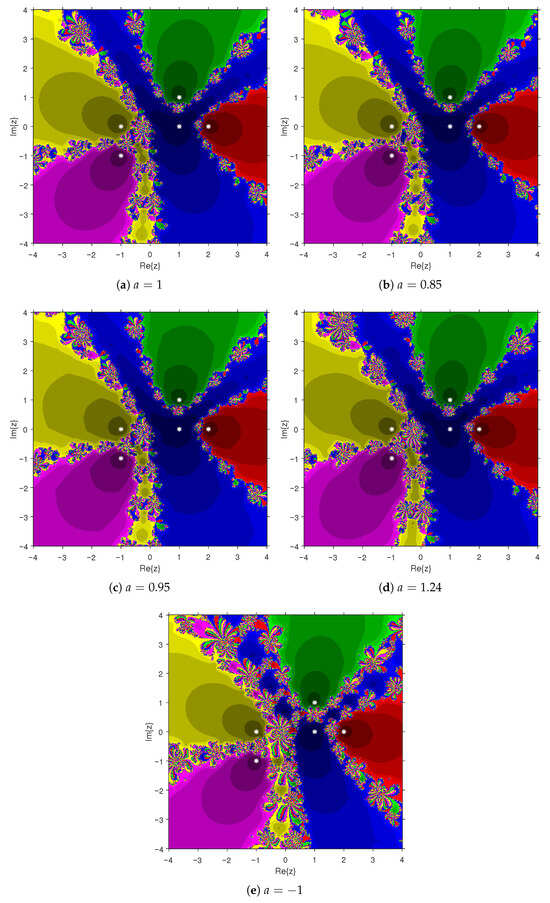
Figure 5.
Basins of attraction associated with Example 2(i), where PBIS is applied for different values of a.
Figure 5.
Basins of attraction associated with Example 2(i), where PBIS is applied for different values of a.
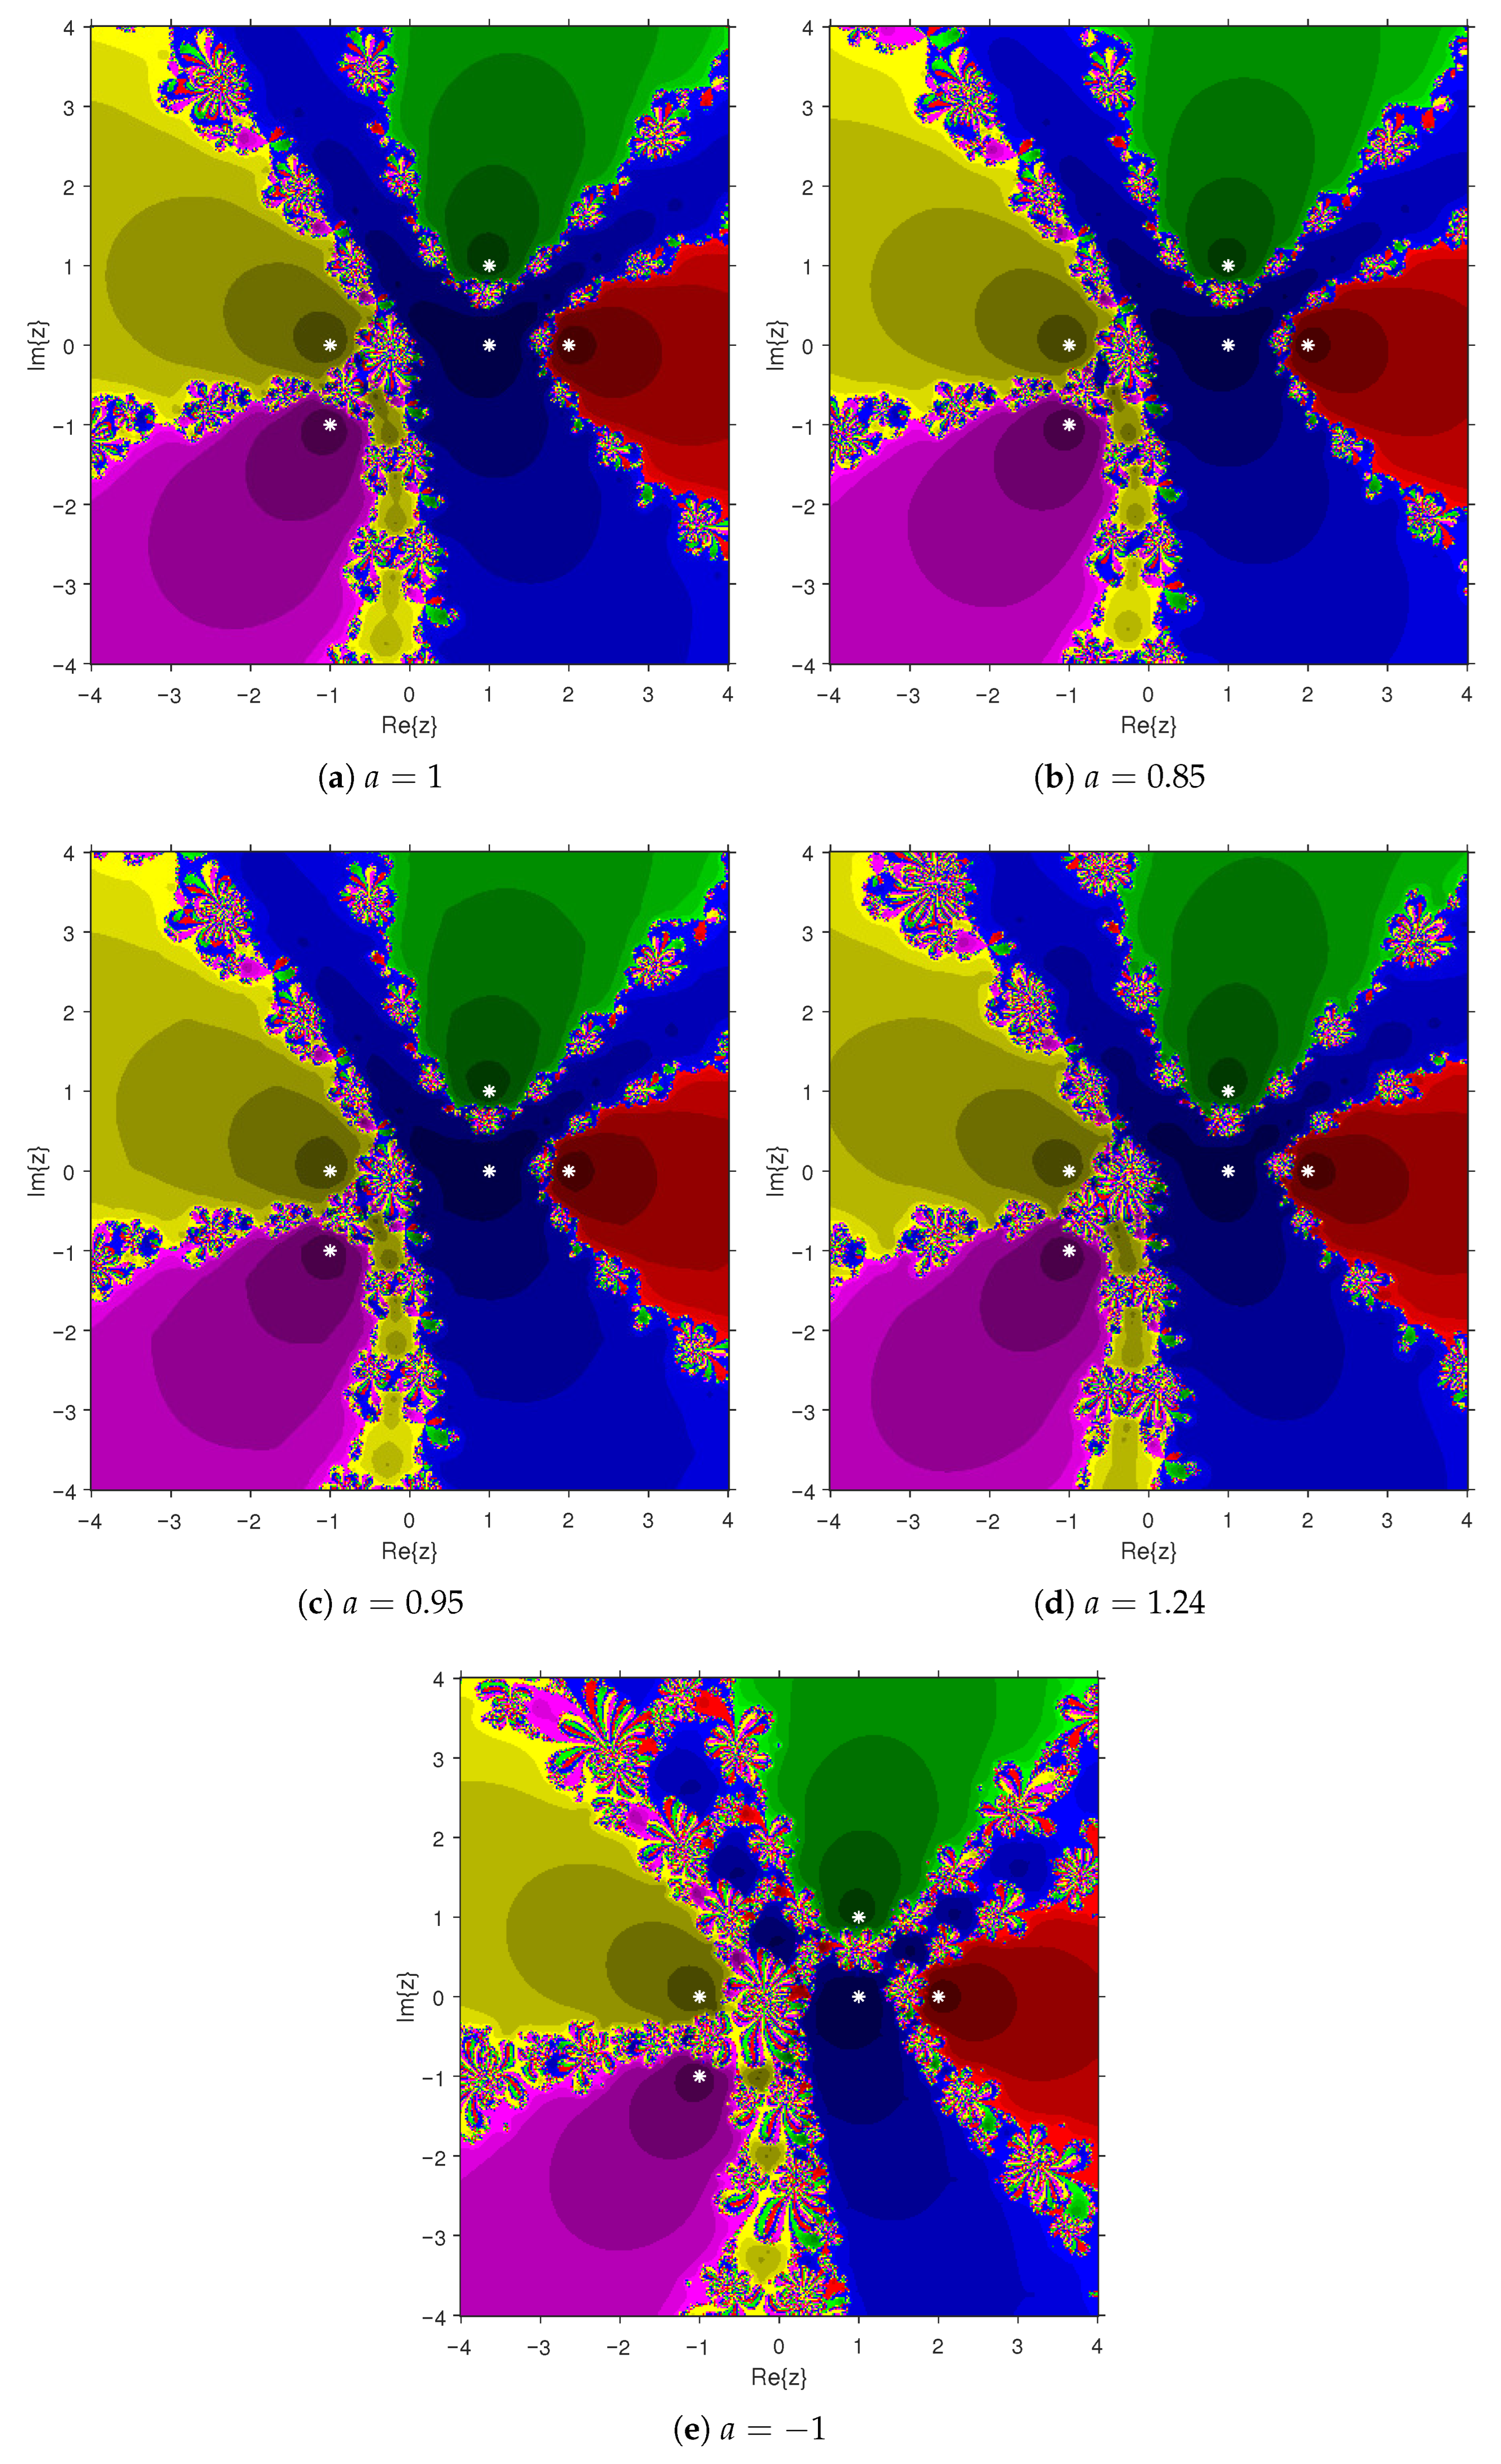
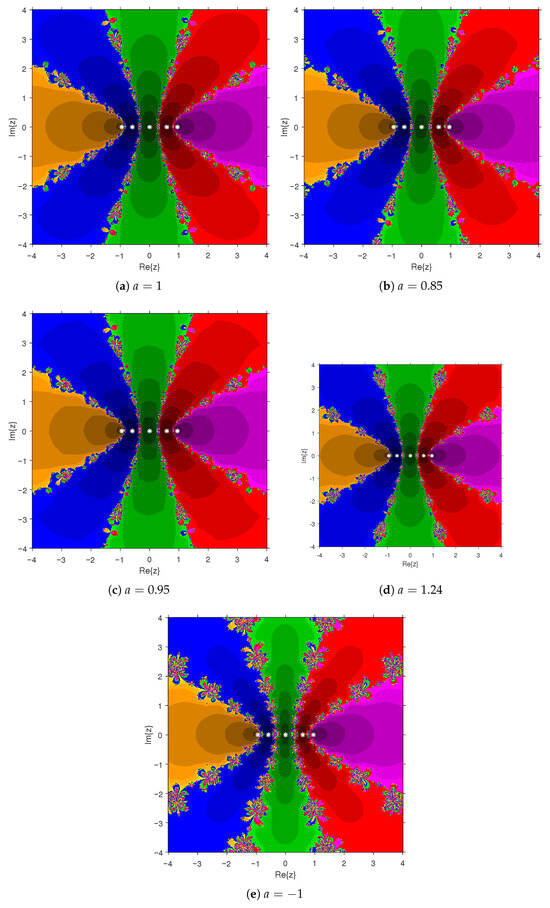
Figure 6.
Basins of attraction associated with Example 2(ii), where PBIS is applied for different values of a.
Figure 6.
Basins of attraction associated with Example 2(ii), where PBIS is applied for different values of a.
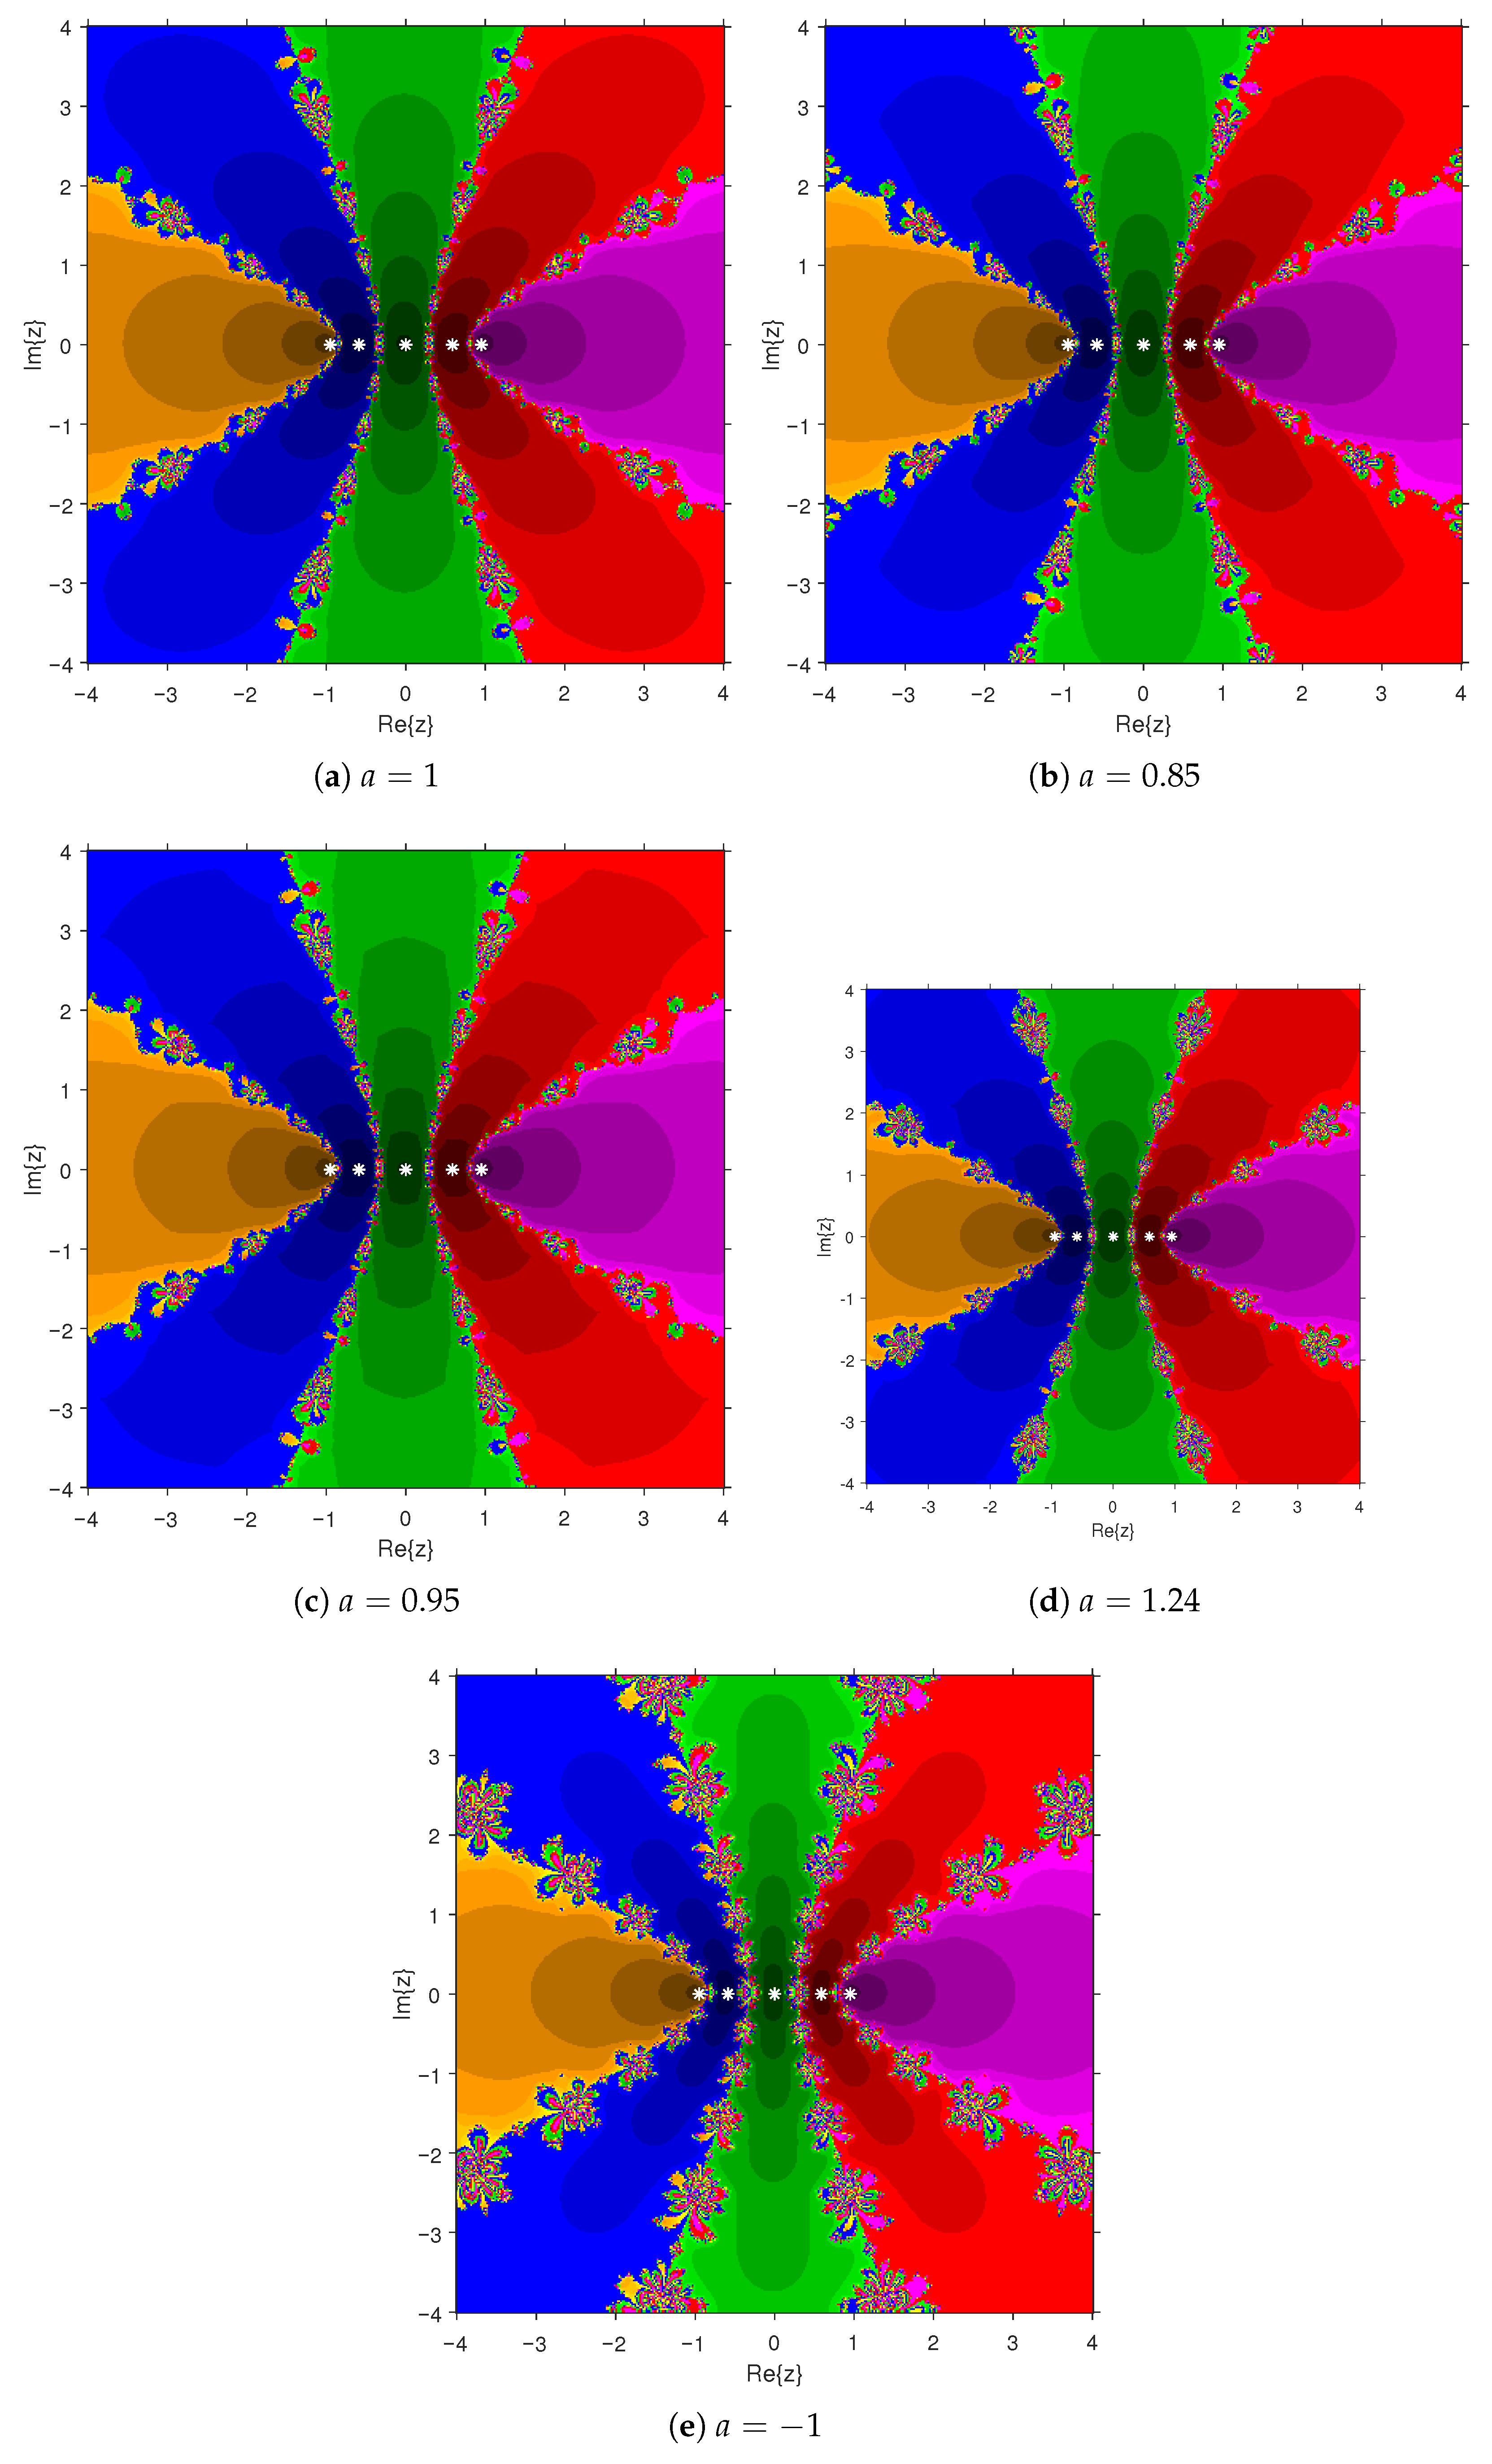
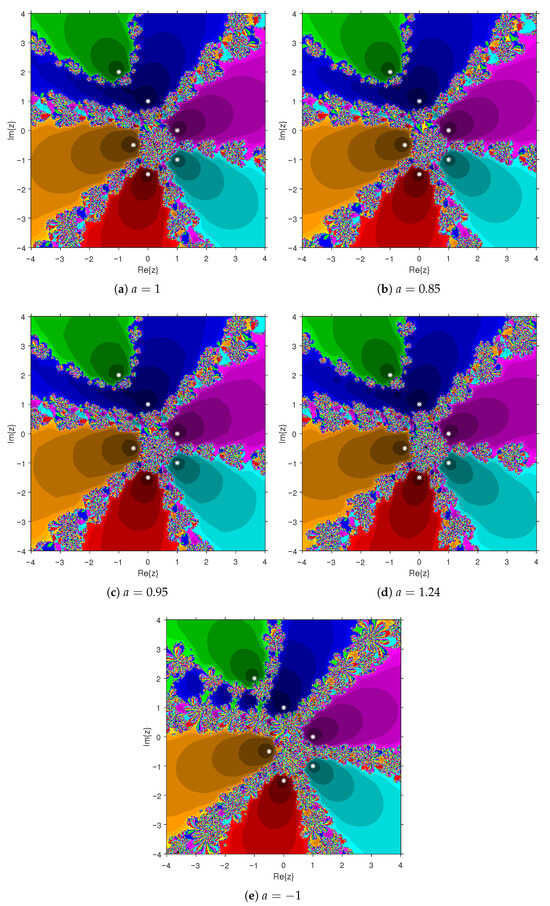
Figure 7.
Basins of attraction associated with Example 2(iii), where PBIS is applied for different values of a.
Figure 7.
Basins of attraction associated with Example 2(iii), where PBIS is applied for different values of a.
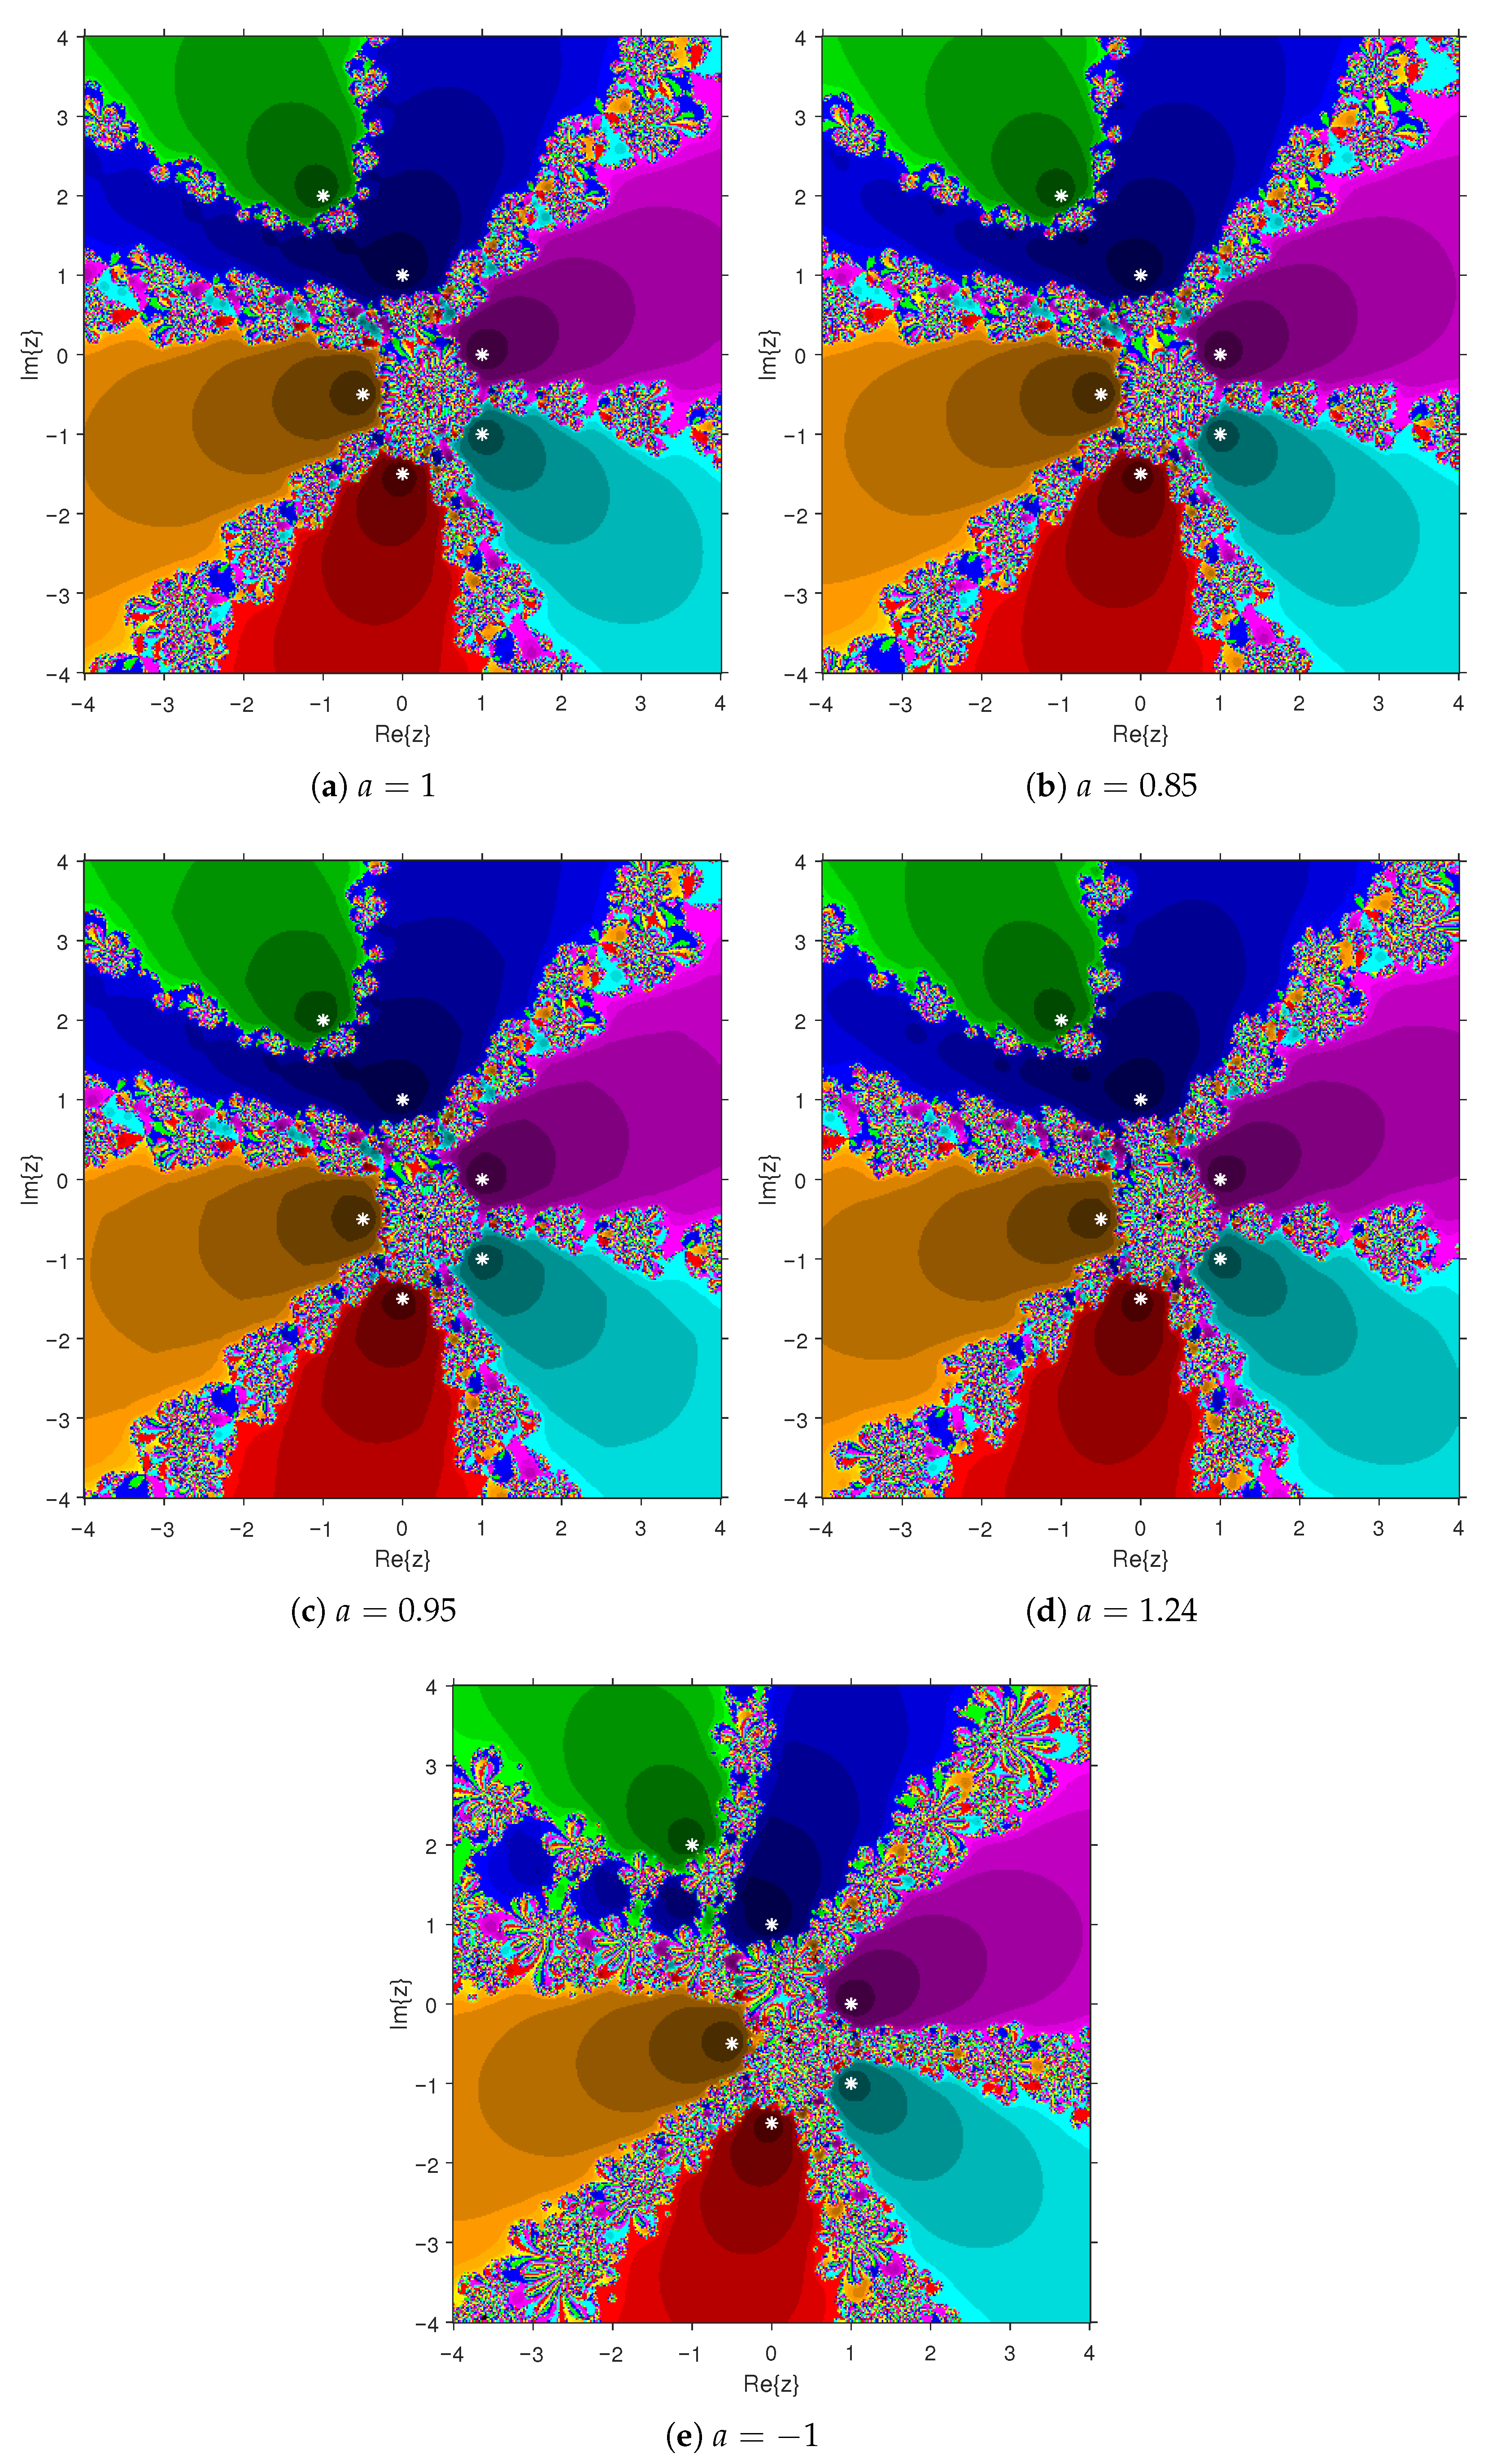
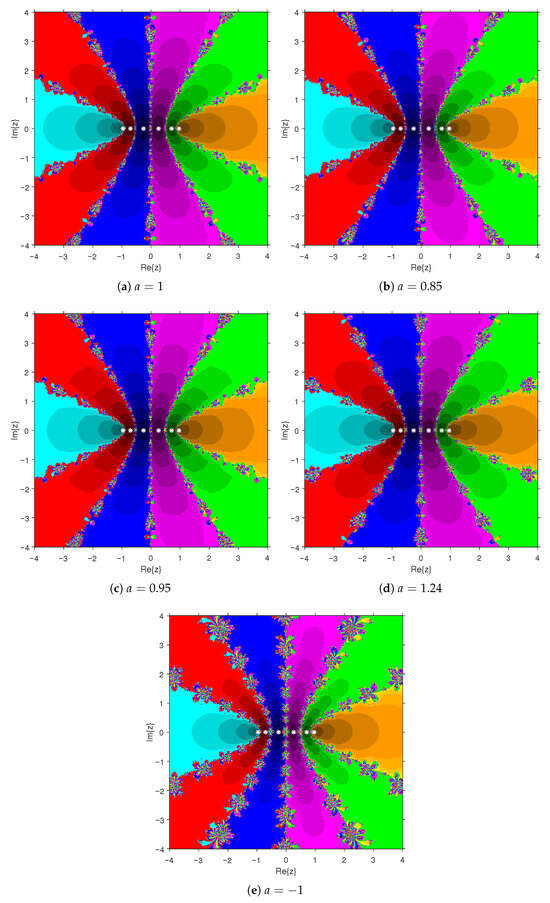
Figure 8.
Basins of attraction associated with Example 2(iv), where PBIS is applied for different values of a.
Figure 8.
Basins of attraction associated with Example 2(iv), where PBIS is applied for different values of a.
4. Computational Verification of the Presented Analysis
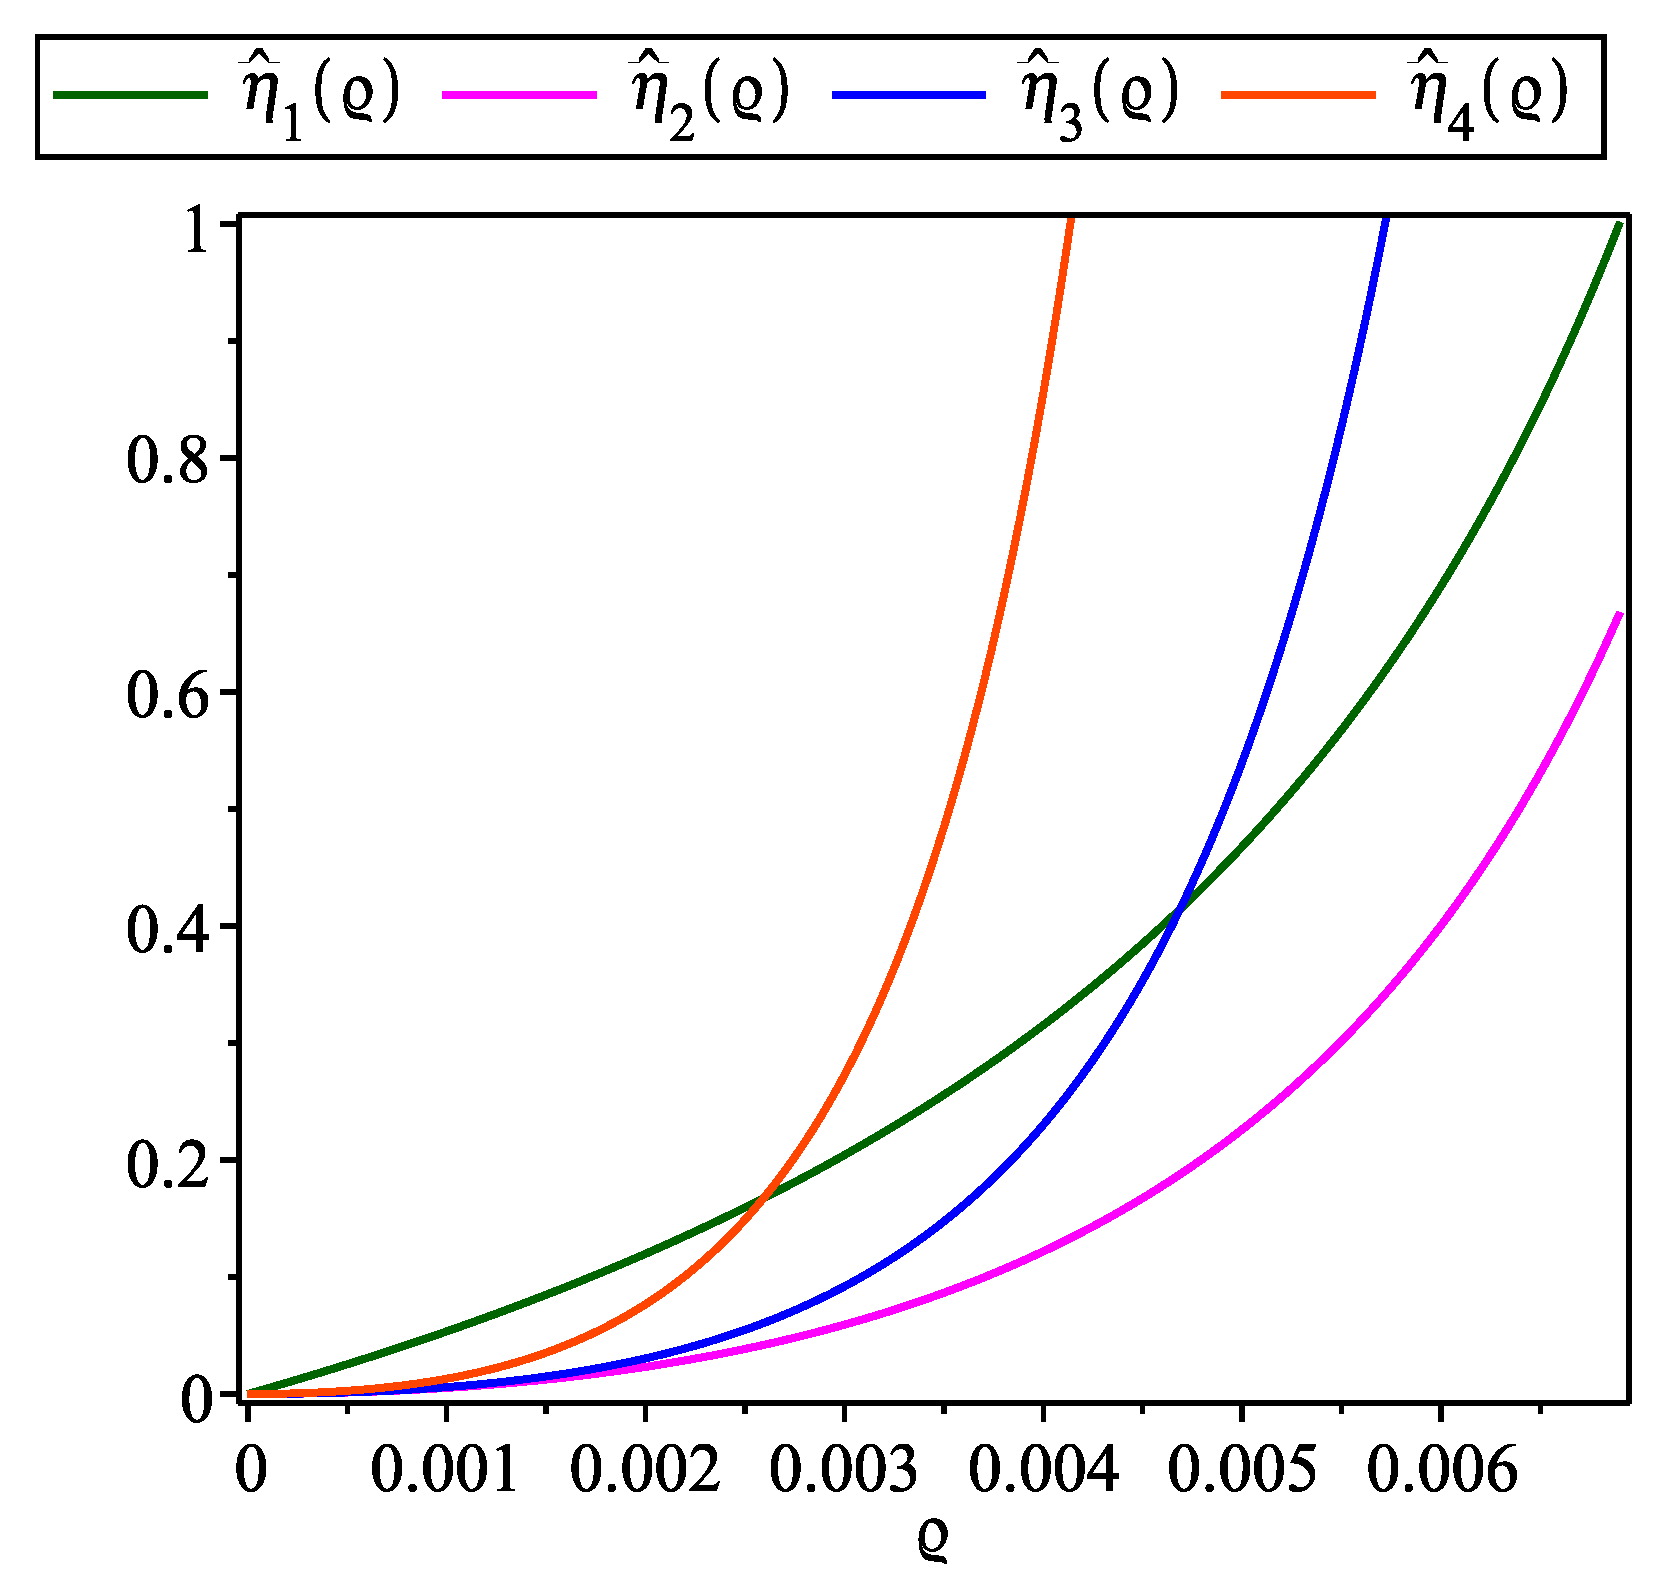
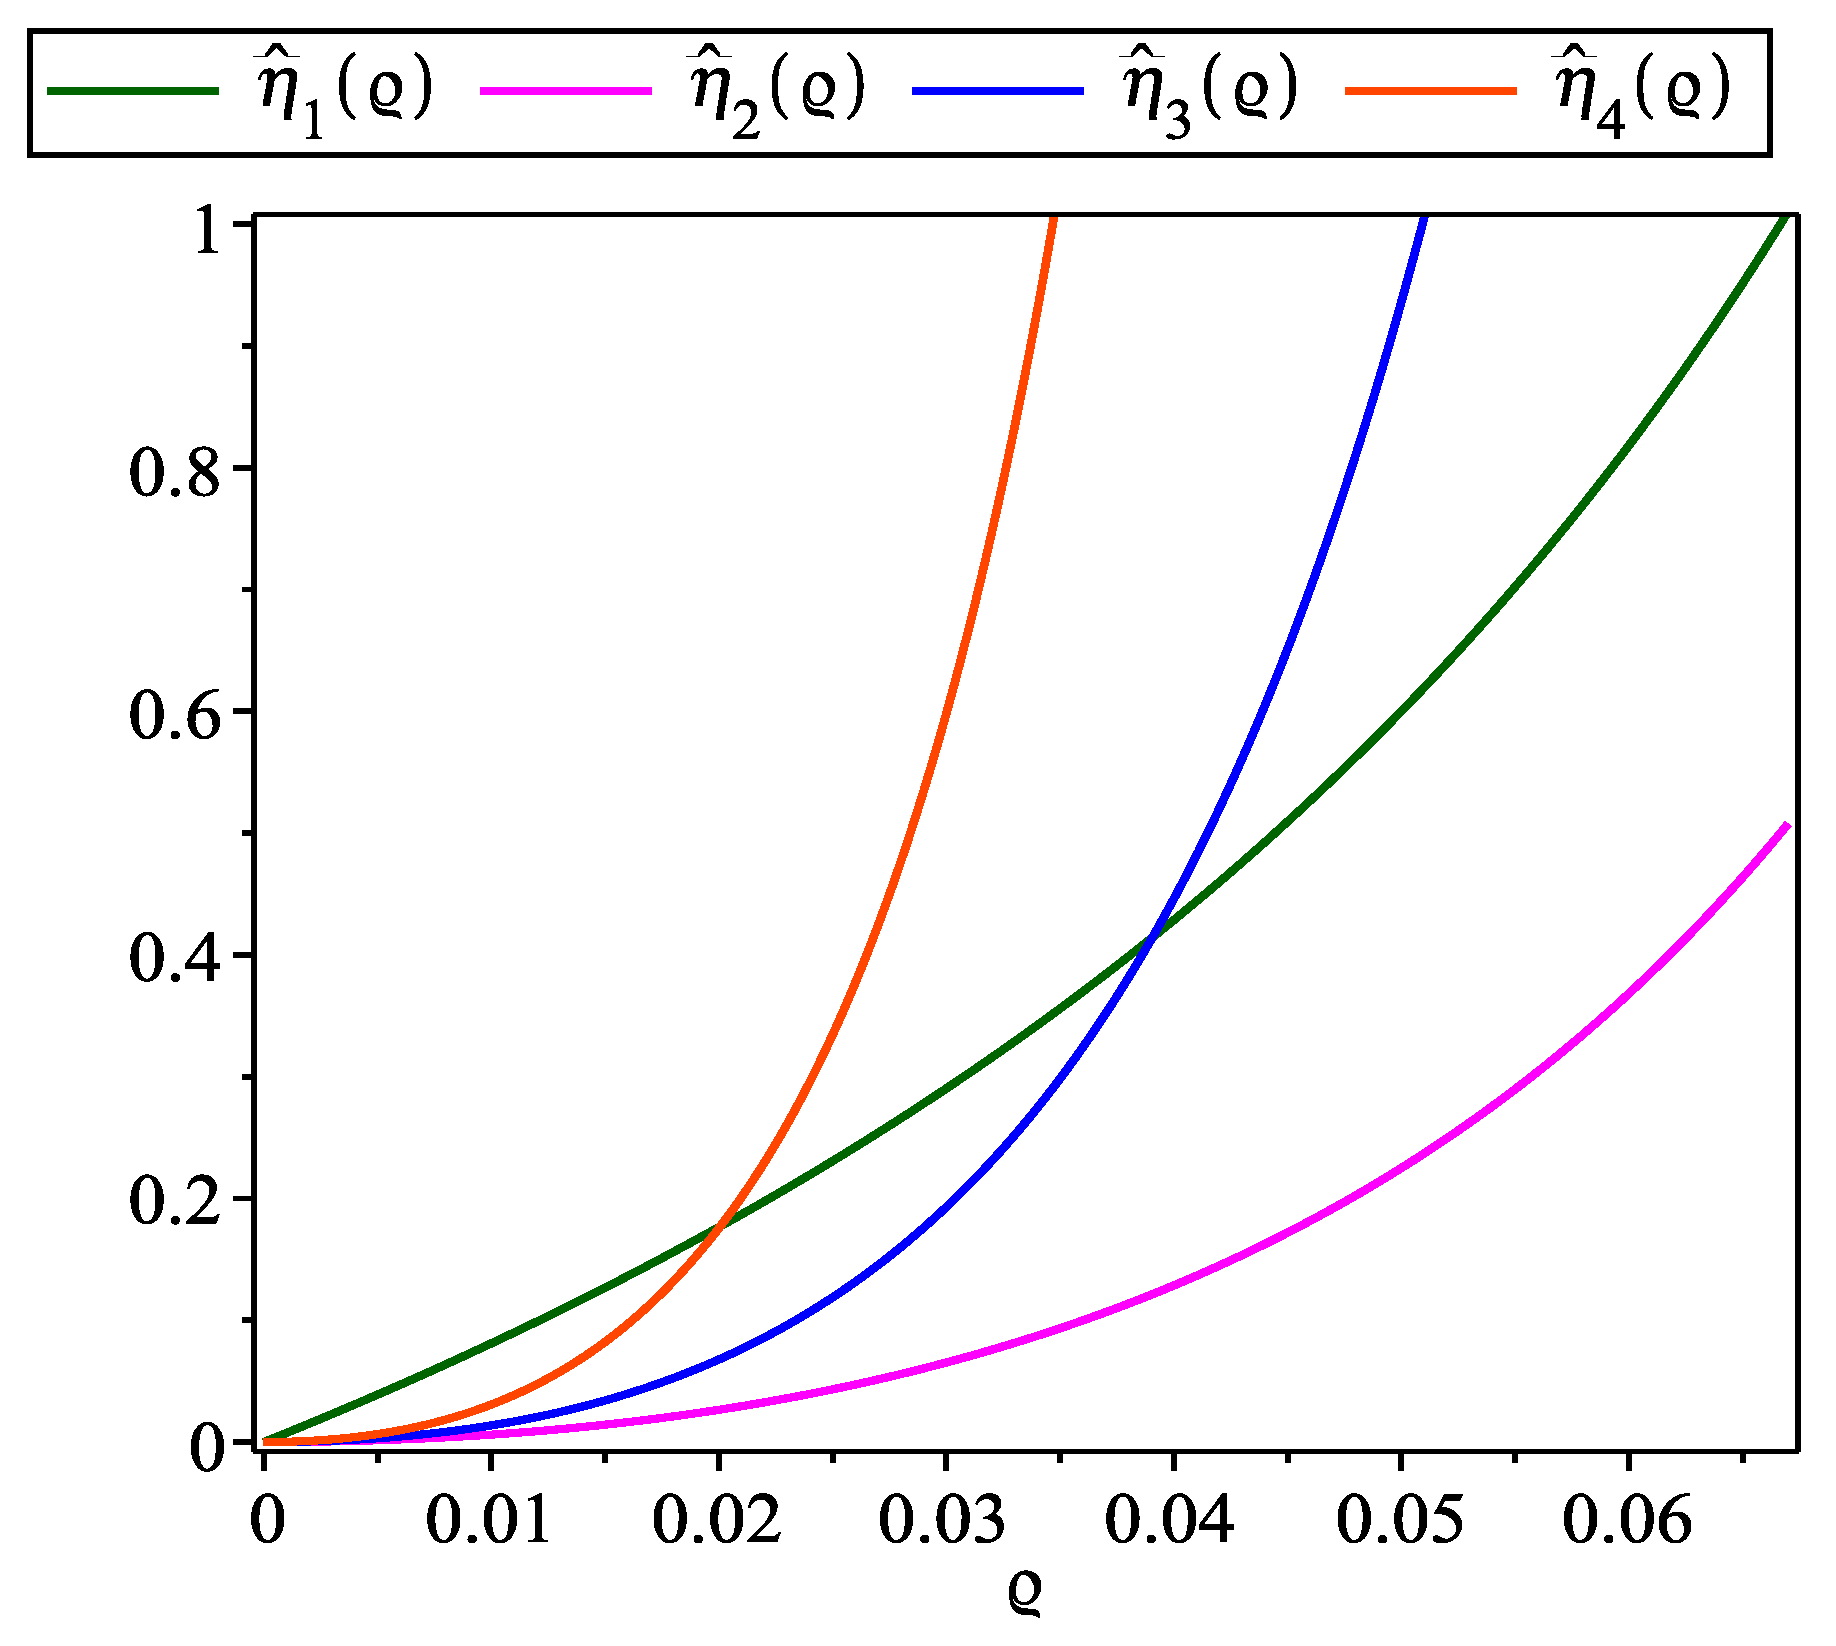
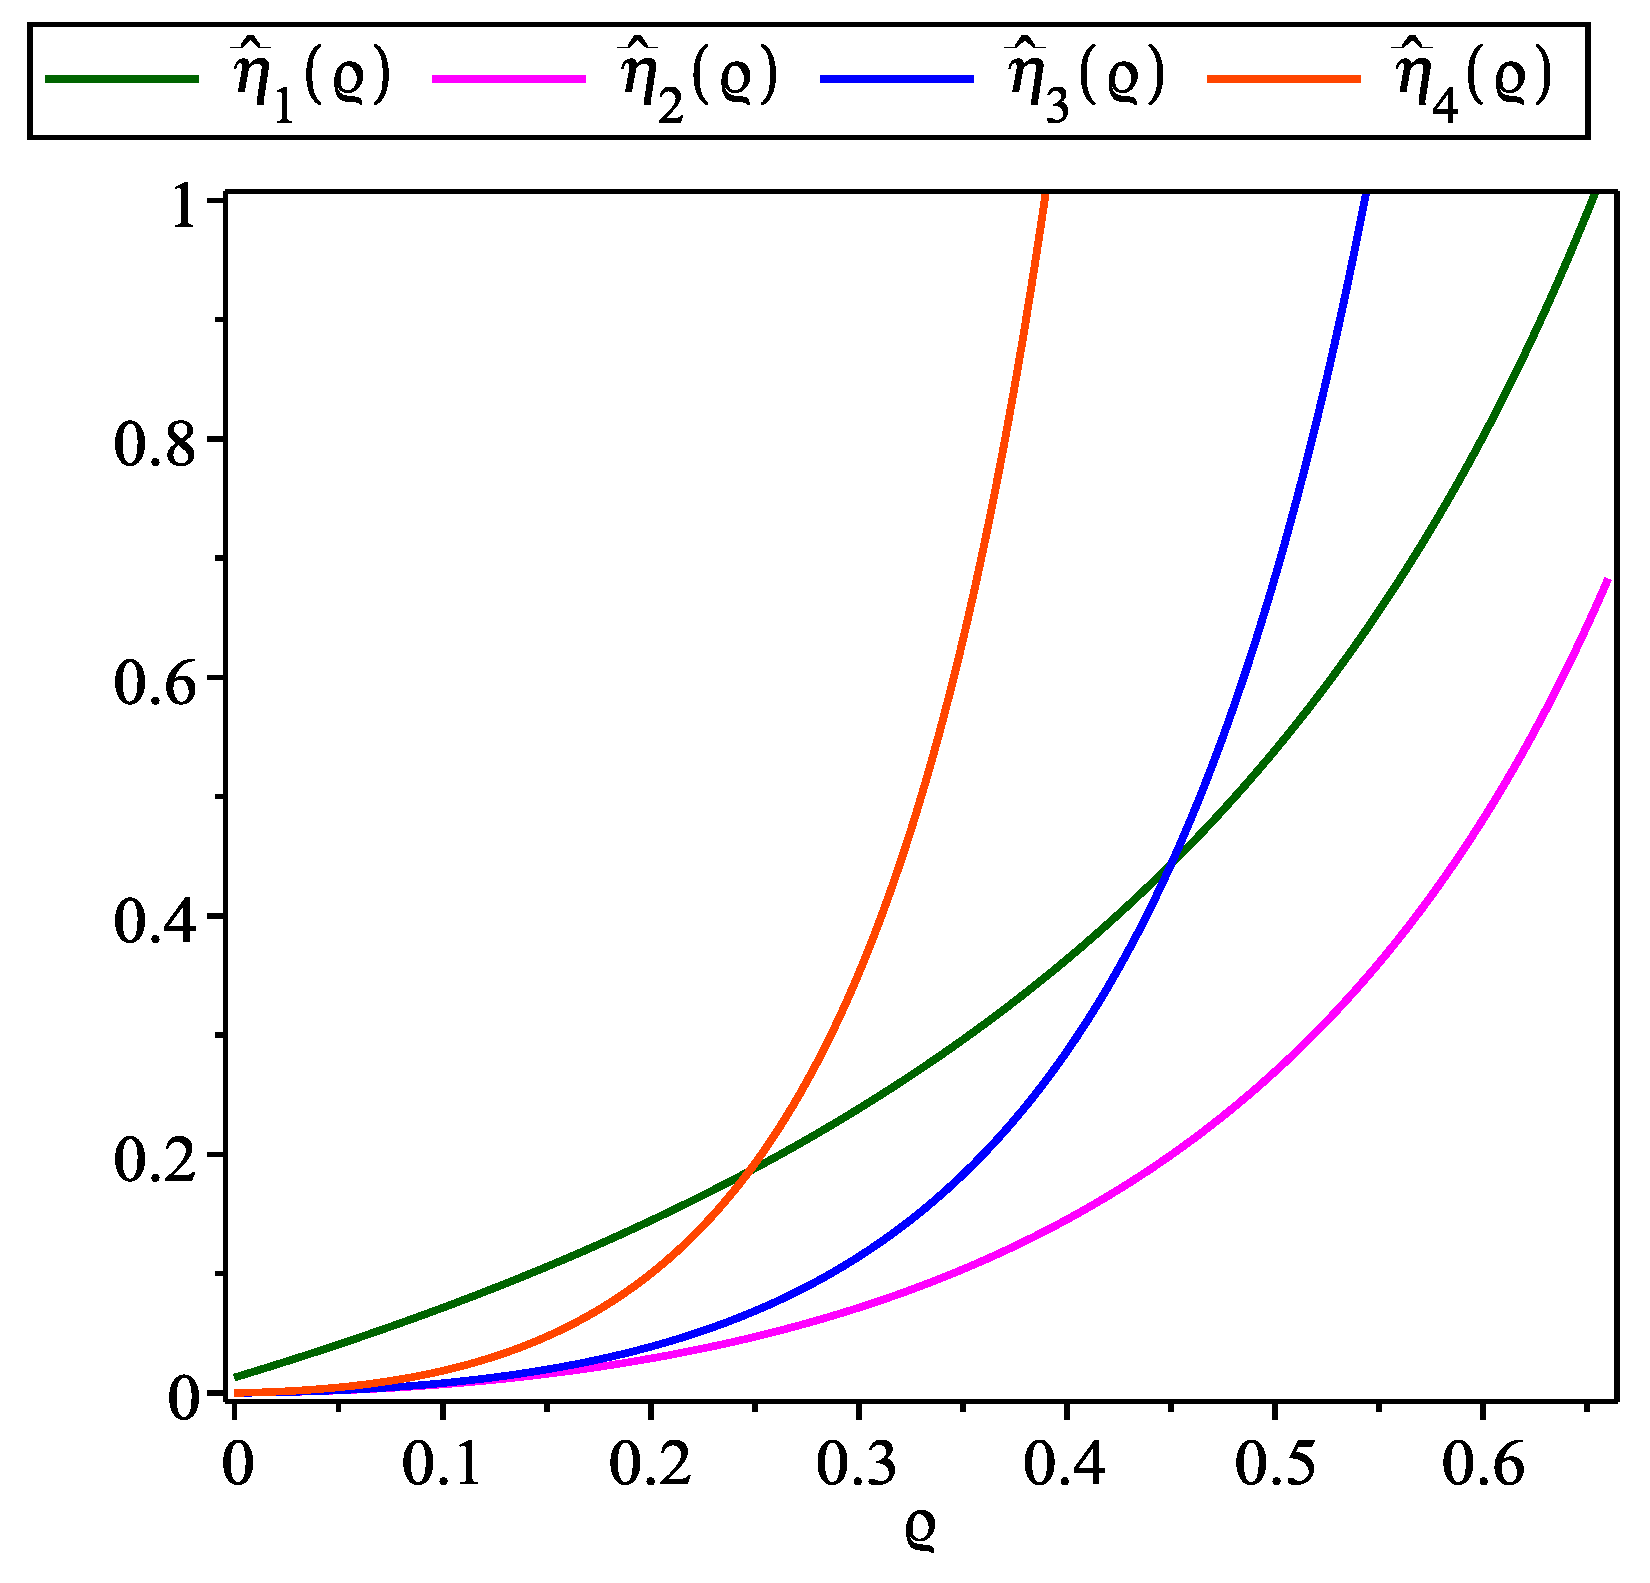
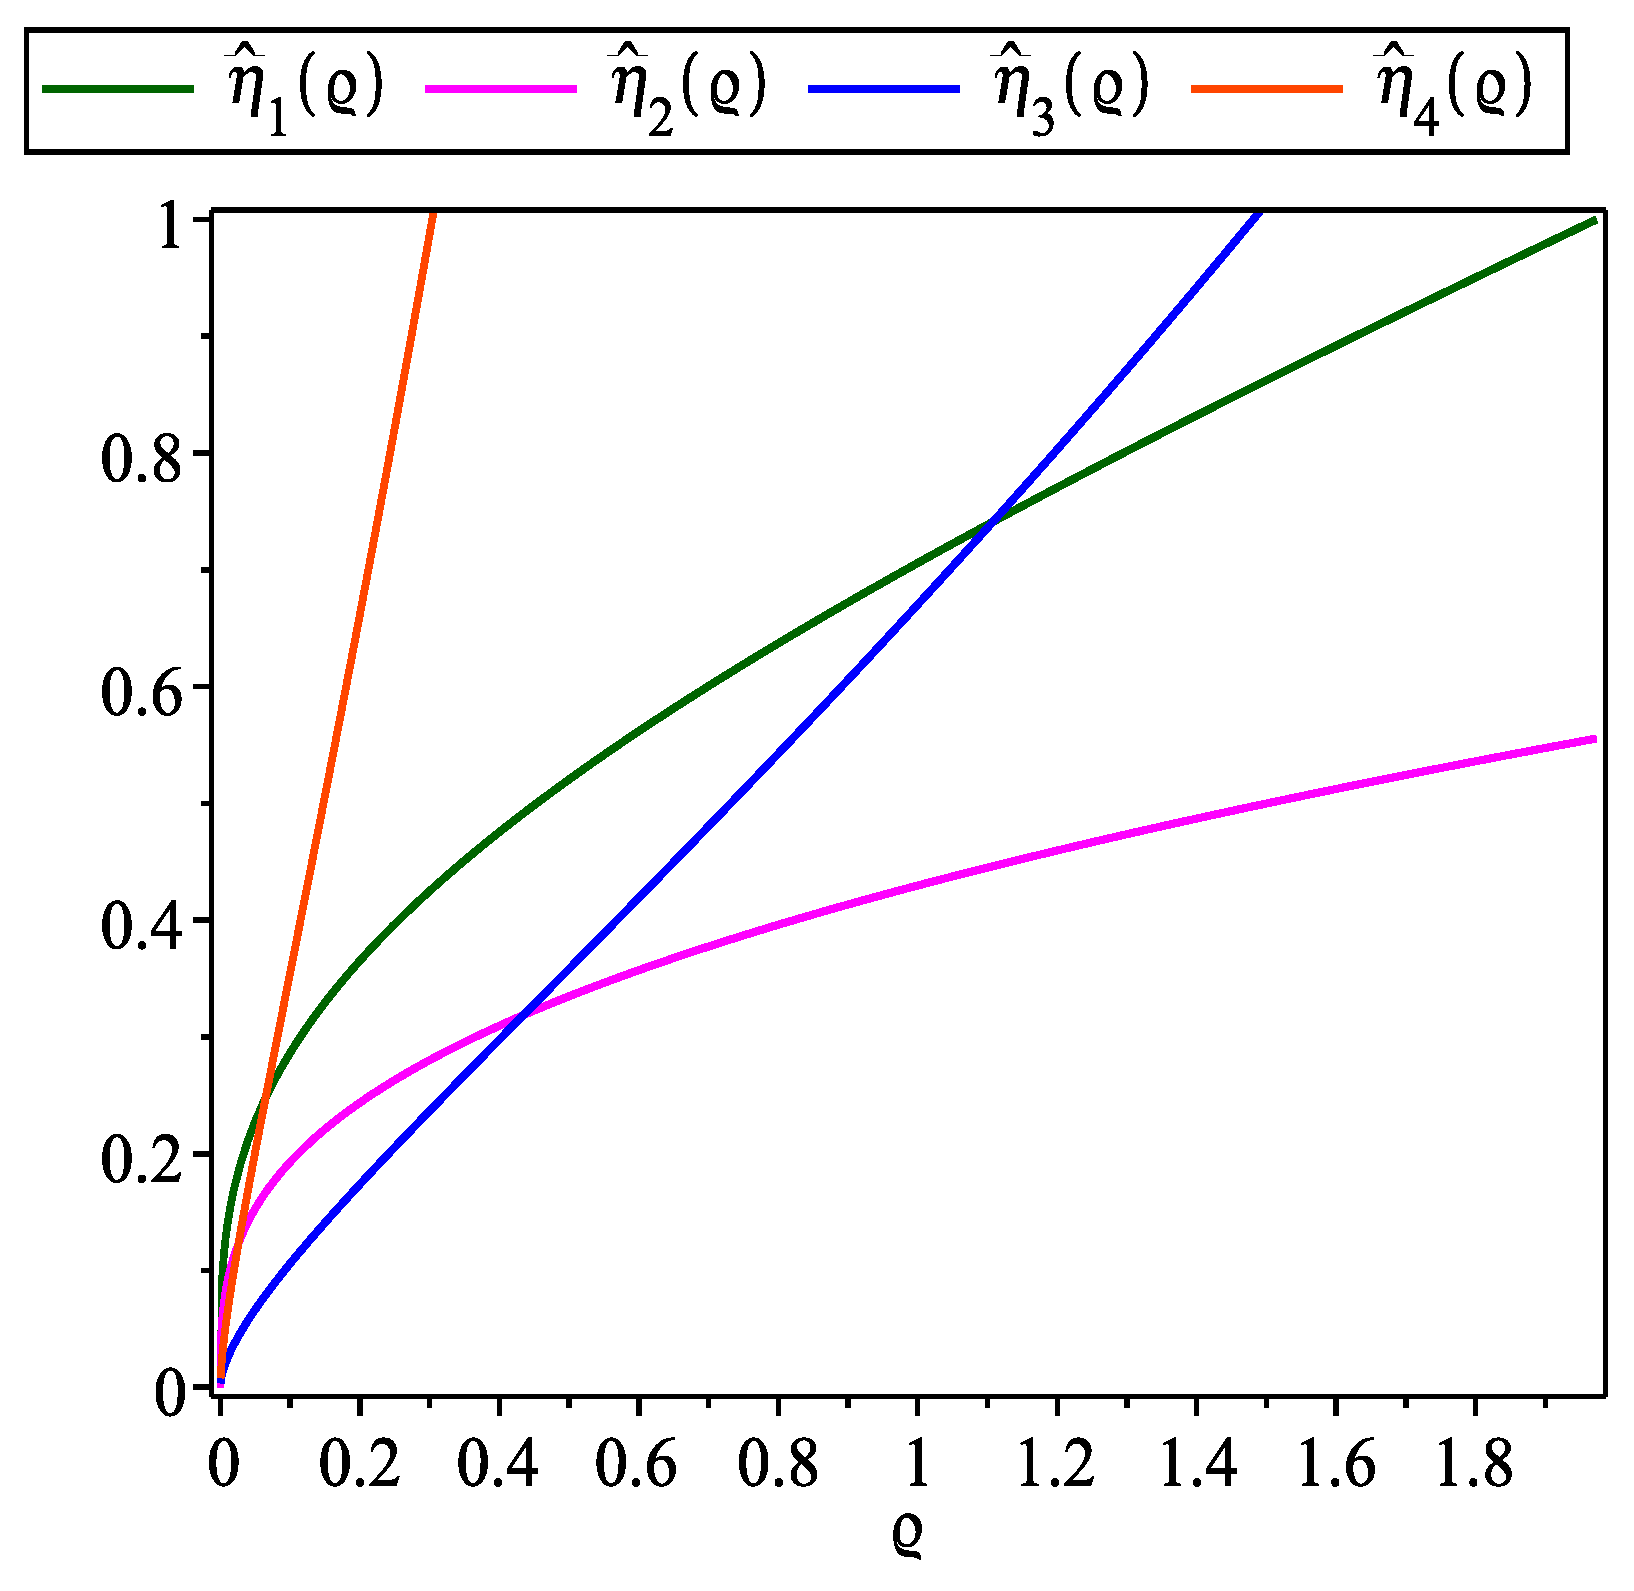
To substantiate the analytical outcomes derived in Section 2, this section deals with a comprehensive set of computational experiments. Specifically, for Problems 1 through 6, we implement the proposed analytical procedure to determine the radii associated with PBIS. The computation process involves the functions , where , which are essential in determining the radii values. In Problem 4, we set , while for the remaining problems, we adopt . Additionally, we conduct a comparative analysis of the PBIS radii for different values of the parameter a. Specifically for , , and , the radii of PBIS are calculated and then compared with the existing results [23,24]. The numerical results from these experiments are systematically organized and presented in Table 1, Table 2, Table 3, Table 4, Table 5, Table 6, Table 7, Table 8, Table 9, Table 10, Table 11 and Table 12. The results clearly highlight that the radii of PBIS, as computed using our proposed technique, are remarkably larger than those reported in earlier research [23,24]. In Table 9, Table 10, Table 11 and Table 12, the symbol indicates that the corresponding parameter could not be determined, as the Lipschitz condition is not satisfied in these cases. In these tables, the parameters and radii are represented by , , and r as used in [23], while in [24], the corresponding notations are , , and . In Table 13 and Table 14, we provide a summary of improvements in the radii for PBIS in comparison to those obtained by Martínez et al. [23] and Singh et al. [24], respectively. Furthermore, Figure 9, Figure 10, Figure 11, Figure 12, Figure 13 and Figure 14 display the functions for , providing a graphical representation that confirms the inequality within the interval .
To further validate the convergence radii established for PBIS in this study, we perform a detailed comparison between PBIS and the classical Newton’s scheme (NS) on Problems 1, 2, and 3. For the integral equation in Problem 2, we apply the composite trapezoidal rule. The starting points are chosen based on the convergence balls for PBIS, using the radii values provided in Table 1, Table 3 and Table 5. We use MATLAB to execute the numerical experiments with variable precision arithmetic set to 2000 digits. We set the following stopping condition for each problem.
The numerical results, presented in Table 15, Table 16 and Table 17, include the number of iterations (NI) required to reach the desired accuracy, the norm , and the approximate computational order of convergence (ACOC) [22], which is computed using the following expression.
The results clearly demonstrate that PBIS consistently surpasses NS in terms of iteration efficacy, accuracy, and ACOC. Thus, the convergence of PBIS is successfully validated through the careful selection of initial points based on the radii derived analytically in our approach.
Problem 1

Table 1.
Radius of PBIS for Problem 1 with .
Table 1.
Radius of PBIS for Problem 1 with .
| Proposed Radius | Radius by Martínez et al. [23] | Radius by Singh et al. [24] |
|---|---|---|

Table 2.
Radii of PBIS for Problem 1 with different values of a.
Table 2.
Radii of PBIS for Problem 1 with different values of a.
| Values of a | Proposed Radius | Radius by Martínez et al. [23] | Radius by Singh et al. [24] |
|---|---|---|---|
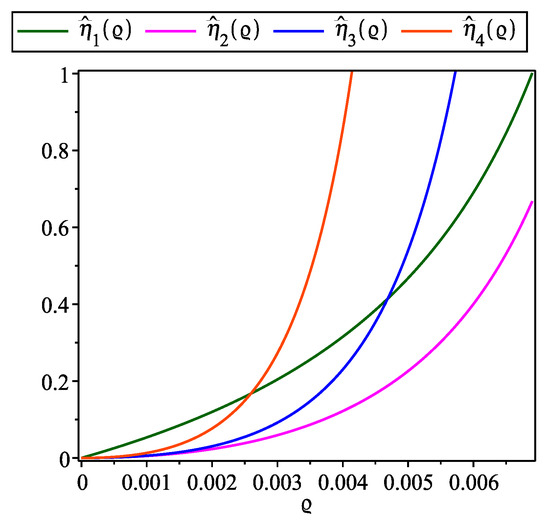
Figure 9.
, , for Problem 1.
Figure 9.
, , for Problem 1.
Problem 2
([13,22,23]). We define by taking and as follows:
Nonlinear equations, involving integral operators of the form , belong to the class of Hammerstein-type equations, which are extensively used in modeling motion-related phenomena. These equations frequently arise in numerous scientific fields, encompassing applications such as traffic flow modeling, kinetic gas theory, problem of radiative transfer, neutron transport problem, biological system dynamics, electromagnetic fluid dynamics, queueing theory, and the modeling of chemical reactor processes [17].

Table 3.
Radius of PBIS for Problem 2 with .
Table 3.
Radius of PBIS for Problem 2 with .
| Proposed Radius | Radius by Martínez et al. [23] | Radius by Singh et al. [24] |
|---|---|---|

Table 4.
Radii of PBIS for Problem 2 with different values of a.
Table 4.
Radii of PBIS for Problem 2 with different values of a.
| Values of a | Proposed Radius | Radius by Martínez et al. [23] | Radius by Singh et al. [24] |
|---|---|---|---|
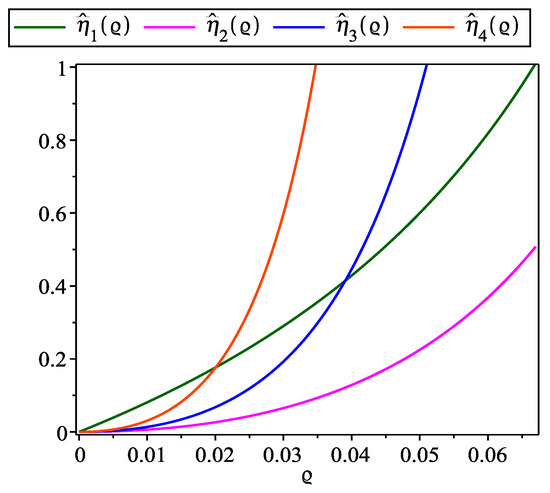
Figure 10.
, , for Problem 2.
Figure 10.
, , for Problem 2.
Problem 3

Table 5.
Radius of PBIS for Problem 3 with .
Table 5.
Radius of PBIS for Problem 3 with .
| Proposed Radius | Radius by Martínez et al. [23] | Radius by Singh et al. [24] |
|---|---|---|

Table 6.
Radii of PBIS for Problem 3 with different values of a.
Table 6.
Radii of PBIS for Problem 3 with different values of a.
| Values of a | Proposed Radius | Radius by Martínez et al. [23] | Radius by Singh et al. [24] |
|---|---|---|---|
Problem 4
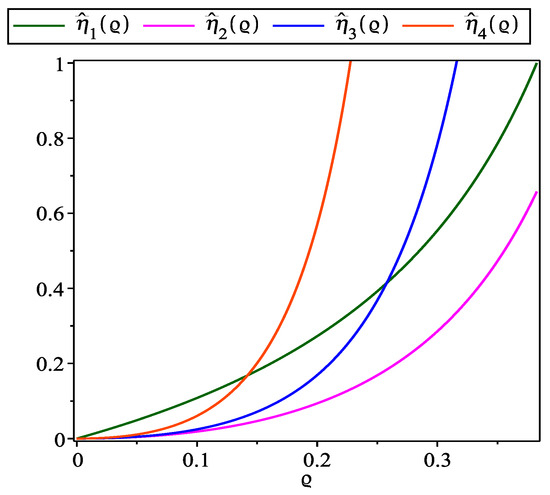
Figure 11.
, , for Problem 3.
Figure 11.
, , for Problem 3.
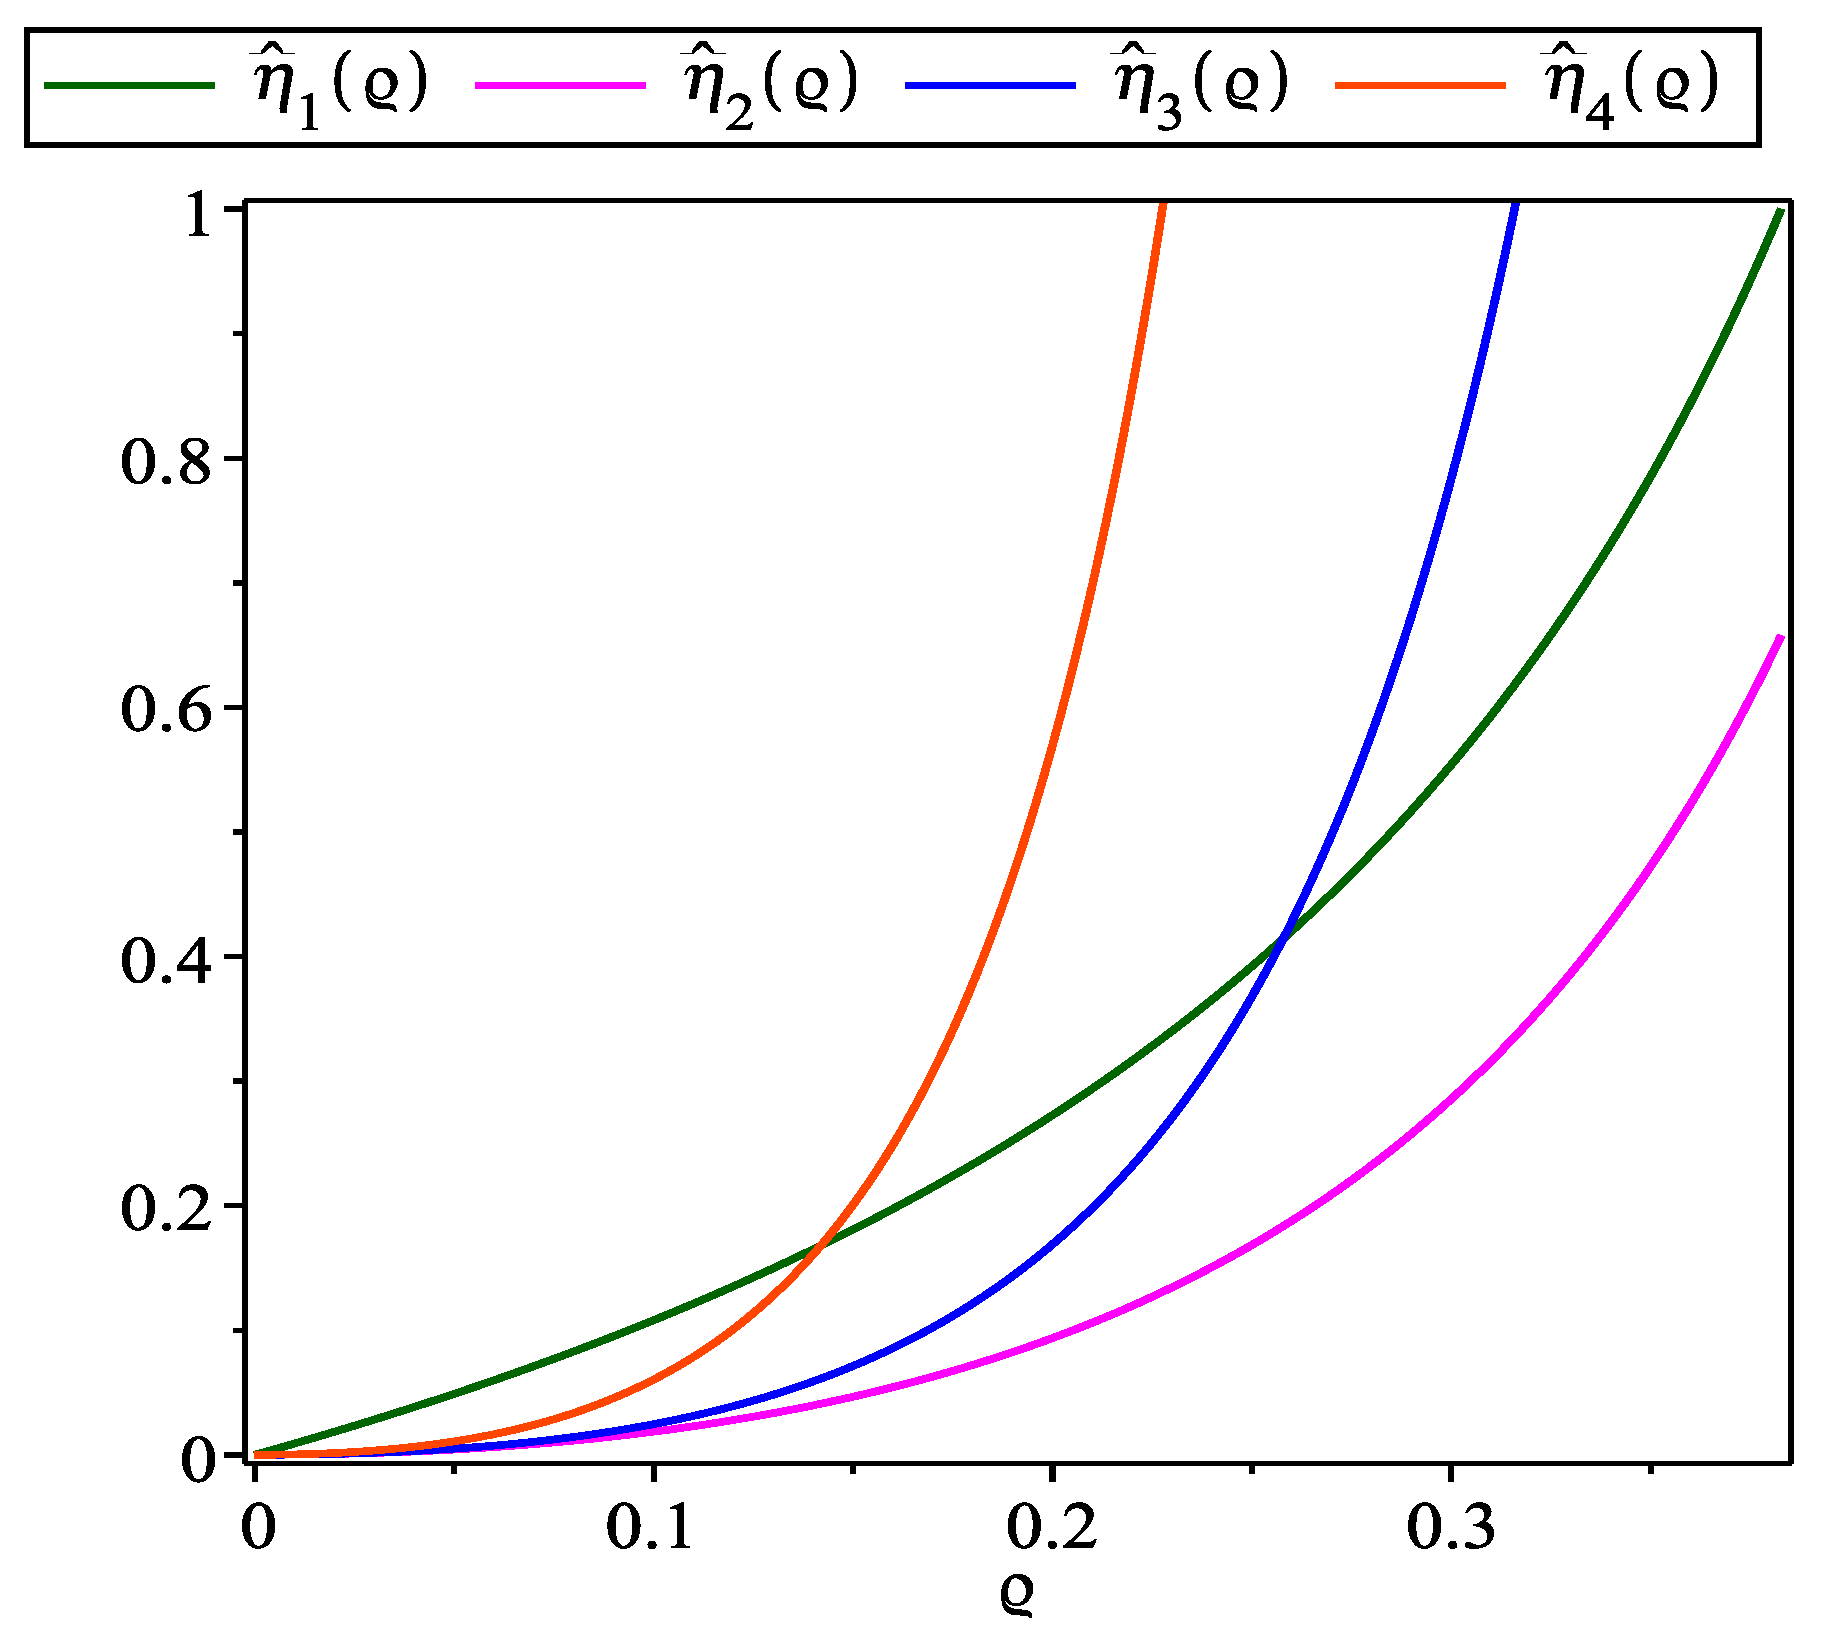

Table 7.
Radius of PBIS for Problem 4 with .
Table 7.
Radius of PBIS for Problem 4 with .
| Proposed Radius | Radius by Martínez et al. [23] | Radius by Singh et al. [24] |
|---|---|---|

Table 8.
Radii of PBIS for Problem 4 with different values of a.
Table 8.
Radii of PBIS for Problem 4 with different values of a.
| Values of a | Proposed Radius | Radius by Martínez et al. [23] | Radius by Singh et al. [24] |
|---|---|---|---|
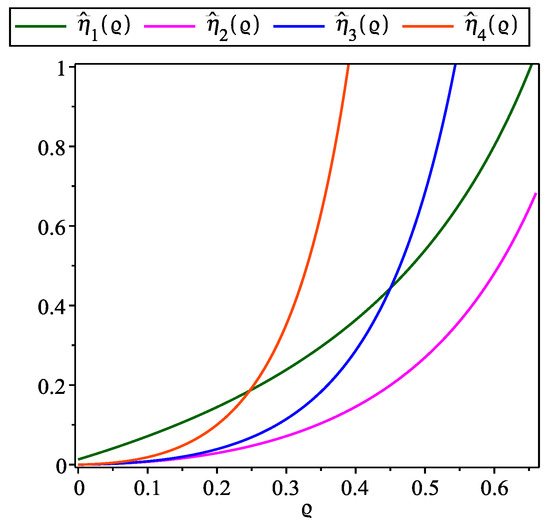
Figure 12.
, , for Problem 4.
Figure 12.
, , for Problem 4.
Problem 5

Table 9.
Radius of PBIS for Problem 5 with .
Table 9.
Radius of PBIS for Problem 5 with .
| Proposed Radius | Radius by Martínez et al. [23] | Radius by Singh et al. [24] |
|---|---|---|
| = ** | ||
| = ** | ||
| r = ** | ||
| = ** |

Table 10.
Radii of PBIS for Problem 5 with different values of a.
Table 10.
Radii of PBIS for Problem 5 with different values of a.
| Values of a | Proposed Radius | Radius by Martínez et al. [23] | Radius by Singh et al. [24] |
|---|---|---|---|
| = ** | |||
| = ** | |||
| = ** |
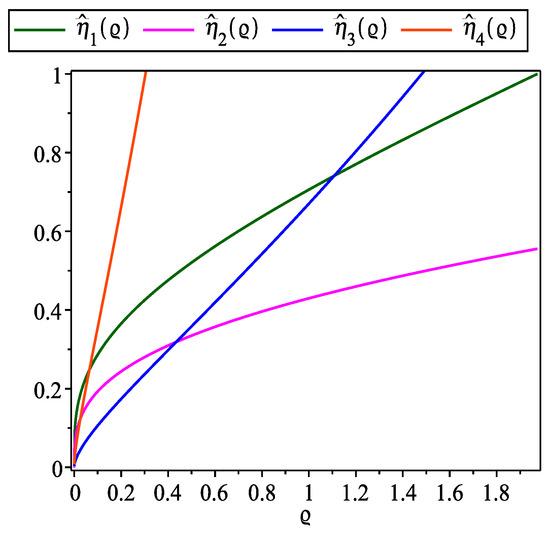
Figure 13.
, , for Problem 5.
Figure 13.
, , for Problem 5.
Problem 6

Table 11.
Radius of PBIS for Problem 6 with .
Table 11.
Radius of PBIS for Problem 6 with .
| Proposed Radius | Radius by Martínez et al. [23] | Radius by Singh et al. [24] |
|---|---|---|
| = ** | ||
| = ** | ||
| r = ** | ||
| = ** |

Table 12.
Radii of PBIS for Problem 6 with different values of a.
Table 12.
Radii of PBIS for Problem 6 with different values of a.
| Values of a | Proposed Radius | Radius by Martínez et al. [23] | Radius by Singh et al. [24] |
|---|---|---|---|
| = ** | |||
| = ** | |||
| = ** |

Table 13.
Summary of improvements in the radii for PBIS compared to those obtained by Martínez et al. [23] across the test problems.
Table 13.
Summary of improvements in the radii for PBIS compared to those obtained by Martínez et al. [23] across the test problems.
| Test Problems | Proposed Radii | Radii by Martínez et al. [23] | Improvements in the Radii |
|---|---|---|---|
| Problem 1 | |||
| Problem 2 | |||
| Problem 3 | |||
| Problem 4 | |||
| Problem 5 | |||
| Problem 6 |

Table 14.
Summary of improvements in the radii for PBIS compared to those obtained by Singh et al. [24] across the test problems.
Table 14.
Summary of improvements in the radii for PBIS compared to those obtained by Singh et al. [24] across the test problems.
| Test Problems | Proposed Radii | Radii by Singh et al. [24] | Improvements in the Radii |
|---|---|---|---|
| Problem 1 | |||
| Problem 2 | |||
| Problem 3 | |||
| Problem 4 | |||
| Problem 5 | |||
| Problem 6 |

Table 15.
Comparison of PBIS with NS for Problem 1.
Table 15.
Comparison of PBIS with NS for Problem 1.
| Methods | NI | ACOC | ||
|---|---|---|---|---|
| NS PBIS | 7 3 | 2.0000 5.0000 | ||
| NS PBIS | 7 3 | 2.0000 4.9999 |
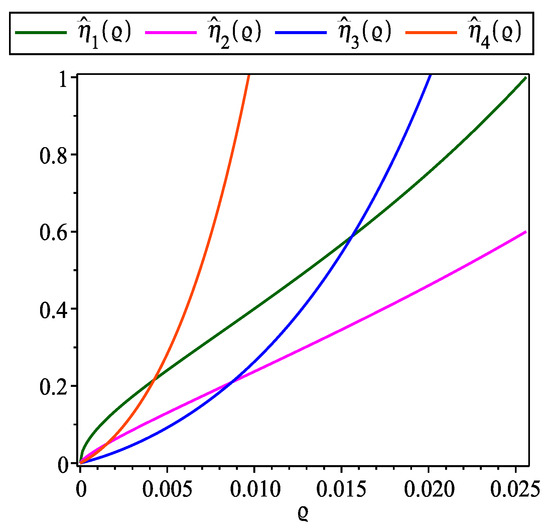
Figure 14.
, , for Problem 6.
Figure 14.
, , for Problem 6.
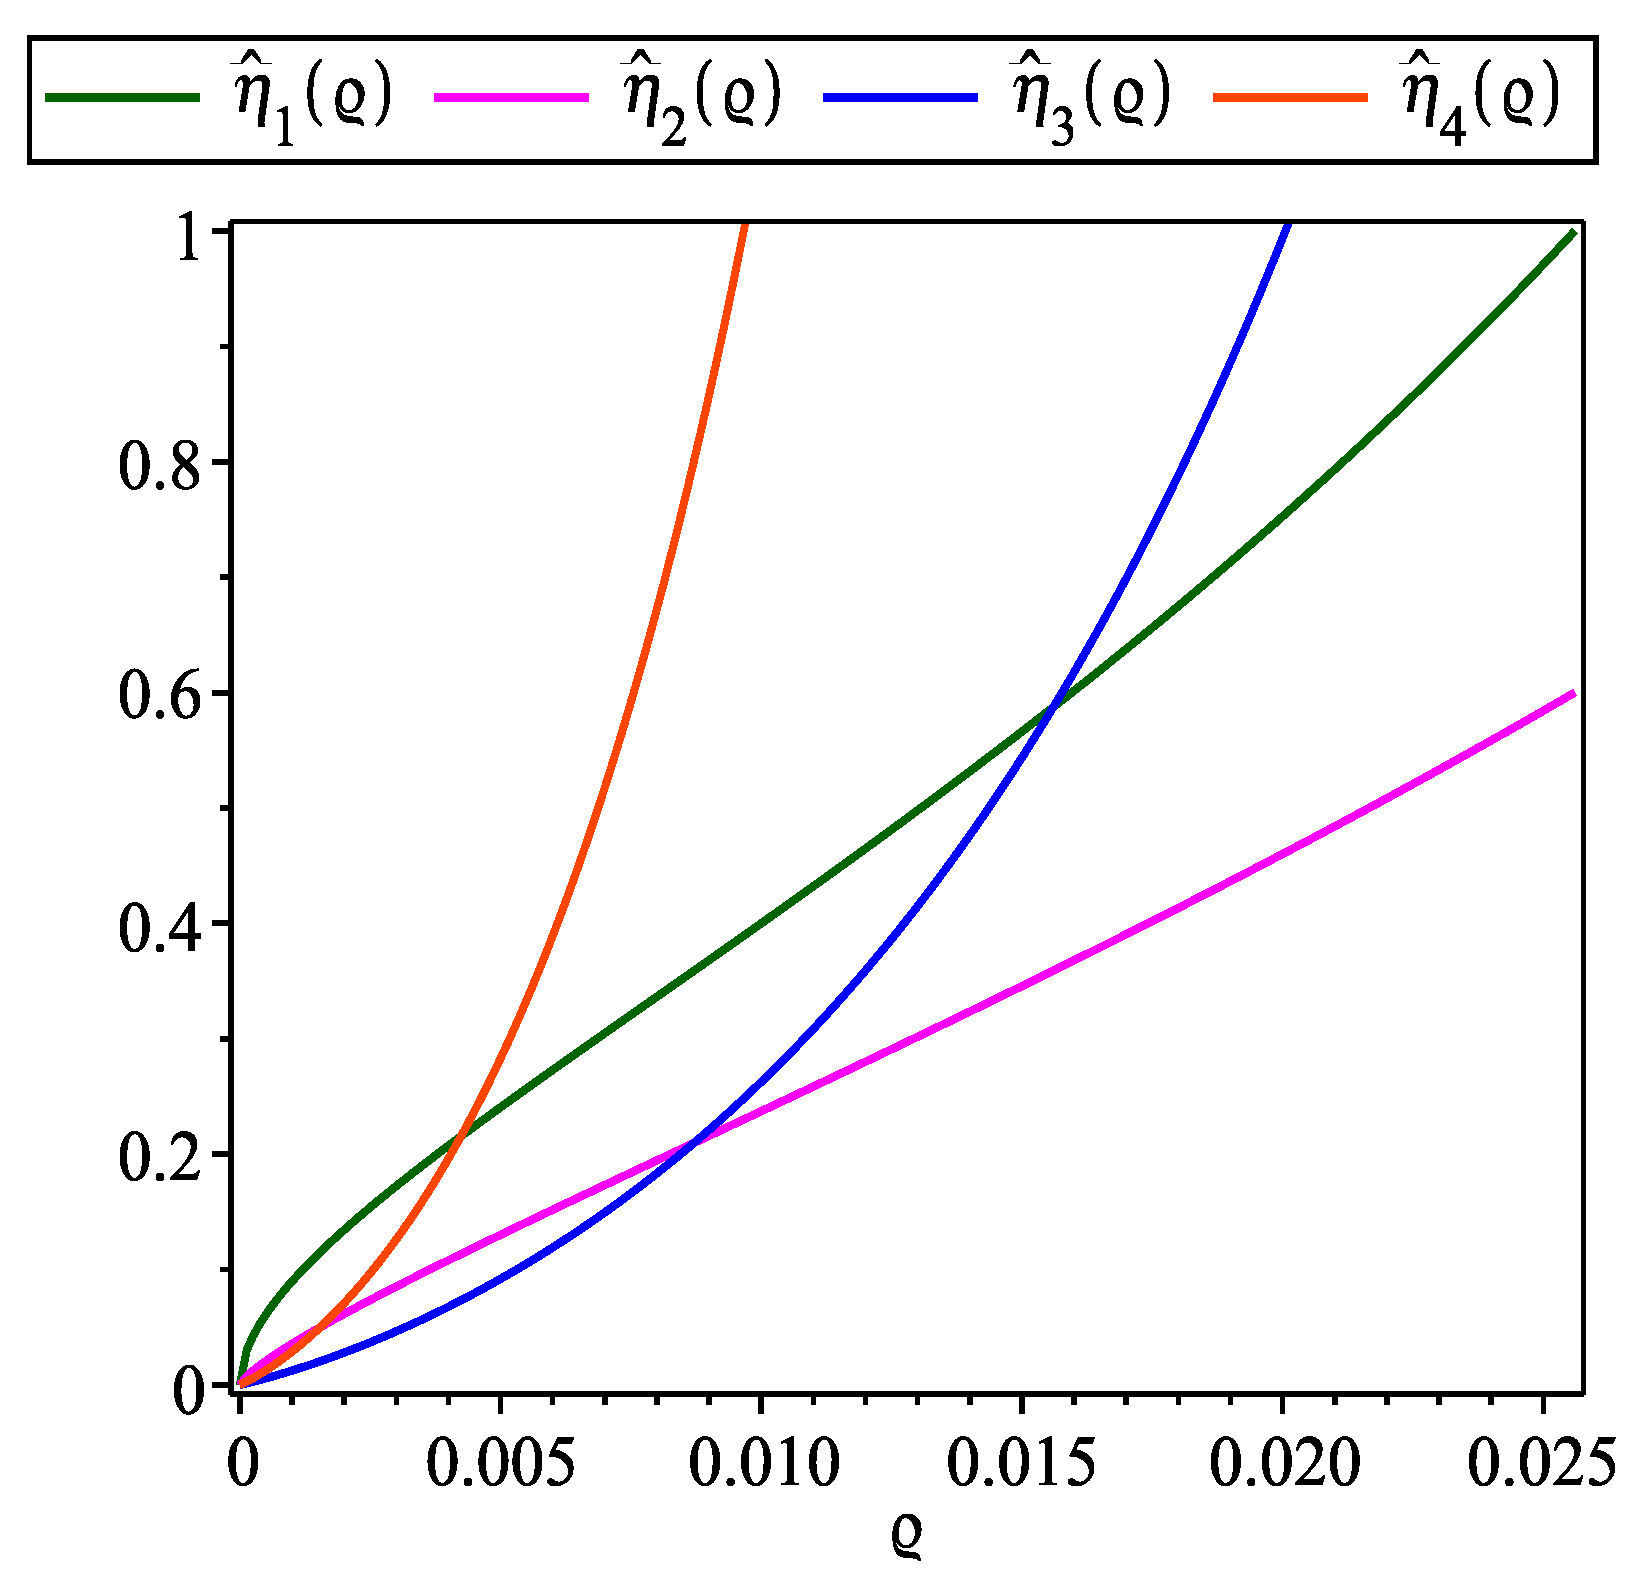

Table 16.
Comparison of PBIS with NS for Problem 2.
Table 16.
Comparison of PBIS with NS for Problem 2.
| Methods | NI | ACOC | ||
|---|---|---|---|---|
| NS PBIS | 5 3 | 3.0000 11.0000 | ||
| NS PBIS | 5 3 | 3.0000 11.0000 |

Table 17.
Comparison of PBIS with NS for Problem 3.
Table 17.
Comparison of PBIS with NS for Problem 3.
| Methods | NI | ACOC | ||
|---|---|---|---|---|
| NS PBIS | 8 4 | 2.0000 5.0000 | ||
| NS PBIS | 8 4 | 2.0000 4.9999 |
5. Conclusions
The analysis presented in this work leads to a significant advancement in the convergence behavior of the parameter-based iteration scheme (PBIS), expanding its convergence domain while avoiding the imposition of additional restrictive conditions. The method’s enhanced effectiveness is substantiated through an extensive theoretical framework and corroborated by numerical experiments, demonstrating its superior performance in solving nonlinear equations, particularly within Banach spaces. Furthermore, the exploration of attraction basins offers additional confirmation of the scheme’s stability and robustness, highlighting its promising potential for applications to complex-valued equations. Because of its generality, the analytical approach presented in this article can be applied to other iterative schemes [10,17,18,19], which will be explored in our future research.
Author Contributions
Conceptualization, E.M. and D.S.; methodology, E.M. and D.S.; software, E.M. and D.S.; validation, E.M. and D.S.; formal analysis, E.M. and D.S.; investigation, E.M. and D.S.; resources, E.M. and D.S.; data curation, E.M. and D.S.; writing—original draft preparation, E.M. and D.S.; writing—review and editing, E.M. and D.S.; visualization, E.M. and D.S.; supervision, E.M. All authors have read and agreed to the published version of the manuscript.
Funding
This research received no external funding.
Data Availability Statement
Data is contained within the article.
Conflicts of Interest
The authors declare no conflicts of interest.
References
- Xiao, X.Y.; Yin, H.W. Increasing the order of convergence for iterative methods to solve nonlinear systems. Calcolo 2016, 53, 285–300. [Google Scholar] [CrossRef]
- Argyros, I.K.; Cho, Y.J.; Hilout, S. Numerical Methods for Equations and Its Applications; Taylor & Francis: Abingdon, UK; CRC Press: New York, NY, USA, 2012. [Google Scholar]
- Cordero, A.; Hueso, J.L.; Martínez, E.; Torregrosa, J.R. Increasing the convergence order of an iterative method for nonlinear systems. Appl. Math. Lett. 2012, 25, 2369–2374. [Google Scholar] [CrossRef]
- Kou, J.; Li, Y.; Wang, X. A composite fourth-order iterative method for solving non-linear equations. Appl. Math. Comput. 2007, 184, 471–475. [Google Scholar] [CrossRef]
- Özban, A.Y. Some new variants of Newton’s method. Appl. Math. Lett. 2004, 17, 677–682. [Google Scholar] [CrossRef]
- Petković, M.S.; Neta, B.; Petković, L.; Dz̃unić, D. Multipoint Methods for Solving Nonlinear Equations; Elsevier: Amsterdam, The Netherlands, 2013. [Google Scholar]
- Potra, F.A.; Ptak, V. Nondiscrete Induction and Iterative Processes; Research Notes in Mathematics; Pitman Publ.: Boston, MA, USA, 1984; Volume 103. [Google Scholar]
- Scott, M.; Neta, B.; Chun, C. Basin attractors for various methods. Appl. Math. Comput. 2011, 218, 2584–2599. [Google Scholar] [CrossRef]
- Traub, J.F. Iterative Methods for the Solution of Equations; Prentice-Hall: Englewood Cliffs, NJ, USA, 1964. [Google Scholar]
- Amat, S.; Argyros, I.K.; Busquier, S.; Hernández-Verón, M.A.; Martínez, E. On the local convergence study for an efficient k-step iterative method. J. Comput. Appl. Math. 2018, 343, 753–761. [Google Scholar] [CrossRef]
- Argyros, I.K.; Behl, R.; Motsa, S.S. Unifying semilocal and local convergence of Newton’s method on Banach space with a convergence structure. Appl. Numer. Math. 2017, 115, 225–234. [Google Scholar] [CrossRef]
- Argyros, I.K.; Magreñán, Á.A. Local convergence for multi-point-parametric Chebyshev-Halley-type methods of higher convergence order. J. Comput. Appl. Math. 2015, 282, 215–224. [Google Scholar] [CrossRef]
- Argyros, I.K.; George, S. Local convergence for an almost sixth order method for solving equations under weak conditions. SeMA J. 2017, 75, 163–171. [Google Scholar] [CrossRef]
- Argyros, I.K.; Magreñán, Á.A. A study on the local convergence and the dynamics of Chebyshev-Halley-type methods free from second derivative. Numer. Algor. 2015, 71, 1–23. [Google Scholar] [CrossRef]
- Argyros, I.K.; Sharma, D.; Argyros, C.I.; Parhi, S.K.; Sunanda, S.K. Extending the applicability and convergence domain of a higher-order iterative algorithm under ω condition. Rend. Circ. Mat. Palermo II Ser. 2022, 71, 469–482. [Google Scholar] [CrossRef]
- Cordero, A.; Ezquerro, J.A.; Hernández-Verón, M.A.; Torregrosa, J.R. On the local convergence of a fifth-order iterative method in Banach spaces. Appl. Math. Comput. 2015, 251, 396–403. [Google Scholar] [CrossRef]
- Hernández-Verón, M.A.; Martínez, E. On the semilocal convergence of a three steps Newton-type iterative process under mild convergence conditions. Numer. Algorithms 2015, 70, 377–392. [Google Scholar] [CrossRef]
- George, S.; Muniyasamy, M.; Gopal, M.; Chandhini, G.; Argyros, I.K. A procedure for increasing the convergence order of iterative methods from p to 5p for solving nonlinear system. J. Complex. 2025, 87, 101921. [Google Scholar] [CrossRef]
- Chang, C.W.; Qureshi, S.; Argyros, I.K.; Chicharro, F.I.; Soomro, A. A modified two-step optimal iterative method for solving nonlinear models in one and higher dimensions. Math. Comput. Simul. 2025, 229, 448–467. [Google Scholar] [CrossRef]
- Regmi, S.; Argyros, I.K.; Argyros, C.I.; Sharma, D. Extended Comparison between Two Derivative-Free Methods of Order Six for Equations under the Same Conditions. Fractal Fract. 2022, 6, 634. [Google Scholar] [CrossRef]
- Sharma, D.; Parhi, S.K. Extending the Applicability of a Newton-Simpson-Like Method. Int. J. Appl. Comput. Math. 2020, 6, 79. [Google Scholar] [CrossRef]
- Sharma, J.R.; Argyros, I.K. Local convergence of a Newton-Traub composition in Banach spaces. SeMA J. 2017, 75, 57–68. [Google Scholar] [CrossRef]
- Martínez, E.; Singh, S.; Hueso, J.L.; Gupta, D.K. Enlarging the convergence domain in local convergence studies for iterative methods in Banach spaces. Appl. Math. Comput. 2016, 281, 252–265. [Google Scholar] [CrossRef]
- Singh, S.; Gupta, D.K.; Badoni, R.P.; Martínez, E.; Hueso, J.L. Local convergence of a parameter based iteration with Hölder continuous derivative in Banach spaces. Calcolo 2017, 54, 527–539. [Google Scholar] [CrossRef]
- Argyros, I.K. Convergence and Application of Newton-Type Iterations; Springer: Berlin/Heidelberg, Germany, 2008. [Google Scholar]
Disclaimer/Publisher’s Note: The statements, opinions and data contained in all publications are solely those of the individual author(s) and contributor(s) and not of MDPI and/or the editor(s). MDPI and/or the editor(s) disclaim responsibility for any injury to people or property resulting from any ideas, methods, instructions or products referred to in the content. |
© 2025 by the authors. Licensee MDPI, Basel, Switzerland. This article is an open access article distributed under the terms and conditions of the Creative Commons Attribution (CC BY) license (https://creativecommons.org/licenses/by/4.0/).
