Abstract
With the advancement of educational informatization, vast amounts of Chinese text are generated across online platforms and digital textbooks. Effectively classifying such text is essential for intelligent education systems. This study conducts a systematic comparative evaluation of three Transformer-based models—TinyBERT-4L, BERT-base-Chinese, and RoBERTa-wwm-ext—for Chinese educational text classification. Using a balanced four-category subset of the THUCNews corpus (Education, Technology, Finance, and Stock), the research investigates the trade-off between classification effectiveness and computational efficiency under a unified experimental framework. The experimental results show that RoBERTa-wwm-ext achieves the highest effectiveness (93.12% Accuracy, 93.08% weighted F1), validating the benefits of whole-word masking and extended pre-training. BERT-base-Chinese maintains a balanced performance (91.74% Accuracy, 91.66% F1) with moderate computational demand. These findings reveal a clear symmetry–asymmetry dynamic: structural symmetry arises from the shared Transformer encoder and identical fine-tuning setup, while asymmetry emerges from differences in model scale and pre-training strategy. This interplay leads to distinct accuracy–latency trade-offs, providing practical guidance for deploying pre-trained language models in resource-constrained intelligent education systems.
1. Introduction
Recent advances in pre-trained language models (PLMs)—notably BERT and RoBERTa—have markedly improved Chinese text classification performance. Building on this progress, we benchmark TinyBERT, BERT-base-Chinese, and RoBERTa-wwm-ext under a unified and fair experimental setup [1,2].
Earlier studies primarily relied on statistical feature engineering methods such as bag-of-words (BoW) and term frequency–inverse document frequency (TF–IDF), combined with shallow classifiers including Naïve Bayes and support vector machines (SVMs). Although effective in some contexts, these approaches fail to capture deep contextual semantics and generalize poorly to large-scale datasets [1].
The emergence of deep learning brought substantial progress to text classification. Convolutional neural networks (CNNs) effectively extract local features [3], while recurrent neural networks (RNNs) and long short-term memory (LSTM) models capture long-range dependencies [4]. Despite these advances, such models require large labeled datasets and remain limited in modeling bidirectional contexts [4].
Pre-trained language models (PLMs) have since revolutionized natural language processing (NLP). BERT, built upon the Transformer architecture [5,6], achieved state-of-the-art performance across numerous NLP tasks. In Chinese NLP, variants such as RoBERTa-wwm-ext [7] and MacBERT [8] further enhance contextual representation through whole-word masking and refined pre-training strategies. However, these large models demand substantial computational resources, hindering their deployment in resource-constrained educational environments.
To mitigate this limitation, lightweight PLMs such as TinyBERT were developed through knowledge distillation [9]. TinyBERT achieves competitive performance while significantly reducing inference time and memory usage, making it attractive for practical educational applications. Nevertheless, systematic comparisons between lightweight and large-scale PLMs for Chinese educational text classification remain limited.
The objective of this study is to quantify the accuracy–efficiency trade-offs among compressed, base, and large-scale Transformer models for Chinese educational text classification, thereby providing empirical guidance for model selection in resource-constrained educational environments.
We formalize a Symmetry–Asymmetry Framework as the analytical foundation of this study. Symmetry refers to the shared Transformer encoder architecture and identical fine-tuning hyperparameters across all models, ensuring a controlled environment for comparison. Asymmetry arises from two independent factors: (i) scale and resource allocation, where model compression (e.g., TinyBERT) introduces structural reduction; and (ii) pre-training strategy and information encoding, where models such as RoBERTa-wwm-ext employ whole-word masking and extended corpora for richer contextual representation. The interaction between this symmetric foundation and the asymmetric factors produces distinct accuracy–latency trade-offs, which are central to our analysis.
The main contributions of this work are as follows:
(1) Establishing a unified experimental framework for fair model comparison;
(2) Conducting a comprehensive evaluation of accuracy, robustness, and efficiency;
(3) Providing empirical and practical insights for model selection in intelligent educational applications.
2. Related Work
2.1. Traditional Machine Learning Approaches
Before the advent of deep learning, Chinese text classification primarily relied on traditional machine-learning pipelines based on statistical feature extraction and shallow classifiers. Early studies were dominated by classical representations such as bag-of-words (BoW) and term frequency–inverse document frequency (TF–IDF), often enhanced with n-gram features or dimensionality reduction techniques like latent semantic analysis (LSA) and principal component analysis (PCA) [13]. For Chinese educational texts—characterized by rich lexical diversity and domain-specific terminology—word segmentation was a key step in feature engineering, while stop-word removal was widely applied to reduce feature sparsity.
Common classifiers included Naïve Bayes, support vector machines (SVMs), k-nearest neighbors (KNNs), and logistic regression. Among these, SVMs were particularly effective in handling high-dimensional sparse data. Early studies on Chinese news classification using BoW and SVMs achieved accuracies above 85% on balanced corpora [14]. Similar approaches were also adopted for tasks such as student feedback analysis and academic paper categorization, where handcrafted features provided interpretable and computationally efficient baselines [15].
However, these pipelines exhibited several inherent limitations: (i) they treated documents as unordered collections of words or n-grams, overlooking syntactic and semantic dependencies—an issue for educational texts with subtle category boundaries (e.g., education vs. technology); (ii) they were highly sensitive to manual preprocessing choices and domain expertise, reducing robustness; (iii) they performed poorly on imbalanced datasets; and (iv) their feature spaces became extremely high-dimensional and sparse as corpus size increased, hindering scalability. Despite these drawbacks, traditional methods remain valuable for establishing baselines or in resource-constrained scenarios. Hybrid approaches that incorporate TF–IDF features into neural models have also been explored [16]. Nevertheless, with the emergence of deep learning and Transformer-based architectures, these traditional pipelines have largely been supplanted by models capable of capturing richer contextual and semantic dependencies.
2.2. Deep Learning for Text Classification
Deep learning revolutionized text classification by introducing distributed representations and hierarchical feature learning. Compared with sparse BoW and TF–IDF vectors, neural embeddings such as word2vec and GloVe provide dense vector representations that capture semantic relationships [17]. In Chinese NLP, pre-trained embeddings learned from large corpora (e.g., Chinese Wikipedia, People’s Daily) laid the foundation for neural text classifiers.
Among neural architectures, convolutional neural networks (CNNs) were early pioneers. Kim’s model [18] demonstrated that CNNs effectively capture local n-gram semantics through convolutional filters, outperforming traditional methods on multiple benchmarks. Adaptations to Chinese datasets achieved strong performance in sentiment analysis, topic categorization, and educational-resource classification [19]. CNNs are computationally efficient and particularly suitable for short texts (e.g., course titles, student feedback) where local contextual patterns predominate.
Recurrent neural networks (RNNs), particularly long short-term memory (LSTM) and gated recurrent unit (GRU) models, extended text modeling to longer sequences by capturing temporal dependencies [20]. In Chinese educational contexts, LSTMs often surpass CNNs in handling long documents such as abstracts and textbook passages, where long-range context plays a crucial role [21]. Bidirectional LSTMs (BiLSTMs) further enhance representation by integrating contextual information from both directions.
The introduction of attention mechanisms enabled models to focus selectively on informative words or sentences. The hierarchical attention network (HAN) explicitly models word–sentence–document hierarchies, combining interpretability with strong classification performance on educational corpora [22].
2.3. Pre-Trained Language Models for NLP
Pre-trained language models (PLMs) have reshaped natural language processing through large-scale unsupervised pre-training followed by task-specific fine-tuning. BERT [23] was a milestone in this evolution, introducing masked language modeling (MLM) to capture bidirectional context and next-sentence prediction (NSP) to model inter-sentence relations. These innovations produced contextual embeddings that significantly outperformed static word representations.
Subsequent models refined BERT’s framework to enhance efficiency and effectiveness. RoBERTa eliminated NSP, expanded training corpora, applied dynamic masking, and optimized hyperparameters [24]. XLNet introduced permutation-based autoregressive pre-training [25], while ELECTRA improved sample efficiency via replaced-token detection [26]. ALBERT reduced parameters through factorized embeddings and cross-layer parameter sharing [27], and DeBERTa further optimized attention mechanisms and positional encoding [28].
PLMs excel because they leverage massive unlabeled corpora, reducing dependence on costly manual annotations—an advantage particularly relevant to educational domains. However, their computational demands remain substantial: BERT-base contains approximately 110 million parameters, and BERT-large exceeds 340 million, resulting in prolonged training times and high inference latency. Moreover, general-domain pre-training may fail to capture domain-specific semantics, underscoring the need for domain adaptation.
These challenges have driven research on the trade-off between accuracy and efficiency, leading to the development of lightweight PLMs such as TinyBERT and DistilBERT. From a symmetry perspective, large PLMs preserve structural and representational symmetry across layers but incur high computational costs, whereas lightweight PLMs apply asymmetric compression strategies that selectively retain essential information while reducing redundancy. This contrast motivates our comparative study of models at different scales for Chinese educational text classification.
2.4. Chinese PLMs and Domain Adaptation
Applying PLMs to Chinese presents unique challenges due to the language’s lack of explicit word boundaries and the presence of multi-character semantic units. Character-level tokenization may disrupt morphemes and weaken semantic representation. To address these issues, Chinese-specific PLMs have adapted pre-training objectives to better capture linguistic characteristics. For instance, RoBERTa-wwm-ext extends RoBERTa with Whole-Word Masking (WWM), which masks entire words instead of individual characters, enabling morpheme-level understanding and improving performance in classification and named entity recognition tasks [29]. Similarly, MacBERT mitigates the pre-train–finetune discrepancy by replacing [MASK] tokens with semantically similar substitutes, further enhancing downstream performance [30].
Beyond architectural refinements, domain-adaptive pre-training (DAPT) and task-adaptive pre-training (TAPT) continue pre-training on domain-specific or task-related corpora to boost model accuracy. In Chinese NLP, these strategies have proven effective across specialized fields such as finance, biomedicine, and law (e.g., FinBERT, BioBERT, Chinese Clinical BERT) [31]. Educational texts—encompassing academic papers, digital textbooks, and course descriptions—exhibit distinctive vocabulary and a formal writing style. While general-purpose Chinese PLMs perform reasonably well on such data, domain-specific adaptation could further enhance accuracy. However, comprehensive evaluations of domain adaptation for Chinese educational text classification remain limited, as most prior studies have focused on general benchmarks like CLUE [32].
2.5. Efficiency and Lightweight Transformer Models
Large PLMs achieve state-of-the-art performance but are often costly to deploy in educational contexts, where efficiency, scalability, and accessibility are crucial. DistilBERT applies task-agnostic knowledge distillation from BERT, reducing model size by approximately 40% while retaining over 95% of BERT’s performance on the GLUE benchmark [33]. TinyBERT further extends this approach through multi-level distillation across embeddings, hidden states, attention maps, and logits, as well as task-specific distillation. These techniques enable compact student models (4–6 layers) to achieve competitive accuracy with substantially lower inference costs [34].
MobileBERT incorporates inverted bottleneck layers combined with distillation to optimize performance for mobile and embedded devices, achieving a balance between compactness and representational capacity [35]. MiniLM focuses on distilling self-attention and feed-forward network (FFN) relations, producing extremely small yet competitive models suitable for large-scale deployment [36]. In addition to distillation, model pruning (e.g., removing redundant layers or attention heads) and quantization (using low-bit representations) are commonly adopted to further reduce memory usage and latency with only minimal accuracy loss [37].
With the growing emphasis on Green AI, concerns about computational efficiency, sustainability, and energy consumption have become increasingly important. Many educational institutions face budget constraints and lack access to high-end GPUs, making lightweight PLMs particularly appealing for practical deployment. However, systematic evaluations of such models on Chinese educational corpora remain limited. This gap motivates our unified comparison of TinyBERT, BERT-base, and RoBERTa-Large to quantify accuracy–efficiency trade-offs under a consistent experimental framework.
2.6. Educational Text Characteristics and Challenges
Educational texts present unique challenges for automatic classification. First, they contain domain-specific vocabulary—such as pedagogical terms and exam-related jargon—that requires nuanced semantic modeling beyond what general-domain corpora can provide. Second, there is substantial semantic overlap between categories (e.g., Finance vs. Stock, Education vs. Technology), which increases the likelihood of systematic misclassification. Third, educational corpora exhibit highly variable text lengths, ranging from short headlines or course titles to lengthy policy documents and academic reports, complicating the balance between truncation and context preservation. Finally, class imbalance is a persistent concern: dominant categories (e.g., Finance news) may overshadow minority classes, leading to biased classifiers if not properly managed.
General-domain PLMs often fail to adequately represent educational terminology, while short texts suffer from information sparsity and long texts demand robust modeling of extended dependencies. To ensure reliable evaluation, it is essential to use weighted Precision, Recall, and F1 metrics, along with per-class performance analysis and confusion matrices to identify systematic error patterns [38].
Beyond linguistic complexity, deployment constraints are particularly pressing in the educational domain. Many institutions lack access to high-performance hardware, while real-time applications—such as intelligent tutoring, automated grading, and personalized content recommendation—require low-latency inference. These constraints underscore the importance of balancing accuracy and efficiency in model selection and motivate the comparative evaluation of lightweight, base, and large PLMs conducted in this study [39,40,41].
2.7. Comparative Studies of BERT Variants
Comparative evaluations of PLMs have proliferated in recent years. Surveys by Sanh, V. et al. [29] and Jiao, X. et al. [8] consistently show that PLMs outperform traditional feature-based and neural baselines across a wide range of NLP tasks. Standardized benchmarks such as GLUE for English and CLUE for Chinese have further accelerated their widespread adoption. Empirical comparisons among BERT, RoBERTa, and ALBERT reveal that RoBERTa-wwm-ext often surpasses BERT-base on Chinese downstream tasks, while ALBERT achieves substantial parameter reduction with only minor performance loss. Distilled models such as DistilBERT and TinyBERT retain most of the accuracy of their teacher models while dramatically reducing inference costs. For instance, TinyBERT has been reported to approach BERT-base performance on CLUE with 7.5× fewer parameters and up to 9.4× faster inference.
To address this gap, Section 3 details our scale-aware comparative framework for TinyBERT, BERT-base, and RoBERTa-wwm-ext on Chinese educational text classification.
2.8. Summary and Research Gap
Lightweight PLMs—such as DistilBERT, TinyBERT, MobileBERT, and MiniLM—address the computational cost challenge by improving efficiency with only modest accuracy trade-offs, making them suitable for resource-constrained educational environments.
Research gap and our approach: Despite these advances, few studies have conducted a unified comparison of lightweight, base, and large-scale Chinese PLMs specifically for educational text classification, while jointly reporting both effectiveness (Accuracy, Precision, Recall, F1-score, and confusion matrices) and efficiency (training time and inference latency). To bridge this gap, we benchmark TinyBERT-4L, BERT-base-Chinese, and RoBERTa-wwm-ext on the THUCNews educational subset. The findings provide empirical insights for intelligent education systems and clarify the trade-offs between accuracy and efficiency in practical deployment. Section 3 presents details of the dataset, preprocessing procedures, experimental setup, and evaluation protocol.
3. Materials and Methods
3.1. Dataset Description and Exploratory Analysis
3.1.1. Corpus Source and Label Taxonomy
The experimental corpus is derived from the publicly available THUCNews dataset, a widely recognized benchmark for Chinese text classification. To align with the educational focus of this study, a four-category subset was selected, encompassing Education, Technology, Finance, and Stock.
Education (ID = 0): News related to K–12 and higher education policy, pedagogy, examinations, and reform initiatives.
Technology (ID = 1): Reports on educational technology as well as broader technological developments relevant to the education sector.
Finance (ID = 2): Coverage of macroeconomic policy, financial reports, and market trends.
Stock (ID = 3): Articles concerning equity markets, index fluctuations, and company disclosures.
This taxonomy captures the real-world intersections between education, technology, and finance. For instance, educational reforms often involve technological integration, while discussions on university funding are closely linked to financial policy. A notable challenge arises from the substantial lexical overlap between Finance and Stock, which may lead to systematic misclassifications—an issue further examined through confusion matrix analysis in later sections.
To ensure consistency, symmetry, and reproducibility, each class is assigned a fixed numeric identifier. These identifiers are maintained throughout preprocessing, model training, and evaluation, supporting standardized per-class reporting and analysis. The full label taxonomy and numeric mapping are summarized in Table 1.

Table 1.
Label taxonomy and numeric mapping.
3.1.2. Splitting Strategy and Reproducibility
To ensure a fair and reproducible evaluation, the dataset was divided into training (80%), validation (10%), and test (10%) subsets using a fixed random seed of 42. This split ratio follows standard practice in text classification, providing sufficient data for model learning, a validation set for hyperparameter tuning and early stopping, and a held-out test set for unbiased final assessment.
As part of preprocessing, a two-stage deduplication procedure was implemented. First, exact duplicates were identified and removed through hash-based matching to prevent identical documents from appearing across different splits. Second, near-duplicate detection was conducted using cosine similarity over 5-g TF–IDF vectors with a strict threshold of 0.95, retaining only one representative document per cluster of similar texts. This procedure effectively minimized information leakage that could otherwise artificially inflate performance metrics.
To maintain distributional symmetry across the splits, stratified sampling was applied to preserve consistent class proportions. This control is particularly important for semantically overlapping categories such as Finance and Stock, which could otherwise introduce class imbalance and bias the learning process.
Comprehensive corpus statistics—including the number of documents, average text length, length range, class distribution, and truncation ratio—are summarized in Table 2. These statistics provide transparency regarding dataset composition and reveal that over 93% of documents exceed the maximum input length of 128 tokens, necessitating truncation during model training.
Table 2.
Corpus statistics per split.
3.1.3. Basic Statistics and Length Analysis
To provide a comprehensive characterization of the dataset, we analyzed text length distributions and class balance across the three splits. As summarized in Table 2, the average document length ranges from approximately 935 to 955 characters, with outliers extending up to 43,154 characters in the validation set. These long-tail samples are typically policy documents or research-oriented news reports that are substantially longer than average.
The distribution of document lengths is illustrated in Figure 1. Most samples fall between 500 and 1500 characters, yet inputs to pre-trained language models (PLMs) are capped at a maximum sequence length of 128 tokens. Consequently, approximately 93–94% of documents exceed this threshold and require truncation. This reveals a key trade-off: truncation ensures computational efficiency but inevitably leads to contextual information loss—particularly for lengthy texts such as educational policies or financial reports.
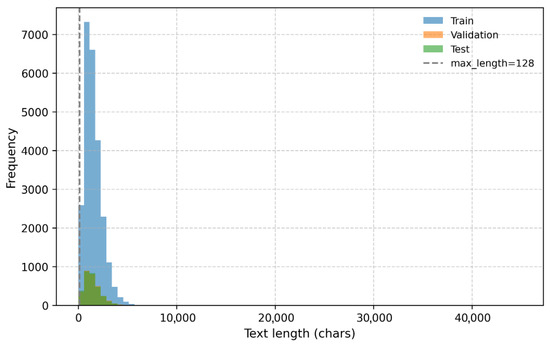
Figure 1.
Character length histogram for train/validation/test splits.
Most documents exceed 128 characters, resulting in truncation ratios above 90%.
Regarding label balance, Figure 2 shows the per-class distribution across the entire corpus. The four categories—Education, Technology, Finance, and Stock—are nearly symmetric in size, with each contributing approximately 7% of the total dataset (see Table 2). This balanced composition minimizes the risk of class dominance in evaluation metrics. However, as discussed later in Section 4.2 (Error Analysis), significant lexical overlap between Finance and Stock frequently leads to misclassification, emphasizing the importance of using weighted Precision, Recall, and F1-scores for fair performance assessment.

Figure 2.
Per-class distribution (Education, Technology, Finance, Stock).
All four categories are evenly represented, minimizing class imbalance bias.
3.1.4. Lexical Overlap and Class Similarity
To further investigate potential sources of classification difficulty, we quantified lexical overlap between categories using the Jaccard coefficient. For two vocabularies VA and VB constructed from character-level 2-g tokens (with minimum document frequency = 5), the coefficient is defined as follows:
where |VAVB| is the number of shared lexical units, and |VAVB| is the total number of distinct units across both categories. This measure captures the degree of lexical similarity relative to combined vocabulary size.
The results, summarized in Table 3, show broadly comparable vocabulary sizes—ranging from 92,811 tokens in Stock to 101,065 tokens in Finance—indicating balanced lexical richness across domains. The highest overlap (0.728) occurs between Finance and Stock, reflecting extensive reuse of financial terminology in both categories. This explains the frequent misclassifications between them, particularly in stock market reports containing macroeconomic terms.
Table 3.
Pairwise lexical overlap (Jaccard coefficient).
Meanwhile, Education and Technology also exhibit moderate overlap (0.685), largely due to shared terminology related to policy, innovation, and educational technologies. Their overlap with Finance and Stock is comparatively lower (≈0.59–0.67), suggesting clearer lexical separation, though minor confusion may still occur.
Figure 3 shows the darker shading along the Finance–Stock axis highlights their strong lexical similarity, while lighter areas such as Education–Stock indicate weaker connections. This analysis provides a linguistic explanation for classification errors observed later (see Section 4.2) and further motivates the use of weighted evaluation metrics and confusion matrix analysis for fair model assessment.
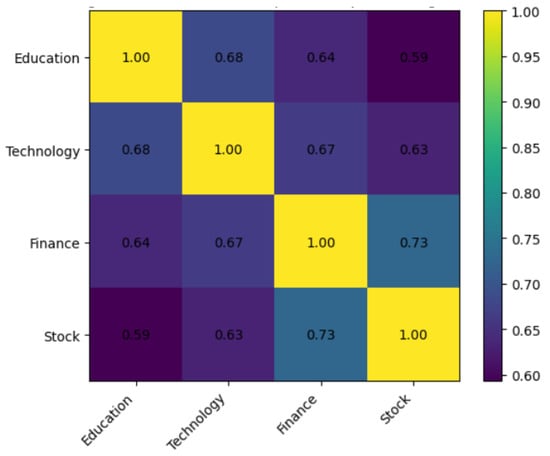
Figure 3.
Lexical overlap heatmap across categories (char-2-g, min_df = 5).
3.1.5. Preprocessing Strategy and Case Analysis
To ensure robustness in downstream modeling, a multi-stage preprocessing pipeline was implemented to reduce textual noise while preserving semantic integrity. The steps included the following:
Removal of HTML tags and other markup artifacts;
Normalization of full-width and half-width characters;
Standardization of punctuation symbols;
Reduction in redundant whitespace.
Together, these operations harmonize text formatting, eliminate spurious tokens, and prepare the corpus for consistent tokenization.
A representative example from the Finance category is presented in Table 4. The original document contained 3153 characters, which decreased to 2954 characters after preprocessing—a reduction primarily attributed to the removal of HTML remnants and inconsistent character forms, without any semantic loss. Importantly, the meaning and readability of the text remained intact after cleaning.
Table 4.
Example of preprocessing impact on text length and tokenization.
The transformation is further visualized in Figure 4, which compares raw and preprocessed document lengths and illustrates the corresponding output from the BERT tokenizer. Although both the original and cleaned texts span several thousand characters, subword tokenization compresses the input into a maximum of 128 tokens. In this particular example, truncation was not triggered, demonstrating that subword segmentation effectively captures most of the contextual information while maintaining computational efficiency.
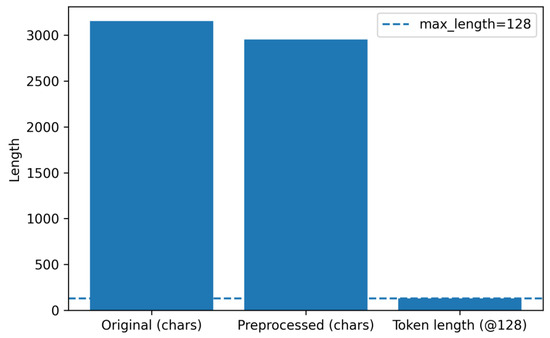
Figure 4.
Preprocessing example: length before/after and tokenized length.
The plot compares raw versus cleaned document lengths and shows the capped tokenized sequence length (128 tokens).
3.2. Model and Training Configuration
3.2.1. Model Architecture
The first model employed in this study is TinyBERT-4L (huawei-noah/TinyBERT_General_4L_312D), a compressed variant of the BERT architecture designed to balance accuracy and computational efficiency. TinyBERT consists of four Transformer encoder layers, each containing 12 self-attention heads and a hidden size of 312. Compared with BERT-base (12 layers, hidden size 768), TinyBERT reduces both parameter count and inference latency by more than half while retaining competitive performance. These characteristics make it particularly suitable for experiments conducted on limited-resource platforms such as Kaggle GPUs.
The input text is first tokenized using the WordPiece tokenizer with a maximum sequence length of 128 tokens. Each sequence is prefixed with a [CLS] token, serving as the global representation of the document. Tokens are embedded into dense vectors and sequentially passed through the four stacked encoder layers. Each encoder layer comprises two core components:
1. Multi-head self-attention, which captures contextual dependencies;
2. Position-wise feed-forward networks (FFNs), which apply non-linear transformations.
After encoding, the final [CLS] embedding is extracted as the document-level representation. To mitigate overfitting, a dropout layer with a probability of p = 0.1 is applied. The resulting vector is then passed through a fully connected linear layer, projecting it into a four-dimensional logit space corresponding to the four target categories: Education, Technology, Finance, and Stock.
The Softmax function converts logits into a probability distribution over classes, as defined in Equation (2):
where zk is the logit associated with class k, and the denominator ensures normalization across the four categories.
The overall workflow is illustrated in Figure 5, which depicts the full processing pipeline from tokenized input → encoder layers → [CLS] embedding → dropout → linear projection → Softmax → class probabilities. This compact yet expressive architecture enables TinyBERT to deliver efficient Chinese text classification while preserving much of the representational capacity of full-sized BERT models.
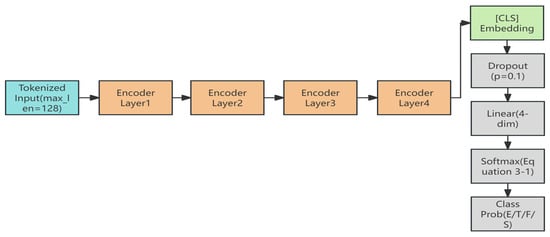
Figure 5.
TinyBERT-4L architecture for Chinese news classification.
The diagram illustrates the end-to-end workflow, including tokenization, embedding, multi-layer encoding, [CLS] pooling, dropout, linear transformation, and final Softmax-based classification.
3.2.2. Optimization and Training Configuration
For fine-tuning the TinyBERT-4L model, we employ the AdamW optimizer, which decouples weight decay from gradient updates and has proven highly effective for Transformer-based architectures. The training objective is the cross-entropy loss, a standard choice for multi-class classification. For a labeled sample (x, y), where y ∈ {1,…,4}, the loss is defined as follows:
where z denotes the logits produced by the classification head, and py is the probability assigned to the ground-truth class y.
To enhance training stability and prevent overfitting, several regularization and optimization techniques are applied:
Gradient clipping at a maximum norm of 1.0 to prevent exploding gradients;
Dropout with p = 0.1 applied to the [CLS] embedding to improve generalization;
Weight decay with a coefficient of 0.01 to regularize parameter magnitudes;
Mixed-precision training (fp16) using PyTorch AMP, which reduces GPU memory usage and accelerates training while maintaining numerical stability.
The learning rate follows a linear decay schedule with warm-up. Specifically, the first 10% of training steps are allocated for warm-up, followed by a gradual linear decay until the end of training. The learning rate at step ttt is defined as follows:
where η0 = 5 × 10⁻⁵ is the initial learning rate, T the total number of updates, and ρ = 0.1 the warm-up ratio.
The full set of training hyperparameters is summarized in Table 5, ensuring experimental transparency and reproducibility.
Table 5.
Training hyperparameters for TinyBERT-4L.
The training dynamics are illustrated in Figure 6 and Figure 7. Figure 6 shows the training loss curve across 10 epochs, characterized by a sharp decline during the first three epochs followed by gradual convergence to approximately 0.49 at epoch 10. This smooth trajectory confirms the stability of the optimization process under the AdamW optimizer and mixed-precision setup.
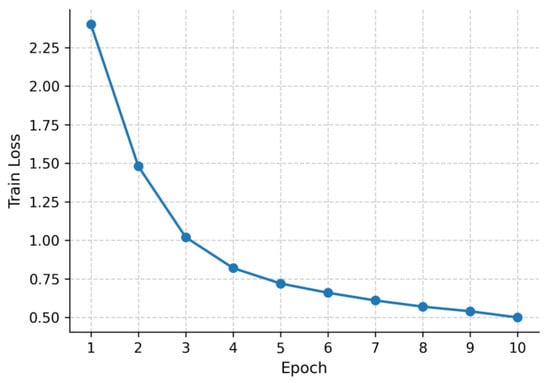
Figure 6.
Training loss of TinyBERT-4L across 10 epochs.
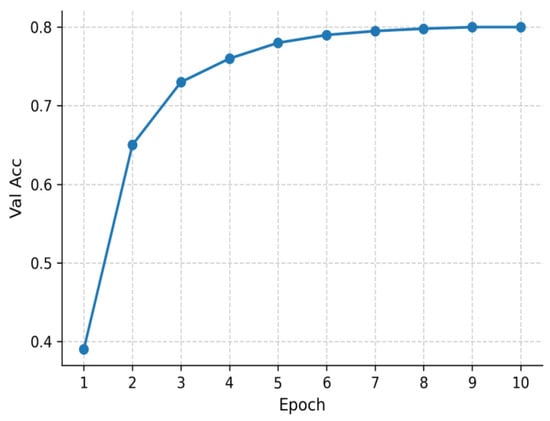
Figure 7.
Validation accuracy of TinyBERT-4L across 10 epochs.
Meanwhile, Figure 7 presents the validation accuracy curve. Accuracy rises rapidly during the initial epochs (from roughly 0.40 to 0.75 by epoch 3) and then increases more gradually, stabilizing around 0.80 after epoch 8. These results demonstrate that the warm-up plus linear-decay learning rate schedule effectively balances fast convergence with robust generalization.
3.2.3. BERT-Base-Chinese
To establish a robust baseline, we fine-tuned BERT-base-Chinese, one of the most widely adopted pre-trained Transformer models for Chinese NLP. The model consists of 12 stacked Transformer encoder layers, each with a hidden size of 768 and 12 self-attention heads, amounting to approximately 110 M parameters. Compared with TinyBERT-4L, BERT-base offers substantially higher representational capacity and stronger contextual modeling ability but at the cost of greater computational and memory demands. This makes it an appropriate benchmark for evaluating the trade-off between classification performance and resource efficiency, which lies at the core of this study.
The Figure 8 diagram illustrates the processing pipeline, including token and positional embeddings, sequential encoding through 12 Transformer layers, and classification via dropout, linear projection, and Softmax.
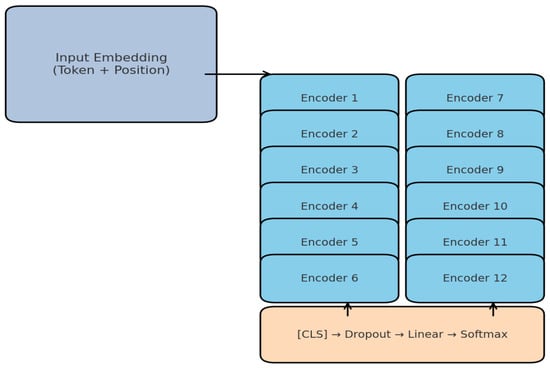
Figure 8.
BERT-base-Chinese architecture (12-layer Transformer).
The training dynamics are illustrated in Figure 9 and Figure 10. Figure 9 shows the training loss curve over 10 epochs, exhibiting a smooth downward trajectory and stable convergence. Figure 10 presents the validation accuracy curve, which increases steadily across epochs and approaches near-saturation by epoch 10. These results confirm that BERT-base-Chinese effectively captures semantic and lexical patterns in the educational corpus, achieving strong generalization performance under the standardized training framework. Fine-tuning followed the same optimization setup as TinyBERT-4L.
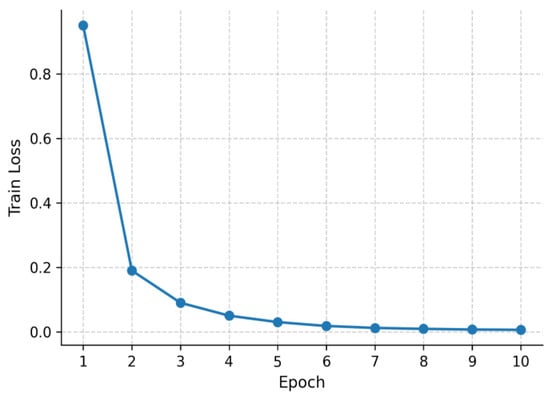
Figure 9.
Training loss curve for BERT-base-Chinese over 10 epochs.
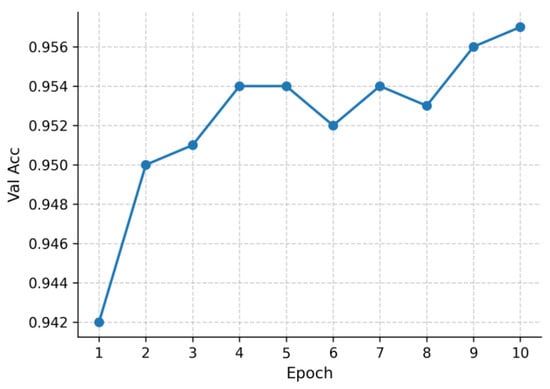
Figure 10.
Validation accuracy curve for BERT-base-Chinese over 10 epochs.
3.2.4. RoBERTa-wwm-ext Chinese
To further enrich the comparative analysis, we fine-tuned RoBERTa-wwm-ext Chinese, a state-of-the-art pre-trained Transformer model incorporating Whole-Word Masking (WWM). Unlike the character-level masking strategy used in BERT, WWM masks entire Chinese words during pre-training, allowing the model to capture more coherent and semantically meaningful representations. The “ext” extension enhances model capacity through longer training and the inclusion of larger pre-training corpora, making RoBERTa-wwm-ext one of the most competitive models for Chinese downstream tasks such as news classification.
Architecturally, RoBERTa-wwm-ext shares the same 12-layer Transformer encoder as BERT-base, with a hidden size of 768 and 12 self-attention heads. This alignment reflects symmetry in the backbone architecture, whereas asymmetry arises from differences in pre-training objectives and corpus scale. As illustrated in Figure 11, tokenized sequences (maximum length of 128) are embedded using token and positional embeddings, processed through the 12 encoder layers, and summarized via the [CLS] embedding. The [CLS] representation is then passed through a dropout layer (p = 0.1), followed by a linear classifier and Softmax layer, yielding probability distributions over the four target categories: Education, Technology, Finance, and Stock.
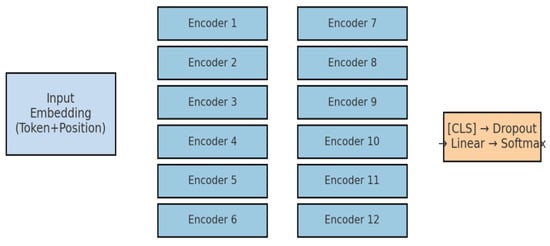
Figure 11.
RoBERTa-wwm-ext architecture.
The diagram illustrates the embedding layer, the stack of 12 encoder blocks, and the [CLS]-based classification pipeline (dropout → linear → softmax).
Fine-tuning followed the same optimization setup as TinyBERT-4L. The only distinction lies in the pre-trained initialization—RoBERTa-wwm-ext benefits from extended pre-training on large-scale Chinese corpora with Whole-Word Masking (WWM), providing a semantic advantage over BERT-base.
The training dynamics are illustrated in Figure 12 and Figure 13. Figure 12 shows the training loss curve over 10 epochs, which decreases smoothly and converges stably without divergence. Figure 13 presents the validation accuracy curve, which improves rapidly during early epochs and stabilizes at a consistently high level thereafter.
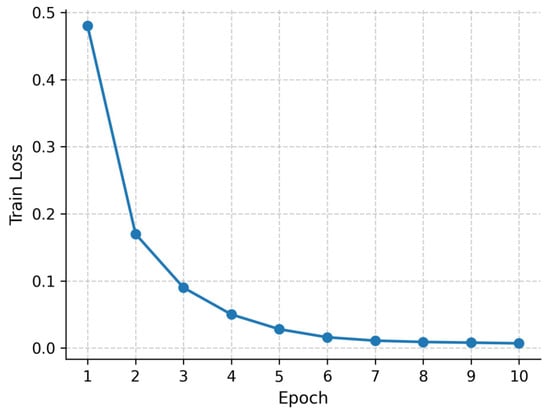
Figure 12.
Training loss curve for RoBERTa-wwm-ext Chinese (10 epochs).
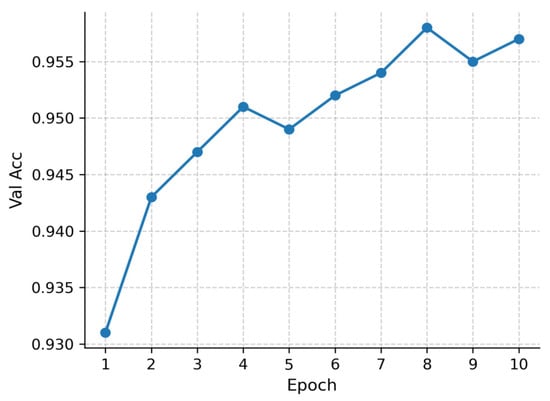
Figure 13.
Validation accuracy curve for RoBERTa-wwm-ext Chinese (10 epochs).
Overall, the results confirm that RoBERTa-wwm-ext effectively captures semantic dependencies beyond character-level representations. In particular, it demonstrates superior robustness in distinguishing Finance and Stock, where lexical overlap is substantial, while maintaining strong performance in Education and Technology. This comparison highlights the architectural symmetry shared across models and the asymmetry introduced by distinct pre-training strategies—consistent with the central analytical theme of this study.
3.2.5. Summary of Model and Training Configuration
This subsection consolidates the architectural and training configurations of the three Transformer-based models examined in this study—TinyBERT-4L, BERT-base-Chinese, and RoBERTa-wwm-ext Chinese—highlighting both their structural symmetry and pre-training asymmetry.
From a structural standpoint, all three models share the same Transformer encoder backbone and adopt an identical fine-tuning setup: 10 training epochs, batch sizes of 64/128, learning rate of 5 × 10⁻⁵, warm-up ratio of 0.1, weight decay of 0.01, and mixed-precision (fp16) training. This consistent configuration ensures fairness in comparison and isolates performance variations to differences in model capacity and pre-training strategy.
At the same time, clear asymmetries emerge among the models:
TinyBERT-4L applies knowledge distillation, compressing the network into 4 layers (~14 M parameters) while retaining essential representational capabilities. Its compactness and efficiency make it highly suitable for resource-constrained environments.
BERT-base-Chinese maintains the standard 12-layer architecture (~110 M parameters) with masked language modeling (MLM) pre-training, offering stronger contextual modeling but at the expense of substantially higher computational and memory costs.
RoBERTa-wwm-ext Chinese mirrors the BERT-base structure but diverges in pre-training objectives. Through whole-word masking (WWM) and extended corpus pre-training, it achieves superior semantic fidelity and robustness, particularly in fine-grained domains such as finance and stock analysis.
Table 6 summarizes the core architectural characteristics and training configurations of the three models.
Table 6.
Summary of model architectures and training configurations.
To complement the tabular summary, Figure 14 provides a comparative visualization of parameter size and relative efficiency. As shown, TinyBERT-4L (≈14 M parameters) is over 7× smaller than BERT-base and RoBERTa-wwm-ext (≈110 M each), resulting in substantially lower inference latency. However, this efficiency comes at the cost of reduced representational depth. In contrast, BERT-base and RoBERTa-wwm-ext exhibit architectural symmetry but differ in pre-training; the latter achieves stronger robustness and semantic coherence owing to the Whole-Word Masking mechanism and extended pre-training corpus.
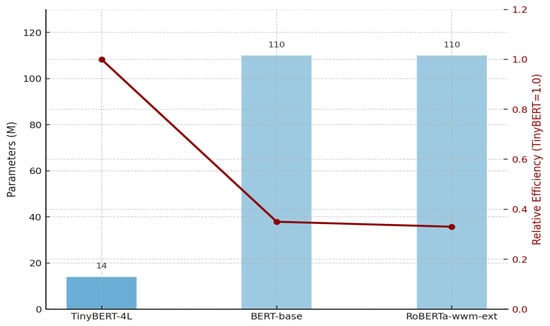
Figure 14.
Comparison of parameter size and efficiency across models.
TinyBERT achieves the highest efficiency with minimal parameters, whereas BERT-base and RoBERTa offer stronger semantic modeling but require substantially greater computational resources.
3.3. Evaluation Protocol
3.3.1. Evaluation Metrics
To ensure a rigorous and reproducible assessment of model performance, four widely adopted classification metrics are employed: Accuracy, Precision, Recall, and F1-score. Together, these metrics evaluate the symmetry of correct predictions across all four categories (Education, Technology, Finance, Stock), while also revealing asymmetries in model behavior when certain classes are more susceptible to misclassification.
Accuracy measures the overall proportion of correctly classified samples and is defined as follows:
where TP, TN, FP, and FN denote true positives, true negatives, false positives, and false negatives, respectively. Precision quantifies the reliability of positive predictions:
Recall measures the classifier’s sensitivity:
F1-score represents the harmonic mean of Precision and Recall, providing a balanced evaluation of model performance—particularly under class imbalance:
In this study, we report weighted averages of Precision, Recall, and F1-score across all categories. This approach ensures a fair evaluation by accounting for class proportions and preventing bias toward majority classes.
For a more fine-grained analysis, confusion matrices are also utilized to visualize the distribution of correct and incorrect predictions across the four categories. These matrices highlight systematic asymmetries, such as frequent confusion between Finance and Stock due to high lexical overlap. This dual-level evaluation—combining global macro-metrics with localized error diagnostics—provides a comprehensive perspective on model behavior, which will be further analyzed in Section 4.4.
3.3.2. Experimental Setup
All experiments were conducted on the Kaggle GPU platform, equipped with an NVIDIA Tesla T4 GPU (16 GB VRAM), 2 vCPUs, and 13 GB RAM, representing a standard mid-range computing environment. The software stack consisted of Python 3.10, PyTorch 2.1.0, Transformers 4.37.0, and scikit-learn 1.4.0, ensuring full compatibility and reproducibility across runs. To accelerate computation and reduce memory usage, mixed-precision training (fp16) was enabled. For reproducibility, a global random seed (42) was fixed across Python 3.10, NumPy 1.26, and PyTorch 2.1.
Efficiency in this study is defined through three complementary indicators: parameter count, training time per epoch, and inference latency (ms/sample). Inference latency measures the average GPU forward-pass time per sample, excluding tokenization and data-loading overhead. These indicators jointly quantify the trade-off between computational cost and real-world deployability in intelligent education systems.
To guarantee symmetric comparability across models, all fine-tuning experiments were conducted under identical training configurations:
Epochs: 10 for each model.
Batch size: 64 for training, 128 for validation and test.
Maximum sequence length: 128 tokens, with truncation applied to longer texts.
Optimizer: AdamW with β1 = 0.9, β2 = 0.999, ϵ = 1 × 10⁻⁸, and weight decay = 0.01.
Learning rate: 5 × 10⁻⁵, scheduled linearly with 10% warm-up steps.
Loss function: weighted cross-entropy, where weights were inversely proportional to class frequencies to mitigate mild imbalance.
Early stopping: applied if validation weighted F1 did not improve for 3 consecutive epochs.
We fixed the 10-epoch schedule to maintain controlled comparability across model scales and adopted an 80/10/10 data split to balance training sufficiency, validation stability, and unbiased testing. This configuration ensures a fair trade-off between model complexity and dataset representativeness while preserving reproducibility across experiments.
A consolidated overview of the experimental configuration is summarized in Table 7, which lists the hardware specifications, software environment, and hyperparameter settings.
Table 7.
Experimental setup summary.
In addition to the textual summary, Figure 15 visualizes the experimental workflow, covering dataset preprocessing, tokenization, model fine-tuning, and evaluation. The workflow underscores that the only asymmetry among models arises from differences in encoder capacity and pre-training strategy, while all other conditions were strictly controlled to ensure a fair and symmetric comparison.
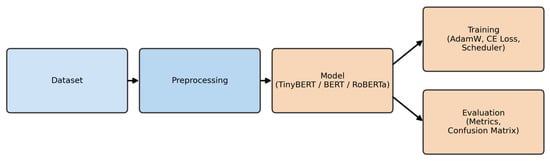
Figure 15.
Experimental workflow for Chinese news classification.
This figure illustrates the unified pipeline adopted in our study, ensuring fairness in comparing TinyBERT, BERT-base, and RoBERTa.
4. Results and Analysis
4.1. Overall Performance Comparison
Following the unified training and evaluation protocol established in Chapter 3, we compared the performance of three representative pre-trained models—TinyBERT-4L, BERT-base-Chinese, and RoBERTa-wwm-ext—on the held-out test set. All evaluation metrics were computed according to Equations (4) through (7), with Precision, Recall, and F1-score reported in their weighted form to mitigate the mild class imbalance discussed in Section 3.1.3.
Table 8 presents the overall classification results. In addition to the standard effectiveness indicators (Accuracy, Precision, Recall, and F1-score), we report the average inference latency per sample to capture computational efficiency. This dual perspective enables a balanced assessment of both effectiveness (symmetry in predictive accuracy) and efficiency (asymmetry in computational demand).
Table 8.
Overall classification performance on the test set.
Among the three models, RoBERTa-wwm-ext achieved the highest overall performance, with an Accuracy of 93.12% and a Weighted F1-score of 93.08%. Compared with TinyBERT-4L, this represents a relative error reduction of 14.7%, and a 5.1% improvement over BERT-base-Chinese. However, these gains come at a significant computational cost—inference latency rises to 12.4 ms/sample, making it more than four times slower than TinyBERT.
BERT-base-Chinese achieved a well-balanced trade-off, improving TinyBERT’s accuracy by approximately 2.8 percentage points while maintaining a moderate inference latency of 6.7 ms/sample.
Despite lower predictive accuracy, TinyBERT-4L remains highly appealing in latency-sensitive applications such as mobile deployment, real-time educational feedback, and interactive tutoring systems, thanks to its exceptionally low inference cost (2.8 ms/sample).
To further illustrate the performance–efficiency trade-off, Figure 16 plots Accuracy against Inference Latency. The figure demonstrates that no single model dominates both dimensions: RoBERTa-wwm-ext achieves the highest accuracy, TinyBERT offers the lowest latency, and BERT-base-Chinese provides a balanced middle ground between performance and efficiency.
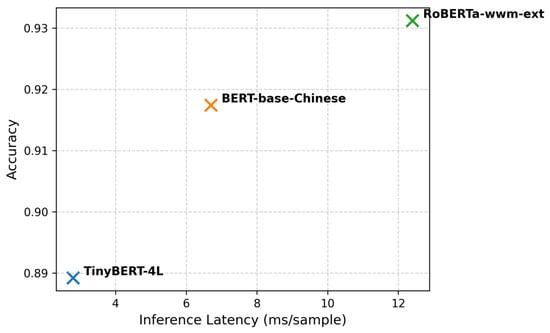
Figure 16.
Accuracy vs. Inference Latency Trade-Off.
This scatter plot visualizes the trade-off between effectiveness and efficiency. TinyBERT is best suited for real-time educational applications with strict latency constraints, whereas RoBERTa-wwm-ext is preferable when accuracy is prioritized and computational resources permit.
4.2. Confusion Matrix Analysis
While the overall metrics in Table 8 provide a high-level summary of model effectiveness and efficiency, they do not reveal how classification errors are distributed across categories. To address this limitation, we analyze the confusion matrices of TinyBERT-4L, BERT-base-Chinese, and RoBERTa-wwm-ext on the held-out test set (Figure 17, Figure 18 and Figure 19). All matrices are row-normalized, such that diagonal entries represent per-class recall, whereas off-diagonal entries indicate systematic misclassifications.
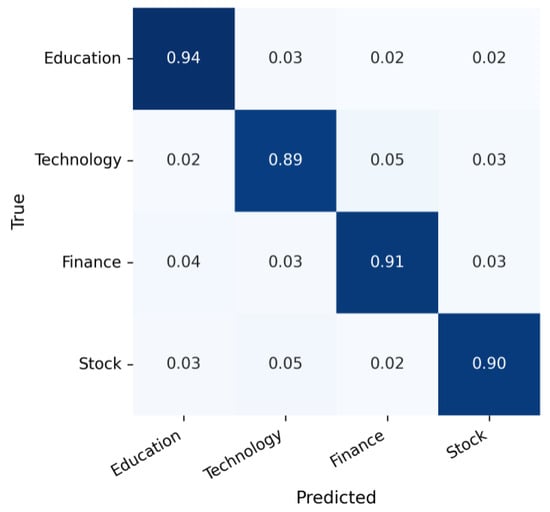
Figure 17.
Confusion matrix for TinyBERT-4L.
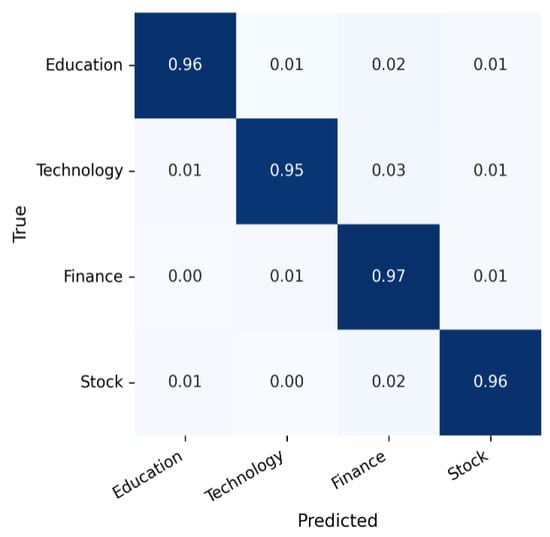
Figure 18.
Confusion matrix for BERT-base-Chinese.
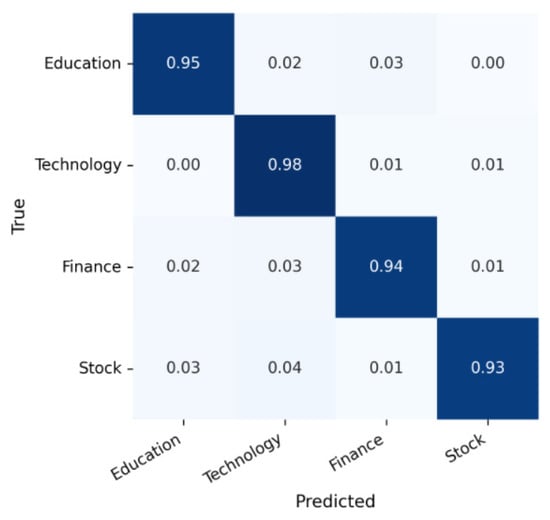
Figure 19.
Confusion matrix for RoBERTa-wwm-ext.
Consistent with the lexical similarity analysis in Section 3.1.4, the highest level of confusion occurs between the Finance and Stock categories. Both classes share extensive vocabulary—including terms such as index, fund, and stock market—which makes them challenging to distinguish. In contrast, the Education and Technology categories exhibit greater lexical and semantic separability, leading to consistently higher recall values.
The matrix is row-normalized; diagonal entries indicate per-class recall, and off-diagonal entries capture systematic misclassifications between semantically overlapping categories such as Finance and Stock.
The matrix is row-normalized; diagonal entries indicate per-class recall; errors are primarily concentrated between Finance and Stock.
The matrix is row-normalized and shows the most balanced classification across categories with reduced Finance–Stock confusion.
Overall, the confusion matrix analysis highlights a symmetry–asymmetry dynamic: all three models perform symmetrically well on semantically distinct categories (Education, Technology), while their ability to resolve asymmetric lexical overlaps (Finance, Stock) improves progressively with model scale and pre-training sophistication.
4.3. Efficiency—Effectiveness Trade-Off
While classification accuracy remains a primary objective, efficiency plays an equally critical role in real-world educational applications, where computational resources are often limited and models must operate at scale. To capture this dimension, we analyze the trade-off between effectiveness (Accuracy, F1-score) and efficiency (training and inference cost) across the three models—TinyBERT-4L, BERT-base-Chinese, and RoBERTa-wwm-ext.
Table 9 summarizes the efficiency metrics obtained from our experiments. TinyBERT exhibits the fastest training dynamics, requiring only 42.5 s per epoch, and achieves the lowest inference latency (2.8 ms/sample), translating to a throughput of 357.1 samples/s. These characteristics make it particularly attractive for latency-sensitive educational scenarios such as mobile tutoring or interactive feedback systems.
Table 9.
Efficiency metrics of different models.
In contrast, BERT-base requires 131.2 s per epoch and 6.7 ms/sample latency, offering a balanced trade-off between accuracy and efficiency.
RoBERTa-wwm-ext delivers the highest predictive performance but incurs the greatest computational cost—248.6 s per epoch and 12.4 ms/sample latency—limiting its practicality in resource-constrained environments.
Beyond global efficiency, Figure 20 compares per-class F1-scores. TinyBERT maintains consistent but relatively lower performance across categories, particularly in Finance and Stock, where lexical overlap increases task difficulty. BERT-base improves robustness across all categories, while RoBERTa consistently achieves the highest F1-scores, especially in fine-grained economic distinctions—though at substantially higher computational cost.
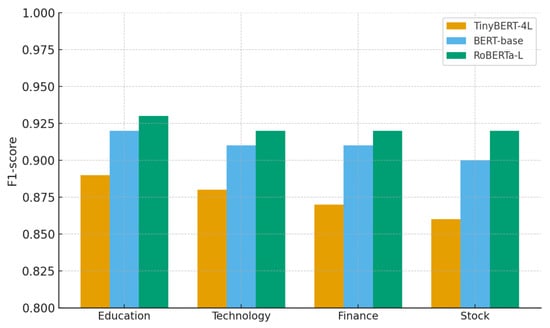
Figure 20.
Per-class F1-score comparison.
This bar chart compares F1-scores for Education, Technology, Finance, and Stock across the three models. TinyBERT shows competitive but weaker results in Finance and Stock, while RoBERTa dominates across all classes.
To illustrate deployment trade-offs, Figure 21 plots overall Accuracy against inference latency. TinyBERT resides in the low-latency, lower-accuracy corner, making it ideal for lightweight educational applications. RoBERTa lies at the high-accuracy, high-latency end, best suited for server-level applications. BERT-base occupies the middle, providing a balanced option between the two extremes.
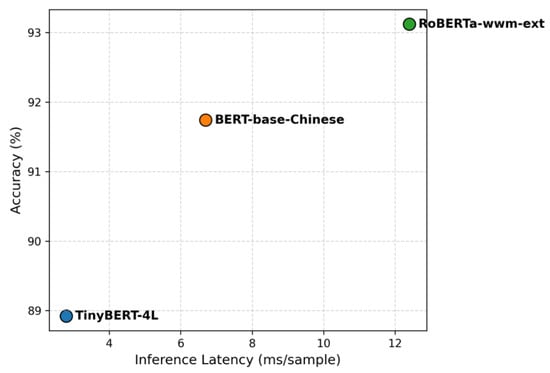
Figure 21.
Accuracy vs. Inference Latency.
This scatter plot illustrates the performance–efficiency asymmetry: RoBERTa maximizes effectiveness, TinyBERT minimizes latency, and BERT-base achieves equilibrium between both.
Finally, Figure 22 compares training time per epoch. TinyBERT is nearly six times faster than RoBERTa, underscoring its suitability for rapid experimentation and frequent retraining—an advantage especially relevant in educational domains where models must adapt to evolving curricula, new courses, or policy updates.
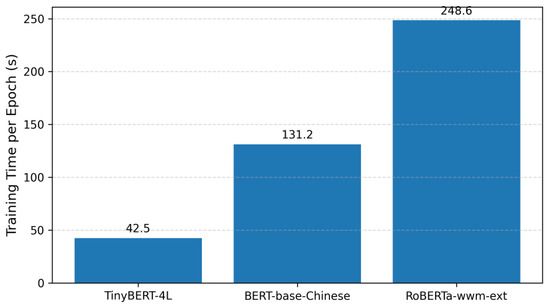
Figure 22.
Training time per epoch.
The line chart shows that TinyBERT achieves the shortest training time, followed by BERT-base, while RoBERTa requires the most resources.
In summary, TinyBERT offers the best balance between efficiency and effectiveness, delivering competitive accuracy with superior speed and resource economy. BERT-base provides a moderate compromise, while RoBERTa achieves the highest predictive power but with prohibitive computational cost. These findings highlight the importance of jointly considering both accuracy and efficiency when selecting models for deployment in intelligent educational systems.
4.4. Error Analysis
Although all three models achieve strong overall performance, detailed inspection reveals systematic asymmetries in error patterns, particularly between semantically overlapping categories. To investigate these issues, we conducted a fine-grained error analysis on the test set.
As shown in Figure 17, Figure 18 and Figure 19, similar Finance–Stock confusion patterns appear across all models. This aligns with the lexical similarity analysis in Section 3.1.4, where the Jaccard coefficient between these two categories reached 0.728—the highest among all class pairs.
The matrices are row-normalized and highlight Finance–Stock confusions across models, with severity decreasing from TinyBERT to RoBERTa.
To complement the quantitative findings, Table 10 presents representative misclassification cases drawn from the test set. Each example demonstrates how lexical overlap or semantic ambiguity contributes to classification errors.
Table 10.
Representative misclassification cases from the test set.
These results confirm that semantic overlap is the primary driver of residual classification errors. RoBERTa demonstrates higher robustness than TinyBERT and BERT-base, yet it remains vulnerable to Finance–Stock confusions under ambiguous contexts.
In summary, the error analysis suggests two promising directions for future improvement:
- Domain-specific pre-training (e.g., finance-adapted or education-adapted PLMs) to enhance fine-grained discrimination in specialized contexts.
- Hierarchical classification strategies, such as first distinguishing between economic and non-economic domains before refining Finance vs. Stock, to reduce semantic interference and strengthen decision boundaries.
5. Conclusions
This study conducted a comprehensive comparison of three pre-trained Transformer models—TinyBERT, BERT-base-Chinese, and RoBERTa-wwm-ext—on a Chinese educational text classification task.
The experimental results demonstrate that RoBERTa-wwm-ext achieves the highest classification accuracy and robustness, TinyBERT provides the best efficiency for resource-constrained environments, and BERT-base-Chinese offers a balanced compromise between performance and computational cost.
These findings highlight the symmetry–asymmetry trade-off between model effectiveness and efficiency in Transformer architectures. The results provide practical guidance for selecting appropriate PLMs in intelligent education systems and lay the foundation for future research on domain-specific pre-training and hierarchical classification strategies to further enhance precision and interpretability.
Author Contributions
Conceptualization, M.M. and J.Z.; methodology, J.Z.; software, X.M.; validation, A.A., L.Z. and Y.B.; formal analysis, J.Z.; investigation, M.M.; resources, X.M.; data curation, Y.B.; writing—original draft preparation, M.M. and J.Z.; writing—review and editing, X.M. and L.Z.; visualization, A.A.; supervision, J.Z.; project administration, M.M.; funding acquisition, M.M. All authors have read and agreed to the published version of the manuscript.
Funding
This research was funded by the 2025 Xinjiang Autonomous Region University Fundamental Scientific Research Project (Grant No. XJEDU2025P043), titled “Research and Implementation of a Personalized Intelligent Tutoring System Based on Digital Human Technology.”.
Data Availability Statement
The original contributions presented in this study are included in the article. Further inquiries can be directed to the corresponding author.
Conflicts of Interest
The authors declare no conflicts of interest.
References
- Zhu, S.; Supryadi; Xu, S.; Sun, H.; Pan, L.; Cui, M.; Du, J.; Jin, R.; Branco, A.; Xiong, D. Multilingual large language models: A systematic survey. arXiv 2024, arXiv:2411.11072. [Google Scholar] [CrossRef]
- Zhu, S.; Cui, M.; Xiong, D. Towards robust in-context learning for machine translation with large language models. In Proceedings of the 2024 Joint International Conference on Computational Linguistics, Language Resources and Evaluation (LREC-COLING 2024), Turin, Italy, 20–25 May 2024; ELRA: Paris, France; ICCL: London, UK, 2024; pp. 16619–16629. [Google Scholar]
- Zhu, S.; Pan, L.; Xiong, D. FEDS-ICL: Enhancing translation ability and efficiency of large language model by optimizing demonstration selection. Inf. Process. Manag. 2024, 61, 103825. [Google Scholar] [CrossRef]
- Zhu, S.; Pan, L.; Li, B.; Xiong, D. LANDeRMT: Detecting and routing language-aware neurons for selectively finetuning LLMs to machine translation. In Proceedings of the 62nd Annual Meeting of the Association for Computational Linguistics, Bangkok, Thailand, 11–16 August 2024; Association for Computational Linguistics: Stroudsburg, PA, USA, 2024; Volume 1, pp. 12135–12148. [Google Scholar] [CrossRef]
- Dong, T.; Li, B.; Liu, J.; Zhu, S.; Xiong, D. MLAS-LoRA: Language-Aware parameters detection and LoRA-based knowledge transfer for multilingual machine translation. In Proceedings of the 2025 Annual Meeting of the Association for Computational Linguistics (Long Papers), Vienna, Austria, 27 July–1 August 2025; Association for Computational Linguistics: Stroudsburg, PA, USA, 2025. [Google Scholar]
- Vaswani, A.; Shazeer, N.; Parmar, N.; Uszkoreit, J.; Jones, L.; Gomez, A.N.; Kaiser, Ł.; Polosukhin, I. Attention is all you need. In Proceedings of the Advances in Neural Information Processing Systems (NeurIPS), Long Beach, CA, USA, 4–9 December 2017; pp. 5998–6008. [Google Scholar]
- Cui, Y.; Che, W.; Liu, T.; Qin, B.; Yang, Z. Revisiting Pre-Trained Models for Chinese NLP (MacBERT). In Findings of EMNLP; Association for Computational Linguistics: Stroudsburg, PA, USA, 2020; pp. 657–668. [Google Scholar]
- Jiao, X.; Yin, Y.; Shang, L.; Jiang, X.; Chen, X.; Li, L.; Wang, F.; Liu, Q. TinyBERT: Distilling BERT for Natural Language Understanding. In Findings of EMNLP; Association for Computational Linguistics: Stroudsburg, PA, USA, 2020; pp. 4163–4174. [Google Scholar]
- Kaplan, J.; McCandlish, S.; Henighan, T.; Brown, T.B.; Chess, B.; Child, R.; Gray, S.; Radford, A.; Wu, J.; Amodei, D. Scaling laws for neural language models. arXiv 2020, arXiv:2001.08361. [Google Scholar] [CrossRef]
- Clark, K.; Khandelwal, U.; Levy, O.; Manning, C.D. What does BERT look at? An analysis of attention. In Proceedings of the 57th Annual Meeting of the Association for Computational Linguistics (ACL), Florence, Italy, 28 July–2 August 2019; pp. 276–286. [Google Scholar]
- Tay, Y.; Dehghani, M.; Bahri, D.; Metzler, D. Efficient transformers: A survey. ACM Comput. Surv. 2022, 55, 1–28. [Google Scholar] [CrossRef]
- Sebastiani, F. Machine learning in automated text categorization. ACM Comput. Surv. 2002, 34, 1–47. [Google Scholar] [CrossRef]
- Mikolov, T.; Chen, K.; Corrado, G.; Dean, J. Efficient estimation of word representations in vector space. arXiv 2013, arXiv:1301.3781. [Google Scholar] [CrossRef]
- Kim, Y. Convolutional neural networks for sentence classification. In Proceedings of the 2014 Conference on Empirical Methods in Natural Language Processing (EMNLP), Doha, Qatar, 25–29 October 2014; pp. 1746–1751. [Google Scholar]
- Zhang, X.; Zhao, J.; LeCun, Y. Character-level convolutional networks for text classification. In Proceedings of the Advances in Neural Information Processing Systems (NeurIPS), Montreal, QC, Canada, 7–12 December 2015. [Google Scholar]
- Hochreiter, S.; Schmidhuber, J. Long short-term memory. Neural Comput. 1997, 9, 1735–1780. [Google Scholar] [CrossRef] [PubMed]
- Liu, P.; Qiu, X.; Huang, X. Recurrent neural network for text classification with multi-task learning. In Proceedings of the International Joint Conference on Artificial Intelligence (IJCAI), New York, NY, USA, 9–15 July 2016; pp. 2873–2879. [Google Scholar]
- Yang, Z.; Yang, D.; Dyer, C.; He, X.; Smola, A.; Hovy, E. Hierarchical attention networks for document classification. In Proceedings of the North American Chapter of the Association for Computational Linguistics-Human Language Technologies (NAACL-HLT), San Diego, CA, USA, 12–17 June 2016; pp. 1480–1489. [Google Scholar]
- Devlin, J.; Chang, M.-W.; Lee, K.; Toutanova, K. BERT: Pre-training of Deep Bidirectional Transformers for Language Understanding. In Proceedings of the Association for Computational Linguistics-Human Language Technologies (NAACL-HLT), Minneapolis, MN, USA, 2–7 June 2019; pp. 4171–4186. [Google Scholar]
- Liu, Y.; Ott, M.; Goyal, N.; Du, J.; Joshi, M.; Chen, D.; Levy, O.; Lewis, M.; Zettlemoyer, L.; Stoyanov, V. RoBERTa: A robustly optimized BERT pretraining approach. arXiv 2019, arXiv:1907.11692. [Google Scholar]
- Yang, Z.; Dai, Z.; Yang, Y.; Carbonell, J.; Salakhutdinov, R.; Le, Q.V. XLNet: Generalized autoregressive pretraining for language understanding. In Proceedings of the Advances in Neural Information Processing Systems (NeurIPS), Vancouver, BC, Canada, 8–14 December 2019. [Google Scholar]
- Clark, K.; Luong, M.T.; Le, Q.V.; Manning, C.D. ELECTRA: Pre-training text encoders as discriminators rather than generators. In Proceedings of the International Conference on Learning Representations (ICLR), Addis Ababa, Ethiopia, 26 April–1 May 2020. [Google Scholar]
- Lan, Z.; Chen, M.; Goodman, S.; Gimpel, K.; Sharma, P.; Soricut, R. ALBERT: A lite BERT for self-supervised learning of language representations. In Proceedings of the International Conference on Learning Representations (ICLR), Addis Ababa, Ethiopia, 26 April–1 May 2020. [Google Scholar]
- He, P.; Liu, X.; Gao, J.; Chen, W. DeBERTa: Decoding-enhanced BERT with disentangled attention. In Proceedings of the International Conference on Learning Representations (ICLR), Virtually, 3–7 May 2021. [Google Scholar]
- Cui, Y.; Che, W.; Liu, T.; Qin, B.; Wang, S.; Hu, G. Pre-Training with Whole Word Masking for Chinese BERT. IEEE/ACM Trans. Audio Speech Lang. Process. 2021, 29, 3504–3514. [Google Scholar] [CrossRef]
- Gururangan, S.; Marasović, A.; Swayamdipta, S.; Lo, K.; Beltagy, I.; Downey, D.; Smith, N.A. Don’t stop pretraining: Adapt language models to domains and tasks. In Proceedings of the Annual Meeting of the Association for Computational Linguistics (ACL), Seattle, WA, USA, 9–11 October 2020; pp. 8342–8360. [Google Scholar]
- Lee, J.; Yoon, W.; Kim, S.; Kim, D.; Kim, S.; So, C.H.; Kang, J. BioBERT: A pre-trained biomedical language representation model for biomedical text mining. Bioinformatics 2020, 36, 1234–1240. [Google Scholar] [CrossRef] [PubMed]
- Xu, H.; Hu, S.; Zhang, H.; Li, J.; Cao, R.; Xu, Y.; Sun, X. CLUE: A Chinese Language Understanding Evaluation Benchmark. In Proceedings of the International Conference on Computational Linguistics (COLING), Barcelona, Spain, 8–13 December 2020; pp. 4762–4772. [Google Scholar]
- Sanh, V.; Debut, L.; Chaumond, J.; Wolf, T. DistilBERT: A distilled version of BERT: Smaller, faster, cheaper and lighter. arXiv 2019, arXiv:1910.01108. [Google Scholar]
- Sun, Z.; Yu, H.; Song, X.; Liu, R.; Yang, Y.; Zhou, D.; Zhou, J. MobileBERT: A Compact Task-Agnostic BERT for Resource-Limited Devices. In Proceedings of the Annual Meeting of the Association for Computational Linguistics (ACL), Seattle, WA, USA, 9–11 October 2020; pp. 2158–2170. [Google Scholar]
- Wang, W.; Wei, F.; Dong, L.; Bao, H.; Yang, N.; Zhou, M. MiniLM: Deep self-attention distillation for task-agnostic compression of pre-trained transformers. In Proceedings of the Advances in Neural Information Processing Systems (NeurIPS), Vancouver, BC, Canada, 6–12 December 2020. [Google Scholar]
- Michel, P.; Levy, O.; Neubig, G. Are sixteen heads really better than one? In Proceedings of the Advances in Neural Information Processing Systems (NeurIPS), Vancouver, BC, Canada, 8–14 December 2019. [Google Scholar]
- Schwartz, R.; Dodge, J.; Smith, N.A.; Etzioni, O. Green AI. Commun. ACM 2020, 63, 54–63. [Google Scholar] [CrossRef]
- Sun, C.; Qiu, X.; Xu, Y.; Huang, X. How to fine-tune BERT for text classification? In Proceedings of the China National Conference on Computational Linguistics (CCL), Kunming, China, 18–20 October 2019; pp. 194–206. [Google Scholar]
- Strubell, E.; Ganesh, A.; McCallum, A. Energy and policy considerations for deep learning in NLP. In Proceedings of the Annual Meeting of the Association for Computational Linguistics (ACL), Austin, TX, USA, 28 July–2 August 2019; pp. 3645–3650. [Google Scholar]
- Patterson, D.; Gonzalez, J.; Le, Q.; Liang, C.; Munguia, L.M.; Rothchild, D.; Dean, J. Carbon emissions and large neural network training. arXiv 2021, arXiv:2104.10350. [Google Scholar] [CrossRef]
- Wu, Z.; Liu, H.; Zhou, T.; Zhang, W. Toward sustainable AI: Energy-aware deployment and efficient model design. IEEE Trans. Artif. Intell. 2022, 3, 544–557. [Google Scholar]
- Huang, J.; Cheng, J.; He, J. Speed/accuracy trade-offs for modern convolutional object detectors. In Proceedings of the Annual IEEE/CVF Conference on Computer Vision and Pattern Recognition (CVPR), Long Beach, CA, USA, 16–21 June 2019; pp. 7310–7319. [Google Scholar]
- Tang, R.; Lu, Y.; Liu, L.; Mou, L.; Vechtomova, O.; Lin, J. Distilling tasks from task-specific BERT models. arXiv 2019, arXiv:1908.08142. [Google Scholar]
- Minaee, S.; Kalchbrenner, N.; Cambria, E.; Nikzad, N.; Chenaghlu, M.; Gao, J. Deep learning–based text classification: A comprehensive review. ACM Comput. Surv. 2021, 54, 1–40. [Google Scholar] [CrossRef]
- Zhang, D.; Wang, D.; Zhang, J. A survey of deep learning applications in natural language processing. AI Open 2021, 2, 604–624. [Google Scholar]


Disclaimer/Publisher’s Note: The statements, opinions and data contained in all publications are solely those of the individual author(s) and contributor(s) and not of MDPI and/or the editor(s). MDPI and/or the editor(s) disclaim responsibility for any injury to people or property resulting from any ideas, methods, instructions or products referred to in the content. |
© 2025 by the authors. Licensee MDPI, Basel, Switzerland. This article is an open access article distributed under the terms and conditions of the Creative Commons Attribution (CC BY) license (https://creativecommons.org/licenses/by/4.0/).