Article

Symmetry-Guided Numerical Simulation of Viscoelastic Pipe Leakage Based on Transient Inverse Problem Analysis

School of Energy and Architecture Engineering, Harbin University of Commerce, No. 1, Xuehai Street, Harbin 150028, China
*
Author to whom correspondence should be addressed.
Symmetry 2025, 17(11), 1805; https://doi.org/10.3390/sym17111805 (registering DOI)
Submission received: 26 September 2025 / Revised: 24 October 2025 / Accepted: 24 October 2025 / Published: 26 October 2025
(This article belongs to the Section Engineering and Materials)

Abstract

In this study, numerical simulations were performed, and leaks in viscoelastic pipelines were detected. Based on the transient flow equations derived from the continuity and momentum equations, the Kelvin–Voigt model was used to describe the viscoelastic constitutive relationship and derive the strain equation, further establishing a one-dimensional transient flow model for viscoelastic pipelines. A frequency-domain analysis of the transient flow was performed by deriving the Fourier transform and transfer matrix. An inverse problem analysis method for transient flow leak detection was proposed to identify the leak location and rate by minimizing the objective function. To verify the effectiveness of the proposed model, an experimental platform was built, and the pressure head frequency-domain data under working conditions of no leak, experimental leak, and simulated leak were compared. The results showed that the experimental data were consistent with the simulated data under leakage conditions, thus proving that the model was accurate and reliable. Under leak-free conditions, the frequency-domain characteristics of transient pressure waves exhibit significant symmetrical features, whereas when a leak exists in the pipeline, the leak point acts as a localized non-uniform disturbance source, disrupting the symmetry of the frequency-domain characteristics. Moreover, the leak point can be determined by the difference in the peak heights between the no-leak and leak conditions, and the leak parameters can be accurately identified using the inverse problem method.

1. Introduction

Pipeline water conveyance systems are core infrastructure for urban water supply, petrochemicals, and industrial production, with leakage as a prevalent issue. Leakage wastes precious water and incurs substantial economic losses for water supply enterprises, so reducing and controlling leakage in water supply networks is highly significant. Compared to traditional metal pipelines, viscoelastic ones (e.g., HDPE and PVC) are widely used for their corrosion resistance and easy installation. However, their creep characteristics significantly alter transient flow propagation, posing new challenges for leakage detection.
The constitutive properties of viscoelastic pipelines make it difficult to simulate and calculate transient flow. To address this issue, researchers have optimized simulation models to a certain extent, focusing on numerical calculation models. Tjuatja et al. [1] conducted a comprehensive review of the literature related to transient flow modeling in viscoelastic pipelines, covering aspects such as mathematical modeling, experimental setup, numerical solution methods, parameter calibration, defect detection, and wave control. Rezapour et al. [2] adopted a Gaussian function-based inverse transient analysis (ITA) method to simulate the quasi-normal distribution of leakage, thereby reducing the computational load. Combined with experimental data, they performed a sensitivity analysis to study the sensitivity of the leakage location and size in viscoelastic pipelines to factors such as dynamic parameters, flow regime, and the sample size. The results showed that a hydraulic transient model that considers only the viscoelastic effect can accurately identify the leakage characteristics. The optimal sample size for determining the leakage location was half the pressure signal period, and that for determining the leakage size was one complete period. The effect was optimal when the ratio of the spatial step size to the pipeline length ranged from 0.019 to 0.032, and this method could detect multiple leaks. Khudayarov and Turaev [3] and their collaborators developed a mathematical model for the nonlinear vibration of viscoelastic fluid-conveying pipelines. They used the Boltzmann-Volterra integral model to describe the pipeline strain process, simplified the model into a system of ordinary integral-differential equations by combining the Bubnov–Galerkin method, and solved it using numerical methods. They studied the effects of genetic kernel singularity and pipeline geometric parameters on vibration and concluded that considering the viscoelastic properties of pipeline materials reduces the vibration amplitude and frequency, and that an Abel-type weakly singular genetic kernel must be used to reveal the influence of viscoelasticity on pipeline vibration.
Other scholars have focused on leakage detection methods based on numerical modeling. Early researchers typically used the time-domain method to solve traditional water hammer models and then used optimization methods to solve the objective function for leak localization. Chahardah-Cherik Parvin et al. [4] performed experimental and numerical studies on polyethylene pipeline networks using the method of characteristics in the time domain and proposed that the viscoelasticity of the pipeline wall leads to pressure signal attenuation, increased head loss, and phase shift under partial blockage. Furthermore, they determined the location and characteristics of blockages of different sizes using ITA in the time domain. Lazhar et al. [5] solved a mathematical model using the method of characteristics in the time domain and conducted research on the detection and localization of double leaks. The results showed that this method can determine the location and size of leaks by analyzing the reflection characteristics of pressure waves, and that factors such as the viscoelasticity of the pipeline wall, leak location, leak size, and friction influence the behavior of pressure signals.
The time-domain method requires measuring the variation processes of the flow rate and water pressure at the inlet and outlet of the pipeline over time, and the measurement deviation of the pressure sensors is much lower than that of the flow sensors. Therefore, one development direction of leakage detection methods is to reduce the reliance on the transient flow rate and realize leak localization through the identification of pressure signals. Therefore, frequency-domain methods for leakage detection have become a key focus of international research. Lee et al. [6,7] proposed pipeline leakage detection methods based on frequency-domain analysis. They used pseudo-random binary signals to generate a frequency response diagram of a pipeline system and studied the influence of pipeline leakage on the frequency response. The results showed that the shape of the frequency response diagram can be used to identify the leak location, the measurement position affects the shape of the frequency response diagram, and both methods can accurately detect and localize single leaks in pipelines. Duan et al. [8] studied leakage detection in viscoelastic pipelines by extending the frequency response function method (FRFM) and combining it with numerical experiments on a one-dimensional viscoelastic transient model. They observed that the viscoelasticity of the pipeline wall significantly affected the attenuation of the pressure wave amplitude and phase shift but had little influence on the pressure head peak frequency pattern induced by leakage. Pan et al. [9] developed a multistage frequency-domain transient method, derived an analytical expression of the transient frequency response of viscoelastic pipeline systems, and proposed a multistage analysis framework to enhance the robustness and effectiveness of the method. Combined with extensive experimental tests and numerical simulations, they identified the viscoelastic parameters (such as creep compliance and delay time) of plastic pipelines. The results indicate that this method can efficiently and accurately identify the viscoelastic parameters. Its accuracy is greatly affected by the pipeline scale and material properties; however, it is insensitive to the initial flow conditions and is superior to traditional time-domain methods. Pan et al. [10] further derived an analytical expression for the transient wave analysis method based on the frequency response function. Combined with experimental laboratory verification and extensive numerical applications, they identified viscoelastic parameters and detected leakage in water-filled plastic pipelines. The results confirmed that this method is feasible and accurate and can effectively achieve the target through a two-step process. Its accuracy in leak localization is higher than that in leak size determination, and the delay time span of the input signal within the characteristic wave time scale is more suitable for this method.
In traditional research, the transient flow simulation of water supply pipe networks is realized by approximating and discretizing each pipeline and boundary in the system in the time domain [11,12,13]. In contrast to the time domain, transient flow analysis of pressurized pipeline flow can be conducted in the frequency domain. Most of these studies focused on identifying leakages or blockages in pressurized pipelines. Owing to the inherent characteristics of frequency-domain analysis, compared to traditional time-domain analysis methods, research on transient flow in the frequency domain has several advantages: higher computational efficiency, avoidance of computational difficulties and errors caused by time-domain discretization [14], easier establishment of connections between transient signals in the pipe network, and characteristics of the water supply pipe network system [15,16]. At present, most studies on the flow state in viscoelastic pipelines focus on elastic pipelines, ignoring the influence of pipe wall deformation or viscoelasticity, and there are relatively few studies on transient gas–liquid two-phase flow in viscoelastic pipelines. Although significant progress has been made in the field of transient flow modeling for viscoelastic pipelines over the past two decades, a reliable transient wave model for viscoelastic pipelines still needs to be verified. Therefore, this study establishes a one-dimensional transient flow model for viscoelastic pipelines, The creep and delay characteristics of the pipeline are accurately described by the Kelvin–Voigt model, avoiding the deviation caused by the traditional elastic assumption. The frequency-domain equations are derived based on the Fourier transform and transfer matrix, retaining the advantages of frequency-domain analysis—“high computational efficiency and avoidance of time-domain discretization errors”. and simultaneously proposes an inverse problem analysis method for transient flow leakage detection that identifies the leak location and leak rate with minimization of the objective function as the core. thereby achieving accurate identification of the leak location and leak rate in viscoelastic pipelines and providing theoretical support and a feasible scheme for engineering applications.

2. Numerical Simulation

2.1. Viscoelastic Constitutive Equation

2.1.1. Kelvin–Voigt Model

To gain a more thorough understanding of the relaxation properties of viscoelastic pipelines, it is preferable to represent linear viscoelastic processes through a model system. For polymers, it is highly inaccurate to describe their mechanical responses using only springs or dashpots. Therefore, a more reliable mechanical model can only be obtained by making a series of combinations of springs and dashpots, such as the Maxwell model, Voigt model, Maxwell-Weichert model, Kelvin–Voigt model, and so on. However, there are relatively few models that describe the viscoelasticity of polymer pipelines. For the generalized Kelvin–Voigt model, when parameters are correctly selected, its creep function can show good agreement with experimentally obtained creep curves [17]. A schematic diagram of the generalized Kelvin–Voigt model is shown in Figure 1. This model is formed by connecting one spring element and n Voigt models in series, with the “elastic spring and viscous damper connected in parallel” as its core structure. It can simultaneously capture the instantaneous elastic response and delayed viscous response of the material: the viscous damper characterizes the time-dependent delayed characteristics of material deformation, thereby accurately quantifying the energy dissipation behavior of viscoelastic materials during the transient flow process.
For linear viscoelastic materials, the material properties are only functions of time, not of stress or strain. The creep compliance (J) represents the strain response to a unit step stress and varies with time. By applying the Laplace transform [18] to the generalized Kelvin–Voigt mechanical model, the creep compliance (J) can be divided into a time-independent elastic component J0 and a time-dependent creep function J(t). The specific expression of the creep function for the generalized Kelvin–Voigt mechanical model is as follows:
J ( t ) = J 0 + k = 1 N k v J k ( 1 e t / τ k )
where J0 is the instantaneous compliance, J 0 =   1   / E 0 ( P a 1 ) , τk is the relaxation time of the k-th dashpot (s), and Jk is the creep compliance of the k-th element J k =   1   / E k ( P a 1 ) . In this equation, E k is the elastic modulus of the k-th spring E k .

2.1.2. Strain Equation

Compared with elastic pipelines, viscoelastic pipelines exhibit the properties of elastic materials and viscous characteristics unique to viscoelastic materials when transient flow occurs. Therefore, Hooke’s law, which is used to analyze elastic materials, cannot be applied here. In this case, the strain ε(t) of the viscoelastic pipeline consists of two components: instantaneous strain εe and delayed strain εr(t), as shown in Equation (2):
ε ( t ) = ε e + ε r ( t )
The calculation formula for the instantaneous strain in the equation is as follows:
ε e = α σ e E 0 = α D 2 E 0 e γ H
where γ is equal to ρg, the specific weight (kg/m2·s2); α is a parameter related to whether the pipeline can be displaced and the degree of displacement; e is the pipeline wall thickness (m).
By combining Equations (1) and (3), the formula for the total strain can be obtained as follows
ε ( t ) = ρ g α D 2 e H ( t ) H 0 J 0 + 0 t γ α ( t t ) D ( t t ) 2 e ( t t ) H ( t t ) H 0 J ( t ) t d t
where D(t) is the inner diameter of the pipeline at time t (m), and e(t) is the wall thickness of the pipeline at time t (m).
The formula for the delayed strain εr(t) is as follows:
ε r ( x , t ) = k = 1 N ε r k ( x , t ) = k = 1 N γ α D 2 e 0 t H ( x , t t ) H 0 ( x ) J k τ k e t τ k d t
For any time t, the current delayed strain εr(t) is the weighted accumulation of the stress change rate d σ ( τ ) d τ at all past times τ (where 0 ≤ τ t). The weight coefficient e ( t τ ) / τ k exhibits exponential decay with the time difference t τ , and this weight distribution presents “symmetric decay” [19] along the time axis, ensuring that the influence of stress on the current strain is neither omitted nor redundant.
When the stress σ ( t ) varies periodically with time, the delayed strain εr(t) also varies symmetrically with time in the same period, and the phase lag remains stable at all times. This reflects the “phase symmetry between periodic stress and periodic strain” and avoids strain distortion that may be caused by an asymmetric constitutive model.
ε r ( t ) t = k = 1 N ε r k ( t ) t
Define F ( x , t ) = α D 2 e γ H ( x , t ) H 0 ( x ) , and further differentiate Equation (6):
ε r ( t ) t = d d t 0 t F ( x , t t ) J k τ k e t / τ k d t
= d d t ( J k τ k 0 t F ( x , y ) e ( y t ) / τ k d y )
= d d t ( J k τ k e t / τ k 0 t F ( x , y ) e y / τ k d y )
= J k τ k 2 e t / τ k 0 t F ( x , y ) e y / τ k d y + J k τ k e t / τ k d d t 0 t F ( x , y ) e y / τ k d y
= J k τ k 2 e t / τ k 0 t F ( x , y ) e y / τ k d y + J k τ k e t / τ k F ( x , y ) e y / τ k
= J k τ k 0 t F ( x , y ) e ( y t ) / τ k τ k d y + J k τ k F ( x , t )
= J k τ k 0 t F ( x , t t ) e t / τ k τ k d t + J k τ k F ( x , t )
= 1 τ k 0 t F ( x , t t ) J k τ k e t / τ k d t + J k τ k F ( x , t )
Among them, the delayed stress can be calculated separately:
ε r ( t ) = 0 Δ t F ( x , t t ) J k τ k e t / τ k d t ¯ ( 1 ) + Δ t t F ( x , t t ) J k τ k e t / τ k d t ¯ ( 2 )
Calculation (1)
ε r ( 1 ) ( t ) = 0 Δ t F ( x , t t ) J k τ k e t / τ k d t
ε r ( 1 ) ( t ) = 0 Δ t F ( x , t ) J k τ k e ( t t ) / τ k d t
ε r ( 1 ) ( t ) = F ( x , t ) J k e ( t t ) / τ k | 0 t Δ t + 0 t Δ t F ( x , t ) t J k e ( t t ) / τ k d t
ε r ( 1 ) ( t ) = J k ( F ( x , t ) F ( x , t Δ t ) e Δ t / τ k ) + J k τ k F ( x , t ) t e ( t t ) / τ k | t t Δ t
0 t Δ t 2 F ( x , t ) t 2 τ k e ( t t ) / τ k d t H i g h e r - o r d e r i n f i n i t e s i m a l s 0
Calculation (2)
ε r ( 2 ) ( t ) = Δ t t F ( x , t t ) J k τ k e t / τ k d t
ε r ( 2 ) ( t ) = 0 t Δ t F ( x , t Δ t z ) J k τ k e z Δ t / τ k d z
The results of calculating part (1) are as follows:
ε r ( 1 ) ( t ) = J k ( F ( x , t ) F ( x , t Δ t ) e Δ t / τ k ) J k τ k F ( x , t ) F ( x , t Δ t ) Δ t ( 1 e ( Δ t ) / τ k )
The result of calculating part (2) is as follows:
ε r ( 2 ) ( t ) = ε r k ( x , t Δ t ) e Δ t / τ k
By combining Equations (7) and (9), the following equation is obtained:
ε r k ( x , t ) = J k F ( x , t ) J k e Δ t / τ k F ( x , t Δ t )
J k τ k ( 1 e Δ t / τ k ) F ( x , t ) F ( x , t Δ t ) Δ t + e Δ t / τ k ε r k ( x , t Δ t )
Substituting Equation (16) into the above equation yields:
ε r k ( x , t ) t = F ( x , t ) J k Δ t ( 1 e Δ t / τ k )
F ( x , t Δ t ) ( J k Δ t ( 1 e Δ t / τ k ) J k τ k e Δ t / τ k ) + e Δ t / τ k ε r k ( x , t Δ t )
To simplify Equation (11), the constants in the equation are defined as A, B, and C using the following equations:
A = α D 2 e γ J k Δ t ( 1 e Δ t / τ k ) , B = α D 2 e γ J k Δ t e Δ t / τ k , C = e Δ t / τ k T k
Substituting constants A, B, and C into Equation (11) yields the following simplified formula:
ε r k ( x , t ) t = A H ( x , t ) B H 0 ( A B ) H ( x , t Δ t ) C ε r k ( x , t Δ t )
Define V E = B H 0 + ( A B ) H ( x , t Δ t ) + C ε r k ( x , t Δ t ) , then the strain formula can be obtained as:
ε r k ( x , t ) t = A H ( x , t ) V E

2.2. One-Dimensional Transient Flow Model for Viscoelastic Pipelines

2.2.1. Basic Equations

The basic equations for one-dimensional transient flow in viscoelastic pipelines are similar to those in elastic pipelines and mainly consist of continuity and momentum equations.
Continuity Equation:
H t + a 2 g A r Q x + 2 a 2 g ε r t = 0
Momentum Equation:
Q t + g A r H x + π D τ w ρ = 0
where Ar is the cross-sectional area of the pipeline (m2).
In this equation, the wall shear stress τ w is similar to that in the first part of this chapter, which consists of two components: steady-state shear stress τ q and unsteady-state shear stress τ u .
τ w = τ q + τ u
The steady-state shear stress was calculated as follows:
τ q = λ 8 ρ u 2
The weight function calculation method from the literature [20] was adopted to calculate the unsteady-state shear stress.
τ u = 2 μ R 0 t w ( t u ) u t ( u ) d u
where R is the inner diameter of the pipeline (m), w(t) is the weight function, u is the axial flow velocity of the fluid (m/s), λ is the friction coefficient, and μ is the dynamic viscosity (Pa·s).

2.2.2. One-Dimensional Unsteady Friction Model

When calculating the transient flow using the unsteady friction model, the friction term includes an additional unsteady friction component compared with the quasi-steady friction model. In other words, the wall shear stress is composed of both steady- and unsteady-state shear stresses. However, with the introduction of the unsteady-state shear stress, the weight function calculation method can no longer be used in normal computations because this would lead to an increased calculation time. Therefore, this study adopted the exponential summation calculation method proposed by Zielke [21].
Δ t ^ = Δ t ν ( D / 2 ) 2
w ( t ^ ) = i = 1 j m i e n i t ^
where v is the kinematic viscosity (m2/s), and mi and ni are the constant coefficients related to the dimensionless time.
Here, numerous terms for the constant coefficients mi and ni are listed. However, Urbanowicz [22] verified that only two to three terms of constant coefficients are required when simulating the water hammer part, which significantly improves computational efficiency.
Under laminar flow conditions, the analytical form proposed by Zielke was adopted for mi and ni, and the specific coefficients could be found in the preset values provided in Reference [23].
Under turbulent flow conditions, the previously mentioned weight function must be revised appropriately.
w ( t ^ ) = i = 1 j A A * m i * e ( n i * + B B * ) t ^
where A A and B B are the revision coefficients that vary with the pipeline smoothness.
For smooth pipe walls:
A A = 1 / ( 4 π ) , B B = Re log ( 15.29 / Re 0.0567 ) / 12.86
For rough pipe walls:
A A = 0.0103 Re ( k s / D ) 0.39 , B B = 0.352 Re ( k s / D ) 0.41
Subsequently, with reference to the discretization of Equation (21) in Kamil Urbanowicz’s research, the following result was obtained:
τ u t + Δ t 2 μ ( D / 2 ) i = 1 j y i t A i + η B i ( u t + Δ t u t ) + ( 1 η ) C i ( u t u t Δ t ) y i ( t + Δ t )
Among them, the dynamic viscosity μ = νρ; meanwhile, A i = e n i Δ t ^ , B i = m i n i Δ t ^ ( 1 A i ) , C i = A i B i are defined. The η in this equation, the equation is the correction coefficient.
η = ( D / 2 ) 2 ν A π B e r f ( Δ t ^ B ) ( D / 2 ) 2 ν i = 1 k m i n i ( 1 e n i Δ t ^ )
By combining Equations (17), (18), (21), and (25), we obtain
( 1 + 2 a 2 Δ t g k = 1 N A ) H i n + 1 + ( B + 4 a Δ t ρ g D 2 μ ( D / 2 ) i = 1 j η B i ) Q i n + 1 = C P
( 1 + 2 a 2 Δ t g k = 1 N A ) H i n + 1 ( B + 4 a Δ t ρ g D 2 μ ( D / 2 ) i = 1 j η B i ) Q i n + 1 = C m
where
C P = H i 1 n + B Q i 1 n + 2 a 2 Δ t g k = 1 N V E 4 a Δ t ρ g D τ q 4 a Δ t ρ g D 2 μ ( D / 2 )
i = 1 j [ y i t Δ t A i η B i Q i n / A + ( 1 η ) C i [ ( Q i n Q i n 1 ) / A ]
C m = H i + 1 n B Q i + 1 n + 2 a 2 Δ t g k = 1 N V E + 4 a Δ t ρ g D τ q + 4 a Δ t ρ g D 2 μ ( D / 2 )
i = 1 j [ y i t Δ t A i η B i Q i n / A + ( 1 η ) C i [ ( Q i n Q i n 1 ) / A ]
By applying Equations (28) and (29), the pressure head and flow rate at a fixed position node under transient flow in the unsteady friction model can be obtained using the following equations:
H i n + 1 = C p + C m 2 ( 1 + 2 a 2 Δ t g k = 1 N A )
Q i n + 1 = C p C m 2 ( B + 4 a Δ t ρ g D 2 μ ( D / 2 ) i = 1 j η B i )

2.2.3. Boundary Conditions

(1) Water Tank
When the upstream of the pipeline is a large-capacity reservoir, the variation process of the reservoir water level is much slower than the hydraulic transient process of the pipeline system and can thus be neglected. Therefore, the reservoir water level can be considered constant in the analysis of the hydraulic transient process. If the local head loss and velocity head at the pipeline inlet are ignored, the following equation is obtained:
H p = H r = C o n s t
where Hp is the piezometric head at the pipeline inlet, and Hr is the upstream reservoir water level.
Substituting Equation (33) into the characteristic compatibility equation yields the flow rate at the pipeline inlets.
Q p 1 = H r C M B M
where Qp1 is the flow rate at the pipeline inlet at time t.
(2) Valve
Under steady flow conditions, the orifice equation for flow through a valve can be expressed as
Q 0 = ( C d A G ) 0 2 g H 0
where Q0 is the flow rate under steady-state conditions, H0 is the head loss of the valve under steady-state conditions, and (CdAG)0 is the product of the valve opening area and discharge coefficient.
For other opening degrees, it can be expressed as follows:
Q p = ( C d A G ) 0 2 g Δ H
where Δ H instantaneous drop of the hydraulic grade line when flowing through the valve.

3. Frequency-Domain Analysis of Transient Flow in Viscoelastic Pipelines

3.1. Fourier Transform

To conduct a frequency-domain analysis of the entire water supply pipe network, it is first necessary to establish a linear relationship between the frequency-domain perturbations of the flow rate and the head upstream and downstream of the viscoelastic pipeline (pipeline transfer matrix equation). A Fourier transform is applied to the continuity and momentum equations, converting the partial derivative with respect to time t into j ω to obtain a frequency-domain equation set.
Frequency-Domain Continuity Equation:
j ω H ( ω , x ) + a 2 ( ω ) g A r ( ω ) Q ( ω , x ) x + f ϵ ( ω ) = 0
Frequency-Domain Momentum Equation:
j ω Q ( ω , x ) + g A r ( ω ) H ( ω , x ) x + 4 A r ( ω ) ρ D τ w ( ω ) = 0

3.2. Derivation of the Transfer Matrix

The frequency-domain equation set was rearranged into a first-order linear partial differential equation as follows:
d H d x d Q d x = 0 C 1 ( ω ) C 2 ( ω ) 0 H Q
C 1 ( ω ) is derived from the rearrangement of the frequency-domain momentum equation; it reflects the influence of the flow rate Q on the pressure head gradient H / x , and its expression is as follows:
C 1 ( ω ) = j ω g A r ( ω ) + 4 g ρ D τ w * ( ω )
C 2 ( ω ) is derived from the rearrangement of the frequency-domain continuity equation; it reflects the influence of the flow rate Q / x on the pressure head gradient H, and its expression is as follows:
C 2 ( ω ) = g A r ( ω ) a 2 ( ω ) ( j ω + E e γ α k = 1 n J k / τ k 1 + j ω τ k · p ( ω ) H ( ω ) )
where C 1 ( ω ) and C 2 ( ω ) are coefficients containing ω , viscoelastic parameters, and friction coefficients.
By solving this system of equations, the relationship between the state vectors [H, Q]T at both ends of the pipeline (x = 0 and x = L) is obtained as follows:
H ( L , ω ) Q ( L , ω ) = T ( ω ) H ( 0 , ω ) Q ( 0 , ω )
T ( ω ) = cosh ( Γ L ) Z c sinh ( Γ L ) sinh ( Γ L ) Z c cosh ( Γ L )
where Γ = C 1 C 2 —propagation constant, and Zc = C 1 / C 2 is the characteristic impedance.
Finally, the frequency-domain equivalent equation described by the transfer matrix T ( ω ) is:
H ( L , ω ) = T 11 ( ω ) H ( 0 , ω ) + T 12 ( ω ) Q ( 0 , ω )
Q ( L , ω ) = T 21 ( ω ) H ( 0 , ω ) + T 22 ( ω ) Q ( 0 , ω )

4. Inverse Problem Analysis Method for Transient Flow Leak Detection

The transient inverse problem analysis model refers to exciting a low-intensity transient flow in a pipeline system, using selected pressure measurement points in the system to obtain real-time pressure response values at these points during the hydraulic transient process through real-time monitoring, which are then compared with the model calculation results under leak conditions to further achieve the goal of identifying pipeline parameters. The presence of a leak in the pipeline significantly changes the attenuation process of the transient pressure wave amplitude. Leaks can be identified by adjusting the leak parameters in the model to minimize the difference between the measured and calculated pressures. The essence of this problem is to solve the system identification inverse problem and perform parameter identification. Therefore, a point is considered a leak point if, under given initial leak rate conditions and leak location, the theoretically calculated value of the same physical quantity (pressure or flow rate) at the same location is completely consistent with or closest to the measured value. Thus, the mathematical expression of the inverse problem analysis model for leak detection can be expressed as follows:
E ( a j ) = i = 1 M t = 0 N { θ 1 [ H i m _ _ ( t ) H i ( t , X j ) ] 2 + θ 2 [ Q i m _ _ ( t ) Q i ( t , X j ) ] 2 }
where E represents the objective function; M is the number of sensor measurement points; N denotes the total sampling time; Xj (j = 1, 2, ···N) is the unknown leak parameters, including the leak location l and leak rate Ql0; θ 1 and θ 2 are weight coefficients; H i m _ _ and Q i m _ _ are the measured values, while H i m and Q i m are the results after filtering and denoising, respectively. When one boundary condition is known at both the inlet and outlet of the pipeline, optimal decision variables l and Ql0 must exist that minimize the objective function E, and l and Ql0 correspond to the theoretical leak location and leak rate, respectively.
In the research on time-domain optimization methods for leak identification in hydraulic transient inverse problems, algorithms such as the gradient-based Levenberg–Marquardt (LM) algorithm proposed by Nash et al. [24], and the genetic algorithm (GA) proposed by Vitkovsky et al. [25] have been reported. The LM algorithm is a standard optimization solution method; however, its convergence depends on initial values, making it prone to falling into local optimality, and it requires excessive computational effort in transient analysis. The trial-calculation method has a simple concept but is time-consuming and highly blind. Considering the global optimization capability of the genetic algorithm (GA), this study attempted to apply it to the solution of the transient frequency-domain inverse problem analysis model (Equation (46)), so as to make up for the local minimum problem that may occur in the solution process of local optimization algorithms.
To ensure the algorithm stably converges to the global optimal solution, the initial population size is set to 50, covering the entire value range of leak parameters to avoid convergence deviation caused by uneven distribution of the initial population. The optimal fitness, average fitness, and parameter optimization trajectory of each generation of the population are recorded in real time; if the average fitness remains unchanged for 3 consecutive generations, 50% of new chromosomes are regenerated to avoid falling into local convergence. The objective function is taken as Equation (26), and the amplitude-frequency characteristics are selected for comparison. The leak parameters are encoded and decoded using 10-bit binary, respectively. The objective function itself is directly used as the fitness; based on this fitness, genetic operations such as selection, crossover, and mutation are performed on the chromosome population. Chromosomes with high fitness are eliminated to obtain a new population, and iterations are repeated until the optimal value is found.

5. Model Validation

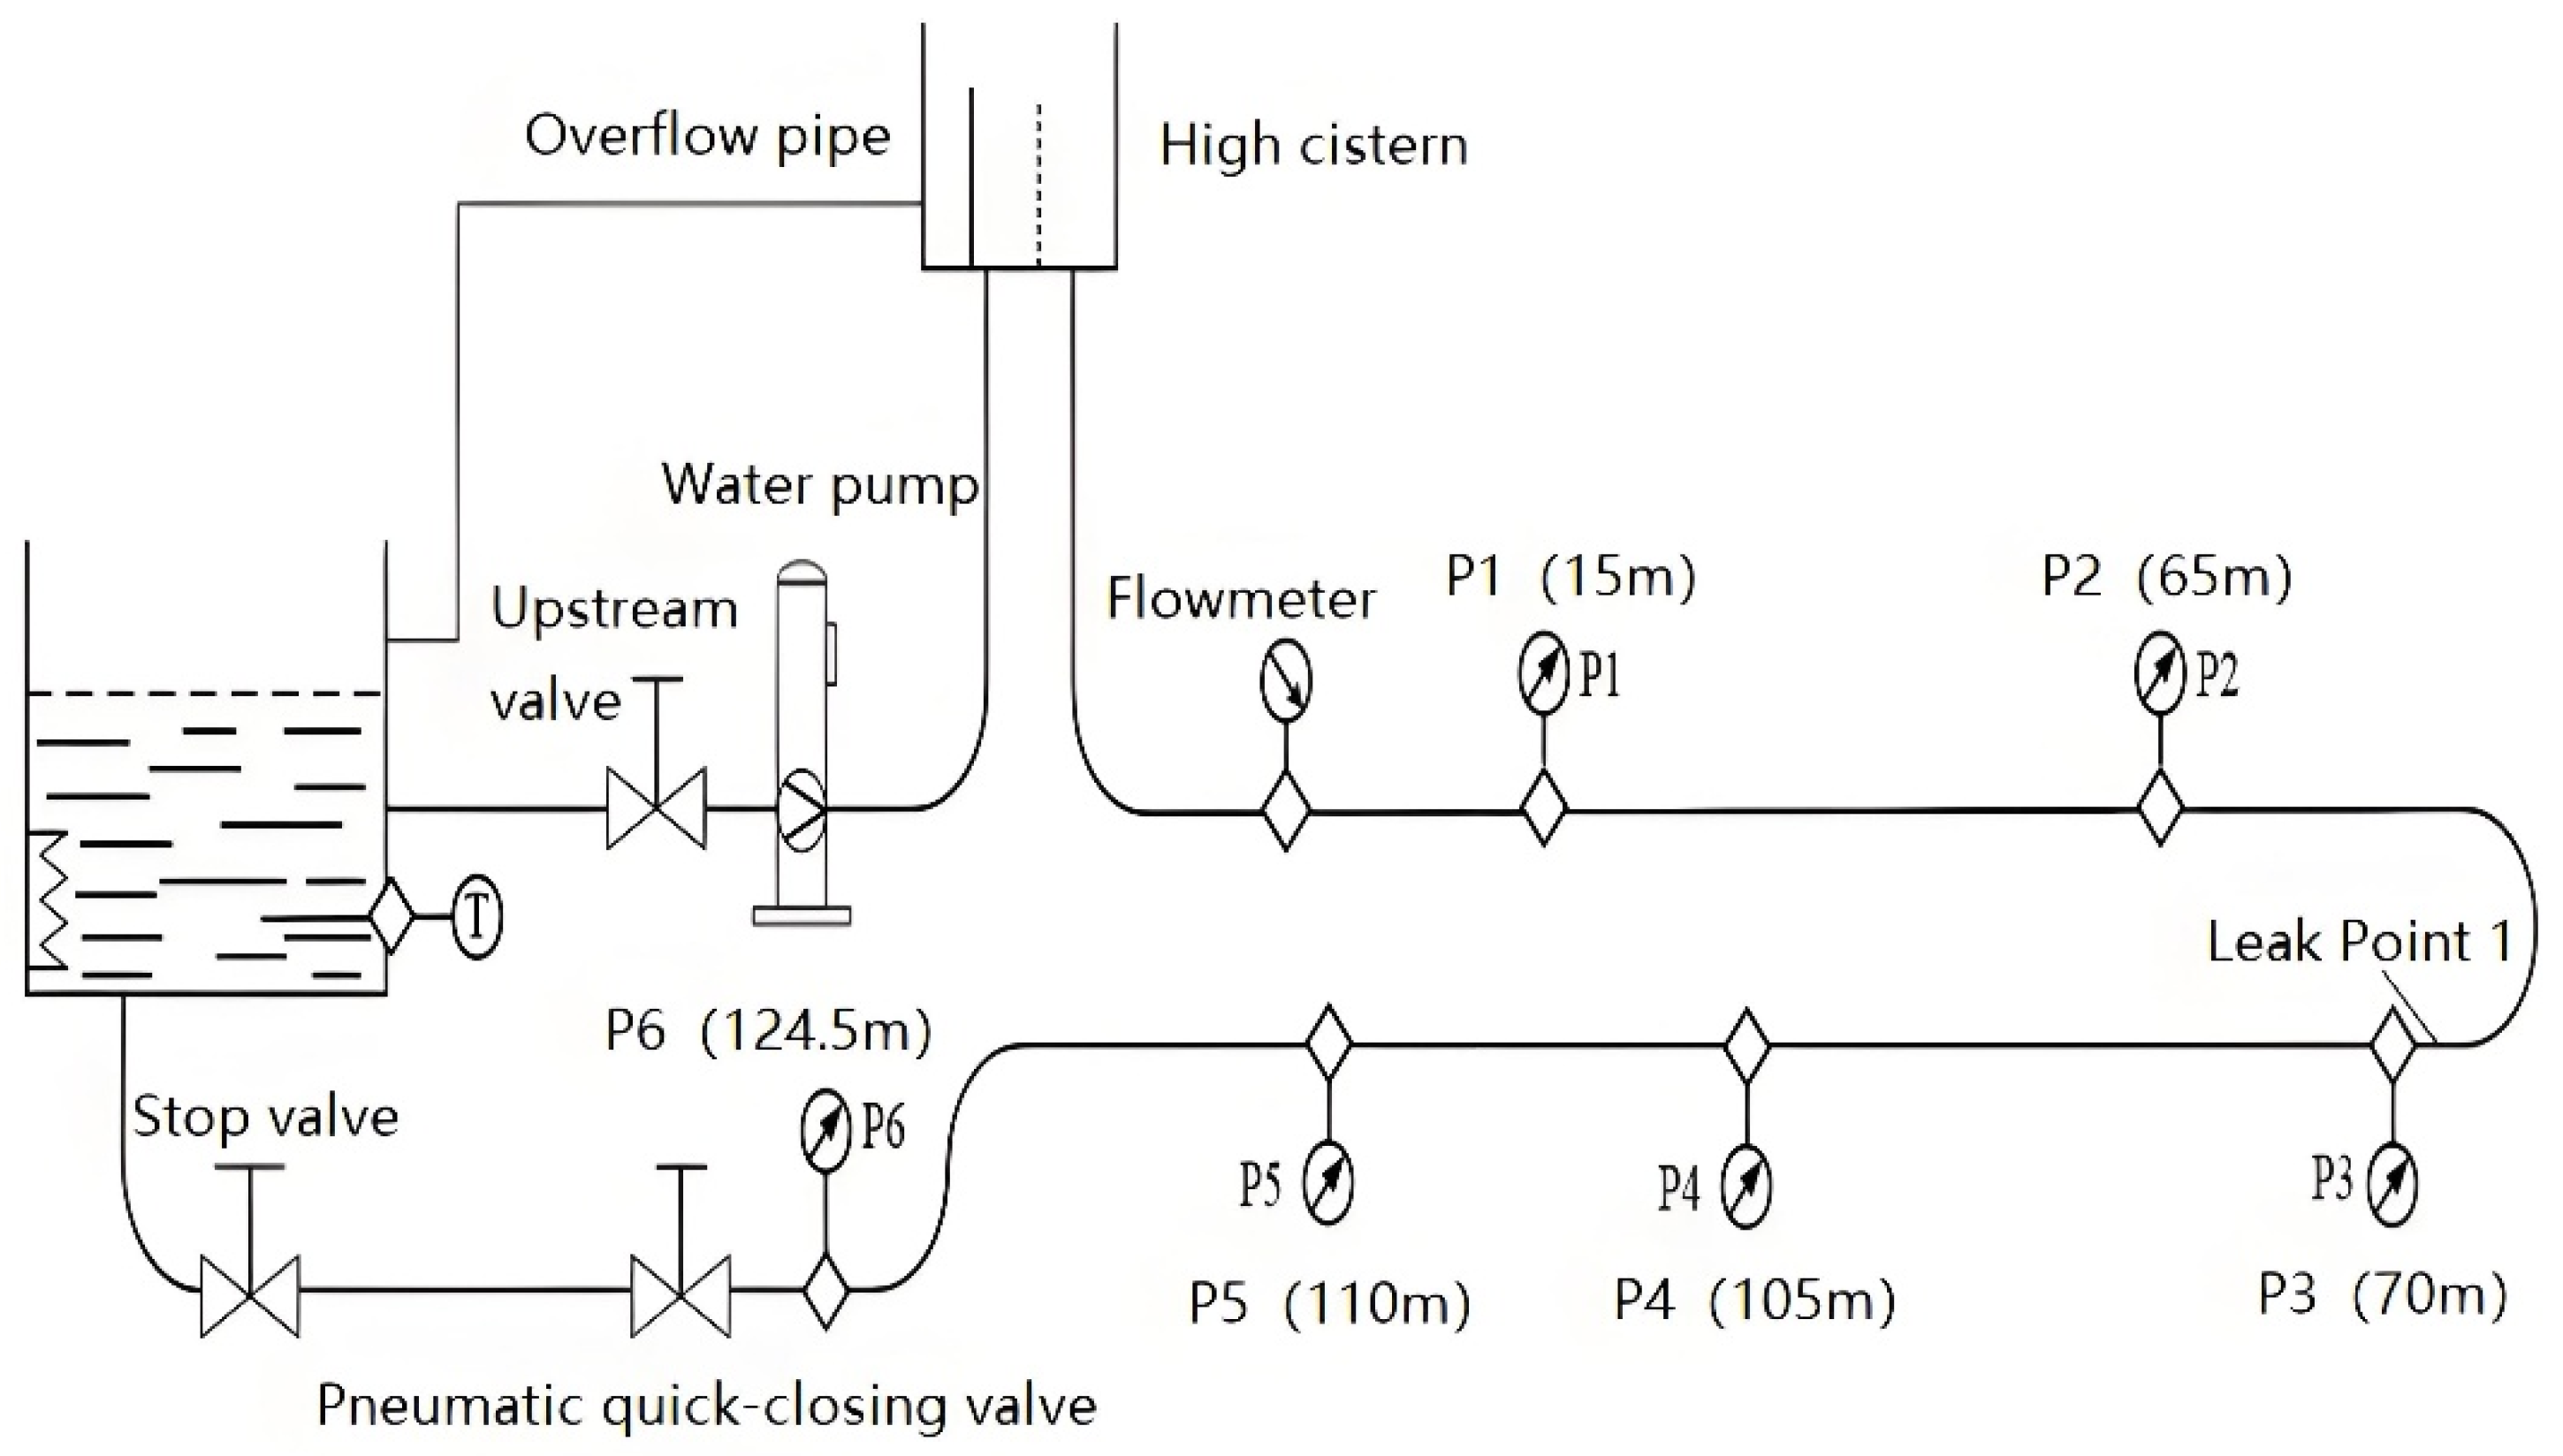
The experimental bench built in this study mainly consisted of the following components: an HDPE pipeline, an elevated water tank located upstream of the pipeline, and a quick-closing valve installed at the end of the pipeline. Among these components, the HDPE pipeline had a length of 125.2 m, inner diameter of 32 mm, wall thickness of 4 mm, and Poisson’s ratio of 0.38. The height of the elevated water tank was 3.2 m. Under steady-state conditions, the flow rate measured using the electromagnetic flowmeter was 1 m3/h. A leak (Leak 1) occurred at the 69.5 m position of the pipeline with a leakage rate of 20%. The fluid used in the pipeline was liquid water. A flow diagram of the experimental bench is shown in Figure 2.
As shown in the diagram, six pressure sensors were installed on the experimental bench, numbered 1–6. The positions of the pressure measurement points are listed in Table 1:
For pressure data collection in this study, H1-8 piezoelectric pressure sensors were used. These sensors were all horizontally installed at the designated measurement positions on the pipeline, with a sampling frequency set to 1000 Hz. The two-point calibration method was adopted for the calibration procedure.
These pressure sensors can monitor real-time pressure changes at different positions inside a pipeline. Partial photographs of the experimental bench are shown in Figure 3.
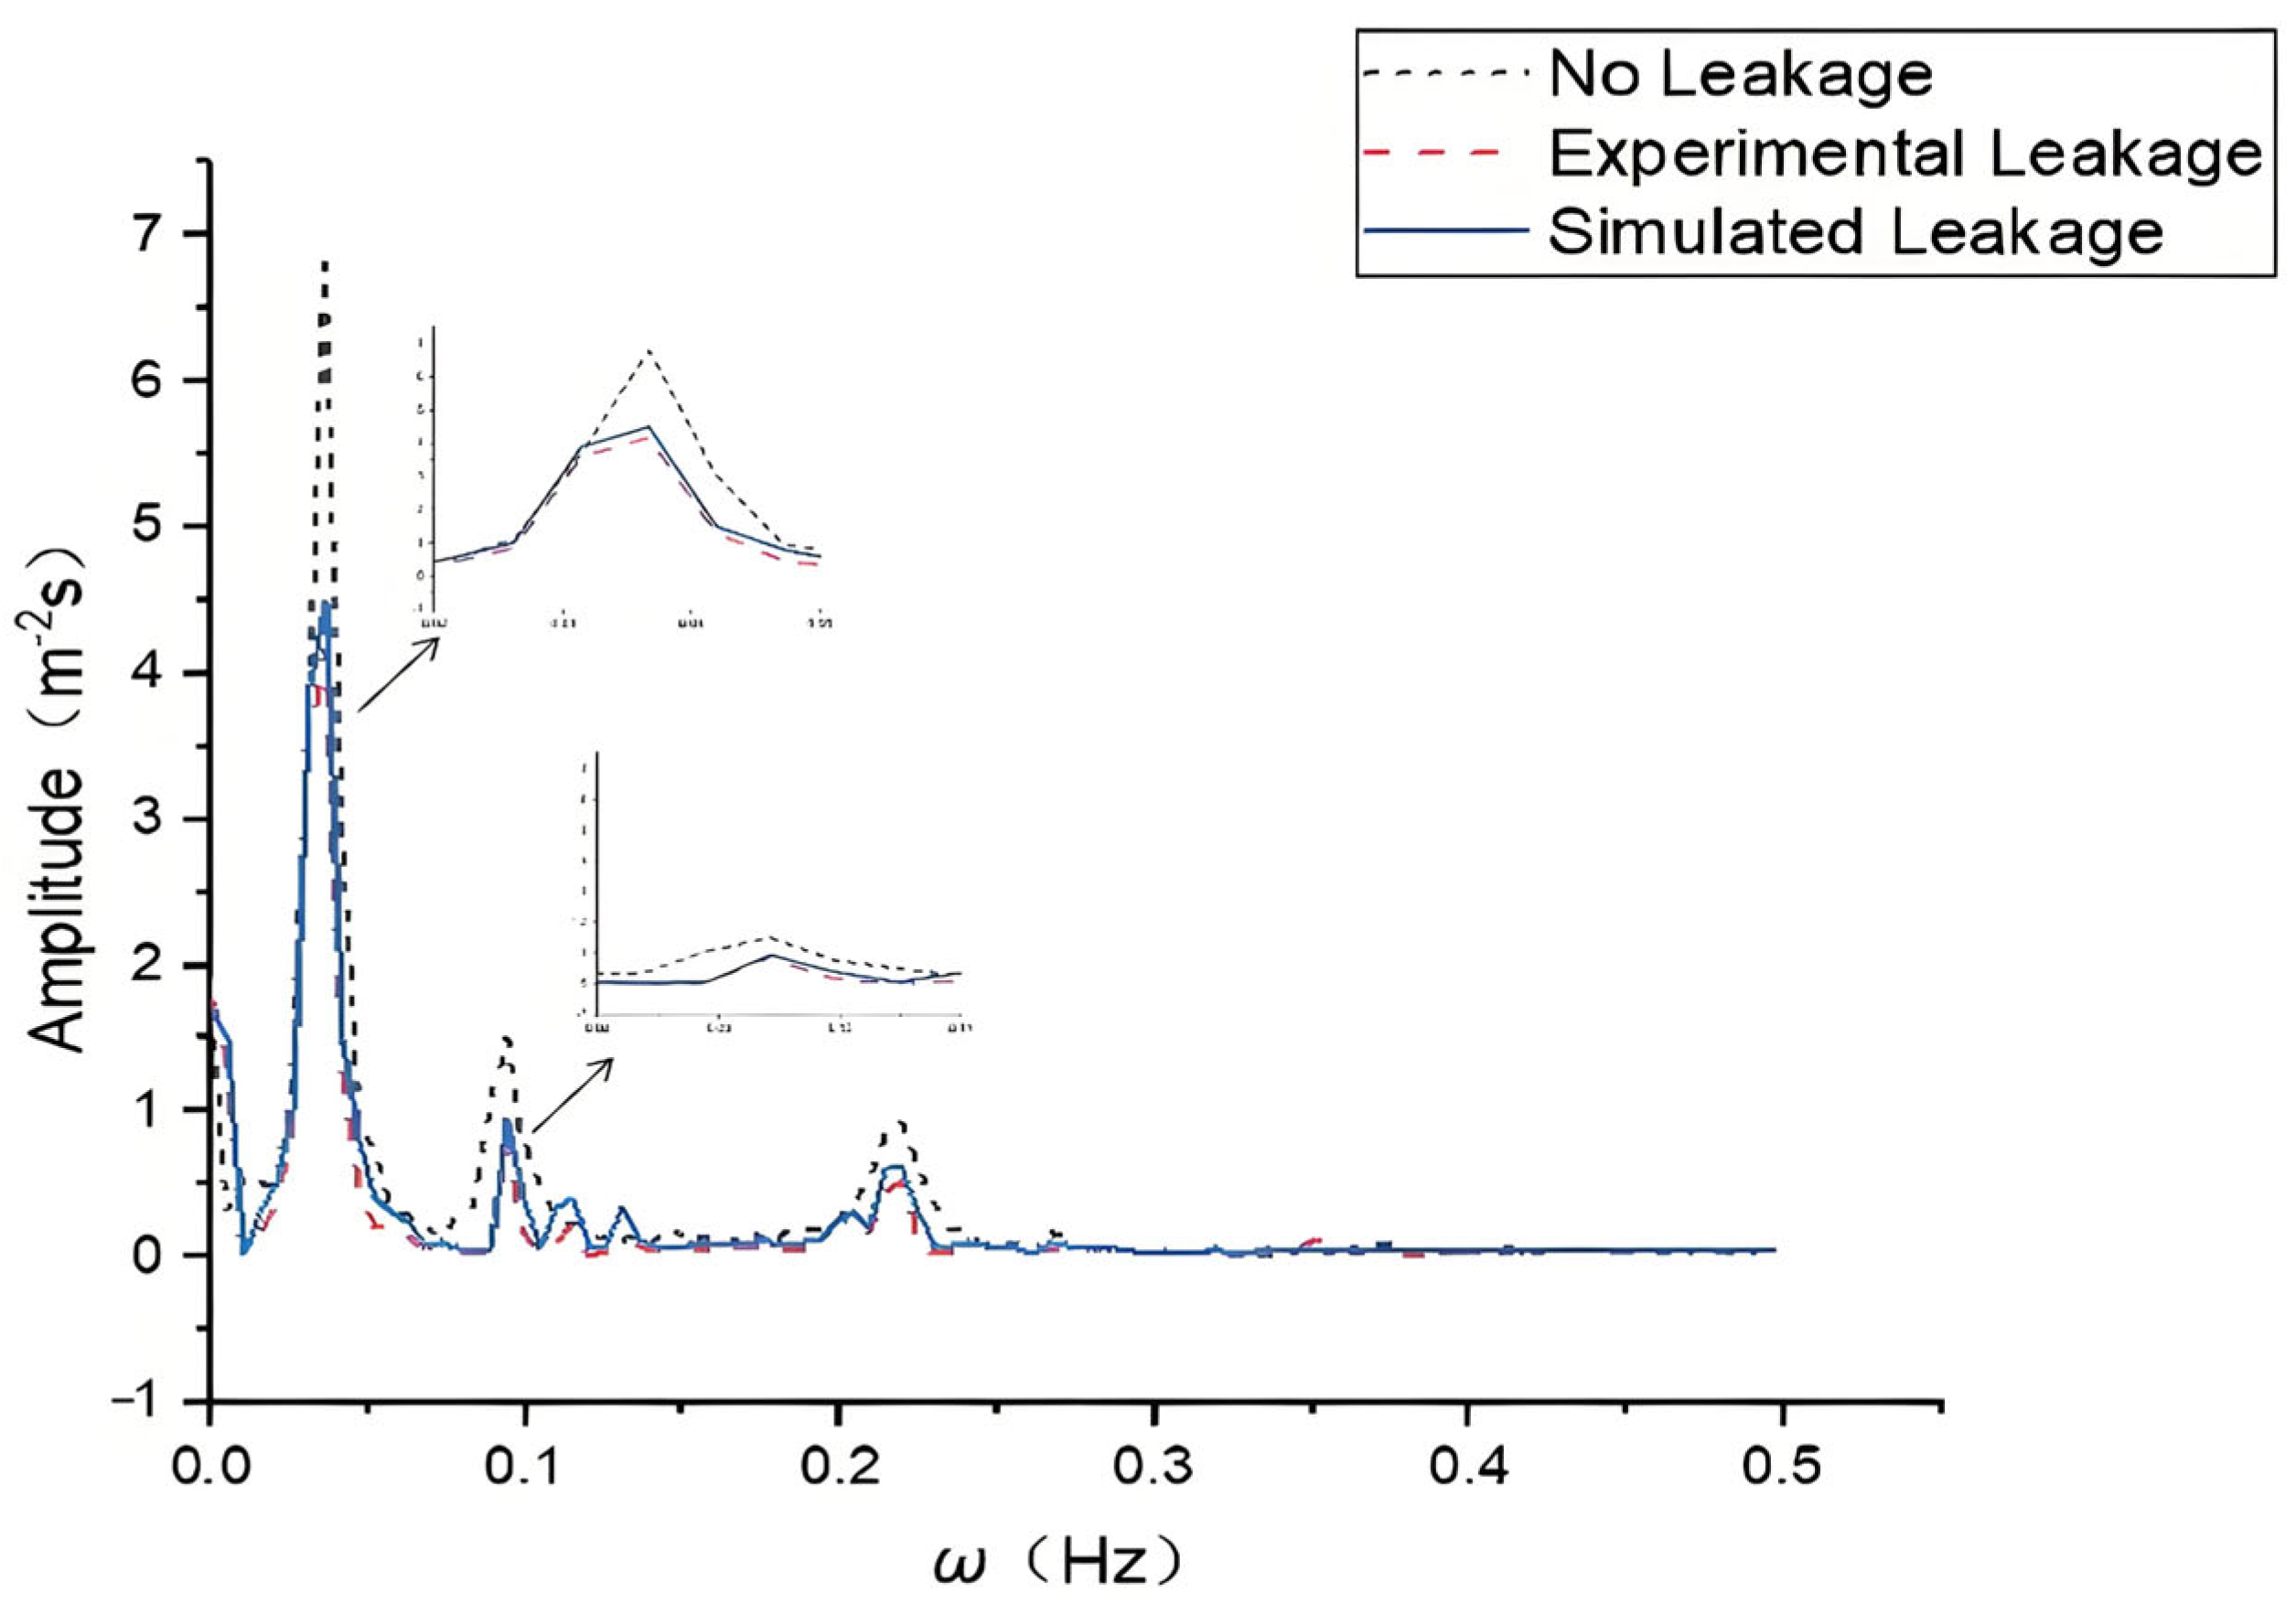
Data from Pressure Measurement Point 3, which was close to Leak 1, were selected for the analysis. Figure 4 displayed the frequency-domain data of the pressure head during the water hammer operation under three conditions: experimental non-leakage, experimental leakage, and simulated leakage. The frequency-domain diagram clearly showed that the experimental and simulated data were consistent under the leakage condition, indicating that the simulation results were reliable and that the model was effective and accurate. To further quantitatively verify the consistency between the experimental data and numerical simulation data in Figure 4, three quantitative indicators—Root Mean Square Error (RMSE), correlation coefficient (R2), and Peak Attenuation Rate (PAR)—were supplemented for the leakage condition and the comparison between the leak-free and leakage conditions. The calculations were based on the pressure head amplitude data within the 0–0.5 Hz frequency range in Figure 4, and these results were presented in Table 2.
Under leak-free conditions, the uniform parameters along the viscoelastic pipeline resulted in transient pressure waves exhibiting significant symmetrical characteristics in the frequency domain—specifically, the amplitude distribution and phase variation within specific frequency intervals were symmetrical about the central frequency or temporal axis. In contrast, when a leak existed in the pipeline, the leak point acted as a localized non-uniform disturbance source, disrupting this symmetrical structure. This disruption manifested as abrupt amplitude changes, asymmetric phase shifts within symmetrical intervals, or anomalies in specific frequency components. By observing the difference in the peak height between the non-leakage and leakage conditions, it was possible to quickly determine whether there was a leak in the pipeline. Using the transient inverse problem method, the calculated results of the pressure measurement points were obtained by simulating the leakage parameters at the nodes at different positions. By optimizing the objective function E (Equation (46)) via the Genetic Algorithm (GA), the estimated values of the leak parameters were obtained. These estimated values were then compared with the theoretical values, and the error results are presented in Table 3. When the objective function E in Equation (46) reached its minimum value, the water hammer waveform was closest to the actual water hammer waveform during the experimental leakage, thereby identifying the leakage parameters.
The Zielke exponential summation method was employed to calculate the unsteady-state shear stress, and only 2–3 terms of the coefficients mi and ni were retained to improve efficiency. By comparing the simulation results, it was found that the estimation deviation of the leak rate increased by 0.1–0.2%, but this was far lower than the engineering allowable error (±5%), which indicated that the simplified scheme achieved a balance between accuracy and efficiency.

6. Conclusions

The one-dimensional transient flow model for viscoelastic pipelines and the frequency-domain analysis method constructed in this study can effectively describe the propagation characteristics of transient flow in viscoelastic pipelines.
By converting the time-domain transient flow equations into a frequency-domain equation set via Fourier transform and establishing a linear relationship between the frequency-domain perturbations of the flow rate and head upstream and downstream of the pipeline through transfer matrix derivation, the method avoids the computational difficulties and errors caused by discretization in traditional time-domain analysis, improves the computational efficiency of transient flow analysis, and facilitates the establishment of correlations between transient signals and pipeline characteristics, such as leakage.
Through the inverse problem analysis method for transient flow leak detection, we adopt the genetic algorithm (GA) with the minimization of the objective function as the criterion. Comparing the measured pressure response values at the pressure measurement points with the model-calculated values enables the effective identification of the leak location and leakage rate in viscoelastic pipelines.
The experimental verification showed that the frequency-domain data of the pressure head under the simulated leakage condition were consistent with those under the experimental leakage condition, and the presence of leaks in the pipeline could be quickly determined by the difference in the pressure peak height between the non-leakage and leakage conditions. This further demonstrates that the method can realize efficient leak detection in viscoelastic pipelines, providing a feasible scheme and parameter reference for subsequent engineering applications of leak detection in these pipelines.
In the future, one can further explore the influence of temperature variations on the viscoelastic parameters of viscoelastic pipelines (such as creep compliance and relaxation time) and the evolution of the propagation laws of transient flow under different flow velocities, so as to improve the applicability of this leak detection method under complex working conditions.

Author Contributions

T.-Y.Z.: Visualization, Validation, Software, Formal analysis, Writing—original draft. Y.X.: Conceptualization, Methodology, Writing—review and editing, Funding acquisition. Y.-C.M.: Investigation, Formal analysis. J.-F.Q.: Methodology, Formal analysis, Funding acquisition. All authors have read and agreed to the published version of the manuscript.

Funding

Funding for this research was provided by the National Natural Science Foundation of China (Grant No 51978202), Natural Science Fund of Shandong Province (Grant No ZR2022ME123), Joint Guidance Project of the Natural Science Foundation of Heilongjiang Province (Grant No LH2023E028) and Fundamental Research Funds in Universities of Heilongjiang Province (2025).

Data Availability Statement

All relevant data are included in the paper.

Acknowledgments

Thanks to the National Natural Science Foundation of China (Grant No 51978202), Natural Science Fund of Shandong Province (Grant No ZR2022ME123), Joint Guidance Project of the Natural Science Foundation of Heilongjiang Province (Grant No LH2023E028) and Fundamental Research Funds in Universities of Heilongjiang Province (2025).

Conflicts of Interest

The authors declare no conflict of interest.

Glossary

J0instantaneous compliance;
τkrelaxation time of the k-th dashpot (s);
Jkcreep compliance of the k-th element;
Ekelastic modulus of the k-th spring;
γspecific weight (kg/m2·s2);
αa parameter related to whether the pipeline can be displaced and the degree of displacement;
epipeline wall thickness (m);
nTotal number of monitoring points in the flow field;
D(t) inner diameter of the pipeline at time t (m);
e (t) wall thickness of the pipeline at time t (m);
Arcross-sectional area of the pipeline (m2);
Rinner diameter of the pipeline (m);
bimaxWidest blade length after unfolding;
w (t) weight function;
uaxial flow velocity of the fluid (m/s);
λfriction coefficient;
μdynamic viscosity (Pa·s);
vkinematic viscosity (m2/s);
mi,, niconstant coefficients related to the dimensionless time;
AA*,BB*revision coefficients that vary with the pipeline smoothness;
Hppiezometric head at the pipeline inlet;
Hrupstream reservoir water level;
Qp1flow rate at the pipeline inlet at time t;
Q0flow rate under steady-state conditions;
H0head loss of the valve under steady-state conditions;
(CdAG)0product of the valve opening area and discharge coefficient;
Δ H instantaneous drop of the hydraulic grade line when flowing through the valve;
C 1 ( ω ) reflects the influence of the flow rate Q on the pressure head gradient H / x ;
C 2 ( ω ) reflects the influence of the flow rate Q / x on the pressure head gradient H;
Γ = C 1 C 2 propagation constant;
Zc = C 1 / C 2 characteristic impedance;
Erepresents the objective function;
Mnumber of sensor measurement points;
Ndenotes the total sampling time;
Xjunknown leak parameters;
lleak location;
Ql0leak rate;
θ 1 , θ 2 weight coefficients.
H i m , Q i m water head and flow rate results after filtering and denoising, respectively.

References

  1. Tjuatja, V.; Keramat, A.; Pan, B.; Duan, H.F.; Brunone, B.; Meniconi, S. Transient flow modeling in viscoelastic pipes: A comprehensive review of literature and analysis. Phys. Fluids 2023, 35, 081302. [Google Scholar] [CrossRef]
  2. Rezapour, I.; Shafai Bejestan, M.; Aminnejad, B. Case study of leak detection based on Gaussian function in experimental viscoelastic water pipeline. Water Supply 2021, 21, 3860–3874. [Google Scholar] [CrossRef]
  3. Khudayarov, B.A.; Turaev, F.Z. Mathematical simulation of nonlinear oscillations of viscoelastic pipelines conveying fluid. Appl. Math. Modell. 2019, 66, 662–679. [Google Scholar] [CrossRef]
  4. Parvin, C.C.; Manoochehr, F.M.; Sadegh, H. Modeling of Transient Flows in Viscoelastic Pipe Network with Partial Blockage; Aqua-Water Infrastructure Ecosystems Society: London, UK, 2021; Volume 70, pp. 832–844. [Google Scholar]
  5. Lazhar, A.; Hadj-Taïeb, L.; Hadj-Taïeb, E. Two leaks detection in viscoelastic pipeline systems by means of transient. J. Loss Prev. Process Ind. 2013, 26, 1341–1351. [Google Scholar] [CrossRef]
  6. Lee, P.J.; Vítkovský, J.P.; Lambert, M.F.; Simpson, A.R.; Liggett, J. Frequency response leak detection using inline valve closures. In Proceedings of the 9th International Conference on Pressure Surges, Chester, UK, 24–26 March 2004; Volume 1, pp. 239–253. [Google Scholar]
  7. Lee, P.J.; Vítkovský, J.P.; Lambert, M.F.; Simpson, A.J.; Liggett, J.A. Frequency domain analysis for detecting pipeline leaks. J. Hydraul. Eng. 2005, 131, 596–604. [Google Scholar] [CrossRef]
  8. Duan, H.F.; Lee, P.J.; Ghidaoui, M.S.; Tung, Y.K. System response function–based leak detection in viscoelastic pipelines. J. Hydraul. Eng. 2012, 138, 143–153. [Google Scholar] [CrossRef]
  9. Pan, B.; Duan, H.F.; Meniconi, S.; Urbanowicz, K.; Che, T.C.; Brunone, B. Multistage frequency-domain transient-based method for the analysis of viscoelastic parameters of plastic pipes. J. Hydraul. Eng. 2020, 146, 04019068. [Google Scholar] [CrossRef]
  10. Pan, B.; Duan, H.F.; Meniconi, S.; Brunone, B. FRF-based transient wave analysis for the viscoelastic parameters identification and leak detection in water-filled plastic pipes. Mech. Syst. Signal Process. 2021, 146, 107056. [Google Scholar] [CrossRef]
  11. Wylie, E.B.; Streeter, V.L.; Suo, L. Fluid Transients in Systems; Prentice Hall: Englewood Cliffs, NJ, USA, 1993. [Google Scholar]
  12. Chaudhry, M.H. Applied Hydraulic Transients; Van Nostrand Reinhold: New York, NY, USA, 1987. [Google Scholar]
  13. Nault, J.D.; Karney, B.W.; Jung, B.S. Generalized flexible method for simulating transient pipe network hydraulics. J. Hydraul. Eng. 2018, 144, 04018031. [Google Scholar] [CrossRef]
  14. Ranginkaman, M.H.; Haghighi, A.; Samani, H.M.V. Application of the frequency response method for transient flow analysis of looped pipe networks. Int. J. Civ. Eng. 2017, 15, 677–687. [Google Scholar] [CrossRef]
  15. Kim, S.H. Address-oriented impedance matrix method for generic calibration of heterogeneous pipe network systems. J. Hydraul. Eng. 2008, 134, 66–75. [Google Scholar] [CrossRef]
  16. Ferrante, M.; Brunone, B. Pipe system diagnosis and leak detection by unsteady-state tests. 1. Harmonic analysis. Adv. Water Resour. 2003, 26, 95–105. [Google Scholar] [CrossRef]
  17. Weinerowska-Bords, K. Viscoelastic model of waterhammer in single pipeline-problems and questions. Arch. Hydro-Eng. Environ. Mech. 2006, 53, 331–351. [Google Scholar]
  18. Wineman, A.S.; Rajagopal, K.R. Mechanical Response of Polymers: An Introduction; Cambridge University Press: Cambridge, UK, 2000. [Google Scholar]
  19. Xu, Y.; Zhang, S.; Zhou, L.; Ning, H.; Wu, K. Dynamic Behavior and Mechanism of Transient Fluid–Structure Interaction in Viscoelastic Pipes Based on Energy Analysis. Water 2024, 16, 1468. [Google Scholar] [CrossRef]
  20. Mohammad, B.; Mahdi, R.A.; Kayvan, S. Numerical analysis of laminar viscoelastic fluid hammer phenomenon in an axisymmetric pipe. J. Braz. Soc. Mech. Sci. Eng. 2021, 43, 396. [Google Scholar] [CrossRef]
  21. Zielke, W. Frequency-dependent friction in transient pipe flow. J. ASME 1968, 90, 109–115. [Google Scholar] [CrossRef]
  22. Urbanowicz, K. New approximation of unsteady friction weighting functions. In Proceedings of the 11th International Conference on Pressure Surges 2012, Lisbon, Portugal, 24–26 October 2012. [Google Scholar]
  23. Urbanowicz, K. Analytical expressions for effective weighting functions used during simulations of water hammer. J. Theor. Appl. Mech. 2017, 55, 1029–1040. [Google Scholar] [CrossRef]
  24. Nash, G.A.; Karney, B.W. Efficient inverse transient analysis in series pipe systems. J. Hydraul. Eng. 1999, 125, 761–764. [Google Scholar] [CrossRef]
  25. Vítkovský, J.P.; Simpson, A.R.; Lambert, M.F. Leak detection and calibration using transients and genetic algorithms. J. Water Resour. Plan. Manag. 2000, 126, 262–265. [Google Scholar] [CrossRef]
Figure 1. Schematic diagram of the generalized Kelvin–Voigt model.
Symmetry 17 01805 g001
Figure 2. Test bench flow chart.
Symmetry 17 01805 g002
Figure 3. Some physical objects of the experimental bench.
Symmetry 17 01805 g003
Figure 4. Frequency domain comparison diagrams under experimental leak-free conditions, experimental leakage conditions and simulated leakage conditions.
Symmetry 17 01805 g004
Table 1. Location of Pressure Measurement Points on Test Bench.
Position NumberDistance from the Elevated Water Tank (m)
115
265
370
4105
5110
6124.5
Table 2. Quantitative calculation results and analysis.
ComparisonIndicatorNumerical ValueResult
Experimental leakage- Simulated leakageRMSE0.042 mThe deviation is less than 0.05 m, far lower than the engineering allowable pressure measurement error (±0.1 m), and the simulation value is in high agreement with the experimental value
Experimental leakage- Simulated leakageR20.968The correlation coefficient is close to 1, indicating that the variation trend of the amplitude in the frequency domain is completely consistent, and the model can accurately reproduce the characteristics of the leakage flow field
No leakage-Experimental leakagePAR24.2%The peak attenuation exceeds 20%, and the amplitude attenuation caused by leakage is significant, meeting the threshold requirements for leakage identification criteria
No leakage-Simulated leakagePAR26.3%The PAR deviation between the simulated values and the experimental values was only 2.1%, further verifying the quantification accuracy of the model for leakage disturbances
Table 3. Error Analysis in Leakage Parameter Estimation.
Leakage ParameterTheoretical ValueEstimated ValueAbsolute ErrorRelative Error
Leakage location l (m)69.569.3~69.7±0.2 m±0.29%
Leakage rate Ql0 (%)2019.6~20.3±0.4%±2.0%
Disclaimer/Publisher’s Note: The statements, opinions and data contained in all publications are solely those of the individual author(s) and contributor(s) and not of MDPI and/or the editor(s). MDPI and/or the editor(s) disclaim responsibility for any injury to people or property resulting from any ideas, methods, instructions or products referred to in the content.