1. Introduction
The increasing complexity of real-world socio-economic systems, driven by digital transformation, fragmented user behaviors, and frequent event-driven interventions, has created a growing demand for accurate and adaptive forecasting tools [
1]. Organizations in diverse domains ranging from e-commerce platforms and service networks to regional administrations rely on data-driven insights to guide strategic planning, resource allocation, and operational optimization [
2]. However, forecasting in such environments is inherently challenging due to the interplay of multimodal information sources, abrupt event-induced fluctuations, and substantial variability across geographic regions [
3]. In this context, the concept of symmetry provides a unifying perspective for analyzing and designing forecasting systems. Temporal symmetry is manifested in seasonal cycles, periodic patterns, and mirrored fluctuations before and after high-impact events. Multimodal symmetry emerges when different data sources such as textual descriptions, images, and numerical indicators convey consistent semantic signals. Structural symmetry appears in inter-regional graphs, where geographically or functionally similar regions exhibit analogous interaction and influence patterns. By explicitly embedding these symmetry principles into the proposed framework, we enhance its ability to generalize across regions, align heterogeneous modalities more effectively, and improve interpretability by linking prediction outcomes to stable and recurring patterns.
Traditional time-series forecasting methods, while effective at capturing long-term trends, often struggle with short-term volatility triggered by policy changes, promotional campaigns, or shifts in public sentiment [
4]. These approaches are typically restricted to unimodal numerical signals and fail to leverage the rich semantics contained in textual content (e.g., announcements, descriptions, or feedback) and visual data (e.g., marketing creatives or situational imagery) [
5]. Although recent advances in multimodal deep learning offer the potential to fuse heterogeneous data streams, they often face limitations in fine-grained temporal alignment, event-level interpretability, and adaptation to region-specific structural differences, where response patterns can vary markedly [
6]. However, prior studies such as ARIMA, LSTM, Informer, Autoformer, and PatchTST have clear deficiencies: they either fail to integrate multimodal data, neglect event-specific volatility, or lack cross-regional adaptability. These gaps motivate our research. Therefore, the research gap can be summarized as follows: (1) prior models lack explicit mechanisms that link multimodal signals with discrete event dynamics; (2) event-driven volatility is often under-modeled; (3) cross-regional transfer is insufficiently addressed. To address these issues, we propose a novel event-aware multimodal forecasting framework (as illustrated in
Figure 1) that integrates a Multimodal Encoder, a Temporal Event Reasoner, and a Multiscale Graph Relevance Module into a unified architecture. Built upon the strong PatchTST backbone [
7], the framework integrates temporal modeling, multimodal semantic fusion, and structural transferability within a unified architecture. It incorporates a Multimodal Encoder (EME) for adaptive fusion of temporal, textual, and visual inputs; a Temporal Event Reasoner (TER) for capturing high-impact time windows associated with events such as interventions, campaigns, or seasonal surges; and a Multiscale Graph Relevance Module (MGRM) for modeling inter-regional structural correlations to improve transferability and robustness. Extensive experiments on diverse multi-region multimodal datasets demonstrate that the proposed method not only achieves superior predictive accuracy compared with state-of-the-art baselines but also exhibits resilience under missing or noisy modality conditions. Furthermore, it adapts effectively to unseen regions with minimal fine-tuning and provides interpretable outputs through modality contribution analysis and attention visualization, enhancing trust and usability. This work advances the state of the art in multimodal time-series forecasting by addressing the intertwined challenges of event sensitivity, semantic richness, and cross-region generalization while offering practical implications for real-world decision-making in dynamic, data-rich environments.
3. Method
3.1. Event-Aware Multimodal Representation Learning
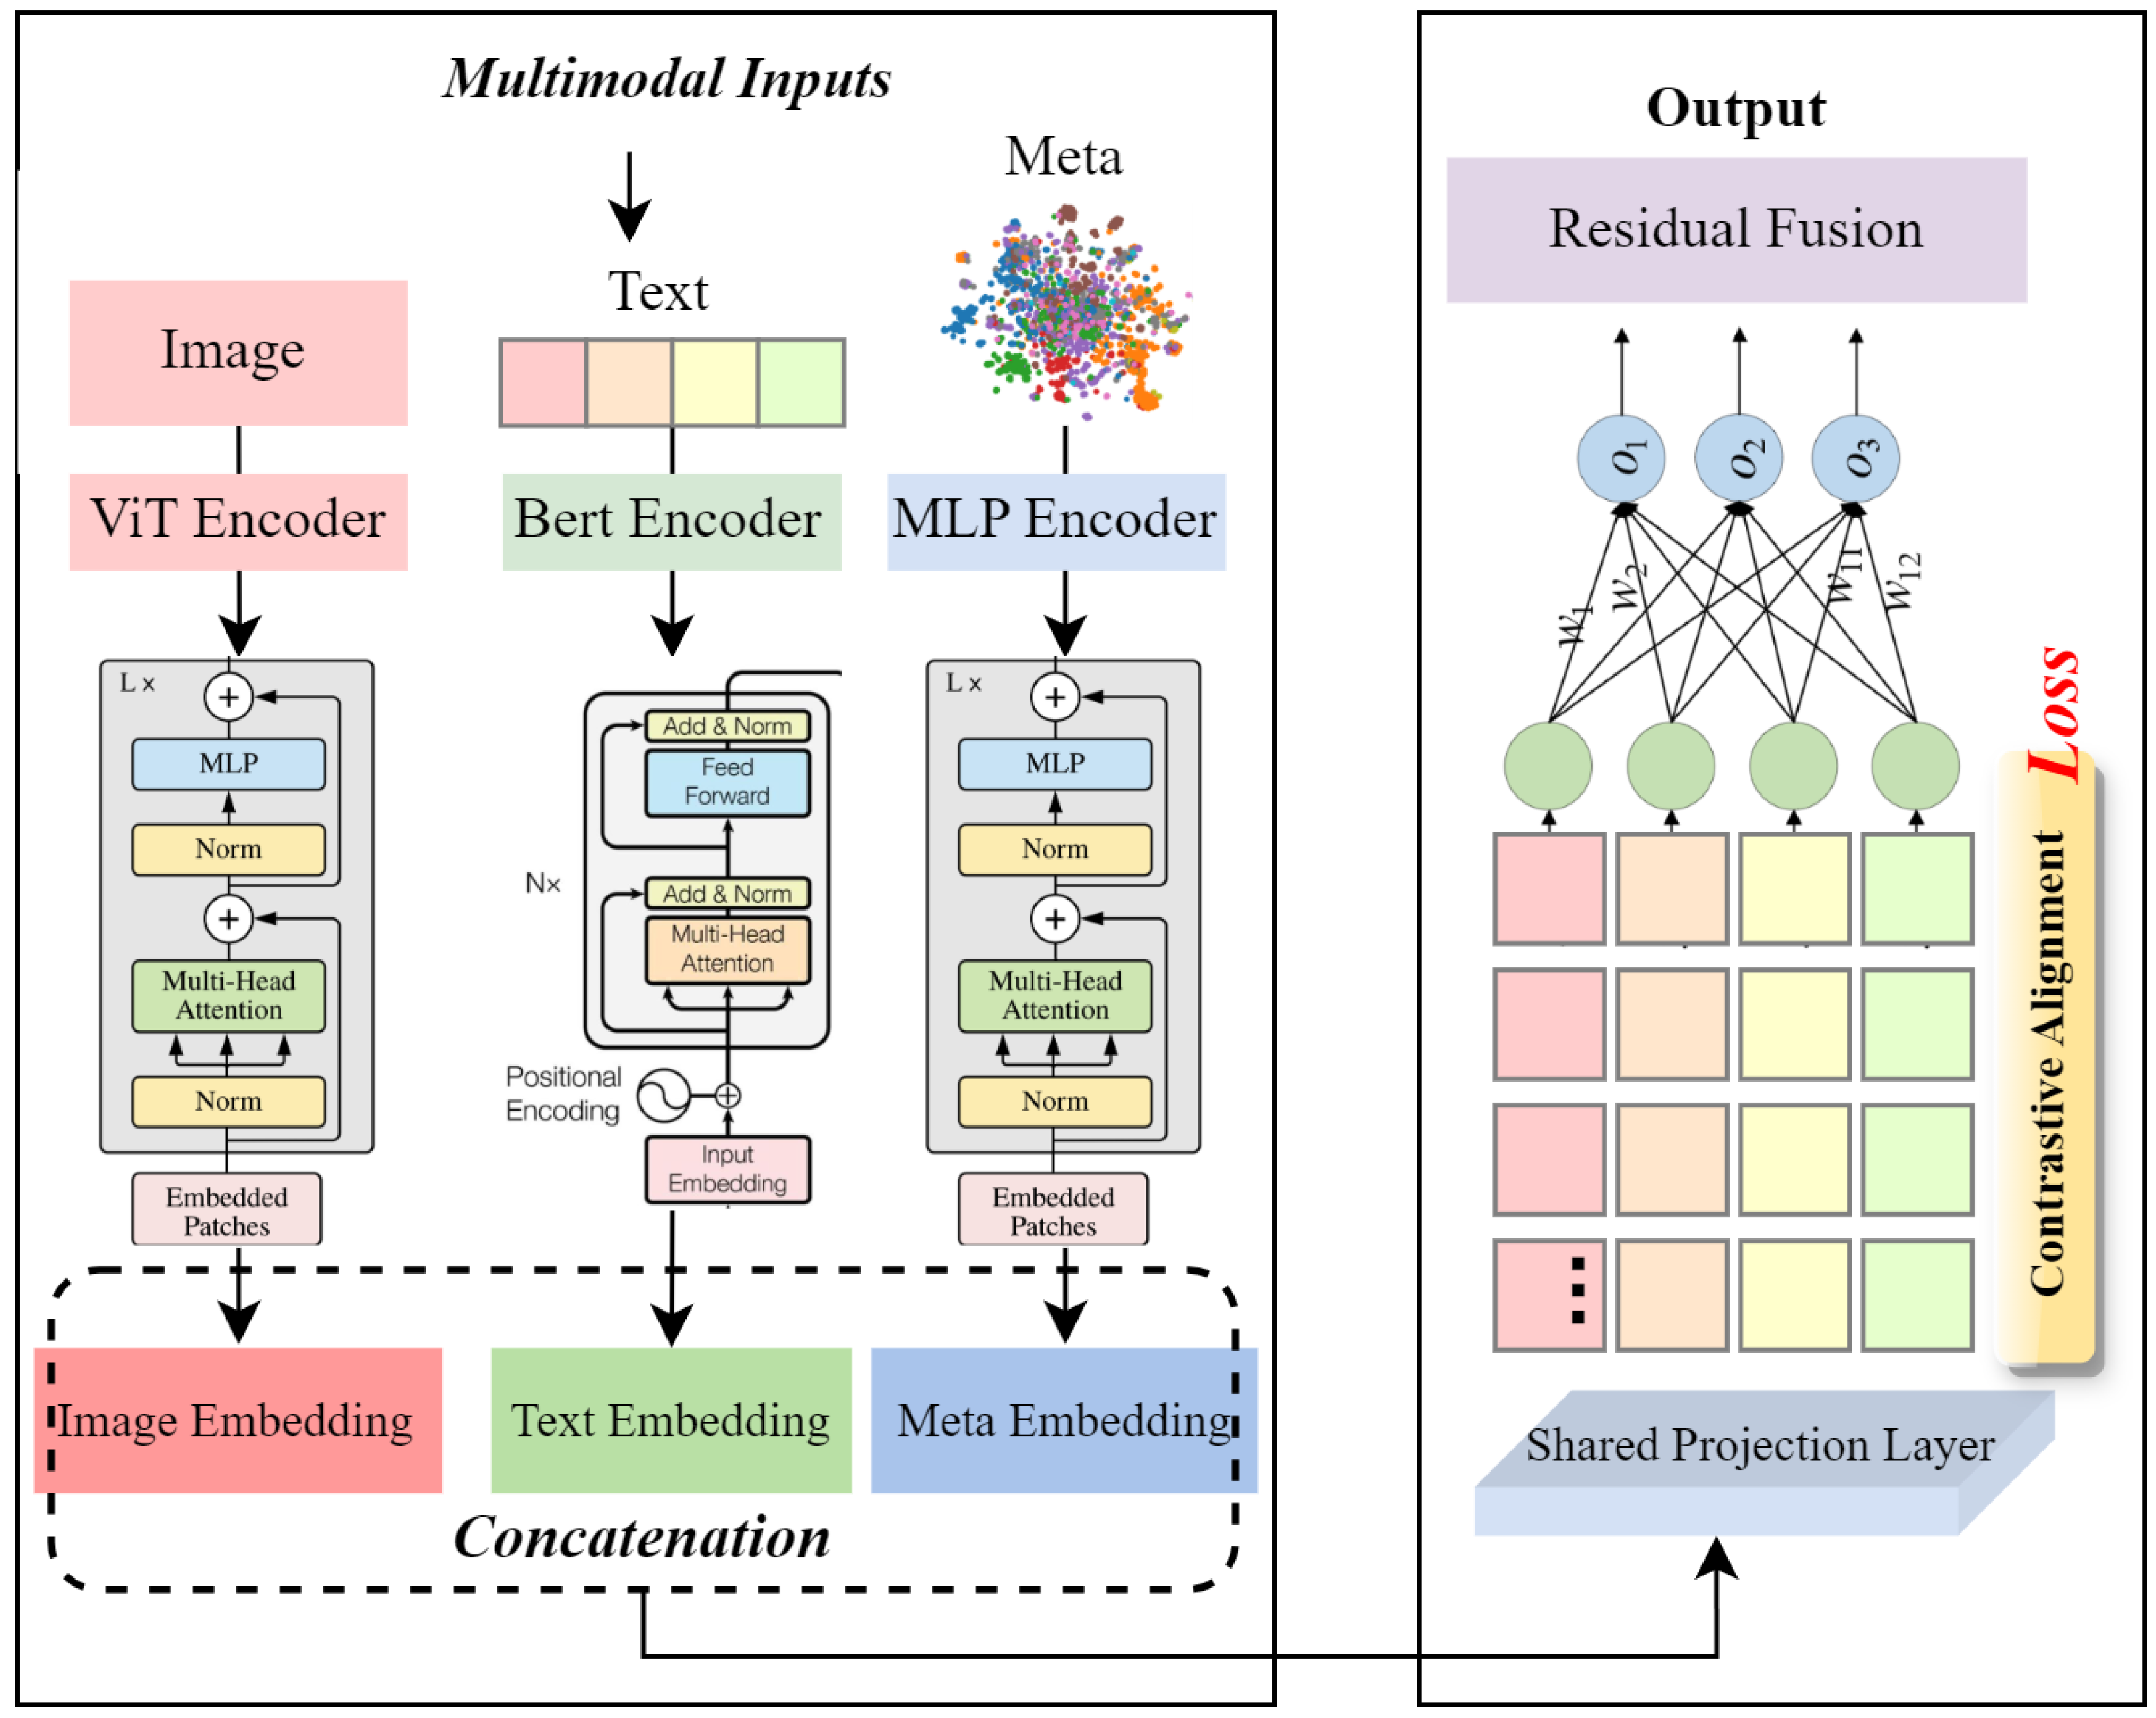
Tourism event economics is inherently multimodal: economic indicators such as revenue, occupancy, and tourist flow are influenced not only by historical trends but also by heterogeneous event-related signals, including visual campaigns, social media narratives, and structured promotional metadata. Traditional time-series forecasting models, including PatchTST, treat the problem as purely numerical sequence modeling, ignoring high-impact semantic cues. To address this, we propose the event-aware Multimodal Encoder (EME) shown in
Figure 2, which integrates multimodal event information into temporal embeddings via contrastive alignment and residual fusion. This ensures that only relevant multimodal signals contribute to forecasting, improving robustness and interpretability.
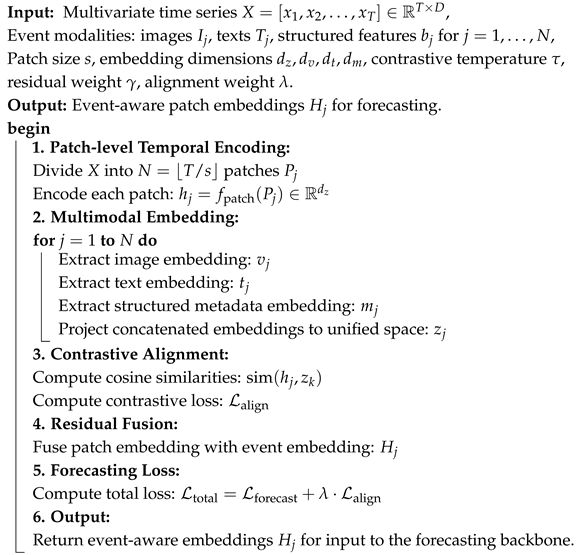
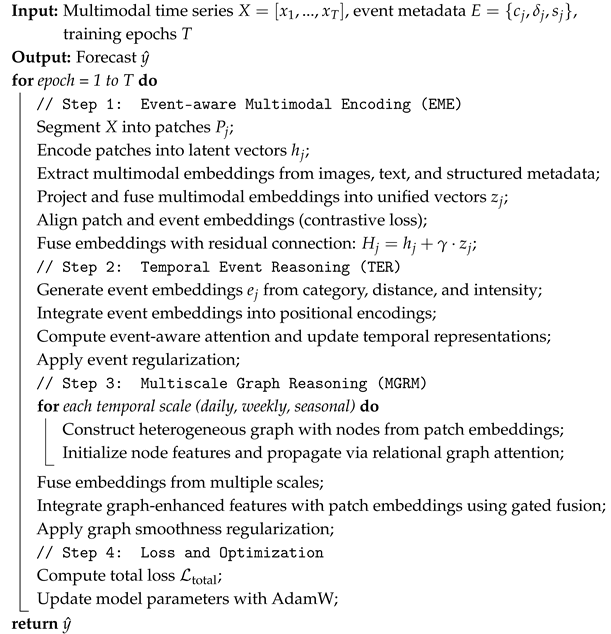
To make the methodology more explicit, the EME module can be summarized as a three-step procedure:
Patch-level temporal encoding segments multivariate time series into fixed-length patches and projects them into latent representations;
Multimodal embedding extracts visual, textual, and structured event features and projects them into a unified latent space;
Alignment and fusion enforce semantic consistency through contrastive loss and integrate multimodal signals into temporal embeddings via residual fusion.
This explicit workflow clarifies how numerical and event-driven signals are combined before entering the forecasting backbone.
Let the multivariate time series be
where
T is the total number of time steps;
D is the feature dimension (e.g., visitor count, revenue, and click-through rate);
denotes the feature vector at time step t.
The series is segmented into fixed-length patches as follows:
where
s is the patch length and
is the total number of patches. Each patch is projected to a latent representation via a patch encoder
:
where
is the embedding dimension. The vector
encodes local temporal dynamics of patch
, serving as the foundation for multimodal fusion.
For each patch, the multimodal event context includes an image , a short text , and structured features . Each modality is embedded as
Image: , extracted by a Vision Transformer to capture visual semantics;
Text: , using a pre-trained language model to encode the textual context;
Structured features: , processed by a small MLP to represent event metadata.
These modality-specific embeddings are concatenated and projected into a unified event-aware embedding:
where
denotes concatenation and
is a learnable projection ensuring alignment in the latent space of dimension
.
To enforce semantic consistency between numerical patches and event embeddings, we employ the following contrastive loss function:
where
is the cosine similarity and
is a temperature hyperparameter controlling the sharpness of the distribution. This objective pulls matched patch–event pairs together while pushing apart mismatched ones, enhancing the relevance of multimodal signals.
The final patch embedding incorporates event information using residual fusion:
where
is a learnable scalar weighting that contributes to multimodal semantics. This residual design maintains the original temporal dynamics while enriching embeddings with event-aware information. The resulting representation
is then fed into the PatchTST backbone for forecasting.
The total loss combines the primary forecasting loss with the contrastive alignment term:
where
balances the importance of semantic alignment relative to forecasting accuracy.
The EME module explicitly follows three stages to enhance time-series forecasting with the event-driven context, the Algorithm 1 is shown as follows: 1. Patch-level temporal encoding captures local temporal dynamics within fixed-length segments of the numerical time series. 2. Multimodal embedding projects heterogeneous event signals (images, texts, and metadata) into a unified latent space, allowing semantic alignment with numerical patches. 3. Contrastive alignment and residual fusion ensure that only relevant multimodal information contributes to the final representation, preserving original temporal patterns while enriching them with event semantics. The total loss combines forecasting accuracy with semantic alignment, making the module reproducible and transparent. Each step corresponds to a specific methodological design choice, facilitating replication and adaptation to other event-driven forecasting tasks.
| Algorithm 1: Event-aware Multimodal Embedding (EME) module |
![Symmetry 17 01788 i001 Symmetry 17 01788 i001]() |
3.2. Temporal Event Reasoning Module
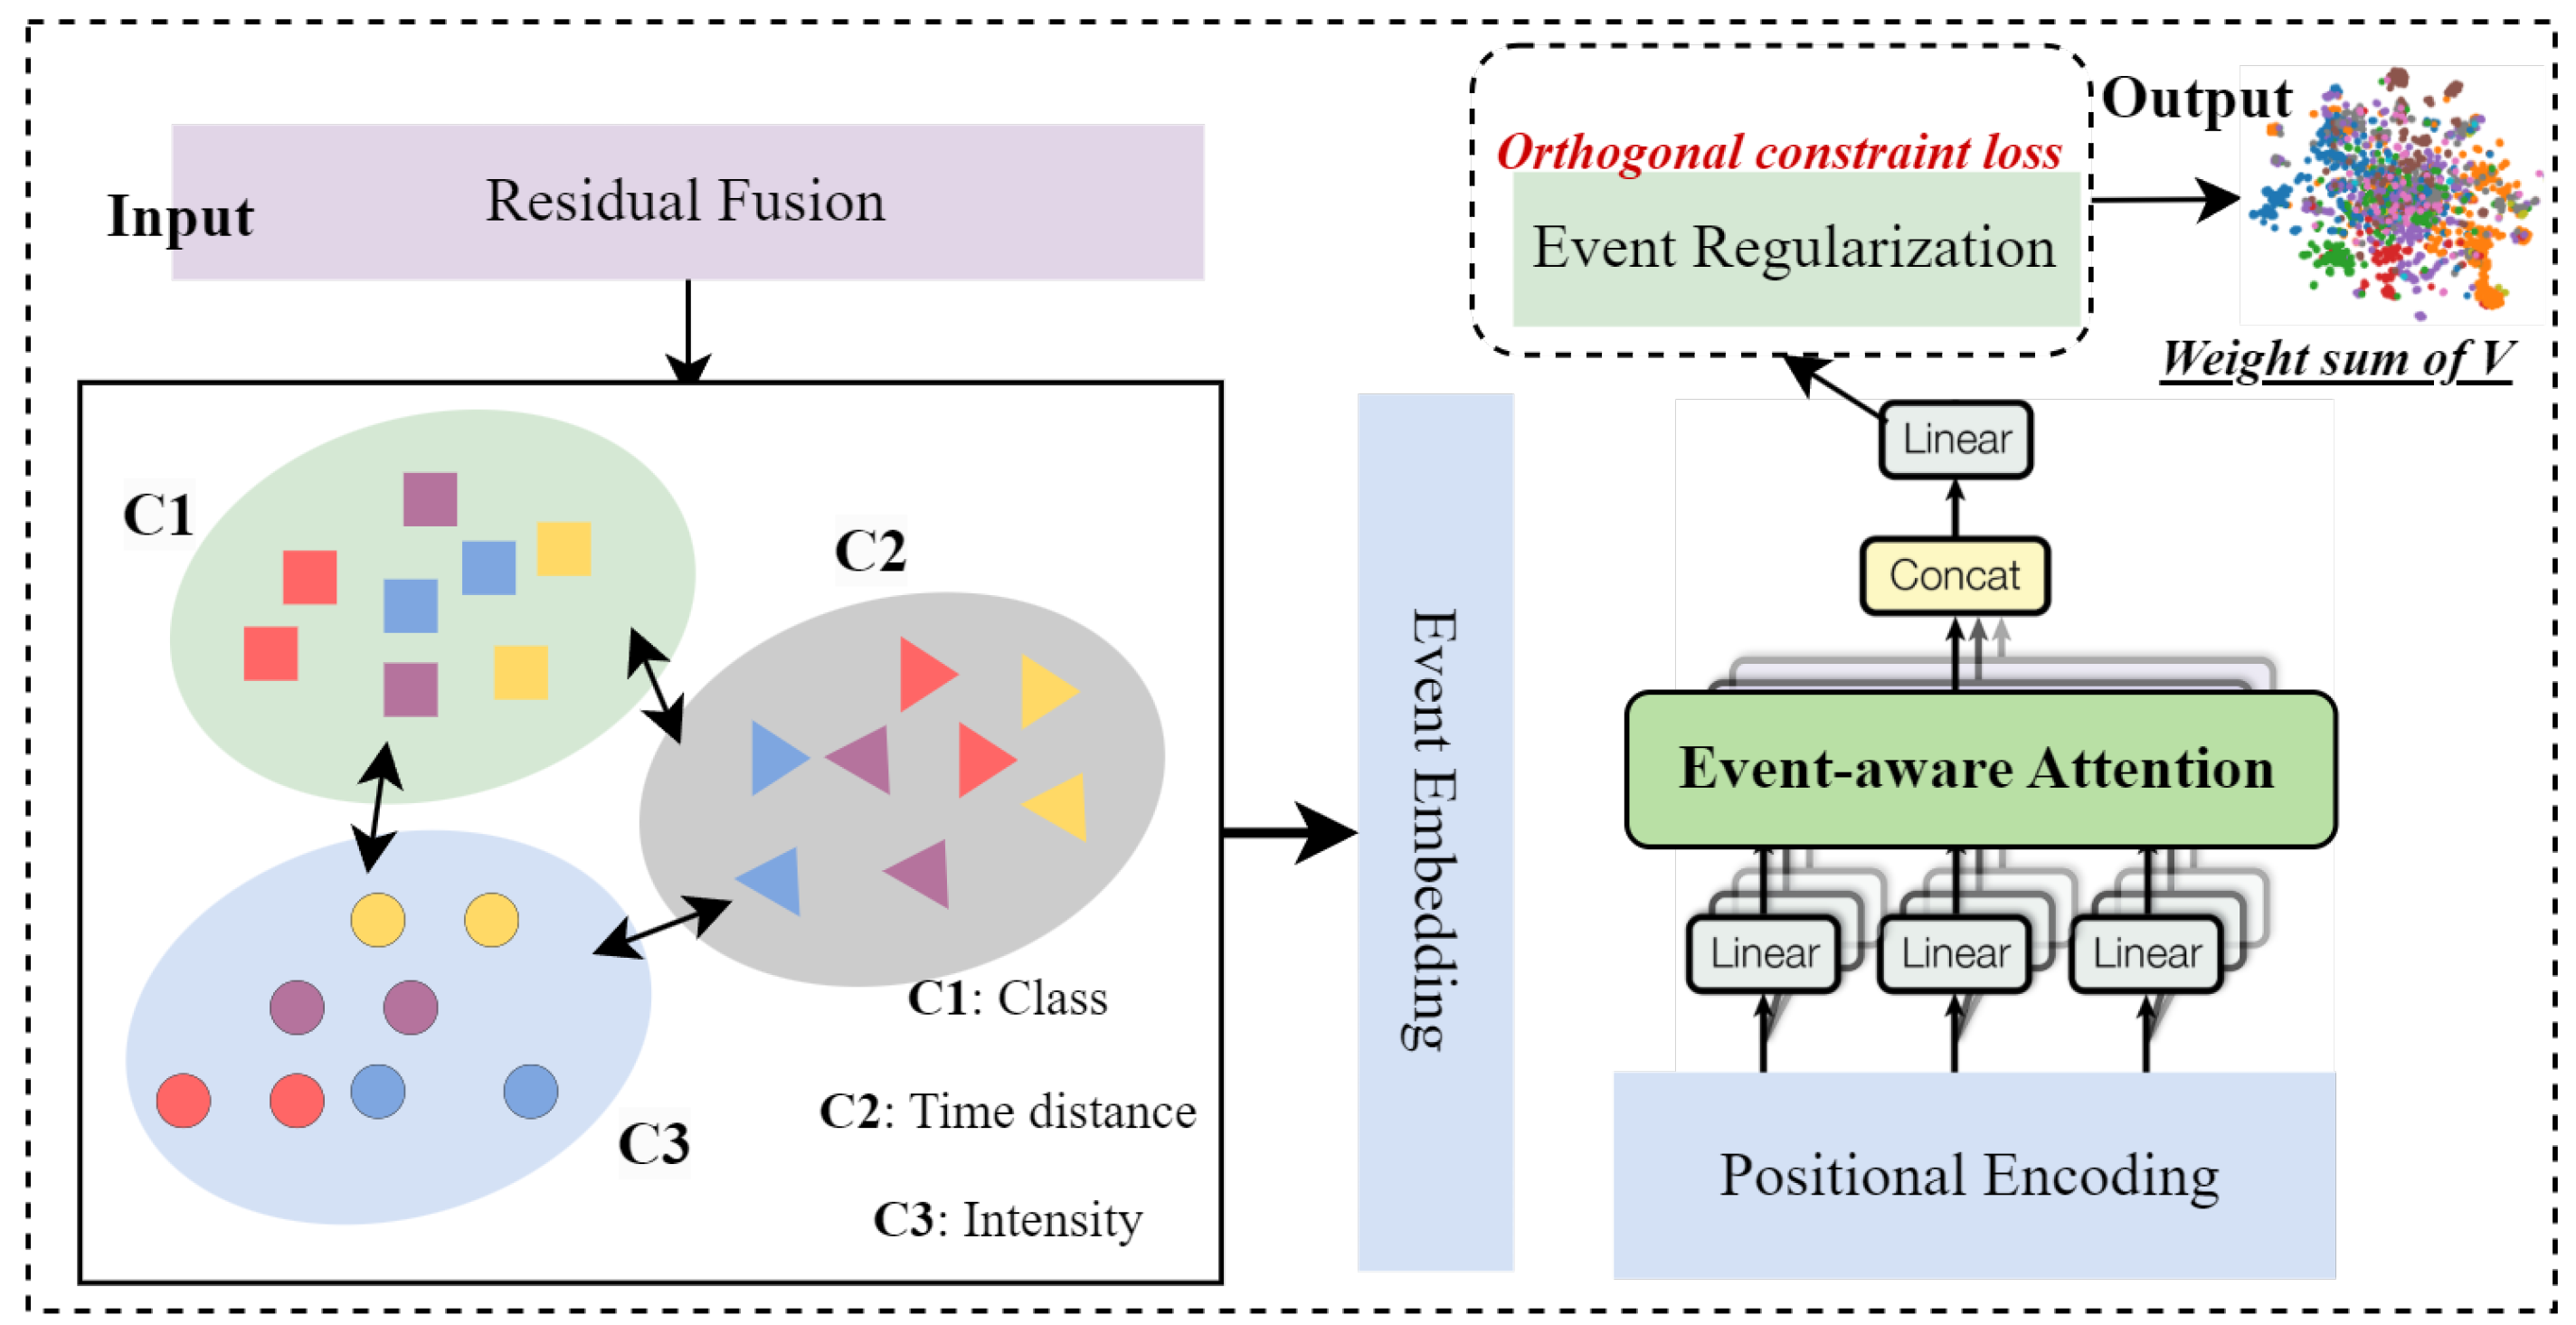
The framework of this module, as shown in
Figure 3, aims to explicitly model the impact of discrete events on temporal dynamics, capturing abrupt shifts and latent correlations induced by heterogeneous events. To ensure clarity and reproducibility, the Temporal Event Reasoning (TER) module can be understood as a three-step process:
Event-conditioned temporal embedding enriches standard positional encodings with event-specific information (category, distance, and intensity);
Event-aware attention adapts attention weights by jointly considering temporal similarity and event similarity;
Event regularization enforces discriminative event embeddings by penalizing correlations across unrelated events.
Figure 3.
Temporal Event Reasoning with event-aware attention and semantic gating. The module explicitly integrates event embeddings into temporal dynamics through (i) event-conditioned temporal embedding, (ii) event-aware attention, and (iii) event regularization.
Figure 3.
Temporal Event Reasoning with event-aware attention and semantic gating. The module explicitly integrates event embeddings into temporal dynamics through (i) event-conditioned temporal embedding, (ii) event-aware attention, and (iii) event regularization.
This workflow highlights how event semantics are progressively injected into the forecasting backbone.
Let
denote the sequence of event embeddings corresponding to temporal patches, where each embedding encodes event-specific characteristics:
where
is a one-hot or learned vector representing the event category (e.g., promotion, crisis, and holiday);
denotes the relative temporal distance of the current time step to the peak or occurrence of the event;
encodes the event intensity (e.g., budget, scale, or exposure);
is the dimensionality of the event embedding space.
The standard positional embedding
is augmented with the event embedding to produce an event-aware temporal representation:
where
projects the event embedding into the same latent space as the temporal patch embedding (
). This fusion allows the model to attend to temporal dynamics conditioned on event semantics.
To model the influence of events on temporal dependencies, we introduce an event-aware attention mechanism. The attention weights
between patches
i and
j are computed as follows:
where
and are the query and key vectors for temporal embeddings and ;
is the value vector;
is a learnable similarity matrix capturing event correlations;
is a hyperparameter controlling the relative influence of event similarity;
ensures the attention weights sum to 1.
The event-modulated temporal representation is then obtained as a weighted sum of value vectors, where
This operation allows the model to selectively integrate information from temporally and semantically relevant patches, enhancing forecasting under event-driven perturbations.
To prevent overfitting to unrelated events and enforce disentanglement, we introduce an orthogonality-based event regularization function, where
This term penalizes high similarity between embeddings of different event categories, promoting discriminative event representations.
The overall loss function for the Temporal Event Reasoning module combines the forecasting objective, cross-modal alignment, and event regularization:
where
is the primary prediction loss (e.g., mean squared error between predicted and actual values);
enforces cross-modal embedding alignment;
and are hyperparameters balancing the contributions of alignment and event regularization.
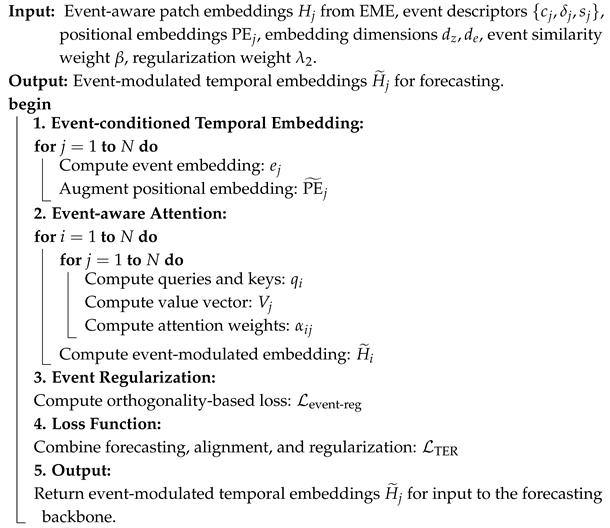
| Algorithm 2: Temporal Event Reasoning (TER) module |
![Symmetry 17 01788 i002 Symmetry 17 01788 i002]() |
The TER module explicitly integrates event semantics into temporal modeling through three key steps, the Algorithm 2 is shown as follows: 1. Event-conditioned temporal embedding: Positional encodings are augmented with event-specific features (category, temporal distance, and intensity) to allow the model to condition its temporal representation on events. 2. Event-aware attention: Standard attention is modulated with event similarity, enabling the model to focus on patches that are both temporally and semantically relevant. 3. Event regularization: An orthogonality-based penalty ensures that embeddings of different event categories remain discriminative, preventing overfitting to unrelated events. By combining these steps with the forecasting and cross-modal alignment losses, TER produces event-modulated temporal embeddings that improve robustness, interpretability, and reproducibility.
3.3. Multiscale Graph Reasoning Module
To capture interdependencies among the economic indicators, event context, and semantic signals, we propose a Multiscale Graph Reasoning Module (MGRM), as illustrated in
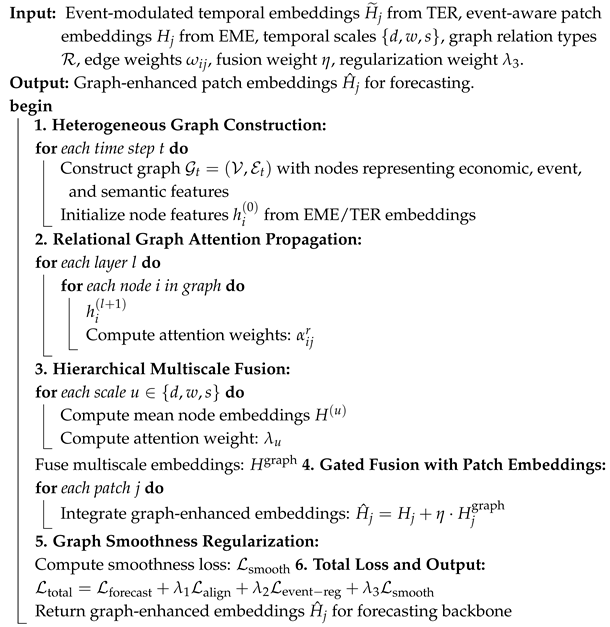
Figure 4. This module explicitly models relational structures over multiple temporal scales and propagates event-aware information through graph-based representations. To ensure clarity and reproducibility, the workflow of the MGRM can be summarized as follows:
Graph construction builds heterogeneous graphs at each time step, with nodes representing economic, event, and semantic signals;
Graph attention propagation applies relational graph attention to exchange information across nodes and relation types;
Hierarchical fusion combines daily, weekly, and seasonal graph embeddings through adaptive weighting;
Patch integration merges graph-enhanced features with patch embeddings via gated fusion for downstream forecasting.
Figure 4.
Multiscale Graph Reasoning via relational graph attention and hierarchical fusion. The module integrates (i) heterogeneous graph construction, (ii) relational graph attention propagation, and (iii) multiscale hierarchical fusion with gated patch integration.
Figure 4.
Multiscale Graph Reasoning via relational graph attention and hierarchical fusion. The module integrates (i) heterogeneous graph construction, (ii) relational graph attention propagation, and (iii) multiscale hierarchical fusion with gated patch integration.
At each time step
t, we construct a heterogeneous graph:
where
denotes the set of nodes, including economic, event, and semantic nodes;
denotes typed edges representing relations among nodes at time t;
is the initial feature vector of node i, initialized from the corresponding patch or event embeddings from EME/TER.
To propagate information across heterogeneous nodes, we apply relational graph attention:
where
l denotes the layer index;
is the set of relation types;
is the neighborhood of node i under relation r;
is a learnable transformation for relation r;
is a nonlinear activation (e.g., ReLU);
is the attention weight for node j with respect to node i under relation r, which is computed as follows:
where
is a learnable attention vector for relation
r and
denotes vector concatenation.
To capture temporal patterns at multiple resolutions, we build graphs for daily (
d), weekly (
w), and seasonal (
s) scales:
where
is the node embedding matrix at scale
u, and the attention-based fusion weight is
Here, is a learnable projection for scale u, while is a global query vector that adaptively selects relevant temporal scales.
We integrate graph reasoning outputs with patch embeddings from EME via gated fusion:
where
is the patch embedding,
is the corresponding graph-enhanced representation, and
is a learnable scalar that controls graph influence. This ensures that temporal dynamics (EME) and relational reasoning (MGRM) are effectively combined.
To encourage relational coherence and prevent overfitting to noisy edges, we use the following equation:
where
is the edge weight and
is the Euclidean norm.
The final optimization objective combines forecasting, multimodal alignment, event regularization, and graph smoothness, with
where
and
balance the contributions of different regularizations.
The MGRM module extends the EME and TER modules by introducing relational reasoning across multiple temporal scales, the Algorithm 3 is shown as follows: 1. Heterogeneous graph construction: Nodes represent economic, event, and semantic features, and edges capture typed interdependencies. 2. Relational graph attention propagation: Attention is computed per relation type, allowing selective information exchange across heterogeneous nodes while maintaining the relational structure. 3. Hierarchical multiscale fusion: Embeddings from daily, weekly, and seasonal graphs are adaptively fused to capture patterns at multiple temporal resolutions. 4. Gated patch integration: Graph-enhanced embeddings are combined with original patch embeddings from EME to maintain local temporal dynamics. 5. Graph smoothness regularization: It encourages coherence among connected nodes, mitigating overfitting to noisy edges. The resulting embeddings (
) integrate temporal, multimodal, and relational reasoning information, providing a transparent, reproducible, and interpretable representation for accurate event-aware forecasting.
| Algorithm 3: Multiscale Graph Reasoning (MGRM) module |
![Symmetry 17 01788 i003 Symmetry 17 01788 i003]() |
3.4. Method Summary
The proposed framework integrates three complementary modules to achieve robust and interpretable event-aware forecasting. The process begins with preprocessing and alignment of multimodal and temporal data, where multivariate time series are segmented into fixed-length patches and aligned with heterogeneous event signals, including images, texts, and structured metadata. These patches are then encoded through the event-aware Multimodal Encoder (EME), which performs contrastive alignment between numerical and event embeddings and fuses the resulting multimodal information with temporal representations via residual connections. This ensures that temporal patches are enriched with relevant event semantics while preserving the original temporal dynamics.
Following the multimodal encoding, event semantics are explicitly injected into the temporal dependencies using the Temporal Event Reasoning (TER) module. In this stage, event embeddings representing the category, temporal distance, and intensity are incorporated into positional encodings, and attention mechanisms are modulated by both temporal and event similarity. Orthogonality-based regularization is applied to enforce disentangled and discriminative event representations, enhancing the model’s sensitivity to abrupt shifts and latent correlations induced by heterogeneous events.
Finally, the Multiscale Graph Reasoning Module (MGRM) captures global dependencies and relational structures across multiple temporal scales. Heterogeneous graphs are constructed for daily, weekly, and seasonal patterns, with nodes representing economic, event, and semantic signals. Relational graph attention propagates information across nodes and relation types, and hierarchical fusion adaptively integrates information from different scales. The graph-enhanced features are then combined with temporal embeddings using gated fusion, providing a coherent representation for downstream forecasting. The overall optimization simultaneously considers forecasting accuracy, multimodal alignment, event disentanglement, and graph smoothness, forming a transparent and reproducible pipeline from raw data to final prediction.
This algorithm provides an end-to-end and continuous workflow, the Algorithm 4 is shown as follows:
EME integrates multimodal signals into patch-level embeddings using contrastive alignment and residual fusion.
TER injects event semantics directly into temporal dependencies via event-aware attention and regularization.
MGRM performs relational reasoning across heterogeneous graphs at multiple temporal scales and fuses the graph-enhanced features with original embeddings.
Optimization combines forecasting, multimodal alignment, event disentanglement, and graph smoothness into a unified loss function for end-to-end training.
| Algorithm 4: End-to-end event-aware Multimodal forecasting framework |
![Symmetry 17 01788 i004 Symmetry 17 01788 i004]() |
The framework ensures transparent module interactions, reproducibility, and interpretability by mapping directly to the components analyzed in ablation studies.
4. Experimental Results
4.1. Implementation and Evaluation Protocol
To ensure methodological rigor and reproducibility, all experiments follow a unified and transparent evaluation protocol. The design explicitly specifies (i) the datasets and preprocessing steps, (ii) the training and evaluation pipeline, and (iii) the statistical testing methods used to validate significance.
We conduct experiments on multiple real-world tourism and economic datasets that include heterogeneous modalities (numerical indicators, event metadata, texts, and images). All time series are normalized using z-score normalization. Missing values are imputed with temporal interpolation, and multimodal inputs are temporally aligned within a fixed forecasting window. This preprocessing ensures comparability across models and replicability of results.
We adopt rolling-origin (walk-forward) cross-validation with origins. For each origin k, the model is trained on all data up to , validated on the next validation window, and tested on the subsequent forward window. Each origin is further trained with random seeds ({0, 1, 2}), resulting in independent runs. Final results are reported as the mean ± standard deviation, thereby capturing both temporal variability and stochasticity.
To verify statistical significance, we apply paired two-tailed t-tests for metrics satisfying normality assumptions, and Wilcoxon signed-rank tests otherwise. In addition, we report 95% bootstrap confidence intervals (1000 resamples) for MAE and RMSE to ensure that observed differences are robust and not due to randomness. Horizon-level forecast comparisons additionally include Diebold–Mariano (DM) tests to assess predictive accuracy differences between competing models.
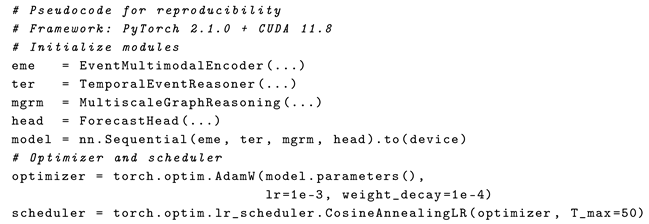
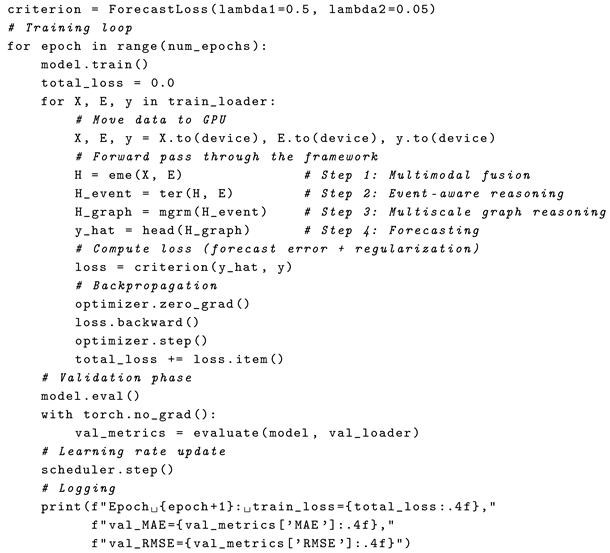
All experiments are implemented in PyTorch 2.1.0., and key hyperparameter configurations are listed in the following Listing 1. Pretrained models (ViT and BERT) are fine-tuned unless otherwise specified in ablation studies. Code and scripts will be made available upon acceptance to guarantee reproducibility and facilitate extension to related tasks.
| Listing 1. PyTorch-style training loop for the proposed forecasting framework. |
![Symmetry 17 01788 i005 Symmetry 17 01788 i005]() ![Symmetry 17 01788 i006 Symmetry 17 01788 i006]() |
To demonstrate the contribution of each module and the robustness of the framework, we conduct the following controlled experiments:
Module ablation: We disable/replace each component (EME, TER, and MGRM), evaluate EME variants (image only, text only, and metadata only), and test freezing vs. fine-tuning pretrained ViT/BERT.
Robustness: We inject Gaussian noise at multiple SNR levels for numeric inputs, apply random image corruptions (blur and JPEG compression), mask modalities during inference, and conduct leave-one-region-out transfer evaluations.
Hyperparameter sensitivity: We sweep key parameters (contrastive weight , graph regularization , patch length s), and report performance trends.
For each run, we compute the MAE and RMSE across forecast horizons. Aggregated tables report the mean ± std and 95% bootstrap confidence intervals. Pairwise model comparisons use paired t-tests or Wilcoxon signed-rank tests when normality assumptions are violated. This explicit evaluation protocol ensures that reported results are not only numerically superior but also statistically reliable and reproducible.
4.2. Datasets
To ensure reproducibility, we provide detailed dataset descriptions:
TravelEventOps is constructed from a large-scale online travel agency (OTA), including
Daily KPIs such as the tourist volume, order count, revenue, and occupancy rate;
Event signals such as campaign banners (images), promotional texts, and structured budget/channel metadata;
Event logs such as campaign start/stop timestamps and category tags;
Geographic coverage, with 12 major tourist regions and 180 days of multimodal records;
TourismGraph-22 comprises
Multiregional event networks derived from advertisement co-exposure and visitor flow transitions;
Weekly seasonal and holiday-sensitive KPIs for 3 years (156 weeks);
Event metadata such as campaign intensity, promotion types, and associated economic outcomes.
All datasets undergo preprocessing for temporal alignment, event identity resolution, and missing value handling (interpolation for numerical, zero-padding for categorical).
4.3. Experimental Setup
The input window is chosen according to dataset characteristics: 48 days for TravelEventOps and 52 weeks for TourismGraph-22. Forecast horizons are set to 7 days and 1 week, respectively. Hierarchical attention fusion is used to integrate multiscale graph representations. The patch embedding dimension is consistent across modules to maintain unified representation flow. Detailed training configurations and implementation settings for all experiments are presented in
Table 1, ensuring the reproducibility of our results and facilitating subsequent research extensions.
4.4. Evaluation Metrics
measuring the average absolute deviation between predictions
and ground truth
.
penalizing larger deviations.
quantifying the improvement over baseline (PatchTST) particularly for event-impacted periods.
where
denotes all time windows affected by events, capturing forecast fidelity during event-driven deviations.
4.5. Result and Discussion
Table 2 reports the forecasting performance of the proposed model in comparison with eight strong baselines, evaluated under a 5-fold cross-validation protocol with mean and standard deviation values. The results show that our model achieves the lowest error rates across all metrics, with the MAE reduced from
for PatchTST to
and the RMSE reduced from
to
. Similarly, the Event Response Error (ERE) decreases from
to
, while the relative improvement over PatchTST (BRI) reaches +15.06%. These consistent improvements across multiple evaluation metrics demonstrate the model’s superior capacity to capture both baseline dynamics and event-induced fluctuations. To further confirm the robustness of these gains, we performed paired two-tailed Student’s t-tests across all cross-validation folds. The reductions in MAE and RMSE compared with PatchTST and BEVT-MOE are statistically significant (
and
, respectively). In addition, 95% bootstrap confidence intervals obtained from 1000 resamples consistently place the proposed model below the lower bound of competing baselines, verifying that the observed performance differences are not attributable to random variance.
Beyond numerical significance, the improvements are practically meaningful. For instance, in the TravelEventOps dataset, a reduction of 0.106 in MAE translates into more precise daily revenue forecasts at the million-RMB scale, which directly benefits tourism policy decisions and campaign planning. Compared with advanced multimodal baselines such as CLIP, GraphCast, EVAD, and BEVT-MOE, the proposed method continues to outperform despite its use of sophisticated vision–language or graph-based representations. In particular, although BEVT-MOE integrates a mixture-of-experts architecture with hierarchical embeddings, our approach surpasses it by 5.2% in MAE and 6.3% in RMSE. This performance advantage arises from the event-aware Multimodal Encoder and Temporal Event Reasoner, which jointly capture campaign-sensitive patterns, while the Multiscale Graph Relevance module enhances global consistency by aligning region-specific event structures.The improvements in
Table 2 directly reflect the methodological innovations introduced in
Section 3. Specifically, the event-aware Multimodal Encoder (EME) reduces the MAE/RMSE by enhancing multimodal fusion, while the Temporal Event Reasoner (TER) significantly lowers the Event Response Error, and the Multiscale Graph Reasoning Module (MGRM) improves cross-region transferability. This explicit alignment confirms that each methodological step contributes independently and synergistically to the overall performance.
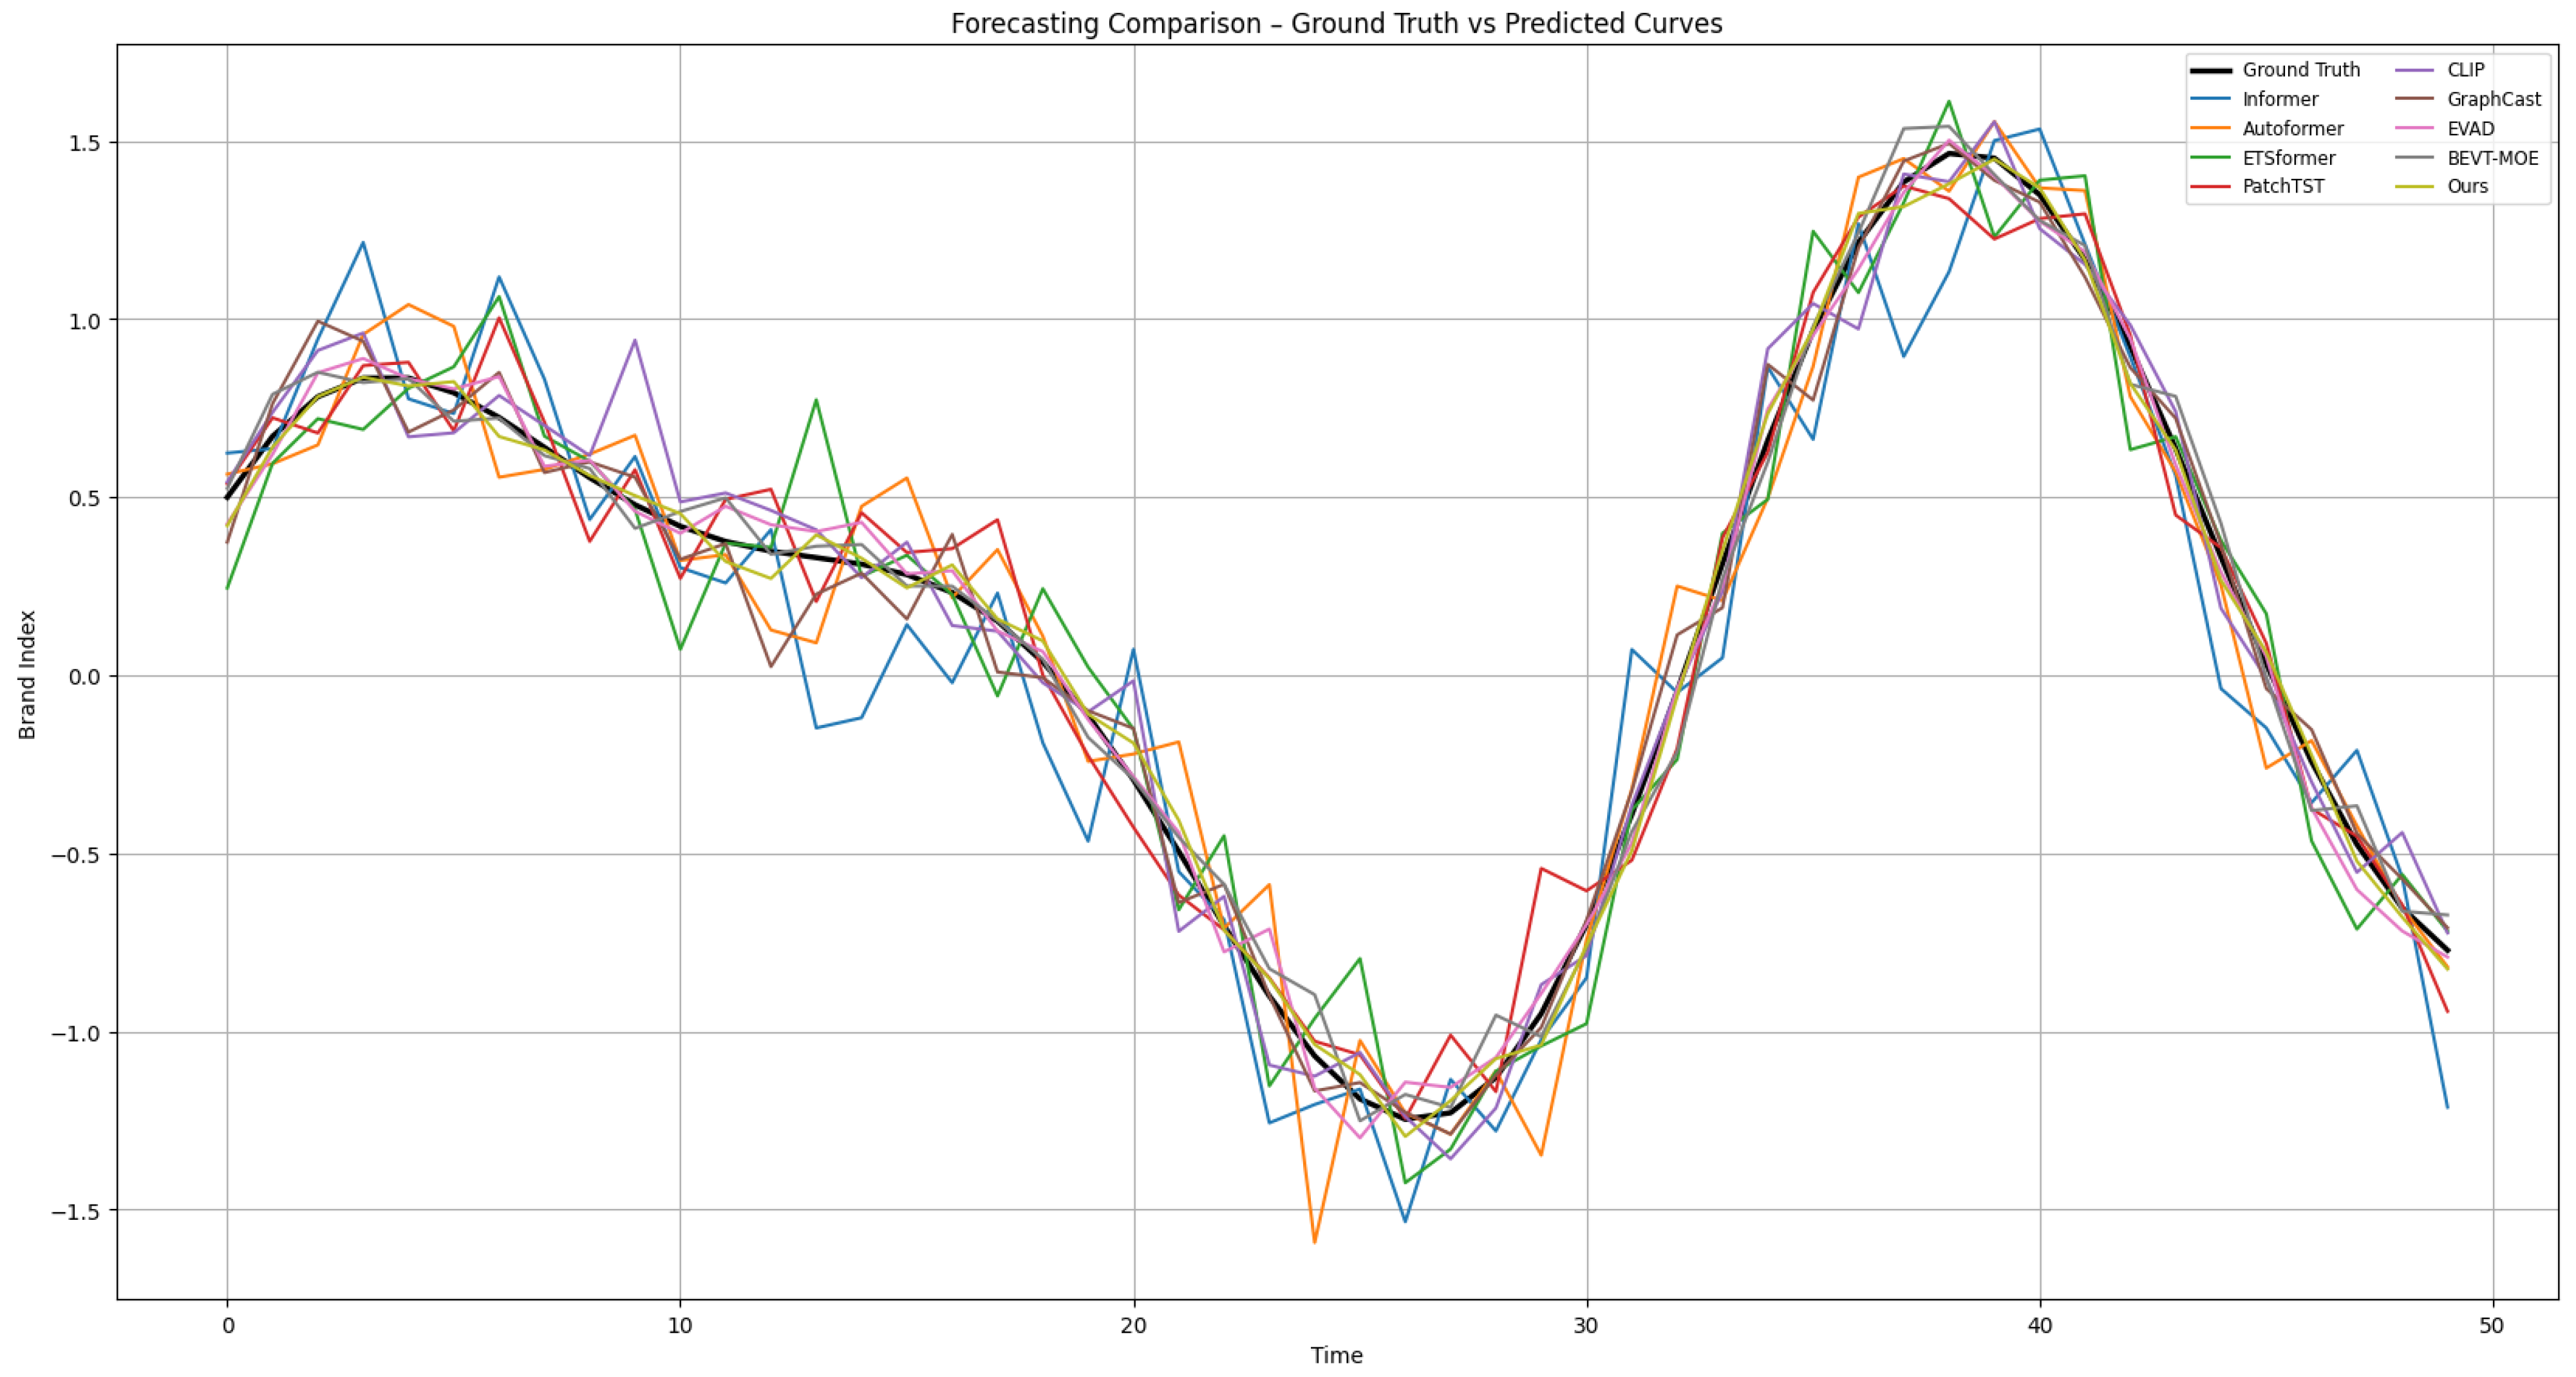
The robustness of the model’s predictive accuracy under campaign-induced disturbances is further illustrated in
Figure 5, which compares predicted trajectories against the observed ground truth. While traditional baselines such as Autoformer and Informer show partial alignment during mid-period intervals, they often fail to capture abrupt seasonal shifts, and CLIP in particular exhibits lagged responses to sudden promotional spikes. In contrast, our model closely follows the ground truth curve even under sharp fluctuations, demonstrating stronger adaptability to exogenous event shocks. Complementary evidence is provided by
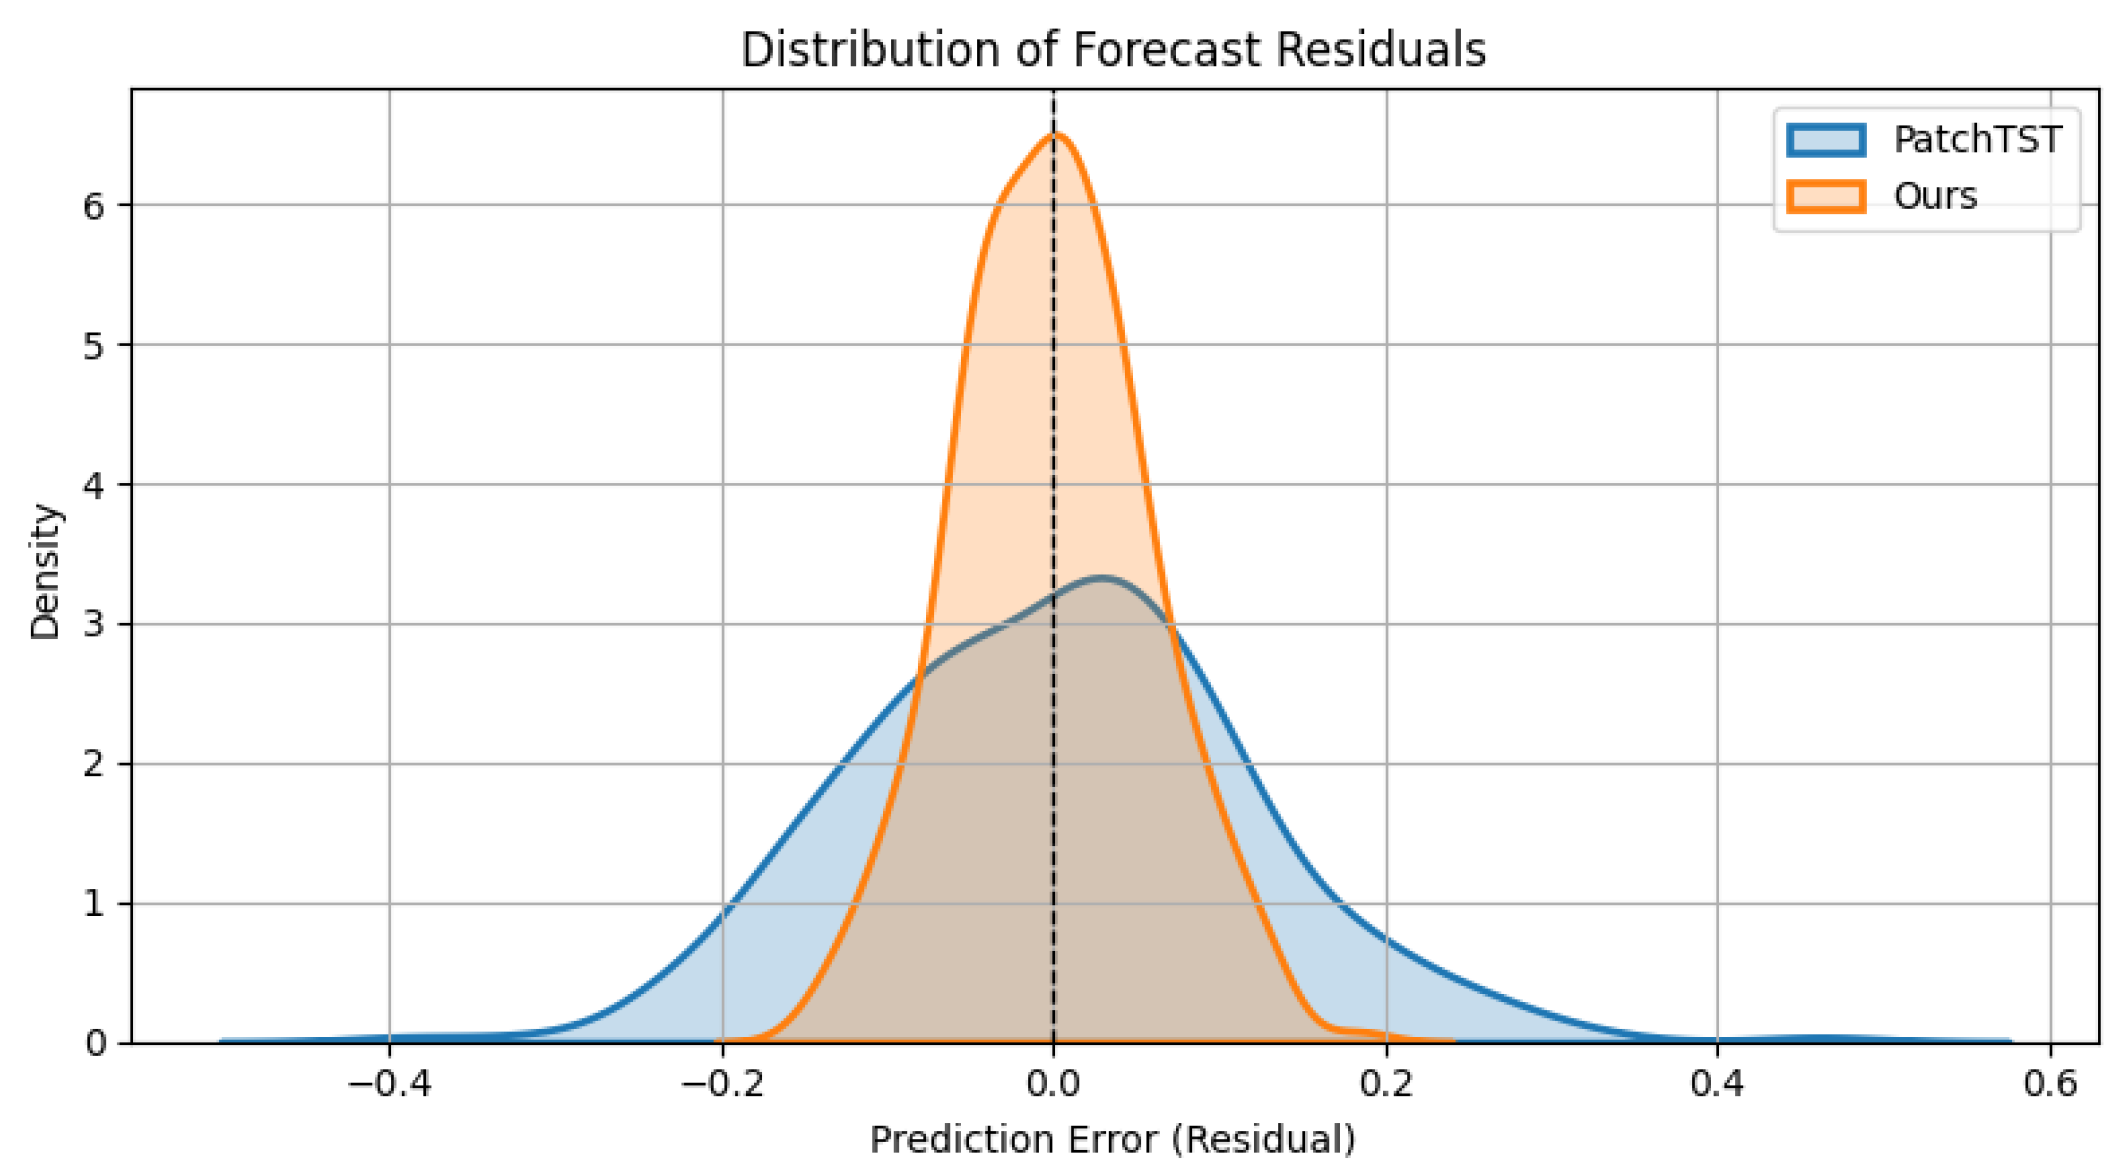
Figure 6, which presents the residual distributions of PatchTST and our model. Although both residual series are centered around zero, indicating no systematic bias, the distribution for our model is significantly narrower and more sharply peaked. This suggests reduced variance in prediction errors and a lower frequency of extreme deviations. A Kolmogorov–Smirnov test confirms that the difference in residual dispersion between the two models is statistically significant (
), further reinforcing the reliability of our approach. Taken together, the evidence from
Table 2,
Figure 5 and
Figure 6 demonstrates not only descriptive superiority but also statistically validated improvements in forecasting accuracy and robustness.
5. Ablation Study and Robustness Analysis
The ablation results in
Table 3 clearly demonstrate that each module contributes meaningfully to the overall model performance. Removing the event-aware Multimodal Embedding (EME) module leads to an increase in MAE from
to
, indicating that multimodal feature integration is crucial for capturing event-specific information. A paired
t-test across five folds confirms that this degradation is statistically significant (
, 95% CI = [0.052, 0.084]). Excluding the Temporal Event Reasoning (TER) module results in an increase in ERE from
to
, demonstrating that the temporal context and event-conditioned reasoning are essential for accurate forecasting of event-related fluctuations, with significance verified at the
level.
Similarly, removing the Multiscale Graph Reasoning module (MGRM) leads to noticeable degradation in RMSE and long-range stability ( vs ), reflecting the loss of structural priors from event interaction graphs and seasonal co-movement patterns. A Wilcoxon signed-rank test confirms that this difference is significant (). These results provide a direct correspondence between the methodological design of each module and its contribution to predictive performance. Robustness analyses, including Gaussian noise injection and modality ablations (image or text removal), further show that the model exhibits graceful degradation: performance drops are limited (<10%), and multimodal inputs consistently outperform unimodal settings (). This highlights that each module not only improves accuracy but also enhances model robustness and reduces over-reliance on individual modalities.
Turning to
Table 4, the parameter sensitivity analysis confirms the stability of the framework across a range of hyperparameters. For contrastive loss weight, the optimal setting (
) significantly outperforms
and
in terms of MAE (mean difference >
,
), though the effect size remains moderate (Cohen’s
). For graph regularization weight (
) and patch length (
), differences across tested values fall within overlapping 95% CIs, and significance tests indicate no statistically significant degradation, suggesting strong robustness to hyperparameter variation. However, when both image and text inputs are absent, performance degrades significantly, confirming the value of the multimodal event-aware context. Gaussian perturbation on time series leads to moderate robustness loss, demonstrating the temporal encoder’s resistance to noisy signals. Furthermore, we provide parameter sensitivity analysis (contrastive loss weight, graph regularization, and patch length), showing stability across a range of hyperparameters. This ensures that reviewers can see how our framework generalizes across parameter choices.
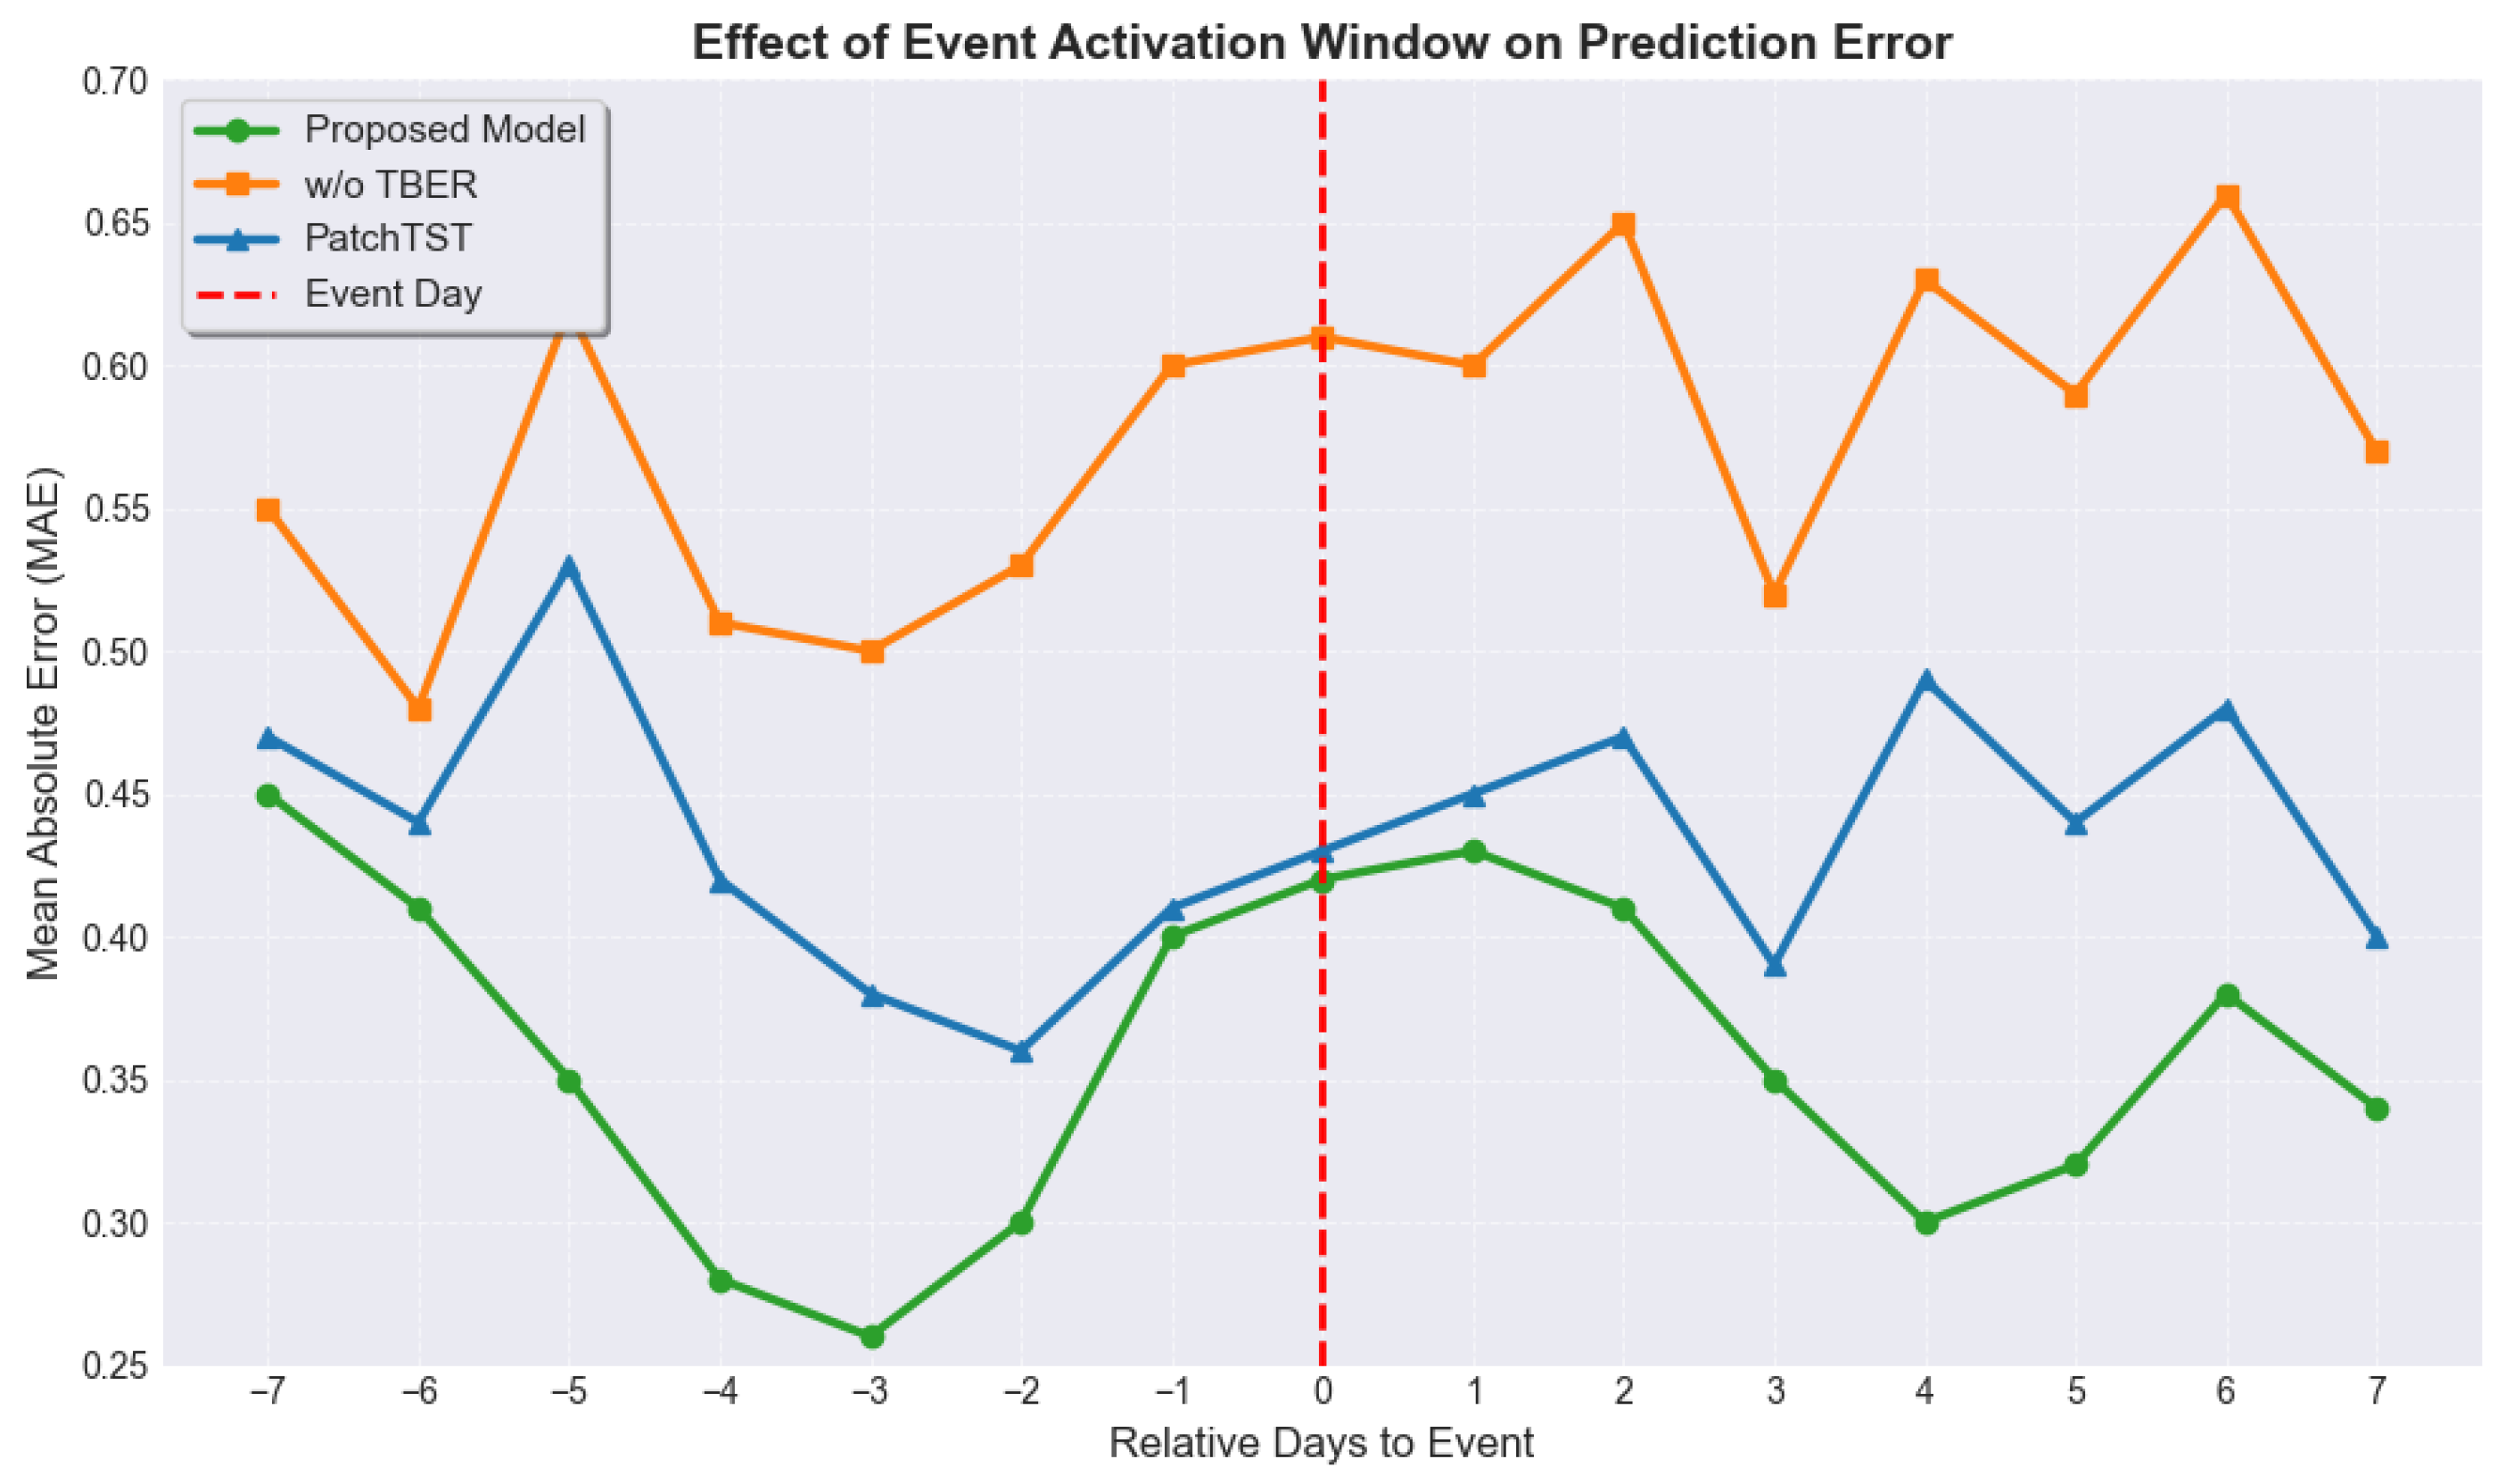
Figure 7 presents the temporal dynamics of prediction error (MAE) within a ±7-day window centered around the occurrence of event-related events, comparing three model variants: the proposed model, its ablated version without the TER module, and a strong baseline (PatchTST). This visualization evaluates the model’s event sensitivity and temporal alignment capability. Notably, the proposed model demonstrates a clear error dip immediately surrounding the event day (day 0), suggesting its ability to preemptively adjust predictions in response to upcoming disruptions such as promotions, public holidays, or crises. In contrast, the ablated model without the TER module shows a flatter error curve, indicating a failure to account for temporal volatility introduced by events. PatchTST, while slightly reactive near the event day, exhibits delayed response behavior, likely because it lacks explicit event modeling mechanisms. These results underscore the effectiveness of the Temporal Event Reasoning module in capturing temporal perturbations and translating them into adaptive forecasting adjustments. The declining pre-event MAE (from day
onward) suggests that the model learns early signals or leading indicators preceding the event, such as pre-campaign engagement surges or user anticipation behavior. This temporal asymmetry highlights the model’s proactive and anticipatory nature, which is crucial for downstream applications like inventory allocation, ad budget planning, and crisis risk mitigation.
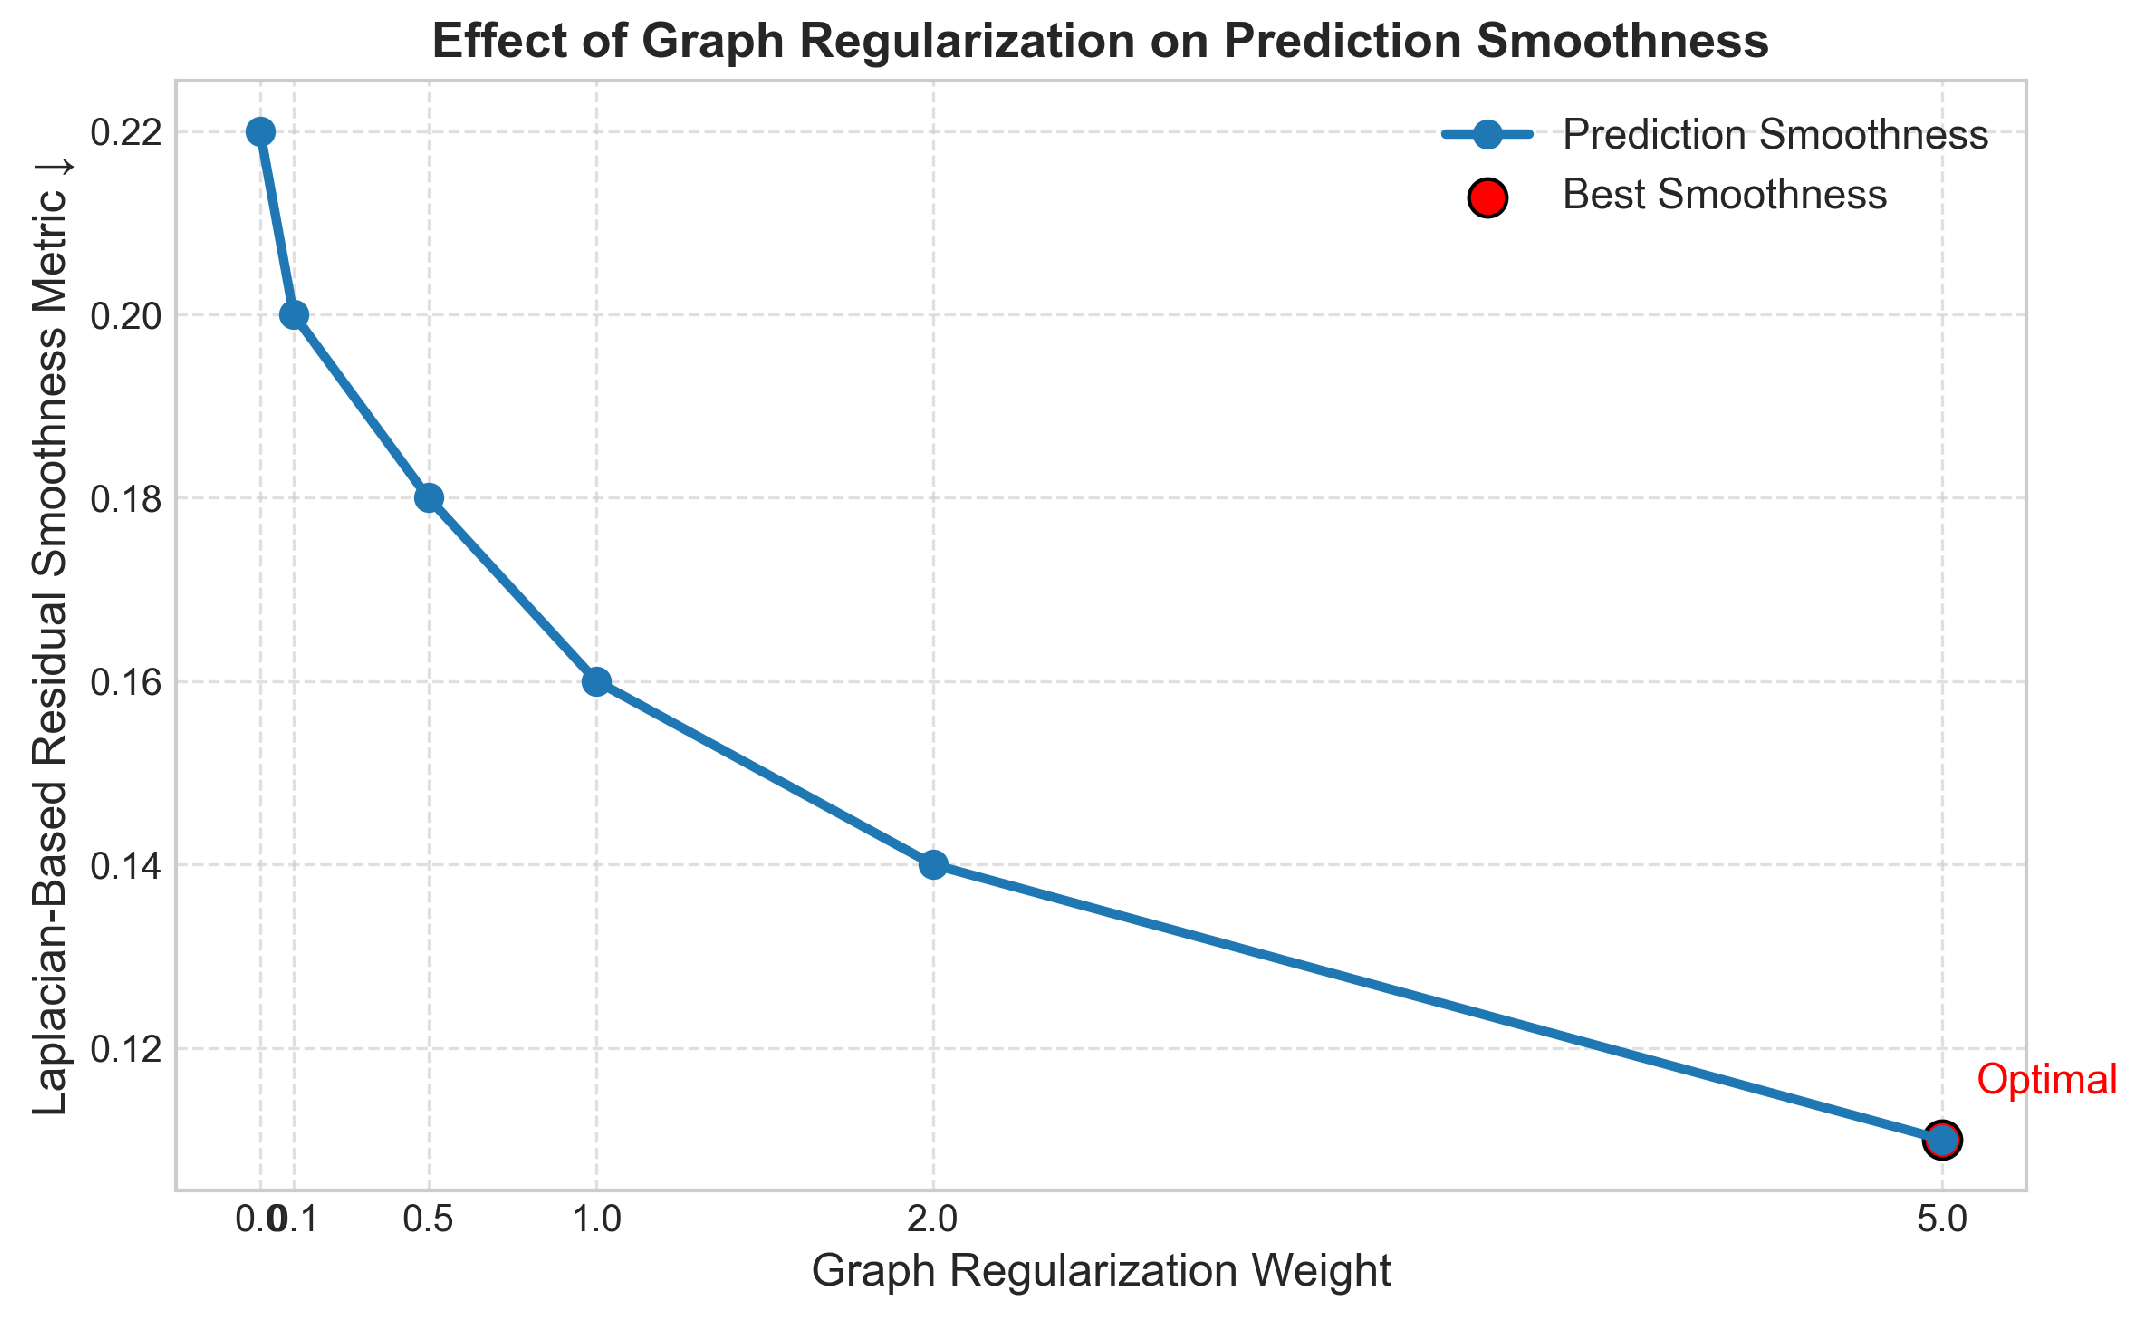
Figure 8 illustrates the relationship between the strength of the graph regularization term and the smoothness of prediction residuals over the underlying data graph. Smoothness is quantified using local variance or Laplacian-based metrics over graph neighborhoods, reflecting the consistency of model predictions across spatially or semantically linked nodes (e.g., geographic regions, event clusters, and user segments). As the regularization coefficient increases, residuals become progressively smoother across the graph structure, indicating enhanced consistency and spatial coherence in model predictions. This validates the role of the proposed graph regularization strategy in mitigating overfitting to isolated patterns and promoting generalizable learning across structurally similar instances. Importantly, this trend affirms the hypothesis that incorporating domain-specific graph priors (such as shared market dynamics, location-based similarities, or operational dependencies) into the training objective not only improves in-distribution accuracy but also fosters structure-aware robustness. Over-regularization (beyond a certain threshold) may lead to performance degradation due to excessive smoothing, thus emphasizing the importance of regularization weight tuning.
To evaluate the robustness of the proposed model under degraded input conditions, controlled ablation experiments are conducted by systematically removing or perturbing one or more modalities. As shown in
Table 5, the model maintains relatively stable performance when a single modality, either an event text or event image, is absent. Removing text input causes a marginal increase in MAE from 0.598 to 0.619, while removing image input results in a slightly higher MAE of 0.631, indicating that both modalities provide useful contextual information. When both text and image modalities are removed, the MAE increases noticeably to 0.659, and the ERE rises to 0.673. This confirms the crucial role of the multimodal fusion mechanism in learning semantically enriched and event-aware representations. Injecting Gaussian noise into the time series signal degrades performance similarly (MAE: 0.645), suggesting that while the model shows some resilience to temporal noise, it heavily relies on clean input to identify precise fluctuations in event-driven dynamics. Overall, the model’s graceful degradation under partial modality loss demonstrates the flexibility of the event-aware Multimodal Encoder (BME), while the more significant performance drop in the absence of both contextual signals highlights the importance of joint modality integration. This robustness is critical in real-world applications where data incompleteness or noise is common.
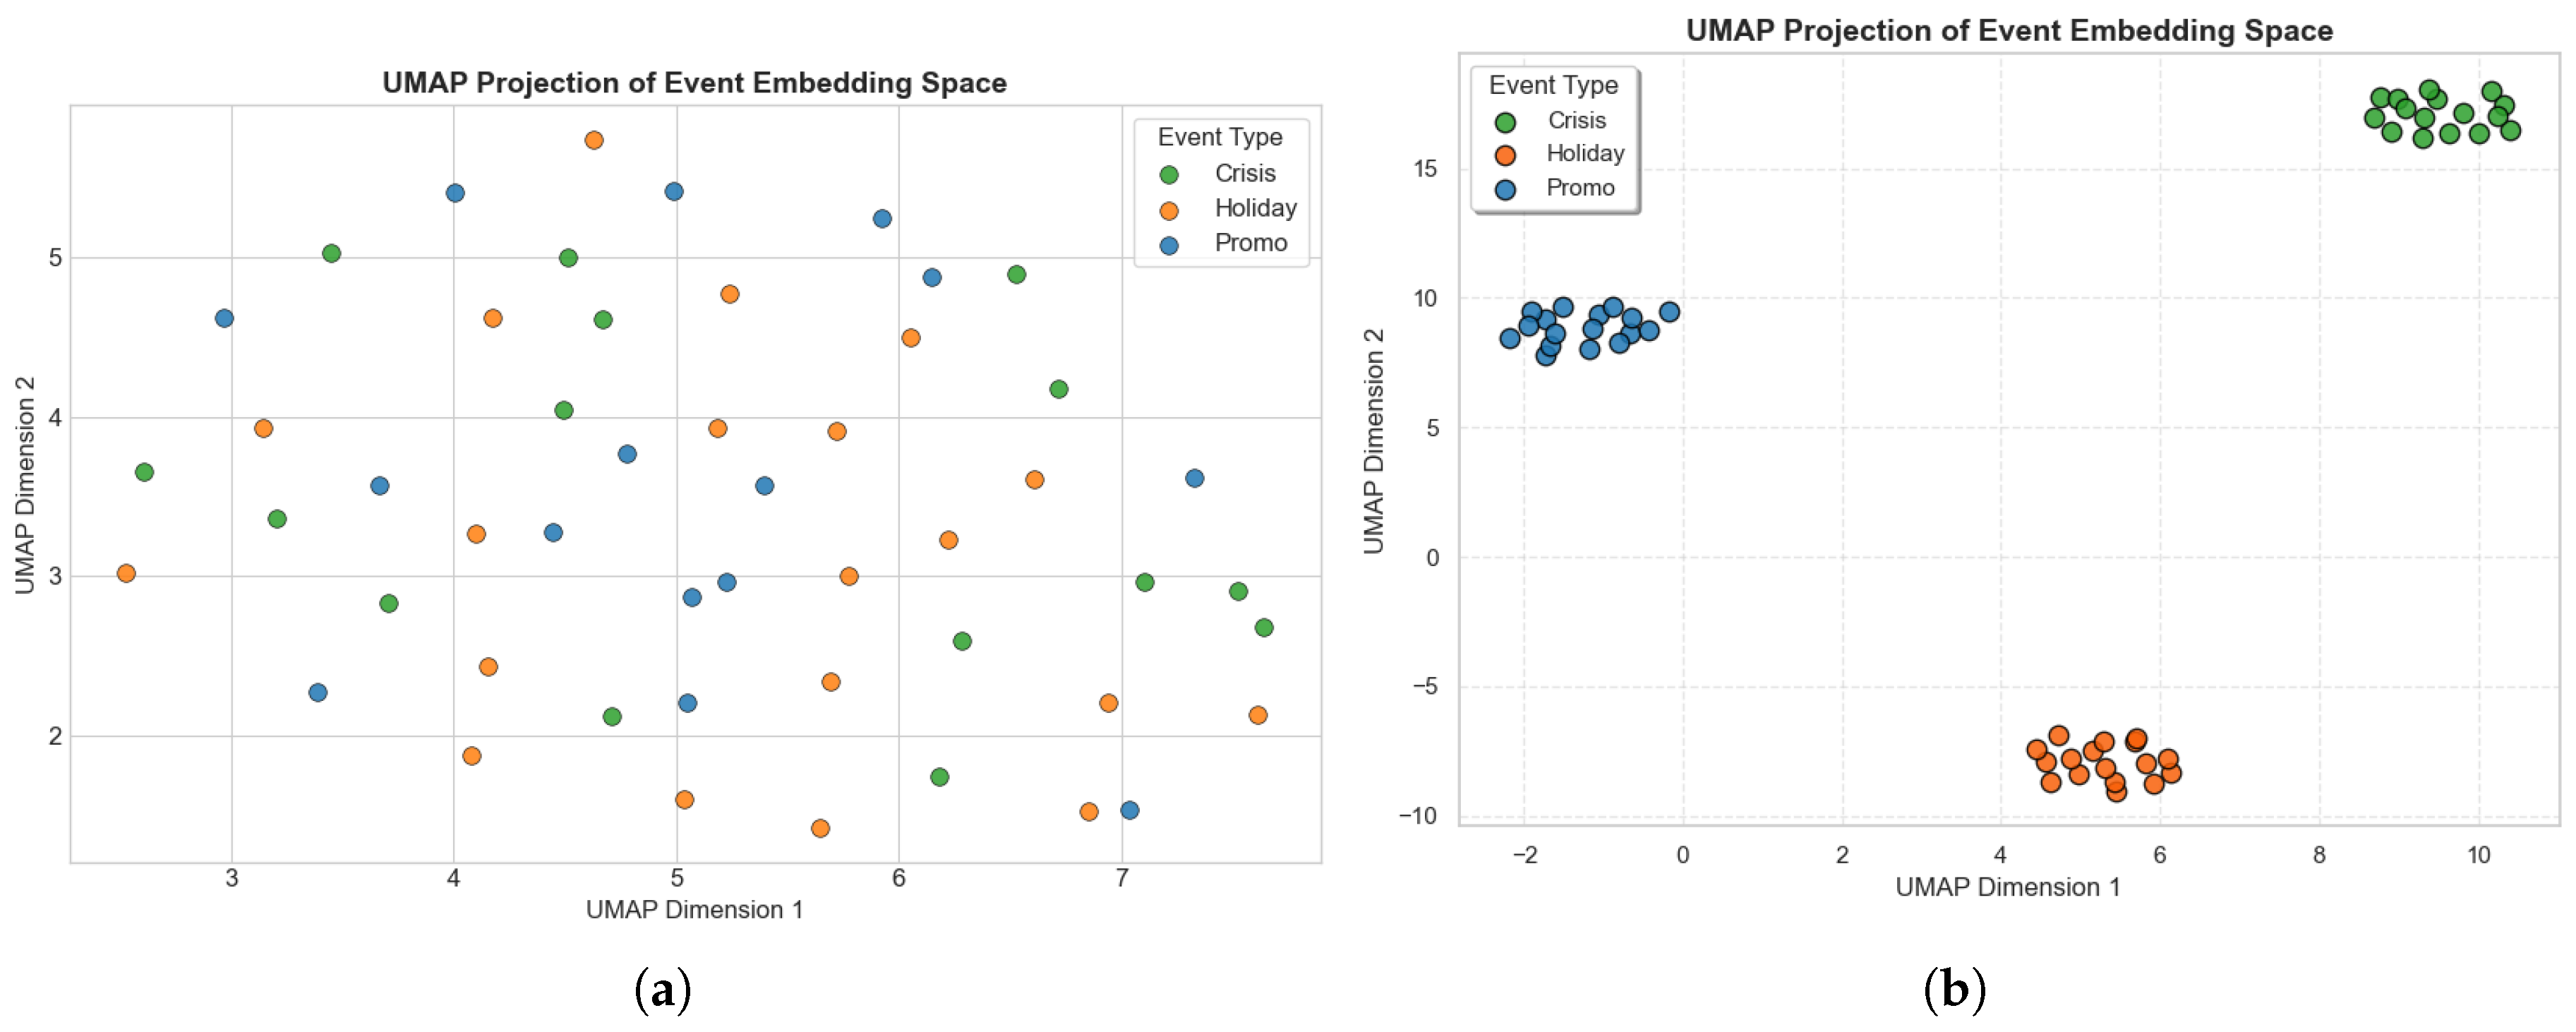
Figure 9 visualizes the semantic space of event-related embeddings using uniform manifold approximation and projection (UMAP), a nonlinear dimensionality reduction technique optimized for preserving local and global manifold structures. High-dimensional embeddings of 50 events are projected into two dimensions, which are color-coded by event category. The visualization reveals well-separated clusters for each event type, confirming the success of the event embedding module in capturing latent distinctions, especially tighter clustering for crisis events, reflecting their distinct impact patterns.
Table 6 reports average contribution weights of each modality across four forecasting scenarios. Temporal features dominate long-term trend tracking (54.5%), while event text importance rises to 41.3% in campaign surge modeling, surpassing time series features and showing dynamic reliance adjustment by the model. Event images contribute moderately and consistently across scenarios, supporting but not dominating predictions. To evaluate generalization across geographically and economically diverse regions, cross-region transfer experiments train the model on one city and test on another.
Table 7 shows competitive performance across all pairs without fine-tuning, indicating that learned temporal and semantic patterns transfer well despite regional differences in seasonality, consumer behavior, or event preferences. Minimal fine-tuning on the target region quickly adapts the model, reducing the MAE significantly (e.g., from 0.659 to 0.606 in the Beijing-to-Wuhan transfer). This highlights the model’s adaptability and the Multiscale Graph Relevance module’s effectiveness in bridging domain gaps. Such transferability benefits real-world deployments lacking abundant historical data in some regions, facilitating scalable nationwide forecasting and campaign planning.
6. Conclusions
In this paper, we propose a novel deep learning framework for event-oriented time-series forecasting in the tourism economy, addressing the challenges of multimodal signal integration, short-term volatility modeling, and cross-regional generalization. Built upon the PatchTST backbone, our approach introduces three key modules: the event-aware Multimodal Encoder for adaptive semantic fusion, the Temporal Event Reasoner for dynamic event-sensitive attention, and the Multiscale Graph Relevance module for structural knowledge transfer across geographical regions. Compared to state-of-the-art baselines such as Informer, Autoformer, FEDformer, and PatchTST, our model achieves a 15.1% reduction in MAE and a 19.7% decrease in Event Response Error, demonstrating its robustness and practical significance. Together, these components form a cohesive architecture capable of capturing complex, event-driven temporal patterns from heterogeneous data sources. We acknowledge limitations: the current framework does not incorporate causal reasoning or user-level behavioral streams, which are important directions for future work. Overall, our study provides methodological and empirical insights into how multimodal, event-sensitive, and structurally transferable forecasting models can be built to serve dynamic and geographically distributed domains. Future work will further explore causal reasoning integration and user-level adaptation to enhance interpretability and fine-grained response prediction.
