Abstract
Horizontal annular flow channels are widely applied in various fields, including thermal engineering, drilling engineering, and food engineering. Investigating their internal flow patterns is crucial for optimizing pipeline design, selecting appropriate equipment, and understanding the sedimentation and migration modes of multiphase flows within annular geometries. In practical engineering applications, the operational conditions of annular flow channels during gas drilling are the most complex, involving parameters such as eccentricity, rotation, surface roughness, and multiphase flow interactions. This study focuses on the flow characteristics of horizontal annular channels under real-world engineering conditions, examining variations in operational parameters. The pressure drop in annular pipelines is influenced by factors such as flow velocity, eccentricity, and rotational speed, exhibiting complex variation patterns. However, previous studies have not fully considered the impact of rough wellbore walls and the interactions among various factors. Employing experimental methods, this research analyzes the pressure drop characteristics within annular geometries. The results reveal that surface roughness significantly affects pressure drop, with the inner pipe’s roughness having a greater impact when the outer pipe surface is rough compared to when it is smooth. An increase in eccentricity substantially reduces pressure drop, with both positive and negative eccentricities demonstrating symmetric pressure drop patterns. Moreover, a significant positive correlation exists between the total rough area of the annular channel and pressure drop. Furthermore, this study establishes a predictive model through dimensional analysis. Unlike existing models, this new model incorporates the influences of both roughness and eccentricity, achieving a prediction accuracy of over 99%. This research confirms the critical role of roughness in annular flow systems and provides practical implications for selecting more reliable pump power equipment in engineering fields.
1. Introduction
Annulus channels are used in various fields such as food engineering, thermal engineering, and drilling engineering. The study of the flow laws within them is beneficial for pipeline optimization and equipment selection. It also plays an important role in the research on deposition and migration laws in annulus multiphase flow. In practical engineering, the annulus channels in gas drilling are the most complex due to conditions such as eccentricity, rotation, and roughness. It has become an advantageous solution because it can increase speed and is environmentally friendly. This paper focuses on the flow characteristics of horizontal annulus channels in gas drilling while considering the variations in working conditions, aiming to enhance our understanding of such complex annulus channels.
Macroscopic flow characteristics of annulus channels are studied more extensively in engineering practice. Estimating friction pressure loss accurately is crucial for pump capacity design and maintaining pressure drop within margins [1]. Studies have been conducted on the influence of eccentricity, rotational speed, and flow velocity on pressure drop and the friction resistance coefficient. Due to the most complex conditions in drilling engineering, annulus channels involve relatively sufficient research, especially for positive eccentricity and rotation.
Numerous studies have focused on the eccentricity of the inner tube. Khatibi et al. [2] found that a higher eccentricity of drill pipe provides a lower friction coefficient in the case of single-phase liquid flow. Dokhani et al. [3] found that the eccentricity of the drill pipe can significantly reduce annulus pressure loss. Nouri et al. [4] studied the flow of Newtonian and non-Newtonian fluids in concentric and eccentric annuli and found that the friction resistance coefficient decreases as eccentricity increases. Under positive eccentricity operating conditions, as the eccentricity increases, both the friction resistance coefficient and the pressure drop show a decreasing trend, and this conclusion is mutually consistent [5,6,7]. However, there are few studies on upward eccentricity of horizontal pipes, which is referred to as negative eccentricity, and its impact on pressure drop needs to be investigated.
For conventional drilling fluid drilling, several researchers have studied the influence of drill string rotation on annulus pressure drop. They [7,8,9,10,11,12,13] observed that the pressure drop increases with increasing drill string rotation, while Hansen and Sterri [14] reported the opposite behavior. Movahedi and Jamshidi [15] found that drill string rotation reduces pressure drop in the case of drilling fluid.
At the same time, many scholars believe that the trend of pressure loss changes with drill string rotation is inconsistent [11,16,17,18]. Therefore, there is inconsistency in describing the impact of inner tube rotation on the pressure loss experienced by Newtonian and non-Newtonian flows in concentric and eccentric annuli. The rotational speed of the drill string is a very complex influencing factor and has not been uniformly understood in research, which also makes the interaction between rotational speed, eccentricity, and roughness to be studied. The laws for conventional drilling are inconsistent, and the impact of gas drilling rotation needs to be studied.
However, the impact of roughness on pressure drop in annulus channels has rarely been reported. Some scholars have pointed out that roughness has a significant influence in practical engineering and should be taken into account. Lyons et al. [19,20] noted that the reason why the Angel model yields results smaller than actual field data is that it uses the flow friction coefficient from smooth pipes to calculate the flow in rough open-hole sections. Ytrehus et al. [21] considered two-phase flow problems in both smooth and rough pipes, pointing out that in highly deviated wellbores, rough well walls have a significant impact on pressure drop measurements and hole cleaning efficiency, with smooth casing walls exhibiting lower pressure drops. Zhu & Liu [22] discovered through experimental and theoretical research on gas injection rates in gas drilling of horizontal wells that visual simulations of well walls made of plexiglass do not accurately represent actual well wall conditions. Dykes [23] explicitly recommended considering roughness in his outlook on research into cuttings transport issues. Therefore, for rough pipes, predictions may underestimate the frictional pressure drop in turbulent flow, necessitating thorough research on rough annuli in turbulent conditions.
In summary, for gas flow pipelines in horizontal annuli, roughness, negative eccentricity, and rotation need further study. The influence of interactions between parameters on pressure drop is more consistent with actual engineering application scenarios. Based on this, this paper delves into the aforementioned issues, conducting comprehensive experimental research on the pressure drop in horizontal annuli with respect to air flow rate, eccentricity and rotational speed of the drill pipe, as well as the roughness of the inner and outer wall surfaces.
2. Experimental Methods and Procedures
2.1. Experimental Platform
The schematic design of the experimental setup is shown in Figure 1. The Schematic diagram of experimental device is shown in Figure 2. The main parameters are as follows: a combination of any lengths up to 8 m, a transparent glass tube with an outer diameter of 110 mm, and an aluminum tube with an inner diameter of 65 mm. The fan flow rate is 0–400 m3/h, which can be continuously and steplessly adjusted via a Variable-Frequency Drive (VFD, of the brand CHNT, with the model number NVF2G-3.7 KW. It has a power rating of 3.7 kW and a frequency range of 0–50 Hz); the inner tube rotational speed is 0–200 r/min, also adjustable via a VFD; eccentricity can be adjusted up to ±90%; both the transparent glass tube and aluminum tube can be rough with roughness values of 1 mm and 0.25 mm, respectively, allowing for four combinations of rough and smooth surfaces, as detailed in Table 1. The differential pressure sensor used is the HY-130 model with a precision of 0.25% FS. The flow path of the air fluid is injected from the fan, passing through a vortex flowmeter to measure the flow rate of the injected gas. The gas is injected from the bottom of the annulus and discharged from the front end through the annular space. Under operating conditions adjusted to each combination of parameters, measurements of flow patterns are conducted. In accordance with the parameter ranges for gas drilling operations proposed by Lyons et al. [19,20], the parameter ranges for the experimental study in this paper are determined as follows: flow velocity ranging from 8 to 13 m/s, an eccentricity of ± 0.9, and roughness ranging from 0 to 1.25.
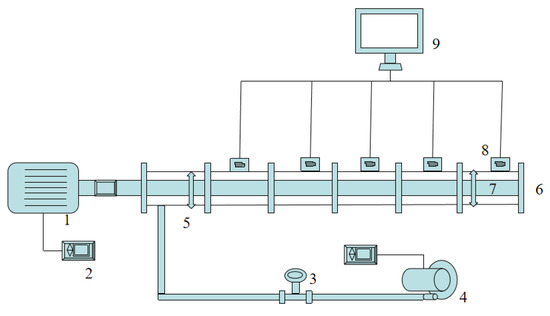
Figure 1.
Schematic Diagram of the Experimental Setup. 1. Electric Motor; 2. Frequency Converter; 3. Flowmeter; 4. High-Pressure Blower; 5. Eccentric Device; 6. Outer Annulus Pipe; 7. Inner Annulus Pipe; 8. Differential Pressure Transmitter; 9. Data Acquisition System.
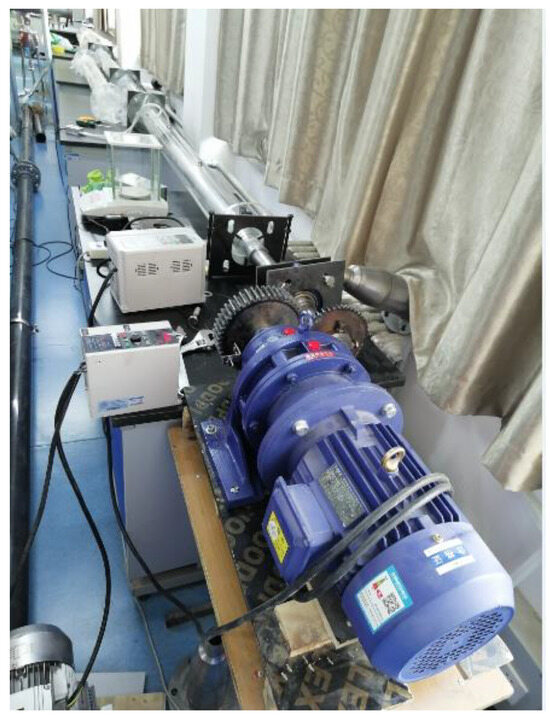
Figure 2.
Schematic diagram of experimental device.

Table 1.
Quantitative analysis of uncertainty in measurement instruments.
To demonstrate the rigor of the entire experimental process, a quantitative analysis of the uncertainty associated with the experimental instruments is presented in this study, as detailed below in Table 1.
(1) The combined standard uncertainty is determined considering the differential pressure transmitter and the data acquisition system as independent error sources:
In summary, through calibration drift control and uncertainty quantification, this study has further ensured the reliability of the measurement results of annulus pressure drop, meeting the requirements of quantitative research.
(2) Uncertainty Propagation and Synthesis: The theoretical model for ΔP is based on the eccentric annulus flow formula:
(where Re represents the Reynolds number, Dh is the hydraulic diameter, and u is the flow velocity). Uncertainty propagation adheres to the principle of taking the square root of the sum of the squares of relative errors. The specific steps are as follows:
(i): Synthesis of Direct Measurement Uncertainties: The differential pressure transmitter and the data acquisition system are independent error sources, and their combined standard uncertainty is
Compared with other experimental studies on roughness related to partial sand bonding treatment at the bottom of the annulus [24,25], this paper adopts rough inner and outer pipes for throughout the annulus to achieve full development of turbulence under rough wall conditions. Simultaneously, research on flow characteristics is conducted in the fully developed well section.
(ii): Uncertainty Propagation for Correlated Parameters: Through propagation from D, d, and e, we obtain un(A) = 1.2 × 10⁻⁶ m2. Substituting a flow rate of 300 m3/h and A = 0.005 m2, we get un(u) = 0.03 m/s, with a relative error of un(u)/u = 0.5%.
Contributions from rotational speed n and geometric parameters: Experimental fitting shows that the correlation exponent b between ΔP and n is approximately 0.1, with a relative error contribution of (b × u (n)/n)2 ≈ 2.5 × 10⁻⁹. The combined relative error contributions from geometric parameters (D, d, e, L) total less than 0.03%, both of which are significantly smaller than the direct measurement errors and can thus be neglected.
(iii): Overall Synthesis and Expanded Uncertainty: taking a typical measurement point with ΔP = 2 kPa as an example, the combined standard uncertainty is
Taking a coverage factor k = 2 (corresponding to a confidence level of 95%), the expanded uncertainty is
That is, the measurement result of ΔP can be expressed as ΔP = (2.000 ± 0.022) kPa (k = 2).
In summary, through calibration drift control and uncertainty quantification, this study has further ensured the reliability of the annulus pressure drop measurement results, meeting the requirements for quantitative research.
The characteristics of wellbore roughness can be observed through underground television, there are numerous depressions in the wellbore that can capture particles [26]. Figure 3 is a schematic diagram of wall roughness.
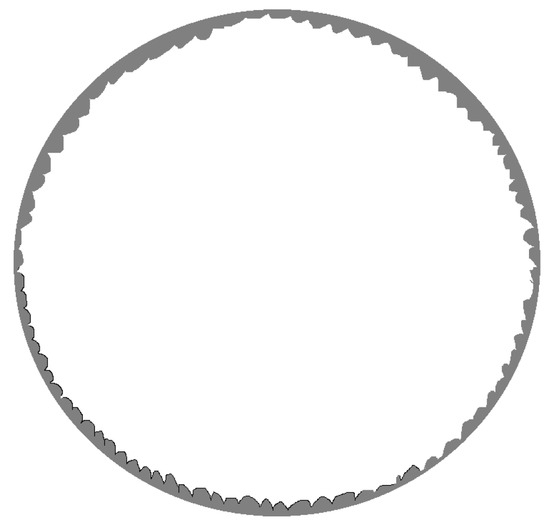
Figure 3.
Schematic diagram of wall roughness.
As shown in Figure 4, the roughness of the outer pipe is achieved by uniformly distributing particles with a size of 1 mm on the outer pipe wall, simulating the roughness of an open hole wall. This roughness is also within the range of roughness given in Lyons et al. [19,20]. At the same time, in drilling engineering, it is customary to use the equivalent diameter of rock cuttings to approximate the roughness of the wellbore [27], and the particle size of 1 mm is also within the measured particle size range, which is also a particle size adopted by most scholars [28,29].
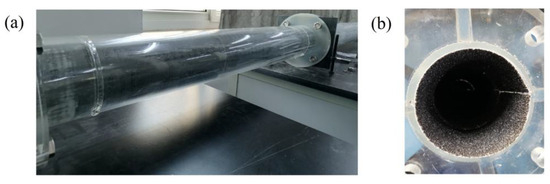
Figure 4.
Physical drawing of outer pipe roughness produced. (a) Whole rough pipe. (b) inner wall of the pipe.
The surface roughness of commercial steel pipe given in William C.lyons’ book is 0.046 mm [19,20], as shown in Figure 5. In this paper, the value is increased by an order of magnitude to 0.25 mm, which is within the weighted average roughness range of open hole and commercial drill pipe in annulus, so as to study the influence of inner pipe roughness on annulus flow.
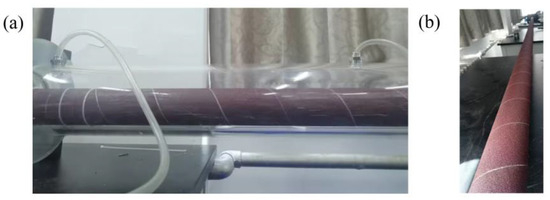
Figure 5.
Physical drawing of inner pipe roughness produced. (a) Inner tube in the annulus. (b) Rough treatment of inner pipe wall.
2.2. Test Procedure
(i) Start up to check the air tightness of the pipeline, zero and calibrate the instruments.
(ii) Calibrate the speed control motor and flow rate control fan, and establish the relationship between VFD frequency, speed and flow rate, so as to realize the control and adjustment of drill pipe speed and fan flow rate.
(iii) Calibrate the eccentric device, adjust the height of the eccentric device, and calibrate the eccentricity.
(iv) Adjust the initial state, determine the fully developed turbulent section, and measure and record the pressure drop data in the fully developed turbulent section.
(v) Adjust the eccentricity, speed and flow rate, and measure and record the pressure drop under all experimental conditions.
(vi) Replace the smooth and rough inner and outer pipes to achieve the transition among four working conditions: smooth inner pipe–smooth outer pipe, smooth inner pipe–rough outer pipe, rough inner pipe–smooth outer pipe, and rough inner pipe–rough outer pipe. Then, repeat the processes described in (i)–(v) above.
2.3. Calibration
The flow rate mainly uses the fan and frequency converter to inject gas and regulate the flow. The flow measurement is indicated by the vortex flowmeter. The flow measurement system is shown in Figure 6a. The frequency converter displays the frequency reading and adjusts the frequency of the frequency converter. When the flow rate of the fan changes, the vortex flowmeter displays the reading accordingly. Therefore, the frequency of the frequency converter is used to calibrate the flow of the vortex flowmeter. The calibration curve is shown in Figure 6b.
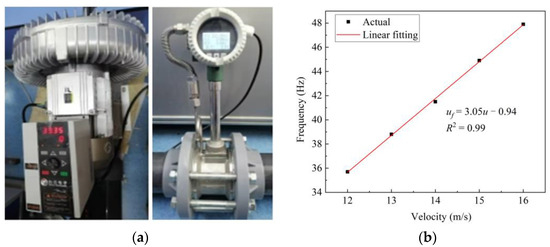
Figure 6.
Gas injection system and its calibration. (a) Flow rate control system. (b) Flow rate calibration curve.
The rotation speed is mainly driven and adjusted by the motor and frequency converter. The measurement of the rotation speed is indicated by the hall sensor. The rotation speed measurement system is shown in Figure 7a. The frequency converter displays the frequency reading, adjusts the frequency of the frequency converter, changes the rotation speed of the motor, and the hall sensor displays the reading accordingly. Therefore, the frequency of the frequency converter is used to calibrate the rotation speed of the motor. The calibration curve is shown in Figure 7b.
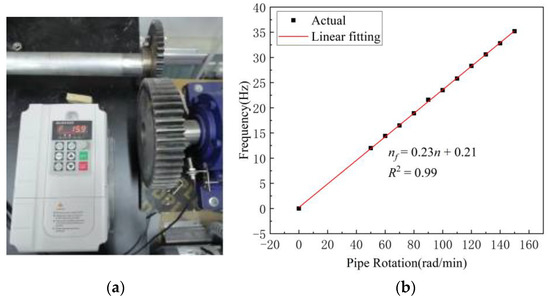
Figure 7.
Rotating system and its calibration. (a) Rotation speed control system. (b) Rotation speed calibration curve.
2.4. Determination of Turbulence Fully Developed Section
In this study, we employ the pressure drop measurement technique to quantify the pressure drop within the fully developed flow region. As shown in Figure 8, in the test section close to the exit, five measuring points (P0, P1, P2, P3 and P4) are selected with an adjacent interval of 0.5 m. The pressure drop is measured. According to the measurement diagram, the pressure drop measured at p12 and P13 is very close, which show that turbulence has developed and stabilized. Therefore, p12 is selected as the measurement position for the overall experimental condition.
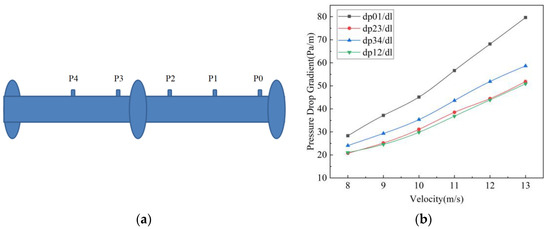
Figure 8.
The position of the fully developed section is determined through the measurement of pressure drop. (a) Actual position of pressure measuring point. (b) Pressure drop gradient relationship curve for each pressure measuring position.
2.5. Repeatability of Experimental Platform
The fluid velocity ranged from 8 m/s to 13 m/s. The temperature condition during the experiment was 30 °C, under which the fluid properties were determined as follows: the air density was approximately 1.18 kg/m3, and the kinematic viscosity was approximately 185.5 mPa·s. Further calculations yielded a Reynolds number range between 22,900 and 37,213. Under the experimental conditions, each data point may have some uncertainty, so it is necessary to repeat the experiment to reduce the experimental error to ensure that the experimental results are reliable [30,31]. In order to ensure the repeatability of the measurement, the smooth and rough pipeline were tested at the same flow rate three times. The results are shown in Figure 9.
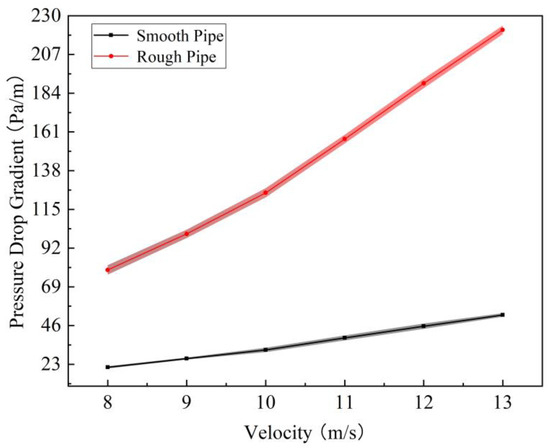
Figure 9.
Experimental repeatability verification of smooth tube and rough tube.
It can be seen from Figure 9 that the results of each experiment are consistent, and the error is within 3%, which shows that the experiment has good repeatability.
Table 2 presents the error analysis regarding experimental reproducibility.

Table 2.
Analysis of quantitative mean values and standard deviations.
3. Results and Discussion
The characteristics of the pressure drop in the horizontal annulus adopt mainly the comprehensive study of parameter interaction. The roughness experiment of the inner and outer tubes has been carried out under four working conditions, as shown in Table 3:

Table 3.
The experiment conditions of the inner and outer.
3.1. The Interplay Between Flow Velocity and Eccentricity Under Four Operating Conditions
As depicted in Figure 10, the pressure drop increases with the rise in flow velocity. When the drill pipe exhibits a downward positive eccentricity, the pressure drop decreases as the eccentricity increases, adhering to the same trend observed during conventional drilling [6]. In cases of both positive and negative eccentricities, as well as centered positions, the centered configuration exhibits the highest pressure drop. Notably, the variation patterns for negative and positive eccentricities are identical, with both showing a decrease in pressure drop as eccentricity increases. This aligns with the conclusion drawn from conventional drilling that eccentricity leads to a reduction in pressure drop [6]. Furthermore, when the eccentricities are equidistant from the center, the pressure drops are nearly identical. In other words, the impact of vertical eccentricities on pressure drop is symmetrical compared to the centered position.
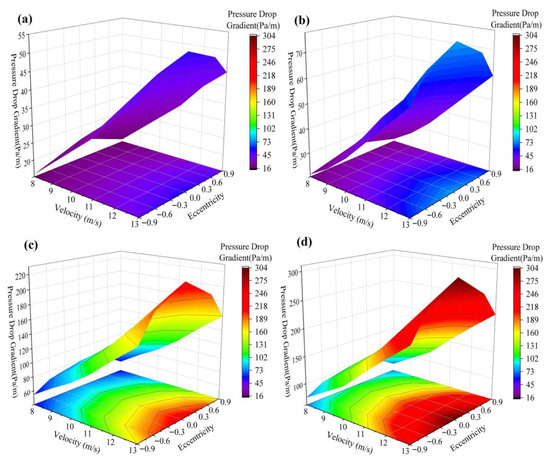
Figure 10.
The interplay between flow velocity and eccentricity under four different operating conditions (a) Case I, (b) Case II, (c) Case III, (d) Case IV.
Quantitatively analyzing the data, for Case I, at flow velocities of 9 m/s, 11 m/s, and 13 m/s, the pressure drop increases with increasing flow velocity. When the eccentricities are 0.6 and −0.6, the pressure drop decreases by an average of 10%, 6.82%, and 6.67%, respectively, compared to the centered position. At eccentricities of 0.9 and −0.9, the reductions are 16.67%, 18.18%, and 16.67%, respectively. For Case II, at eccentricities of 0.6 and −0.6, the average reductions are 12.5%, 9.68%, and 9.09%, while at eccentricities of 0.9 and −0.9, the reductions are 26.25%, 22.58%, and 23.86%, respectively. In Case III, with symmetrical eccentricities of 0.6 and −0.6, the average reductions are 11.4%, 12.08%, and 11.71%, and at eccentricities of 0.9 and −0.9, the reductions are 27.63%, 28.09%, and 27.78%, respectively. For Case IV, at eccentricities of 0.6 and −0.6, the average pressure drop reductions are 11.18%, 12.81%, and 12.72%, and at eccentricities of 0.9 and −0.9, the reductions are 26.97%, 27.27%, and 27.46%, respectively.
Based on the aforementioned qualitative and quantitative analyses, it can be inferred that when the drill pipe is in a concentric position, the pressure drop reaches its maximum value, whereas any eccentricity results in a reduction in pressure drop. Therefore, it is recommended to consider the influence of the symmetry of eccentricity and its interaction effects in drilling engineering. The specific mechanistic explanations are presented in the authors’ previous studies [32].
3.2. The Interaction Between Rotational Speed and Flow Velocity Across Four Distinct Operating Scenarios
As illustrated in Figure 11, the pressure drop gradient increases with the rise in flow velocity, with roughness being the primary controlling factor. From a quantitative analysis across the four operating conditions, at flow velocities of 9 m/s, 11 m/s, and 13 m/s, Case II exhibits an increase in pressure drop gradient of 35.05%, 36.68%, and 45.65%, respectively, compared to Case I. Similarly, Case III shows increases of 285.9%, 300.6%, and 317.1%, and Case IV demonstrates increases of 417.5%, 448.9%, and 476.4%, when compared to Case I. Under the combined influence of rotational speed and flow velocity, it is the flow velocity that primarily drives the increase in pressure drop gradient, while the pressure drop gradient remains largely unaffected by variations in rotational speed. Minor fluctuations in pressure drop may be attributed to the swaying of the drill string. Regarding pressure fluctuations caused by drill string swaying, similar observations have been reported in studies by other scholars. Khatibi et al. [2] found that, in environments where drilling fluid serves as the working fluid, the drill pipe tends to exhibit a jumping tendency due to the intense turbulence present in axial flow.
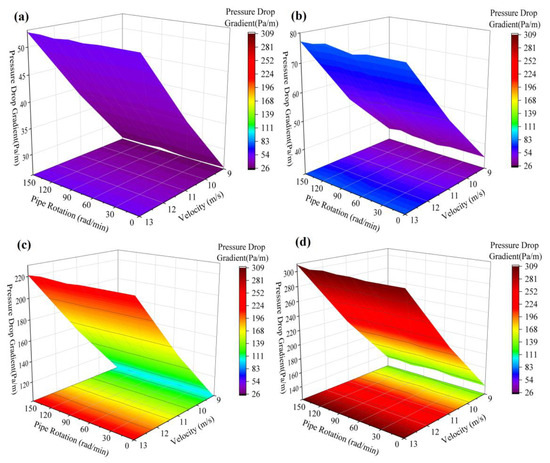
Figure 11.
The interaction between rotational speed and flow velocity under four distinct operating conditions (a) Case I, (b) Case II, (c) Case III, (d) Case IV.
3.3. The Interaction Between Rotational Speed and Eccentricity in Four Specific Operating Conditions
As can be seen from Figure 12, the pressure drop gradient decreases as the eccentricity increases. Roughness plays a dominant role in this phenomenon. A quantitative analysis across the four operating conditions reveals that, at eccentricities of 0, 0.6, and 0.9, Case II exhibits increases in pressure drop gradient of 45.65%, 42.19%, and 33.7%, respectively, compared to Case I. Similarly, Case III shows increases of 317.1%, 295.1%, and 245.2%, and Case IV demonstrates increases of 475.5%, 443.7%, and 382.7%, when compared to Case I. Under certain drill pipe deflection scenarios, the impact of rotation on pressure drop is negligible, which contrasts sharply with the conventional laws observed in drilling fluid drilling [17,18]. Minor fluctuations in pressure drop are associated with the swaying caused by drill pipe rotation. There are two primary reasons for these fluctuations in pressure loss: the oscillatory motion of the drill pipe (which decreases with increasing rotational speed) and the annular vortex flow (which intensifies with increasing rotational speed). Turbulent vortex flows result in uneven flow velocities and generate random upward and downward force pulses, which are currently difficult to detect using existing equipment [22].
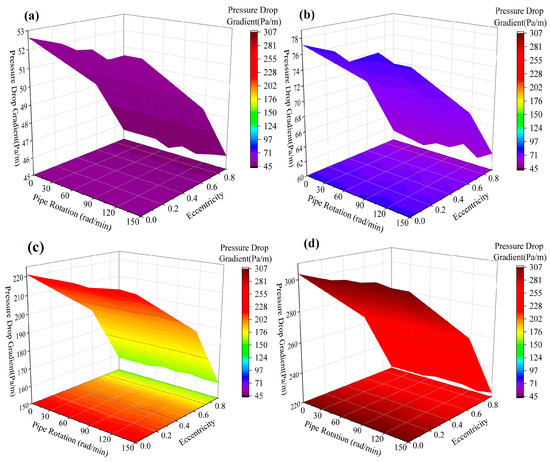
Figure 12.
The interaction between rotational speed and eccentricity under four specific operating scenarios (a) Case I, (b) Case II, (c) Case III, (d) Case IV.
3.4. Internal Roughness Effect
Figure 13 shows the effect of inner pipe roughness under different eccentricities. Due to advanced manufacturing technology, the drill pipe exhibits a low surface roughness, typically 0.00015 ft. This result uses the actual aluminum pipe and the rough pipe with 0.25 mm sand adhered outside the aluminum pipe, so as to compare the impact of the increase in the roughness of drill pipe. Within this range of roughness, the increase in pressure drop caused by roughness is significant.
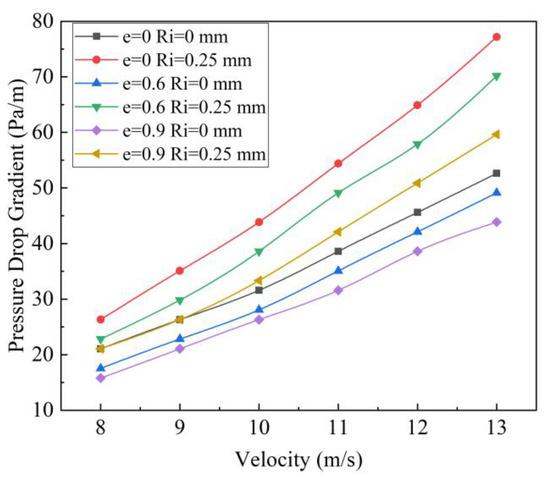
Figure 13.
Pressure drop characteristics of smooth and rough inner tubes with different eccentricities.
From the standpoint of quantitative analysis, the trends in pressure drop variations can be summarized as follows: In scenarios where the inner pipe is centrally positioned and features a roughness measurement of 0.25 mm, the pressure drop experienced at peak flow velocity exhibits a notable increase of 46.67%, while the average pressure drop across a range of flow velocities expands by 37.85%. When the eccentricity is set at 0.6, the pressure drop at maximum flow velocity experiences a substantial growth of 42.86%, accompanied by a 36.43% surge in the average pressure drop across different flow rates. As the eccentricity climbs to 0.9, while the pressure drop at peak flow velocity still demonstrates a significant rise of 36%, the average pressure drop across varying flow velocities increases by a more modest 31.02%. These observations clearly indicate that the influence of roughness on pressure drop diminishes as eccentricity increases. Furthermore, it becomes apparent that higher flow velocities exert a more pronounced impact on pressure drop.
3.5. Effect of External Roughness
Figure 14 shows the effect of outer pipe roughness under different eccentricities. From the perspective of drilling practice, the roughness of borehole wall must exist. Transparent acrylic tubes are commonly used in indoor experiments. so that the micro quantity of flow field can be measured and the cleanliness in the well can be observed. In order to study the effect of the actual roughness of the borehole wall on the pressure drop, the PMMA tube borehole wall and the rough borehole wall adhered with 1 mm sand particles were carried out. It can be seen from Figure 14. that within this range, the influence of roughness is very significant.
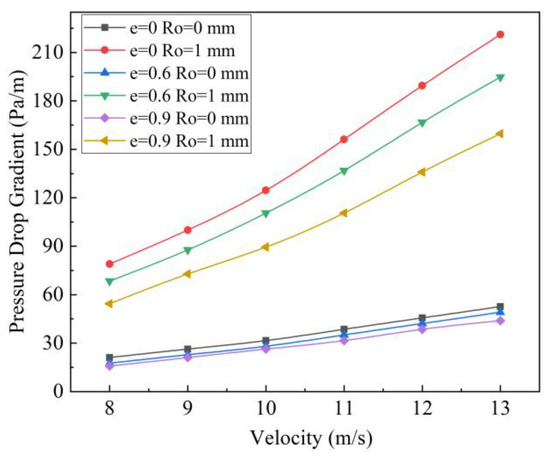
Figure 14.
Pressure drop characteristics of smooth and rough outer tubes with different eccentricities.
From a quantitative viewpoint, under conditions where the inner pipe is centrally located and the outer pipe possesses a roughness of 1 mm, the pressure drop achieved at peak flow velocity is a remarkable 3.2-fold increase compared to that observed in a smooth outer pipe. Similarly, when considering the average pressure drop across a spectrum of flow velocities, this figure stands at 2.98 times that of a smooth outer pipe. In scenarios where the eccentricity is set at 0.6, the pressure drop at maximum flow velocity surges to 2.96 times that of a smooth pipe, with the average pressure drop across different flow rates being 2.92 times higher. As the eccentricity escalates to 0.9, while the pressure drop at peak flow velocity still experiences a significant increase, amounting to 2.64 times that of a smooth pipe, the average pressure drop across varying flow velocities moderates slightly to 2.49 times. This data underscores a notable trend: as the degree of eccentricity intensifies, the influence of roughness on pressure drop diminishes accordingly.
It can be seen from Figure 14 that with the increase in flow rate, the impact on pressure drop in the rough annulus pipeline is very significant, which is consistent with the rule found in the drilling fluid by Rushd et al. [33].
3.6. Comparison of Four Rough Working Cases
As shown in Figure 15, the comparison of the four rough working conditions shows that, regardless of the roughness, the increase in flow rate is the dominant factor for the increase in pressure drop, and with the increase in flow rate, the impact on pressure drop is increasing. When the outer tube is smooth, the roughness of the inner tube has little effect on the pressure drop. However, when the outer tube is rough, the influence of the inner tube roughness on the pressure drop is obviously larger, and this increasing trend shows a non-linear increase with increasing flow velocity. With the increase in the total rough area, the pressure drop increases, and it basically increases linearly at low flow rate and low rough area.
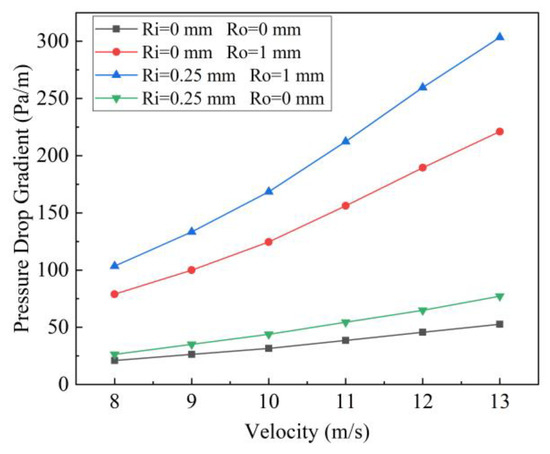
Figure 15.
Pressure drop characteristics under four working cases.
From a quantitative analysis standpoint, under the condition of a centrally located inner tube: When the roughness of the inner tube is 0.25 mm, the pressure drop at the maximum flow rate increases by a factor of 0.47, and the average pressure drop across various flow rates increases by a factor of 0.38. In the case where the roughness of the outer tube is 1 mm, the pressure drop at the maximum flow rate escalates by a factor of 3.20, and the average pressure drop at different flow rates rises by a factor of 2.98. When both the inner tube roughness is 0.25 mm and the outer tube roughness is 1 mm, the pressure drop at the maximum flow rate surges by a factor of 4.77, and the average pressure drop at various flow rates augments by a factor of 4.38.
By synthesizing the insights derived from both the qualitative and quantitative analyses presented in Figure 13, Figure 14 and Figure 15, we can conclude that the pattern of pressure drop variations is fundamentally linked to the interplay between the fluid and the pipe wall. From the perspective of fluid mechanics, the reason for the increased pressure drop when both the inner and outer pipes are rough, compared to their smooth state, can be explained in the context of annular gas turbulent flow. Turbulence is a highly complex and irregular fluid motion state, characterized by numerous vortices and velocity fluctuations. These vortices and fluctuations enhance the interaction between the fluid and the pipe wall, leading to increased frictional and flow resistance. When both the inner and outer pipes are rough, the irregularity of the pipe wall surface further intensifies this interaction. The rough surface increases the contact area between the fluid and the pipe wall, making the fluid more susceptible to obstructions and disturbances during flow. These obstructions and disturbances generate additional vortices and velocity fluctuations within the pipe, thereby increasing flow resistance and pressure drop. From the perspective of energy loss, when fluid flows over a rough pipe wall, more energy is consumed in overcoming the increased frictional and flow resistance. This energy loss results in a reduction in fluid pressure during flow, leading to a greater pressure drop. Therefore, in annular gas turbulent flow, when both the inner and outer pipes are rough, a larger pressure drop is observed compared to the smooth state. This is due to the increased interaction between the fluid and the rough pipe wall, the altered fluid flow state, and the resultant greater energy loss.
3.7. The Mechanism Governing the Variation Pattern of Pressure Drop
The turbulent boundary layer is divided into three regions. When y+ < 5, it falls within the viscous sublayer; when 5 < y+ < 70, the turbulence is in the buffer region; and when y+ > 70, it is in the fully turbulent region. The calculation of the roughness scale is carried out according to the following relationships: , and . The pressure drop is obtained through experimental measurements, which allows for a discussion of the contribution of roughness.
For Case I, both the inner and outer pipes are smooth, with no impact of roughness on turbulence, and thus the pressure drop is the smallest. In Case II, when the inner pipe has a roughness of 0.25 mm and the outer pipe is smooth, the roughness scale under the experimental conditions ranges from (7–13), and the turbulence is in the buffer region. Both turbulent and viscous stresses play a role simultaneously. The influence of roughness is not very significant, but the pressure drop increases compared to that of a smooth pipe due to the effect of roughness. In Case III, when the inner pipe is smooth and the outer pipe has a roughness of 1 mm, the roughness scale under the experimental conditions ranges from (44–89), and the turbulence ranges from the buffer region to the fully turbulent region. The influence of roughness becomes significant, and roughness contributes in the fully turbulent region. Therefore, the pressure drop increases significantly due to the effect of the roughness scale. In Case IV, when the inner pipe has a roughness of 0.25 mm and the outer pipe has a roughness of 1 mm, the roughness scale under the experimental conditions ranges from (52–105) for the outer pipe and (13–26) for the inner pipe. The turbulence is in the buffer region, and in most cases, it is in the fully turbulent region. The influence of the outer pipe’s roughness on the pressure drop increase is more significant. For the inner pipe, which is in the turbulent buffer region, both turbulent and viscous stresses play a role simultaneously. The combined effect of the inner and outer pipes leads to an increase in frictional resistance and pressure drop.
Therefore, when comparing the four conditions, Case IV has the largest roughness scale, mainly in the fully turbulent region, and roughness has the greatest contribution to the pressure drop. Case I has no impact of roughness, and thus there is no contribution of roughness to the pressure drop. Conditions 2 and 3 are mainly in the turbulent buffer region, where turbulent interactions and viscous stresses work together, and the pressure drop is between that of Case I and Case IV. This also reveals from the perspective of the turbulent boundary layer why the pressure drop is the largest in Case IV and the smallest in Case I.
3.8. Construction of Annular Pressure Drop Prediction Model
Addressing the predictive challenges of annular pressure drop, the core issue fundamentally stems from the accurate determination of frictional resistance coefficient correlations [34]. In response, this study develops a pressure drop prediction methodology grounded in the analysis of frictional resistance coefficients. As a classical empirical modeling approach in fluid mechanics, this method integrates data-driven parameter fitting and regression analysis techniques to effectively capture the nonlinear dynamic characteristics of fluid flow systems. By quantifying complex flow behaviors, it provides actionable decision support for optimizing drilling engineering parameters.
3.8.1. Dimensional Analysis and Relationship Derivation
Curve analysis of interaction effects demonstrates that key parameters such as inner pipe roughness, outer pipe roughness, fluid velocity, and eccentricity, along with their coupling effects, significantly influence the pressure loss characteristics of annular flow fields. To construct an engineering-applicable annular pressure drop prediction model, this study adopts a dimensional analysis theoretical framework. By systematically establishing a dimensionless parameter system, it enables quantitative characterization of multi-physics coupling effects. Specifically, for the geometric parameters, flow parameters, and their interaction terms listed in Table 4 and Table 5, the Buckingham Π theorem is applied to derive dimensionless criterion number combinations that reflect the intrinsic physical laws. This approach not only effectively eliminates the constraints of dimensional differences on model universality but also lays a methodological foundation for developing an annular pressure drop prediction model that combines theoretical rigor with engineering practicality by revealing the internal correlation mechanisms among influencing factors. The resulting dimensionless model system maintains analytical capabilities for complex flow characteristics while significantly enhancing the extrapolation applicability of prediction results under various operating conditions.

Table 4.
Influencing Parameters of Annular Pressure Drop.

Table 5.
Dimensional Analysis of Influencing Parameters for Annular Pressure Drop.
Based on experimental environments and operating parameters, the functional relationship determining responsive physical quantities can be expressed as:
There are eight physical quantities, choose three basic physical quantities: Geometric quantity, representing the length dimension L, selecting hydraulic diameter, dim (Do − Di) = L. Movement amount, representing the time dimension T, selecting speed, dim u = LT−1. Dynamic force, representing the mass dimension M, selecting density, dimρ = ML−3. According to Buckingham’s π theorem, five dimensionless numbers can be formed, and the other five dimensionless groups are derived as follows:
Through dimensional analysis, dimensionless numbers are obtained:
Therefore, the functional relationship can be written as:
Conventionally, π3 and π4 are denoted as eccentricity (e) and Reynolds number (Re), respectively. Therefore, the dimensionless functional relationship for pressure drop gradient can be written as:
According to the definition of the Fanning friction factor, the following relationship holds [35]:
Based on the pressure drop gradient relationship in pipelines, the following can be derived [36]:
Substituting Equation (12) into Equation (11) yields:
Therefore, based on the dimensional analysis relationship of the Fanning friction factor, the following is derived:
3.8.2. Model Regression and Validation
To systematically evaluate the coupled influence mechanism of geometric and operational parameters on annular pressure drop, this study constructed a full-scale annular flow experimental platform to conduct flow characteristic tests under multiple operating conditions. The experimental design took the pressure drop gradient as the core response variable. Based on the experimental results and dimensionless groups, a dataset of dimensionless groups was further calculated from the experimental data. Regression analysis was performed on the composed dataset to determine the effects of four influencing factors on annular pressure drop. The correlation analysis of annular pressure drop is presented in Table 6.

Table 6.
Regression Coefficients and p-values for the Annular Pressure Drop Model.
The dimensionless regression model is expressed as Equation (15):
Substituting Equation (15) into Equation (13) yields the Fanning friction factor model expressed as Equation (16):
In the mathematical models established by Equations (15) and (16), the sign and magnitude of variable coefficients jointly form a quantitative characterization mechanism for parameter effects. Specifically, positive coefficients enhance the magnitude of response variables through intensified nonlinear coupling effects, while negative coefficients reduce the pressure drop response intensity by suppressing energy dissipation processes. As a discriminant indicator of statistical significance, the p-value plays a critical role in model construction. When p < 0.05, the corresponding variable or interaction term achieves statistical significance at a 95% confidence level for its influence on the response variable.
Based on the regression analysis results in Table 4, this study employed a stepwise regression method for variable screening: interaction terms with p < 0.05 were retained as significant terms, while those with p > 0.05 were eliminated as nonsignificant terms. The analysis reveals that the p-values of interaction terms involving inner pipe roughness, outer pipe roughness, flow velocity, and eccentricity are all less than 0.05, confirming the dominant influence of these factors on annular pressure drop. Notably, the quadratic term of eccentricity also exhibits significant statistical characteristics (p < 0.01), which is cross-validated with the eccentricity-pressure drop parabolic relationship shown in Figure 10.
To verify the accuracy of the regression model, the predicted results of the annular pressure drop model were compared with experimental data. As illustrated in Figure 16, the regression model shows excellent agreement with experimental results, with a coefficient of determination (R2) exceeding 99%, demonstrating the model’s high accuracy and predictive capability.
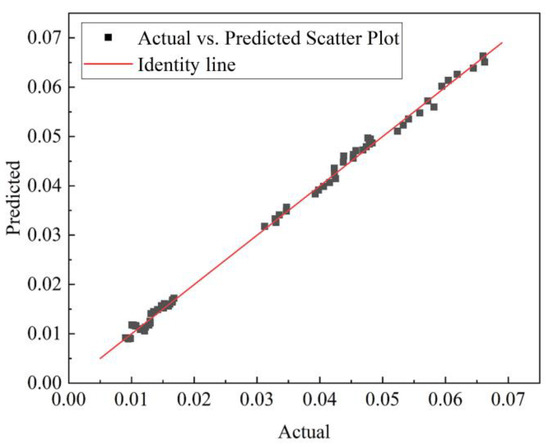
Figure 16.
Comparison of Predicted and Experimental Annular Pressure Drop.
To analyze the interactions of boundary layers, their impacts on the friction coefficient, and their manifestations in Equation (16) under Operating Conditions I, II, III, and IV, it is essential to proceed by integrating the developmental patterns of boundary layers with the term structure of Equation (16):
For Operating Case I (where both the inner and outer pipes feature smooth walls), substituting Ri = 0 and Ro = 0 into Equation (16) renders all terms containing Ri = 0 or Ro =0 null, thereby simplifying the equation to:
At this moment, the friction coefficient is primarily governed by the constant term, the Reynolds number term, the first-order and second-order terms of the eccentricity. This fully reflects the law that under smooth wall conditions, the friction coefficient is controlled by the flow state and geometric eccentricity, with no contribution from the roughness term. In terms of the influence on the friction coefficient, it is mainly determined by the fluid viscosity (embodied through Re) and the annulus geometry (eccentricity e), without additional turbulent dissipation caused by rough walls. As the Reynolds number Re increases, the flow tends to become more turbulent, and the relative proportion of viscous friction decreases, resulting in a decrease in the friction coefficient with increasing Re. The eccentricity e has a quadratic nonlinear impact on the friction coefficient by altering the distribution of the effective flow cross-section in the annulus. From the perspective of boundary layer interaction, when both the inner and outer pipes have smooth walls, the boundary layers of the annulus flow develop from the walls. Initially, they are laminar boundary layers, and momentum transfer is mainly driven by molecular viscosity. When Re is sufficiently large, the boundary layers transition to turbulent boundary layers, and momentum transfer is jointly driven by molecular viscosity and turbulent mixing. However, the turbulent mixing is solely dominated by Re of the flow itself (such as flow velocity and hydraulic diameter), without forced disturbances from rough protrusions on the wall. The interaction between the two smooth boundary layers is manifested as follows: the development of the boundary layers is controlled by the annulus geometry (eccentricity e) and the flow state (Re), with smooth momentum exchange dominated by viscosity at the core, and no turbulent superposition caused by additional rough disturbances.
For Operating Case II (where the inner pipe is rough and the outer pipe is smooth), by substituting Ri = 0.25 mm and Ro = 0 into Equation (16), the terms containing Ro = 0, and the equation simplifies to:
The direct inner-roughness term indicates that the roughness of the inner pipe directly increases friction. The interaction term between the Reynolds number and inner roughness shows that the flow velocity enhances the turbulent disturbances caused by the inner roughness, further increasing friction. The interaction term between the eccentricity and inner roughness reveals that eccentricity adjusts the friction coefficient by altering the flow field distribution on the side with inner roughness. In terms of the influence on the friction coefficient, it is jointly determined by the inner-pipe roughness, Reynolds number, eccentricity, and the interaction between the inner and outer boundary layers. The inner-pipe roughness is the main contributor to friction; the rough protrusions directly increase resistance, resulting in a significantly higher friction coefficient compared to the case with both smooth pipes. The influence of Re is intensified by the inner-pipe roughness. High flow velocities (large Re) enhance the turbulent disturbances caused by the inner-pipe roughness, further elevating the friction coefficient. The impact of eccentricity becomes more complex due to the asymmetric flow field created by the rough inner and smooth outer pipes. Eccentricity changes the effective flow cross-section of the annulus, and the asymmetric superposition of turbulent dissipation on the rough inner side and viscous transfer on the smooth outer side makes the pattern of eccentricity’s effect on friction more intricate. From the perspective of boundary-layer interaction, when the inner pipe has a rough wall, the rough protrusions disrupt the viscous sub-layer, triggering high-intensity turbulent disturbances, with the boundary layer centered around roughness-dominated turbulent dissipation. When the outer pipe has a smooth wall, the development of the boundary layer is mainly governed by the flow Re. Initially, it is laminar and gradually transitions to turbulent as it extends downstream. The interaction between the two is manifested as follows: the local turbulent vortices generated by the inner rough pipe diffuse and transfer energy to the boundary layer of the outer smooth pipe, accelerating the turbulent transition of the outer pipe’s boundary layer. Meanwhile, the smooth momentum exchange in the outer pipe’s boundary layer exerts a certain inhibitory and regulatory effect on the intense turbulent dissipation caused by the inner rough pipe.
For Operating Case III (where the inner pipe is smooth and the outer pipe is rough), by substituting Ri = 0 and Ro = 1 mm into Equation (16), the terms containing Ri become zero, and the equation simplifies to:
The direct outer-roughness term indicates that the roughness of the outer pipe directly increases friction. Since Ro is larger, the contribution of this direct term is more significant than that of the inner-roughness term in Operating Case II. The interaction term between the Reynolds number and outer roughness shows that the flow velocity enhances the turbulent disturbances caused by the outer roughness, further increasing friction. The interaction term between the eccentricity and outer roughness reveals that eccentricity adjusts the friction coefficient by altering the flow field distribution on the side with outer roughness. In terms of the influence on the friction coefficient, it is jointly determined by the outer-pipe roughness, Re, eccentricity, and the interaction between the outer and inner boundary layers. The outer-pipe roughness is the main contributor to friction; the rough protrusions directly increase resistance, resulting in a significantly higher friction coefficient compared to the case with both smooth pipes. The influence of the Reynolds number is intensified by the outer-pipe roughness. High flow velocities (large Re) enhance the turbulent disturbances caused by the outer-pipe roughness, further elevating the friction coefficient. The impact of eccentricity becomes more complex due to the asymmetric flow field created by the rough outer and smooth inner pipes. Eccentricity changes the effective flow cross-section of the annulus, and the asymmetric superposition of turbulent dissipation on the rough outer side and viscous transfer on the smooth inner side makes the pattern of eccentricity’s effect on friction more intricate. From the perspective of boundary-layer interaction, when the outer pipe has a rough wall, the rough protrusions disrupt the viscous sub-layer, triggering high-intensity turbulent disturbances, with the boundary layer centered around roughness-dominated turbulent dissipation. When the inner pipe has a smooth wall, the development of the boundary layer is mainly governed by the flow Re. Initially, it is laminar and gradually transitions to turbulent as it extends downstream. The interaction between the two is manifested as follows: the local turbulent vortices generated by the outer rough pipe diffuse and transfer energy to the boundary layer of the inner smooth pipe, accelerating the turbulent transition of the inner pipe’s boundary layer. Meanwhile, the smooth momentum exchange in the inner pipe’s boundary layer exerts a certain inhibitory and regulatory effect on the intense turbulent dissipation caused by the outer rough pipe.
For Operating Case IV (where both the inner and outer pipes have rough walls), by substituting Ri = 0.25 mm and Ro = 1 mm into Equation (16), multiple terms containing Ri and Ro are involved in the calculation together, reflecting the coupled contributions of roughness terms, the interaction terms between Re and roughness, and the interaction terms between the eccentricity and roughness. The direct roughness terms and directly increase the friction coefficient due to the roughness of the inner and outer pipes. The roughness interaction term reflects the synergistic effect of the roughness of the inner and outer pipes. When both pipes are rough, this interaction term further increases the friction, representing the enhanced turbulent dissipation resulting from the superposition of the turbulent boundary layers of the two rough pipes. The interaction terms and between the Reynolds number and roughness illustrate the coupling of the flow velocity (Re) and roughness: the higher the flow velocity, the more intense the turbulence triggered by the rough protrusions, and the influence of Re on the friction coefficient is enhanced by the roughness. The interaction terms and between the eccentricity and roughness demonstrate the coupling of the eccentricity (e) and roughness: eccentricity changes the flow field distribution in the annulus, and under rough wall conditions, the influence of this distribution on friction exhibits a more complex pattern due to the presence of the rough protrusions. In terms of the influence on the friction coefficient, it significantly increases and is predominantly governed by the interactions among roughness (Ri, Ro), the Re, and the eccentricity (e). The direct contribution of roughness is that the rough protrusions impede the flow and directly consume energy, leading to an increase in the friction coefficient. The contribution of the interaction between the Reynolds number and roughness is that a high flow velocity (large Re) intensifies the turbulent disturbances caused by the rough protrusions, further increasing the friction coefficient. The contribution of the interaction between the eccentricity and roughness is that eccentricity changes the distribution of the effective flow cross-section in the annulus, and under rough wall conditions, the influence of this distribution on friction becomes more complex due to the presence of the rough protrusions. From the perspective of boundary-layer interaction, when both the inner and outer pipes have rough walls, the rough protrusions on the walls disrupt the viscous sub-layer, causing premature turbulent transition and a significant increase in turbulent intensity. The rough protrusions act as sources of turbulence, generating local vortices and enhancing turbulent dissipation within the annulus. The development of the boundary layer is not only driven by the flow Re but also controlled by the forced disturbances caused by the rough protrusions. Momentum transfer is jointly dominated by molecular viscosity and high-intensity turbulent mixing (dominated by roughness). The interaction between the two rough boundary layers is manifested as the local turbulent vortices generated by the rough protrusions of the inner and outer pipes superimpose and interfere with each other within the annulus, further enhancing the overall turbulent dissipation.
Davis [37] provided a correlation formula for the friction drag coefficient related to the diameter ratio within an annulus using air as the working fluid, in the Reynolds number range of 3000 < Re < 40,000.
For higher Reynolds numbers (10,000 < Re < 45,000), the calculation is based on the Nikuradse equation [38]:
Lyons et al. [20] pointed out that when considering the influence of wall roughness on the friction drag coefficient, the more widely used formula is the Colebrook-White equation, which takes the following form:
Since Formulas (15) and (16) did not account for roughness, therefore, to make a comparison under the same conditions, the model in this paper is degenerated to the case of a smooth annulus with the inner pipe centered for model comparison.
As illustrated in Figure 17, the friction factor exhibits a gradual decline with a negligibly small overall variation. Among the models compared, the Colebrook-White model yields the highest friction factor, approximately within the range of 0.009 to 0.0105. With an increase in the Reynolds number, a substantial decrease in the friction factor is observed, which aligns well with the resistance characteristics typical of turbulent flow in smooth pipes. The Rothfus model presents a friction factor at an intermediate level, roughly spanning from 0.0055 to 0.0062. As the Reynolds number rises, the friction factor in this model experiences a slow reduction. The friction factor obtained from the model proposed in this study falls between those of the Colebrook-White and Rothfus models, approximately ranging from 0.005 to 0.0055. As the Reynolds number increases, the friction factor decreases gradually and demonstrates a good match with the Rothfus model. The discrepancies among these models can be ascribed to the influence of varying annulus geometries. For instance, the Davis model already incorporates variations based on the radius ratio of the inner and outer pipes. Different radius ratios lead to distinct curvatures of the annulus, which consequently impact the calculated results of the friction resistance coefficient.
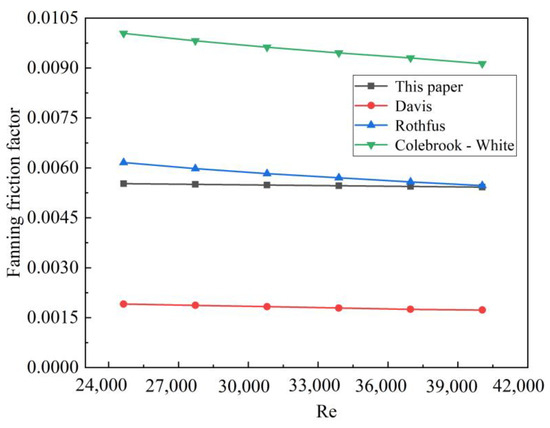
Figure 17.
Comparison between the model in this paper and models proposed by other scholars.
This study is applicable to gas drilling scenarios, with a Reynolds number range of 24,643 to 40,046, an inner pipe roughness of 0 to 0.25 mm, an outer pipe roughness of 0 to 1 mm, and an eccentricity ranging from −0.9 to 0.9.
4. Conclusions
This paper presents experimental investigations into the interactions among flow velocity, eccentricity, rotational speed, and the roughness of both inner and outer pipes, along with a detailed study on the pressure drop pattern of fluids in annuli.
An increase in flow velocity leads to a higher pressure drop. According to the experimental results on the interactions between flow velocity and rotational speed, as well as between rotational speed and eccentricity, the pressure drop remains unchanged with variations in rotational speed. Therefore, flow velocity emerges as the primary controlling factor for pressure drop, while rotational speed does not significantly influence it. Meanwhile, the interactions between flow velocity and eccentricity, as well as between flow velocity and roughness, are notably significant.
The pressure drop decreases with an increase in eccentricity, and the effects of downward positive eccentricity and upward eccentricity on pressure drop are almost identical, demonstrating a symmetry in pressure drop patterns under positive and negative eccentricity conditions. This symmetry should be given particular attention in pressure drop analysis and multiphase flow research in drilling engineering.
Roughness also has a pronounced impact on pressure drop. An increase in the roughness of both inner and outer pipes results in a significant rise in pressure drop. The pressure drop increases with the total rough area. Notably, the influence of inner pipe roughness on the rough outer pipe case is more significant than on the smooth outer pipe condition, highlighting the necessity of considering roughness in drilling engineering.
Based on dimensional analysis, this paper establishes a predictive model for pressure drop and subsequently validates it. The correlation analysis of interaction terms reveals that these interactions have a substantial impact on the pressure drop gradient in annuli, underscoring the importance of considering parameter interactions under realistic conditions in practical research. The discussion on pressure drop in this paper serves as the basis for pump power selection, as the product of flow rate and pressure drop determines the pump power.
Author Contributions
Writing—original draft preparation, Y.S.; writing—review and editing, G.S., S.B., P.W. and B.Y.; visualization and funding acquisition, P.L. and J.W. All authors have read and agreed to the published version of the manuscript.
Funding
This study was funded by the Lanzhou Science and Technology Development Guidance Plan Project (funder: Jinxiang Wang, No. 2024-9-296) and the Youth Fund Project of Lanzhou City University (funder: Panliang Liu, No. LZCU-QN2023-08).
Data Availability Statement
No new data were created or analyzed in this study. The data that support the findings of this study are available on request from the corresponding author upon reasonable request.
Acknowledgments
The authors are grateful to the professors from Bailie School of Petroleum Engineering, Lanzhou City University, who provided inspiration and guidance for this paper.
Conflicts of Interest
The authors declare no conflicts of interest.
Nomenclature
| f | Fanning friction factor |
| τ | Average shear stress (Pa) |
| rio | Radius ratio of inner and outer tubes |
| E | The distance by which the center of the inner tube deviates from the center of the Outer tube (m) |
| e | Eccentricity |
| un | Uncertainty of measuring instrument |
| unc | Combined standard uncertainty |
| Un | Expanded uncertainty |
| ΔPdirect | Uncertainty of direct measurement of differential pressure (Pa) |
| ΔPtransmitter | The standard uncertainty of the differential pressure transmitter (Pa) |
| ΔPacquisition system | The standard uncertainty of the differential pressure acquisition module (Pa) |
| R+ | Roughness scale |
| R | Roughness (m) |
| y+ | Wall-normal dimensionless distance |
| uτ | Friction coefficient (m/s) |
| ν | Kinematic viscosity (m2/s) |
| ρg | Fluid density (kg/m3) |
| y+ | Distance from the wall |
| uf | inverter frequency for fluid velocity calibration (Hz) |
| nf | Inverter frequency for rotational speed calibration (Hz) |
References
- Sayindla, S.; Lund, B.; Ytrehus, J.D. Hole-cleaning performance comparison of oil-based and water-based drilling fluids. J. Pet. Sci. Eng. 2017, 159, 49–57. [Google Scholar]
- Khatibi, M.; Wiktorski, E.; Sui, D. Experimental Study of Frictional Pressure Loss for Eccentric Drillpipe in Horizontal Wells. In Proceedings of the IADC/SPE Asia Pacific Drilling Technology Conference and Exhibition, Bangkok, Thailand, 7–8 August 2018. IADC/SPE-191046-MS. [Google Scholar]
- Dokhani, V.; Ma, Y.; Li, Z. Effects of drill string eccentricity on frictional pressure losses in annuli. J. Pet. Sci. Eng. 2020, 187, 1–14. [Google Scholar]
- Nouri, J.M.; Umur, H.; Whitelaw, J.H. Flow of Newtonian and non Newtonian fluids in concentric and eccentric annuli. J. Fluid Mech. 1993, 253, 617–641. [Google Scholar] [CrossRef]
- Zamora, M.; Roy, S.; Slater, K. Comparing a Basic Set of Drilling Fluid Pressure-loss Relationship to Flow Loop and Field Data. Paper AADE-05-NTCE-27. In Proceedings of the AADE National Conference and Exhibition, Houston, TX, USA, 5–7 April 2005. [Google Scholar]
- Ferroudji, H.; Hadjadj, A.; Rahman, M.A.; Hassan, I.; Ofei, T.N.; Haddad, A. The impact of orbital motion of drill pipe on pressure drop of non-Newtonian fluids in eccentric annulus. J. Adv. Res. Fluid Mech. Therm. 2021, 65, 94–108. [Google Scholar]
- Erge, O.; Karimi, V.A.; Ozbayoglu, M.E.; Van, O.E. Frictional pressure loss of drilling fluids in a fully eccentric annulus. J. Nat. Gas Sci. Eng. 2015, 26, 1119–1129. [Google Scholar] [CrossRef]
- Erge, O.; Ozbayoglu, E.M.; Miska, S.Z.; Yu, M.; Takach, N.; Saasen, A.; May, R. The effects of drillstring-eccentricity, rotation, and buckling configurations on annular frictional pressure losses while circulating yield-power-law fluids. SPE Drill. Complet. 2015, 30, 257–271. [Google Scholar]
- Erge, O.; Ozbayoglu, E.M.; Miska, S.Z.; Yu, M.; Takach, N.; Saasen, A.; May, R. Laminar to turbulent transition of yield power law fluids in annuli. J. Pet. Sci. Eng. 2015, 128, 128–139. [Google Scholar]
- Ozbayoglu, E.M.; Sorgun, M. Frictional pressure loss estimation of non-newtonian fluids in realistic annulus with pipe rotation. J. Can. Pet. Technol. 2010, 49, 57–64. [Google Scholar]
- Saasen, A. Annular frictional pressure losses during drilling-predicting the effect of drillstring rotation. J. Energy Resour. Technol. 2014, 136, 034501. [Google Scholar]
- Hansen, S.A.; Rommetveit, R.; Sterri, N.; Aas, B.; Merlo, A. A new hydraulics model for slim hole drilling applications. SPE-57579-MS. In Proceedings of the SPE/IADC Middle East Drilling Technology Conference, Abu Dhabi, United Arab Emirates, 8–10 November 1999. [Google Scholar]
- Sterri, N.; Saasen, A.; Aas, B.; Hansen, S.A. Drill string rotation effects on axial flow of shear thinning fluids in an eccentric annulus. Oil Gas Eur. Mag. 2000, 26, 30–33. [Google Scholar]
- Hansen, S.A.; Sterri, N. Drill pipe rotation effects on frictional pressure losses in slim annuli. SPE-30488-MS. In Proceedings of the SPE Annual Technical Conference and Exhibition, Dallas, TX, USA, 22–25 October 1995. [Google Scholar]
- Movahedi, H.; Jamshidi, S. Experimental and CFD simulation of slurry flow in the annular flow path using two-fluid model. J. Pet. Sci. Eng. 2021, 198, 108224. [Google Scholar] [CrossRef]
- Ahmed, R.M.; Miska, S.Z. Experimental study and modeling of yield power-law fluid flow in annuli with drillpipe rotation. In Proceedings of the IADC/SPE Drilling Conference, Orlando, FL, USA, 4–6 March 2008; Society of Petroleum Engineers: Calgary, AB, Canada, 2008. [Google Scholar]
- Salubi, V.; Mahon, R.; Oluyemi, G. The combined effect of fluid rheology, inner pipe rotation and eccentricity on the flow of Newtonian and non-Newtonian fluid through the annuli. J. Pet. Sci. Eng. 2022, 211, 110018. [Google Scholar] [CrossRef]
- Barooah, A.; Khan, M.S.; Khaled, M.S. Investigation of cutting transport in horizontal deviated annulus using visualization and pressure drop techniques for two-phase slurry flow. J. Nat. Gas. Sci. Eng. 2022, 100, 104460. [Google Scholar] [CrossRef]
- Lyons, W.C.; Guo, B.; Seidel, F.A. Air and Gas Drilling Manual, 2nd ed.; New York McGraw-Hill: New York, NY, USA, 2001; pp. 1–199. [Google Scholar]
- Lyons, W.C.; Guo, B.; Graham, R.L.; Hawley, G.D. Air and Gas Drilling Manual, 3rd ed.; Gulf Professional Publishing: Houston, TX, USA, 2009; pp. 160–163. [Google Scholar]
- Ytrehus, J.D.; Lund, B.; Taghipour, A. Hydraulic behavior in cased and open hole sections in highly deviated wellbores. J. Energ. Resour. Tech. 2021, 143, 033008. [Google Scholar] [CrossRef]
- Zhu, X.; Liu, B. Development of a gas injection rate model for gas-drilling horizontal wells based on the onset of cutting-particle motion. Int. J. Oil Gas Coal Technol. 2020, 24, 36–61. [Google Scholar] [CrossRef][Green Version]
- Dykes, G.B. Cuttings Transport Implications for Drill String Design: A Study with Computational Fluid Dynamics; Colorado School of Mines: Golden, CO, USA, 2014. [Google Scholar][Green Version]
- Luo, Q. Study on Hydraulic Purification of Extended Reach Well; Yangtze University: Jingzhou, China, 2014; pp. 30–31. [Google Scholar][Green Version]
- Wu, W.; Liu, T.; Xie, L. Prediction model and field application of cuttings bed thickness in extended reach well: Taking CH1-1-XX well drilling as an example. Sci. Tech. Eng. 2024, 24, 3654–3662. [Google Scholar][Green Version]
- Dong, C.Y.; Deng, S.; Li, A.P. Research of critical condition for grains at bed surface in highly deviated wells Petrol. Drill. Tech. 2010, 38, 22–26. [Google Scholar][Green Version]
- Wang, T. Establishment and Software Development of Hydraulic Parameter Optimization Design Model for Small Wellbore Drilling; Xi’an University of Petroleum: Xi’an, China, 2015; pp. 1–59. [Google Scholar][Green Version]
- Sun, C. Research on the Movement Distribution Law and Destruction Method of Particles in Gas Drilling Rock Debris Bed; Southwest Petroleum University: Chengdu, China, 2013; pp. 1–68. [Google Scholar][Green Version]
- Li, X. Research on the Purification Law of Gas Drilling Horizontal Wells; Southwest Petroleum University: Chengdu, China, 2014; pp. 1–87. [Google Scholar][Green Version]
- Ytrehus, J.D.; Lund, B.; Taghipour, A. Oil-Based Drilling Fluid’s Cuttings Bed Removal Properties for Deviated Wellbores. J. Energ. Resour. Tech. 2021, 143, 103003. [Google Scholar] [CrossRef]
- Huque, M.M.; Rahman, M.A.; Zendehboud, S. Investigation of cuttings transport in a horizontal well with high-speed visualization and electrical resistance tomography technique. J. Nat. Gas. Sci. Eng. 2021, 92, 103968. [Google Scholar] [CrossRef]
- Sun, Y.; Sun, J.; Zhang, J.; Huang, N. Investigation of Turbulence Characteristics Influenced by Flow Velocity, Roughness, and Eccentricity in Horizontal Annuli Based on Numerical Simulation. Symmetry 2025, 17, 409. [Google Scholar] [CrossRef]
- Rushd, S.; Shazed, A.R.; Faiz, T. CFD Simulation of Pressure Losses in Eccentric Horzontal Wells; Society of Petroleum Engineers: Calgary, AB, Canada, 2017; pp. 1–9, SPE183934-ms. [Google Scholar]
- Sorgun, M.; Ulker, E. Friction factor calculation for turbulent flow in annulus with temperature effects. Int. J. Numer. Methods Heat Fluid Flow 2020, 30, 3755–3763. [Google Scholar] [CrossRef]
- Kundu, P.K.; Cohen, I.M.; Dowling, D.R. Fluid Mechanics, 5th ed.; Elsevier: Amsterdam, The Netherlands, 2012. [Google Scholar]
- Escudier, M.P.; Cullen, L.M. Flow of a Shear-Thinning Liquid in a Cylindrical Container with a Rotating End Wall. Exp. Therm. Fluid Sci. 1996, 12, 381–387. [Google Scholar] [CrossRef]
- Davis, E.S. Heat transfer and pressure drop in annuli. Trans. ASME 1943, 65, 755–759. [Google Scholar] [CrossRef]
- Rothfus, R.R.; Monrad, C.C.; Senecal, V.E. Velocity distribution and fluid friction in smooth concentric annuli. Ind. Eng. Chem. 1950, 42, 2511–2520. [Google Scholar]
Disclaimer/Publisher’s Note: The statements, opinions and data contained in all publications are solely those of the individual author(s) and contributor(s) and not of MDPI and/or the editor(s). MDPI and/or the editor(s) disclaim responsibility for any injury to people or property resulting from any ideas, methods, instructions or products referred to in the content. |
© 2025 by the authors. Licensee MDPI, Basel, Switzerland. This article is an open access article distributed under the terms and conditions of the Creative Commons Attribution (CC BY) license (https://creativecommons.org/licenses/by/4.0/).