Article

Using Large Language Models to Analyze Interviews for Driver Psychological Assessment: A Performance Comparison of ChatGPT and Google-Gemini

1
School of Modern Post, Xi’an University of Posts & Telecommunications, Xi’an 710061, China
2
College of Computer Science, Chongqing University, Chongqing 400044, China
3
China Merchants Chongqing Communications Research & Design Institute Co., Ltd., Chongqing 400067, China
4
Transportation Industry R&D Center for Autonomous Driving Technology, Chongqing 400067, China
5
Hunan Province Transportation Planning, Surveying and Design Institute Co., Ltd., Changsha 410200, China
*
Author to whom correspondence should be addressed.
Symmetry 2025, 17(10), 1713; https://doi.org/10.3390/sym17101713
Submission received: 22 July 2025 / Revised: 25 August 2025 / Accepted: 2 October 2025 / Published: 13 October 2025
(This article belongs to the Section Computer)

Abstract

This study examines the application of large language models (LLMs) in analyzing subjective driver perceptions during tunnel driving simulations, comparing the effectiveness of questionnaires and interviews. Building on previous research involving driver simulations, we recruited 29 new participants, collected their perceptions via questionnaires, and conducted follow-up interviews. The interview data were analyzed using three LLMs: GPT-3.5, GPT-4, and Google-Gemini. The results revealed that while GPT-4 provides more in-depth and accurate analysis, it is significantly slower than GPT-3.5. Conversely, Google-Gemini demonstrated a balance between analysis quality and speed, outperforming the other models overall. Despite the challenge of occasional misunderstandings, LLMs still have the potential to enhance the efficiency and accuracy of subjective data analysis in transportation research.

1. Introduction

Using questionnaires to survey people’s opinions is a traditional method with a long history [1]. Questionnaires have significant advantages [2], such as simplicity [3], convenience [4], and low cost [5]. However, they also have some limitations [6], such as question design biases [7], inflexibility in modifying questions [8], and especially a difficulty in covering all the respondent’s feelings [9]. Respondents often find that the questions do not fully reflect their thoughts [10]. In response to these limitations, interviews have become a more natural choice [11]. Interviews allow respondents to express themselves relatively freely [12], providing a comprehensive understanding of their psychological states [13]. However, interviews are not without flaws [14], as respondents may speak too briefly or too lengthily [15], making it challenging to concisely convey their views. As a result, interviewers must expend considerable effort and time to analyze and identify the core content [16] and to classify and analyze the views of multiple respondents [17]. Therefore, whether using questionnaires or interviews, there are inherent issues that require new methods to achieve a simple, efficient, and accurate exploration of people’s thoughts.
In recent years, with the rise of large language model technology [18], AI-driven automated analysis of text data has made significant progress [19]. In tasks such as text writing and processing, AI’s performance in sentiment analysis [20] has become one of the most prominent research directions. Thus, the aforementioned limitations of questionnaires and interviews may be addressed by converting the content into text and using AI for further analysis.
Sentiment Analysis, also known as Opinion Mining, is a NLP technique aimed at identifying and extracting opinions, emotions, and sentiments contained in textual data. The main methods currently used for sentiment analysis include lexicon-based, machine learning-based, and hybrid approaches. The emergence of Explainable AI (XAI) [21,22,23,24] has provided more insight into the reasoning process behind sentiment analysis, increasing transparency [25] and enabling researchers to better understand the final conclusions.
As one of the tools of Explainable AI, ChatGPT has injected new energy into numerous research fields. GPT-3.5 and GPT-4 are AIGC models launched by OpenAI in November 2022 and March 2023, respectively. Due to their ability to handle challenging language comprehension and generation tasks in a conversational manner, they have attracted the interest of engineers, social media users, academics, writers, teachers, and students [26]. ChatGPT integrates various technologies, including deep learning, unsupervised learning, instruction fine-tuning, multitask learning, contextual learning, and reinforcement learning. Unlike previous chatbots, ChatGPT can remember what users have said earlier in the conversation, facilitating continuous dialogue [27]. Compared to GPT-3.5, GPT-4 has improved in generating answers that involve step-by-step logic and critical thinking [28,29], and it introduces multimodal capabilities, supporting input and output of images. Current applications of ChatGPT are primarily focused on specific fields such as ethics [30,31,32], language analysis [33] and processing [34,35], text generation [36,37,38,39,40], healthcare [41,42,43,44,45,46], and education [47,48,49,50,51,52,53].
Another large language models, Google-Gemini, has emerged as a potential competitor to ChatGPT. Google-Gemini, a large language model released by Google in December 2023 [54], is designed with “native multimodality” at its core, enabling it to process and learn from various data types, including text, audio, and video. The advent of Google-Gemini represents a significant leap in chatbot technology, demonstrating exceptional capabilities and innovative features. Some scholars have already compared the performance of Google-Gemini with ChatGPT [55], but a performance comparison in sentiment analysis remains an unexplored area.
In traffic research, surveying drivers’ subjective feelings is a crucial means of evaluating various aspects of road design, traffic safety design, and landscape design. Conducting surveys on drivers’ subjective feelings through questionnaires has yielded substantial results. However, we encountered two issues when using questionnaires in related studies: (1) Questionnaires fail to capture subtle differences in drivers’ feelings. For example, when asking about the driver’s experience in terms of good, fair, or poor, respondents may express a need for options like “somewhat good” or “somewhat poor”. (2) In addition to the questions provided in the questionnaire, respondents may have other feelings that they wish to express.
Therefore, this study is primarily based on two existing research foundations: the results of questionnaire surveys on drivers’ perceptions of the installation location and spacing of reflective rings and blocks in tunnels [56,57]. In previous studies, we recruited drivers to participate in a simulation driving platform experiment and then had them fill out a questionnaire to evaluate their feelings during the simulated driving process. The focus was on comparing the installation of reflective rings and blocks in tunnels under different scenarios, as well as assessing the spacing of these installations.
In this study, we will continue to use the previous simulation model and driving platform, recruiting 29 new drivers to compare their perceptions of reflective rings and blocks in tunnel simulation scenarios. The drivers will fill out questionnaires afterward. We will then conduct interviews with the drivers, record the conversations, convert them into text, and input them into the selected three large models. Specific instructions will be used to have the AI analyze and summarize the drivers’ perceptions and tendencies. Subsequently, we will analyze the differences between the questionnaire and interview results, providing references for scholars in the field when choosing methods to collect subjective information. Finally, regarding the interview analysis results from the large models, we will attempt to establish an evaluation index system to comprehensively assess the potential applications of each AI large model in processing interview information. If the model scores high, it indicates that the model has a certain capacity and potential to simulate the human brain in sentiment analysis and opinion extraction in traffic interview analysis. Conversely, a lower score would suggest that the model is not yet capable of replacing humans in this area, and reducing the workload will require further advancements in AI technology.
The experimental flowchart of this paper is shown in Figure 1.
Beyond comparing analytical performance, this work investigates the symmetry of information, how questionnaires, interviews, and different LLMs align or diverge in the structure and content of extracted findings. By studying method-driven patterns of symmetry and asymmetry, the study links to the thematic focus of Symmetry on patterns, balance, and structural consistency.

2. Methods

2.1. Dataset Introduction

The dataset for this study is based on a previous research project in which 29 drivers participated in a driving simulation experiment. After the experiment, each participant completed a 26-item questionnaire and a 10-question interview, resulting in 29 sets of questionnaires and interview results. All subjects gave their informed consent for inclusion before they participated in the study. The study was conducted in accordance with the Declaration of Helsinki, and the protocol was approved by the Ethics Committee of Xi’an University of Posts & Telecommunications. This paper aims to explore the similarities and differences between questionnaires and interviews in transportation research, as well as the sentiment analysis capabilities of LLMs on interview data. Therefore, we screened and merged the dataset to select six comparable questions from both the questionnaire and the interviews, as detailed in Table 1. In summary, the dataset for this study comprises the responses of 29 drivers to six questions from both the questionnaire and the interviews, totaling 348 data points.

2.2. Input Commands

The instructions for conducting sentiment analysis on interview content using LLMs are provided in Table 2.
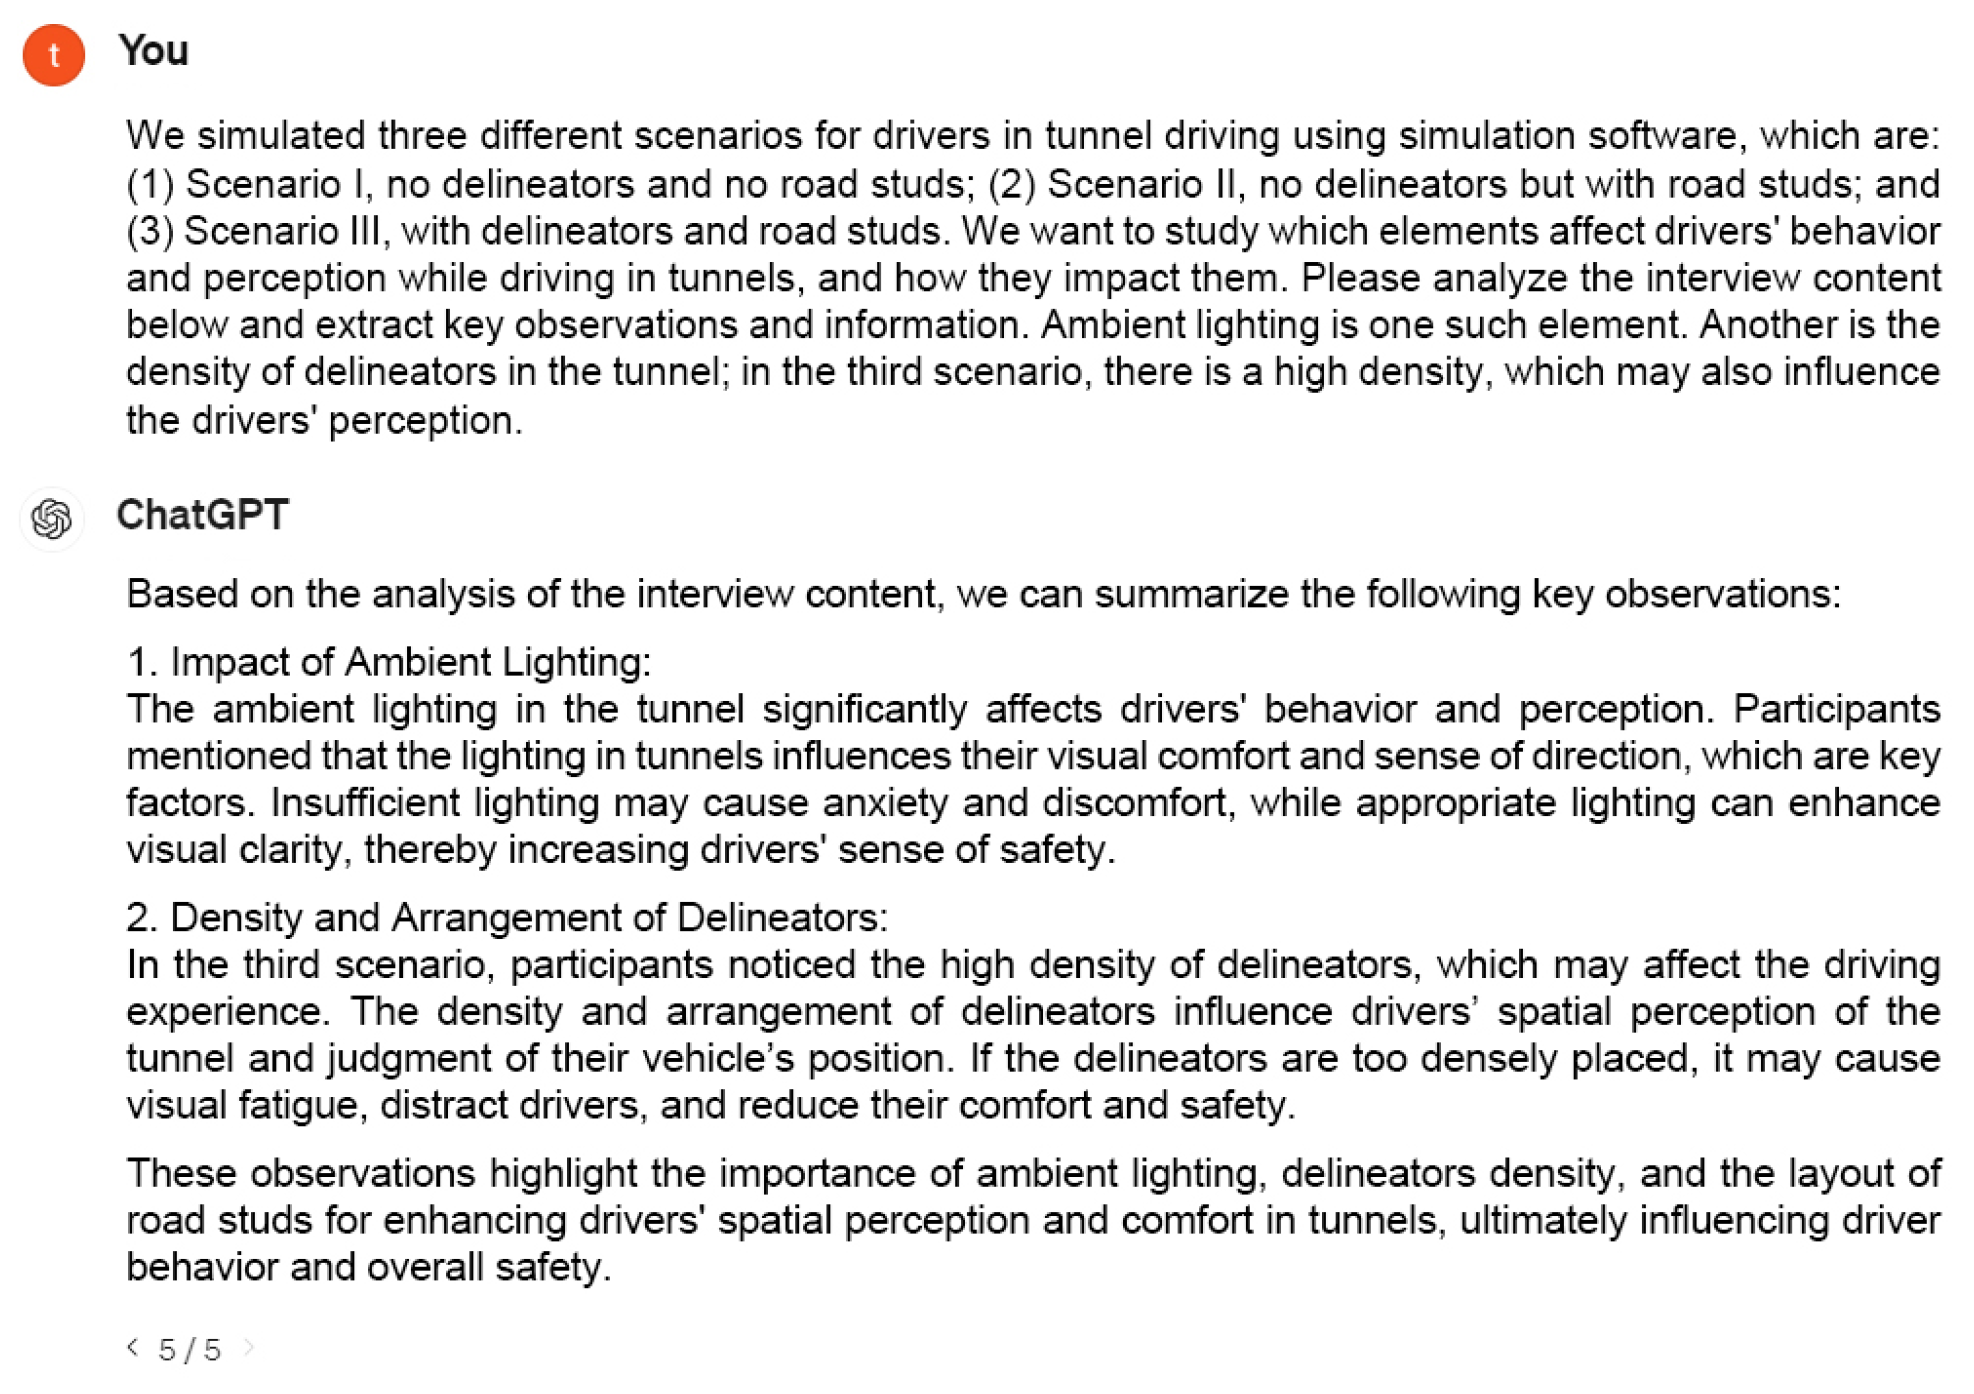
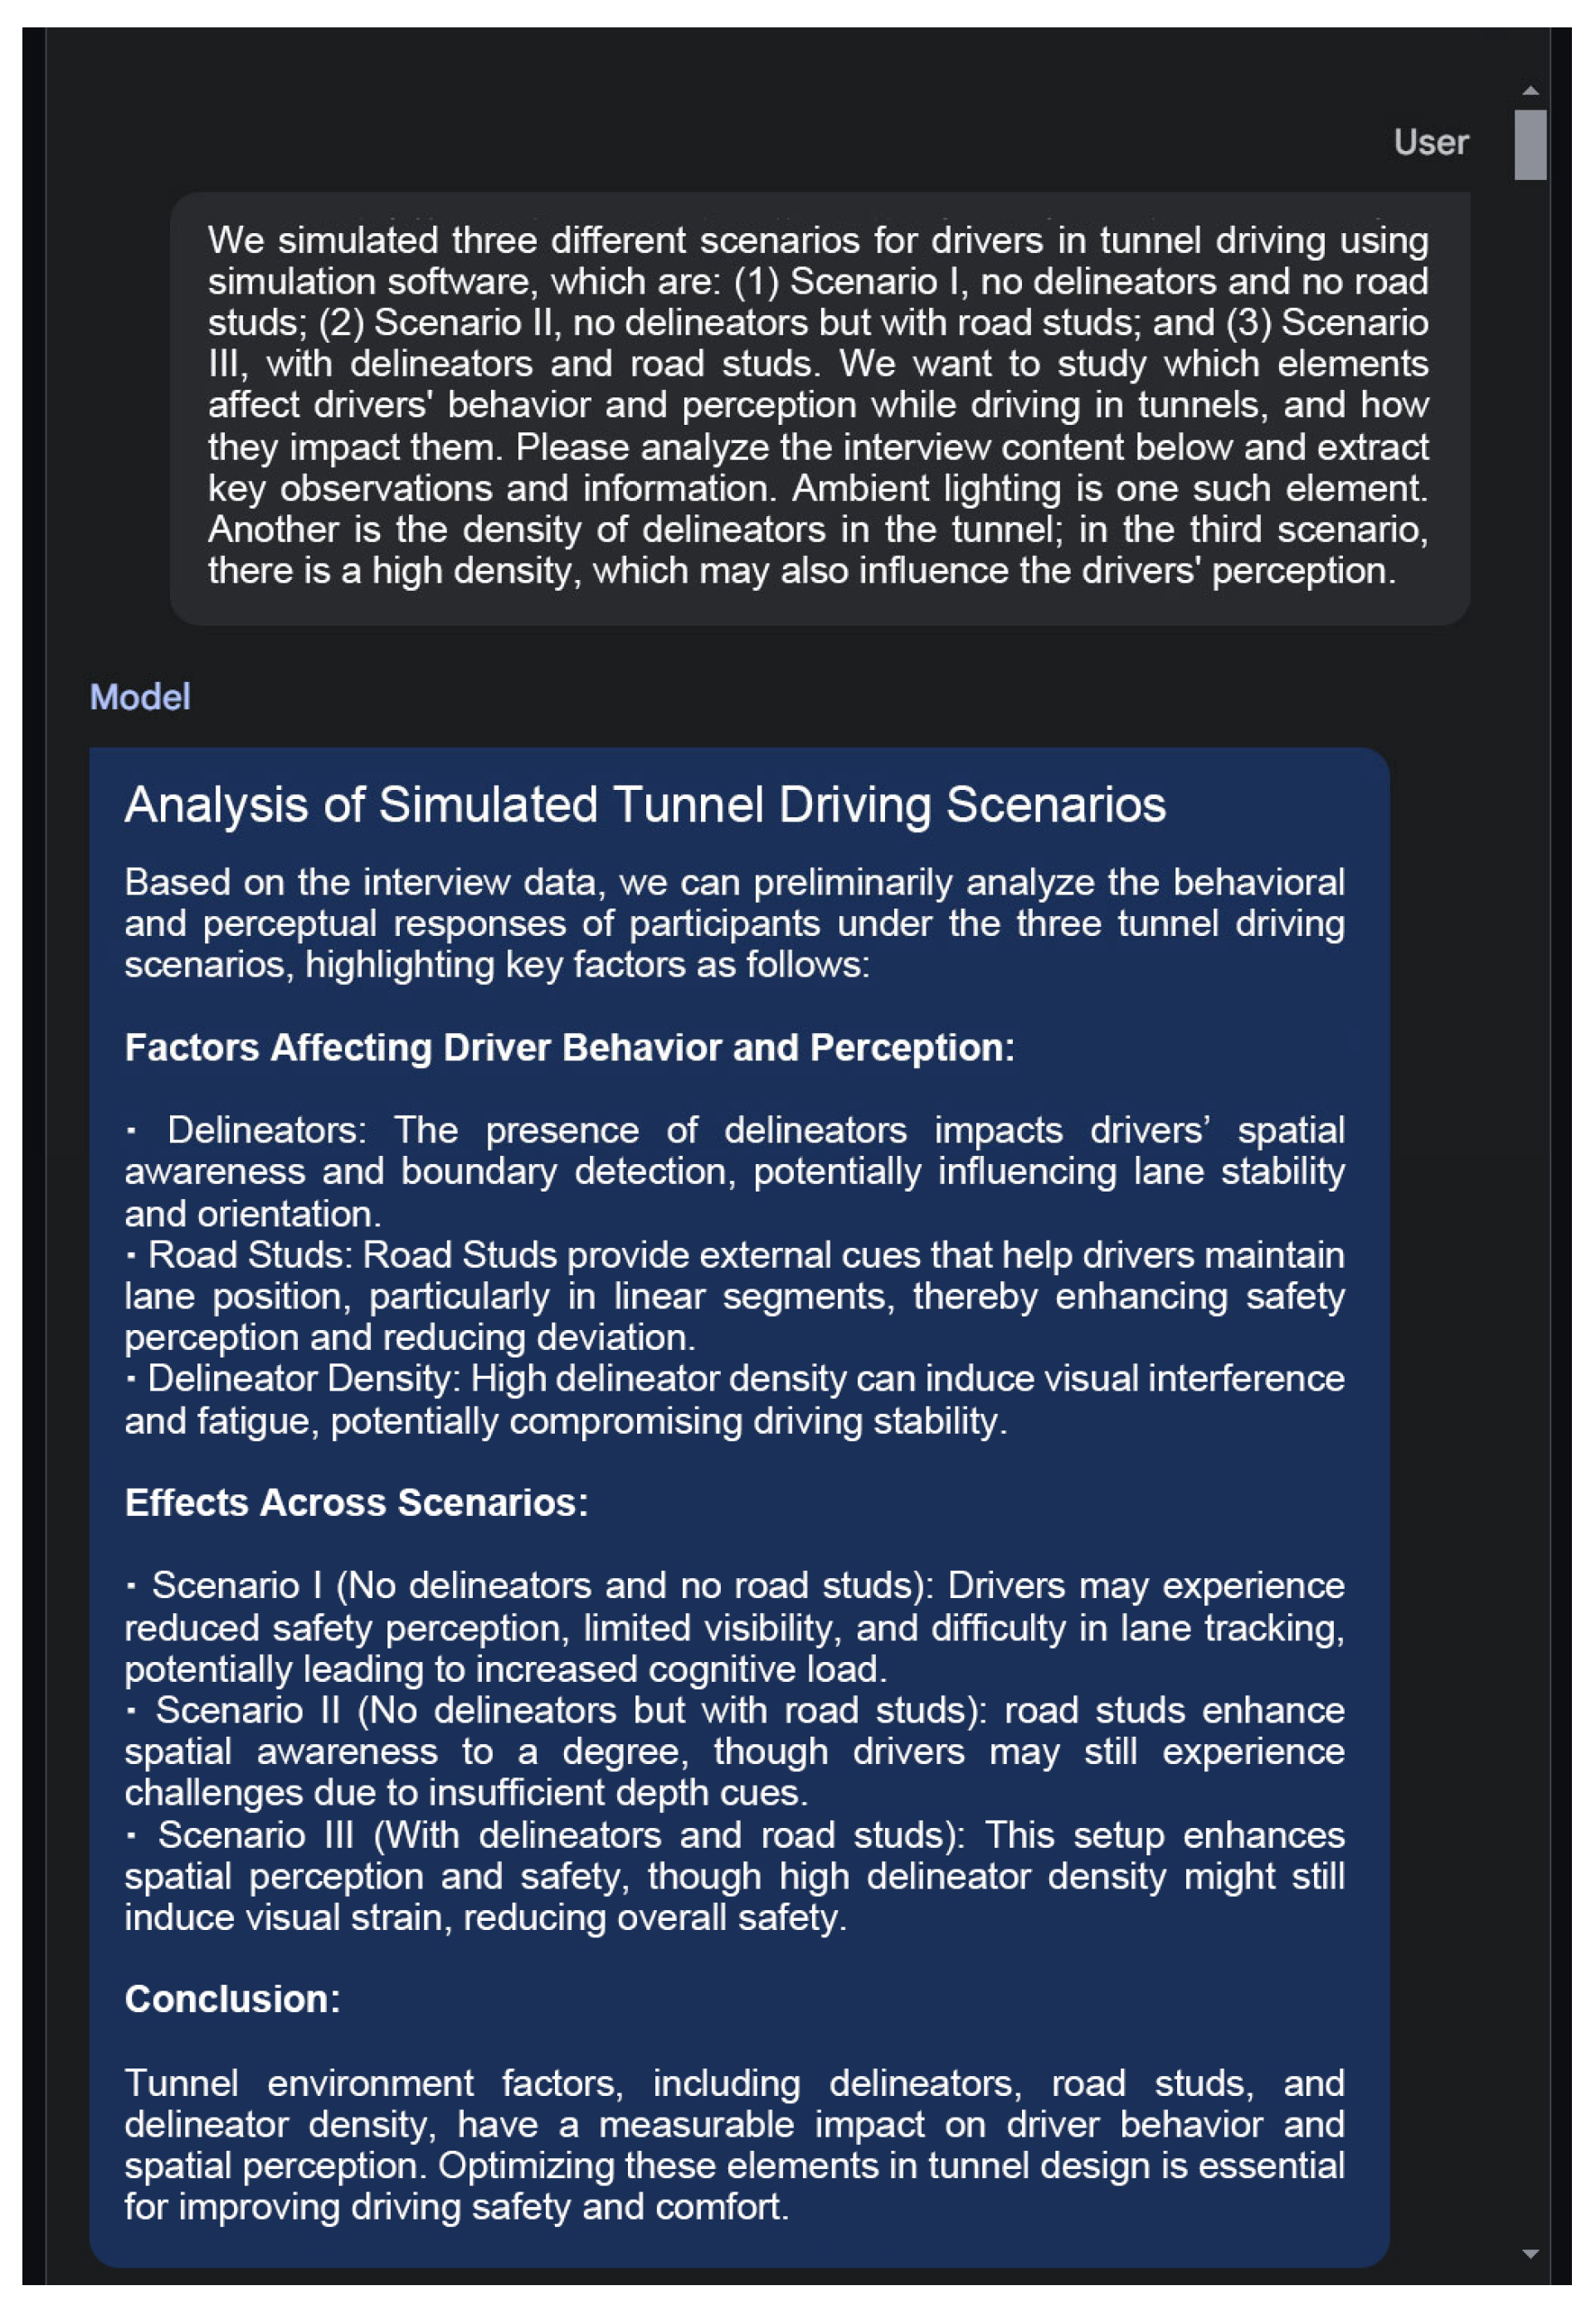
The figure below illustrates the process of sentiment analysis on the same interview sample using different LLMs. Figure 2 shows the input and output results of ChatGPT, while Figure 3 depicts the input and output results of Google-Gemini. These figures provide a concrete example of the prompt-based analysis process, demonstrating how the structured instructions guide the LLMs to generate focused and interpretable summaries from raw interview text.

2.3. Experimental Procedure

1. Questionnaire and Interview Comparison
The information obtained from questionnaires and interviews is compared, and the degree of consistency in the selection tendencies between the two methods is categorized as consistent, partially consistent, and inconsistent. Additionally, characteristics of both methods in the transportation domain are summarized during the comparative process, along with considerations for the design phase.
2. Model Analysis and Scoring
The evaluation of LLMs’ analysis and processing proficiency on interview results primarily consists of three steps.
(1) Preliminary Processing of Interview Data
We transcribed the interview audio from the 29 participants into text, corrected any spelling errors, removed redundant information, and integrated the text into coherent interview transcripts. Upon discovering that Participant 1’s response to Question 6 seeking advice was “none”, this data point was excluded, resulting in a total of 173 interview data points.
(2) Analysis of Interview Data
The analysis instructions for the six interview questions mentioned above were inputted into the LLMs along with the corresponding 173 interview responses. For each participant’s response to the same interview question, the LLMs generated five answers to test the consistency and stability of the model’s responses. Simultaneously, response times of the LLMs were monitored after inputting instructions.
(3) Evaluation of Analytical Capabilities
To assess and compare the sentiment analysis capabilities of different LLMs on tunnel driving interview transcripts, we constructed an evaluation index system consisting of six parameters. The definitions and weight assignments for each indicator are detailed in Table 3.
Regarding the formulation of scoring criteria, the following rules are established:
Scores range from 0 to 10 points, with the first four indicators implementing a deduction system, and the fifth and sixth indicators derived through conversion and calculation. All score results are precise to two decimal places.
Clarity and precision of key points (C): Assuming there are X key points in the interview text, each point is assigned a score of x = 10 / X points. Regarding the key points identified by the LLM, no points are deducted for correctly identified and useful points. Points are deducted by x 4 for inaccurate subheadings, x 2 for correctly identified but useless points, and x for incorrect or missing points.
Logical coherence and flow (L): Assuming there are X key points in the interview text, each point is assigned a score of x = 10 / X points. Regarding the sequence of key points identified by the LLM, no points are deducted for a logical sequence. Points are deducted by x for cases where changes to the original sequence are needed but not made, or changes are made but not logically coherent. Additionally, points are deducted by x 2 if there is any overlap between the extracted points.
Fluency and natural language use (F): Points are deducted based on the approximate proportion of improperly worded or logically confusing sentences in the LLM analysis results.
Emotion recognition and handling (E): This indicator primarily evaluates whether the LLM accurately identifies the emotional tendencies of respondents regarding the questions asked, i.e., positive or negative attitudes and choice tendencies. Considering the interview questions and responses, assuming the text contains Y emotional tendencies, each tendency is assigned a score of y   =   10 / Y points. Points are deducted for each incorrectly identified emotional tendency.
Analysis Speed (A): Using a timer to measure time in seconds as the baseline value a . As this indicator represents a negative value of time and to ensure the final score falls within the range of [0, 10], the time value needs to be reversed. Find the minimum value a m i n and maximum value a m a x of the running time for processing the questions in two versions of GPT. Calculate the final score a using Equation (1):
a = a m a x a a m a x a m i n × 10
Stability of multiple responses (S): The stability of multiple answers is measured to assess the fluctuation in the analysis level of GPT over five iterations. The value of this indicator, denoted as s , can be calculated based on the values and weights of the aforementioned five indicators using a weighted average variance calculation as shown in Equation (2):
s = i = 1 5 ω i · V a r X i i = 1 5 ω i
where V a r ( X i ) denotes the variance of the i -th dataset, and ω i represents the weight of the i -th dataset.
Considering that all other five indicators are positive, similar to the indicator A, the calculated value needs to be reversed. Find the minimum value s m i n and maximum value s m a x of the weighted average variance, and use Equation (3) to calculate the final score s :
s = s m a x s s m a x s m i n × 10
Due to the uniqueness of the S indicator, in the process of calculating the weighted score, it is assumed that the S indicator scores for the five analyses of a single interview result are identical. Therefore, based on the weights of the six indicators, the weighted scores of the five analyses for each of the 173 interview data points can be calculated.
For the above evaluation index system, we then calculate the weight index.
In order to ensure the scientific and fairness of the evaluation system, this study combines Entropy Weight Method (EWM) and Criteria Importance Through Intercriteria Correlation (CRITIC) to assign weights to each evaluation index. These two methods belong to the objective weighting method, which can determine the weight according to the distribution characteristics of the data itself, avoid the interference of subjective factors, and improve the objectivity and reliability of the evaluation results.
Due to the different calculation ideas of the entropy weight method and the CRITIC method, the former mainly emphasizes the degree of dispersion of the indicators, while the latter not only considers the discreteness, but also combines the correlation between the indicators. Therefore, the use of a single method may lead to bias in weight distribution and affect the final evaluation results. In order to make full use of the advantages of the two and improve the rationality of weight distribution, this study uses the weighted average method to fuse the weights calculated by the entropy weight method and the CRITIC method.
In particular, when calculating the respective weights based on the above two methods, this study will analyze the data obtained from all interview results for GPT-3.5 and GPT-4 to calculate the weights. This is because there may be systematic differences in the distribution of index values between GPT-3.5 and GPT-4. If the data are directly combined and calculated, the weights of some indicators may be greatly amplified, while the weights of other indicators are compressed, so that the final weight distribution is unreasonable, thus affecting the scientific and fairness of the evaluation system.
Therefore, after obtaining the index weights of GPT-3.5 and GPT-4, this study uses the variance weighted average method to fuse the weights of the two to obtain the evaluation index weights corresponding to each method. The reason for this is that the variance weighted average method can be weighted according to the fluctuation of the weight value. In this way, the final weight distribution can be more in line with the data characteristics, and the weight dilution problem caused by direct average can be avoided.
The index weights of GPT-3.5 and GPT-4 calculated by entropy weight method are shown in Table 4.
The index weights of GPT-3.5 and GPT-4 calculated by CRITIC method are shown in Table 5.
Next, the variance weighted average weights of GPT-3.5 and GPT-4 are calculated by entropy weight method and CRITIC method, respectively.
Finally, the weighted average weights of variance of each index calculated by entropy weight method and CRITIC method are shown in Table 6.
Next, the comprehensive weights of the entropy weight method and the CRITIC method are further combined. The final calculated weighted average weights of each index are shown in Table 7.
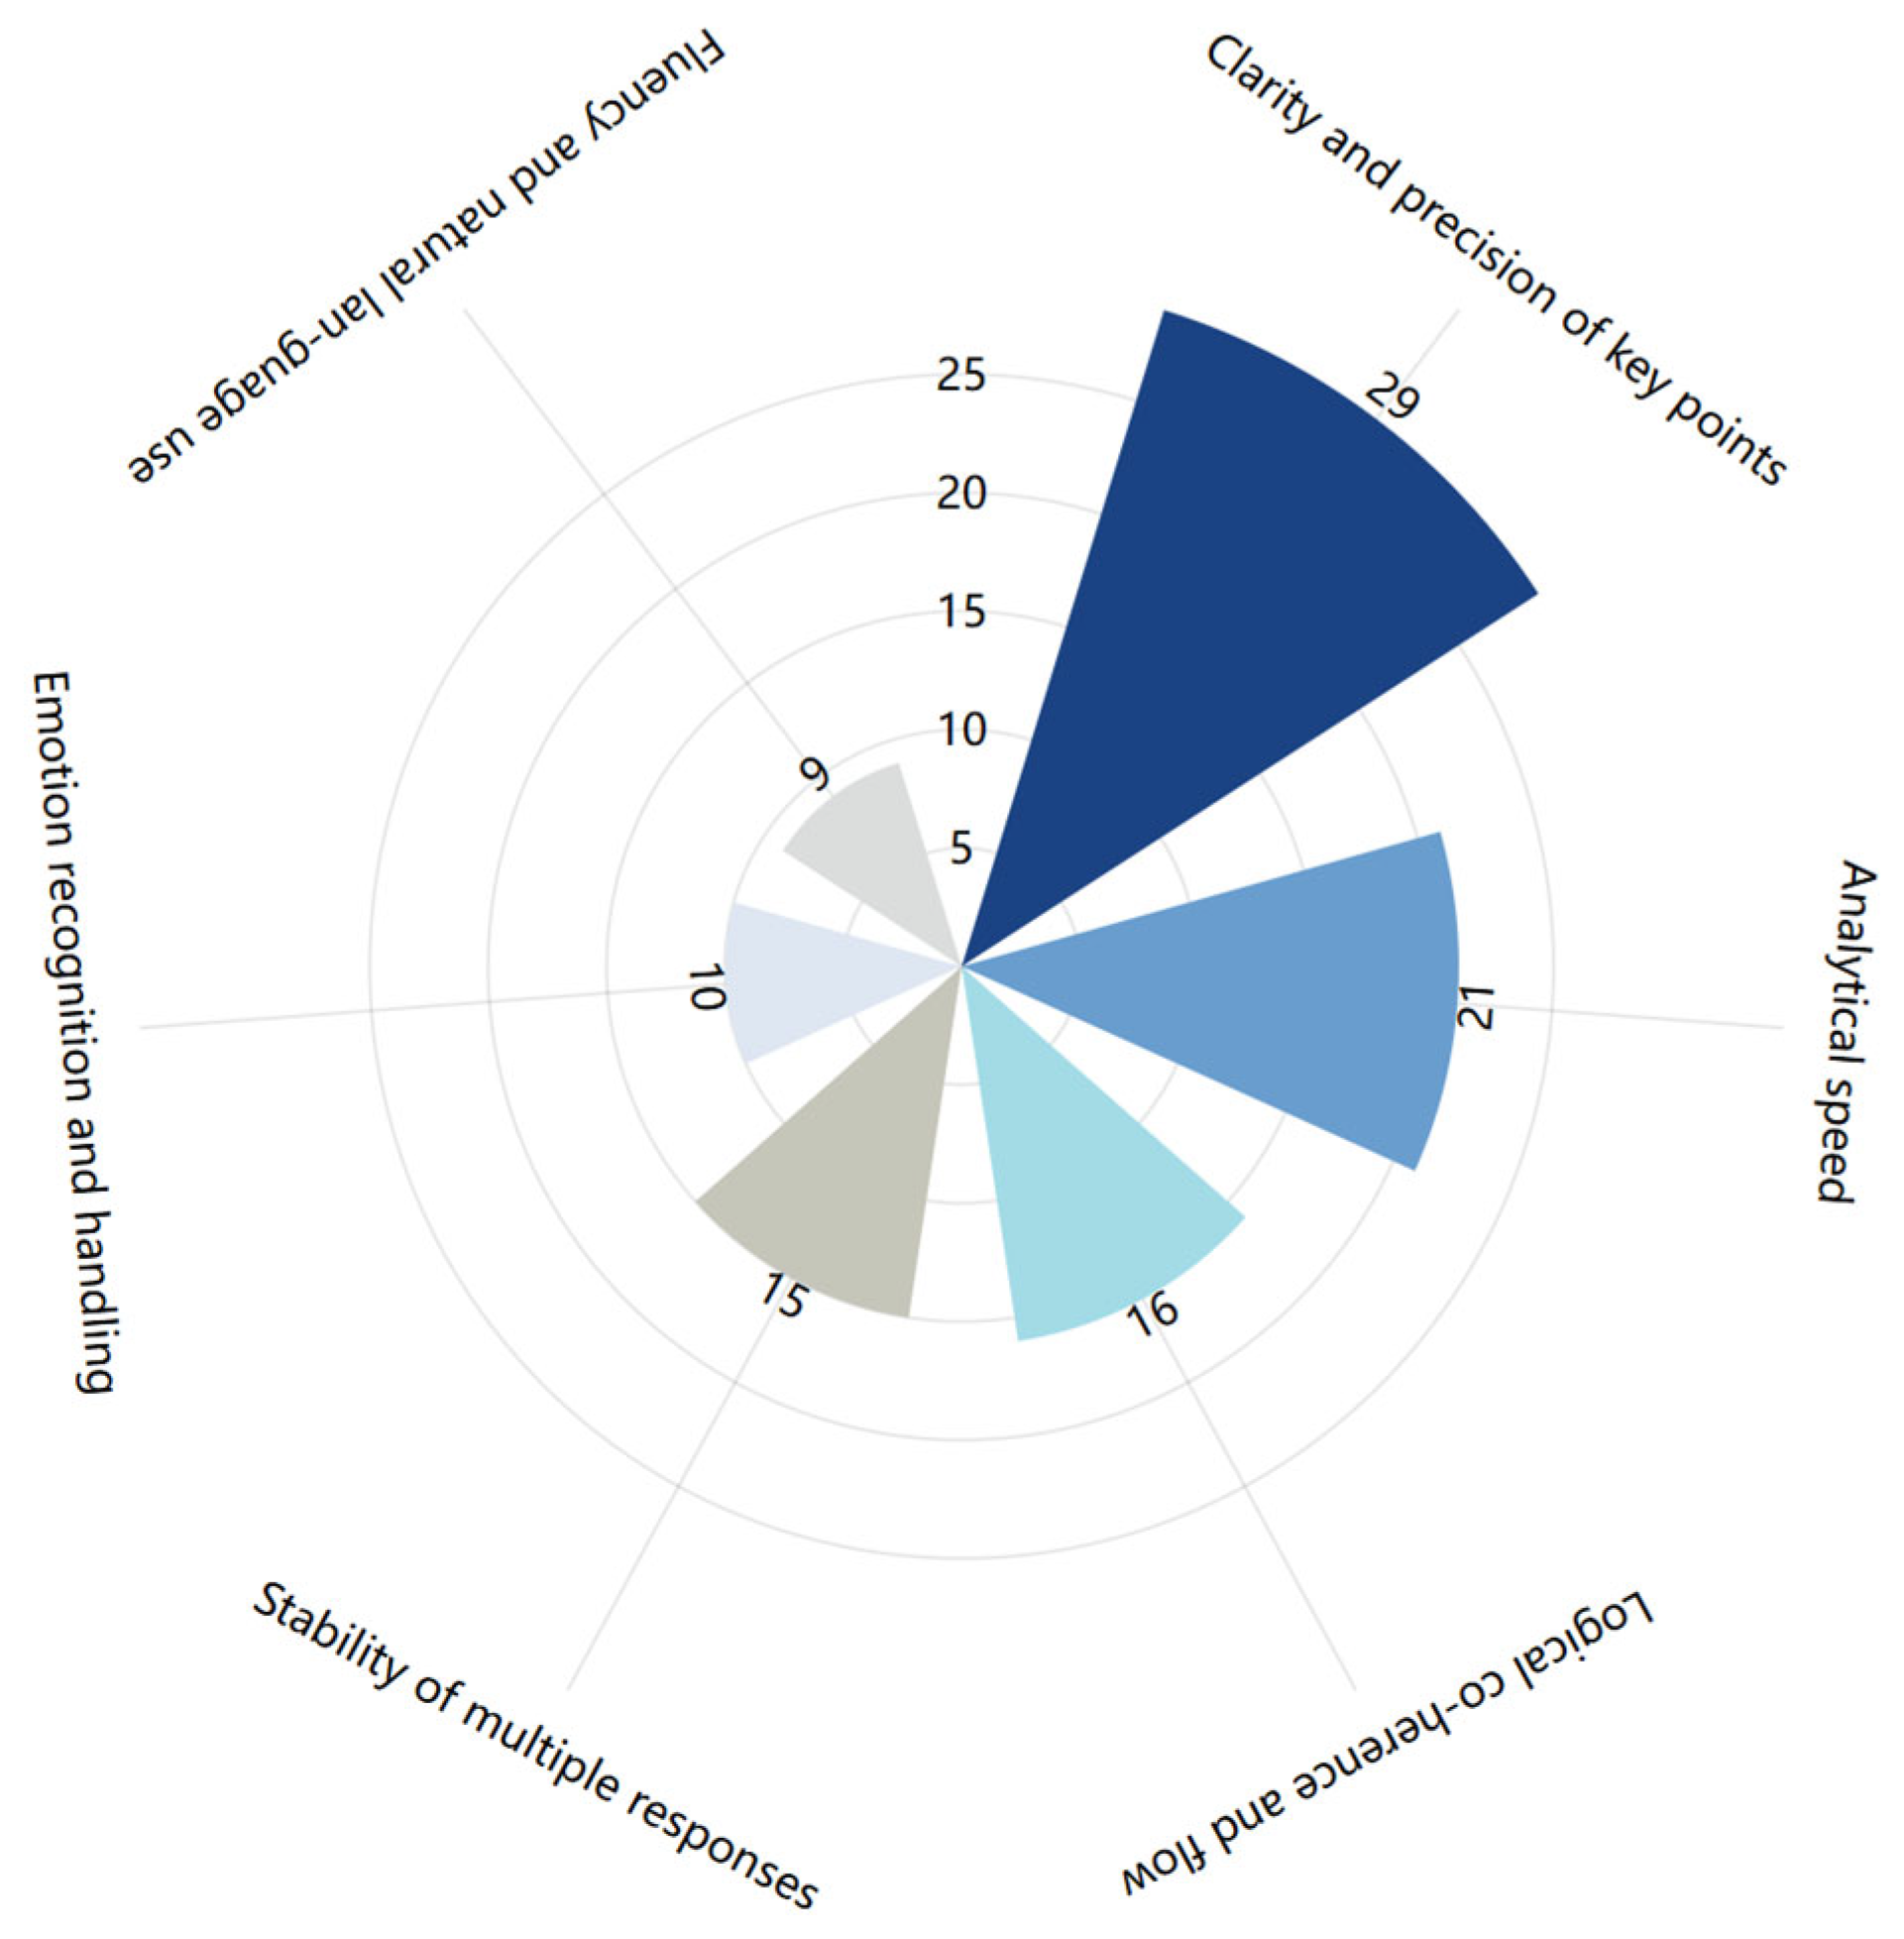
The final evaluation index system is shown in Figure 4. Therefore, the weighted scores of different LLMs on the analysis ability of each interview result can be calculated according to the weights of the six indicators.
3. Model Analysis Results Comparison
In assessing the differences in model scores, Welch’s ANOVA test is employed to determine whether the differences are significant. Post hoc multiple comparisons using the LSD method are conducted to explore whether the differences between pairs of models are significant. The significance level is set at 5%.

2.4. Ethical Statements

In this study, 29 participants were recruited to conduct a simulated driving experiment using a driving simulator. The study was approved by the Research Office of Xi’an University of Posts and Telecommunications, as it posed minimal risk to participants. Informed consent was obtained from all participants prior to their involvement in the experiment, and the study was conducted in accordance with the relevant guidelines and institutional regulations for research involving human participants.

3. Results

3.1. Comparison of Questionnaire and Interview Results

The questionnaire results and interview results are compared based on six questions. The degree of consistency in the selection tendencies between the two is categorized into three levels: consistent (represented by 1), partially consistent (represented by 0.5), and inconsistent (represented by 0). The comparison results are presented in the following Figure 5. Additionally, the observed mix of agreement and disagreement between questionnaires and interviews can be interpreted as coexisting symmetric and asymmetric patterns in the representation of driver perceptions. This pattern suggests that while certain perceptions are symmetric across methods, other aspects are asymmetric method.
From the results, it can be observed that half of the questionnaire and interview responses regarding emotional attitudes and choice tendencies are consistent, with 17% partially consistent and 33% inconsistent. This indicates significant differences between the results obtained from the questionnaire and interviews.
From the analysis process, several points can be summarized:
1. Comprehensive Nature of Interviews
Compared to questionnaire surveys, interviews provide richer subjective information from drivers.
For example, in response to Question 1, interviews not only address whether individuals find it easy to be distracted but also elaborate on factors causing distraction such as driving experience, skill level, driving condition, fear of accidents (vehicle, weather), driving environment, familiarity with road conditions, road shape and length, road signs, visual illusions, and chatting.
For Question 4, the attitude towards road studs shifts from negative to positive for some respondents, as seen in the interview results, while the questionnaire cannot capture this change in sentiment.
For Question 5, where the questionnaire offers single-choice options, many respondents, such as the 25th, 27th, 28th, and 29th respondents, believe that road markings are helpful for both left and right turns. However, due to their inherent preferences, they only select one option in the questionnaire. Moreover, the questionnaire does not differentiate between road markings and road studs, whereas interviews reveal differing attitudes towards the two types of markers.
For Question 6, while the questionnaire options are limited to road marking colors, interviewees mention additional characteristics such as brightness, shape, size, intermittent appearance, etc. Furthermore, many suggestions for improvement in various aspects within tunnels are raised in interviews, beyond just road markings.
2. Limitations of Questionnaires
Compared to interviews, questionnaire surveys have many limitations. The structured nature of this method greatly reduces flexibility, and respondents’ motivation to fill out questionnaires may be significantly influenced in unsupervised settings.
Due to the format of questionnaires, although some questions provide a “self-fill” option as a supplement, in reality, the vast majority of respondents do not choose this option and fill it out. However, from the interview results, it is evident that their primary choices are often not within the range of options provided in the questionnaire.
For example, the eighth respondent mentions in the interview for Question 2 that they have “no feelings of anxiety or unease,” yet the questionnaire options do not include “no concerns,” forcing them to select an anxiety-inducing factor to some extent.
For the fourth question, many interviewees mention that road markings can make the environment appear brighter and improve visibility, but these options are not available in the questionnaire, and no one selects the self-fill option.
3. Design Details of Questionnaires
Additionally, it is worth noting a specific case regarding the response of respondent number 15 to Question 4. The questionnaire results indicate that the assistance level for driving in Scenario 3-2-1 is rated as 3-4-4 (on a 5-point scale), while the interview results show that the respondent holds a positive attitude towards both road studs and road markings. The inconsistency may be due to the respondent misinterpreting the sequence, as the experiment simulated driving in Scenario 1-2-3, whereas the questionnaire required scoring in the order of Scenario 3-2-1. This also underscores the importance of aligning the questionnaire sequence with the experimental sequence in questionnaire design.
In summary, the characteristics of questionnaires include efficiency and time-saving benefits, but they are limited by their restricted options, singular nature, lack of detailed elaboration, low tolerance, and minimal selection of self-fill options. Interviews, on the other hand, are slower but provide comprehensive survey information, with relatively accurate results. Respondents are less likely to mishear information during interviews, and even if they do, there is a possibility of correction through follow-up questioning.

3.2. Comparison of Sentiment Analysis Levels Between GPT-3.5 and GPT-4

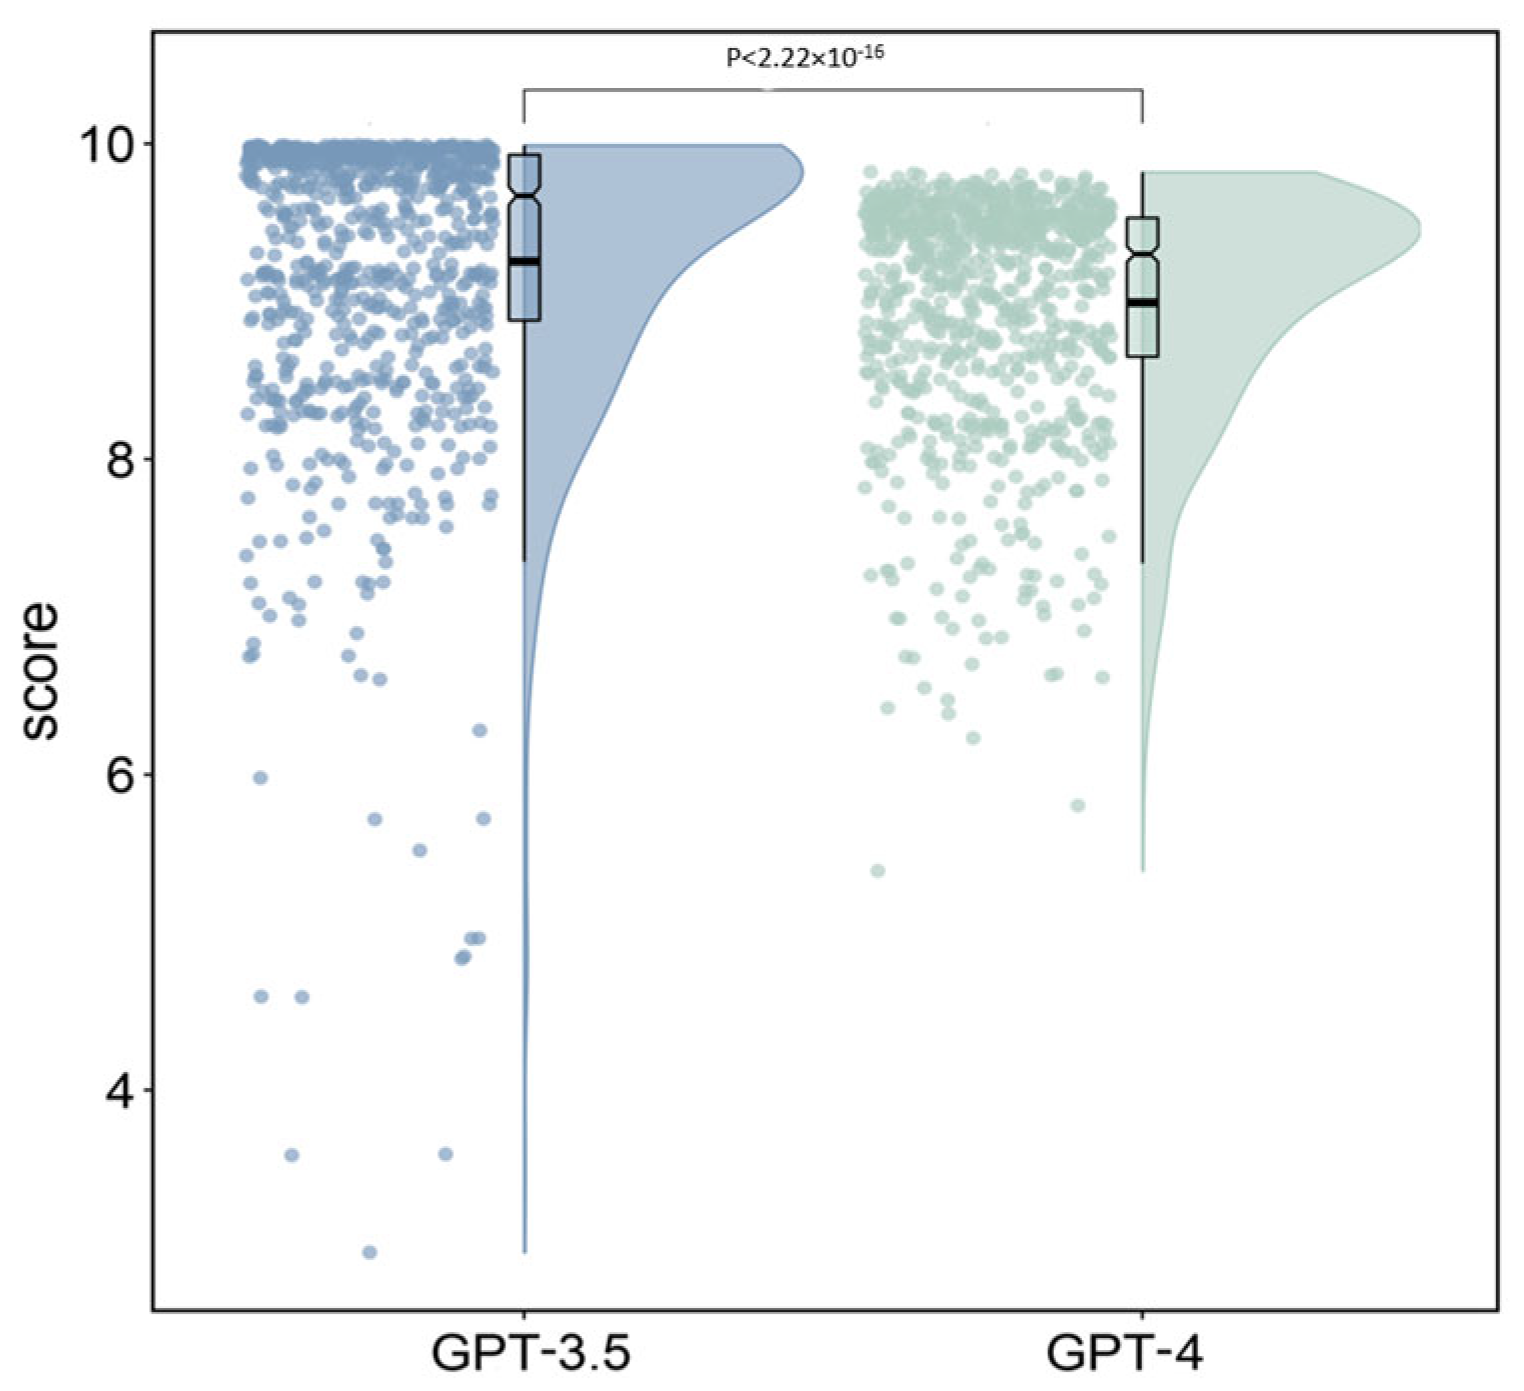
The scores of sentiment analysis between GPT-3.5 and GPT-4 are compared. The following Figure 6 depicts the distribution of weighted scores for both models. Combining scatter plots, box plots, and violin plots, the figure provides a multi-dimensional portrayal of the score data characteristics for the two models. In the box plot, the upper limit, concavity, and lower limit represent the quartiles, with the bold black line indicating the mean value.
Through the distribution of box lengths, scatter plots, and violin plots, it is observed that the scores of GPT-4 are more concentrated. This indicates that in terms of analysis stability, GPT-4 shows slight superiority over GPT-3.5. However, the average scores of GPT-3.5 and GPT-4 are 9.25 and 9, respectively. Focusing on the box plot, it can be observed that the quartiles and mean values of GPT-3.5 are higher than those of GPT-4. Furthermore, Welch’s ANOVA test was conducted on the two sets of data, resulting in p < 0.05, indicating significant differences in scores between different models. Therefore, it can be concluded that GPT-3.5 demonstrates significantly better sentiment analysis capabilities for tunnel interviews compared to GPT-4, although its stability is slightly lower.
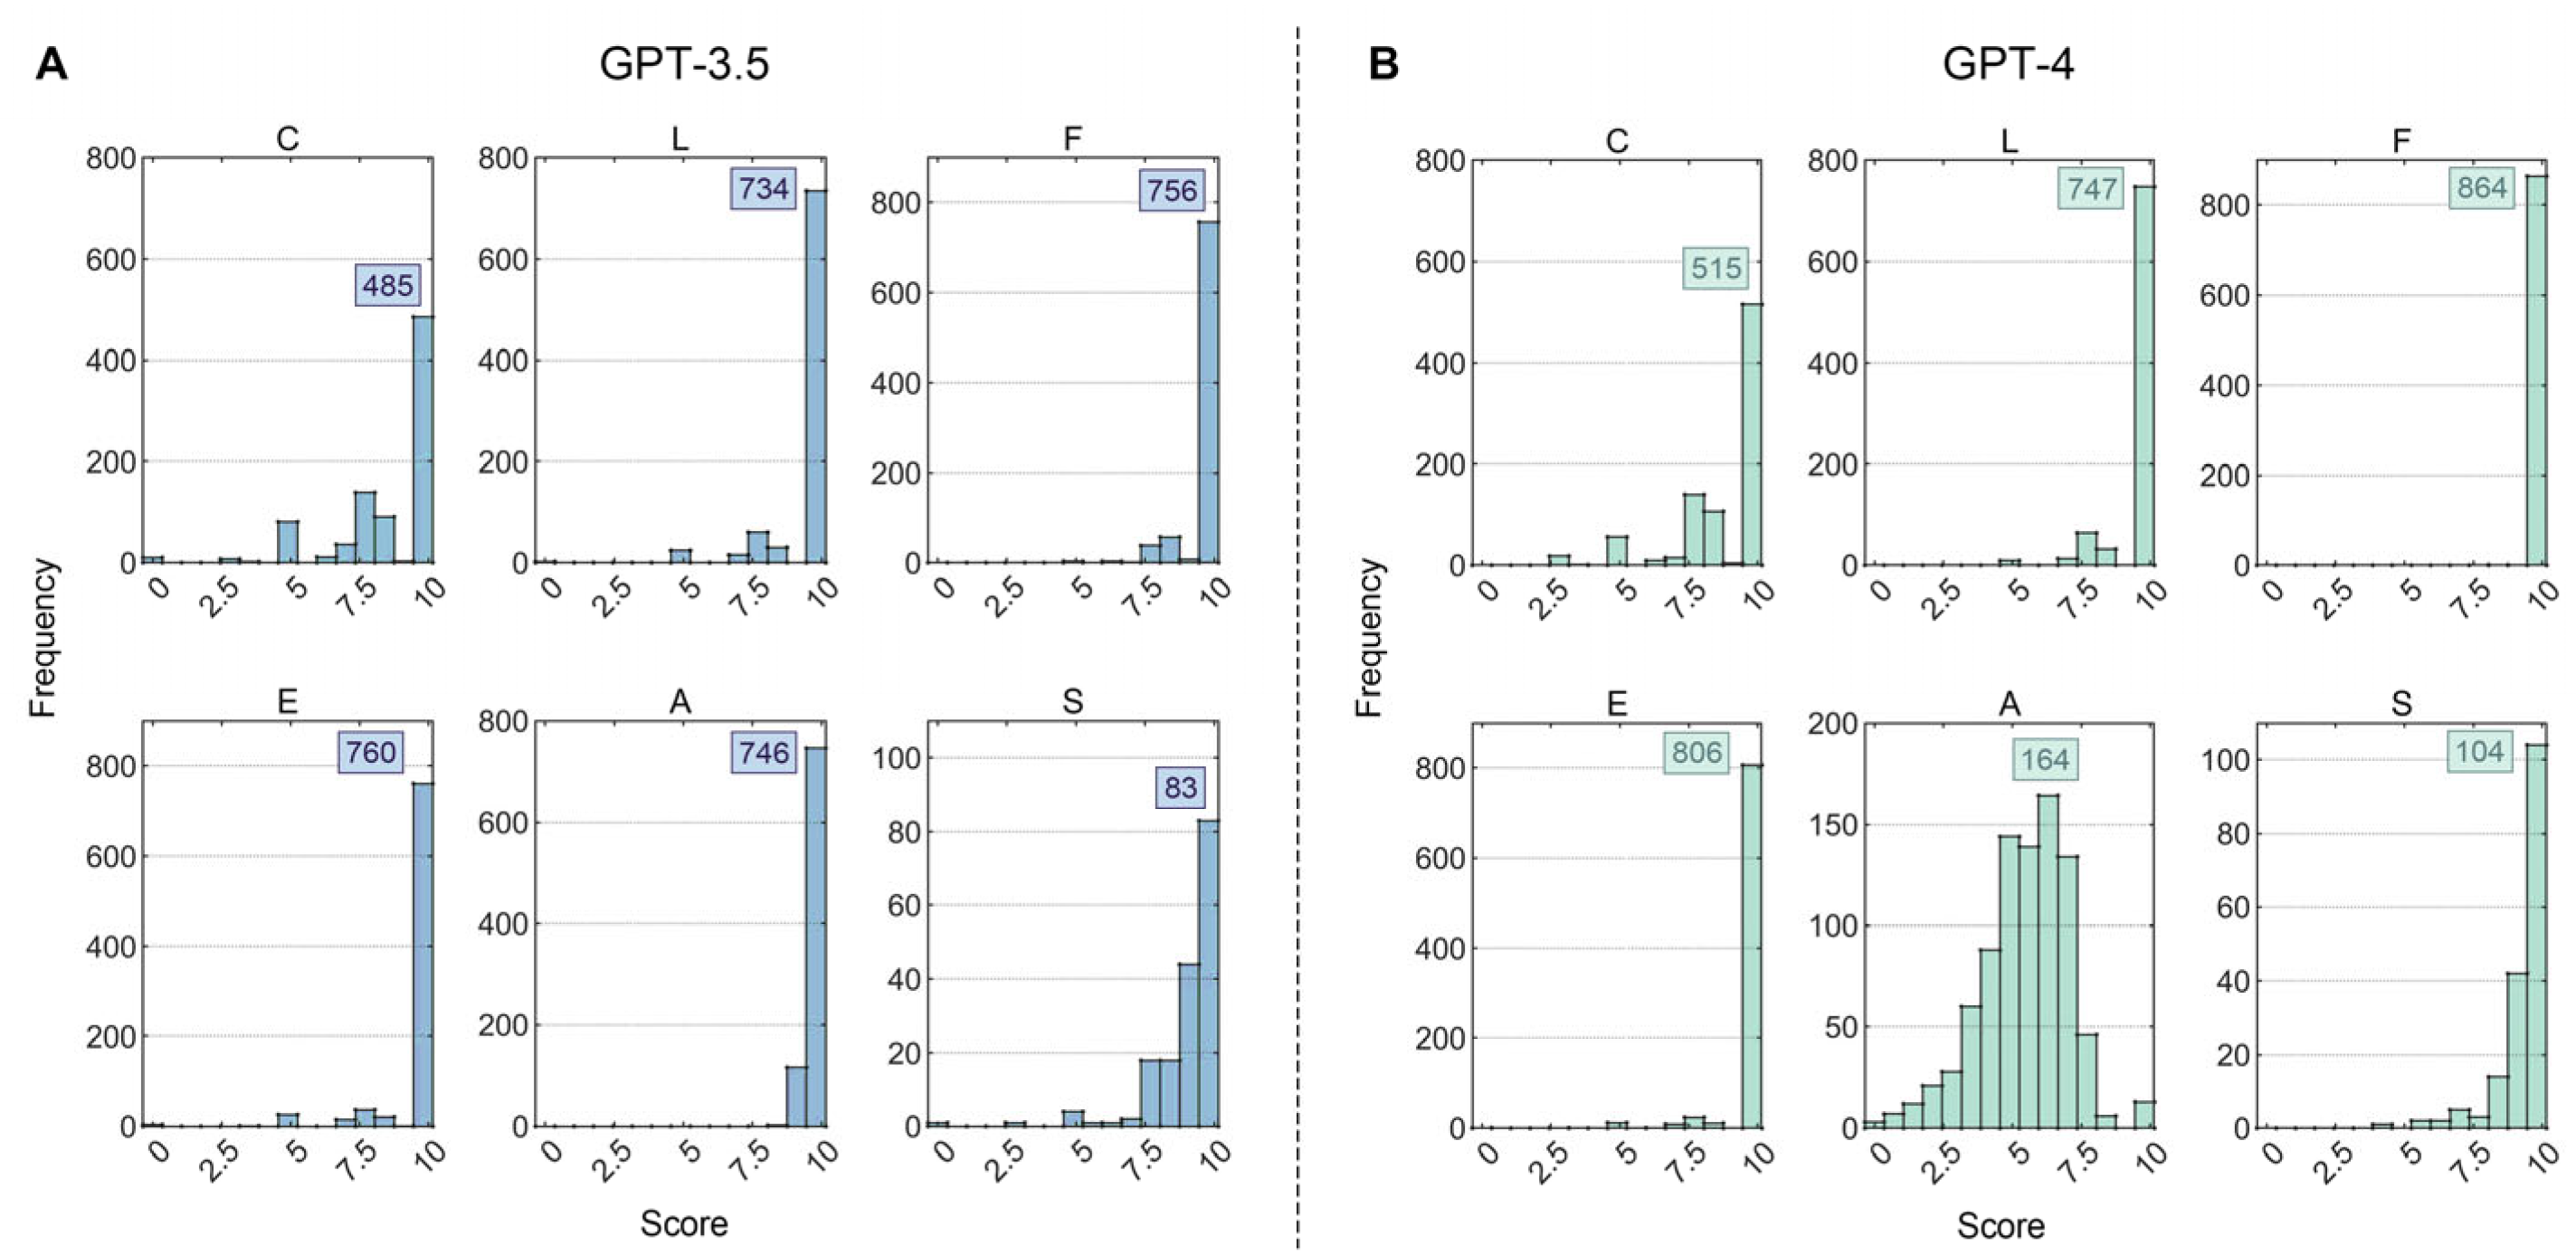
Specifically, the scores of the two models can be analyzed and classified according to different criteria. The distribution of scores classified by 6 questions shows no significant difference, so we can explore the analysis level of the two models based on the 6 indicators. Figure 7 presents histograms of scores for each indicator, where the horizontal axis represents the score and the vertical axis represents the frequency. Figure 7A,B, respectively, depict the score distribution of GPT-3.5 and GPT-4.
Firstly, the scores of the six indicators for GPT-3.5 were subjected to a test for heterogeneity, yielding p < 0.05, indicating significant differences among the scores of different indicators. Post hoc multiple comparisons using the LSD method were conducted, and the results are presented in Table 1. The results revealed no significant differences between L and E, L and A, and E and A, while significant differences were observed among the other parameters. Additionally, from Figure 7A, it is evident that the distributions of L, E, and A are quite similar, with the majority of analysis results clustering around 10 points. Similarly, the distribution patterns of the F indicator and the aforementioned three parameters exhibit minor variations, suggesting relatively consistent performance across logical sequencing, emotional recognition, analysis speed, and grammatical expression in GPT-3.5’s analyses. However, the distributions of the C and S indicators are more dispersed, with a higher proportion of low-scoring analysis results. This indicates that GPT-3.5 performs comparably across logical sequencing, emotional recognition, analysis speed, and grammatical expression, but slightly lags behind in the refinement of key points based on comprehensive text understanding and the stability of responses derived from the first five indicators.
Secondly, a test for heterogeneity was conducted on the scores of the six indicators for GPT-4, yielding p < 0.05, indicating significant differences among the scores of different indicators. Post hoc multiple comparisons using the LSD method were performed, and the results are presented in Table 8. The results indicated that all parameters exhibited significant differences with p < 0.05. Figure 7B illustrates that although the majority of analysis results for L, F, and E are close to 10 points, there are slight variations in their score distributions. The distributions of the C, A, and S indicators are relatively dispersed, with more low scores observed. This suggests that GPT-4 excels in grammatical expression, nearly achieving full marks. Subsequently, emotional recognition and logical sequencing perform slightly lower but still maintain a relatively high level. Similar to GPT-3.5, GPT-4 falls short in the refinement of key points and the stability of responses. Notably, GPT-4 exhibits the poorest performance in analysis speed, with scores ranging from 0 to 10 points, roughly following a normal distribution centered around a mean of 6. This is largely attributed to the high sensitivity of GPT-4’s analysis time to the number of words processed, as observed during the analysis, where the duration of analysis significantly increased with the increase in the number of words in the interview text.
Finally, a cross-sectional comparison was conducted between GPT-3.5 and GPT-4 regarding the distribution of scores for the same indicators. The results of the difference test indicated that the p-value for the indicator L was 0.055, which is greater than 0.05, indicating that there is no significant difference between the models in terms of the L indicator scores. For the remaining five indicators, the p-values were less than 0.05, indicating significant differences between the models in the scores of the remaining five indicators. Further effect size quantification analysis revealed that there was a minimal difference in scores between the models for the C and E indicators, a small difference for the F and S indicators, and a large difference for the A indicator. From Figure 4, it can be observed that for the C, L, and E indicators, the high-score analysis results of GPT-4 were slightly higher than those of GPT-3.5. Additionally, for the F and S indicators, the high-score analysis results of GPT-4 were considerably higher than those of GPT-3.5. However, the distribution of scores for the A indicator between the two models differed significantly. The scores of GPT-3.5 were mostly concentrated between 8 and 10, whereas the scores of GPT-4 were dispersed between 0 and 10, with the majority falling between 3 and 7, significantly lower than the former.
In conclusion, despite GPT-4 outperforming GPT-3.5 in terms of key point extraction, logical sequencing, fluency of sentences, emotion recognition, and stability, particularly in fluency of sentences and stability, the slow response speed of GPT-4, typically 7–15 times longer in analysis duration compared to GPT-3.5, significantly lowered the weighted scores of GPT-4 analysis results. Consequently, from a weighted perspective, the emotional analysis level of GPT-3.5 was significantly superior to that of GPT-4.

3.3. Comparison of Sentiment Analysis Performance Between Google-Gemini and ChatGPT

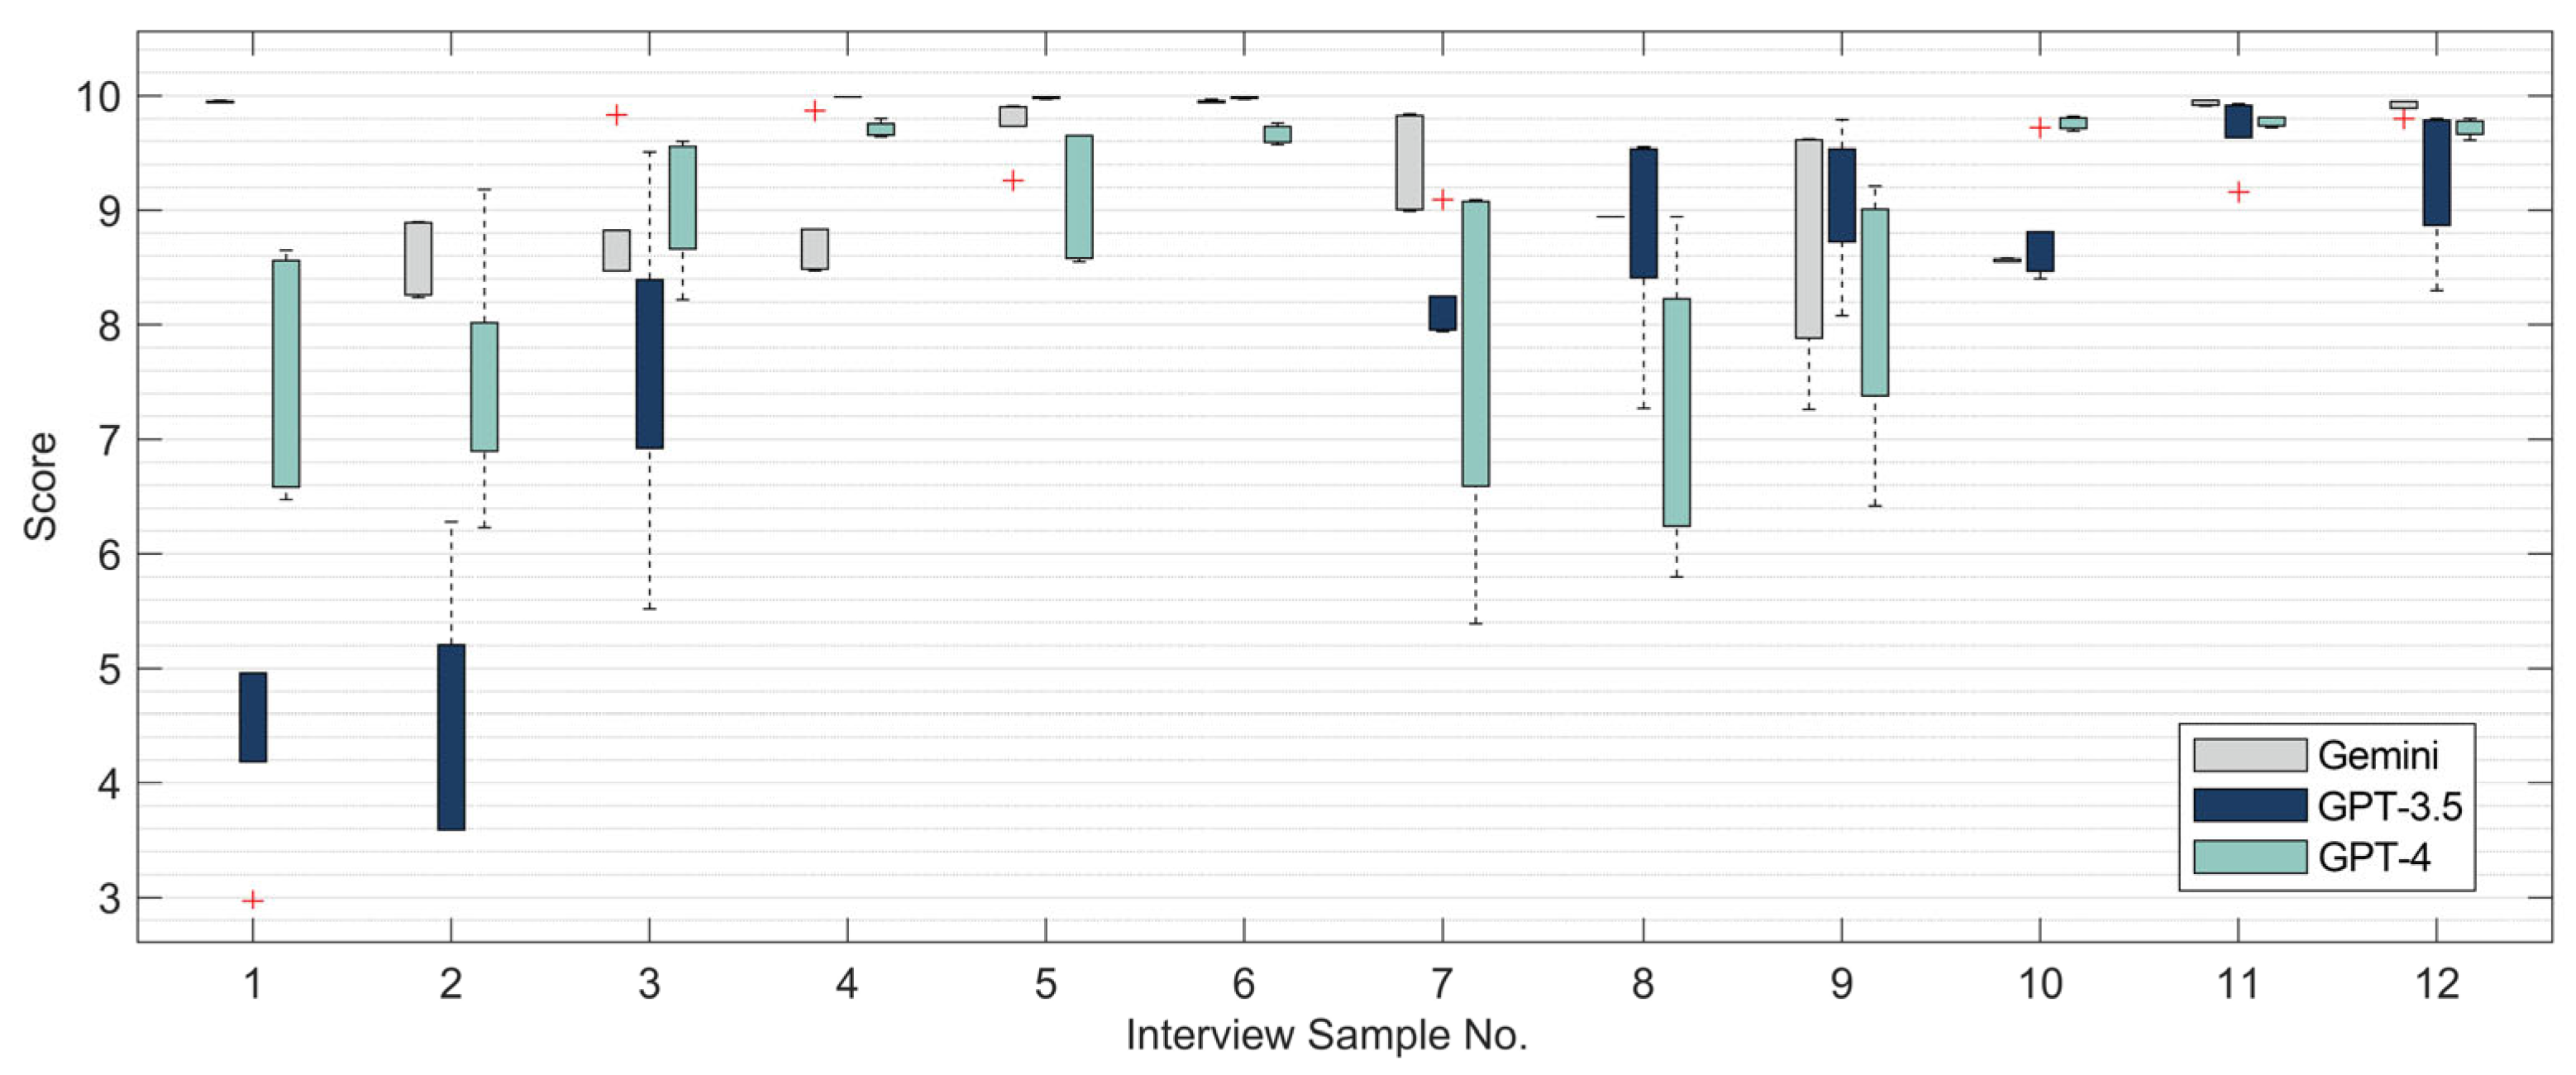
In this sub-study, we conducted further comparison of the sentiment analysis performance between Google-Gemini and the previously mentioned GPT-3.5 and GPT-4 models, using a selected set of representative interview results as samples. Following Sandmann’s methodology for sample selection [58], we chose interview samples that ranked third from the bottom and top three in the weighted scores of GPT-3.5 and GPT-4, respectively. It is important to note that our comparison of LLM performance, specifically for GPT-3.5, GPT-4, and Google-Gemini, primarily relied on a targeted sampling strategy. Transcripts were selected based on their scores, focusing on the “bottom third and top three” to highlight clear performance distinctions. While this approach effectively illustrates the inherent differences and trade-offs between models, it does not constitute a comprehensive, randomly sampled representation of the entire dataset. Consequently, the findings from this specific comparison should be interpreted as illustrative examples of model behavior under varying performance scenarios, rather than exhaustive population-level assessments. Future research employing systematic random sampling or analyzing the full dataset would be beneficial to further generalize these findings. In addition, it is important to note that since each interview result was analyzed five times, if there were any duplicates in the selection due to ranking, they were skipped.
After analyzing and scoring the selected interview samples using Google-Gemini, the scores of the three models are compared as shown in Figure 8. The horizontal axis represents the interview sample scores, with 1–6 indicating the last three and first three samples analyzed by GPT-3.5, and 7–12 indicating the last three and first three samples analyzed by GPT-4. The vertical axis represents the scores of the interview samples, with red marks indicating outliers.
Based on the criteria for selecting representative interview results, the scores are divided into four groups for differential analysis, namely, the reverse and forward order scores of GPT-3.5 and GPT-4 for the three interview samples. Welch’s variance test is used, and the p values for the four sample groups all satisfy p < 0.05, indicating significant statistical differences in scores among the different models. Subsequently, LSD method is used for post hoc multiple comparisons to explore whether there are significant differences between the three models pairwise. The comparison results of the four groups of interview samples are as follows:
1. GPT-3.5 Last Three:
The mean scores of the three models are ranked as follows: Google-Gemini > GPT-4 > GPT-3.5, with significant differences observed between GPT-3.5 and GPT-4, GPT-3.5 and Google-Gemini, and GPT-4 and Google-Gemini.
2. GPT-3.5 First Three:
The mean scores of the three models are ranked as follows: GPT-3.5 > Google-Gemini > GPT-4, with significant differences observed between GPT-3.5 and GPT-4, and GPT-3.5 and Google-Gemini.
3. GPT-4 Last Three:
The mean scores of the three models are ranked as follows: Google-Gemini > GPT-3.5 > GPT-4, with significant differences observed between GPT-3.5 and GPT-4, and GPT-4 and Google-Gemini.
4. GPT-4 First Three:
The mean scores of the three models are ranked as follows: GPT-4 > Google-Gemini > GPT-3.5, with significant differences observed between GPT-3.5 and GPT-4.
In summary, in the samples where GPT-3.5 has the poorest analysis performance, Google-Gemini’s analysis level is significantly higher than that of GPT-4. In the samples where GPT-3.5 has the best analysis performance, Google-Gemini’s analysis level is similar to that of GPT-4. In the samples where GPT-4 has the poorest and best analysis performance, Google-Gemini’s analysis level is similar to that of GPT-3.5. Therefore, if the model used as the selection criterion is only considered as a filtering mechanism without participating in the comparison, it can be found that the analysis ability of the Google-Gemini model is always greater than or equal to that of the GPT models. This also indicates that compared to the GPT models, Google-Gemini is more stable.
Additionally, to further investigate the analysis capabilities of the three models, we calculated the average scores of the six indicators for the five analyses of the 12 interview samples, as shown in Figure 9. The three circular bar charts correspond to the scores of the three models, and the six colors represent the six indicators. The height of the bars is proportional to the scores, with a maximum score of 10 points.
1. Clarity and precision of key points
From the analysis of interview samples, the sequence of scores for the three models from highest to lowest is Google-Gemini, GPT-4, and GPT-3.5. It is evident from the modeling process that Google-Gemini excels in refining key points with greater precision and providing more detailed output results. However, Google-Gemini’s compliance with instructions is not as strong as GPT’s. Despite repeated requests not to include notes and suggestions, the language model tends to add similar text under a different heading.
2. Logical coherence and flow
From the analysis of interview samples, the sequence of scores for the three models from highest to lowest is GPT-4, Google-Gemini, and GPT-3.5. Google-Gemini’s slight inferiority to GPT-4 lies in the summarization of interview results. While Google-Gemini provides a summary of viewpoints at the end of the output, the summaries for some samples are excessively verbose, almost repeating the earlier analysis points. Consequently, the high repetition rate of emotional analysis results affects the coherence of logic and leads to deductions.
3. Fluency and natural language use
From the analysis of interview samples, both Google-Gemini and GPT-4 score full marks, surpassing GPT-3.5. Google-Gemini and GPT-4 exhibit high compatibility with Chinese, with accurate word choices, smooth sentences, correct grammar, and natural language usage in their output results. In contrast, GPT-3.5’s contextual word usage is sometimes peculiar and stiff, resulting in less fluent reading and a more noticeable mechanical feel.
4. Emotion recognition and handling
From the analysis of interview samples, the sequence of scores for the three models from highest to lowest is Google-Gemini, GPT-4, and GPT-3.5. Due to Google-Gemini’s higher compatibility with Chinese, its understanding of Chinese text is also superior. For expressions that are not straightforward or contexts that are more confusing, Google-Gemini can provide more accurate emotion recognition results.
5. Analytical speed
From the analysis of interview samples, the sequence of scores for the three models from highest to lowest is GPT-3.5, Google-Gemini, and GPT-4. Although Google-Gemini’s emotional analysis quality is similar to GPT-4’s, its analytical speed far exceeds that of GPT-4, being only slightly slower than GPT-3.5 by 2 to 5 s.
6. Stability of multiple responses
From the analysis of interview samples, the sequence of scores for the three models from highest to lowest is Google-Gemini, GPT-3.5, and GPT-4. This indicates that Google-Gemini’s emotional analysis level is more stable compared to the two GPT models. This is also evident from the textual output, where Google-Gemini’s five analyses tend to be consistent in key points, sequence, and emotional judgments, with differences mainly in wording.

4. Discussion

4.1. Conclusions

Questionnaire responses are often constrained by pre-set options, which may not accurately reflect respondents’ true feelings, while interviews allow for greater flexibility and immediacy, leading to more sincere and engaged responses. This disparity aligns with findings from previous research [59,60], suggesting that while questionnaires are efficient for questions that require straightforward answers, interviews are more effective for exploring underlying reasons and eliciting comprehensive feedback. Careful attention to questionnaire design, including precise question descriptions and well-considered option choices, is essential to minimize ambiguities and enhance data quality.
In comparing the performance of GPT-3.5 and GPT-4 in sentiment analysis of interview texts, our results indicated that GPT-4 provides higher analysis quality and more detailed output, but at a significant cost in processing time, typically taking 7 to 15 times longer than GPT-3.5. A comprehensive analysis reveals that the performance differences between the two versions of ChatGPT, GPT-3.5 and GPT-4, can be summarized in the following five aspects: (1) Compared to GPT-3.5, GPT-4 exhibits higher compatibility with Chinese, leading to significantly improved text comprehension and naturalness of output; (2) GPT-4’s analysis becomes more comprehensive, although sometimes appearing somewhat verbose and repetitive. However, it can also provide precise and detailed summaries of interview texts; (3) GPT-4 demonstrates stronger autonomous learning during the analysis process compared to GPT-3.5; (4) In the process of conducting sentiment analysis five times on the same interview text, GPT-4’s analysis is more stable relative to GPT-3.5, with improvements over time; (5) More detailed analysis and longer text output contribute to GPT-4 requiring more time to process interview texts.
The comparative results of sentiment analysis on Chinese traffic interviews using GPT-3.5 and GPT-4 in this study are consistent with other studies conducted using different tests and languages. Sandmann et al. [58] evaluated the clinical accuracy of GPT-3.5 and GPT-4, with the results indicating superior performance of GPT-4. Watari et al. [61] assessed the performance of large language models (LLMs) in answering Japan Radiology Board Examination (JRBE) questions, with GPT-4 scoring 65% when answering Japanese questions, superior to GPT-3.5 and Google Bard. Rosoł et al. [62] evaluated the performance of GPT-3.5 and GPT-4 in the Polish Medical Final Examination (MFE), with GPT-4 outperforming GPT-3.5 in all three English and Polish versions of the exam. Madrid-García et al. [63] evaluated the performance of GPT-3.5 and GPT-4 in answering rheumatology questions in the Spanish Medical Resident Admission Exam (MIR), with the latter exhibiting better performance. Brin et al. [64] compared the performance of GPT-3.5 and GPT-4 in the USMLE Step 2 Clinical Skills Assessment, with GPT-4’s performance superior to GPT-3.5, increasing the correct answer rate from 62.5% to 90%. Additionally, GPT-4 showed empathy and stronger consistency in subsequent queries.
In the sub-study, the Google-Gemini model demonstrated remarkable performance, surpassing ChatGPT in the indicators of Clarity and Precision of Key Points, Emotion Recognition and Handling, and Stability of Multiple Responses. In terms of Fluency and Natural Language Use, both Google-Gemini and GPT-4 exhibited higher compatibility with Chinese than GPT-3.5. Regarding the Logical Coherence and Flow indicator, Google-Gemini outperformed GPT-3.5 but slightly lagged behind GPT-4, primarily due to the higher repetition rate in Google-Gemini’s analysis summaries, which resulted in less smooth logic. For the Analytical Speed indicator, Google-Gemini was slightly slower than GPT-3.5 but significantly faster than GPT-4. In summary, the Google-Gemini model rivals GPT-4 in analysis quality while being closer to GPT-3.5 in analysis speed.
The comparative analysis of the analysis results of ChatGPT and Google-Gemini on Chinese traffic interviews in this study remains consistent with the findings of another research. Masalkhi et al. [65] compared the analysis levels of ChatGPT and Google-Gemini in the field of ophthalmology. Although the two language models differ in various aspects of language processing and response generation, Google-Gemini demonstrates unique advantages in areas such as language understanding. Kaftan et al. [66] evaluated the effectiveness of GPT-3.5, Copilot, and Google-Gemini in explaining biochemical data evaluated in the laboratory. The results showed that Copilot achieved the highest accuracy, followed by Google-Gemini, and then GPT-3.5.

4.2. Implications for Transportation Research and Practical Applications

The findings of this study extend beyond a mere technical comparison of LLMs; they offer tangible insights and guidelines for transportation researchers and practitioners engaged in driver behavior and psychological assessment.
The distinct performance profiles of GPT-4, GPT-3.5, and Google-Gemini directly influence their suitability for different assessment scenarios. GPT-4’s superior performance in clarity, logical coherence, and emotion recognition makes it an excellent tool for post hoc, in-depth analysis where accuracy is paramount. For instance, in investigating the root causes of traffic accidents or understanding complex driver emotional responses to new road designs, GPT-4’s detailed summaries can uncover nuances that might be missed by human coders or simpler models, albeit at the cost of longer processing time. Conversely, GPT-3.5’s exceptional speed makes it suitable for high-throughput screening applications. Researchers conducting large-scale surveys with thousands of open-ended responses could use GPT-3.5 to quickly categorize data, identify common themes, and flag critical responses for further human review. Google-Gemini emerges as the most balanced option, offering analysis quality closer to GPT-4 while maintaining a speed much faster than GPT-4. This makes it ideal for routine analysis tasks that require a good balance between depth and efficiency, such as periodically analyzing driver feedback from simulation studies or public surveys.
Based on our comparative analysis, we provide the following specific recommendations for transportation researchers:
1. For rapid screening and large-scale data processing:
Prioritize GPT-3.5 to achieve the fastest turnaround time. This is optimal for initial data exploration and processing large volumes of interview transcripts where extreme depth can be traded for speed.
2. For detailed, nuanced psychological assessment where accuracy is critical:
Use GPT-4 despite its slower speed. This is essential for studies aiming to extract subtle emotional cues, complex reasoning, or for generating rich qualitative insights for publication and policy-making.
3. For a balanced approach in most routine research tasks:
Google-Gemini is highly recommended. It provides robust analysis quality superior to GPT-3.5 and GPT-4, with significantly better speed than GPT-4, representing a practical solution for everyday research needs.
4. General Practice:
Always implement a human-in-the-loop validation step, especially in safety-critical transportation research. Researchers should spot-check AI summaries against original transcripts to ensure reliability and contextual accuracy.
Ultimately, there is no universal LLM solution, the optimal model is determined by a study’s particular goals, sample size, and the required nuance of analysis.
In conclusion, this study highlights the analytical capabilities of large language models in processing interview data within the transportation domain, but further research is needed to assess their performance across different languages and domains. Furthermore, in this paper, by comparing questionnaires, interviews, and three large language models, GPT-3.5, GPT-4, and Google Gemini, it examines the convergence of methods in key points and sentiment assessment, namely the symmetric pattern, as well as the systematic differences among methods, namely the asymmetric pattern. Using symmetry as a framework helps to understand the stability and repeatability of behavioral inferences from different data sources. Additionally, optimizing the evaluation criteria system and exploring the integration and analysis of multimodal data by other large language models could expand AI applications across various fields and enhance research efficiency.

Author Contributions

Conceptualization: R.S., Methodology: R.S. and X.H., Investigation: Y.S. and Z.L., Visualization: B.L., Supervision: Z.L. and B.L., Writing—original draft: X.H. and Y.C., Writing—review and editing: R.S. and Y.S. All authors have read and agreed to the published version of the manuscript.

Funding

This research was funded by 2025 Shaanxi Provincial Philosophy and Social Sciences Research Special Project, No. 2025YB0328; Shaanxi Provincial Social Science Fund, No. 2024D032; Humanities and Social Sciences Project of the Ministry of Education of China, No. 23YJCZH195; Fundamental Research Funds for the Central Universities, CHD, No. 30010234450204, No. 300102345507; Natural Science Basic Research Program Shaanxi, No. 2024JC-YBON-0738, No. 2023-JC-ON-0560.

Data Availability Statement

The original contributions presented in this study are included in the article. Further inquiries can be directed to the corresponding author.

Conflicts of Interest

Author Zhongbin Luo was employed by the company Transportation Industry R&D Center for Autonomous Driving Technology, Chongqing. Author Bin Liu was employed by the company Hunan Province Transportation Planning, Surveying and Design Institute Co., Ltd. The remaining authors declare that the research was conducted in the absence of any commercial or financial relationships that could be construed as a potential conflict of interest.

References

  1. Rattray, J.; Jones, M.C. Essential elements of questionnaire design and development. J. Clin. Nurs. 2007, 16, 234–243. [Google Scholar] [CrossRef]
  2. Lefever, S.; Dal, M.; Matthíasdóttir, Á. Online data collection in academic research: Advantages and limitations. Br. J. Educ. Technol. 2007, 38, 574–582. [Google Scholar] [CrossRef]
  3. Kelleher, C.; Cardozo, L.; Khullar, V.; Salvatore, S. A new questionnaire to assess the quality of life of urinary incontinent women. BJOG Int. J. Obstet. Gynaecol. 1997, 104, 1374–1379. [Google Scholar] [CrossRef] [PubMed]
  4. Okumura, M.; Ishigaki, T.; Mori, K.; Fujiwara, Y. Development of an easy-to-use questionnaire assessing critical care nursing competence in Japan: A cross-sectional study. PLoS ONE 2019, 14, e0225668. [Google Scholar] [CrossRef]
  5. Dillman, D.A.; Christenson, J.A.; Carpenter, E.H.; Brooks, R.M. Increasing mail questionnaire response: A four state comparison. Am. Sociol. Rev. 1974, 39, 744–756. [Google Scholar] [CrossRef]
  6. Charlton, R. Research: Is an ‘ideal’ questionnaire possible? Int. J. Clin. Pract. 2000, 54, 356–359. [Google Scholar] [CrossRef]
  7. Krosnick, J.A. Questionnaire design. In The Palgrave Handbook of Survey Research; Springer International Publishing: Cham, Switzerland, 2018; pp. 439–455. [Google Scholar] [CrossRef]
  8. Taras, V.; Steel, P.; Kirkman, B.L. Negative practice–value correlations in the GLOBE data: Unexpected findings, questionnaire limitations and research directions. J. Int. Bus. Stud. 2010, 41, 1330–1338. [Google Scholar] [CrossRef]
  9. Slattery, E.L.; Voelker, C.C.J.; Nussenbaum, B.; Rich, J.T.; Paniello, R.C.; Neely, J.G. A practical guide to surveys and questionnaires. Otolaryngol.-Head Neck Surg. 2011, 144, 831–837. [Google Scholar] [CrossRef] [PubMed]
  10. Choi, B.C.; Pak, A.W. Peer reviewed: A catalog of biases in questionnaires. Prev. Chronic Dis. 2005, 2, A13. [Google Scholar]
  11. Shinohara, Y.; Minematsu, K.; Amano, T.; Ohashi, Y. Modified Rankin scale with expanded guidance scheme and interview questionnaire: Interrater agreement and reproducibility of assessment. Cerebrovasc. Dis. 2006, 21, 271–278. [Google Scholar] [CrossRef]
  12. Meo, A.I. Picturing Students’ Habitus: The Advantages and Limitations of Photo-Elicitation Interviewing in a Qualitative Study in the City of Buenos Aires. Int. J. Qual. Methods 2010, 9, 149–171. [Google Scholar] [CrossRef]
  13. Roulston, K. Interview ‘problems’ as topics for analysis. Appl. Linguist. 2010, 32, 77–94. [Google Scholar] [CrossRef]
  14. Tomlinson, P. Having it both ways: Hierarchical focusing as research interview method. Br. Educ. Res. J. 1989, 15, 155–176. [Google Scholar] [CrossRef]
  15. Young, J.C.; Rose, D.C.; Mumby, H.S.; Benitez-Capistros, F.; Derrick, C.J.; Finch, T.; Garcia, C.; Home, C.; Marwaha, E.; Morgans, C.; et al. A methodological guide to using and reporting on interviews in conservation science research. Methods Ecol. Evol. 2018, 9, 10–19. [Google Scholar] [CrossRef]
  16. Warren, C.A.B.; Barnes-Brus, T.; Burgess, H.; Wiebold-Lippisch, L.; Hackney, J.; Harkness, G.; Kennedy, V.; Dingwall, R.; Rosenblatt, P.C.; Ryen, A.; et al. After the interview. Qual. Sociol. 2003, 26, 93–110. [Google Scholar] [CrossRef]
  17. DiCicco-Bloom, B.; Crabtree, B.F. The qualitative research interview. Med. Educ. 2006, 40, 314–321. [Google Scholar] [CrossRef]
  18. Luitse, D.; Denkena, W. The great transformer: Examining the role of large language models in the political economy of AI. Big Data Soc. 2021, 8, 20539517211047734. [Google Scholar] [CrossRef]
  19. Rathje, S.; Mirea, D.-M.; Sucholutsky, I.; Marjieh, R.; Robertson, C.E.; Van Bavel, J.J. GPT is an effective tool for multilingual psychological text analysis. Proc. Natl. Acad. Sci. USA 2024, 121, e2308950121. [Google Scholar] [CrossRef] [PubMed]
  20. Amin, M.M.; Cambria, E.; Schuller, B.W. Will Affective Computing Emerge From Foundation Models and General Artificial Intelligence? A First Evaluation of ChatGPT. IEEE Intell. Syst. 2023, 38, 15–23. [Google Scholar] [CrossRef]
  21. Tjoa, E.; Guan, C. A survey on explainable artificial intelligence: Toward medical. IEEE Trans. Neural Netw. Learn. Syst. 2020, 32, 4793–4813. [Google Scholar] [CrossRef]
  22. Gunning, D. Explainable Artificial Intelligence; Defense Advanced Research Projects Agency (DARPA): Arlington VA, USA, 2017. [Google Scholar]
  23. Arrieta, A.B.; Díaz-Rodríguez, N.; Del Ser, J.; Bennetot, A.; Tabik, S.; Barbado, A.; Garcia, S.; Gil-Lopez, S.; Molina, D.; Benjamins, R.; et al. Explainable Artificial Intelligence (XAI): Concepts, taxonomies, opportunities and challenges toward responsible AI. Inf. Fusion 2020, 58, 82–115. [Google Scholar] [CrossRef]
  24. Guidotti, R.; Monreale, A.; Ruggieri, S.; Turini, F.; Giannotti, F.; Pedreschi, D. A survey of methods for explaining black box models. ACM Comput. Surv. (CSUR) 2018, 51, 1–42. [Google Scholar] [CrossRef]
  25. Cambria, E.; Poria, S.; Gelbukh, A.; Thelwall, M. Sentiment analysis is a big suitcase. IEEE Intell. Syst. 2017, 32, 74–80. [Google Scholar] [CrossRef]
  26. Wu, T.; He, S.; Liu, J.; Sun, S.; Liu, K.; Han, Q.-L.; Tang, Y. A brief overview of ChatGPT: The history, status quo and potential future development. IEEE/CAA J. Autom. Sin. 2023, 10, 1122–1136. [Google Scholar] [CrossRef]
  27. Jiao, W.; Wang, W.; Huang, J.; Wang, X.; Tu, Z. Is ChatGPT a good translator? Yes with GPT-4 as the engine. arXiv 2023, arXiv:2301.08745. [Google Scholar] [CrossRef]
  28. Achiam, J.; Adler, S.; Agarwal, S.; Ahmad, L.; Akkaya, I.; Aleman, F.L.; Almeida, D.; Altenschmidt, J.; Altman, S.; Anadkat, S.; et al. Gpt-4 technical report. arXiv 2023, arXiv:2303.08774. [Google Scholar] [CrossRef]
  29. Bubeck, S.; Chandrasekaran, V.; Eldan, R.; Gehrke, J.; Horvitz, E.; Kamar, E.; Lee, P.; Lee, Y.T.; Li, Y.; Lundberg, S.; et al. Sparks of artificial general intelligence: Early experiments with gpt-4. arXiv 2023, arXiv:2303.12712. [Google Scholar] [CrossRef]
  30. Liebrenz, M.; Schleifer, R.; Buadze, A.; Bhugra, D.; Smith, A. Generating scholarly content with ChatGPT: Ethical challenges for medical publishing. Lancet Digit. Health 2023, 5, e105–e106. [Google Scholar] [CrossRef]
  31. Bishop, L. A Computer Wrote This Paper: What Chatgpt Means for Education, Research, and Writing. 2023. Available online: https://papers.ssrn.com/sol3/papers.cfm?abstract_id=4338981 (accessed on 30 August 2025).
  32. Grimaldi, G.; Ehrler, B. AI et al.: Machines are about to change scientific publishing forever. ACS Energy Lett. 2023, 8, 878–880. [Google Scholar] [CrossRef]
  33. Chen, Y.; Eger, S. Transformers Go for the LOLs: Generating (Humourous) Titles from Scientific Abstracts End-to-End. In Proceedings of the 4th Workshop on Evaluation and Comparison of NLP Systems, Bali, Indonesia, 1 November 2023; pp. 62–84. [Google Scholar]
  34. Cotton, D.R.; Cotton, P.A.; Shipway, J.R. Chatting and cheating: Ensuring academic integrity in the era of ChatGPT. Innov. Educ. Teach. Int. 2023, 61, 228–239. [Google Scholar] [CrossRef]
  35. Aljanabi, M.; Mohanad, G.; Ahmed Hussein, A.; Saad Abas, A.; ChatGpt. ChatGpt: Open Possibilities. Iraqi J. Comput. Sci. Math. 2023, 4, 62–64. [Google Scholar] [CrossRef]
  36. Azaria, A. ChatGPT Usage and Limitations. 2022. Available online: https://osf.io/preprints/osf/5ue7n_v1 (accessed on 30 August 2025).
  37. Nguyen, Q.; La, V. Academic Writing and AI: Day-4 Experiment with Mindsponge Theory. OSF Preprints 2023. Available online: https://osf.io/preprints/osf/awysc_v1 (accessed on 30 August 2025).
  38. Nordling, L. How ChatGPT is transforming the postdoc experience. Nature 2023, 622, 655. [Google Scholar] [CrossRef] [PubMed]
  39. Yeadon, W.; Inyang, O.-O.; Mizouri, A.; Peach, A.; Testrow, C.P. The death of the short-form physics essay in the coming AI revolution. Phys. Educ. 2023, 58, 035027. [Google Scholar] [CrossRef]
  40. Herbold, S.; Hautli-Janisz, A.; Heuer, U.; Kikteva, Z.; Trautsch, A. A large-scale comparison of human-written versus ChatGPT-generated essays. Sci. Rep. 2023, 13, 18617. [Google Scholar] [CrossRef]
  41. Fijačko, N.; Gosak, L.; Štiglic, G.; Picard, C.T.; Douma, M.J. Can ChatGPT pass the life support exams without entering the American heart association course? Resuscitation 2023, 185, 109732. [Google Scholar] [CrossRef]
  42. Hasani, A.M.; Singh, S.; Zahergivar, A.; Ryan, B.; Nethala, D.; Bravomontenegro, G.; Mendhiratta, N.; Ball, M.; Farhadi, F.; Malayeri, A. Evaluating the performance of Generative Pre-trained Transformer-4 (GPT-4) in standardizing radiology reports. Eur. Radiol. 2023, 34, 3566–3574. [Google Scholar] [CrossRef]
  43. Xue, V.W.; Lei, P.; Cho, W.C. The potential impact of ChatGPT in clinical and translational medicine. Clin. Transl. Med. 2023, 13, e1216. [Google Scholar] [CrossRef]
  44. Antaki, F.; Touma, S.; Milad, D.; El-Khoury, J.; Duval, R. Evaluating the performance of chatgpt in ophthalmology: An analysis of its successes and shortcomings. Ophthalmol. Sci. 2023, 3, 100324. [Google Scholar] [CrossRef]
  45. Jazi, A.H.D.; Mahjoubi, M.; Shahabi, S.; Alqahtani, A.R.; Haddad, A.; Pazouki, A.; Prasad, A.; Safadi, B.Y.; Chiappetta, S.; Taskin, H.E.; et al. Bariatric Evaluation Through AI: A Survey of Expert Opinions Versus ChatGPT-4 (BETA-SEOV). Obes. Surg. 2023, 33, 3971–3980. [Google Scholar] [CrossRef]
  46. Biswas, S.S. Role of ChatGPT in radiology with a focus on pediatric radiology: Proof by examples. Pediatr. Radiol. 2023, 53, 818–822. [Google Scholar] [CrossRef]
  47. Shoufan, A. Exploring Students’ Perceptions of CHATGPT: Thematic Analysis and Follow-Up Survey. IEEE Access 2023, 11, 38805–38818. [Google Scholar] [CrossRef]
  48. Farrokhnia, M.; Banihashem, S.K.; Noroozi, O.; Wals, A. A SWOT analysis of ChatGPT: Implications for educational practice and research. Innov. Educ. Teach. Int. 2023, 61, 460–474. [Google Scholar] [CrossRef]
  49. Kortemeyer, G. Could an artificial-intelligence agent pass an introductory physics course? Phys. Rev. Phys. Educ. Res. 2023, 19, 010132. [Google Scholar] [CrossRef]
  50. Frieder, S.; Pinchetti, L.; Griffiths, R.R.; Salvatori, T.; Lukasiewicz, T.; Petersen, P.; Berner, J.; Chevalier, A. Mathematical capabilities of chatgpt. In Advances in Neural Information Processing Systems; The MIT Press: Cambridge, MA, USA, 2024; p. 36. [Google Scholar]
  51. Susnjak, T.; McIntosh, T.R. ChatGPT: The end of online exam integrity? Educ. Sci. 2024, 14, 656. [Google Scholar] [CrossRef]
  52. Kung, T.H.; Cheatham, M.; Medenilla, A.; Sillos, C.; De Leon, L.; Elepaño, C.; Madriaga, M.; Aggabao, R.; Diaz-Candido, G.; Maningo, J.; et al. Performance of ChatGPT on USMLE: Potential for AI-assisted medical education using large language models. PLoS Digit. Health 2023, 2, e0000198. [Google Scholar] [CrossRef]
  53. Bašić, Ž.; Banovac, A.; Kružić, I.; Jerković, I. ChatGPT-3.5 as writing assistance in students’ essays. Humanit. Soc. Sci. Commun. 2023, 10, 1–5. [Google Scholar] [CrossRef]
  54. Gemini Team; Anil, R.; Borgeaud, S.; Alayrac, J.-B.; Yu, J.; Soricut, R.; Schalkwyk, J.; Dai, A.M.; Hauth, A.; Millican, K.; et al. Gemini: A family of highly capable multimodal models. arXiv 2023, arXiv:2312.11805. [Google Scholar] [CrossRef]
  55. Carlà, M.M.; Gambini, G.; Baldascino, A.; Giannuzzi, F.; Boselli, F.; Crincoli, E.; D’oNofrio, N.C.; Rizzo, S. Exploring AI-chatbots’ capability to suggest surgical planning in ophthalmology: ChatGPT versus Google Gemini analysis of retinal detachment cases. Br. J. Ophthalmol. 2024, 108, 1457–1469. [Google Scholar] [CrossRef]
  56. Han, X.; Shao, Y.; Pan, B.; Yu, P.; Li, B. Evaluating the impact of setting delineators in tunnels based on drivers’ visual characteristics. PLoS ONE 2019, 14, e0225799. [Google Scholar] [CrossRef]
  57. Han, X.; Shao, Y.; Yang, S.; Yu, P. Entropy-based effect evaluation of delineators in tunnels on drivers’ gaze behavior. Entropy 2020, 22, 113. [Google Scholar] [CrossRef]
  58. Sandmann, S.; Riepenhausen, S.; Plagwitz, L.; Varghese, J. Systematic analysis of ChatGPT, Google search and Llama 2 for clinical decision support tasks. Nat. Commun. 2024, 15, 2050. [Google Scholar] [CrossRef]
  59. Harris, L.R.; Brown, G.T. Mixing interview and questionnaire methods: Practical problems in aligning data. Pract. Assess. Res. Eval. 2019, 15, 1. [Google Scholar] [CrossRef]
  60. Denz-Penhey, H.; Murdoch, J.C. A comparison between findings from the DREEM questionnaire and that from qualitative interviews. Med. Teach. 2009, 31, e449–e453. [Google Scholar] [CrossRef]
  61. Watari, T.; Takagi, S.; Sakaguchi, K.; Nishizaki, Y.; Shimizu, T.; Yamamoto, Y.; Tokuda, Y. Performance Comparison of ChatGPT-4 and Japanese Medical Residents in the General Medicine In-Training Examination: Comparison Study. JMIR Med. Educ. 2023, 9, e52202. [Google Scholar] [CrossRef]
  62. Rosoł, M.; Gąsior, J.S.; Łaba, J.; Korzeniewski, K.; Młyńczak, M. Evaluation of the performance of GPT-3.5 and GPT-4 on the Polish Medical Final Examination. Sci. Rep. 2023, 13, 20512. [Google Scholar] [CrossRef]
  63. Madrid-García, A.; Rosales-Rosado, Z.; Freites-Nuñez, D.; Pérez-Sancristóbal, I.; Pato-Cour, E.; Plasencia-Rodríguez, C.; Cabeza-Osorio, L.; Abasolo-Alcázar, L.; León-Mateos, L.; Fernández-Gutiérrez, B.; et al. Harnessing ChatGPT and GPT-4 for evaluating the rheumatology questions of the Spanish access exam to specialized medical training. Sci. Rep. 2023, 13, 22129. [Google Scholar] [CrossRef]
  64. Brin, D.; Sorin, V.; Vaid, A.; Soroush, A.; Glicksberg, B.S.; Charney, A.W.; Nadkarni, G.; Klang, E. Comparing ChatGPT and GPT-4 performance in USMLE soft skill assessments. Sci. Rep. 2023, 13, 16492. [Google Scholar] [CrossRef]
  65. Masalkhi, M.; Ong, J.; Waisberg, E.; Lee, A.G. Google DeepMind’s gemini AI versus ChatGPT: A comparative analysis in ophthalmology. Eye 2024, 38, 1412–1417. [Google Scholar] [CrossRef]
  66. Kaftan, A.N.; Hussain, M.K.; Naser, F.H. Response accuracy of ChatGPT 3.5 Copilot and Gemini in interpreting biochemical laboratory data a pilot study. Sci. Rep. 2024, 14, 8233. [Google Scholar] [CrossRef]
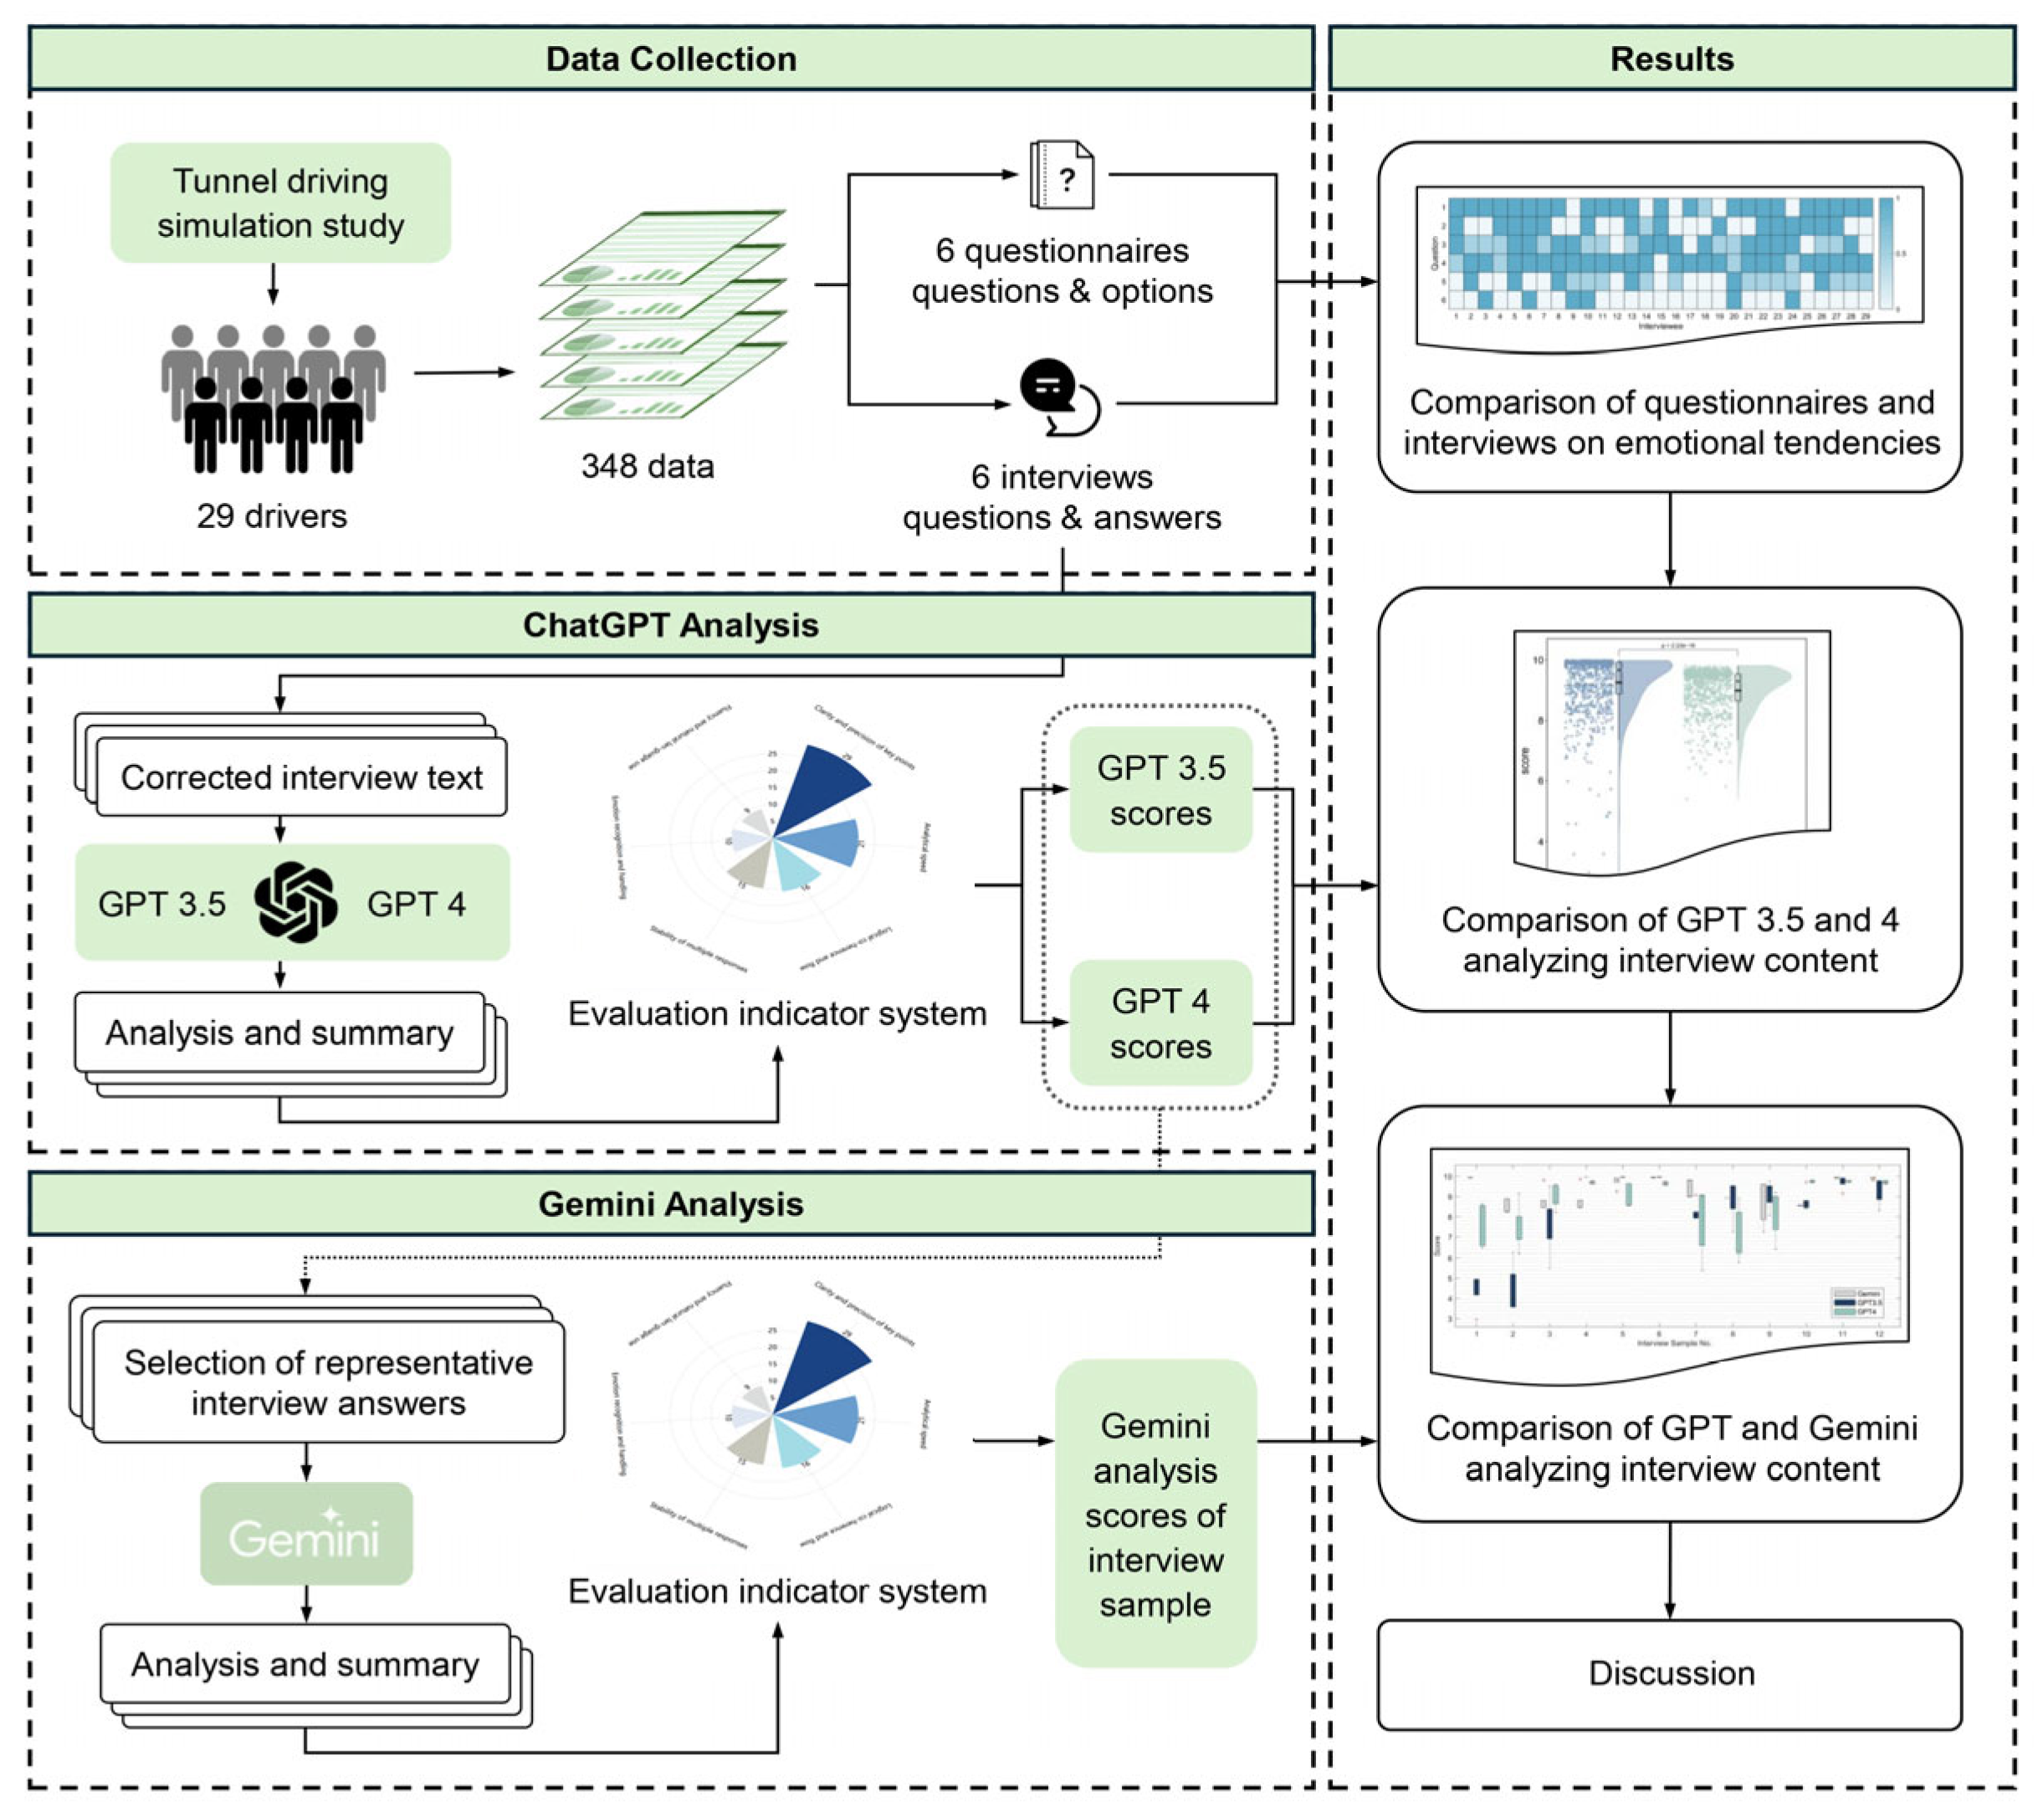
Figure 1. Experimental flow chart.
Symmetry 17 01713 g001
Figure 2. Input and output results of ChatGPT.
Symmetry 17 01713 g002
Figure 3. Input and output results of Google-Gemini.
Symmetry 17 01713 g003
Figure 4. Evaluation index system and weights.
Symmetry 17 01713 g004
Figure 5. The comparison results between the questionnaire and interview.
Symmetry 17 01713 g005
Figure 6. Scores of sentiment analysis for GPT-3.5 and GPT-4.
Symmetry 17 01713 g006
Figure 7. (A) GPT-3.5 and (B) GPT-4 Histograms of Scores for 6 Indicators.
Symmetry 17 01713 g007
Figure 8. Box Plot of Analytical Scores for Interview Samples by Three LLMs.
Symmetry 17 01713 g008
Figure 9. Scores of various indicators in interview samples under three language models. (A) The average score of six indicators after five analyses of Gemini. (B) The average score of six indicators after five analyses of GPT-3.5. (C) The average score of six indicators after five analyses of GPT-4.
Symmetry 17 01713 g009
Table 1. Comparison of questions from the questionnaire and interviews.
Question NumberQuestionnaireInterview
Q1Do you find yourself easily
distracted or disturbed by your
surroundings?
Are you easily distracted or influenced by your surroundings while driving?
Q2What is your biggest concern about driving in the tunnel?Do you feel uneasy or anxious while driving in the tunnel? If so, what do you think causes these feelings?
Q3What worries you the most during tunnel driving?What factors affect your driving while in the tunnel? How do they influence your driving?
Q4How do you believe these
delineators or road studs affect your driving process? Please
assess the degree of assistance
provided by the following three
scenarios while driving in the
tunnel.
How do the delineators and road studs affect your driving in the tunnel? How does your attention differ as a result?
Q5Which section of the tunnel
(alignment) do you think would benefit the most from the
placement of delineators or road studs?
In the tunnel, there are three types of sections: straight sections, left-turn
sections, and right-turn sections. In
different sections, do you prefer driving in the left lane or the right lane?
Q6What design do you believe should be adopted for delineators or road studs in tunnel driving?What suggestions or ideas do you have that could help drivers better navigate through tunnels?
Table 2. Instructions for conducting interview analysis input to LLMs.
Question NumberInput Instructions
Q1We simulated three different scenarios of drivers driving in the tunnel through the simulation software, namely: (1) Scenario I, no delineators and no road studs; (2) Scenario II, no delineators but with road studs; and (3) Scenario III, with delineators and road studs. We aim to investigate whether respondents are prone to distraction while driving or susceptible to the
influence of their surroundings. Please analyze the interview content below and extract key viewpoints and information for this purpose.
Q2We simulated three different scenarios of drivers driving in the tunnel through the simulation software, namely: (1) Scenario I, no delineators and no road studs; (2) Scenario II, no delineators but with traffic buttons; and (3) Scenario III, with delineators and road studs. We aim to investigate whether respondents experience feelings of unease or anxiety while driving in
tunnels and what factors contribute to these sensations. Please analyze the interview content below and distill key viewpoints and information for this purpose.
Q3We simulated three different scenarios of drivers driving in the tunnel through the simulation software, namely: (1) Scenario I, no delineators and no road studs; (2) Scenario II, no delineators but with road studs; and (3) Scenario III, with delineators and road studs. We intend to investigate the factors that influence a respondent’s driving behavior and perceptions while driving in tunnels, as well as how these factors exert their influence. Please analyze the interview content below and extract key viewpoints and
information for this purpose.
Q4We simulated three different scenarios of drivers driving in the tunnel through the simulation software, namely: (1) Scenario I, no delineators and no road studs; (2) Scenario II, no delineators but with road studs; and (3) Scenario III, with delineators and road studs. We aim to study the effects of tunnel markings and road signs on respondents while driving in tunnels,
exploring their impact on attention and differences therein. Please analyze the interview content below and distill key viewpoints and information for this purpose.
Q5We simulated three different scenarios of drivers driving in the tunnel through the simulation software, namely: (1) Scenario I, no delineators and no road studs; (2) Scenario II, no delineators but with road studs; and (3) Scenario III, with delineators and road studs. We aim to study respondents’ preferences regarding lane selection—left or right lanes—while driving in different sections of tunnels, including straight, left-turn, and right-turn
segments. Please analyze the interview content below and distill key
viewpoints and information for this purpose.
Q6We simulated three different scenarios of drivers driving in the tunnel through the simulation software, namely: (1) Scenario I, no delineators and no road studs; (2) Scenario II, no delineators but with road studs; and (3) Scenario III, with delineators and road studs. We aim to study ways to drive more safely and comfortably in tunnels. Below are suggestions or ideas
provided by the interviewees. Please analyze the interview content below and distill key viewpoints and information for this purpose.
Table 3. Definitions and basis for weight assignment of each indicator.
IndicatorDefinitionBasis for Weighting
Clarity and
precision of key points
The depth and accuracy of LLM’s understanding of interview content, assessed by comparing the match between LLM summaries and the key information and details of the interview content.This is one of the most critical
indicators as it directly reflects the LLM’s ability to understand the core content of the interview, which is fundamental for any analysis and summarization task.
Logical coherence and flowLLM’s ability to effectively integrate interview information and form
logically coherent content,
examining understanding and
expression of the relationship
between information.
The ability to integrate
information and the logical
coherence is crucial for
generating meaningful and
understandable summaries,
reflecting the LLM’s capability in structured information
processing.
Fluency and
natural language use
The fluency and naturalness of the text generated by LLM, assessing whether there are errors or
unnatural expressions in the
vocabulary, grammar, and sentence structure of the text.
Language fluency and
naturalness is essential for
understanding and
communication, but slightly less critical compared to the accuracy and logical coherence of content.
Emotion
recognition and handling
LLM’s ability to understand and
express emotional attitudes in
interviews, analyzing whether the tendency of choice for certain closed-ended questions is consistent with the respondents’ original
expressions.
Emotion recognition is
important for understanding
implicit meanings and
viewpoints in interviews but is not as critical as precision of key points extraction and logical
coherence in technical or
professional interviews.
Analytical speedThe time taken by LLM to
complete the analysis, evaluating its efficiency in analyzing large amounts of data.
Analysis speed is relatively
important in scenarios involving the processing of large volumes of data.
Stability of
multiple responses
The fluctuation of LLM’s analysis level during repeated analyses,
evaluating the stability of its
performance.
Stability is more important when repeated processing of the same information or processing large amounts of similar information is required.
Table 4. The index weights calculated by the entropy weight method.
ModelClarity and Precision of Key PointsLogical
Coherence and Flow
Fluency and
Natural Language Use
Emotion
Recognition and Handling
Analytical SpeedStability of
Multiple
Responses
GPT-3.50.34250.09770.13650.11890.15750.1469
GPT-40.33490.17740.0080.03480.30640.1385
Table 5. The index weights calculated by the CRITIC method.
ModelClarity and
Precision of Key Points
Logical Coherence and FlowFluency and
Natural Language Use
Emotion
Recognition and Handling
Analytical SpeedStability of
Multiple
Responses
GPT-3.50.20460.16640.16950.13450.17390.1511
GPT-40.27170.2230.0430.10190.19050.1699
Table 6. The variance-weighted average weights corresponding to each index of the two methods.
MethodClarity and
Precision of Key Points
Logical Coherence and FlowFluency and
Natural Language Use
Emotion
Recognition and Handling
Analytical SpeedStability of
Multiple
Responses
entropy weight method0.33870.13760.07230.07690.23810.1427
CRITIC method0.23810.19740.10630.11820.18220.1605
Table 7. The variance-weighted average weights corresponding to each index of the two methods.
IndexClarity and
Precision of Key Points
Logical Coherence and FlowFluency and
Natural Language Use
Emotion
Recognition and Handling
Analytical SpeedStability of
Multiple
Responses
weight0.28840.16620.08930.09750.2070.1516
Table 8. Post hoc multiple comparison results of the scores for the six indicators between GPT-3.5 and GPT-4.
CLFEAS
GPT-3.5
C-−0.957 (p < 0.05)−1.168 (p < 0.05)−0.999 (p < 0.05)1.031 (p < 0.05)−0.407 (p < 0.05)
L−0.957 (p < 0.05)-0.211 (p < 0.05)0.042 (p = 0.476)0.075 (p = 0.208)0.549 (p < 0.05)
F−1.168 (p < 0.05)0.211 (p < 0.05)-−0.169 (p < 0.05)−0.136 (p < 0.05)0.76 (p < 0.05)
E−0.999 (p < 0.05)0.042 (p = 0.476)−0.169 (p < 0.05)-0.032 (p = 0.584)0.592 (p < 0.05)
A1.031 (p < 0.05)0.075 (p = 0.208)−0.136 (p < 0.05)0.032 (p = 0.584)-0.624 (p < 0.05)
S−0.407 (p < 0.05)0.549 (p < 0.05)0.76 (p < 0.05)0.592 (p < 0.05)0.624 (p < 0.05)-
GPT−4
C-−0.835 (p < 0.05)−1.181 (p < 0.05)−0.965 (p < 0.05)−3.373 (p < 0.05)−0.472 (p < 0.05)
L−0.835 (p < 0.05)-0.346 (p < 0.05)0.13 (p < 0.05)−4.209 (p < 0.05)0.363 (p < 0.05)
F−1.181 (p < 0.05)0.346 (p < 0.05)-−0.216 (p < 0.05)−4.555 (p < 0.05)0.71 (p < 0.05)
E−0.965 (p < 0.05)0.13 (p < 0.05)−0.216 (p < 0.05)-−4.339 (p < 0.05)0.494 (p < 0.05)
A−3.373 (p < 0.05)−4.209 (p < 0.05)−4.555 (p < 0.05)−4.339 (p < 0.05)-−3.845 (p < 0.05)
S−0.472 (p < 0.05)0.363 (p < 0.05)0.71 (p < 0.05)0.494 (p < 0.05)−3.845 (p < 0.05)-
Disclaimer/Publisher’s Note: The statements, opinions and data contained in all publications are solely those of the individual author(s) and contributor(s) and not of MDPI and/or the editor(s). MDPI and/or the editor(s) disclaim responsibility for any injury to people or property resulting from any ideas, methods, instructions or products referred to in the content.