Article

Research on Enterprise Public Opinion Crisis Response Strategies in the Context of Information Asymmetry

1
School of Economics and Management, Hebei University of Science and Technology, Shijiazhuang 050018, China
2
Emergency Management Research Center, Hebei University of Science and Technology, Shijiazhuang 050018, China
*
Author to whom correspondence should be addressed.
Symmetry 2025, 17(10), 1694; https://doi.org/10.3390/sym17101694
Submission received: 27 August 2025 / Revised: 27 September 2025 / Accepted: 4 October 2025 / Published: 9 October 2025
(This article belongs to the Special Issue Symmetry Applied in Mathematical Modeling and Computational Methods)

Abstract

Once an online public opinion emerges, the interweaving of information distortion and public panic makes it difficult for enterprises to accurately grasp the emotional turning point and formulate sustainable marketing strategies. Based on the perspective of information asymmetry, in this paper, we construct a four-agent evolutionary game model involving the central government, local governments, enterprises and netizens. It analyzes the balance of strategies used by different actors in public opinion crises and examines how these strategies drive public panic from three perspectives: content, users and emotions. Finally, the findings are verified through simulation calculations. Our research reveals that when panic sentiment is in the medium range, the central government’s strengthened supervision coexists with enterprises’ deceptive marketing, and the impact of the event is magnified. When panic breaks through the threshold, local governments shift from full disclosure to partial disclosure, while consumers maintain their purchasing confidence and are less likely to be swayed by rumors. Research shows that after a public opinion crisis occurs, only by replacing deception with transparent and genuine content and jointly creating green solutions with consumers can enterprises transform panic into sustainable brand assets and provide a decision-making basis for the long-term development of the enterprise.

1. Introduction

In recent years, the deep integration of social media and e-commerce platforms has enabled enterprise crisis events to spread across the entire Internet in a short period of time. A single product quality defect, an improper public relations incident pertaining to a senior executive, or even an unverified short video can quickly evolve into a public opinion storm sweeping across multiple platforms, directly impacting a brand’s reputation and cash flow. Moreover, crisis information is often accompanied by the amplification and distortion of public panic, forcing the government to strike a difficult balance between information disclosure and local economic stability. How to accurately identify the turning point of public opinion in the early stage of a crisis, coordinate the relationships among all participants in the enterprise crisis event, and then transform public opinion risks into opportunities for brand restoration and sustainable growth, has become a core issue of common concern in both academic and industrial circles.
To determine how enterprises can turn danger into safety during crisis events, it is first necessary to clarify exactly how enterprise public opinion is triggered, magnified and shifted. In recent years, exploring the mechanism of public opinion dissemination, analyzing the process of public opinion dissemination, and improving the governance path of public opinion dissemination have become hot research topics. On the one hand, in terms of the influencing factors of public opinion dissemination, some scholars have studied the influencing factors and governance paths of public opinion in university education from the perspective of new media [1]. On the other hand, scholars have delved deeply into the influencing factors of online public opinion dissemination by integrating Internet technology and the subjects involved in communication [2,3]. The research on the evolution and prediction model of public opinion dissemination is mainly divided into two aspects: case analysis and theoretical innovation. The research on cases mainly focuses on constructing the evolution model of public opinion dissemination themes in subdomains, and conducts empirical studies by taking earthquakes, floods and real emergencies as examples [4,5]. Theoretical research mainly expands traditional theories or models in the field of public opinion dissemination [6,7]. Most scholars’ research on the governance path of public opinion dissemination is based on analyzing the mechanism of public opinion dissemination. At the micro-level, scholars mostly study the elements involved in the process of public opinion dissemination, such as digital technology, dissemination network nodes, and dissemination discourse rights, to build public opinion governance mechanisms and propose governance strategies for enterprises and governments [8,9,10].
Looking at the current research on public opinion dissemination reveals that domestic scholars have mostly focused on case reviews of past emergencies, analyzing the technical features and dissemination laws. In the current digital age of social networks, platforms are not only gathering places for public opinions but also venues for the dissemination of various emotions. Therefore, once an enterprise is embroiled in a public opinion crisis, the panic of netizens can easily turn into consumer boycotts and regulatory penalties, directly damaging the enterprise’s foundation of sustainable marketing and long-term development resilience. Therefore, clarifying the evolution mechanism of public panic during enterprise public opinion crises, identifying key inflection points, and then proposing guiding strategies that balance brand restoration and sustainable value creation are central to addressing the fragmented perspectives in the existing research and responding to the urgent need for the sustainable development of enterprises.

2. Literature Review

2.1. Research on Emotions in Public Opinion Dissemination

The existing research on emotional dissemination in online public opinion can be broadly categorized into three areas: first, descriptive analyses based on the phenomenon of emotional dissemination; second, the influence of emotional factors in public opinion dissemination on the decision-making of relevant subjects; and third, the innovation of emotional identification models in public opinion dissemination. In terms of the description and analysis of emotional dissemination phenomena, scholars mainly analyze prior typical public opinion dissemination cases and explore the characteristics of the public’s emotional expression and changes during the process of public opinion dissemination [11,12]. In terms of the research on the influence of emotional factors in public opinion dissemination on relevant subjects, Razzaq et al. investigated how emotions expressed in public opinion affect government policy-making [13], and Ke et al. explored the impact of user emotions on the marketing strategies of platform merchants [14]. In terms of innovation in sentiment recognition models for public opinion dissemination, Wan et al. proposed an integrated model of emotional cognitive reasoning for sentiment analysis of public opinions on online emergencies [15], and Aslan constructed an innovative sentiment classification model to classify public sentiments during the Russia–Ukraine conflict [16].

2.2. Research on the Formation and Spread of Panic

Panic is a sharp reaction characterized by the loss of self-control [17]. Quarantelli and Glass have studied the concept of panic: The former believes that panic is the uncontrollable emotion produced by individuals in the face of unexpected events, and that individuals are prone to aggressive behaviors under this emotion [18]. The latter believes that panic is the uncooperative psychology that occurs when an individual believes that they are in danger [19]. As a personal feeling with subjective characteristics, the emergence of panic often stems from the perception of being unable to extricate oneself from the possible predicament [17]. Therefore, the intensity of panic arousal is influenced by multiple factors such as changes in the external environment, differences in individual cognitive graphs, and individual judgments on the controllability of emergencies [20].
Scholars often combine panic sentiment with emergencies, financial bonds and market economies in their studies. In terms of financial bonds and economic fears in the market, investors are generally the people who panic because of information about events that can lead to market economic fluctuations or changes in the value of financial bonds [21,22]. According to the “National Overall Emergency Plan for Public Emergencies” promulgated by the State Council of China in 2006, this study classifies emergencies into four types: natural disasters, accident disasters, public health emergencies and social security emergencies. When natural disasters such as floods, earthquakes, wildfires and other emergencies occur, the people affected often panic due to concerns about their safety, and the spread of rumors combined with incomplete information disclosure about the incident prevents security needs from being met, resulting in the further spread of panic [23,24]. When a public health event such as a large-scale infectious disease occurs, the impact and scope of the incident are often large, and people (whether they are immediately affected or not) require their security needs to be met; additionally, the speed and breadth of information dissemination in the Internet era have been greatly improved [25]. Thus, if government departments do not take regulatory measures, public panic will be greatly increased. When accidents, disasters or social security incidents, such as coal mine accidents and crowd stampede accidents, occur, people who receive the incident information will often have a substitution mentality, and people who cannot meet their security needs will panic [26,27,28]. Therefore, the arousal of panic is affected by the government’s disclosure of information, the supervision of public opinion and the public’s ability to receive information.

2.3. The Application of Tipping Point Theory in the Dissemination of Public Opinion

The tipping point theory was first proposed by sociologist Malcolm Gladwell. He argues that the popularity of all things does not come out of nowhere and defines the tipping point as the moment when the tide surges [29]. The three golden rules of tipping point theory include the law of the individual person, the law of adhesion, and the law of environmental power. The law of the individual person refers to the key people involved in the outbreak of the tide, the law of adhesion refers to the characteristics of popular things in the process of the outbreak of the tide, and the law of environmental power refers to the external environment, such as time and place, that leads to the outbreak of the tide.
Since the tipping-point theory was proposed, it has been applied to information dissemination, event epidemic mechanism analysis, urban traffic analysis and many other aspects. Some scholars have combined the tipping point theory with systems engineering research to explore the tipping points of complex systems [30], predict the tipping points of urban traffic congestion with the help of dynamic models [31], or conduct research on the application of the tipping point theory at the policy level for crisis event cases [32]. To sum up, most of the existing research on the dissemination of public opinion information analyzes the popularity mechanism of specific events from a macro-perspective, lacking an analysis of each participant at the micro-level.
This paper applies the tipping point theory to the research on the dissemination of enterprise crisis public opinion in the digital age and constructs a four-party evolutionary game model involving the central government, local governments, enterprises and netizens to reveal the triggering mechanism behind turning points in public opinion and sustainable marketing strategies during crises. Most scholars have focused on two-party or three-party games among netizens, between the government and netizens, or among the government, online media and netizens, making it difficult to fully depict the multi-subject interactions in the context of enterprise crises. To this end, this paper divides the government into two levels: the central and local, forming a four-party game framework to explore how public opinion panic drives the co-evolution of enterprise crisis response and sustainable marketing in the digital age.
Therefore, this paper combines the concept of public panic in public opinion during enterprise crises under conditions of information asymmetry with tipping point theory; it analyzes the behavioral factors of the central government, local governments, enterprises and netizens in the evolution of public opinion from the three perspectives: content, users and emotions. The specific dimension division is shown in Figure 1.

3. Multi-Agent Evolutionary Game Model

Based on the three principles of the tipping point theory, this paper examines the behavioral strategies of the central government, local government, enterprises and netizens in public opinion dissemination during emergencies, focusing on the dimensions of content, emotions and users. This paper explores the role of panic sentiment and constructs an evolutionary game model to analyze the spread of panic sentiment through multi-subject public opinion.

3.1. Analysis of Influencing Factors of Strategies in the Context of Information Asymmetry

In today’s information age, enterprise public opinion crises occur frequently, and their evolution process has become the focus of attention in various fields. As a key element in public opinion crises, the distribution and circulation of information play a crucial role in decision-making and interaction among participating entities. In the complex context of an enterprise public opinion crisis, information asymmetry has become the core influencing factor of the strategic interaction among various entities, affecting the overall direction of the public opinion crisis. This asymmetry is not only reflected in the differences in the timing and completeness of information acquisition, but also further affects the cognitive structure, decision-making logic and balance of interests of the subjects. When choosing strategies, each entity is significantly affected by information asymmetry. This asymmetry is rooted in the positions of each subject in the information chain and the scope of their rights and responsibilities, thereby shaping their unique decision-making logic and behavioral patterns.
As a supervisor and manager, the central government, although authoritative, is confronted with the problem of lagging information. Therefore, the core decision-making choice of the central government lies in whether to strengthen supervision at a high cost to break through information barriers and reshape market order, or to adopt a weak supervision strategy to save costs but bear the systemic risk of public opinion getting out of control due to insufficient information. Local governments, as intermediate levels, are not only under supervision pressure from higher authorities but also need to deal with the management predicaments of enterprises. This enables local governments to have flexible strategic choices. One option is to fully disclose event information, which can maximize credibility. However, partial disclosure of event information, although it can temporarily avoid direct accountability, may result in less trust due to covering up the truth. Enterprises, as the source of crises, enjoy an information advantage but are under market pressure. The enterprise’s choice is essentially a game of strategy that involves taking advantage of information superiority. On the one hand, it can choose genuine marketing to actively eliminate information asymmetry. On the other hand, it can engage in deceptive marketing, taking advantage of the public’s information blind spots to blur public opinion and further cause information asymmetry. As the terminal nodes of information dissemination, netizens are not only the recipients of public opinion but also the participants in the development of public sentiment. This multi-dimensional information distribution pattern results in decision-makers presenting complex game characteristics during the process of strategy selection.

3.2. Basic Assumptions

Hypothesis 1:
In the process of public opinion dissemination, the key participants include the central government, local governments, enterprises and netizens. Each subject is influenced by the uncertainty of the external environment, the incompleteness of individual cognition and information asymmetry. All four subjects are boundedly rational entities.
Public panic refers to the anxiety induced by the spread of public opinion. This paper assumes that the maximum level of public panic following an enterprise crisis event is K. The degree of public panic during the decision-making process of the subject is Kni (0 < ni < 1), where ni represents the public panic coefficient. The variables are detailed in Table 1. The dynamic process of the quadripartite game is illustrated in Figure 2 below. The figure depicts the dynamic game process of the quadripartite agents and lists 16 strategy combinations. Assume that the public panic coefficients corresponding to strategy combinations (1), (2), …, (16) are n1, n2, …, n16, respectively.
Hypothesis 2:
The strategic space of the central government is {g1, g2} = {strong supervision, weak supervision}, where g1 and g2 are chosen with probabilities x and 1-x, respectively. Under strong supervision, the central government incurs costs C1 and C2 to oversee local governments and enterprises, enhancing social benefits (S1). Under weak supervision, it opts for a lenient approach and incurs costs C3 and C4, with lower social benefits (S2). The public panic translates into a loss of social income and supervision costs for the central government in the proportion of a and d (0 < a < 1, 0 < d < 1, C1 > C3, C2 > C4, S1 > S2).
Hypothesis 3:
The strategic space of the local government is {e1, e2} = {full disclosure, partial disclosure}, where e1 and e2 are chosen with probabilities y and 1 − y, respectively. When local governments choose to fully disclose enterprise crisis event information, their commitment to openness enhances credibility, increasing social benefits S3 at a disclosure cost C5. If the partial disclosure is well-intentioned (to maintain social order), the local government reports to the central government and discloses part of the incident information, incurring cost C6 and generating social benefits S4. If the partial disclosure is malicious (to evade responsibility and punishment), the local government fails to report to the central government and partially discloses the incident information to avoid accountability, incurring cost C7 and generating social benefits S4. When the local government does not report to the central government, strong supervision by the central government leads to public condemnation, reducing social benefits by S5, while weak supervision reduces social benefits by S6. Assume that the local government discloses some information to the central government with probability w and conceals information with probability 1 − w. The public panic translates into a loss of social revenue for local governments in proportion b (0 < b < 1, 0 < w < 1, S3 > S5 > S6 > S4).
Hypothesis 4:
The strategic space of enterprises is {l1, l2} = {authentic marketing, deceptive marketing}, where l1 and l2 are selected with probabilities z and 1 − z, respectively. When enterprises choose authentic marketing (truthfully disclosing content consistent with the public information of local governments), they will not be affected by the central government supervision. Moreover, due to the authenticity of the marketing content, they will receive incentive funds F issued by industry associations, increasing economic benefits E1 and incurring time costs C8. Deceptive marketing increases economic benefits E2 at cost C9, but faces future benefit reductions (E3 under strong supervision, E4 under weak supervision). Enterprises pay income tax to the local government at a rate of r. The public panic translates into short-term sales premiums for enterprises in proportion c (0 < c < 1, 0 < r < 1, E1 < E2, C8 < C9, E2 > E3).
Hypothesis 5:
The strategic space of netizens is {f1, f2} = {participate in dissemination, not participate in dissemination}, where f1 and f2 are chosen with probabilities p and 1 − p, respectively. Netizens gain benefits H1 (under strong supervision) or H2 (under weak supervision) from a positive online environment. Participating in dissemination costs C10. Spreading true information influences consumer behavior, changing enterprise benefits by A1, and grants netizens social benefits S7. Spreading false information may cause losses E5, change enterprise benefits by A2, and grant social benefits S8. Under strong supervision, netizens’ reputations suffer a loss S9; under weak supervision, they face suspicion, reducing social benefits by S10. Non-participation indirectly helps control information spread; if the unshared information is true, netizens incur opportunity cost C11 (S9 > S10, x, y, z, p ∈ [0, 1]).

3.3. Model Construction and Analysis

Based on the above assumptions, the payoff matrix of the four-agent game between the central government, local governments, enterprises, and netizens is constructed, as shown in Table 2.
According to Table 2, the replication dynamic equation f for the expected returns and strategy choices of each party was derived (see Appendix A), and the expected returns of each entity were calculated (Formulas (A16)–(A19)). The equilibrium point is obtained by setting the equation f to zero. The Jacobian matrix J was constructed by using the first method of Lyapunov (see Appendix A). Analyze the eigenvalues corresponding to each equilibrium point strategy combination to determine the asymptotic stability of the equilibrium points. The eigenvalues of the equilibrium points of each strategy are shown in Table A1. It is determined that the 12 equilibrium points may have stability, and the stability conditions are shown in Table 3.

3.4. Analysis of the Stability Conditions for Strategy Combinations

Table 3 can be used to determine the stable achievement conditions of each strategy portfolio as follows.
Strategy Portfolio 1 is (g2, e2, l2, f2), representing weak supervision by the central government, partial disclosure by local governments, deceptive marketing by enterprises, and non-participation of netizens in dissemination. The stability conditions are as follows:
( S 1 S 2 ) C 1 + C 2 ( n 8 n 16 ) ( a + d ) K + C 3 + C 4 < 0 S 3 S 4 + S 6 + w ( C 6 C 7 S 6 ) C 5 + C 7 ( n 12 n 16 ) ( b c r ) K < 0 ( 1 r ) [ c ( n 14 n 16 ) K ( C 8 C 9 ) + F + E 1 E 2 + E 4 ] < 0
For the central government, the difference in public panic between choosing the strong supervision strategy and the weak supervision strategy ( n 8 n 16 ) is greater than the critical value P ( P = ( S 1 S 2 ) C 1 + C 2 + C 3 + C 4 ( a + d ) K ). When P > 0 , weak supervision results in lower public panic than strong supervision, prompting the central government to reduce supervision intensity. If the panic difference is positive, the central government opts for weak supervision. If the panic difference is negative, the profits from strong supervision are lower than those from weak supervision, leading the central government to choose weak supervision. When P < 0 , the difference in public panic between full and partial disclosure exceeds a critical value. Partial disclosure results in lower public panic than full disclosure, leading the local government to withhold some information. If the panic difference is positive, the local government opts for partial disclosure. If the panic difference is negative, the profits from full disclosure are lower than those from partial disclosure, prompting the local government to choose partial disclosure. When b c r > 0 , the difference in public panic between local governments choosing full disclosure and partial disclosure ( n 12 n 16 ) is less than the critical value Q1 ( Q 1 = S 3 S 4 + S 6 ( C 5 C 7 ) + w ( C 6 C 7 S 6 ) ( b c r ) K ). When Q 1 > 0 , the degree of public panic caused by local governments partially disclosing information on the enterprise crisis event is lower than that caused by fully disclosing such information. Therefore, local governments choose to conceal some of the information. When Q 1 < 0 , partial disclosure still results in lower public panic than full disclosure, leading the local government to withhold some information. If the panic difference is positive, the local government opts for partial disclosure. If the panic difference is negative, the profits from full disclosure are lower than those from partial disclosure, prompting the local government to choose partial disclosure. When b c r < 0 , the difference in the degree of public panic between the local government’s full disclosure strategy and the partial disclosure strategy is less than the critical value Q1. When Q 1 > 0 , the degree of public panic caused by the local government’s partial disclosure of enterprise crisis event information is lower than that caused by the full disclosure of event information, and the local government chooses to conceal part of the information. When Q 1 < 0 , the difference in panic degree is greater than zero, and local governments choose to partially disclose. If the difference in panic degree is less than zero, at this time, the profit of local governments fully disclosing information is less than that of partially disclosing information, and local governments choose to partially disclose. The difference in the degree of public panic caused by the authentic marketing and deceptive marketing strategies of enterprises ( n 14 n 16 ) is less than the critical value V1 ( V 1 = ( C 8 C 9 ) ( F + E 1 E 2 + E 4 ) c K ); that is, the degree of public panic caused by the authentic marketing of event information by enterprises is lower than that caused by the enterprises choosing deceptive marketing. In order to pursue economic benefits and high attention, enterprises choose deceptive marketing.
Strategy Portfolio 2 is (g2, e2, l1, f2), representing weak supervision by the central government, partial disclosure by local governments, authentic marketing by enterprises, and non-participation in dissemination by netizens. The stability conditions are as follows:
( S 1 S 2 ) C 1 + C 2 ( n 6 n 14 ) ( a + d ) K + C 3 + C 4 < 0 S 3 S 4 + S 6 + w ( C 6 C 7 S 6 ) C 5 + C 7 ( n 10 n 14 ) ( b c r ) K < 0 ( 1 r ) [ c ( n 14 n 16 ) K ( C 8 C 9 ) + F + E 1 E 2 + E 4 ] > 0 S 7 C 10 + C 11 < 0
At this point, the difference in public panic between strong and weak supervision by the central government ( n 6 n 14 ) is greater than the critical value P; that is, the public panic is low under the weak supervision strategy of the government, and the central government then adopts the weak supervision strategy. When b c r > 0 , the difference in public panic between the strategy of local governments choosing to fully disclose event information and the strategy of partially disclosing event information ( n 10 n 14 ) is greater than the critical value Q1; at this time, local governments choose the strategy of partial disclosure in order to reduce the losses caused by high public panic. When b c r < 0 , the proportion of public panic converted into the loss of social benefits for local governments was small enough. Therefore, even if the public panic caused by partially disclosing event information was higher than that caused by fully disclosing event information, local governments still chose to partially disclose event information for their own interests. For enterprises, the difference in public panic between the enterprises’ authentic marketing of event information and deceptive marketing of event information ( n 14 n 16 ) is greater than the critical value V1. To avoid a decrease in future economic benefits and attract high attention, enterprises will choose to truthfully promote event information. For netizens, the difference between the cost incurred by netizens in choosing to participate in the dissemination strategy and the social benefits obtained by enterprises when the information is truthfully disseminated ( C 10 S 7 ) is greater than the opportunity cost paid by netizens when they choose not to participate in the dissemination but the information is true. This indicates that at this time, the cost paid by netizens in choosing to participate in the communication strategy is very high and cannot generate benefits. Therefore, netizens chose not to participate in the dissemination of the event at this time.
Strategy portfolio 3 is (g2, e2, l1, f1), representing weak supervision by the central government, partial disclosure by local governments, authentic marketing by enterprises, and participation of netizens in dissemination. The stability conditions are as follows:
( S 1 S 2 ) C 1 + C 2 ( n 5 n 13 ) ( a + d ) K + C 3 + C 4 < 0 S 3 S 4 + S 6 + w ( C 6 C 7 S 6 ) C 5 + C 7 ( n 9 n 13 ) ( b c r ) K < 0 ( 1 r ) [ c ( n 13 n 15 ) K ( C 8 C 9 ) + F + E 1 E 2 + E 4 + A 1 A 2 ] > 0 S 7 ( C 10 C 11 ) > 0
At this time, the difference between the public panic degree of the central government’s strong supervision strategy and weak supervision strategy ( n 5 n 13 ) is greater than the critical value P, so the central government chooses the weak supervision strategy. When b c r > 0 , the difference in public panic between the complete disclosure and partial disclosure strategies of local governments ( n 9 n 13 ) is greater than the critical value Q1, local governments choose the partial disclosure strategy. When b c r < 0 , the difference between the public panic degree of the local government’s full disclosure and partial disclosure strategy is less than the critical value Q1. Because the proportion of the public panic degree converted into the loss of the local government’s social income is small, the local government chooses the partial disclosure strategy. For enterprises, the difference in public panic between authentic marketing and deceptive marketing by enterprises ( n 13 n 15 ) is greater than the critical value V2 ( V 2 = ( C 8 C 9 ) ( F + E 1 E 2 + E 4 ) ( A 1 A 2 ) c K ). Enterprises choose the authentic marketing strategy in pursuit of high attention. For netizens, the difference between the cost incurred by netizens when choosing to participate in the dissemination strategy and the social benefits obtained by enterprises when truthfully disseminating ( C 10 S 7 ) is smaller than the opportunity cost paid by netizens when choosing not to participate in the dissemination but the information is true. This indicates that the opportunity cost paid by netizens when not participating in the dissemination is relatively large, and there is a possibility of obtaining benefits by participating in the dissemination. At this point, netizens choose to participate in the dissemination.
Strategy portfolio 4 is (g2, e1, l2, f2), representing weak supervision by the central government, full disclosure by local governments, deceptive marketing by enterprises, and non-participation of netizens in dissemination. The stability conditions are as follows:
( S 1 S 2 ) C 1 + C 2 ( n 4 n 12 ) ( a + d ) K + C 3 + C 4 < 0 S 3 S 4 + S 6 + w ( C 6 C 7 S 6 ) C 5 + C 7 ( n 12 n 16 ) ( b c r ) K > 0 ( 1 r ) [ c ( n 10 n 12 ) K ( C 8 C 9 ) + F + E 1 E 2 + E 4 ] < 0
For the central government, the difference in public panic degree between strong and weak supervision ( n 4 n 12 ) exceeds the critical value P. To reduce public panic, the central government opts for weak supervision. When b c r > 0 , the difference in public panic degree between full and partial disclosure by the local government ( n 12 n 16 ) is below the critical value Q1. To minimize public panic, the local government selects full disclosure. When b c r < 0 , the public panic degree under full disclosure exceeds the critical value Q1. To avoid central government supervision, the local government adopts the full disclosure strategy. For enterprises, the difference in public panic degree between authentic and deceptive marketing ( n 10 n 12 ) is below the critical value V1. To maximize panic-driven attention, enterprises opt for deceptive marketing.
Strategy portfolio 5 is (g2, e1, l1, f2), representing weak supervision by the central government, full disclosure by the local government, authentic marketing by enterprises, and non-participation of netizens in dissemination. The stability conditions are as follows:
( S 1 S 2 ) C 1 + C 2 ( n 2 n 10 ) ( a + d ) K + C 3 + C 4 < 0 S 3 S 4 + S 6 + w ( C 6 C 7 S 6 ) C 5 + C 7 ( n 10 n 14 ) ( b c r ) K > 0 ( 1 r ) [ c ( n 10 n 12 ) K ( C 8 C 9 ) + F + E 1 E 2 + E 4 ] > 0 S 7 C 10 + C 11 < 0
For the central government, the difference in public panic degree between strong and weak supervision ( n 2 n 10 ) exceeds the critical value P. To reduce public panic, the central government opts for weak supervision. When b c r > 0 , the difference in public panic degree between full and partial disclosure by the local government ( n 10 n 14 ) is below the critical value Q1. To minimize public panic and losses, the local government selects full disclosure. For enterprises, the difference in public panic degree between authentic and deceptive marketing ( n 10 n 12 ) exceeds the critical value V1. To maximize public attention, enterprises select the authentic marketing strategy, which yields a higher public panic degree. For netizens, the sum of the social benefits from participating in dissemination and the opportunity cost of not participating (when the information is true) is less than the cost of participation. This implies that participation incurs significant costs without commensurate benefits. Thus, netizens opt not to participate in dissemination.
Strategy portfolio 6 is (g2, e1, l1, f1), representing weak supervision by the central government, full disclosure by local governments, authentic marketing by enterprises, and participation of netizens in dissemination. The stability conditions are as follows:
( S 1 S 2 ) C 1 + C 2 ( n 1 n 9 ) ( a + d ) K + C 3 + C 4 < 0 S 3 S 4 + S 6 + w ( C 6 C 7 S 6 ) C 5 + C 7 ( n 9 n 13 ) ( b c r ) K > 0 ( 1 r ) [ c ( n 9 n 11 ) K ( C 8 C 9 ) + A 1 A 2 + F + E 1 E 2 + E 4 ] > 0 S 7 ( C 10 C 11 ) > 0
For the central government, the difference in public panic degree between strong and weak supervision ( n 1 n 9 ) exceeds the critical value P. To reduce public panic, the central government opts for weak supervision. When b c r > 0 , the difference in public panic degree between full and partial disclosure by the local government ( n 9 n 13 ) is below the critical value Q1. To minimize public panic, the local government selects full disclosure. When b c r < 0 , even if the difference in public panic degree between full and partial disclosure exceeds Q1, the local government is minimally affected by public panic. Thus, it fully discloses information to avoid central government supervision. For enterprises, the difference in public panic degree between authentic and deceptive marketing ( n 9 n 11 ) exceeds the critical value V2. To maximize economic benefits, enterprises opt for authentic marketing. For netizens, the net cost of participating in dissemination (considering costs and social benefits) is lower than the opportunity cost of non-participation. Since the loss from non-participation is greater, netizens choose to participate in dissemination.
Strategy portfolio 7 is (g1, e2, l2, f2), representing strong supervision by the central government, partial disclosure by the local government, deceptive marketing by enterprises, and non-participation of netizens in dissemination. The stability conditions are as follows:
( S 1 S 2 ) C 1 + C 2 ( n 8 n 16 ) ( a + d ) K + C 3 + C 4 > 0 S 3 S 4 + S 5 + w ( C 6 C 7 S 5 ) C 5 + C 7 ( n 4 n 8 ) ( b c r ) K < 0 ( 1 r ) [ c ( n 6 n 8 ) K ( C 8 C 9 ) + F + E 1 E 2 + E 3 ] < 0
For the central government, the difference in public panic degree between strong and weak supervision ( n 8 n 16 ) is below the critical value P, leading the central government to opt for strong supervision. When b c r > 0 , the difference in public panic degree between full and partial disclosure ( n 4 n 8 ) exceeds the critical value Q2 ( Q 2 = S 3 S 4 + S 5 ( C 5 C 7 ) + w ( C 6 C 7 S 5 ) ( b c r ) K ), prompting the local government to choose partial disclosure to reduce public panic. When b c r < 0 , the difference in public panic degree between full and partial disclosure is below the critical value Q2, indicating minimal impact on the local government. In this case, the local government selects partial disclosure to conceal information and evade central government accountability. For enterprises, the difference in public panic degree between authentic and deceptive marketing ( n 6 n 8 ) is below the critical value V3 ( V 3 = ( C 8 C 9 ) ( F + E 1 E 2 + E 3 ) c K ), leading enterprises to choose deceptive marketing to maximize benefits.
Strategy portfolio 8 is (g1, e2, l1, f2), representing strong supervision by the central government, partial disclosure by the local government, authentic marketing by enterprises, and non-participation of netizens in dissemination. The stability conditions are as follows:
( S 1 S 2 ) ( C 1 + C 2 ) ( n 6 n 14 ) ( a + d ) K + C 3 + C 4 > 0 S 3 S 4 + S 5 + w ( C 6 C 7 S 5 ) C 5 + C 7 ( n 2 n 6 ) ( b c r ) K < 0 ( 1 r ) [ c ( n 6 n 8 ) K ( C 8 C 9 ) + F + E 1 E 2 + E 3 ] > 0 S 7 C 10 + C 11 < 0
For the central government, the difference in public panic degree between strong and weak supervision ( n 6 n 14 ) is below the critical value P, prompting the central government to opt for strong supervision to reduce public panic. When b c r > 0 , the difference in public panic degree between full and partial disclosure ( n 2 n 6 ) exceeds the critical value Q2, leading the local government to choose partial disclosure to minimize public panic. When b c r < 0 , the difference in public panic degree between full and partial disclosure is below the critical value Q2. Since public panic has minimal impact on the local government, it is disregarded, and the local government selects partial disclosure to evade central government accountability. For enterprises, the difference in public panic degree between truthful and false dissemination ( n 6 n 8 ) exceeds the critical value V3, leading enterprises to choose authentic marketing to maximize public attention. For netizens, the net cost of participating in dissemination (considering costs and social benefits) exceeds the opportunity cost of not participating in authentic marketing by enterprises. This indicates that participating in dissemination results in greater losses, leading netizens to choose non-participation.
Strategy portfolio 9 is (g1, e2, l1, f1), representing strong supervision by the central government, partial disclosure by local governments, authentic marketing by enterprises, and participation of netizens in dissemination. The stability conditions are as follows:
( S 1 S 2 ) C 1 + C 2 ( n 5 n 13 ) ( a + d ) K + C 3 + C 4 > 0 S 3 S 4 + S 5 + w ( C 6 C 7 S 5 ) C 5 + C 7 ( n 1 n 5 ) ( b c r ) K < 0 ( 1 r ) [ c ( n 5 n 7 ) K ( C 8 C 9 ) + A 1 A 2 + F + E 1 E 2 + E 3 ] < 0 S 7 ( C 10 C 11 ) > 0
For the central government, the difference in public panic degree between strong and weak supervision ( n 5 n 13 ) is below the critical value P, leading the central government to adopt strong supervision. When b c r > 0 , the difference in public panic degree between full and partial disclosure ( n 1 n 5 ) exceeds the critical value Q2, prompting the local government to choose partial disclosure to reduce public panic. When b c r < 0 , the public panic degree has minimal impact on the local government, which then opts for partial disclosure to protect its reputation and evade central government accountability. For enterprises, the difference in public panic degree between authentic and deceptive marketing ( n 5 n 7 ) exceeds the critical value V4 ( V 4 = ( C 8 C 9 ) ( F + E 1 E 2 + E 3 ) ( A 1 A 2 ) c K ), leading enterprises to choose authentic marketing to maximize public attention. For netizens, the net benefit of participating in dissemination (considering costs and increased social benefits) outweighs the opportunity cost of non-participation. Since the loss from not participating is greater, netizens choose to participate in dissemination.
Strategy portfolio 10 is (g1, e1, l2, f2), representing strong supervision by the central government, full disclosure by the local government, deceptive marketing by enterprises, and non-participation of netizens in dissemination. The stability conditions are as follows:
( S 1 S 2 ) C 1 + C 2 ( n 4 n 12 ) ( a + d ) K + C 3 + C 4 > 0 S 3 S 4 + S 5 + w ( C 6 C 7 S 5 ) C 5 + C 7 ( n 4 n 8 ) ( b c r ) K > 0 ( 1 r ) [ c ( n 2 n 4 ) K ( C 8 C 9 ) + F + E 1 E 2 + E 3 ] < 0
The difference in public panic degree between strong and weak supervision by the central government ( n 4 n 12 ) is below the critical value P, leading the central government to adopt the strong supervision strategy. When b c r > 0 , the difference in public panic degree between full and partial disclosure ( n 4 n 8 ) is below the critical value Q2, prompting the local government to choose full disclosure to mitigate the impact of public panic. When b c r < 0 , the difference in public panic degree between full and partial disclosure exceeds the critical value Q2, indicating minimal impact on the local government. In this case, the local government opts for full disclosure to avoid subsequent central government supervision. For enterprises, the difference in public panic degree between authentic and deceptive marketing ( n 2 n 4 ) is below the critical value V3, leading enterprises to choose deceptive marketing to maximize economic benefits.
Strategy portfolio 11 is (g1, e1, l1, f2), representing strong supervision by the central government, full disclosure by local governments, authentic marketing by enterprises, and non-participation of netizens in dissemination. The stability conditions are as follows:
( S 1 S 2 ) C 1 + C 2 ( n 2 n 10 ) ( a + d ) K + C 3 + C 4 > 0 S 3 S 4 + S 5 + w ( C 6 C 7 S 5 ) C 5 + C 7 ( n 2 n 6 ) ( b c r ) K > 0 ( 1 r ) [ c ( n 2 n 4 ) K ( C 8 C 9 ) + F + E 1 E 2 + E 3 ] > 0 S 7 C 10 + C 11 < 0
For the central government, the difference in public panic degree between strong and weak supervision ( n 2 n 10 ) is below the critical value P, leading the central government to adopt strong supervision to reduce public panic. When b c r > 0 , the difference in public panic degree between full and partial disclosure ( n 2 n 6 ) is below the critical value Q2, prompting the local government to choose full disclosure to mitigate the impact of public panic. When b c r < 0 , local governments disregard the impact of public panic and opt for honest disclosure to avoid central government supervision. For enterprises, the difference in public panic degree between authentic and deceptive marketing ( n 2 n 4 ) exceeds the critical value V3, leading enterprises to choose authentic marketing to gain public attention. For netizens, when participating in dissemination alongside truthful enterprises dissemination, the net cost (cost minus social benefits) exceeds the opportunity cost of non-participation. Thus, netizens incur greater losses by participating and therefore choose not to participate in dissemination.
Strategy Portfolio 12 is (g1, e1, l1, f1), representing strong supervision by the central government, full disclosure by the local government, authentic marketing by enterprises and participation of netizens in dissemination. The stability conditions are as follows:
( S 1 S 2 ) C 1 + C 2 ( n 1 n 9 ) ( a + d ) K + C 3 + C 4 > 0 S 3 S 4 + S 5 + w ( C 6 C 7 S 5 ) C 5 + C 7 ( n 1 n 5 ) ( b c r ) K > 0 ( 1 r ) [ c ( n 1 n 3 ) K ( C 8 C 9 ) + A 1 A 2 + F + E 1 E 2 + E 3 ] > 0 S 7 ( C 10 C 11 ) > 0
For the central government, the difference in public panic degree between strong and weak supervision ( n 1 n 9 ) is below the critical value P, leading the central government to adopt strong supervision to reduce public panic. When b c r > 0 , the difference in public panic degree between full and partial disclosure ( n 1 n 5 ) is below the critical value Q2, prompting the local government to choose full disclosure to mitigate the impact of public panic. When b c r < 0 , the difference in public panic degree between full and partial disclosure exceeds the critical value Q2. In this case, the local government disregards the influence of public panic and opts for full disclosure to avoid subsequent central government supervision. For enterprises, the difference in public panic degree between truthful and deceptive marketing ( n 1 n 3 ) exceeds the critical value V4, leading enterprises to choose authentic marketing despite the higher public panic degree. For netizens, the net cost of participating in dissemination (considering truthful dissemination by enterprises) is lower than the opportunity cost of not participating. Since the loss from non-participation is greater, netizens choose to participate in dissemination.

4. Simulation Analysis

By constructing and analyzing the evolutionary game model, we derive the payoff matrix and equilibrium strategies for the quadripartite agent game. To validate the model’s accuracy, we further investigate the interplay between strategy selection among all agents. Then, the numerical examples were simulated using MATLABR2022b software to analyze the evolutionary game model.

4.1. Initial Assignment for Simulation

To ensure the reality and validity of the model simulation results, the parameter assignment in this study is mainly estimated based on the “Tesla brake Failure” public opinion event that occurred in China in 2021. This case completely covers four agents: the central government (the State Administration for Market Regulation), the local government (the market supervision department of the place where the incident occurred), the enterprise (Tesla) and netizens. The assignment of all parameters follows the constraints in the model assumptions and is obtained through reasonable estimation and standardization processing of the publicly available information, industry reports and related academic research. The initial variable assignments are shown in Table 4.
The parameter assignment of the central government is mainly based on its supervision behavior and actual impact on events. Under the strong supervision strategy, referring to the actual expenditures of the special investigation team established by the State Administration for Market Regulation of China for technical appraisal and cross-departmental coordination, let the central government investigation cost C1 = 100 and the network control cost C2 = 80. Under the weak supervision strategy, only basic administrative and publicity costs are incurred (C3 = 40, C4 = 20). Strong supervision can effectively calm public opinion, restore market confidence and bring high social benefits (S1 = 250). While weak regulation can maintain basic order, its benefits are limited (S2 = 80). Considering that the indirect losses caused by public panic may far outweigh the direct losses of the event, K is set at 1000. Set the loss rate of central social benefits at 10% (a = 0.1), and the intensification of public panic will force the government to increase the emergency budget (d = 0.2).
Based on the expenses for holding press conferences and organizing third-party appraisals by the market supervision bureaus of first-tier cities in China, the cost of fully disclosing information is the highest (C5 = 60), but it can greatly enhance credibility (S3 = 150). Based on the behavior of the local government avoiding sensitive information in the event, the partial disclosure cost is relatively low (C6 = 40, C7 = 30), and basic benefits can be obtained (S4 = 40). If one chooses to conceal and fails to report, they will suffer significant losses under strong central government supervision (S5 = 100), while the losses will be relatively minor under weak supervision (S6 = 50). Based on the fact that local governments were more inclined to handle the situation independently rather than report it in the early stage of the case, the probability w of reporting to the central government when partially disclosing is set at 0.4. Local governments are closer to the center of public opinion and are more affected. The local loss rate is set slightly higher than that of the central government (b = 0.15).
If Tesla chooses to respond truthfully and cooperatively, it can achieve long-term stable returns (E1 = 120) and pay a lower cost of explanation (C8 = 20). Referring to the research and development subsidy funds provided by the Chinese government to enterprises in emerging industries, such as new energy vehicles that actively fulfill their social responsibilities, the enterprise incentive fund F is set at 40. If deceptive marketing is chosen in the early stage of a crisis event, although higher public relations costs (C9 = 50) need to be paid, it may maintain the brand image in the short term, avoid huge recall costs, and achieve higher short-term returns (E2 = 200). However, once the central government implements strict supervision, enterprises will face huge future losses, such as huge fines and reputation collapse (E3 = 150). Even under weak supervision, long-term losses can still be suffered due to the persistence of public opinion (E4 = 60). The income tax rate adopts the Chinese standard rate of 0.25. Based on research in behavioral economics, the short-term price increase in some commodities during crisis events can reach over 30% (c = 0.3).
Netizens need to pay a time cost to participate in the dissemination (C10 = 5), while there is an opportunity cost if they do not disseminate true information (C11 = 3). The benefits of a clear and clean online environment brought by strong regulation (H1 = 30) are significantly higher than those of weak regulation (H2 = 10). Spreading true information brings positive social benefits (S7 = 15), while spreading false information can gain attention (S8 = 10), but it faces serious losses under strong supervision (S9 = 20) and minor losses under weak supervision (S10 = 8). According to the data from the China Consumers Association, if one makes a wrong consumption decision due to the dissemination of false information, they may suffer economic losses (E5 = 80). The influence coefficients of netizens’ dissemination on enterprise profits are set as A1 = 0.1×E1 and A2 = 0.2×E2, reflecting the long-term promotion effect of rational dissemination and the short-term amplification effect of extreme dissemination.

4.2. The Influence of Public Panic on Evolutionary Equilibrium

The values of critical values P, Q1, Q2, V1, V2, V3, V4 are calculated according to the initial assignment, as shown in Table 5 below.
Via the initial values S7, C10 and C11, the evolution strategy combinations (1, 1, 1, 1), (1, 1, 0, 0), (0, 1, 1, 1), and (0, 1, 0, 0) can be used; a panic degree is then assigned separately according to the critical value, and the following evolutionary game process diagram can be obtained.
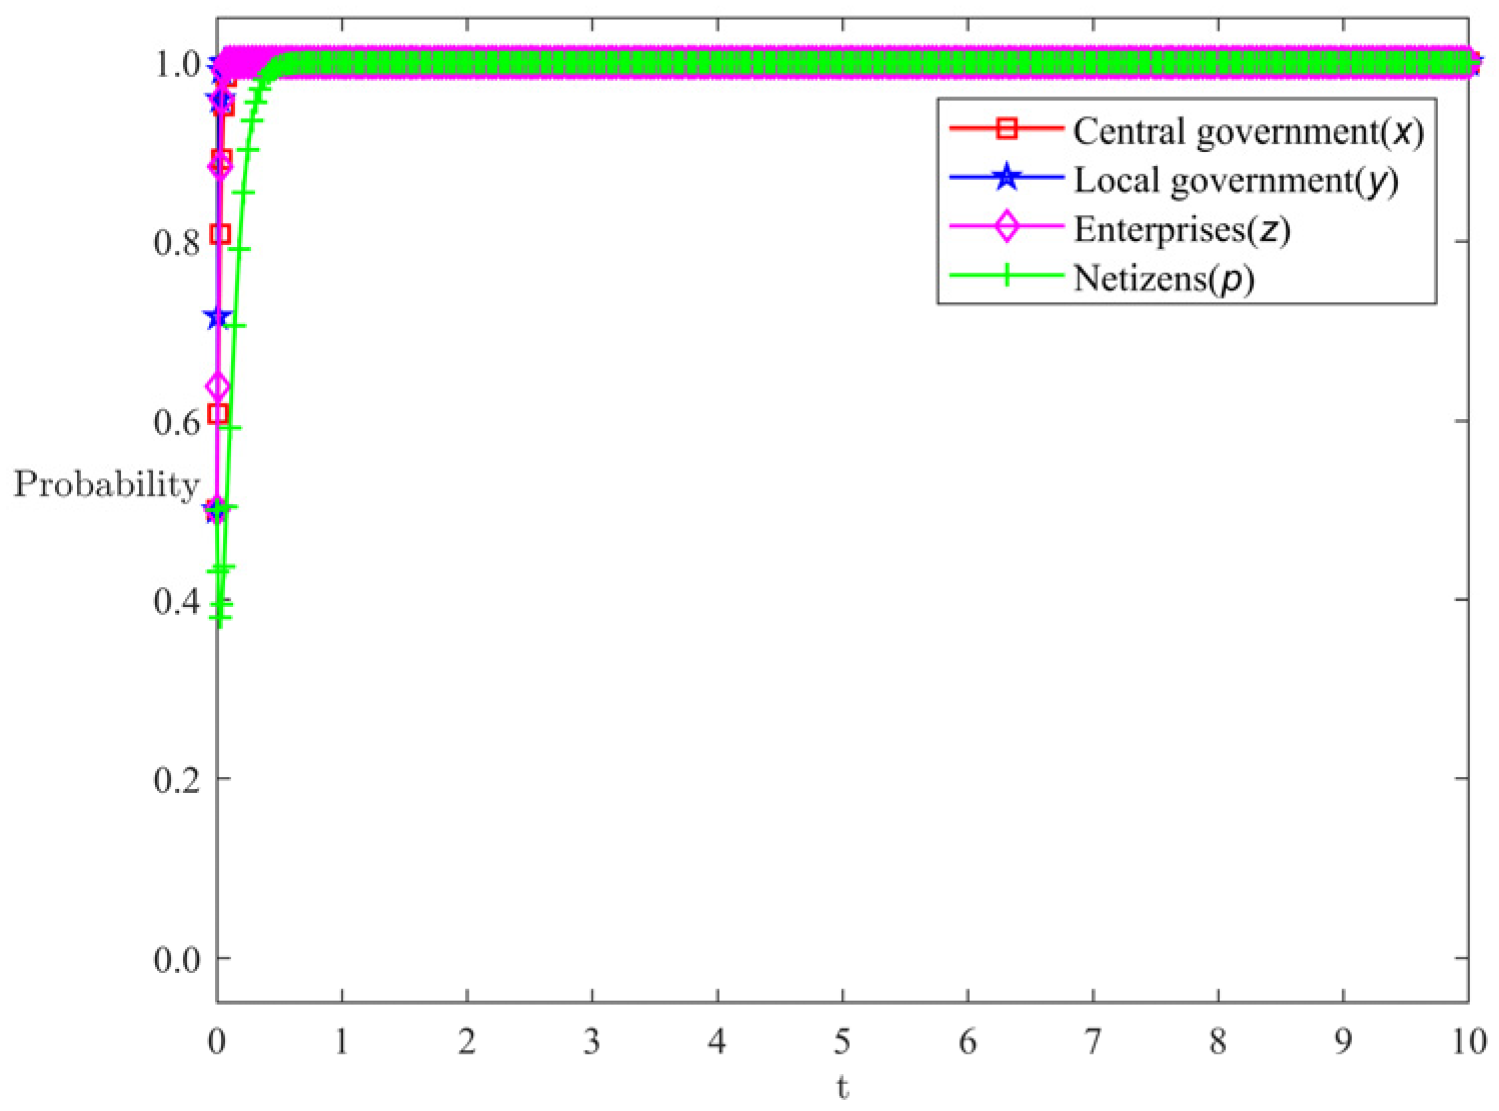
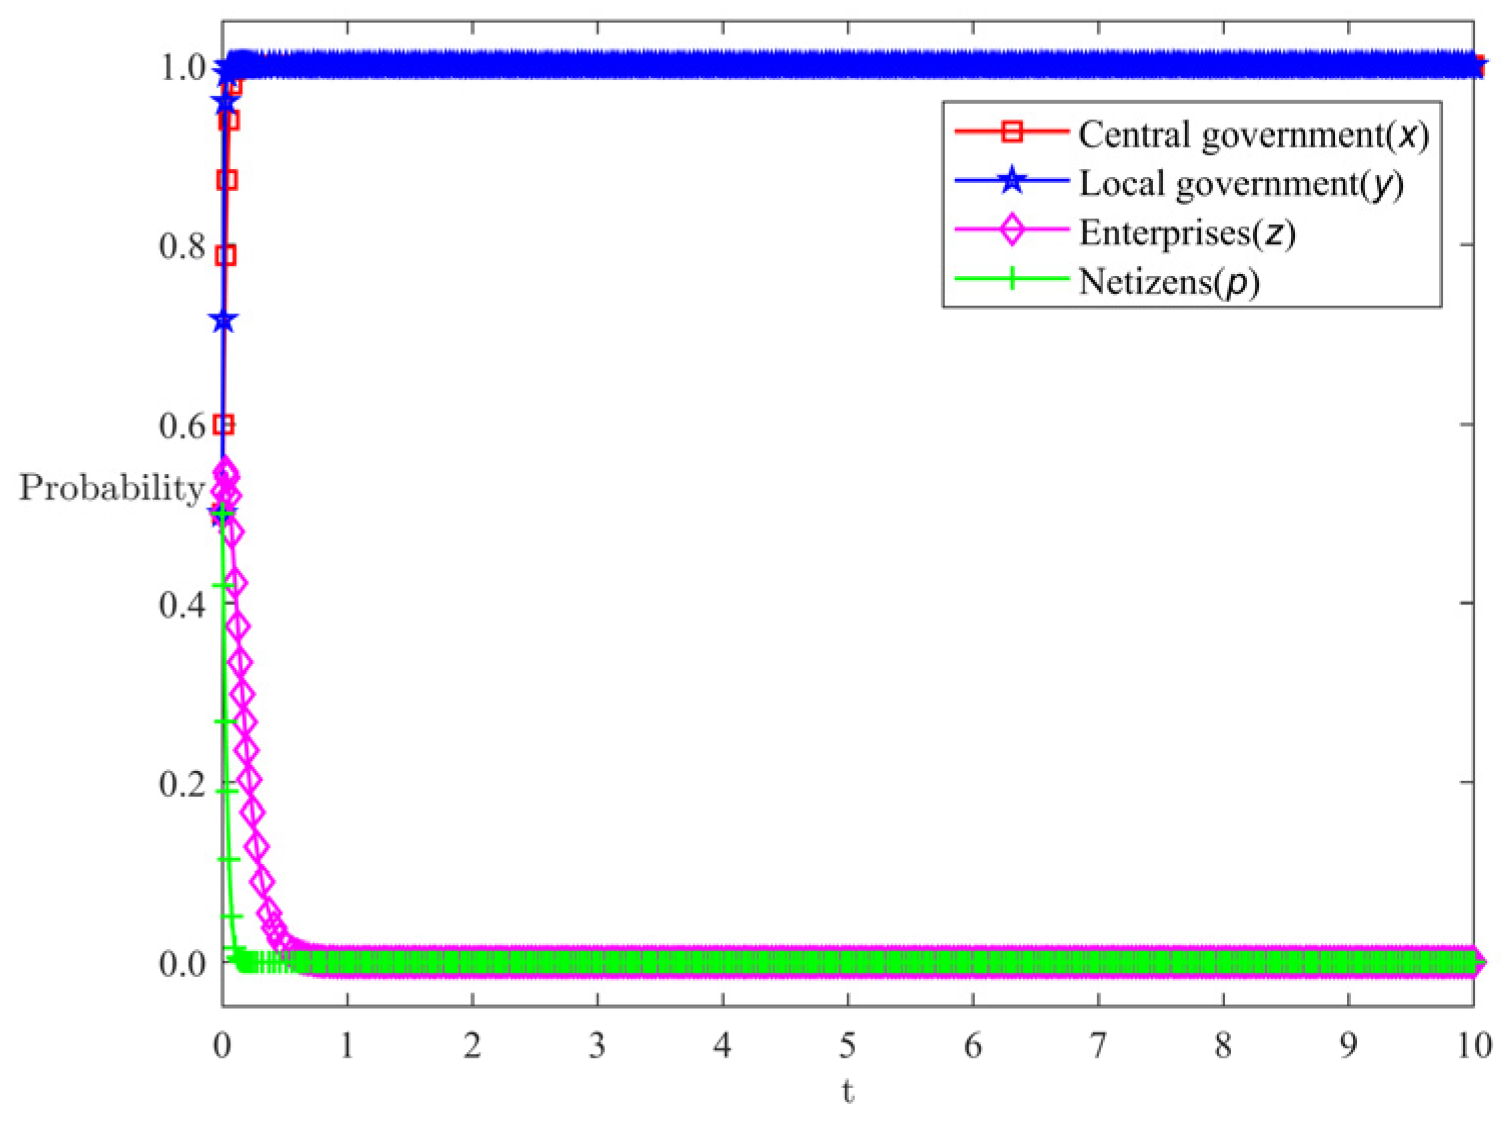
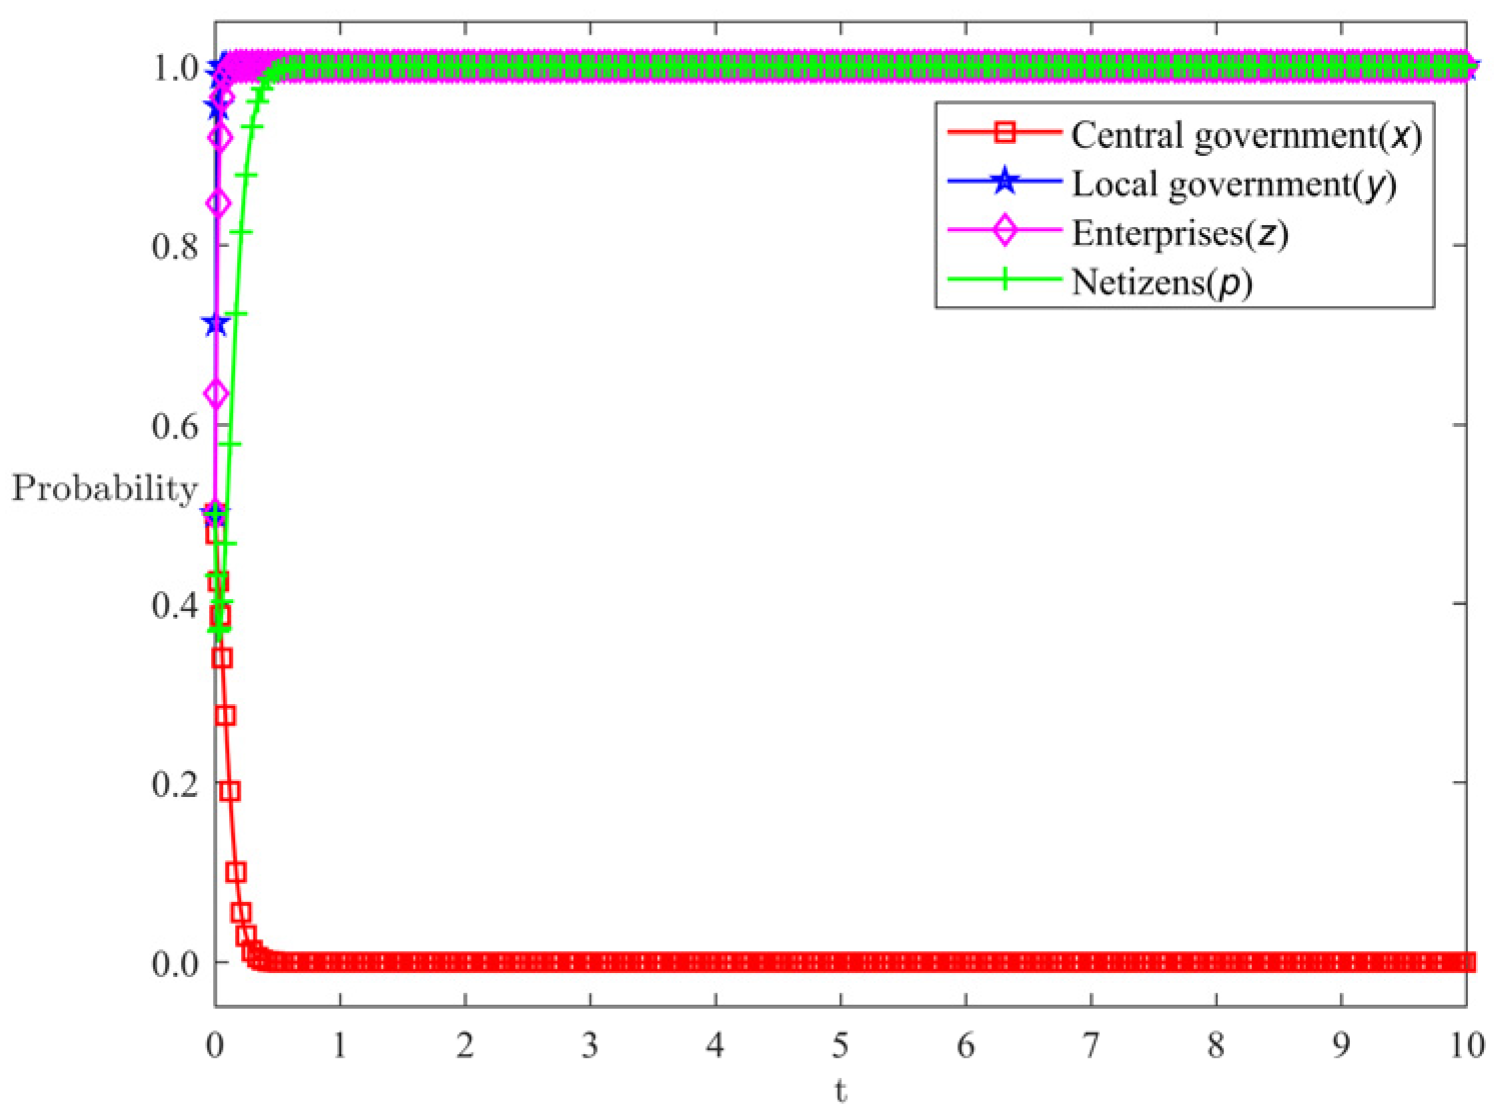
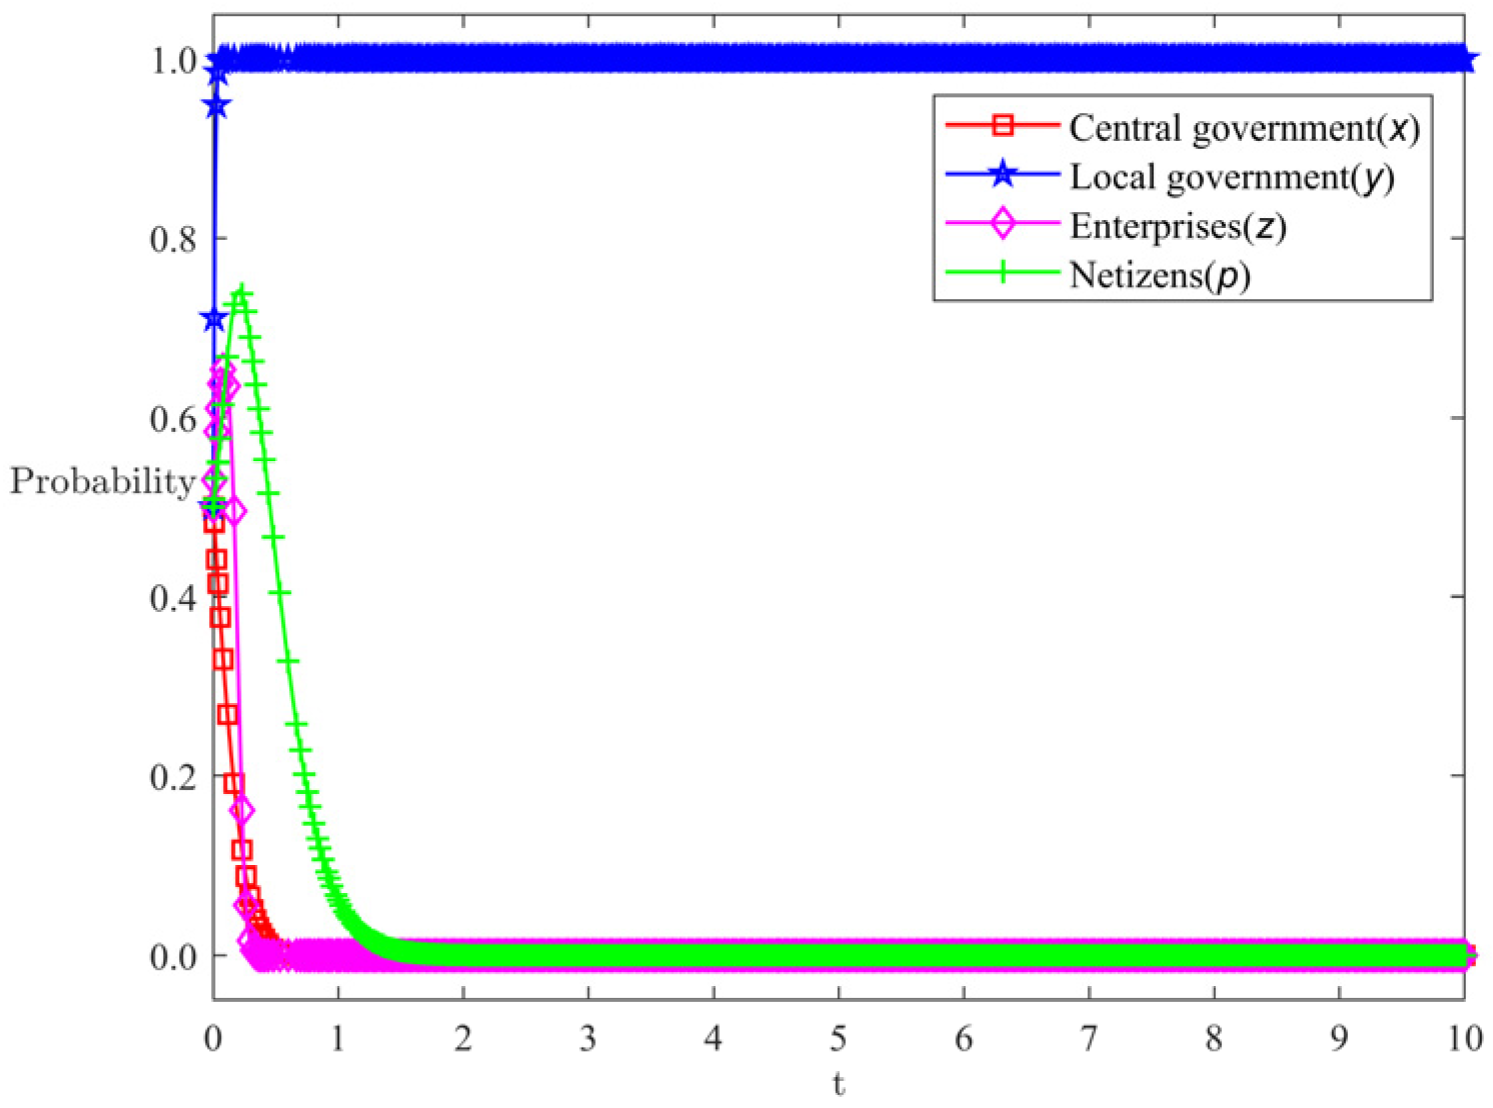
Figure 3 shows the evolutionary stabilization strategy (1, 1, 1, 1) simulated according to the initial assignment. Figure 4 shows the evolutionarily stable strategy (1, 1, 0, 0) after changing the values of E3, n4 and n12 to 80, 0.7 and 0.65, respectively, on the basis of the initial assignment. Figure 5 shows the evolutionarily stable strategy (0, 1, 1, 1) with the values of S2, C3, n1, n9 and n11 changed to 120, 20, 0.5, 0.2 and 0.1. Figure 6 shows the evolutionarily stable strategy (0, 1, 0, 0) obtained by changing S2, E2, E4, E5, n4 and n12 to 130, 220, 30, 20, 0.9 and 0.6.
As shown by the numerical simulation results, under the initial conditions, the system evolves toward the ideal strategy (1, 1, 1, 1), characterized by strong central supervision, full disclosure at the local level, authentic marketing by enterprises and dissemination by netizens. When E3 decreases from 150 to 80, n4 increases from 0.35 to 0.7, and n12 rises from 0.45 to 0.65, the strategy shifts to (1, 1, 0, 0). This represents strong central supervision, full disclosure at the local level, deceptive marketing by enterprises and non-participation in dissemination by netizens. This aligns with the early characteristics of the Tesla incident: despite regulatory intervention, the company opted for a hardline response due to reduced punishment severity (E3 decrease) and heightened panic premium (n4 increase), while netizens shifted toward cautious silence amid increased risks of information confusion. When S2 increases from 80 to 120, C3 decreases from 40 to 20, n1 rises from 0.15 to 0.5, n9 falls from 0.25 to 0.2, and n11 drops from 0.7 to 0.1, the strategy combination evolves to (0, 1, 1, 1). This indicates that even when enterprises maintain integrity and netizens actively participate, the system deviates from optimal regulatory intensity if the net benefits of weak central regulation surpass those of strong regulation due to reduced costs and altered benefit assessments. When S2 increases to 130, E2 rises to 220, E4 drops to 30, E5 falls to 20, n4 climbs to 0.9, and n12 rises to 0.6, the strategy combination deteriorates to (0, 1, 0, 0). This fully simulates the vicious cycle observed in the Tesla incident, where regulatory absence led to uncontrolled enterprises and public silence. It also provides theoretical grounds for precise intervention: by setting penalty thresholds and panic control critical points, the system can be effectively guided back to its ideal state.
The parameter evolution simulation reveals that the effectiveness of enterprise public opinion crisis management highly depends on the dynamic equilibrium of several key parameters. In the Tesla case, even if the central government maintains strong regulation and local full disclosure, if the punishment for enterprises’ deceptive marketing lacks sufficient severity or public panic becomes uncontrollable, it will still lead to enterprises taking desperate risks and netizens choosing silence, causing the system to deviate from the ideal state of collaborative governance. This indicates that supervisory deterrence, panic management, enterprise incentives and netizen participation costs significantly influence strategy evolution. Therefore, during the initial stages of Tesla’s brake failure incident, regulators should intervene swiftly to curb corporate speculation through adequate penalties and efficient oversight. Simultaneously, enterprises must recognize that the long-term benefits of integrity far outweigh short-term gains from deception. Furthermore, optimizing the information environment to reduce public panic and designing incentives to guide rational public discourse are essential. Only when the strategies of these four major actors form a positive feedback loop can the system stabilize at an ideal equilibrium: strong central supervision, full local disclosure, authentic enterprise marketing and dissemination by the public. This achieves the fundamental resolution of public opinion crises.

4.3. The Influence of x Initial Value on Evolutionary Equilibrium

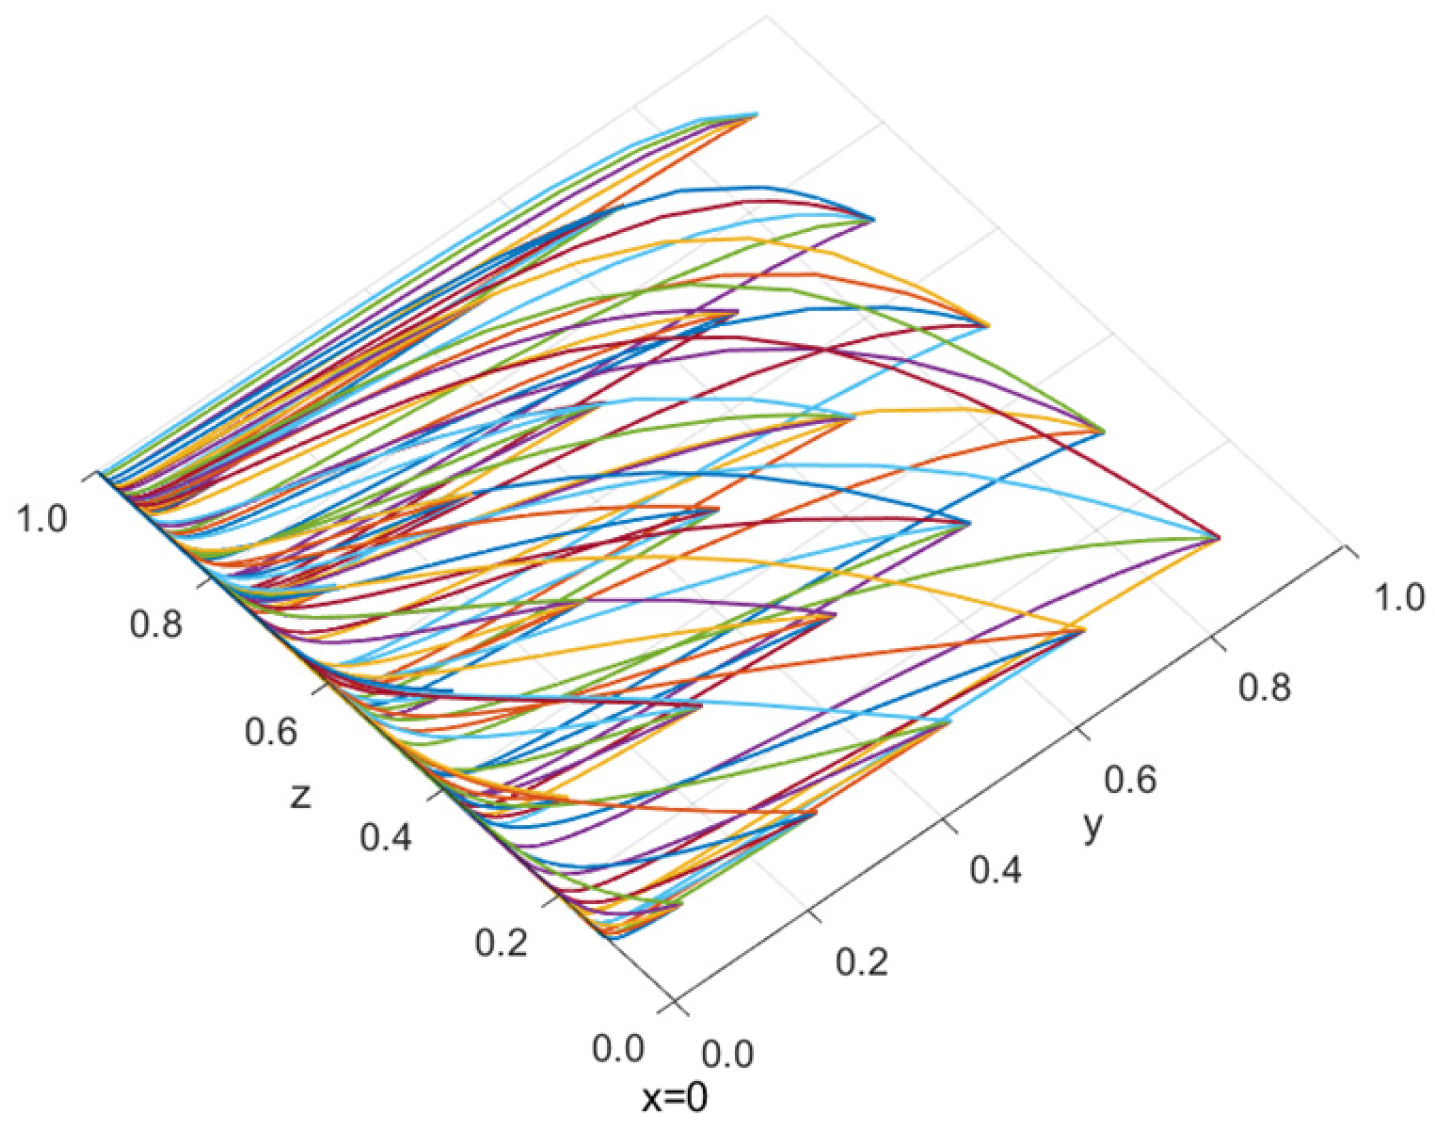
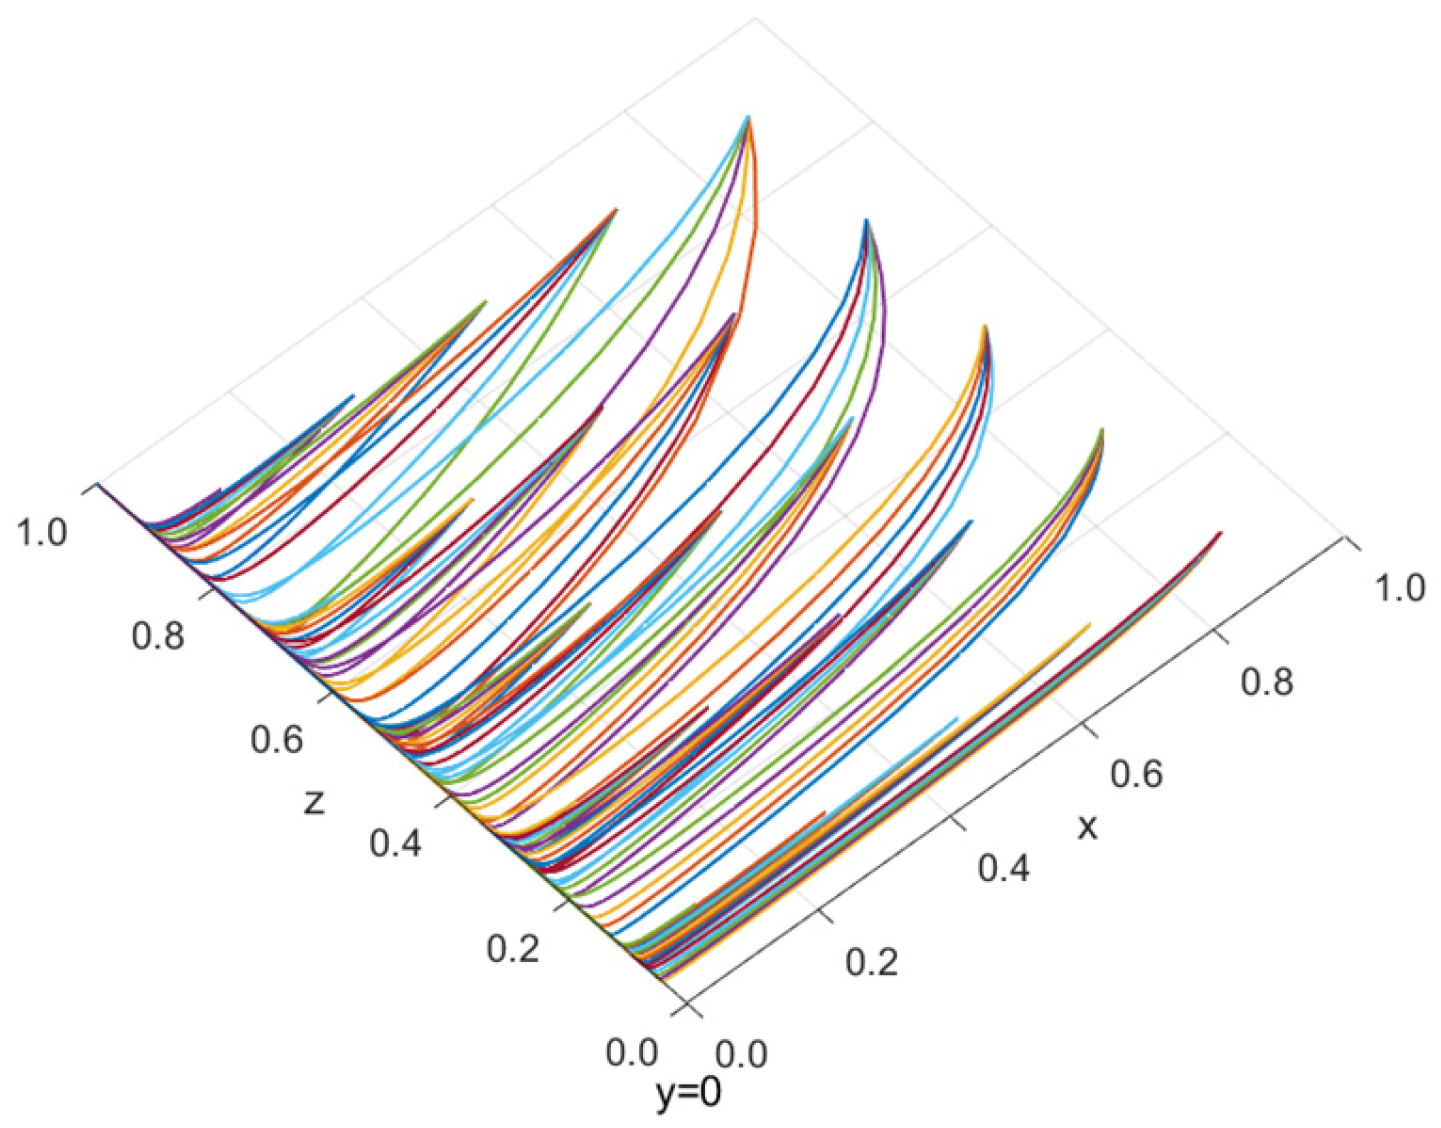
Figure 7 and Figure 8 show the evolution process diagram and top view of y, z and p when the initial value of x is 0. It can be seen from the figure that when the initial value of x is 0, p has no influence on the evolution process of y and z, where the decline rate of y value is greater than the rise rate of z, indicating that when the initial value of the central government’s strong supervision is 0, the proportion of netizens participating in dissemination has no influence on the proportion of local government’s full disclosure and the proportion of enterprises’ authentic marketing. The proportion of full disclosure by local governments and the proportion of authentic marketing by enterprises are determined by local governments and enterprises themselves. The larger the initial value of z, the smaller the initial value of y, indicating that the larger the proportion of authentic marketing of the enterprises, the smaller the proportion of complete disclosure of the local government. When the proportion of authentic marketing of enterprises is 1, the proportion of full disclosure of local government is close to 0.
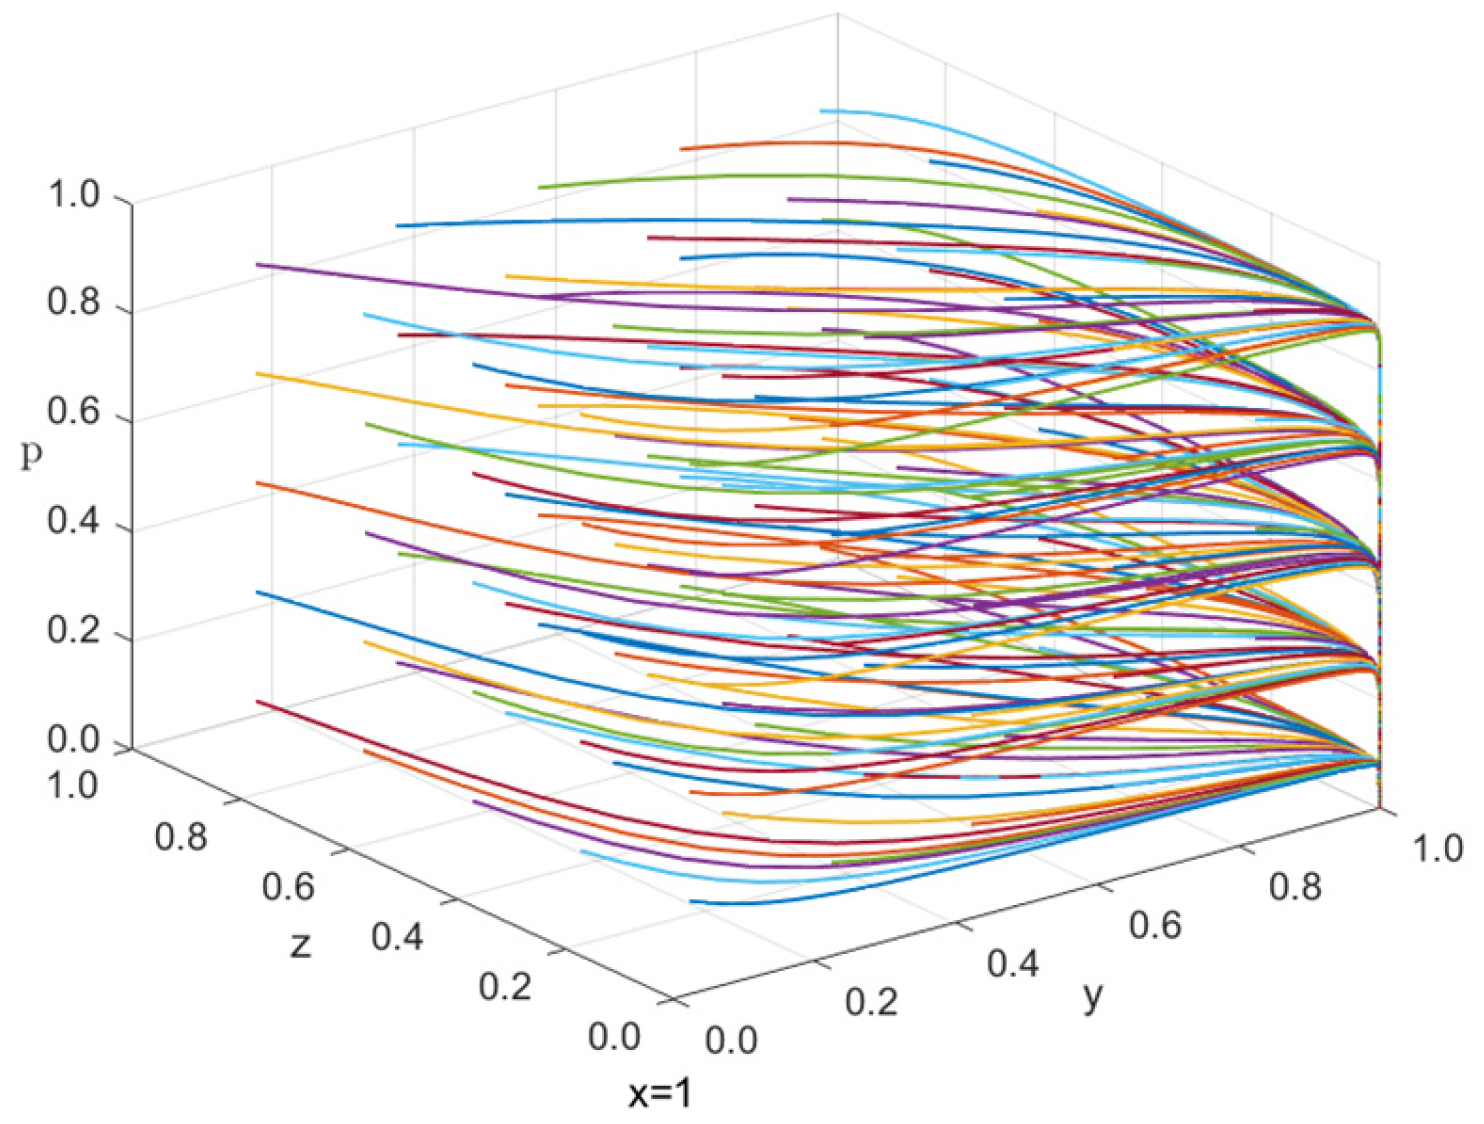
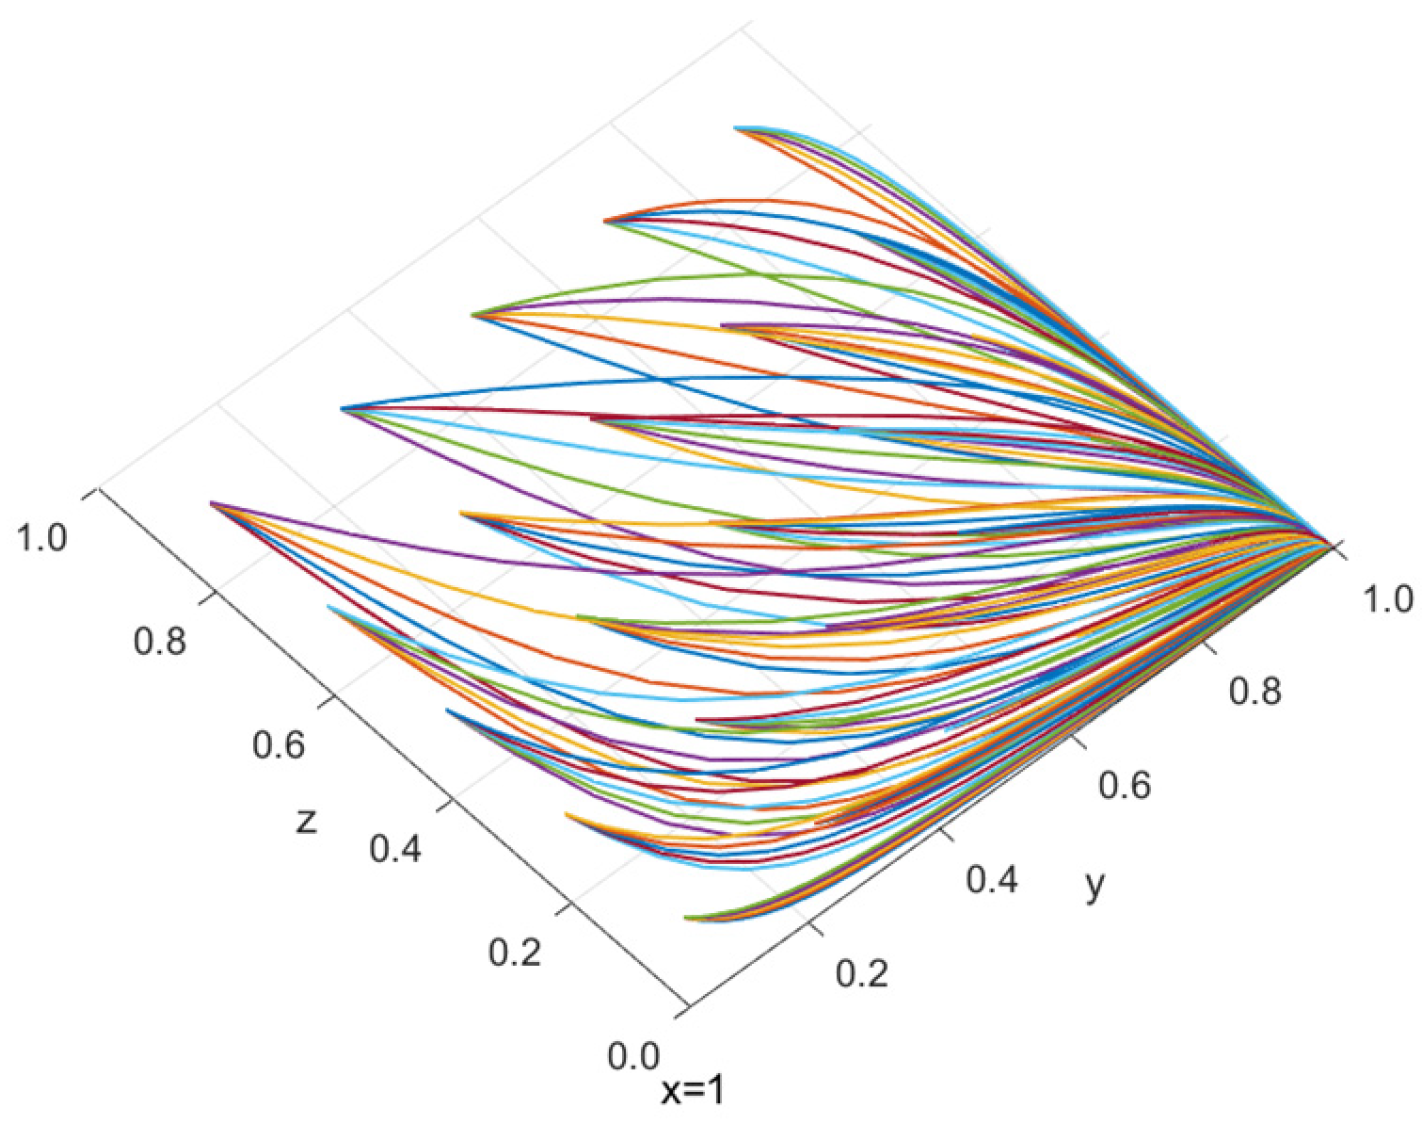
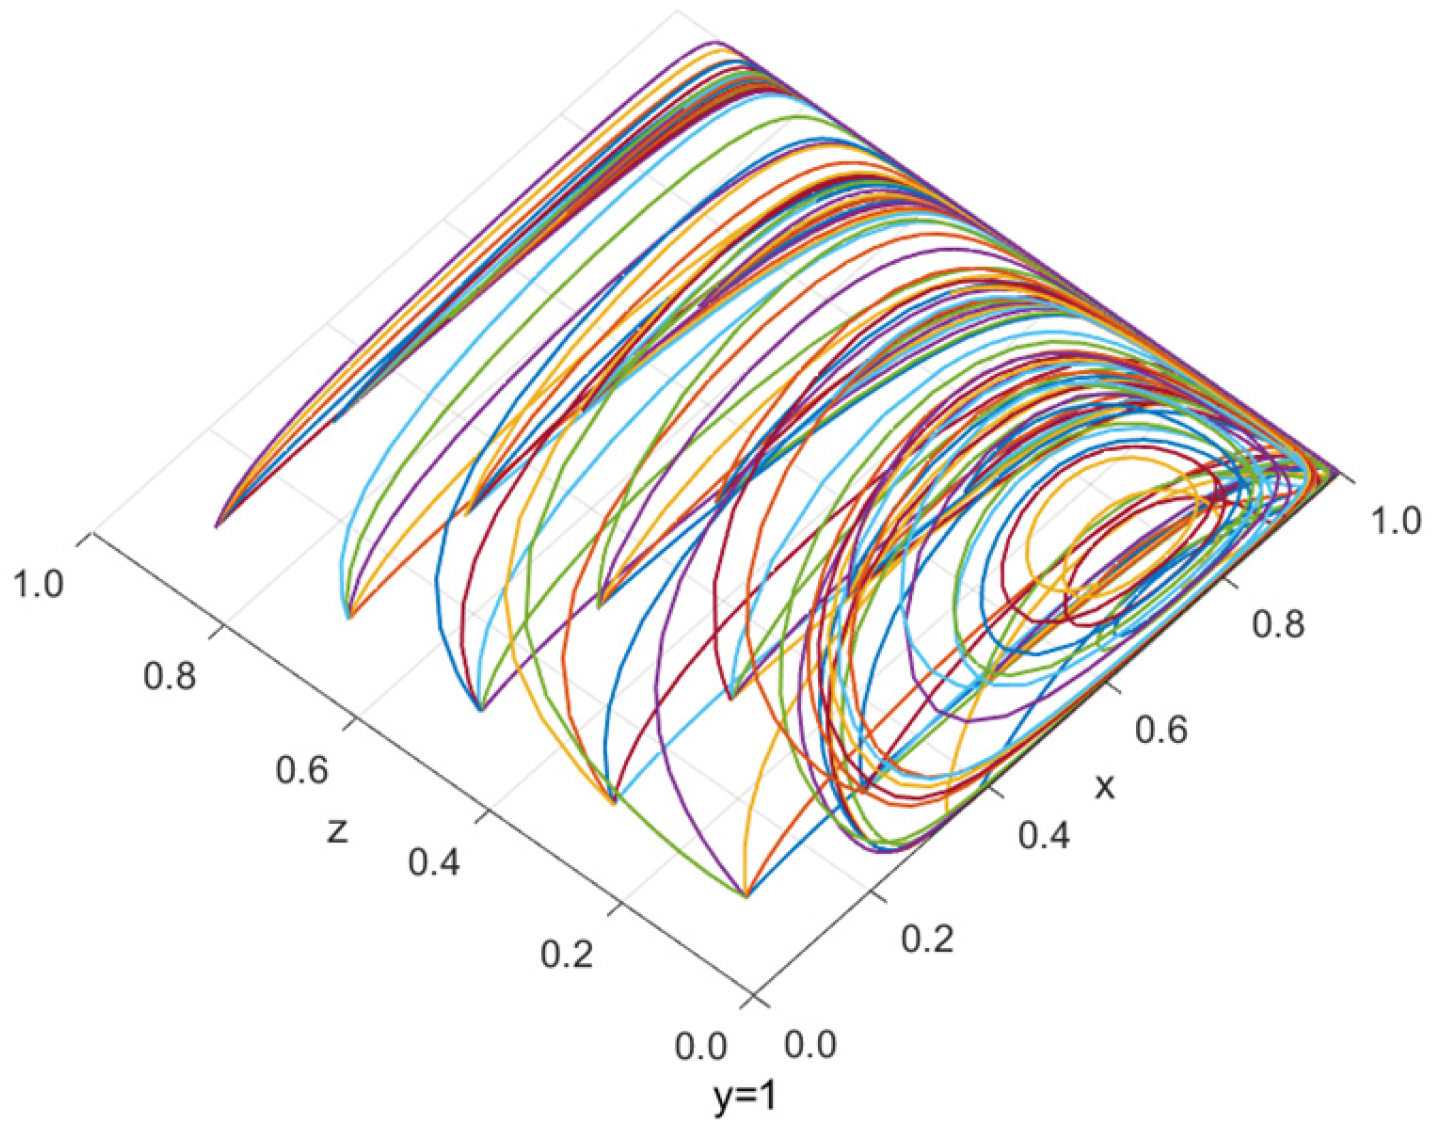
Figure 9 and Figure 10 show the evolution process diagram and top view of y, z and p when the initial value of x is 1. It can be seen from the figure that when the initial value of x is 1, p has no influence on the evolution process of y and z, and the rising speed of y value is smaller than the decreasing speed of z, indicating that when the initial value of the central government’s strong supervision is 1, the proportion of netizens participating in dissemination has no influence on the proportion of local government’s full disclosure and the proportion of enterprises’ authentic marketing. The proportion of full disclosure by local governments and the proportion of authentic marketing by enterprises are determined by local governments and enterprises themselves. The smaller the initial value of z, the larger the initial value of y, indicating that the proportion of authentic marketing by the enterprises is smaller, and the proportion of complete disclosure by the local government is larger. When the proportion of authentic marketing of enterprises is 0, the proportion of full disclosure of local government is close to 1.
Figure 7, Figure 8, Figure 9 and Figure 10 prove that the smaller the initial proportion of authentic marketing of the enterprises, the more obvious the promotion effect on the local government to adopt the strategy of complete disclosure.

4.4. The Influence of y Initial Value on Evolutionary Equilibrium

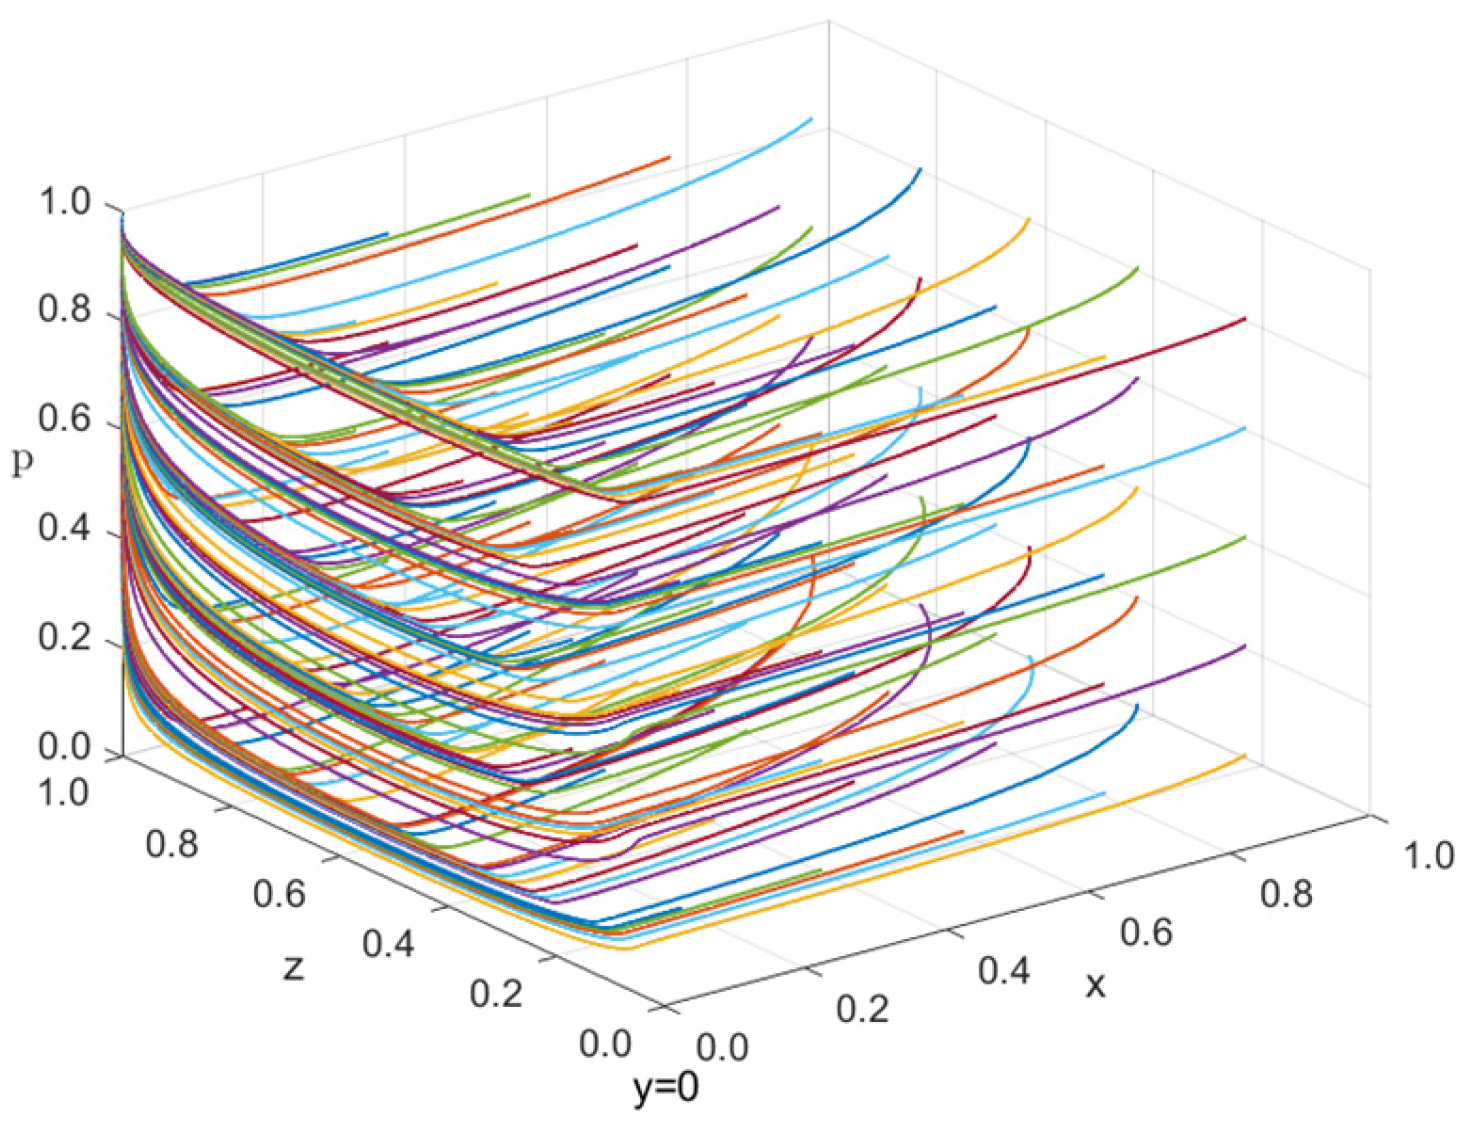
Figure 11 and Figure 12 show the evolution process diagram and top view of x, z and p when the initial value of y is 0. It can be seen from the figure that when the initial value of y is 0, the size of p does not affect the evolution process of x and z, and the rate of decline of x is greater than the rate of rise in z. In other words, when the initial proportion of full disclosure by local governments is 0, the participation of netizens in dissemination has no impact on the proportion of strong supervision by the central government and the proportion of authentic marketing by the enterprises, indicating that the proportion of strong supervision by the central government and the proportion of authentic marketing by the enterprises are determined by themselves. When z increases, x decreases, indicating that the greater the proportion of authentic marketing of the enterprises, the smaller the proportion of strong supervision by the central government. When the proportion of authentic marketing of the enterprises is 1, the proportion of strong supervision by the central government is 0. This proves that the greater the proportion of authentic marketing from the media, the more relaxed the central government will be.
Figure 13 and Figure 14 show the evolution process diagram and top view of x, z and p when the initial value of y is 1. As can be seen from the figure, when the initial value of y is 1, the evolution process of x and z is affected by the size of p. The smaller the value of p, the faster x increases compared to the rate at which z increases. That is, when the initial proportion of full disclosure by local governments is 1, the lower the proportion of netizens participating in dissemination, the faster the proportion of strong supervision by the central government will rise compared to the rate of decline of authentic marketing by the enterprises. In addition, when the proportion of netizens participating in the dissemination is greater than 0.5, the changes in x and z both show a spiral phenomenon; that is, the proportion of strong supervision by the central government shows a spiral upward trend, while the proportion of authentic marketing by the enterprises shows a spiral downward trend, and the overall trend remains unchanged. When the proportion of strict supervision by the central government is 1, the proportion of authentic marketing by enterprises is 0. That is, when netizens participate in the dissemination, enterprises always put their own interests first, use deceptive marketing to deal with the public opinion crisis of the enterprise and try to confuse consumers. The central government always strengthens supervision and maintains network order.
Figure 11, Figure 12, Figure 13 and Figure 14 prove that the larger the initial proportion of deceptive marketing by enterprises, the more obvious the promotion effect of the central government in choosing a strong supervision strategy.

4.5. The Influence of z Initial Value on Evolutionary Equilibrium

Figure 15 and Figure 16 show the evolution process diagram and top view of x, y and p when the initial value of z is 0. When the initial value of z is 0, x and y have two evolution processes at the same time; that is, x and y simultaneously decline and x and y simultaneously rise, and with the increase in p-value, x and y simultaneously rise less and less. This indicates that when the initial value of the authentic marketing ratio of enterprises is 0, the proportion of the central government’s strong supervision changes in the same direction as the proportion of the local government’s full disclosure. Moreover, the higher the proportion of netizens participating in dissemination, the more the proportion of the central government’s strong supervision decreases in the same direction as that of the local government’s full disclosure. In other words, under strong central government supervision, local governments are forced to adopt the strategy of full disclosure to avoid punishment.
Figure 17 and Figure 18 show the evolution process diagram and top view of x, y and p when the initial value of z is 1. When the initial value of z is 1, the size of p has no effect on the evolution of x and y, and x and y fall and rise at the same time, respectively. That is, when the initial proportion of honest promotion by enterprises is 1, the proportion of netizens participating in dissemination will not affect the proportion of strong supervision by the central government or full disclosure by the local government, and the trend of strong supervision by the central government is the same as that of full disclosure by the local government. This shows that when enterprises use authentic marketing, local governments will be forced to choose the strategy of complete disclosure.
Figure 15, Figure 16, Figure 17 and Figure 18 prove that when the central government is strongly regulated, a larger initial proportion results in a more obvious increase in local governments choosing to fully disclose enterprise crisis event information.

4.6. The Influence of p Initial Value on Evolutionary Equilibrium

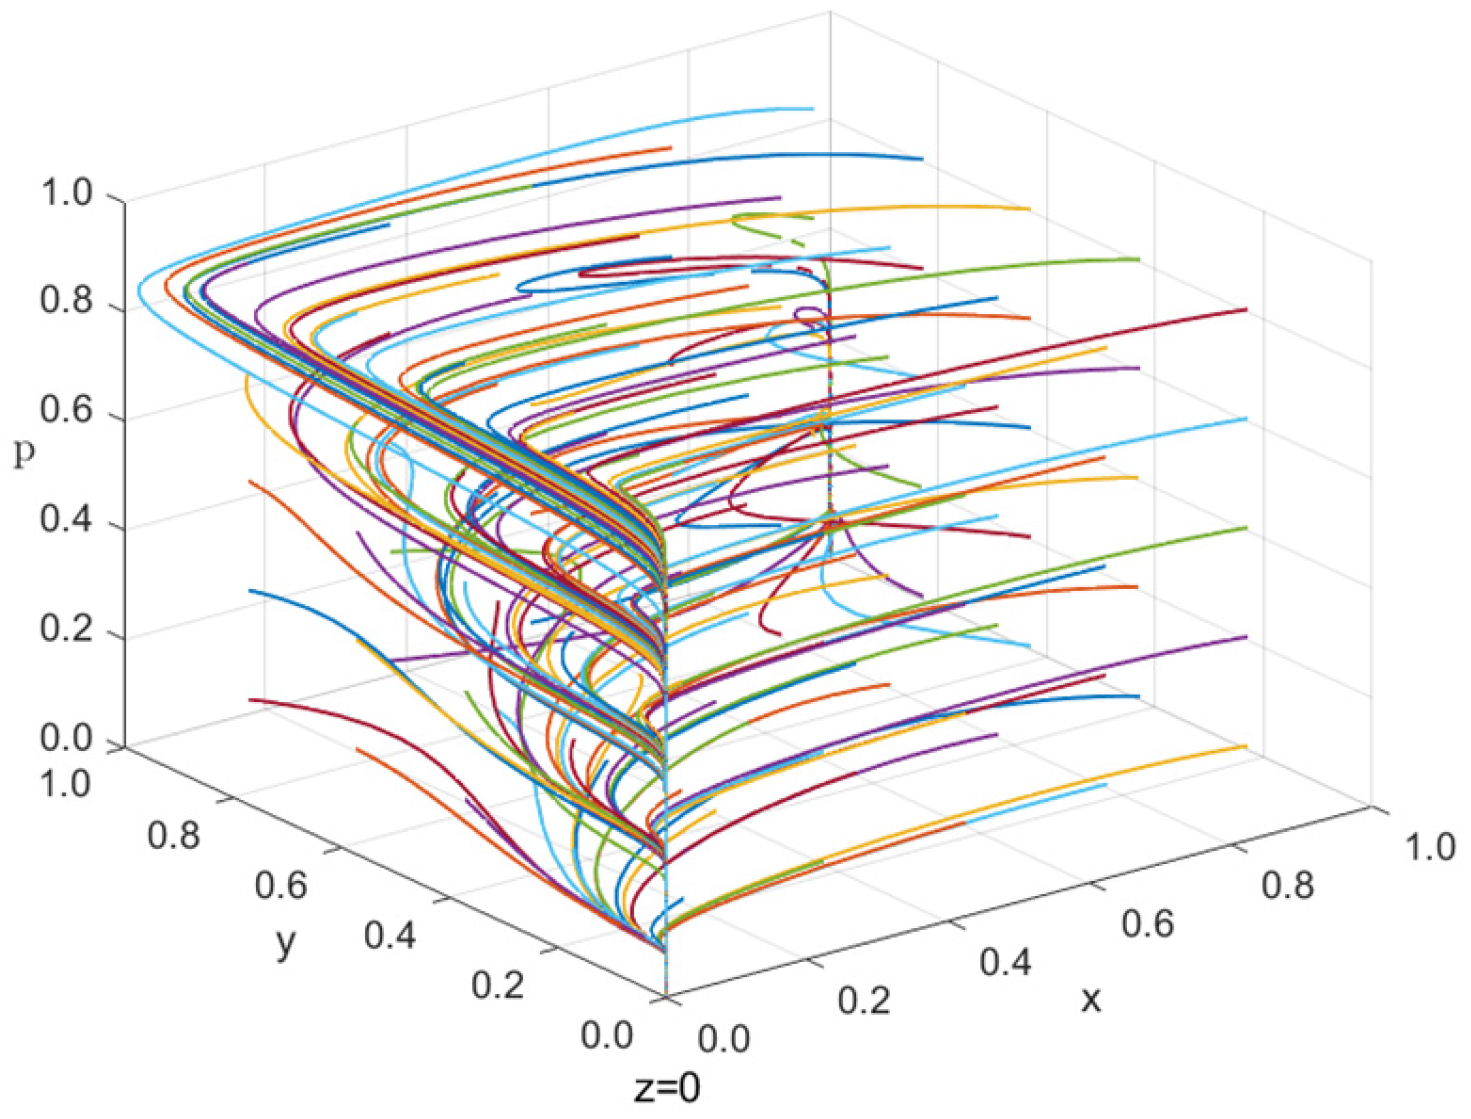
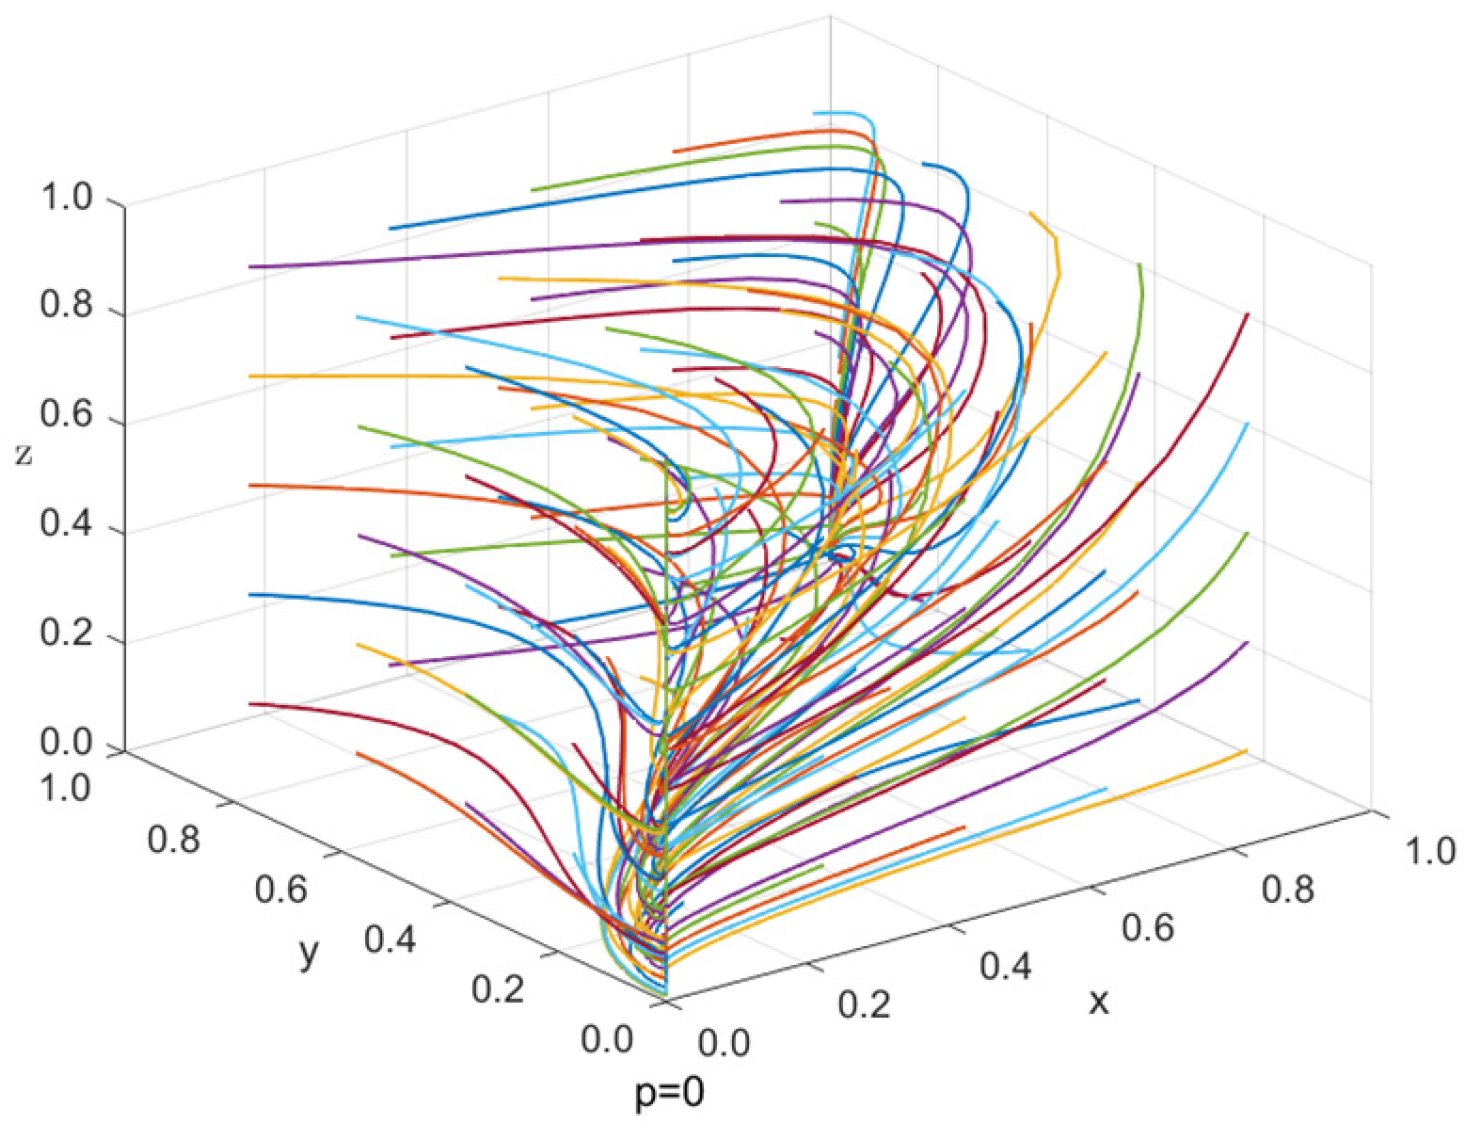
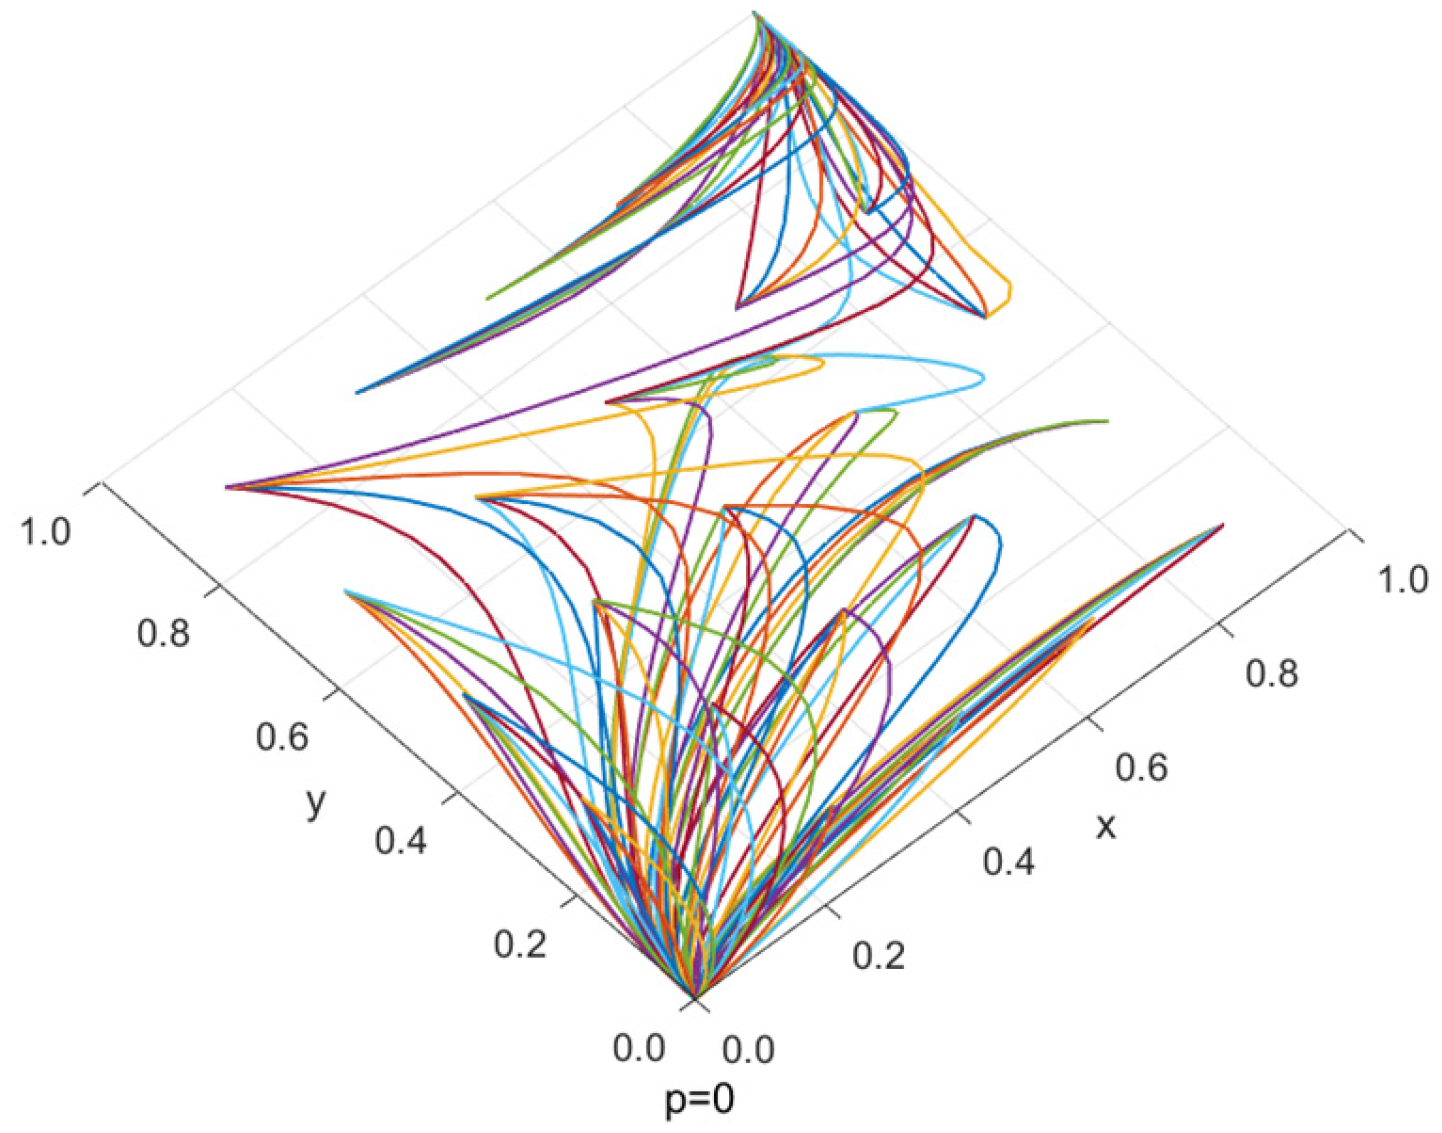
Figure 19 and Figure 20 show the evolution process diagram and top view of x, y and z when the initial value of p is 0. When the initial value of p is 0, z has an effect on the evolution process of x and y, but has no effect on the final evolution result, and x and y rise and fall at the same time. That is, when the initial proportion of netizens participating in dissemination is 0, the strategy combination of the central government and the local government evolves in the same direction.
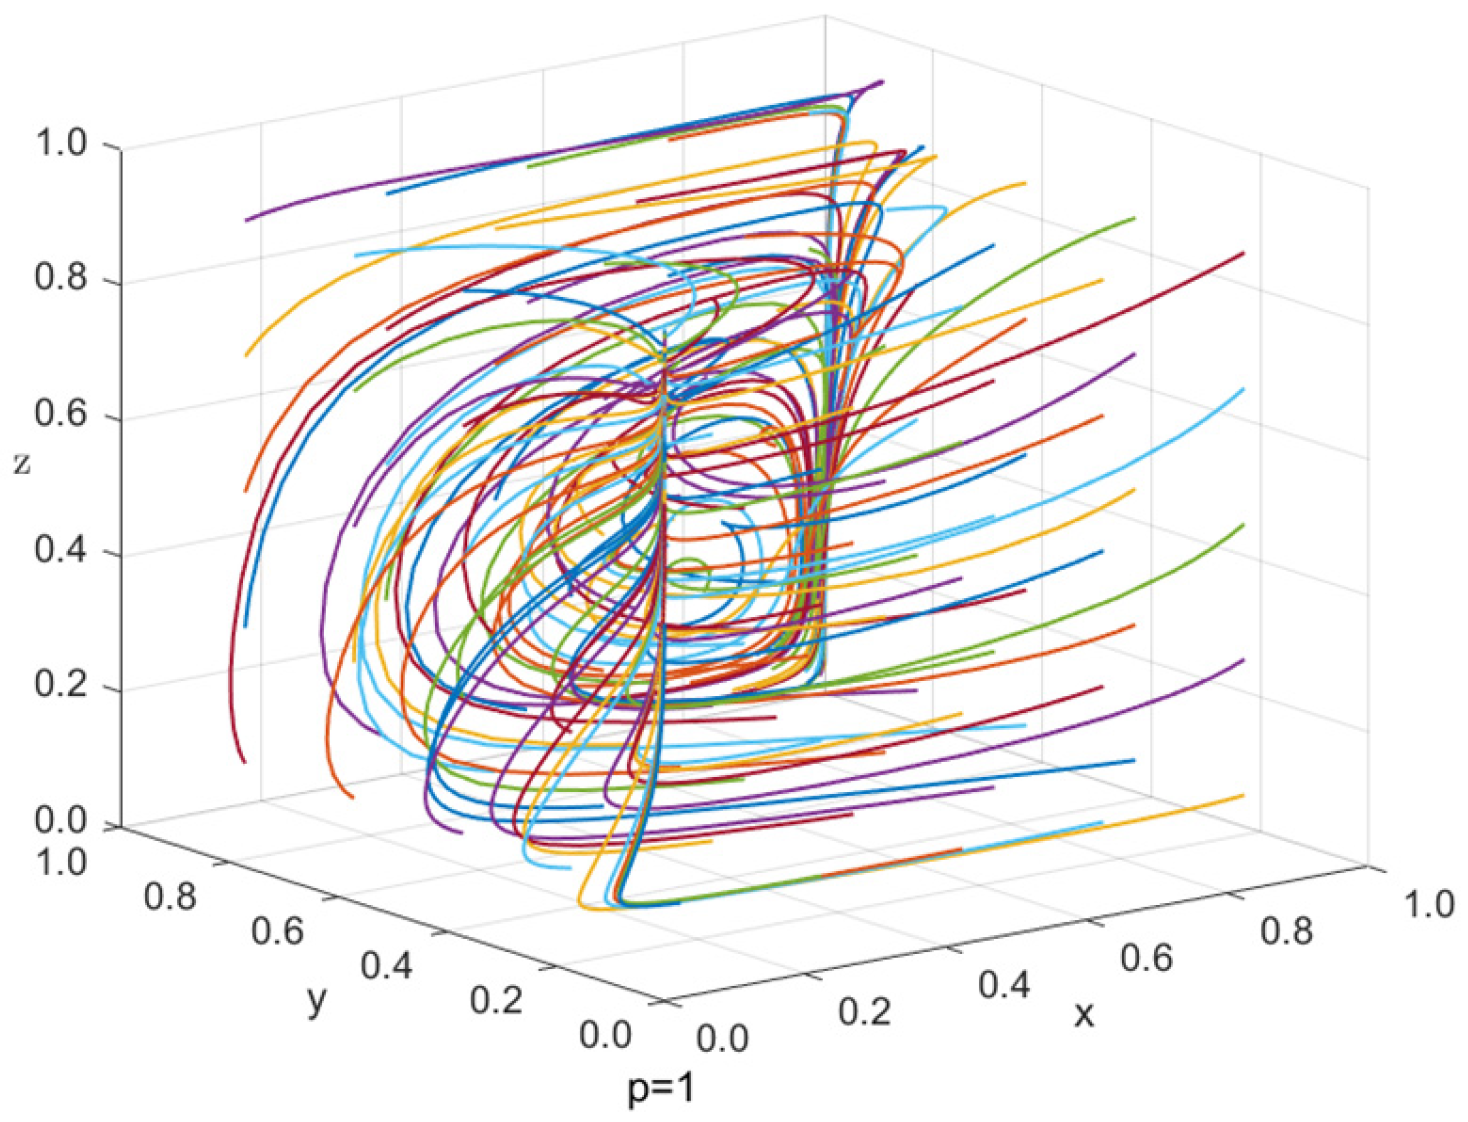
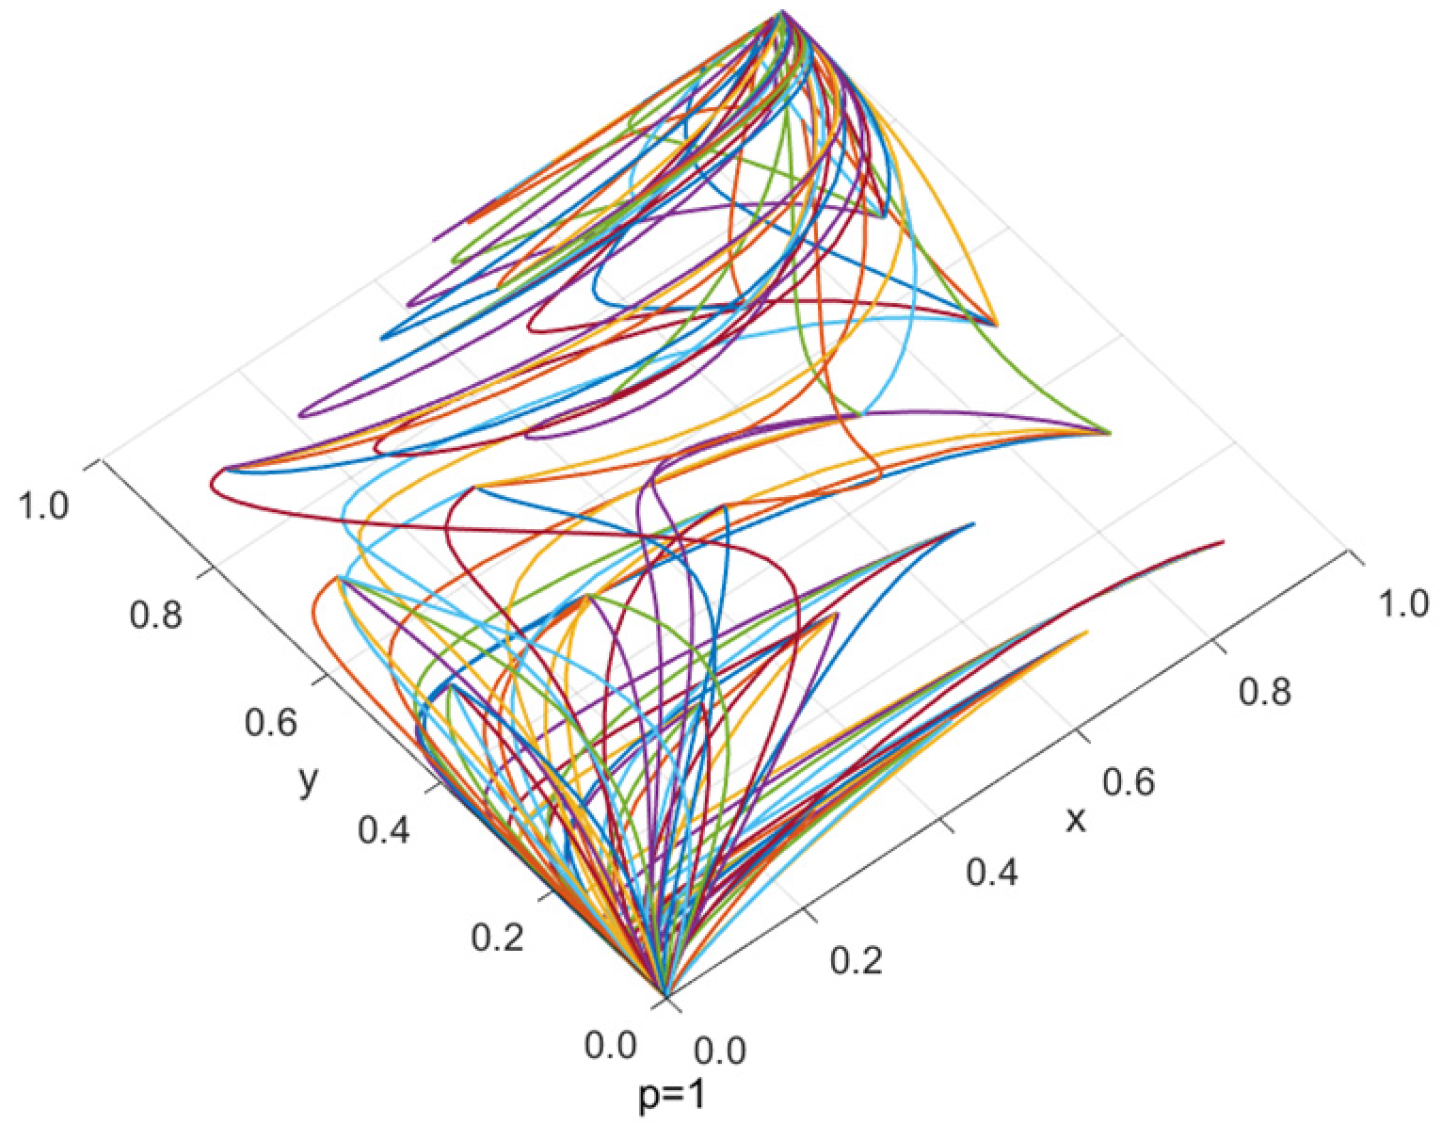
Figure 21 and Figure 22 show the evolution process diagram and top view of x, y and z when the initial value of p is 1. When the initial value of p is 1, x and y rise and fall at the same time. That is, when the initial proportion of netizens participating in dissemination is 0, the strategy combination of the central government and the local government evolves in the same direction.
Figure 19, Figure 20, Figure 21 and Figure 22 prove that the greater the initial proportion of strong supervision by the central government, the more obvious the increase in local governments choosing to fully disclose enterprise crisis event information.

5. Results and Management Enlightenment

5.1. Results

Based on the tipping point theory and taking public panic as a breakthrough, this paper establishes a multi-agent evolutionary game model for public opinion dissemination between the central government, the local government, enterprises and netizens after an enterprise crisis event, analyzes the stability point of the model, and explores the evolutionary equilibrium conditions of each agent’s behavior strategy. Through model construction and evolutionary stability strategy analysis, the following results are drawn.
(1)
Public panic plays a two-way moderating role in the evolution of the behavior strategy of the government and enterprises. The level of public panic can indirectly affect the behavior strategies of the government and enterprises through public behavior and online public opinion; that is, the range of public panic corresponds to the strategy choices of the government and enterprises, as shown in Table A2.
(2)
The central government is more likely to influence the strategic choice of local governments than enterprises and netizens. When the central government chooses a strong supervision strategy, it will push local governments to fully disclose enterprise public opinion crisis event information. When the initial proportion of the central government’s strong supervision is larger, that is, the punishment imposed on local governments is greater, the local government will fully disclose the incident information because the punishment after being supervised will be greater than the impact of public panic.
(3)
The greater the proportion of enterprises adopting deceptive marketing strategies, the more likely the central government is to strengthen supervision, and the more inclined local governments are to fully disclose information related to the public opinion crisis of enterprises. To attract users’ attention, enhance brand value and maximize short-term revenue, enterprises will exaggerate or distort the original facts. This strategy not only expanded network traffic but also injected false information into public information flow, intensifying panic. As deceptive marketing spreads, public panic keeps accumulating, and the risk of collective boycotts increases. This forces the central government to adopt a strong supervision strategy to curb misleading propaganda and guide public sentiment, thereby reducing the risk of panic. When enterprises continuously adopt deceptive marketing strategies after public opinion events occur, the intensity of public panic depends on the completeness of information disclosure by local governments.

5.2. Management Enlightenment

Combining the tipping point theory with the evolutionary game model, this study provides the following management insights for governments and enterprises.
(1)
User dimension: Local governments should carry out digital literacy and crisis information identification education for netizens to enhance their ability to discriminate between true and deceptive marketing information. Enterprises should help netizens quickly verify the facts of the crisis through transparent communication, traceable labels and interactive popular science, and strengthen their trust and participation in the brand’s sustainable commitment. This can not only promptly calm the panic during the peak period of public opinion, but also accumulate sustainable consumption preferences after the crisis, forming a long-term value network jointly maintained by enterprises and consumers.
(2)
Emotional dimension: Enterprises should upgrade their response to public opinion crises to the operation of sustainable emotional accounts. They should release verifiable information within the ESG framework at the first moment of a public opinion crisis and enhance emotional resonance with visual data, such as the progress of social welfare. First, conduct public relations with netizens through empathy statements. Second, invite consumers to participate in the co-creation of green solutions. Finally, share the sustainable achievements, transforming crisis panic into a deep recognition of the brand’s sustainable commitment, and thereby driving long-term green consumption and word-of-mouth expansion.
(3)
Content dimension: Enterprises can take the officially disclosed information after a crisis as content assets, transform the crisis information into sustainable and shareable stories and conduct authenticity marketing. Meanwhile, enterprises have launched remedial products, opened up consumer co-creation channels on social media and used UGC content to help optimize green products. Achieve a complete closed loop of emotional repair, brand co-creation, and repurchase locking, directly transforming public opinion crises into a sustainable growth flywheel.

6. Discussion and Conclusions

6.1. Discussion

We utilized the four-agent evolutionary game model to predict the panic generated during the public opinion dissemination process after a crisis event, providing a basis for creating a favorable marketing environment and helping enterprises achieve sustainable marketing. However, this study has certain limitations. The future research directions are as follows.
(1)
Empirical research verification: This study mainly relies on theoretical analysis and numerical simulation. Although it can reveal the evolution mechanism of panic emotions and the dynamic characteristics of public opinion dissemination, it lacks specific empirical data to verify the accuracy and validity of the model. In the future, the model can be empirically verified by combining specific cases and big data analysis to further improve the theoretical framework.
(2)
Extended research on influencing factors: This study mainly focuses on the bidirectional supervision effect of panic emotions, while the role of other emotions (such as optimism, anger, etc.) in the dissemination of public opinion has not been deeply analyzed. In the future, it is necessary to study the role of other emotions (such as optimism, anger, etc.) in public opinion dissemination and their impact on market behavior.
(3)
Practical application research: This study mainly explores the evolution mechanism of public panic and the dynamic characteristics of public opinion dissemination in enterprise public opinion crises from a macro-perspective, lacking targeted research for specific industries. In the future, the marketing strategies of different industries in response to public opinion crisis events should be analyzed, providing more comprehensive practical support for sustainable marketing.

6.2. Conclusions

After the outbreak of an enterprise public opinion crisis, accurately grasping the moment when consumers’ emotions change is crucial for maintaining revenue and brand equity. Although the existing research on public opinion diffusion mainly focuses on the macro level, research on the micro level of the four key subjects, namely, the central government, local governments, enterprises and netizens, is still insufficient. Therefore, this study analyzed the behavioral factors that drive the triggering of public panic from three dimensions (content, users, and emotions) and established a four-agent evolutionary game model, aiming to reveal the micro-laws that control the evolution of enterprise crisis public opinion in the digital age. The main contributions of this study are as follows.
(1)
Deepening the perspective on micro-subject analysis: We conducted an in-depth analysis of the behavioral factors of each participating agent in public opinion dissemination at the micro level, making up for the deficiency of existing research in the analysis of micro-agents. It provides new perspectives and entry points for subsequent research, promoting the development of public opinion dissemination research towards a more detailed and in-depth direction.
(2)
Constructing a multi-agent evolutionary game model: We constructed an evolutionary game model involving the central government, local government, enterprises and netizens, providing a new methodological tool for studying the interaction among the agents in the process of complex public opinion dissemination. This multi-agent analytical approach helps us to understand the dynamic characteristics of public opinion dissemination more comprehensively.
(3)
Performing simulation analysis and a simulation: Based on the four-party evolution game model of crisis public opinion, the behavioral trajectories and panic degree inflection points of the central government, local governments, enterprises and netizens under different strategy combinations are simulated to provide decision support for enterprises’ crisis response and sustainable marketing. The simulation results can be directly transformed into crisis communication scripts, information disclosure rhythms and green product launch strategies. This can not only quickly reduce public panic during the peak stage of public opinion dissemination but also accumulate brand trust and sustainable consumption assets after the crisis, demonstrating the enterprise’s own social responsibility while maintaining its long-term profits.

Author Contributions

Conceptualization, X.Y. and J.S.; methodology, X.Y. and J.S.; software, Y.Y.; validation, J.S., X.Y. and Y.Y.; formal analysis, X.Y.; investigation, J.S.; resources, Y.Y.; data curation, J.S.; writing—original draft preparation, X.Y. and J.S.; writing—review and editing, X.Y.; visualization, X.Y.; supervision, Y.Y.; project administration, Y.Y.; funding acquisition, Y.Y. All authors have read and agreed to the published version of the manuscript.

Funding

This research was funded by Science Research Project of Hebei Education Department, China (Grant no. BJ2025294), the 2025 Hebei Province Master’s Degree Graduate Students’ Innovation Ability Cultivation Funding Project, China (Grant no. CXZZSS2025077), Funding for Key Research Bases of Humanities and Social Sciences in Higher Educational Institutions in Hebei Province.

Institutional Review Board Statement

Not applicable.

Informed Consent Statement

Not applicable.

Data Availability Statement

The original contributions presented in this study are included in the article material. Further inquiries can be directed to the corresponding authors.

Conflicts of Interest

The authors declare no conflicts of interest.

Appendix A

f = d x d t = x 1 x y z p G 11 G ` 13 + 1 y z p G 12 G 14 + y z 1 p G 21 G 23 + 1 y z 1 p G 22 G 24 + y 1 z p G 31 G 33 + 1 y 1 z p G 32 G 34 + y 1 z 1 p G 41 G 43 + 1 y 1 z 1 p G 42 G 44 d y d t = y 1 y x z p E 11 E 12 + x z 1 p E 21 E 22 + x 1 z p E 31 E 32 + x 1 z 1 p E 41 E 42 + 1 x z p E 13 E 14 + 1 x z 1 p E 23 E 24 + 1 x 1 z p E 33 E 34 + 1 x 1 z 1 p E 43 E 44 d z d t = z 1 z x y p L 11 L 31 + x 1 y p L 12 L 32 + 1 x y p L 13 L 33 + 1 x 1 y p L 14 L 34 + x y 1 p L 21 L 41 + x 1 y 1 p L 22 L 42 + 1 x y 1 p L 23 L 43 + 1 x 1 y 1 p L 24 L 44 d p d t = p 1 p x y z F 11 F 21 + x 1 y z F 12 F 22 + 1 x y z F 13 F 23 + 1 x 1 y z F 14 F 24 + x y 1 z F 31 F 41 + x 1 y 1 z F 32 F 42 + 1 x y 1 z F 33 F 43 + 1 x 1 y 1 z F 34 F 44
J = M 11 M 12 M 13 M 14 M 21 M 22 M 23 M 24 M 31 M 32 M 33 M 34 0 0 0 M 44
M 11 = 1 2 x y z p G 11 G ` 13 + 1 y z p G 12 G 14 + y z 1 p G 21 G 23 + 1 y z 1 p G 22 G 24 + y 1 z p G 31 G 33 + 1 y 1 z p G 32 G 34 + y 1 z 1 p G 41 G 43 + 1 y 1 z 1 p G 42 G 44
M 12 = x 1 x a + d K z p ( n 5 n 13 ) ( n 1 n 9 ) + z 1 p ( n 6 n 14 ) ( n 2 n 10 ) + 1 z p ( n 7 n 15 ) ( n 3 n 11 ) + 1 z 1 p ( n 8 n 16 ) ( n 4 n 12 )
M 13 = x 1 x a + d K y p ( n 3 n 11 ) ( n 1 n 9 ) + 1 y p ( n 7 n 15 ) ( n 5 n 13 ) + y 1 p ( n 4 n 12 ) ( n 2 n 10 ) + 1 y 1 p ( n 8 n 16 ) ( n 6 n 14 )
M 14 = x 1 x a + d K y z ( n 2 n 10 ) ( n 1 n 9 ) + 1 y z ( n 6 n 14 ) ( n 5 n 13 ) + y 1 z ( n 4 n 12 ) ( n 3 n 11 ) + 1 y 1 z ( n 8 n 16 ) ( n 7 n 15 )
M 21 = y 1 y z p S 5 S 6 1 w + ( n 9 n 13 ) ( n 1 n 5 ) ( b c r ) K + z 1 p S 5 S 6 1 w + ( n 10 n 14 ) ( n 2 n 6 ) ( b c r ) K + 1 z p S 5 S 6 1 w + ( n 11 n 15 ) ( n 3 n 7 ) ( b c r ) K + 1 z 1 p S 5 S 6 1 w + ( n 12 n 16 ) ( n 4 n 8 ) ( b c r ) K
M 22 = 1 2 y x z p E 11 E 12 + x z 1 p E 21 E 22 + x 1 z p E 31 E 32 + x 1 z 1 p E 41 E 42 + 1 x z p E 13 E 14 + 1 x z 1 p E 23 E 24 + 1 x 1 z p E 33 E 34 + 1 x 1 z 1 p E 43 E 44
M 23 = y 1 y b c r K x p ( n 3 n 7 ) ( n 1 n 5 ) + x 1 p ( n 4 n 8 ) ( n 2 n 6 ) + 1 x p ( n 11 n 15 ) ( n 9 n 13 ) + 1 x 1 p ( n 12 n 16 ) ( n 10 n 14 )
M 24 = y 1 y b c r K x z ( n 2 n 6 ) ( n 1 n 5 ) + x 1 z ( n 4 n 8 ) ( n 3 n 7 ) + 1 x z ( n 10 n 14 ) ( n 9 n 13 ) + 1 x 1 z ( n 12 n 16 ) ( n 11 n 15 )
M 31 = z 1 z 1 r y p c ( n 1 n 3 ) K c ( n 9 n 11 ) K + E 3 E 4 + 1 y p c ( n 5 n 7 ) K c ( n 13 n 15 ) K + E 3 E 4 + y 1 p c ( n 2 n 4 ) K c ( n 10 n 12 ) K + E 3 E 4 + 1 y 1 p c ( n 6 n 8 ) K c ( n 14 n 16 ) K + E 3 E 4
M 32 = z c K 1 z 1 r x p ( n 1 n 3 ) ( n 5 n 7 ) + 1 x p ( n 9 n 11 ) ( n 13 n 15 ) + x 1 p ( n 2 n 4 ) ( n 6 n 8 ) + 1 x 1 p ( n 10 n 12 ) ( n 14 n 16 )
M 33 = 1 2 z x y p L 11 L 31 + x 1 y p L 12 L 32 + 1 x y p L 13 L 33 + 1 x 1 y p L 14 L 34 + x y 1 p L 21 L 41 + x 1 y 1 p L 22 L 42 + 1 x y 1 p L 23 L 43 + 1 x 1 y 1 p L 24 L 44
M 34 = z 1 z 1 r x y c ( n 1 n 3 ) K c ( n 2 n 4 ) K + A 1 A 2 + x 1 y c ( n 5 n 7 ) K c ( n 6 n 8 ) K + A 1 A 2 + 1 x y c ( n 9 n 11 ) K c ( n 10 n 12 ) K + A 1 A 2 + 1 x 1 y c ( n 13 n 15 ) K c ( n 14 n 16 ) K + A 1 A 2
M 44 = 1 2 p x y z F 11 F 21 + x 1 y z F 12 F 22 + 1 x y z F 13 F 23 + 1 x 1 y z F 14 F 24 + x y 1 z F 31 F 41 + x 1 y 1 z F 32 F 42 + 1 x y 1 z F 33 F 43 + 1 x 1 y 1 z F 34 F 44
E x = x y z p G 11 G ` 13 + 1 y z p G 12 G 14 + y z 1 p G 21 G 23 + 1 y z 1 p G 22 G 24 + y 1 z p G 31 G 33 + 1 y 1 z p G 32 G 34 + y 1 z 1 p G 41 G 43 + 1 y 1 z 1 p G 42 G 44   + y 1 z p S 2 C 3 + C 4 a n 11 K d n 11 K + y z p S 2 C 3 + C 4 a n 9 K d n 9 K + 1 y z p S 2 C 3 + C 4 a n 13 K d n 13 K + y z 1 p S 2 C 3 + C 4 a n 10 K d n 10 K   + 1 y z 1 p S 2 C 3 + C 4 a n 14 K d n 14 K + 1 y 1 z p S 2 C 3 + C 4 a n 15 K d n 15 K + y 1 z 1 p S 2 C 3 + C 4 a n 12 K d n 12 K   + 1 y 1 z 1 p S 2 C 3 + C 4 a n 16 K d n 16 K
E y = y x z p E 11 E 12 + x z 1 p E 21 E 22 + x 1 z p E 31 E 32 + x 1 z 1 p E 41 E 42 + 1 x z p E 13 E 14 + 1 x z 1 p E 23 E 24 + 1 x 1 z p E 33 E 34 + 1 x 1 z 1 p E 43 E 44   + x z p w S 4 C 6 + 1 w S 4 C 7 S 5 + r F + E 1 + A 1 + c n 5 K C 8 b n 5 K + x z 1 p w S 4 C 6 + 1 w S 4 C 7 S 5 + r F + E 1 + c n 6 K C 8 b n 6 K   + x 1 z p w S 4 C 6 + 1 w S 4 C 7 S 5 + r E 2 + A 2 + c n 7 K C 9 E 3 b n 7 K + x 1 z 1 p w S 4 C 6 + 1 w S 4 C 7 S 5 + r E 2 + c n 8 K C 9 E 3 b n 8 K   + 1 x z p w S 4 C 6 + 1 w S 4 C 7 S 6 + r F + E 1 + A 1 + c n 13 K C 8 b n 13 K + 1 x z 1 p w S 4 C 6 + 1 w S 4 C 7 S 6 + r F + E 1 + c n 14 K C 8 b n 14 K   + 1 x 1 z p w S 4 C 6 + 1 w S 4 C 7 S 6 + r E 2 + A 2 + c n 15 K C 9 E 4 b n 15 K + 1 x 1 z 1 p w S 4 C 6 + 1 w S 4 C 7 S 6 + r E 2 + c n 16 K C 9 E 4 b n 16 K
E z = z x y p L 11 L 31 + x 1 y p L 12 L 32 + 1 x y p L 13 L 33 + 1 x 1 y p L 14 L 34 + x y 1 p L 21 L 41 + x 1 y 1 p L 22 L 42 + 1 x y 1 p L 23 L 43 + 1 x 1 y 1 p L 24 L 44   + x y p 1 r E 2 + A 2 + c n 3 K E 3 C 9 + x 1 y p 1 r E 2 + A 2 + c n 7 K C 9 E 3 + 1 x y p 1 r E 2 + A 2 + c n 11 K C 9 E 4 + 1 x 1 y p 1 r E 2 + A 2 + c n 15 K C 9 E 4   + x y 1 p 1 r E 2 + c n 4 K E 3 C 9 + x 1 y 1 p 1 r E 2 + c n 8 K C 9 E 3 + 1 x y 1 p 1 r E 2 + c n 12 K C 9 E 4 + 1 x 1 y 1 p 1 r E 2 + c n 16 K C 9 E 4
E p = p x y z F 11 F 21 + x 1 y z F 12 F 22 + 1 x y z F 13 F 23 + 1 x 1 y z F 14 F 24 + x y 1 z F 31 F 41 + x 1 y 1 z F 32 F 42 + 1 x y 1 z F 33 F 43 + 1 x 1 y 1 z F 34 F 44   + x y z H 1 C 11 + x 1 y z H 1 C 11 + 1 x y z H 2 C 11 + 1 x 1 y z H 2 C 11 + x y 1 z H 1 + x 1 y 1 z H 1 + 1 x y 1 z H 2 + 1 x 1 y 1 z H 2
Table A1. Strategy eigenvalue.
Equilibrium PointCharacteristic Value 1Characteristic Value 2Characteristic Value 3Characteristic Value 4
(0, 0, 0, 0) G 42 G 44 E 43 E 44 L 24 L 44 F 34 F 44
(0, 0, 0, 1) G 32 G 34 E 33 E 34 L 14 L 34 F 34 F 44
(0, 0, 1, 0) G 22 G 24 E 23 E 24 L 24 L 44 F 14 F 24
(0, 0, 1, 1) G 12 G 14 E 13 E 14 L 14 L 34 F 14 F 24
(0, 1, 0, 0) G 41 G 43 E 43 E 44 L 23 L 43 F 33 F 43
(0, 1, 0, 1) G 31 G 33 E 33 E 34 L 13 L 33 F 33 F 43
(0, 1, 1, 0) G 21 G 23 E 23 E 24 L 23 L 43 F 13 F 23
(0, 1, 1, 1) G 11 G ` 13 E 13 E 14 L 13 L 33 F 13 F 23
(1, 0, 0, 0) G 42 G 44 E 41 E 42 L 22 L 42 F 32 F 42
(1, 0, 0, 1) G 32 G 34 E 31 E 32 L 12 L 32 F 32 F 42
(1, 0, 1, 0) G 22 G 24 E 21 E 22 L 22 L 42 F 12 F 22
(1, 0, 1, 1) G 12 G 14 E 11 E 12 L 12 L 32 F 12 F 22
(1, 1, 0, 0) G 41 G 43 E 41 E 42 L 21 L 41 F 31 F 41
(1, 1, 0, 1) G 31 G 33 E 31 E 32 L 11 L 31 F 31 F 41
(1, 1, 1, 0) G 21 G 23 E 21 E 22 L 21 L 41 F 11 F 21
(1, 1, 1, 1) G 11 G ` 13 E 11 E 12 L 11 L 31 F 11 F 21
G 11 G ` 13 = ( S 1 S 2 ) C 1 + C 2 ( n 1 n 9 ) ( a + d ) K + C 3 + C 4
G 12 G 14 = ( S 1 S 2 ) C 1 + C 2 ( n 5 n 13 ) ( a + d ) K + C 3 + C 4
G 21 G 23 = ( S 1 S 2 ) C 1 + C 2 ( n 2 n 10 ) ( a + d ) K + C 3 + C 4
G 22 G 24 = ( S 1 S 2 ) C 1 + C 2 ( n 6 n 14 ) ( a + d ) K + C 3 + C 4
G 31 G 33 = ( S 1 S 2 ) C 1 + C 2 ( n 3 n 11 ) ( a + d ) K + C 3 + C 4
G 32 G 34 = ( S 1 S 2 ) C 1 + C 2 ( n 7 n 15 ) ( a + d ) K + C 3 + C 4
G 41 G 43 = ( S 1 S 2 ) C 1 + C 2 ( n 4 n 12 ) ( a + d ) K + C 3 + C 4
G 42 G 44 = ( S 1 S 2 ) C 1 + C 2 ( n 8 n 16 ) ( a + d ) K + C 3 + C 4
L 11 L 31 = ( 1 r ) [ c ( n 1 n 3 ) K ( C 8 C 9 ) + A 1 A 2 + F + E 1 E 2 + E 3 ]
L 12 L 32 = ( 1 r ) [ c ( n 5 n 7 ) K ( C 8 C 9 ) + A 1 A 2 + F + E 1 E 2 + E 3 ]
L 13 L 33 = ( 1 r ) [ c ( n 9 n 11 ) K ( C 8 C 9 ) + A 1 A 2 + F + E 1 E 2 + E 4 ]
L 14 L 34 = ( 1 r ) [ c ( n 13 n 15 ) K ( C 8 C 9 ) + F + E 1 E 2 + E 4 + A 1 A 2 ]
L 21 L 41 = ( 1 r ) [ c ( n 2 n 4 ) K ( C 8 C 9 ) + F + E 1 E 2 + E 3 ]
L 22 L 42 = ( 1 r ) [ c ( n 6 n 8 ) K ( C 8 C 9 ) + F + E 1 E 2 + E 3 ]
L 23 L 43 = ( 1 r ) [ c ( n 10 n 12 ) K ( C 8 C 9 ) + F + E 1 E 2 + E 4 ]
L 24 L 44 = ( 1 r ) [ c ( n 14 n 16 ) K ( C 8 C 9 ) + F + E 1 E 2 + E 4 ]
E 11 E 12 = S 3 S 4 + S 5 + w ( C 6 C 7 S 5 ) C 5 + C 7 ( n 1 n 5 ) ( b c r ) K
E 21 E 22 = S 3 S 4 + S 5 + w ( C 6 C 7 S 5 ) C 5 + C 7 ( n 2 n 6 ) ( b c r ) K
E 31 E 32 = S 3 S 4 + S 5 C 5 + C 7 ( n 3 n 7 ) ( b c r ) K + w ( C 6 C 7 S 5 )
E 41 E 42 = S 3 S 4 + S 5 + w ( C 6 C 7 S 5 ) C 5 + C 7 ( n 4 n 8 ) ( b c r ) K
E 13 E 14 = S 3 S 4 + S 6 + w ( C 6 C 7 S 6 ) C 5 + C 7 ( n 9 n 13 ) ( b c r ) K
E 23 E 24 = S 3 S 4 + S 6 + w ( C 6 C 7 S 6 ) C 5 + C 7 ( n 10 n 14 ) ( b c r ) K
E 33 E 34 = S 3 S 4 + S 6 C 5 + C 7 ( n 11 n 15 ) ( b c r ) K + w ( C 6 C 7 S 6 )
E 43 E 44 = S 3 S 4 + S 6 + w ( C 6 C 7 S 6 ) C 5 + C 7 ( n 12 n 16 ) ( b c r ) K
F 11 F 21 = S 7 ( C 10 C 11 )
F 12 F 22 = S 7 ( C 10 C 11 )
F 13 F 23 = S 7 ( C 10 C 11 )
F 14 F 24 = S 7 ( C 10 C 11 )
F 31 F 41 = S 8 C 10 S 9 E 5
F 32 F 42 = S 8 C 10 S 9 E 5
F 33 F 43 = S 8 C 10 S 10 E 5
F 34 F 44 = S 8 C 10 S 10 E 5
Table A2. Strategy combination and public panic degree.
StrategyCentral GovernmentLocal GovernmentEnterprisesNetizen
(0, 0, 0, 0)(Weak supervision, partial disclosure, deceptive marketing, non-participate in dissemination)The difference ( n 8 n 16 ) between the degree of public panic under the strong supervision strategy and the weak supervision strategy is greater than the critical value P.The proportion of public panic converted into the loss of social benefits for local governments is greater than the product of the tax rate paid by enterprises and the proportion of public panic converted into the loss of economic benefits for enterprises, the difference ( n 12 n 16 ) in public panic under the full disclosure and partial disclosure strategies of local governments is greater than the critical value Q1.
The proportion of public panic converted into social benefit losses for local governments is less than the product of the tax rate paid by enterprises and the proportion of public panic converted into economic benefit losses for enterprises. The difference ( n 12 n 16 ) in public panic under the full disclosure and partial disclosure strategies of local governments is less than the critical value Q1.
The difference ( n 14 n 16 ) in the degree of public panic caused by authentic marketing and deceptive marketing strategies is less than the critical value V1./
(0, 0, 1, 0)(Weak supervision, partial disclosure, authentic marketing, non-participate in dissemination)The difference ( n 6 n 14 ) between the degree of public panic under the strong supervision strategy and the weak supervision strategy is greater than the critical value P.The proportion of public panic converted into the loss of social benefits for local governments is greater than the product of the tax rate paid by enterprises and the proportion of public panic converted into the loss of economic benefits for enterprises, the difference ( n 10 n 14 ) in public panic under the full disclosure and partial disclosure strategies of local governments is greater than the critical value Q1.
The proportion of public panic converted into social benefit losses for local governments is less than the product of the tax rate paid by enterprises and the proportion of public panic converted into economic benefit losses for enterprises. The difference ( n 10 n 14 ) in public panic under the full disclosure and partial disclosure strategies of local governments is less than the critical value Q1.
The difference ( n 14 n 16 ) in the degree of public panic caused by authentic marketing and deceptive marketing strategies is greater than the critical value V1.The difference ( C 10 S 7 ) between the cost incurred by netizens choosing to participate in the dissemination strategy and the social benefits obtained by enterprises when they truthfully disseminate information is greater than the opportunity cost paid by netizens when they choose not to participate in the dissemination but the information is true.
(0, 0, 1, 1)(Weak supervision, partial disclosure, authentic marketing, participate in dissemination)The difference ( n 5 n 13 ) between the degree of public panic under the strong supervision strategy and the weak supervision strategy is greater than the critical value P.The proportion of public panic converted into the loss of social benefits for local governments is greater than the product of the tax rate paid by enterprises and the proportion of public panic converted into the loss of economic benefits for enterprises, the difference ( n 9 n 13 ) in public panic under the full disclosure and partial disclosure strategies of local governments is greater than the critical value Q1.
The proportion of public panic converted into social benefit losses for local governments is less than the product of the tax rate paid by enterprises and the proportion of public panic converted into economic benefit losses for enterprises. The difference ( n 9 n 13 ) in public panic under the full disclosure and partial disclosure strategies of local governments is less than the critical value Q1.
The difference ( n 13 n 15 ) in the degree of public panic caused by authentic marketing and deceptive marketing strategies is greater than the critical value V2.The difference ( C 10 S 7 ) between the cost incurred by netizens choosing to participate in the dissemination strategy and the social benefits obtained by enterprises when they truthfully disseminate information is less than the opportunity cost paid by netizens when they choose not to participate in the dissemination but the information is true.
(0, 1, 0, 0)(Weak supervision, full disclosure, deceptive marketing, non-participate in dissemination)The difference ( n 4 n 12 ) between the degree of public panic under the strong supervision strategy and the weak supervision strategy is greater than the critical value P.The proportion of public panic converted into the loss of social benefits for local governments is greater than the product of the tax rate paid by enterprises and the proportion of public panic converted into the loss of economic benefits for enterprises, the difference ( n 12 n 16 ) in public panic under the full disclosure and partial disclosure strategies of local governments is less than the critical value Q1.
The proportion of public panic converted into social benefit losses for local governments is less than the product of the tax rate paid by enterprises and the proportion of public panic converted into economic benefit losses for enterprises. The difference ( n 12 n 16 ) in public panic under the full disclosure and partial disclosure strategies of local governments is greater than the critical value Q1.
The difference ( n 10 n 12 ) in the degree of public panic caused by authentic marketing and deceptive marketing strategies is less than the critical value V1./
(0, 1, 1, 0)(Weak supervision, full disclosure, authentic marketing, non-participate in dissemination)The difference ( n 2 n 10 ) between the degree of public panic under the strong supervision strategy and the weak supervision strategy is greater than the critical value P.The proportion of public panic converted into the loss of social benefits for local governments is greater than the product of the tax rate paid by enterprises and the proportion of public panic converted into the loss of economic benefits for enterprises, the difference ( n 10 n 14 ) in public panic under the full disclosure and partial disclosure strategies of local governments is less than the critical value Q1.
The proportion of public panic converted into social benefit losses for local governments is less than the product of the tax rate paid by enterprises and the proportion of public panic converted into economic benefit losses for enterprises. The difference ( n 10 n 14 ) in public panic under the full disclosure and partial disclosure strategies of local governments is greater than the critical value Q1.
The difference ( n 10 n 12 ) in the degree of public panic caused by authentic marketing and deceptive marketing strategies is greater than the critical value V1.The difference ( C 10 S 7 ) between the cost incurred by netizens choosing to participate in the dissemination strategy and the social benefits obtained by enterprises when they truthfully disseminate information is less than the opportunity cost paid by netizens when they choose not to participate in the dissemination but the information is true.
(0, 1, 1, 1)(Weak supervision, full disclosure, authentic marketing, participate in dissemination)The difference ( n 1 n 9 ) between the degree of public panic under the strong supervision strategy and the weak supervision strategy is greater than the critical value P.The proportion of public panic converted into the loss of social benefits for local governments is greater than the product of the tax rate paid by enterprises and the proportion of public panic converted into the loss of economic benefits for enterprises, the difference ( n 9 n 13 ) in public panic under the full disclosure and partial disclosure strategies of local governments is less than the critical value Q1.
The proportion of public panic converted into social benefit losses for local governments is less than the product of the tax rate paid by enterprises and the proportion of public panic converted into economic benefit losses for enterprises. The difference ( n 9 n 13 ) in public panic under the full disclosure and partial disclosure strategies of local governments is greater than the critical value Q1.
The difference ( n 9 n 11 ) in the degree of public panic caused by authentic marketing and deceptive marketing strategies is greater than the critical value V2.The difference ( C 10 S 7 ) between the cost incurred by netizens choosing to participate in the dissemination strategy and the social benefits obtained by enterprises when they truthfully disseminate information is less than the opportunity cost paid by netizens when they choose not to participate in the dissemination but the information is true.
(1, 0, 0, 0)(strong supervision, partial disclosure, deceptive marketing, non-participate in dissemination)The difference ( n 8 n 16 ) in public panic between strong supervision and weak supervision is less than the critical value P.The proportion of public panic converted into the loss of social benefits for local governments is greater than the product of the tax rate paid by enterprises and the proportion of public panic converted into the loss of economic benefits for enterprises, the difference ( n 4 n 8 ) in public panic under the full disclosure and partial disclosure strategies of local governments is greater than the critical value Q2.
The proportion of public panic converted into social benefit losses for local governments is less than the product of the tax rate paid by enterprises and the proportion of public panic converted into economic benefit losses for enterprises. The difference ( n 4 n 8 ) in public panic under the full disclosure and partial disclosure strategies of local governments is less than the critical value Q2.
The difference ( n 6 n 8 ) in the degree of public panic caused by authentic marketing and deceptive marketing strategies is less than the critical value V3./
(1, 0, 1, 0)(strong supervision, partial disclosure, authentic marketing, non-participate in dissemination)The difference ( n 6 n 14 ) in public panic between strong supervision and weak supervision is less than the critical value P.The proportion of public panic converted into the loss of social benefits for local governments is greater than the product of the tax rate paid by enterprises and the proportion of public panic converted into the loss of economic benefits for enterprises, the difference ( n 2 n 6 ) in public panic under the full disclosure and partial disclosure strategies of local governments is greater than the critical value Q2.
The proportion of public panic converted into social benefit losses for local governments is less than the product of the tax rate paid by enterprises and the proportion of public panic converted into economic benefit losses for enterprises. The difference ( n 2 n 6 ) in public panic under the full disclosure and partial disclosure strategies of local governments is less than the critical value Q2.
The difference ( n 6 n 8 ) in the degree of public panic caused by authentic marketing and deceptive marketing strategies is greater than the critical value V3.The difference ( C 10 S 7 ) between the cost incurred by netizens choosing to participate in the dissemination strategy and the social benefits obtained by enterprises when they truthfully disseminate information is greater than the opportunity cost paid by netizens when they choose not to participate in the dissemination but the information is true.
(1, 0, 1, 1)(strong supervision, partial disclosure, authentic marketing, participate in dissemination)The difference ( n 5 n 13 ) in public panic between strong supervision and weak supervision is less than the critical value P.The proportion of public panic converted into the loss of social benefits for local governments is greater than the product of the tax rate paid by enterprises and the proportion of public panic converted into the loss of economic benefits for enterprises, the difference ( n 1 n 5 ) in public panic under the full disclosure and partial disclosure strategies of local governments is greater than the critical value Q2.
The proportion of public panic converted into social benefit losses for local governments is less than the product of the tax rate paid by enterprises and the proportion of public panic converted into economic benefit losses for enterprises. The difference ( n 1 n 5 ) in public panic under the full disclosure and partial disclosure strategies of local governments is less than the critical value Q2.
The difference ( n 5 n 7 ) in the degree of public panic caused by authentic marketing and deceptive marketing strategies is greater than the critical value V4.The difference ( C 10 S 7 ) between the cost incurred by netizens choosing to participate in the dissemination strategy and the social benefits obtained by enterprises when they truthfully disseminate information is less than the opportunity cost paid by netizens when they choose not to participate in the dissemination but the information is true.
(1, 1, 0, 0)(strong supervision, full disclosure, deceptive marketing, non-participate in dissemination)The difference ( n 4 n 12 ) in public panic between strong supervision and weak supervision is less than the critical value P.The proportion of public panic converted into the loss of social benefits for local governments is greater than the product of the tax rate paid by enterprises and the proportion of public panic converted into the loss of economic benefits for enterprises, the difference ( n 4 n 8 ) in public panic under the full disclosure and partial disclosure strategies of local governments is less than the critical value Q2.
The proportion of public panic converted into social benefit losses for local governments is less than the product of the tax rate paid by enterprises and the proportion of public panic converted into economic benefit losses for enterprises. The difference ( n 4 n 8 ) in public panic under the full disclosure and partial disclosure strategies of local governments is greater than the critical value Q2.
The difference ( n 2 n 4 ) in the degree of public panic caused by authentic marketing and deceptive marketing strategies is less than the critical value V3./
(1, 1, 1, 0)(strong supervision, full disclosure, authentic marketing, non-participate in dissemination)The difference ( n 2 n 10 ) in public panic between strong supervision and weak supervision is less than the critical value P.The proportion of public panic converted into the loss of social benefits for local governments is greater than the product of the tax rate paid by enterprises and the proportion of public panic converted into the loss of economic benefits for enterprises, the difference ( n 2 n 6 ) in public panic under the full disclosure and partial disclosure strategies of local governments is less than the critical value Q2.
The proportion of public panic converted into social benefit losses for local governments is less than the product of the tax rate paid by enterprises and the proportion of public panic converted into economic benefit losses for enterprises. The difference ( n 2 n 6 ) in public panic under the full disclosure and partial disclosure strategies of local governments is greater than the critical value Q2.
The difference ( n 2 n 4 ) in the degree of public panic caused by authentic marketing and deceptive marketing strategies is greater than the critical value V3.The difference ( C 10 S 7 ) between the cost incurred by netizens choosing to participate in the dissemination strategy and the social benefits obtained by enterprises when they truthfully disseminate information is greater than the opportunity cost paid by netizens when they choose not to participate in the dissemination but the information is true.
(1, 1, 1, 1)(strong supervision, full disclosure, authentic marketing, participate in dissemination)The difference ( n 1 n 9 ) in public panic between strong supervision and weak supervision is less than the critical value P.The proportion of public panic converted into the loss of social benefits for local governments is greater than the product of the tax rate paid by enterprises and the proportion of public panic converted into the loss of economic benefits for enterprises, the difference ( n 1 n 5 ) in public panic under the full disclosure and partial disclosure strategies of local governments is less than the critical value Q2.
The proportion of public panic converted into social benefit losses for local governments is less than the product of the tax rate paid by enterprises and the proportion of public panic converted into economic benefit losses for enterprises. The difference ( n 1 n 5 ) in public panic under the full disclosure and partial disclosure strategies of local governments is greater than the critical value Q2.
The difference ( n 1 n 3 ) in the degree of public panic caused by authentic marketing and deceptive marketing strategies is greater than the critical value V4.The difference ( C 10 S 7 ) between the cost incurred by netizens choosing to participate in the dissemination strategy and the social benefits obtained by enterprises when they truthfully disseminate information is less than the opportunity cost paid by netizens when they choose not to participate in the dissemination but the information is true.

References

  1. Qu, Y.; Chen, H. Research on endogenous internet public opinion dissemination in Chinese universities based on SNIDR model. J. Intell. Fuzzy Syst. 2023, 44, 9901–9917. [Google Scholar] [CrossRef]
  2. Wang, Z.; Zhang, S.; Zhao, Y.; Chen, C.; Dong, X. Risk prediction and credibility detection of network public opinion using blockchain technology. Technol. Forecast. Soc. Change 2023, 187, 122177. [Google Scholar] [CrossRef]
  3. Geng, L.; Zheng, H.; Qiao, G.; Geng, L.; Wang, K. Online public opinion dissemination model and simulation under media intervention from different perspectives. Chaos Solitons Fractals 2023, 166, 112959. [Google Scholar] [CrossRef]
  4. Zhang, P.; Zhang, H.; Kong, F. Research on online public opinion in the investigation of the “7–20” extra rainstorm and flooding disaster in Zhengzhou, China. Int. J. Disaster Risk Reduct. 2024, 105, 104422. [Google Scholar] [CrossRef]
  5. Guo, F.; Liu, Z.; Lu, Q.; Ji, S.; Zhang, C. Public Opinion About COVID-19 on a Microblog Platform in China: Topic Modeling and Multidimensional Sentiment Analysis of Social Media. J. Med. Internet Res. 2024, 26, e47508. [Google Scholar] [CrossRef] [PubMed]
  6. Zhao, J.; He, H.; Zhao, X.; Lin, J. Modeling and simulation of microblog-based public health emergency-associated public opinion communication. Inf. Process. Manag. 2022, 59, 102846. [Google Scholar] [CrossRef]
  7. Geng, L.; Yang, S.; Wang, K.; Zhou, Q.; Geng, L. Modeling public opinion dissemination in a multilayer network with SEIR model based on real social networks. Eng. Appl. Artif. Intell. 2023, 125, 106719. [Google Scholar] [CrossRef]
  8. Guo, C.; Song, Y. Multi-Subject Decision-Making Analysis in the Public Opinion of Emergencies: From an Evolutionary Game Perspective. Mathematics 2025, 13, 1547. [Google Scholar] [CrossRef]
  9. Wei, J.; Wang, L.; Zhu, H.; Huang, W. Cooperation behavior of opinion leaders and official media on the governance of negative public opinion in the context of the epidemic: An evolutionary game analysis in the perspective of prospect theory. Complexity 2023, 2023, 1366260. [Google Scholar] [CrossRef]
  10. Yan, S.; Su, Q.; Gong, Z.; Zeng, X. Fractional order time-delay multivariable discrete grey model for short-term online public opinion prediction. Expert Syst. Appl. 2022, 197, 116691. [Google Scholar] [CrossRef]
  11. Bengesi, S.; Oladunni, T.; Olusegun, R.; Audu, H. A machine learning-sentiment analysis on monkeypox outbreak: An extensive dataset to show the polarity of public opinion from Twitter tweets. IEEE Access 2023, 11, 11811–11826. [Google Scholar] [CrossRef]
  12. Müller-Hansen, F.; Repke, T.; Baum, C.M.; Brutschin, E.; Callaghan, M.W.; Debnath, R.; Lamb, W.F.; Low, S.; Lück, S.; Roberts, C.; et al. Attention, sentiments and emotions towards emerging climate technologies on Twitter. Glob. Environ. Change 2023, 83, 102765. [Google Scholar] [CrossRef]
  13. Razzaq, R.; Riaz, R.; Nasir, T.; Hussain, W. Public Opinion and Policy Development: A Psychological Approach to Understanding the Role of Public Sentiment in Shaping LegislationA Case Study of Law, Psychology, Media and Policy Development Nexus. Annu. Methodol. Arch. Res. Rev. 2025, 3, 296–310. [Google Scholar] [CrossRef]
  14. Ke, J.; Wang, Y.; Fan, M.; Chen, X.; Zhang, W.; Gou, J. Discovering e-commerce user groups from online comments: An emotional correlation analysis-based clustering method. Comput. Electr. Eng. 2024, 113, 109035. [Google Scholar] [CrossRef]
  15. Wan, B.; Wu, P.; Yeo, C.K.; Li, G. Emotion-cognitive reasoning integrated BERT for sentiment analysis of online public opinions on emergencies. Inf. Process. Manag. 2024, 61, 103609. [Google Scholar] [CrossRef]
  16. Aslan, S. A deep learning-based sentiment analysis approach (MF-CNN-BILSTM) and topic modeling of tweets related to the Ukraine–Russia conflict. Appl. Soft Comput. 2023, 143, 110404. [Google Scholar] [CrossRef]
  17. Quarantelli, E.L. The nature and conditions of panic. Am. J. Sociol. 1954, 60, 267–275. [Google Scholar] [CrossRef]
  18. Quarantelli, E.L. The behavior of panic participants. Sociol. Soc. Res. 1957, 41, 187–194. [Google Scholar]
  19. Glass, T.A.; Schochspana, M. Bioterrorism and the people: How to vaccinate a city against panic. Clin. Infect. Dis. 2002, 34, 217–223. [Google Scholar] [CrossRef]
  20. Roseman Ira, J.; Evdokas, A. Appraisals Cause Experienced Emotions: Experimental Evidence. Cogn. Emot. 2008, 18, 1–28. [Google Scholar] [CrossRef]
  21. Sakariyahu, R.; Lawal, R.; Yusuf, A.; Olatunji, A. Mass shootings, investors’ panic, and market anomalies. Econ. Lett. 2023, 231, 111284. [Google Scholar] [CrossRef]
  22. Metrick, A. The failure of silicon valley bank and the panic of 2023. J. Econ. Perspect. 2024, 38, 133–152. [Google Scholar] [CrossRef]
  23. Wang, W.; Zhu, X.; Lu, P.; Zhao, Y.; Chen, Y.; Zhang, S. Spatio-temporal evolution of public opinion on urban flooding: Case study of the 7.20 Henan extreme flood event. Int. J. Disaster Risk Reduct. 2024, 100, 104175. [Google Scholar] [CrossRef]
  24. De Iuliis, M.; Battegazzorre, E.; Domaneschi, M.; Cimellaro, G.P.; Bottino, A.G. Large scale simulation of pedestrian seismic evacuation including panic behavior. Sustain. Cities Soc. 2023, 94, 104527. [Google Scholar] [CrossRef]
  25. Li, C.; Zhao, Y.; Gao, L.; Ni, Y.; Liu, X. Government’s public panic emergency capacity assessment and response strategies under sudden epidemics: A fuzzy Petri net-based approach. Heliyon 2024, 10, e30316. [Google Scholar] [CrossRef]
  26. Li, X.; Long, Y.; Zhang, S.; Yang, C.; Xing, M.; Zhang, S. Experimental study on emergency psychophysiological and behavioral reactions to coal mining accidents. Appl. Psychophysiol. Biofeedback 2024, 49, 541–568. [Google Scholar] [CrossRef]
  27. Zhao, R.; Wei, B.; Han, C.; Jia, P.; Zhu, W.; Li, C.; Ma, Y. Improved Crowd Dynamics Analysis Considering Physical Contact Force and Panic Emotional Propagation. IEEE Trans. Intell. Transp. Syst. 2024, 26, 1840–1851. [Google Scholar] [CrossRef]
  28. Guo, C.; Huo, F.; Li, Y.; Li, C.; Zhang, J. An evacuation model considering pedestrian crowding and stampede under terrorist attacks. Reliab. Eng. Syst. Saf. 2024, 249, 110230. [Google Scholar] [CrossRef]
  29. Gladwell, M. The Tipping Point: How Little Things Can Make a Big Difference; Little, Brown and Company: Boston, MA, USA, 2000. [Google Scholar]
  30. Edwards, M.C.; Nilchiani, R.R.; Ganguly, A.; Vierlboeck, M. Evaluating the tipping point of a complex system: The case of disruptive technology. Syst. Eng. 2024, 28, 69–81. [Google Scholar] [CrossRef]
  31. Chattopadhyay; Narayan, S.; Gupta, A.K. Predicting Jams in Heterogeneous Disordered Traffic: Insights from Tipping Point Theory. Appl. Math. Model. 2025, 125, 116254. [Google Scholar] [CrossRef]
  32. Russill, C.; Lavin, C. Tipping point discourse in dangerous times. Can. Rev. Am. Stud. 2012, 42, 142–163. [Google Scholar] [CrossRef]
Figure 1. Graphical representation of strategy interaction between four agents based on public opinion panic level.
Symmetry 17 01694 g001
Figure 2. Four-agent evolutionary game decision tree with 16 strategy-combination panic coefficients n1n16.
Symmetry 17 01694 g002
Figure 3. Evolution strategy (1, 1, 1, 1).
Symmetry 17 01694 g003
Figure 4. Evolution strategy (1, 1, 0, 0).
Symmetry 17 01694 g004
Figure 5. Evolution strategy (0, 1, 1, 1).
Symmetry 17 01694 g005
Figure 6. Evolution strategy (0, 1, 0, 0).
Symmetry 17 01694 g006
Figure 7. Main view of the evolution strategy (x = 0). Colors represent different initial strategy points.
Symmetry 17 01694 g007
Figure 8. Top view of the evolution strategy (x = 0). Color scheme same as in Figure 7.
Symmetry 17 01694 g008
Figure 9. Main view of the evolution strategy (x = 1). Color scheme same as in Figure 7.
Symmetry 17 01694 g009
Figure 10. Top view of the evolution strategy (x = 1). Color scheme same as in Figure 7.
Symmetry 17 01694 g010
Figure 11. Main view of the evolution strategy (y = 0). Colors represent different initial strategy points.
Symmetry 17 01694 g011
Figure 12. Top view of the evolution strategy (y = 0). Color scheme same as in Figure 11.
Symmetry 17 01694 g012
Figure 13. Main view of the evolution strategy (y = 1). Color scheme same as in Figure 11.
Symmetry 17 01694 g013
Figure 14. Top view of the evolution strategy (y = 1). Color scheme same as in Figure 11.
Symmetry 17 01694 g014
Figure 15. Main view of the evolution strategy (z = 0). Colors represent different initial strategy points.
Symmetry 17 01694 g015
Figure 16. Top view of the evolution strategy (z = 0). Color scheme same as in Figure 15.
Symmetry 17 01694 g016
Figure 17. Main view of the evolution strategy (z = 1). Color scheme same as in Figure 15.
Symmetry 17 01694 g017
Figure 18. Top view of the evolution strategy (z = 1). Color scheme same as in Figure 15.
Symmetry 17 01694 g018
Figure 19. Main view of the evolution strategy (p = 0). Colors represent different initial strategy points.
Symmetry 17 01694 g019
Figure 20. Top view of the evolution strategy (p = 0). Color scheme same as in Figure 19.
Symmetry 17 01694 g020
Figure 21. Main view of the evolution strategy (p = 1). Color scheme same as in Figure 19.
Symmetry 17 01694 g021
Figure 22. Top view of the evolution strategy (p = 1). Color scheme same as in Figure 19.
Symmetry 17 01694 g022
Table 1. Main variable and declaration.
VariableVariable Declaration
Central governmentC1The supervision cost of central government under the strong supervision strategy
C2The central government’s supervision cost of public opinion under the strong supervision strategy
C3The supervision cost of central government to local government under the weak supervision strategy
C4The supervision cost of the central government on public opinion under the weak supervision strategy
S1Social gains from the central government’s strong supervision strategy
S2Social gains from the central government’s weak supervision strategy
aThe proportion of public fear translated into loss of social benefits for the central government
dThe proportion of the degree of public panic transformed into the cost of public opinion supervision by the central government
Local governmentC5Costs incurred when local governments choose a full disclosure strategy
C6Costs incurred when local governments choose to disclose parts and report them
C7Costs incurred when local governments choose to disclose parts and report them
S3Social gains when local governments are fully open
S4The social benefits of partial disclosure of local governments
S5Some local governments disclose the social gains lost by the central government’s strong supervision when they fail to report
S6Some local governments disclose the social gains lost by the central government’s weak supervision when they fail to report
bThe proportion of public panic translated into loss of social benefits for local governments
wThe probability of local governments choosing to report to the central government under the partial disclosure strategy
EnterprisesC8The costs generated by the authentic marketing strategies of enterprises
C9The costs resulting from deceptive marketing strategies of enterprises
E1The economic benefits obtained by the authentic marketing strategies of enterprises
E2The economic benefits obtained by enterprises through deceptive marketing strategies
E3The economic gains lost by enterprises under the strict supervision strategy of the central government due to deceptive marketing by enterprises
E4The economic gains lost by enterprises under the weak supervision strategy of the central government due to deceptive marketing by enterprises
A1The change in economic benefits of enterprises that conduct authentic marketing when netizens disseminate true information
A2The change in economic benefits of enterprises that engage in deceptive marketing when netizens spread false information
FThe reward money obtained by the enterprise through its authentic marketing strategy
rThe tax rate at which enterprises pay taxes to local governments
cThe proportion of public panic transformed into enterprises economic profit
NetizensC10The cost of netizens choosing to participate in the dissemination strategy
C11The opportunity cost paid by netizens when they choose not to participate in the dissemination but the information is true
S7The social benefits obtained by netizens when they participate in the truthful dissemination of enterprises
S8The social benefits obtained by netizens when they participate in spreading false dissemination of enterprises
S9The diminished social reputation of netizens who spread deceptive marketing information from enterprises when under strong supervision by the central government
S10The diminished social reputation of netizens who spread deceptive marketing information from enterprises when under weak supervision by the central government.
H1Extra benefits for netizens when the central government tightens supervision
H2Extra benefits for netizens t users when the central government is weak in supervision
E5The economic losses incurred when netizens choose to participate in the dissemination but encounter false information
KThe highest level of public panic after an emergency
niCoefficient of public panic
Table 2. Payoff matrix of the four-agent evolutionary game.
Strategy
Combination
g1g2
e1e2e1e2
l1f1 S 1 ( C 1 + C 2 ) a n 1 K d n 1 K ,
S 3 + r ( F + E 1 + A 1 + c n 1 K C 8 ) C 5 b n 1 K ,
( 1 r ) ( F + E 1 + A 1 + c n 1 K C 8 ) ,
H 1 C 10 + S 7
S 1 ( C 1 + C 2 ) a n 5 K d n 5 K ,
w ( S 4 C 6 ) b n 5 K + ( 1 w ) ( S 4 C 7 S 5 ) + r ( F + E 1 + A 1 + c n 5 K C 8 ) ,
( 1 r ) ( F + E 1 + A 1 + c n 5 K C 8 ) ,
H 1 C 10 + S 7
S 2 ( C 3 + C 4 ) a n 9 K d n 9 K ,
S 3 + r ( E 1 + F + A 1 + c n 9 K C 8 ) C 5 b n 9 K ,
( 1 r ) ( E 1 + F + A 1 + c n 9 K C 8 ) ,
H 2 C 10 + S 7
S 2 C 3 + C 4 a n 13 K d n 13 K ,
w ( S 4 C 6 ) b n 13 K + ( 1 w ) ( S 4 C 7 S 6 ) + r ( F + E 1 + A 1 + c n 13 K C 8 ) ,
( 1 r ) ( F + E 1 + A 1 + c n 13 K C 8 ) ,
H 2 C 10 + S 7
f2 S 1 ( C 1 + C 2 ) a n 2 K d n 2 K ,
S 3 + r ( F + E 1 + c n 2 K C 8 ) C 5 b n 2 K ,
( 1 r ) ( F + E 1 + c n 2 K C 8 ) ,
H 1 C 11
S 1 ( C 1 + C 2 ) a n 6 K d n 6 K ,
w ( S 4 C 6 ) b n 6 K + ( 1 w ) ( S 4 C 7 S 5 ) + r ( F + E 1 + c n 6 K C 8 ) ,
( 1 r ) ( F + E 1 + c n 6 K C 8 ) ,
H 1 C 11
S 2 ( C 3 + C 4 ) a n 10 K d n 10 K ,
S 3 + r ( E 1 + F + c n 10 K C 8 ) C 5 b n 10 K ,
( 1 r ) ( E 1 + F + c n 10 K C 8 ) ,
H 2 C 11
S 2 ( C 3 + C 4 ) a n 14 K d n 14 K ,
w ( S 4 C 6 ) b n 14 K + ( 1 w ) ( S 4 C 7 S 6 ) + r ( F + E 1 + c n 14 K C 8 ) ,
( 1 r ) ( F + E 1 + c n 14 K C 8 ) ,
H 2 C 11
l2f1 S 1 ( C 1 + C 2 ) a n 3 K d n 3 K ,
S 3 + r ( E 2 + A 2 + c n 3 K E 3 C 9 ) C 5 b n 3 K ,
( 1 r ) ( E 2 + A 2 + c n 3 K E 3 C 9 ) ,
H 1 C 10 + S 8 S 9 E 5
S 1 ( C 1 + C 2 ) a n 7 K d n 7 K ,
w ( S 4 C 6 ) b n 7 K + ( 1 w ) ( S 4 C 7 S 5 ) + r ( E 2 + A 2 + c n 7 K C 9 E 3 ) ,
( 1 r ) ( E 2 + A 2 + c n 7 K C 9 E 3 ) ,
H 1 C 10 + S 8 S 9 E 5
S 2 ( C 3 + C 4 ) a n 11 K d n 11 K ,
S 3 + r ( E 2 + A 2 + c n 11 K C 9 E 4 ) C 5 b n 11 K ,
( 1 r ) ( E 2 + A 2 + c n 11 K C 9 E 4 ) ,
H 2 + S 8 C 10 E 5 S 10
S 2 ( C 3 + C 4 ) a n 15 K d n 15 K ,
w ( S 4 C 6 ) b n 15 K + ( 1 w ) ( S 4 C 7 S 6 ) + r ( E 2 + A 2 + c n 15 K C 9 E 4 ) ,
( 1 r ) ( E 2 + A 2 + c n 15 K C 9 E 4 ) ,
H 2 + S 8 C 10 S 10 E 5
f2 S 1 ( C 1 + C 2 ) a n 4 K d n 4 K ,
S 3 + r ( E 2 + c n 4 K E 3 C 9 ) C 5 b n 4 K ,
( 1 r ) ( E 2 + c n 4 K E 3 C 9 ) ,
H 1
S 1 ( C 1 + C 2 ) a n 8 K d n 8 K ,
w ( S 4 C 6 ) b n 8 K + ( 1 w ) ( S 4 C 7 S 5 ) + r ( E 2 + c n 8 K C 9 E 3 ) ,
( 1 r ) ( E 2 + c n 8 K C 9 E 3 ) ,
H 1
S 2 C 3 + C 4 a n 12 K d n 12 K ,
S 3 + r ( E 2 + c n 12 K C 9 E 4 ) C 5 b n 12 K ,
( 1 r ) ( E 2 + c n 12 K C 9 E 4 ) ,
H 2
S 2 ( C 3 + C 4 ) a n 16 K d n 16 K ,
w ( S 4 C 6 ) b n 16 K + ( 1 w ) ( S 4 C 7 S 6 ) + r ( E 2 + c n 16 K C 9 E 4 ) ,
( 1 r ) ( E 2 + c n 16 K C 9 E 4 ) ,
H 2
Table 3. Evolutionary stability condition.
Strategy
Combination
Stable Condition
1(g2, e2, l2, f2) ( S 1 S 2 ) C 1 + C 2 ( n 8 n 16 ) ( a + d ) K + C 3 + C 4 < 0 S 3 S 4 + S 6 ( C 5 C 7 ) ( n 12 n 16 ) ( b c r ) K + w ( C 6 C 7 S 6 ) < 0 ( 1 r ) [ c ( n 14 n 16 ) K ( C 8 C 9 ) + F + E 1 E 2 + E 4 ] < 0
2(g2, e2, l1, f2) ( S 1 S 2 ) C 1 + C 2 ( n 6 n 14 ) ( a + d ) K + C 3 + C 4 < 0 S 3 S 4 + S 6 ( C 5 C 7 ) ( n 10 n 14 ) ( b c r ) K + w ( C 6 C 7 S 6 ) < 0 ( 1 r ) [ c ( n 14 n 16 ) K ( C 8 C 9 ) + F + E 1 E 2 + E 4 ] > 0 S 7 ( C 10 C 11 ) < 0
3(g2, e2, l1, f1) ( S 1 S 2 ) C 1 + C 2 ( n 5 n 13 ) ( a + d ) K + C 3 + C 4 < 0 S 3 S 4 + S 6 ( C 5 C 7 ) ( n 9 n 13 ) ( b c r ) K + w ( C 6 C 7 S 6 ) < 0 ( 1 r ) [ c ( n 13 n 15 ) K ( C 8 C 9 ) + F + E 1 E 2 + E 4 + A 1 A 2 ] > 0 S 7 ( C 10 C 11 ) > 0
4(g2, e1, l2, f2) ( S 1 S 2 ) C 1 + C 2 ( n 4 n 12 ) ( a + d ) K + C 3 + C 4 < 0 S 3 S 4 + S 6 ( C 5 C 7 ) ( n 12 n 16 ) ( b c r ) K + w ( C 6 C 7 S 6 ) > 0 ( 1 r ) [ c ( n 10 n 12 ) K ( C 8 C 9 ) + F + E 1 E 2 + E 4 ] < 0
5(g2, e1, l1, f2) ( S 1 S 2 ) C 1 + C 2 ( n 2 n 10 ) ( a + d ) K + C 3 + C 4 < 0 S 3 S 4 + S 6 ( C 5 C 7 ) ( n 10 n 14 ) ( b c r ) K + w ( C 6 C 7 S 6 ) > 0 ( 1 r ) [ c ( n 10 n 12 ) K ( C 8 C 9 ) + F + E 1 E 2 + E 4 ] > 0 S 7 ( C 10 C 11 ) < 0
6(g2, e1, l1, f1) ( S 1 S 2 ) C 1 + C 2 ( n 1 n 9 ) ( a + d ) K + C 3 + C 4 < 0 S 3 S 4 + S 6 ( C 5 C 7 ) ( n 9 n 13 ) ( b c r ) K + w ( C 6 C 7 S 6 ) > 0 ( 1 r ) [ c ( n 9 n 11 ) K ( C 8 C 9 ) + A 1 A 2 + F + E 1 E 2 + E 4 ] > 0 S 7 ( C 10 C 11 ) > 0
7(g1, e2, l2, f2) ( S 1 S 2 ) C 1 + C 2 ( n 8 n 16 ) ( a + d ) K + C 3 + C 4 > 0 S 3 S 4 + S 5 ( C 5 C 7 ) ( n 4 n 8 ) ( b c r ) K + w ( C 6 C 7 S 5 ) < 0 ( 1 r ) [ c ( n 6 n 8 ) K ( C 8 C 9 ) + F + E 1 E 2 + E 3 ] < 0
8(g1, e2, l1, f2) ( S 1 S 2 ) C 1 + C 2 ( n 6 n 14 ) ( a + d ) K + C 3 + C 4 > 0 S 3 S 4 + S 5 ( C 5 C 7 ) ( n 2 n 6 ) ( b c r ) K + w ( C 6 C 7 S 5 ) < 0 ( 1 r ) [ c ( n 6 n 8 ) K ( C 8 C 9 ) + F + E 1 E 2 + E 3 ] > 0 S 7 ( C 10 C 11 ) < 0
9(g1, e2, l1, f1) ( S 1 S 2 ) C 1 + C 2 ( n 5 n 13 ) ( a + d ) K + C 3 + C 4 > 0 S 3 S 4 + S 5 ( C 5 C 7 ) ( n 1 n 5 ) ( b c r ) K + w ( C 6 C 7 S 5 ) < 0 ( 1 r ) [ c ( n 5 n 7 ) K ( C 8 C 9 ) + A 1 A 2 + F + E 1 E 2 + E 3 ] > 0 S 7 ( C 10 C 11 ) > 0
10(g1, e1, l2, f2) ( S 1 S 2 ) C 1 + C 2 ( n 4 n 12 ) ( a + d ) K + C 3 + C 4 > 0 S 3 S 4 + S 5 ( C 5 C 7 ) ( n 4 n 8 ) ( b c r ) K + w ( C 6 C 7 S 5 ) > 0 ( 1 r ) [ c ( n 2 n 4 ) K ( C 8 C 9 ) + F + E 1 E 2 + E 3 ] < 0
11(g1, e1, l1, f2) ( S 1 S 2 ) C 1 + C 2 ( n 2 n 10 ) ( a + d ) K + C 3 + C 4 > 0 S 3 S 4 + S 5 ( C 5 C 7 ) ( n 2 n 6 ) ( b c r ) K + w ( C 6 C 7 S 5 ) > 0 ( 1 r ) [ c ( n 2 n 4 ) K ( C 8 C 9 ) + F + E 1 E 2 + E 3 ] > 0 S 7 ( C 10 C 11 ) < 0
12(g1, e1, l1, f1) ( S 1 S 2 ) C 1 + C 2 ( n 1 n 9 ) ( a + d ) K + C 3 + C 4 > 0 S 3 S 4 + S 5 ( C 5 C 7 ) ( n 1 n 5 ) ( b c r ) K + w ( C 6 C 7 S 5 ) > 0 ( 1 r ) [ c ( n 1 n 3 ) K ( C 8 C 9 ) + A 1 A 2 + F + E 1 E 2 + E 3 ] > 0 S 7 ( C 10 C 11 ) > 0
Table 4. Variable initial assignment.
VariableValueVariableValueVariableValueVariableValueVariableValue
C1100S1250A24w0.4n110.7
C280S280E1120n10.15n120.45
C340S3150E2200n20.1n130.45
C420S440E3150n30.6n140.4
C560S5100E460n40.35n150.9
C640S650E580n50.3n160.65
C730S715F40n60.25r0.25
C820S810a0.1n70.75K1000
C950S920b0.15n80.5H130
C105S108c0.3n90.25H210
C113A112d0.2n100.2
Table 5. Frontage value.
Frontage ValueValueFrontage ValueValueFrontage ValueValueFrontage ValueValue
P0.167Q21.92V2−0.23V4−0.59
Q11.52V1−0.2V3−0.56
Disclaimer/Publisher’s Note: The statements, opinions and data contained in all publications are solely those of the individual author(s) and contributor(s) and not of MDPI and/or the editor(s). MDPI and/or the editor(s) disclaim responsibility for any injury to people or property resulting from any ideas, methods, instructions or products referred to in the content.