Abstract
Given the inadequacies in the management of reactive power compensation equipment in distribution networks and insufficient power data mining, existing studies pay little attention to asymmetric reactive power compensation equipment and face pain points such as difficult quantification of nonlinear relationships and challenging evaluation of mechanical switches. First, this paper proposes a data mining-based diagnostic method for the operating status of asymmetric reactive power compensation equipment: it preprocesses data via singular value decomposition and matrix approximation. Second, it classifies load types with K-means clustering, defines “health degree” by introducing mutual information and a reliability coefficient, constructs dual switching criteria, and defines the switching qualification rate. Third, the TOPSIS method is employed for dual-index comprehensive evaluation, and equipment status levels are classified with statistical analysis. Finally, the case analysis demonstrates that the proposed method is accurate, applicable, and easy to implement, which can serve as a basis for equipment troubleshooting and maintenance, thereby filling the relevant research gap.
1. Introduction
Low-voltage asymmetric reactive power compensation equipment for distribution transformers is a crucial component of the power system. Its primary function is to compensate for the reactive power required by inductive loads [1], improve the power factor and energy utilization efficiency of the power system, and reduce grid losses [2]. Due to the wide distribution, large quantity, delayed fault maintenance, low availability of reactive power compensation devices, coupled with the lack of basic ledgers for reactive power equipment, it is difficult to timely grasp the rationality of capacity configuration, whether they are in operation, and whether their operating status is qualified. Diagnosing the operating status of reactive power compensation equipment based on monitoring data will help in the active prevention and early treatment of operation and maintenance issues, and reduce losses caused by damage to reactive power compensation equipment or poor operating status.
However, there are few studies on the status evaluation of reactive power compensation equipment in distribution networks at present. Existing studies on reactive power compensation equipment mainly focus on evaluation indicators and monitoring systems, yet few specifically address systematic state diagnosis at the distribution transformer low-voltage side. For instance, Reference [3] established a multi-dimensional evaluation index system based on daily three-phase measurement data, covering voltage and reactive power qualification rates, load symmetry, causes of non-compliance, and capacitor aging and switching balance. While comprehensive in indicators, this method relies heavily on traditional statistical techniques, which are inefficient for large-scale equipment and lack effective feature extraction from complex load data. Moreover, the approach evaluates individual indicators without providing an integrated quantitative score, making it difficult to directly guide maintenance prioritization. Its treatment of capacitor switching reasonableness is also limited, considering only balance of switching counts without examining whether switching actions meet compensation requirements. Another representative work, Reference [4] developed a monitoring and evaluation system based on IoT and GPRS communication. By retrofitting devices with wireless sensor networks, this system enables real-time data collection, remote transmission, and centralized management, combined with Bayesian network methods for state assessment. While practical in enhancing visualization and improving operational efficiency, the approach depends heavily on communication and hardware infrastructures, leading to high implementation and maintenance costs. Furthermore, its analysis methods remain at the level of rule-based and probabilistic inference, with limited ability to mine deep patterns in data or detect early signs of equipment anomalies.
For reactive power compensation equipment, its switching actions depend on the operating data of the low-voltage side of the distribution transformer, including single-phase/three-phase active power, single-phase/three-phase reactive power, single-phase/three-phase power factor, and single-phase/three-phase voltage. New electronic switch reactive power compensation equipment can collect real-time information on switch actions, but some regions still use early mechanical switches, which do not have the function of collecting and storing switch action information, which brings great difficulties to evaluating the operating status of reactive power compensation equipment in these regions.
Power quality data has unique advantages of high reliability, timely availability, and large data volume, and can be used in equipment anomaly detection and other aspects [5]. In-depth exploration of the application potential of power big data is an important means for power grid enterprises to cope with economic downturn and improve quality and efficiency [6,7]. Relevant data analysis methods also provide a new perspective for power equipment evaluation [8,9]. This paper proposes a method for diagnosing the operating status of reactive power compensation equipment based on data mining, which uses singular value decomposition and matrix approximation for load clustering, takes the mutual information between power factor and active power as the criterion to measure whether the reactive power compensation equipment has action capability, and defines the health degree and switching qualification rate of reactive power compensation equipment as evaluation indicators for equipment operating status. This method does not rely on complete switching records, which makes it applicable even in areas still using mechanical switches. Examples show that this method can effectively evaluate the operating status of reactive power compensation equipment and provide guiding suggestions for its operation and maintenance.
2. Definition of Health Analysis for Reactive Power Compensation Equipment
2.1. Correlation Analysis
In engineering practice, the power load at a certain time section on the low-voltage side of a distribution transformer is generally constructed into a power source model, i.e., P + jQ, and its power factor cosφ calculation formula is as follows:
It can be derived from the above formula that cos φ is jointly determined by the active load P and reactive load Q on the low-voltage side of the distribution transformer. If the reactive power compensation equipment is put into operation with a compensation capacity of Qc, then Q refers to the reactive power after considering the compensation effect of Qc, that is, the reactive power after compensation. If the reactive power compensation equipment belonging to the transformer district is not put into operation or no reactive power compensation equipment has been installed in the district yet, the ideal change in the power factor of the distribution transformer d cos φ is defined as follows [10]
Define QdP − PdQ as the ideal change coefficient. If the reactive power compensation equipment generates a switching action at a certain moment, the ideal change coefficients are expressed as QdP − Pd(Q − Qc) and QdP − Pd(Q + Qc), respectively.
As the variation in active load is not affected by the switching of reactive power compensation equipment, the relationship between the natural power factor and active power is called natural correlation. From the analysis above, it can be inferred that the operation of the reactive power compensation equipment will modify the natural variation factors, thereby influencing the trend of the power factor curve. As a result, the daily power factor at the switching moments will not change naturally with the active power, which reduces the natural correlation between the power factor and active power. Since the power factor and active power have a nonlinear functional relationship, this paper quantifies the degree of nonlinear correlation between the power factor and active power based on mutual information (MI) [11]. It considers a set of corresponding active power series X and power factor series Y, where each sampling moment forms a pair (X, Y), and its mutual information I(X, Y) is calculated as follows:
In the formula: H(X) and H(Y) are the information entropies of the active power sequence X and the power factor sequence Y, respectively; H(X, Y) is the joint entropy of X and Y; p(xi) is the probability of the value xi of the random variable X; p(yi) is the probability of the value yi of the random variable Y; p(xi, yi) denotes the joint probability of X taking the value xi and Y taking the value yi at the same time. If the two sets of values are completely independent, one set of values contains no information about the other set, that is, there is no relationship between active power and power factor, then their mutual information is 0. On the other hand, if there is a relationship between the two sets of values, whether linear or not, it can be quantified by mutual information. The larger the value, the stronger the correlation between the two sets of values [12,13]. Therefore, mutual information can be used as a criterion to measure whether the reactive power compensation equipment is put into operation.
2.2. Load Clustering
Practical power grid operation experience shows that the changing trend of loads mainly depends on their own types. For example, the daily load curves of industrial loads, household loads, and commercial loads all have their typical changing trends. From the above analysis, it can be concluded that a type of active load corresponds to an ideal changing trend of the power factor, and the switching action of the reactive power compensation equipment will change the correlation degree between the power factor and the active power, reducing their mutual information. Therefore, for loads of the same type, the mutual information between their daily power factor and the type of their associated active load can be used as a quantitative criterion to determine whether the reactive power compensation equipment of the distribution transformer is in operation.
Factors such as geographical location and industrial structure will also lead to certain differences in typical load types, so the conventional mathematical model of loads is no longer applicable. SVD effectively reduces the dimensionality of high-dimensional load data, simplifying the data structure while retaining the most important information, thereby improving computational efficiency and reducing complexity. Additionally, SVD helps remove noise by extracting significant features, enhancing analysis accuracy. It captures the main trends in the data, optimizing the precision of clustering analysis, and ensures that the most relevant information is preserved in the low-rank approximation. Based on these advantages, this paper uses SVD for principal component extraction, dimensionality reduction, and denoising of daily active load data, and applies matrix approximation to the distribution transformer load matrices. Based on the ideas of references [14,15,16,17,18], this paper performs singular value decomposition on the load data, uses an approximation matrix to approximate the original load matrix, and then applies the K-means algorithm for clustering [19,20,21].
According to the singular value decomposition theory [22,23], considering a matrix A with rank r, its rank-k approximation matrix can be expressed as:
In the formula: σi is the ith singular value of matrix A; ui and vi are the left singular vector and right singular vector, respectively.
Based on the above analysis, when processing daily load matrix data, we can perform singular value decomposition on it and then use an approximation matrix for approximation, which can effectively solve the problems of high dimensionality and existing noise in the original matrix.
According to the Eckart–Young–Mirsky theorem, the first k singular values and their corresponding vectors provide the best rank-k approximation of the original matrix. Thus, choosing an appropriate k is critical for dimensionality reduction and feature extraction. In determining the number of singular values to retain, this study calculates the cumulative energy contribution rate of singular values. In singular value decomposition, each singular value squared σi2 corresponds to the energy or variance contribution of the original matrix in that direction, and its magnitude reflects the importance of the information carried by the singular value. By computing the ratio of the sum of the squares of the first k singular values to the sum of the squares of all singular values, the cumulative energy contribution ratio can be obtained. It can be used to measure the extent to which the first k singular values preserve the overall information, with the threshold commonly set between 90% and 99.99%.
In the formula: η(k) is the cumulative energy contribution ratio, r denotes the total number of singular values. The calculation results are shown in Figure 1.
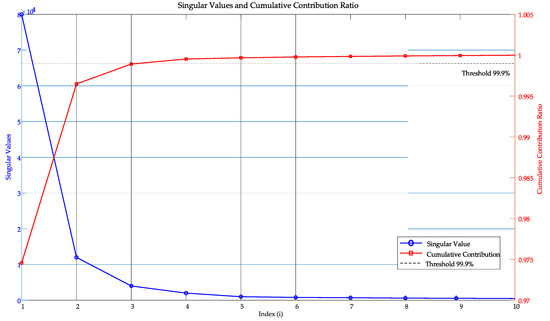
Figure 1.
Singular Values and Cumulative Contribution Ratio.
The statistical results in this study show that when k = 3, the cumulative contribution already exceeds 99.9%, indicating that the dominant structural and feature patterns of the original matrix can be effectively captured with only a few singular values. Therefore, we reasonably select k = 3 for dimensionality reduction in load data. In practice, however, we retain up to the first 10 singular values to ensure stability and robustness, as adding more singular values beyond this point yields only marginal benefits while introducing redundancy.
The new load matrix obtained after singular value decomposition and approximation is used as the input for clustering. The K-means algorithm is then applied to group the reactive power compensation equipment samples into several load clusters. K-means is simple and efficient, making it suitable for handling the diversity in load data and effectively identifying different load patterns to support the analysis and optimization of equipment operation. However, its performance depends heavily on the choice of the number of clusters and the initialization of cluster centers. An inappropriate cluster number may lead to unsatisfactory results, and random initialization may cause convergence to a local optimum.
To address this, the Davies–Bouldin Index (DBI) [24,25] is introduced as a validity measure to determine the optimal cluster number by evaluating intra-cluster compactness and inter-cluster separation, thereby improving the robustness of the clustering process.
Given the clustering partition C = {C1, C2, …, Ck}, the average intra-cluster distance is defined as:
The distance between the centroids of two clusters Ci and Cj is given by:
Then, the DBI is defined as:
In the formula: avg(Ci) denotes the average distance between samples within cluster Ci, μ represents the centroid of a cluster, and dcen(Ci, Cj) is the distance between two centroids. A smaller DBI value indicates that the clusters are more compact and better separated, and thus the clustering performance is superior.
2.3. Mutual Information Analysis and Definition of Equipment Health Degree
After load clustering, each daily load matrix in the sample is divided into several load clusters. Within each load cluster, the daily power factor and clustering center of each distribution transformer in the cluster are calculated, so as to compute the mutual information between them. To avoid the impact of dimensionality on the calculation results [26], this paper first normalizes the load center matrix and the power factor matrix. The normalized load center matrix is denoted as:
In the formula: pin represents the load center curve of the nth cluster on the ith day; n is the number of clusters in the daily clustering, determined by DBI calculation. Similarly, the normalized power factor matrix is denoted as:
In the formula: cijk is the power factor curve of the kth distribution transformer belonging to the jth cluster on the ith day, where k = 1, 2, …, N, and N is the total number of distribution transformers belonging to the jth cluster on the ith day. Calculate the mutual information between the power factor curve of the distribution transformer and the cluster center to obtain the corresponding mutual information matrix:
In the formula: Iijk is the mutual information of the kth distribution transformer in the jth cluster on the ith day, where k = 1, 2, …, N.
A reliability coefficient λijk is defined to characterize the possibility of anomalies in reactive power compensation equipment:
In the formula: λijk is the daily reliability coefficient of the kth device in the jth cluster on the ith day; cos φijk,av is the daily average power factor of the kth device in the jth cluster on the ith day. A lower reliability coefficient indicates a higher possibility of abnormality in the reactive power compensation equipment.
Combining the reliability coefficient and mutual information, the health degree matrix of the reactive power compensation equipment for distribution transformers is defined as:
The health degree hijk is shown in Equation (16):
In the formula, hijk is the health degree of the kth distribution transformer in the jth cluster on day i, where k = 1, 2, …, N, and N is the total number of distribution transformers in the jth cluster on day i.
2.4. Actual Switching Action Criterion and Ideal Switching Action Criterion
At present, some distribution transformers still use mechanical switched capacitor banks that do not have the function of recording the switching action status of reactive power compensation equipment. The specific status of the equipment can only be confirmed through tedious manual inspection. Therefore, it is necessary to judge the actual operation status of reactive power compensation equipment based on the thinking of data mining. Meanwhile, combined with the reactive power and voltage operation guidelines and the factory settings of reactive power compensation equipment, this paper proposes an ideal switching action criterion that can be used to guide the switching of reactive power compensation equipment.
Based on the analysis of actual load characteristic curves, it is found that the active component of conventional power loads is generally much larger than the reactive component. Therefore, under non-fault conditions, the fluctuation of power factor will not be very drastic. Moreover, GB/T 40427–2021 Technical Guidelines for Voltage and Reactive Power in Power Systems specifies the allowable fluctuation range of power factor for power users [27]. Therefore, under the general premise that the load does not change sharply (usually caused by system faults) within adjacent sampling moments, the change in power factor usually tends to be stable or there is no large sudden change. In actual scenarios, the magnitude of power factor change caused by the operation of reactive power compensation equipment will be greater than that of the ideal change in power factor.
The power information of the distribution transformer at time t1 is {P1, Q1, cos φ1}, and the power information at the next time t2 is {P2, Q2, cos φ2}. The ideal value of reactive power Q2′ of the distribution transformer at time t2 is defined as:
If the reactive power compensation equipment is put into operation at time t2, the deviation between the actual value and the ideal value of reactive power at this time is denoted as:
In general, after the reactive power compensation equipment is put into operation, the actual change degree of the distribution transformer’s power factor will be greater than the ideal change degree, resulting in a large deviation between the actual value and the ideal value of reactive power. Therefore, this paper proposes the criterion for the actual switching action of reactive power compensation equipment by defining the threshold of the deviation value, as follows.
Let the minimum switching capacity of the capacitor bank be min Qc; when the deviation value is less than −min Qc, the reactive power compensation equipment should be put into operation; when the deviation value is greater than min Qc, the reactive power compensation equipment should be cut off.
Let the power data of the distribution transformer at time t be P, Q, and cos φ, respectively, the ideal value of reactive power at the next moment be Q’, and the allowable range of power factor after the reactive power compensation device is put into operation be [cos φmin, cos φmax]. In this study, the power factor operating range [0.9, 1.0] was set according to the technical guidelines of the pilot region, which are commonly adopted in engineering practice to ensure power quality. While the thresholds may vary across regions, they can be flexibly adjusted according to local standards, ensuring the reproducibility and adaptability of the proposed method. The constructed ideal switching action criteria are as follows.
If the power factor of the distribution transformer is unqualified, the reactive power compensation equipment should be put into operation; if the power factor of the distribution transformer exceeds the upper limit after the reactive power compensation equipment is put into operation with the minimum compensation capacity, the equipment should be cut off; if the power factor of the distribution transformer exceeds the lower limit after the minimum compensation capacity is cut off, the equipment should not be cut off. The computational cost is 0.4085 ± 0.0372 s (10 repeated runs).
2.5. Reactive Power Compensation Equipment Switching Qualification Rate
To accurately assess the rationality of switching operations of reactive power compensation devices for distribution transformers, a sample set D = {D1, D2, D3, …, DM}, M is constructed, where M represents the total number of devices. Based on the above two criteria, the actual daily and moment-by-moment switching operations, as well as the ideal daily and moment-by-moment switching operations, of all devices in the sample set are determined. The actual switching operation and the ideal switching operation of each device in the sample set at the same day and the same moment are compared one by one. If they are in the same state (no operation, switching on, switching off), the switching operation at that moment is considered qualified; otherwise, it is deemed unqualified.
The daily switching qualification rate s of device Di on a certain day is defined as:
In the formula: α and β are the total number of daily qualified switching moments and the total number of daily sampling moments of the equipment, respectively. In the actual analysis, this paper uses the average switching qualification rate of the equipment over a period of time for analysis to reduce errors and the impact of contingency.
3. Comprehensive Evaluation of the Operating Status of Reactive Power Compensation Equipment
To evaluate whether the reactive power compensation equipment of a distribution transformer is in an ideal operating state, two indicators should be used: first, the equipment itself is healthy and has the ability to perform switching actions; second, the equipment has a high switching qualification rate, so that the power factor can meet the requirements of the operation guidelines. Accordingly, the operating state of reactive power compensation equipment can be measured by health degree and switching qualification rate. Each device in the equipment sample set can be expressed as an ordered pair: Di = (xi,yi), where xi is the health degree of the device, and yi is the switching qualification rate of the device.
For multi-objective decision analysis, the TOPSIS method is often used. By avoiding reliance on subjective weight assignment and fully exploiting the original data, the method ensures that the evaluation results are more objective and reproducible. This makes it particularly well-suited for operating state assessment of equipment, where quantitative and objective evaluation is essential. It can make full use of original data information, sort the proximity of a limited number of evaluation objects to the idealized target, and accurately reflect the gap between each evaluation object [28,29]. The computational cost is 0.0009 ± 0.0001 s. Its implementation process is as follows: Construct the evaluation matrix. The total number of equipment participating in the evaluation is M, and there are 2 evaluation indicators, namely the health degree and the switching qualification rate. Both are positive indicators, and the indicator evaluation matrix is denoted as Z:
Matrix standardization. To eliminate the influence of dimensions between different indicators, the matrix is standardized, and the standardized matrix is denoted as S:
Calculate the positive ideal solution and negative ideal solution. Define the positive ideal solution S+ and the negative ideal solution S−, which refer to the maximum value and minimum value of each standardized evaluation indicator:
Calculate the distances from positive and negative ideal solutions for each evaluation index and the comprehensive score. Define the distances from the ith evaluation object to the positive and negative ideal solutions as follows:
Then, the comprehensive score of the ith evaluation object is:
It is obvious that 0 ≤ Ti ≤ 1. The larger Ti is, the smaller di,+ is, meaning the closer the equipment is to the positive ideal solution, and the more ideal its operating state is.
4. Case Study
All distribution transformers recorded in the system for two weeks in a city of China were selected as samples, and their operating data were extracted, including three-phase active power, reactive power, and power factor. The system samples once every 15 min, with a total of 96 sampling moments per day. After removing outliers and blank values from the original data, the operating data of distribution transformers in this area each day can form three matrices, namely:
They are, respectively, called the daily active power matrix, daily reactive power matrix, and daily power factor matrix. Among them, Pin, Qin, Cin represent the daily active load, daily reactive load, and daily power factor of the nth distribution transformer on the ith day. After data preprocessing, a total of 10,564 devices were extracted.
4.1. Load Matrix Approximation and Load Clustering
Each daily load matrix in the sample data is approximated, and the approximation matrix is used to replace the original daily load matrix. Four different devices are randomly selected, and their daily load data on different days are subjected to matrix singular value decomposition and visual presentation of matrix approximation, as shown in Figure 2.
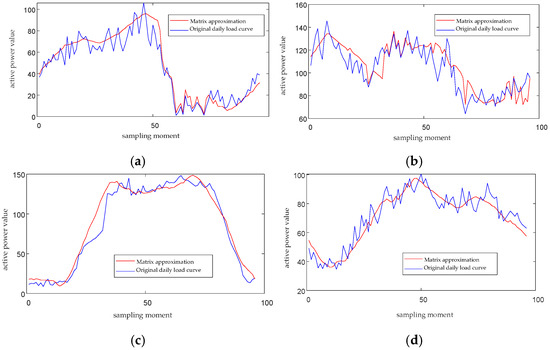
Figure 2.
(a) Comparison between approximation and original load matrix (device 1); (b) Comparison between approximation and original load matrix (device 2); (c) Comparison between approximation and original load matrix (device 3); (d) Comparison between approximation and original load matrix (device 4).
A comparison is made from the aspects of the change trend, proximity, peaks, and valleys between the approximation curve and the original curve. It can be seen that the approximation matrix largely restores the main information of the original load matrix, well retains its main components such as the change trend, peaks, and valleys, and has a significant effect in terms of denoising. The K-means algorithm is used to cluster each daily load matrix in the sample set, and the DBI is adopted to confirm the initial number of clusters. Four daily load matrices are selected for the visual display of load center curves, as shown in Figure 3.
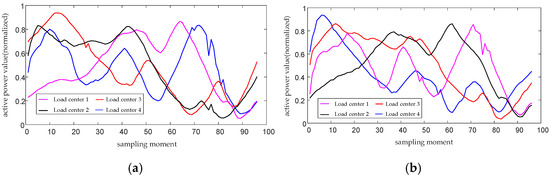
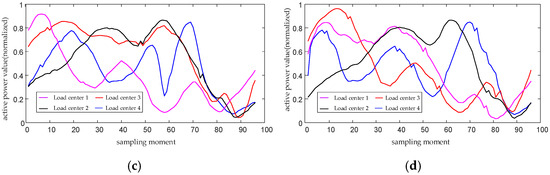
Figure 3.
(a) Clustering centers of load matrices for day 1; (b) Clustering centers of load matrices for day 2; (c) Clustering centers of load matrices for day 3; (d) Clustering centers of load matrices for day 4.
For the four daily load matrices in Figure 3, the DBI calculation results all indicate that clustering the loads into 4 categories yields the best effect, which shows that the loads of distribution transformers have extractable and typical characteristics. It can also be seen from Figure 3 that different types of loads have peaks and valleys at different times, that is, different electricity consumption peaks, troughs, and time-series change trends. This indicates that different types of loads have distinct time-series characteristics, thus verifying the effectiveness of clustering.
4.2. Verification of Clustering Effectiveness by Matrix Approximation Technology
By comparing the load data approximated using matrix approximation technology with the original load data without matrix approximation technology, and analyzing the DBI (Davies-Bouldin Index) of the optimal daily clustering number after clustering for both, i.e., the daily minimum DBI, the verification result of matrix approximation technology on clustering effectiveness is obtained.
Nine daily load matrices are selected, normalized, and then clustered using the approximation matrix and the original matrix, respectively. The daily minimum DBI of clustering for each daily load matrix is calculated, as shown in Figure 4.
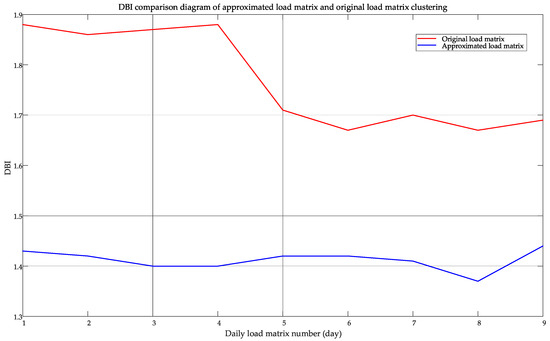
Figure 4.
DBI comparison of approximate and original load matrix clustering.
It can be seen from Figure 4 that the clustering effect of the approximated load matrix is better than that of the original matrix. Therefore, the application of matrix approximation technology can pre-optimize the data and improve the accuracy of the algorithm.
4.3. Analysis of Judgment Results
Based on the TOPSIS method, the comprehensive score Ti for the operating state of each device in the reactive power compensation equipment sample set in this area is calculated. It can be considered that T is a random variable and follows the distribution T~p(T). Several statistical measures of the calculated sample set are shown in Table 1.

Table 1.
Statistics of T.
This study supplements the analysis with boxplots based on the evaluation scores of 10,564 devices in the pilot region, providing a more comprehensive view of the distribution, skewness, outliers, and median, thereby offering deeper insights into the operating state of reactive power compensation devices in the area [30,31], which is shown in Figure 5. Define Q1 as the lower quartile of the sample data, Q3 as the upper quartile of the sample data, and R as the interquartile range, which is the difference between Q3 and Q1. Statistical theory shows that if the data is less than Q1 − 1.5R or greater than Q3 + 1.5R, the data is suspected to be abnormal. Since T is a very large indicator, there is no need to perform data verification for Q3 + 1.5R. Therefore, the abnormal threshold ε is defined as Q1 − 1.5R. Since the switching qualification rate is a direct quantification of the performance of switching actions, the abnormal threshold is set as its mean value.
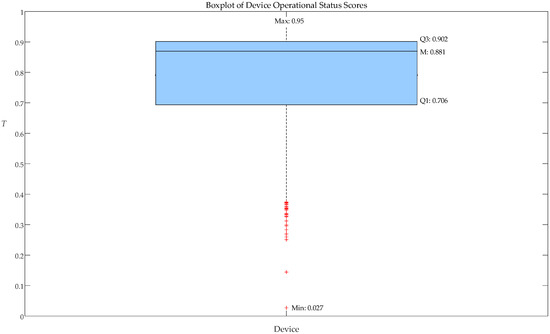
Figure 5.
Boxplot of Device Operational Status Scores.
From the boxplot based on the sample distribution, we can see that the median (M) is 0.881, which lies within the interquartile range, indicating that the number of devices in good operational status is greater than the number of devices in poor operational status. This suggests that most devices have operational scores around this value, meaning that half of the devices perform well. The values of Q3 and Q1 are 0.902 and 0.706, respectively, which further support the view that most devices are performing well, with a considerable portion scoring above 0.7. This distribution ensures that most devices operate efficiently, and only a small number experience performance degradation.
Statistical theory suggests that if the data are below Q1 − 1.5 IQR or above Q3 + 1.5 IQR, they are considered outliers. Since T is a very large index, there is no need to validate data above Q3 + 1.5 IQR. Based on the calculation, the IQR of this sample is 0.196, and the value of Q1 − 1.5 IQR is 0.412. Therefore, we can conclude that if the operational score of the reactive power compensation device is lower than 0.412, it should be considered as “requiring urgent inspection,” as these devices not only have health issues but also have low switching qualification rates, resulting in the failure to meet power factor requirements. If the score is below the lower quartile of 0.706, it should be included in the candidate inspection plan, and a detailed analysis of its two operational status indicators should be conducted to identify potential issues.
The calculation results obtained by the method proposed in this paper are verified based on the actual inspection results of reactive power compensation devices in Fujian area. A total of 25 reactive power compensation devices are selected as the inspection samples. Among them, 16 are in normal operating state, and 9 are in abnormal operating state.
The reactive power compensation devices in the inspection sample are analyzed, as shown in Table 2, where h is the health degree, s is the switching qualification rate, and T is the comprehensive score of the operating state. The thresholds for each indicator in this method are 0.82, 0.76, and 0.41, respectively. In this study, the three-phase voltage qualification rate indicator from Reference [3] was selected and applied to the same sample period, with 80% used as the threshold for evaluation. If the qualification rate falls below 80%, the device is considered to have problems. Although limited by the currently available data, this method provides a standardized starting point for equipment condition assessment and lays the foundation for subsequent research.
Table 2.
Data statistics of troubleshooting plan equipment.
An analysis of Table 2 shows that, regarding health status, the misjudgment probability of the method proposed in this paper is approximately 4% (1/25). Among the 16 reactive power compensation devices that are shown to be in normal operation in the inspection list, 8 have a switching qualification rate below the average switching qualification rate, resulting in low comprehensive operating scores. For such devices with relatively normal health status but failing to meet the requirements for switching qualification rate, their switching strategies should be adjusted through experimental research or parameter adjustment to meet the switching qualification rate requirements; none of the devices are classified as “urgently needing inspection”. An analysis of the faulty devices shown in the inspection list reveals that their health degrees are all below the threshold. The proposed method can accurately identify faulty devices, and due to inherent faults, all faulty devices have low switching qualification rates. The only device with a relatively high switching qualification rate, Device 14, may be because changes in its power factor led to more moments when no action was required during the sampling period, thus resulting in a significantly higher switching qualification rate compared to other faulty devices.
By contrast, the misjudgment rate of the compared method is about 20% (5/25). The difference arises because the compared method relies solely on the voltage qualification rate, which can be misleading in areas equipped with energy storage or photovoltaic systems that effectively stabilize voltage quality. In such cases, device problems may be masked, leading to a higher misjudgment rate. By contrast, our proposed method integrates multiple indicators, capturing the intrinsic operational state of devices and thereby ensuring more accurate and reliable evaluation.
Based on the method proposed in this paper, the diagnosis of the ideal operating state of reactive power compensation devices for distribution transformers in Fujian Province is carried out. Among the samples in this region, a total of 88 devices is classified as “urgently needing inspection”. Such devices have significant problems in both health status and switching qualification rate, and on-site inspection and maintenance should be carried out as soon as possible to prevent equipment damage from causing harm to the distribution network; 2554 devices should be included in the inspection plan, and the inspection order should be determined according to their comprehensive operating scores; 7011 devices have a comprehensive operating score above the average, belonging to devices in relatively good operating condition, and there is no need for inspection in the short term. However, the comprehensive operating scores of the devices should also be counted regularly to prevent problems such as equipment aging and fault damage.
5. Conclusions
This paper proposes a data mining-based method for diagnosing the operating status of reactive power compensation devices. It clusters the typical characteristics of loads through singular value decomposition and matrix approximation, measures whether reactive power compensation devices have action capabilities based on the mutual information between the power factor and active power of distribution transformers, and defines the health degree and switching qualification rate of reactive power compensation devices as evaluation indicators for diagnosing the operating status of the devices. By analyzing the actual regional operating data, the following conclusions are drawn:
- (1)
- By introducing health degree and switching qualification rate as core indicators, a comprehensive scoring method was established. The results provide quantitative references for power supply enterprises to plan inspection and maintenance, reduce costs, estimate equipment life, and compare equipment quality across manufacturers.
- (2)
- The proposed method is not only computationally efficient and easy to implement, but also relies on data that are relatively easy to obtain. It can be conveniently integrated into existing management systems and applied across diverse operational scenarios, thereby enhancing the automation and objectivity of equipment state assessment.
- (3)
- Unlike traditional approaches that rely solely on switching behavior, the dual-indicator system of “health degree + switching qualification rate” provides a more comprehensive representation of equipment operating status. Its effectiveness has been validated using real regional data, demonstrating strong practical value.
This study has several limitations. First, the method relies on the completeness and accuracy of power quality and load data; missing values or noise may affect the evaluation results. Second, although the case study in this work is based on a region with representative characteristics, the sample set has not yet covered areas with different operating environments and grid topologies, which to some extent limits the verification of the method’s general applicability. Third, for highly irregular or strongly fluctuating load pat-terns, the clustering stability may decrease. To address these issues, future research will incorporate multi-source data, such as device parameters and historical fault records, and extend validation to additional regions and different power grid scenarios, so as to improve both the robustness and cross-regional applicability of the method, and to enable more comprehensive and accurate diagnosis in practical applications.
Author Contributions
Conceptualization, Y.Z.; methodology, Y.C.; software, Y.C.; validation, Y.Z.; formal analysis, Y.Z.; investigation, Y.C.; data curation, Y.C.; writing—original draft preparation, Y.C.; writing—review and editing, Y.Z.; visualization, Y.Z.; supervision, Y.C. All authors have read and agreed to the published version of the manuscript.
Funding
This research received no external funding.
Data Availability Statement
The codes developed are not public. However, data will be made available on request.
Conflicts of Interest
The authors declare no conflicts of interest.
References
- Ni, S.; Yu, S.; Hua, C.; Cheng, W. Power quality control of low-voltage distribution network based on PIMC-STATCOM. Distrib. Util. 2023, 40, 76–83. [Google Scholar]
- Ou, J.; Zhang, Y.; Chen, Y.; Xin, R.; Lin, Q. Decentralized collaborative power quality control strategy considering the regulation characteristics of multivariate devices. Power Syst. Technol. 2025, 1–17. [Google Scholar] [CrossRef]
- Ma, J.; Fang, J.; Zhu, B.; Wang, H. Condition Monitoring Method for Low-Voltage Reactive Power Compensation Equipment of Distribution Transformers Based on Internet of Things Technology. Electron. Compon. Inf. Technol. 2023, 7, 174–177. [Google Scholar]
- Chen, W. Development and Research of Condition Monitoring and Evaluation System for Low-Voltage Reactive Power Compensation Equipment of Distribution Transformers. Bachelor’s Thesis, North China Electric Power University, Beijing, China, 2016. [Google Scholar]
- Yan, W.; Chen, S.; Shen, H. Index system of operational status evaluation for reactive-power compensation device at low-voltage side of distribution transformer. Electr. Power Autom. Equip. 2016, 36, 25–31. [Google Scholar]
- Li, Q. Power big data anomaly detection method based on an improved PSO-PFCM clustering algorithm. Power Syst. Prot. Control. 2021, 49, 161–166. [Google Scholar]
- Xao, X.; Zheng, Z. New power systems dominated by renewable energy towards the goal of emission peak & carbon neutrality: Contribution, key techniques, and challenges. Adv. Eng. Sci. 2022, 54, 47–59. [Google Scholar]
- Zhang, G.; Kong, L. Evaluation algorithm of distribution transformer operation state based on big power data. Hebei Electr. Power 2022, 41, 6–9+32. [Google Scholar]
- Tang, Z.; Li, Y. Application of improved adaptive parameterless empirical wavelet transform in transformer high frequency partial discharge current noise suppression. Power Syst. Technol. 2023, 47, 3474–3484. [Google Scholar]
- Gu, Z.; Li, P.; Qin, F.; Mai, X.; Yang, W.; Liu, H. Provincial technical loss reduction platform with interactive management and control considering reactive power compensation potential of power supply and consumption sides. Energy Rep. 2024, 11, 1846–1855. [Google Scholar] [CrossRef]
- Riyanto, A.; Kuswanto, H.; Prastyo, D.D. Mutual Information-Based Variable Selection on Latent Class Cluster Analysis. Symmetry 2022, 14, 908. [Google Scholar] [CrossRef]
- Wu, Y.; Zhao, J.; Xuan, Y.; Sun, Z.; Xu, G. Analysis of power consumption behavior of special users based on multidimensional load characteristic mining. Electr. Power Constr. 2024, 45, 116–125. [Google Scholar]
- Zhong, J.; Wang, S.; Ran, Y.; Ran, X.; Yu, J.; Yu, H. Short-term consumer load forecasting based on mutual information and LSTM. Electr. Power Constr. 2022, 43, 96–102. [Google Scholar]
- Yang, J. Research on Feature Extraction and Fault Diagnosis Method for Rolling Bearing Vibration Signals Based on Improved FDM-SVD and CYCBD. Symmetry 2024, 16, 552. [Google Scholar] [CrossRef]
- Wang, Z. Research on Distribution Network Topology Identification and Load Curve Clustering Feature Extraction Method Based on Load Measurement. Master’s Thesis, Zhejiang University, Hangzhou, China, 2021. [Google Scholar]
- Zhu, W.; Shu, H.; Li, J.; Zhu, H. Identification and management of three-phase imbalanced station areas based on time-period dominant characteristics. Power Syst. Technol. 2024, 48, 1–8. [Google Scholar]
- Wang, L.; Liu, T.; Wang, B.; Hao, Y.; Wang, Z.; Zhang, Y. Short-term wind power prediction based on svd and Kalman filter correction of multi-position nwp. Acta Energiae Solaris Sin. 2022, 43, 392–398. [Google Scholar]
- Yang, W.; Liu, Y.; Shu, Q. A short-term load forecasting model based on CEEMD. Power Syst. Technol. 2022, 46, 3615–3622. [Google Scholar]
- Liu, S.; Fu, X.; Ye, C.; Huang, M. Spatial load clustering and integrated forecasting method of distribution network considering regional difference. Autom. Electr. Power Syst. 2017, 41, 70–75+82. [Google Scholar]
- Jin, K.; Zhang, P.; Deng, X.; Xie, H. Improved multi-linear Monte Carlo probabilistic energy flow calculation method based on K-means clustering technique. Power Syst. Technol. 2019, 43, 65–74. [Google Scholar]
- Liu, F.; Gao, C.; Liu, L. SK-PSO: A Particle Swarm Optimization Framework with SOM and K-Means for Inverse Kinematics of Manipulators. Symmetry 2024, 16, 1667. [Google Scholar] [CrossRef]
- Meng, Z.R. Research on Combined Forecasting Method for Short-Term Load of Power System. Ph.D. Thesis, Wuhan University, Wuhan, China, 2022. [Google Scholar]
- Zhu, Y.; Yao, R.; Wang, L.; Bai, H.; Li, W.; Du, W.; Xu, M. Sensitivity analysis method for resonant frequency of power grids based on singular value decomposition. South. Power Syst. Technol. 2025, 19, 85–92. [Google Scholar]
- Huang, Y.; Luan, K.; Huang, Q.; Zhang, Y.; Zhou, Q.; Yang, S.; Duan, M.; Cheng, H. Research on the photoelectric field reduction method based on dynamic time regularized layer condensation. Distrib. Util. 2023, 40, 91–100. [Google Scholar]
- Bai, Y.; Zhou, Y.; Liu, J. Clustering analysis of daily load curve based on deep convolution embedding clustering. Power Syst. Technol. 2022, 46, 2104–2113. [Google Scholar]
- Yan, Y.; Sun, H.; Bai, Z.; Zhang, F.; Yao, P.; Huang, K.; Ye, C. Analysis method of user’s electricity consumption behavior in low-voltage station area based on MEFE and GN-CNN. Distrib. Util. 2023, 40, 79–86. [Google Scholar]
- GB/T 40427-2021; Technical Guidelines for Voltage and Reactive Power in Power Systems. Standardization Administration of China: Beijing, China, 2021.
- Zhang, Y.; Gu, D.; Li, Z.; Huang, Y.; Guo, X. A power system adequacy assessment method based on hierarchical classification and improved AHP-EW-TOPSIS. Power Syst. Prot. Control. 2024, 52, 144–154. [Google Scholar]
- Wang, S.; Shi, L.; Gu, R. Evaluation of primary equipment operation state in smart grid based on TOPSIS. Distrib. Util. 2021, 38, 56–60. [Google Scholar]
- Fu, W.; Zhao, Y.; Fu, Y.; Wu, C. Viscosity prediction of dissolved gas in transformer oil based on improved boxplot and ISMAHHO-KELM[J/OL]. High Volt. Appar. 2024, 1–13. [Google Scholar]
- Zhao, Y.; Chen, Y.; Zhang, X.; Zhang, L. A Ship Detection Algorithm for SAR Image Based on Box-Plot. Period. Ocean. Univ. China 2021, 51, 130–140. [Google Scholar]
Disclaimer/Publisher’s Note: The statements, opinions and data contained in all publications are solely those of the individual author(s) and contributor(s) and not of MDPI and/or the editor(s). MDPI and/or the editor(s) disclaim responsibility for any injury to people or property resulting from any ideas, methods, instructions or products referred to in the content. |
© 2025 by the authors. Licensee MDPI, Basel, Switzerland. This article is an open access article distributed under the terms and conditions of the Creative Commons Attribution (CC BY) license (https://creativecommons.org/licenses/by/4.0/).