Article

Asymmetric Structural Response Characteristics of Transmission Tower-Line Systems Under Cross-Fault Ground Motions Revealed by Shaking Table Tests

1
Key Laboratory of Urban Security and Disaster Engineering of China Ministry of Education, Beijing University of Technology, Beijing 100124, China
2
Key Laboratory of Earthquake Forecasting and Risk Assessment, Ministry of Emergency Management, Institute of Earthquake Forecasting, Beijing 100036, China
3
Institute of Geophysics, China Earthquake Administration, Beijing 100081, China
*
Author to whom correspondence should be addressed.
Symmetry 2025, 17(10), 1646; https://doi.org/10.3390/sym17101646
Submission received: 27 August 2025 / Revised: 13 September 2025 / Accepted: 16 September 2025 / Published: 4 October 2025
(This article belongs to the Section Engineering and Materials)

Abstract

The long-distance high-voltage transmission tower-line system, frequently traversing active fault zones, is vulnerable to severe symmetry-breaking damage during earthquakes due to asymmetric permanent ground displacements. However, the seismic performance of such systems, particularly concerning symmetry-breaking effects caused by asymmetric fault displacements, remains inadequately studied. This study investigates the symmetry degradation mechanisms in a 1:40 scaled 500 kV tower-line system subjected to cross-fault ground motions via shaking table tests. The testing protocol incorporates representative fault mechanisms—strike-slip and normal/reverse faults—to systematically evaluate their differential impacts on symmetry response. Measurements of acceleration, strain, and displacement reveal that while acceleration responses are spectrally controlled, structural damage is highly fault-type dependent and markedly asymmetric. The acceleration of towers without permanent displacement was 35–50% lower than that of towers with permanent displacement. Under identical permanent displacement conditions, peak displacements caused by normal/reverse motions exceeded those from strike-slip motions by 50–100%. Accordingly, a fault-type-specific amplification factor of 1.5 is proposed for the design of towers in dip-slip fault zones. These results offer novel experimental insights into symmetry violation under fault ruptures, including fault-specific correction factors and asymmetry-resistant design strategies. However, the conclusions are subject to limitations such as scale effects and the exclusion of vertical ground motion components.

1. Introduction

As critical components of modern energy infrastructure, lifeline systems such as transmission tower-line networks are characterized by large spans and extensive continuous layouts, frequently traversing complex terrains including mountains, rivers, and active fault zones. Their primary structural elements, lattice towers, possess inherent geometric symmetry and are designed to maintain dynamic symmetry under uniform loading conditions [1]. However, this inherent symmetry also renders them highly susceptible to symmetry-breaking excitations, a vulnerability that is particularly pronounced in fault-crossing segments. Pulse-type ground motions, characteristic of near-fault regions, are known to significantly amplify structural responses, posing a destructive potential far greater than that of ordinary ground motions. Moreover, seismic excitations across a fault exhibit strong spatial variability and pronounced asymmetry, resulting in differential input motions at the structural supports that induce excessive internal forces and deformations. Historical earthquakes have repeatedly demonstrated the severe degradation of symmetry in such systems, underscoring the urgent need to prioritize symmetry preservation and restoration in seismic design. Although conventional design codes, such as GB 50011 [2], typically rely on idealized assumptions of symmetry and uniform excitation [3], actual fault ruptures introduce intensely asymmetric loading. For instance, traditional elastic design frameworks (e.g., a displacement angle limit of 1/50) are entirely inadequate for addressing permanent ground displacement—such as the 3.5-m vertical offset observed at the Hongkou Fault during the 2008 Wenchuan earthquake—which can induce severe asymmetric plastic deformation.
Indeed, the seismic response of fault-crossing structures has become a prominent research topic in civil engineering. For instance, Goel et al. [4] developed two approximation methods based on structural dynamics to estimate the peak responses of conventional bridges crossing fault rupture zones. Gazetas et al. [5] examined the response of bridge pier caisson foundations to inclined fault motions, with numerical results showing good agreement with physical tests. Yang et al. [6,7] found that standard input motions considerably underestimate the responses of fault-spanning bridges and proposed a simplified method for synthesizing ground motions for strike-slip faults. Zeng et al. [8,9,10] identified the decisive influence of permanent fault displacement amplitude on bridge response. Furthermore, studies on suspension bridges [11], buried pipelines [12,13,14], embankments [13], and tunnels [15] have collectively shown that factors such as the fault crossing angle, traveling wave effects, soil–structure interaction, and low-frequency components of ground motions are critical drivers of asymmetric structural response and damage accumulation.
However, compared to other structures, the understanding of symmetry failure mechanisms in transmission tower-line systems under differential fault displacement remains limited. Early experimental studies often employed isolated tower models, which simplified or neglected the dynamic coupling effects between the tower and conductors—an approach later shown to be inadequate [16] In recent years, significant progress has been made through multi-shaker shake-table tests on coupled tower-line systems. These studies have revealed that tower-top displacement under non-uniform excitation can be over 35% greater than under uniform input, and that neglecting tower-conductor interaction can lead to a 40–60% underestimation of the seismic response while masking symmetry-breaking dynamic characteristics and energy dissipation mechanisms [17,18,19,20]. Near-fault pulse effects have been shown to markedly amplify dynamic responses and reduce hysteretic energy dissipation capacity by 37%, whereas conductor participation can reduce the seismic response by 4–45% [21,22,23,24]. Xiong performed shake-table tests on a 1:15 scaled ultra-high voltage transmission tower-line system, revealing significant traveling wave effects under multi-support asynchronous input [25]. Xin et al. tested systems near and across faults, confirming that near-fault motions strongly amplify structural responses [26]. Wei et al. investigated the influence of horizontal-rocking coupling in ground motions, demonstrating that it induces asymmetric displacement responses in towers [27]. Notably, Several studies have also highlighted that permanent ground displacement intensifies structural response, concentrates stress in tower legs, triggers local buckling, and leads to global instability [28,29,30,31,32]. Therefore, employing coupled system models such as “three towers and two spans” or “three towers and four spans” in shake-table testing can effectively simulate collapse mechanisms and validate numerical models of transmission tower-line systems. The presence of conductors and ground wires significantly alters the dynamic characteristics of the system. However, due to challenges such as large prototype dimensions, limited equipment capacity, and complex model fabrication, experimental studies involving multi-shaker, multi-dimensional, and multi-point excitations remain scarce.
In summary, while existing research has established that geometric symmetry does not guarantee a symmetric dynamic response, a deep, quantitative understanding of the mechanism by which symmetry systematically degrades and leads to failure in transmission tower-line systems—especially under the combined effects of permanent fault displacement and intensely asymmetric ground shaking—is still lacking from an experimental perspective. To address this critical research gap, this study conducts large-scale shake-table tests to investigate the failure mechanisms and symmetry degradation process of a fault-crossing transmission tower-line system. Based on dynamic similitude theory, a scaled model preserving the geometric symmetry of the prototype was designed and fabricated. The seismic input was applied using displacement boundary conditions derived from recorded accelerograms to accurately replicate the fault rupture, incorporating both permanent offset and bilateral asymmetry. A multi-channel data acquisition system synchronously measured strain, acceleration, and displacement responses, with a particular focus on analyzing asymmetric deformation and the loss of dynamic symmetry. The findings of this study provide crucial experimental validation for the development of symmetry-based seismic design methodologies for transmission systems and offer quantitative data for assessing symmetry degradation, which is essential for establishing rational fault-effect modification factors.

2. Experimental Tower-Line System Model Design

According to structural similarity theory, shaking table tests of prototype structural models face significant limitations. First, constrained by the maximum load capacity and platform dimensions of large-scale shaking table equipment, prototype testing requirements for super high-rise buildings or long-span structures cannot be satisfied [33]. Second, full-scale testing costs increase nonlinearly, often exceeding conventional research budgets [34]. Consequently, reduced-scale model testing has become a standard engineering practice. This approach involves establishing a dimensionless parameter system that satisfies the π-theorem [35], with three critical requirements: (1) geometric similarity, requiring strict control of slenderness ratio tolerances for key structural members; (2) stress-strain material similarity, with constitutive curve inflection point offsets maintained within ±3%; and (3) mass-gravity similarity, necessitating synchronous matching of the Froude (Fr) and Cauchy (Ca) numbers [36].
Based on the above principles, the core similarity relationship was established as follows: firstly, a geometric scaling ratio of 1:40 for the tower model, constrained by shaking table dimensions at Beijing University of Technology; secondly, red copper was selected with an elastic modulus ratio of 1:2 to optimize mass distribution; finally, an acceleration scaling ratio of 3:1 was implemented. This resulted in a model tower height of 1.85 m, scaled from the 74 m prototype. To ensure experimental results accurately reflect prototype structural behavior, the physical similarity design followed Buckingham’s π [37] theorem for distributed artificial mass and gravity compensation modeling. Artificial masses were strategically positioned to supplement gravity and inertia effects while preserving structure stiffness. The finalized similarity ratios for components of the transmission tower-line system are detailed in Table 1.
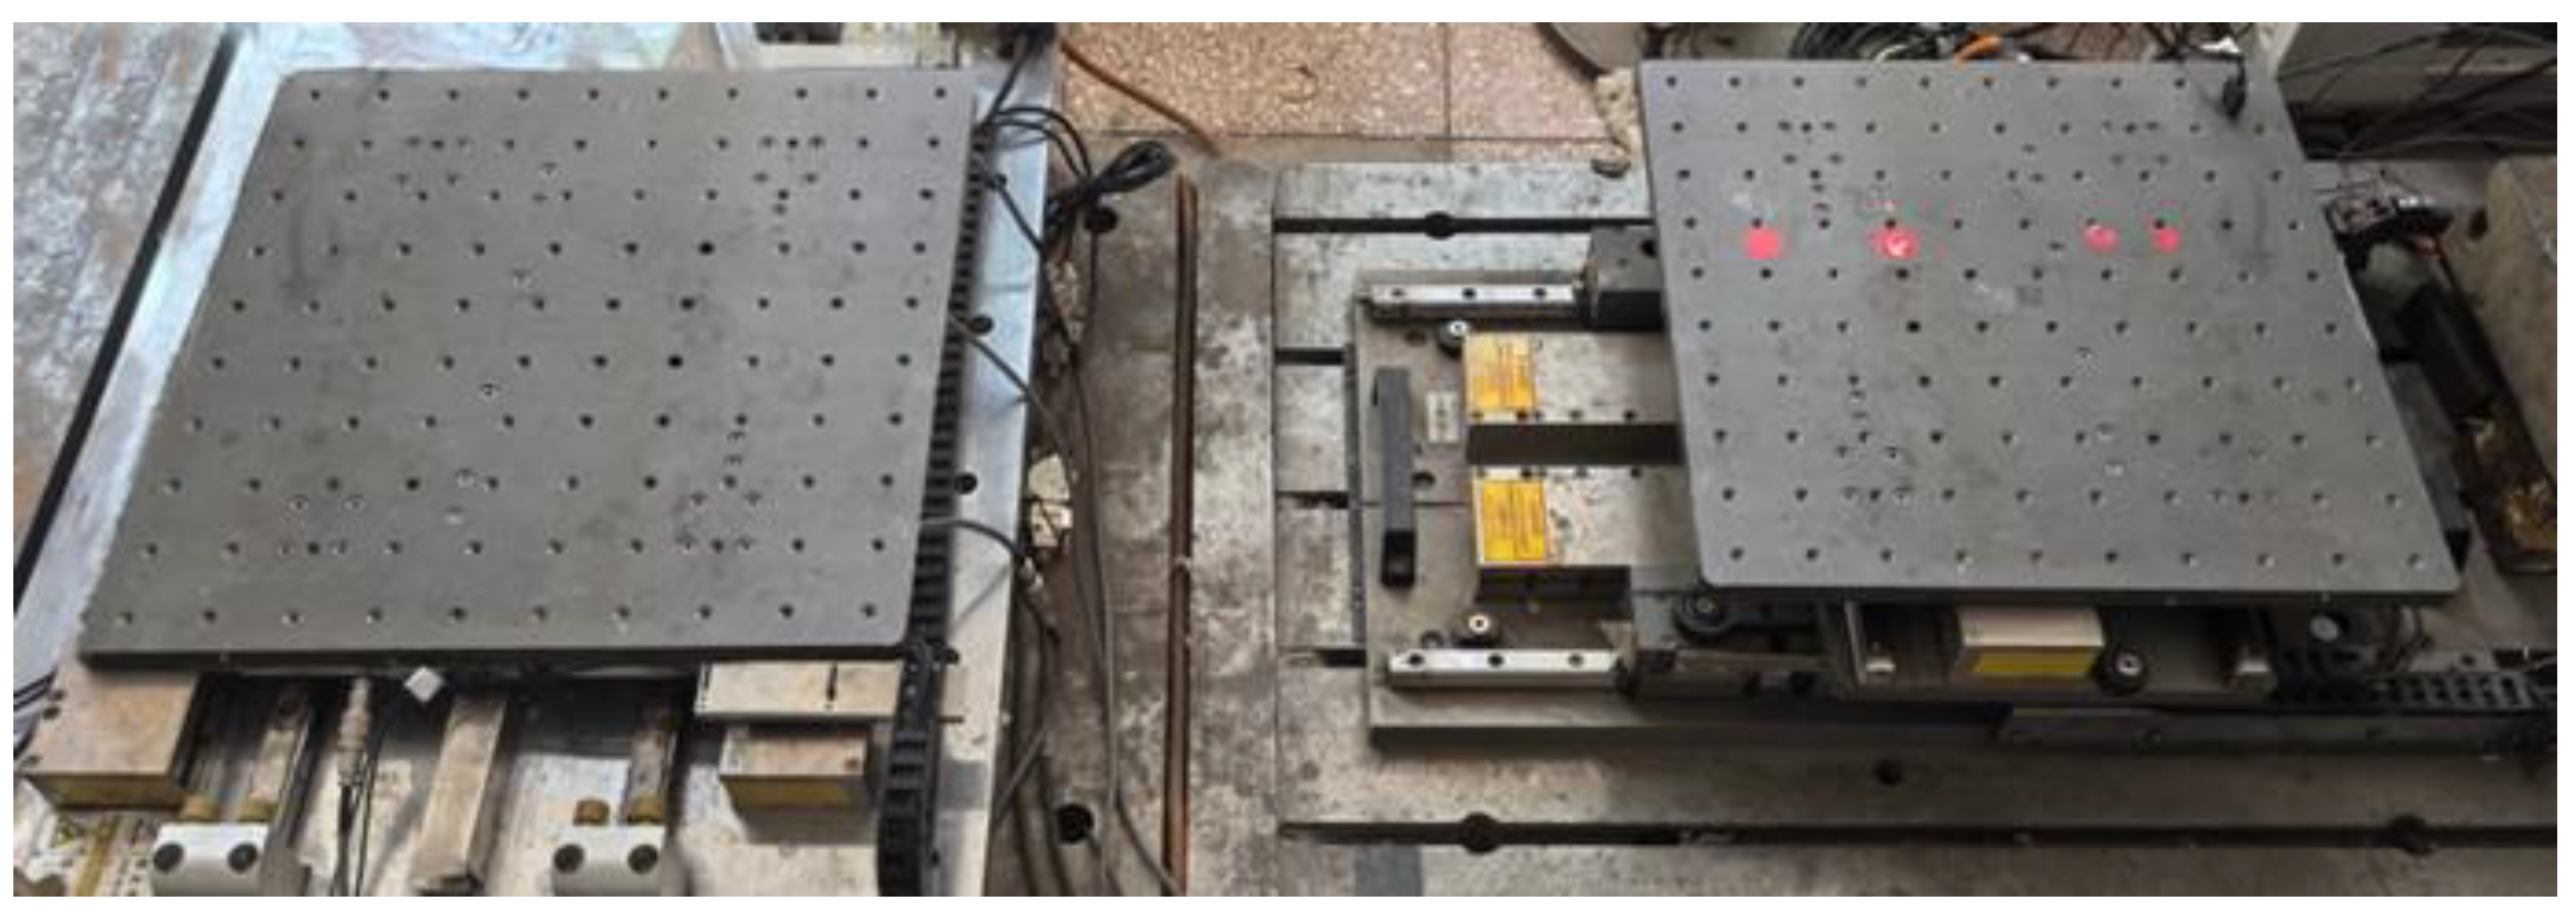
To streamline model design and fabrication, uniform red copper material specifications were implemented for the shaking table test transmission tower model, the primary members using L15 × 1 angle copper, the diagonal members using L7 × 0.5 angle copper, and all other components using L5 × 0.5 angle copper. The fabricated model is shown in Figure 1. Functioning primarily as wire suspension components, insulator strings serve as auxiliary structures in this test (Figure 1b). Considering the feasibility requirements of the model design, we neglect the stiffness and mass similitude ratio requirements for the insulators. Instead, they are equivalently modeled as rigid links, with the insulator string acting solely as load-transferring component between the tower and wires [38]. Compared to transmission towers, conductors and ground wires, insulators feature smaller dimensions but higher stiffness. Thus, the insulator strings are treated as rigid rod with pinned connections at both ends, with their length and mass modeled using similitude ratios of 1/40 and 1/1567, respectively. The test model’s insulator strings have masses of 0.46 kg and 0.02 kg. The laboratory’s electrodynamic shakers (comprising two sub-tables) provide a longitudinal maximum displacement of ±100 mm and a maximum acceleration of ±1 g, with a combined working range of 1 m (Figure 2). Adopting a geometric similitude ratio of 1:40 for the conductor and ground wire would require a laboratory span of 10 m (calculated from the actual distance of 400 m). This exceeds the shaker array’s working range, making it impractical to strictly simulate the long-span suspension structure using geometric similarity alone. To ensure the integrity of the scaled tower-line coupling system while maintaining the correct frequency relationship between the conductors, ground wires, and main tower, the design employs a separation of dynamic similitude characteristics [39]. Considering laboratory space limitations and dynamic performance requirements, a geometric similitude ratio of 1:400 was selected for the conductor (ground) wires. This approach satisfies spatial constraints and better meets the model’s dynamic characteristic requirements, ensuring feasibility without introducing excessive errors.
To achieve the required inertial behavior in the scaled transmission line model, material selection combined mass and density similitude ratios. Based on stiffness equivalence principles, steel wires with diameters of 3 mm (conductor wires) and 1.5 mm (ground wires) were selected. Due to the steel wire’s lower density, additional counterweights of 1.217 kg and 0.067 kg were applied to meet the mass similitude ratio. The specific materials used In the model are detailed In Table 2.
As shown in Figure 3, the two towers are mounted on separate laboratory shakers spaced 1 m apart center-to-center. Fixed poles are positioned 1 m outward from each tower, forming a two-tower three-conductor transmission system.

3. Instrumentation Arrangement and Test Scheme

3.1. Instrumentation Arrangement

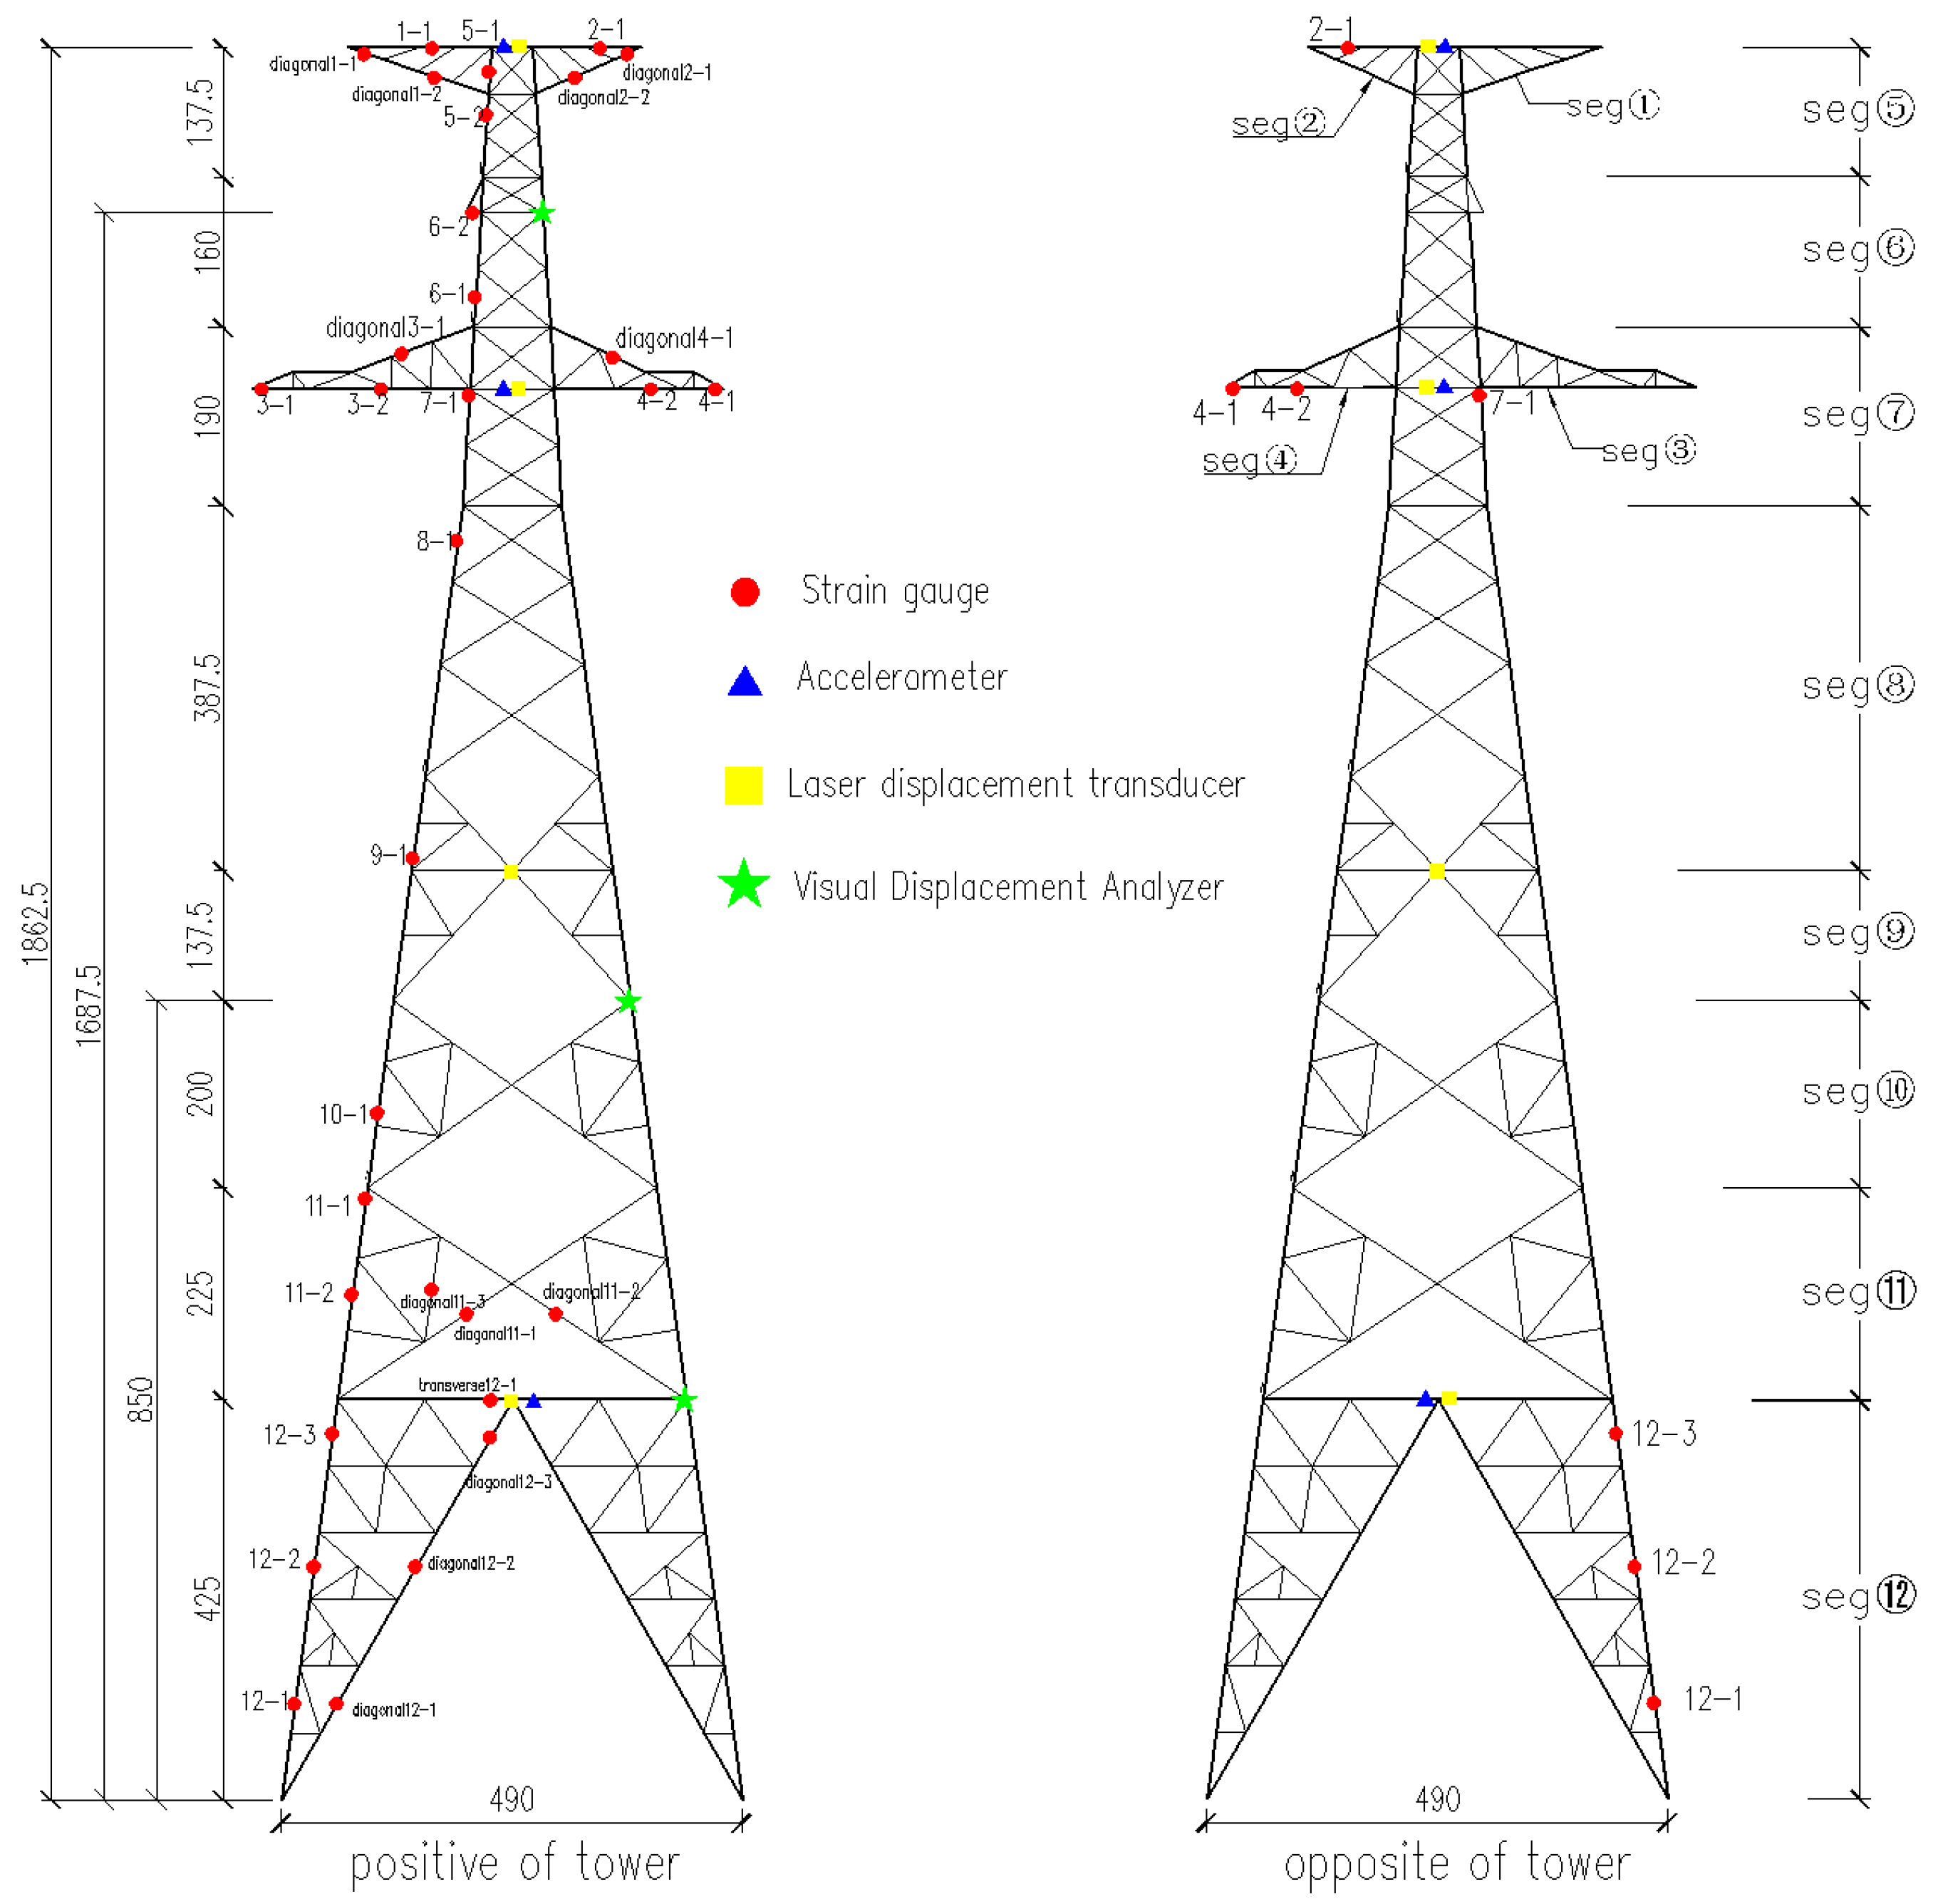
To facilitate distinct component identification, the transmission tower is divided into 12 segments as shown in Figure 4. Strain gauges, displacement transducers, and accelerometers are installed on the structure to capture corresponding experimental data. Strain gauges are mounted on the main columns and diagonal braces at locations marked by red dots in Figure 4. Laser displacement transducers are positioned at 1.8625 m height on both tower tops. Wire displacement transducers are installed at 0.425 m, 0.9875 m, and 1.5 m levels, indicated by yellow squares. Additionally, non-contact dynamic displacement measurement (VDA) specialized software is performed at 0.425 m, 0.85 m, and 1.6825 m heights, with measurement points marked by pentagrams. Accelerometers are deployed at 0.425 m, 1.5 m, and 1.8625 m, shown as blue triangles.

3.2. Test Scheme

To examine how ground motions with different spectral characteristics affect the tower-line system, this study employs unidirectional input motions. The selected motions consist of four recorded events (CHY024-X, CHY024-Y, TCU052-Z, and Landers-N2). Additionally, to examine the influence of permanent versus transient displacement, a synthetic motion was generated by reversing the displacement time history of the original record (synthetic Landers-N1). Figure 5 shown the recorded acceleration time histories described in Table 3, and the corresponding normalized response spectra are presented in Figure 5f.
Shaking table tests were conducted to evaluate the structural performance under concurrent near-fault ground motions and fault dislocation effects. Owing to the operational displacement limit of the shaking table (±100 mm), the acceleration records were initially baseline-corrected and subsequently integrated twice to derive displacement time histories [40], which were then scaled in amplitude while maintaining the original duration. This experimental design facilitates a direct comparison of system responses between strike-slip and normal/reverse fault mechanisms under identical input conditions, thereby ensuring that observed differences are attributable solely to the fault displacement pattern rather than inherent variability among seismic records.
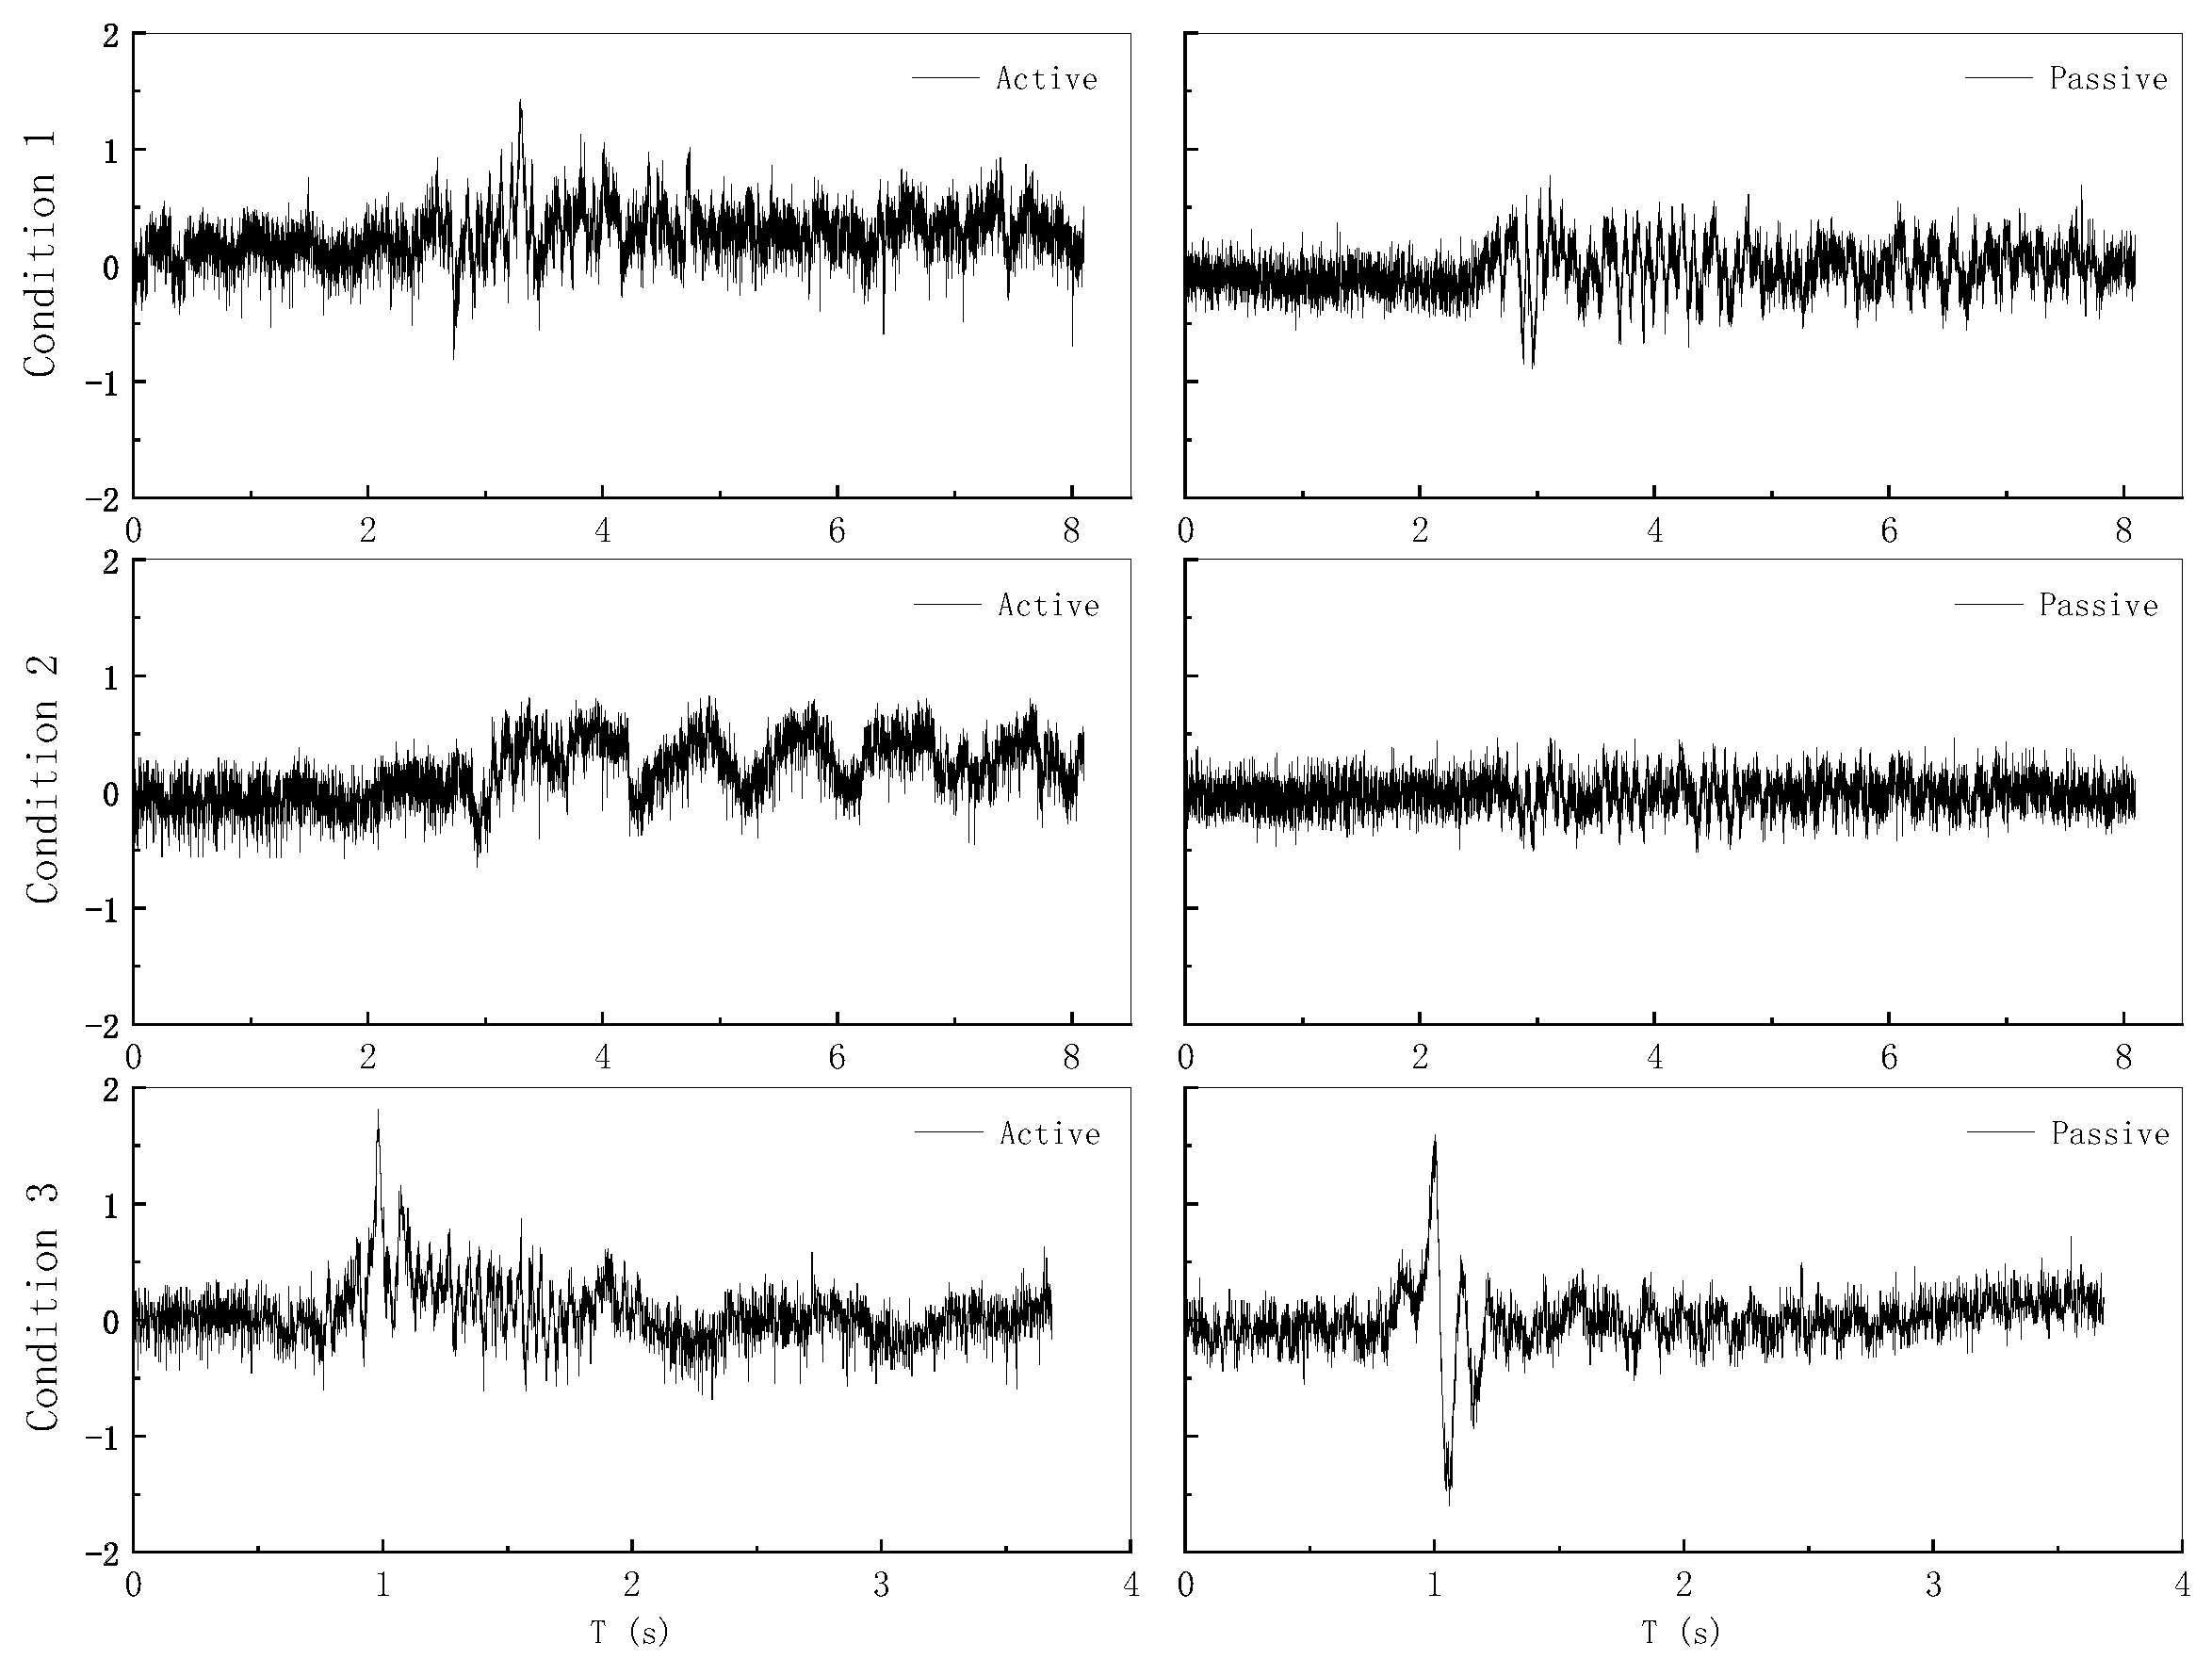
This study utilizes a dual-tower shaking table system with differentiated X and Y bidirectional horizontal seismic inputs to characterize the mechanical effects of strike-slip faults and normal/reverse faults. To investigate the impact of non-uniform seismic excitation on transmission tower-line systems, five original seismic time histories were processed through similarity ratio compression and reconstructed into the three typical working conditions shown in Figure 6: progressive displacement difference (gradient accumulation via gradual near-fault displacement variation), abrupt displacement difference (simulating near-fault displacement step-surge), and reverse displacement loading (achieving large displacement differences through counter-motion of dual tables). In these tests, an active plate with permanent displacement motions simulates fault accumulation, and a passive plate using non-permanent displacement motions, in the X direction (perpendicular to lines) characterizing strike-slip fault horizontal dislocation, and the Y direction (parallel to lines), simulates normal/reverse fault motions (due to the lack of vertical motion capability in the shaking table, only the horizontal motion effects of normal/reverse faults are simulated). Detailed configurations are specified in Table 4.

3.3. Structural Dynamic Characterization Test

To verify the reliability of the experiment, white noise excitation was applied prior to formal testing. The measured natural frequencies of the single transmission tower are 17.43 Hz (first-order) and 18.1 Hz (second-order), as illustrated in Figure 7.
Pre-test finite element analysis of the scaled transmission tower model identified first-order and second-order natural frequencies of 20.195 Hz and 20.455 Hz, respectively, with maximum relative errors maintained below 15%. This discrepancy primarily stems from differences between the finite element model’s uniformly distributed mass representation and the concentrated mass weighting approach used in physical testing.
Under X-direction white noise excitation, the tower-line system demonstrated a measured natural frequency of 9.05 Hz (representing a 48% reduction from isolated tower values), compared to the finite element prediction of 11.54 Hz (43% reduction). This divergence highlights the numerical simulation’s idealized assumptions regarding coupled stiffness and boundary constraints. The amplified frequency reduction in physical testing arises from two synergistic mechanisms: inertial enhancement due to conductor mass loading and structural stiffness degradation caused by flexible connections.

4. System Response Under Cross-Fault Inputs in the Out-of-Plane Direction

4.1. Influence of Displacement Processes on Tower-Line System Under Identical Permanent Displacement

Three sets of seismic ground motions were applied to the transmission tower system in the X-direction to simulate the horizontal motion of a strike-slip fault. The resulting strain, acceleration, and displacement responses were recorded.

4.1.1. Strain Response Characteristics

A comparative analysis of the transmission tower responses under three seismic conditions revealed significant regional variations in strain distribution shown in Figure 8. Under Conditions 1 and 2, peak strains concentrate in the tower head (Segment 5) and sub-peak regions (Segments 9–10), while Segment 11 exhibits transient displacement, demonstrating its critical influence on structural dynamics. Condition 3 induces the highest strain intensity in the leg section (Segment 12), though Segments 9–10 maintain sustained high-strain states. Notably, the persistent strain concentration in Segments 9–10 across all conditions identifies this structural zone as a critical vulnerability, warranting prioritized reinforcement.

4.1.2. Displacement Response Characteristics

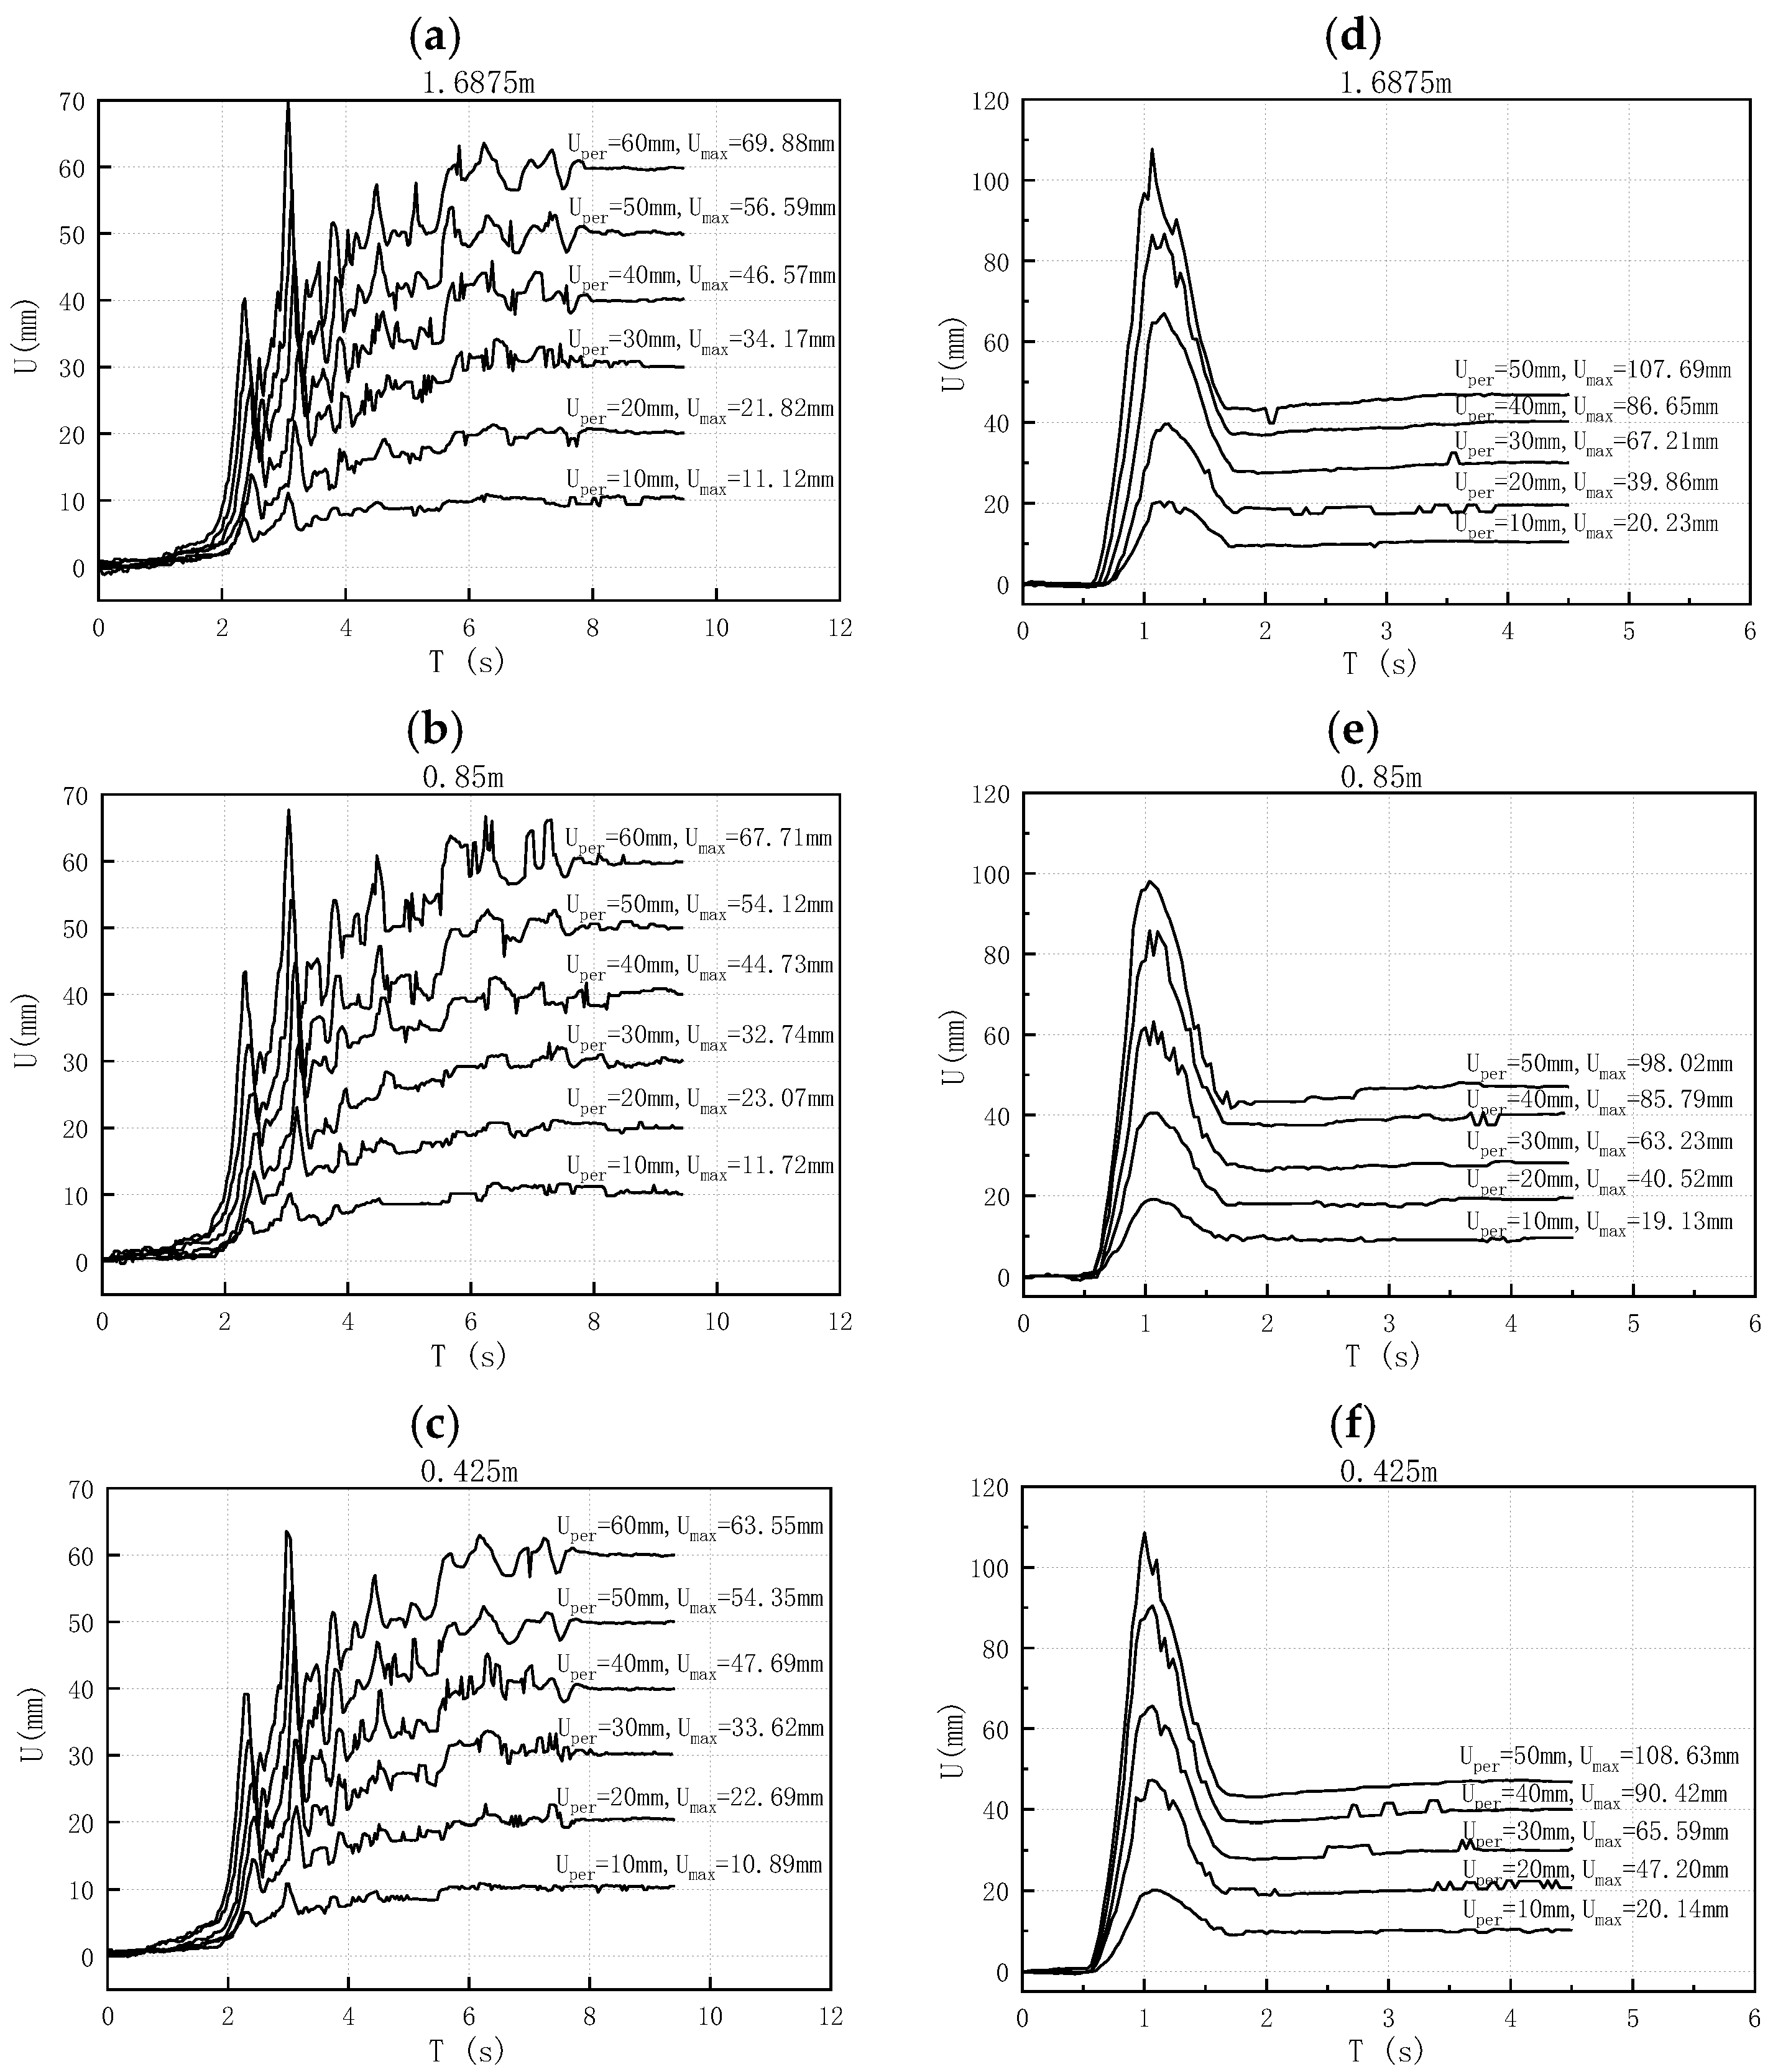
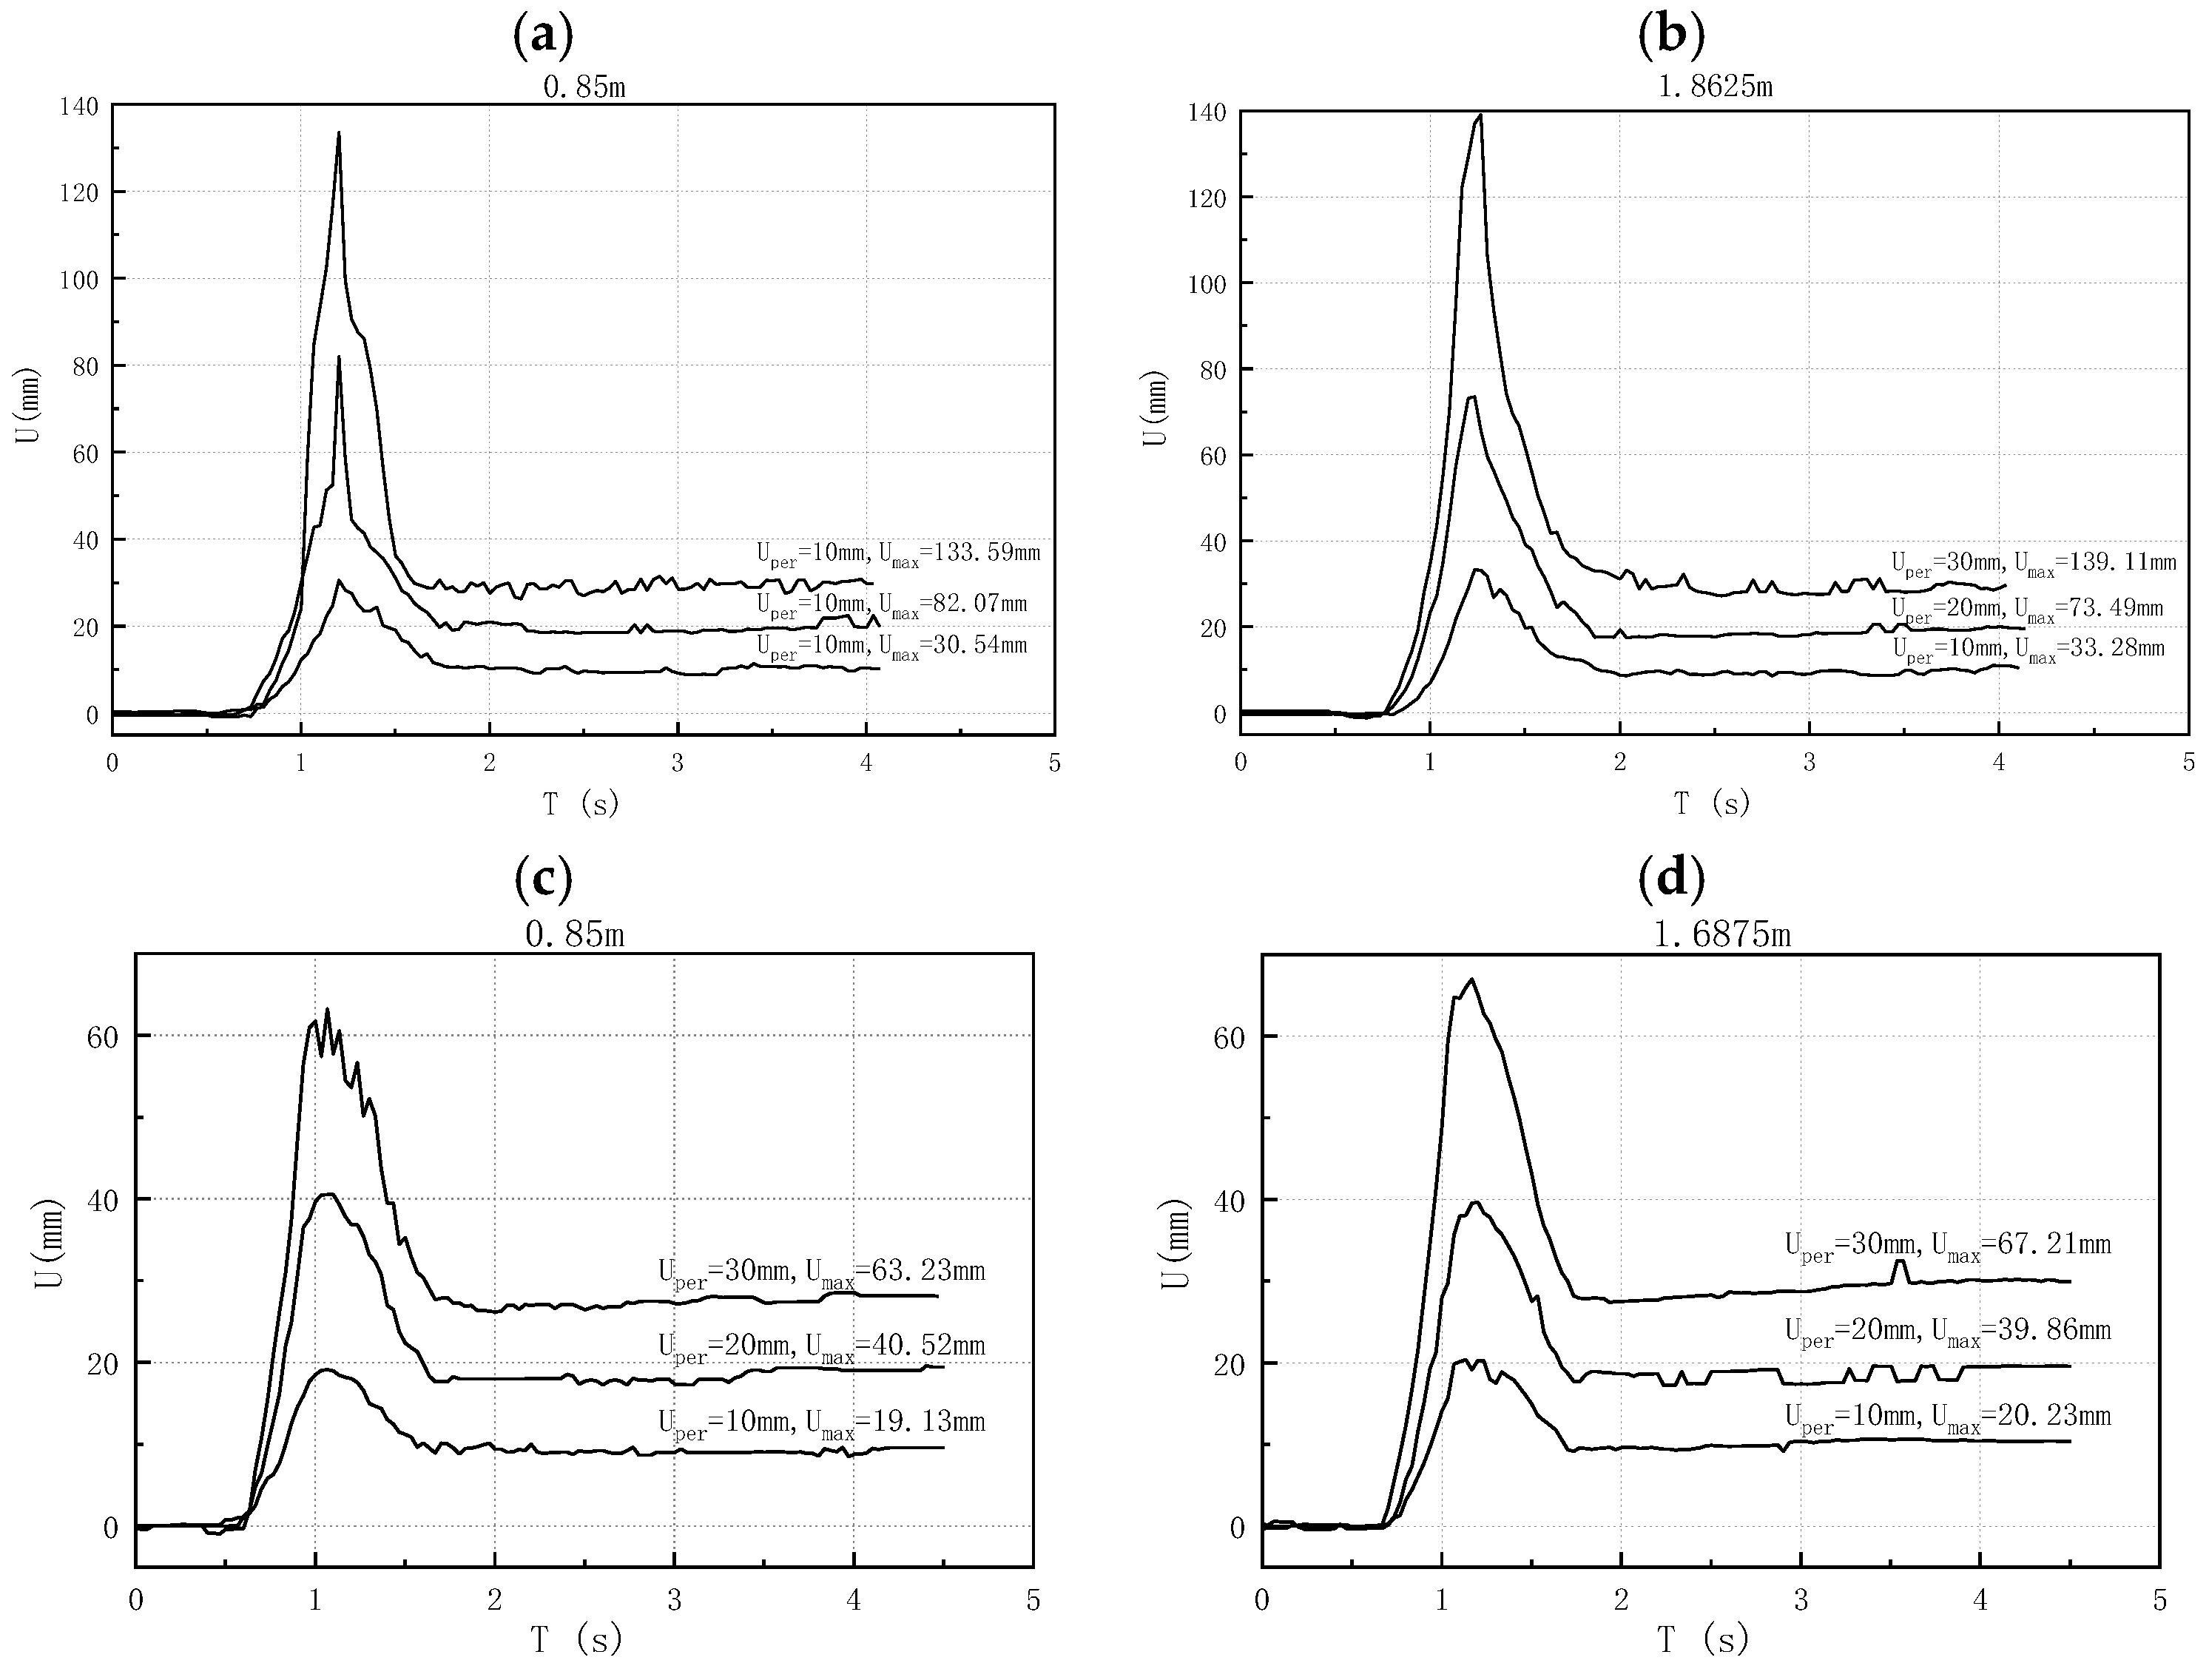
Figure 9 compares the displacement responses between Condition 1 and Condition 3, revealing maximum displacements at 1.6875 m for Condition 1 and 0.425 m for Condition 3. This contrast demonstrates that seismic motions with distinct spectral characteristics determine different maximum response locations in transmission towers.
Figure 10 illustrates the top–bottom relative displacements of the transmission tower under 10 mm permanent displacement across different loading conditions. Condition 3 induces the maximum transient displacement, with active/passive plate displacements nearly doubling those in Condition 1, attributable to reverse displacement components in passive plate seismic inputs that generate opposing phase responses. Condition 2 demonstrates converged plate displacement responses between active/passive plates, with relative displacement reduced by 0.5 mm compared to Condition 1. Displacement amplification follows the hierarchy Condition 3 > Condition 1 > Condition 2.

4.1.3. Acceleration Response Characteristics

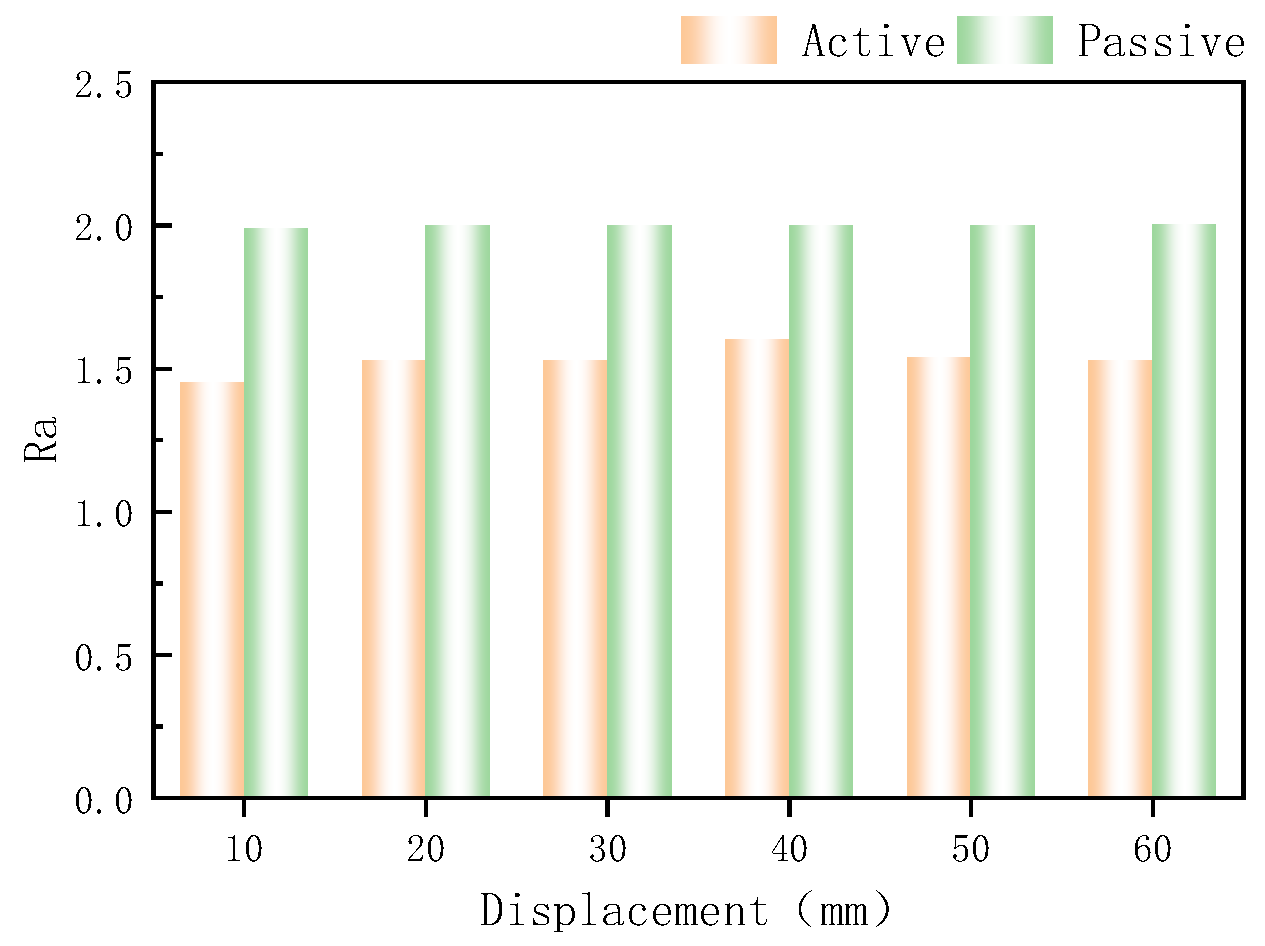
By analyzing the acceleration response characteristics at the top and bottom of transmission towers under three seismic conditions, this study reveals significant differences in structural dynamic responses due to ground motions with varying predominant frequencies, as shown in Figure 11. When the permanent displacement reaches 10 mm, the acceleration amplification factors of the active and passive plates exhibit distinct separation characteristics: the passive plate acceleration ratios stabilize at 2.0 ± 0.15, while the active plate responses display strong excitation-frequency dependence. Notably, Condition 2 yields the lowest amplification factors, whereas Condition 3 produces values twice as high as those in Condition 2, highlighting the primary component’s sensitivity to seismic spectral characteristics.

4.1.4. Analysis of Dynamic Response Results

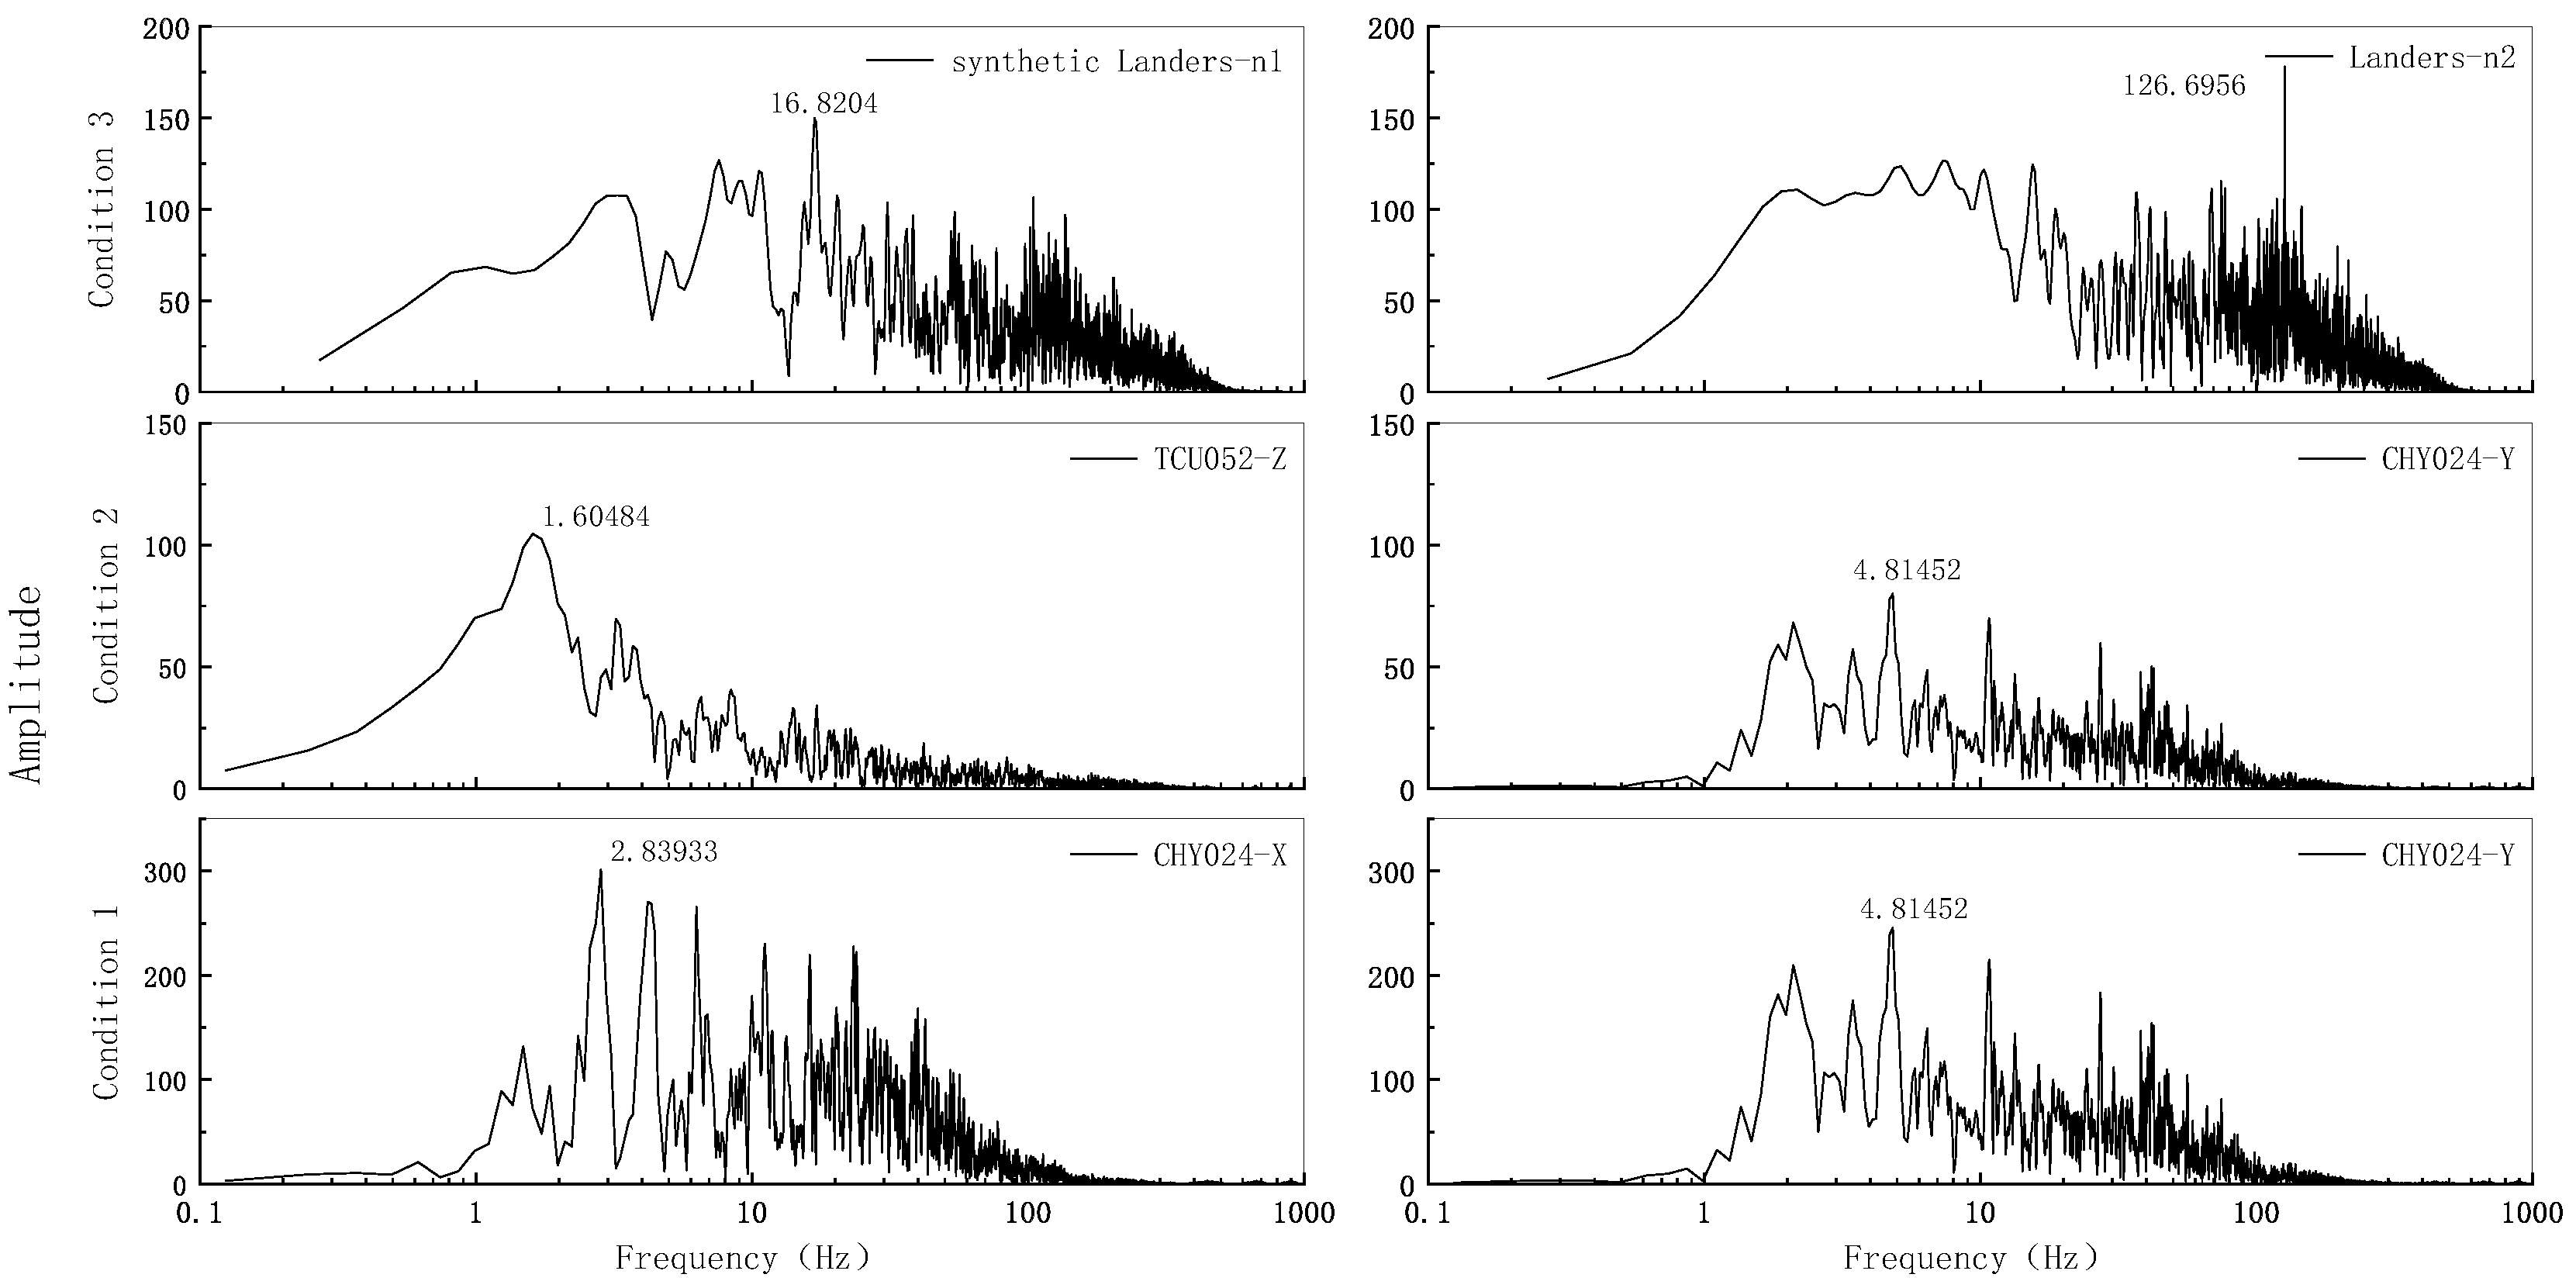
Analysis of the three seismic input conditions revealed that Condition 3 induced the most substantial structural strain under the 10 mm displacement-controlled active plate configuration. As illustrated in Figure 12, Fourier spectrum analysis indicates that Condition 3 exhibited a dominant frequency of 16.82 Hz—only 0.61 Hz below the tower’s fundamental natural frequency (17.43 Hz). This offset was significantly smaller than those of Condition 1 (2.84 Hz) and Condition 2 (1.60 Hz). When the predominant frequency of the input motion approaches the structure’s natural frequency (as in Condition 3, where the frequency difference was <5%), near-resonant effects amplify the structural response, substantially increasing the displacement amplitude at the tower’s top. This study confirms that spectral alignment between ground motion characteristics and structural natural frequencies critically determines the magnitude of transmission tower displacement responses.
This study compares the dynamic response characteristics of a transmission tower-line system under three working conditions. Condition 3 yields the highest dynamic response amplitude at Segments 11–12. Condition 2 demonstrates minimal global response but significant local strain intensification, whereas Condition 1 exhibits a stronger overall response than Condition 2, though both conditions display strain concentration at Segments 5–6. Notably, while all conditions result in an equivalent 10 mm permanent displacement, transient displacement variations lead to substantial divergence in structural dynamic responses. Strain monitoring identifies Segments 5–6 and 11–12 as structural vulnerability zones, where strain sensitivity exhibits a strong correlation with the phase characteristics of seismic motion.

4.2. Influence of Different Permanent Displacement on Tower-Line System

To investigate the influence of permanent displacement variations on the tower-line system under seismic excitation, the experiment modulates input ground motion’s permanent displacement within a range of 10–70 mm. This range corresponds to similarity ratio of fault dislocations spanning 0.4–2.8 m.

4.2.1. Strain Response Characteristics

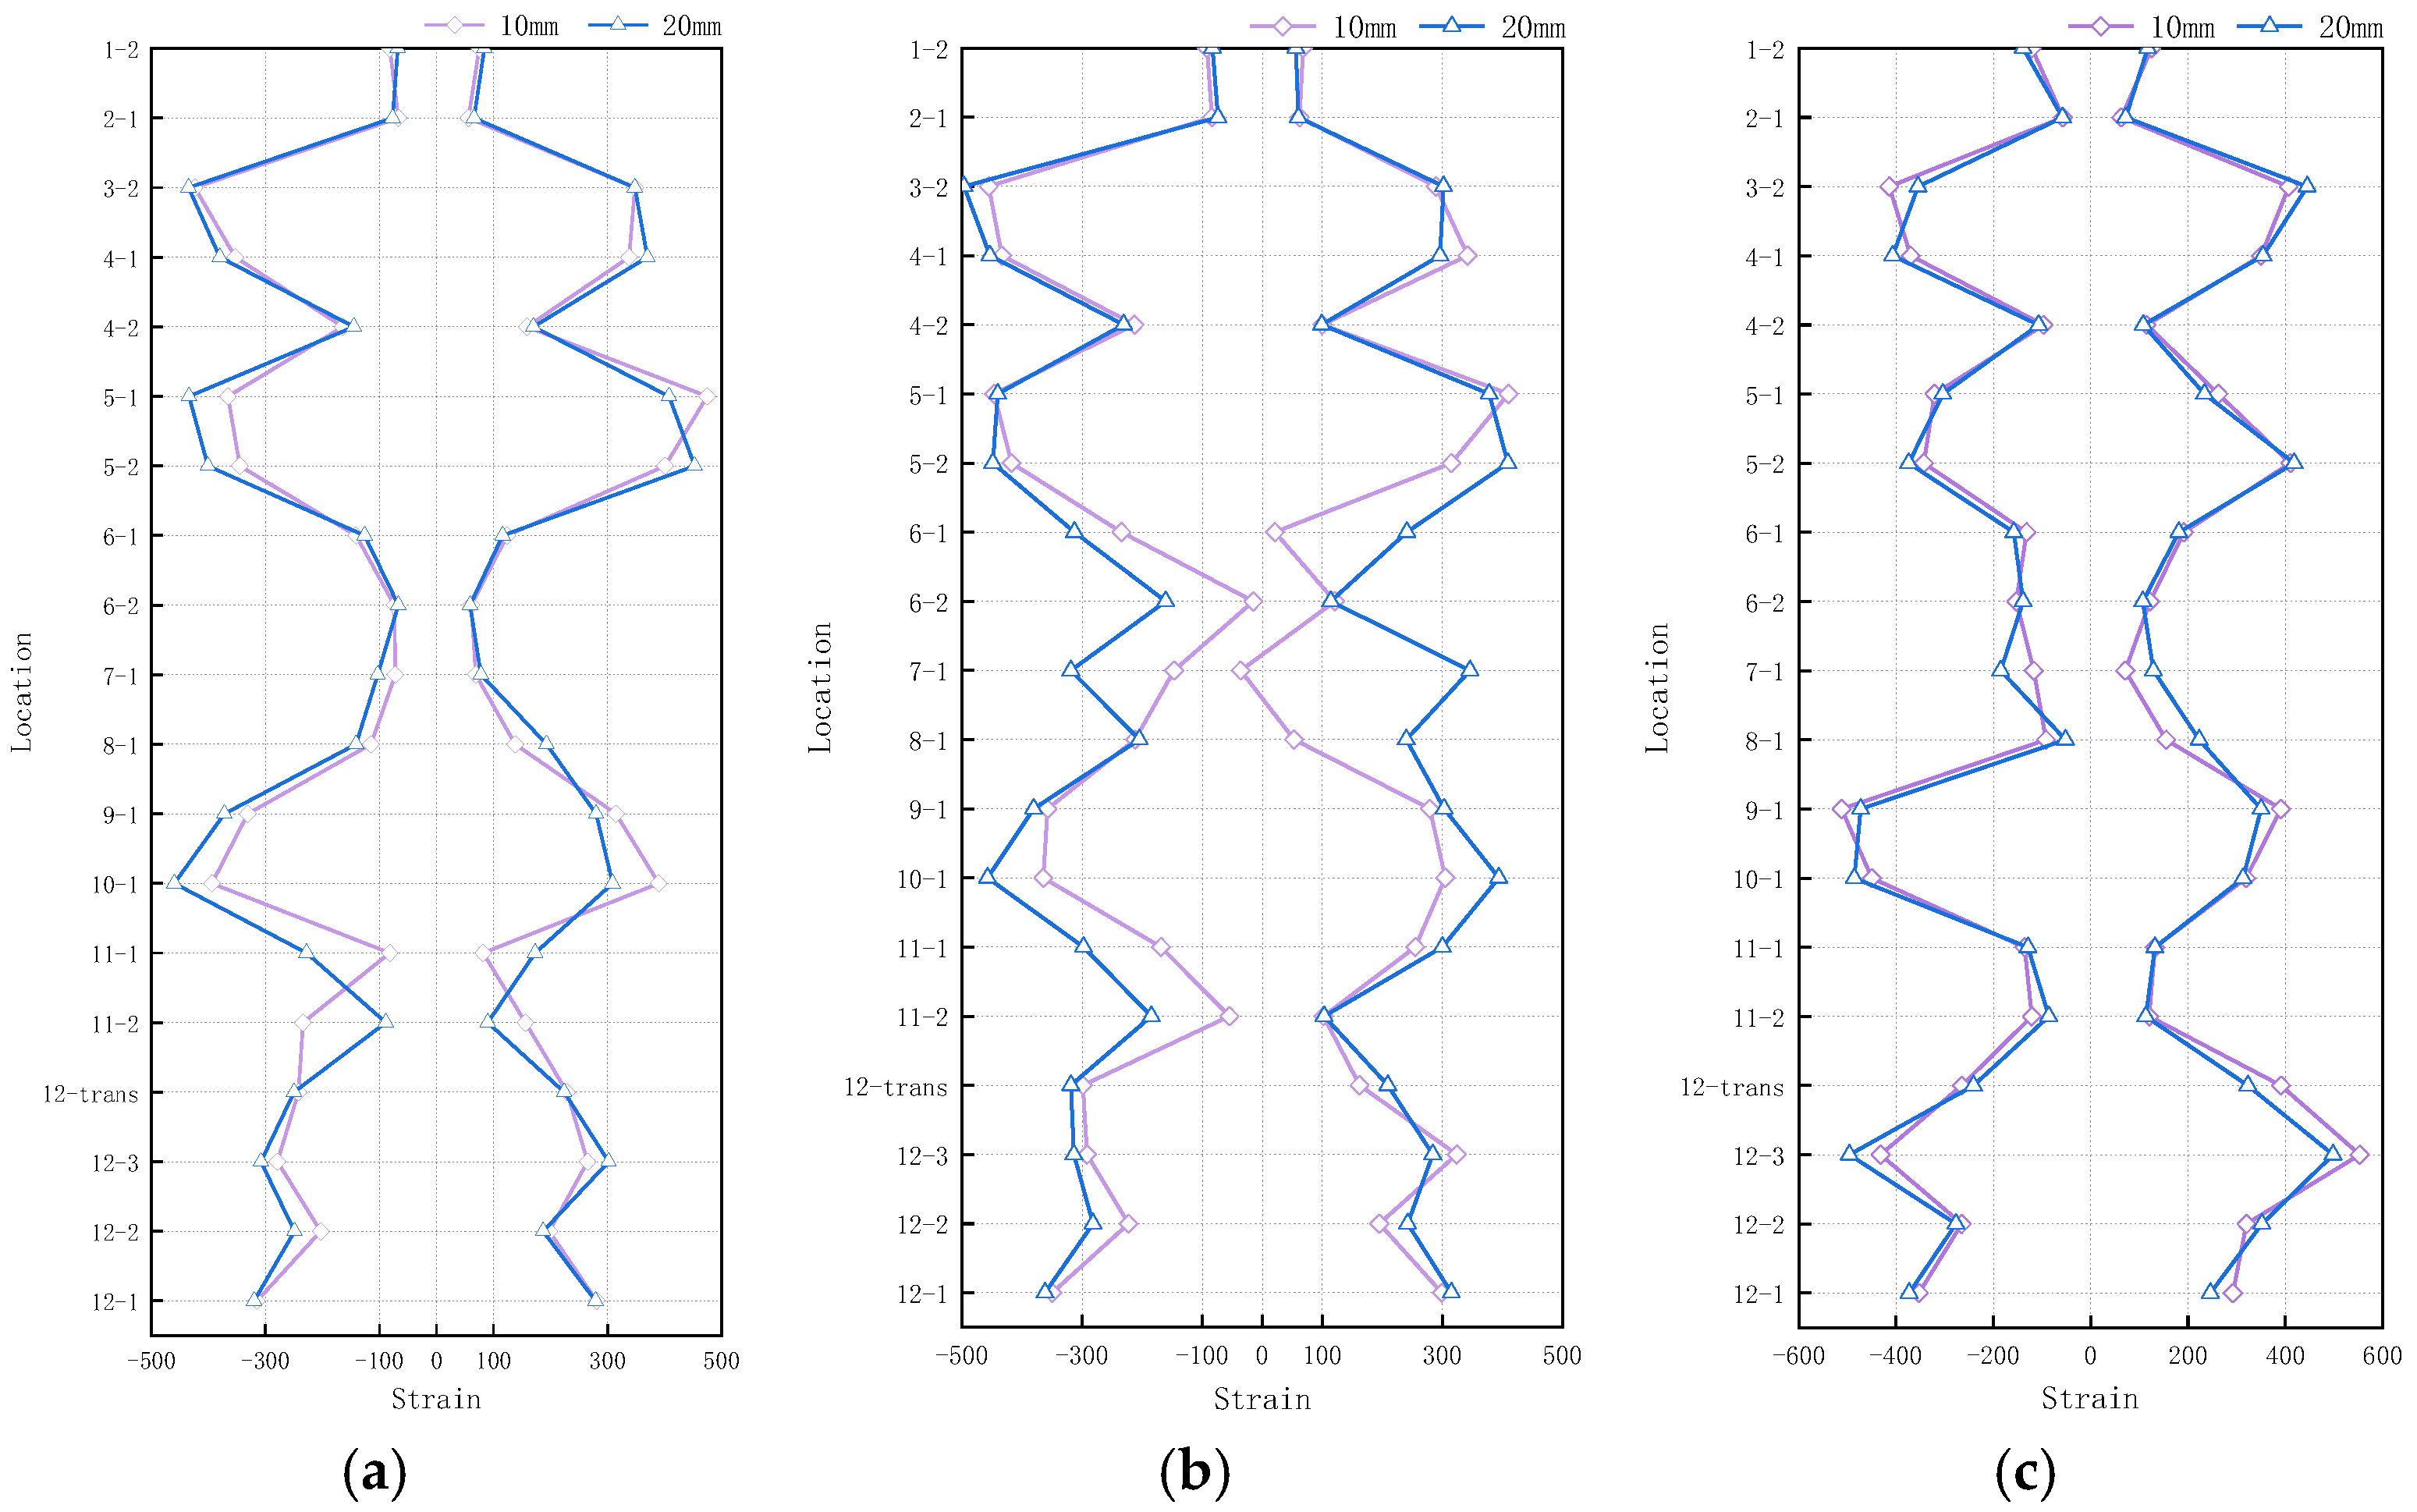
A comparative analysis of strain distributions under 10 mm and 20 mm permanent displacements for Condition 1 (Figure 13) reveals a proportional relationship between strain and permanent displacement, while the overall strain distribution pattern remains largely consistent across both displacement levels.

4.2.2. Displacement Response Characteristics

Analysis of Condition 2 test data (Figure 14) reveals that the tower-top/bottom relative displacement differential in the transmission tower-line system exhibits significant synchronous growth characteristics with increasing permanent displacement. As permanent displacement increases from 10 mm to 70 mm, the response displacement curves of the active and passive plates maintain consistent synchronization. Notably, the active plate demonstrates 2.0–2.3 times greater absolute displacement growth than the passive plate (with the active plate ranging between 0–4 mm and the passive plate between 0–2 mm). This phenomenon confirms the existence of a preferential displacement response mechanism for dominant members in tower-line coupling systems.
A comparative analysis of top–bottom relative displacement responses in transmission towers under identical seismic excitation with varying fault displacements (Figure 15) reveals three key findings: First, active and passive plate response displacements demonstrate strong correlation, with tower-top displacement increases maintaining steady fluctuations within ±8% bounds. Second, Condition 2 exhibits smaller relative displacement increases in passive plates compared to Condition 1. Third, active plate displacement increases average 1.6–3.0 times greater than passive plates in Conditions 1 and 2, while this differential reduces to 1.0–1.8 times in Condition 3. These results demonstrate that transient displacement step-changes trigger displacement responses, and increasing transient displacements alter response modes, ultimately affecting the system’s dynamic response characteristics.

4.2.3. Acceleration Response Characteristics

As shown in Figure 16, under Condition 2, the acceleration ratio between the top and bottom of both transmission towers remains constant with increasing displacement. This indicates that the response acceleration increase in the transmission towers is independent of displacement increments.

5. System Response Under Cross-Fault Input in the Parallel Tower-Line Direction

Three sets of seismic ground motions were applied to the transmission tower system along the Y-direction to simulate normal/reverse fault horizontal displacements.

5.1. Strain Response Characteristics

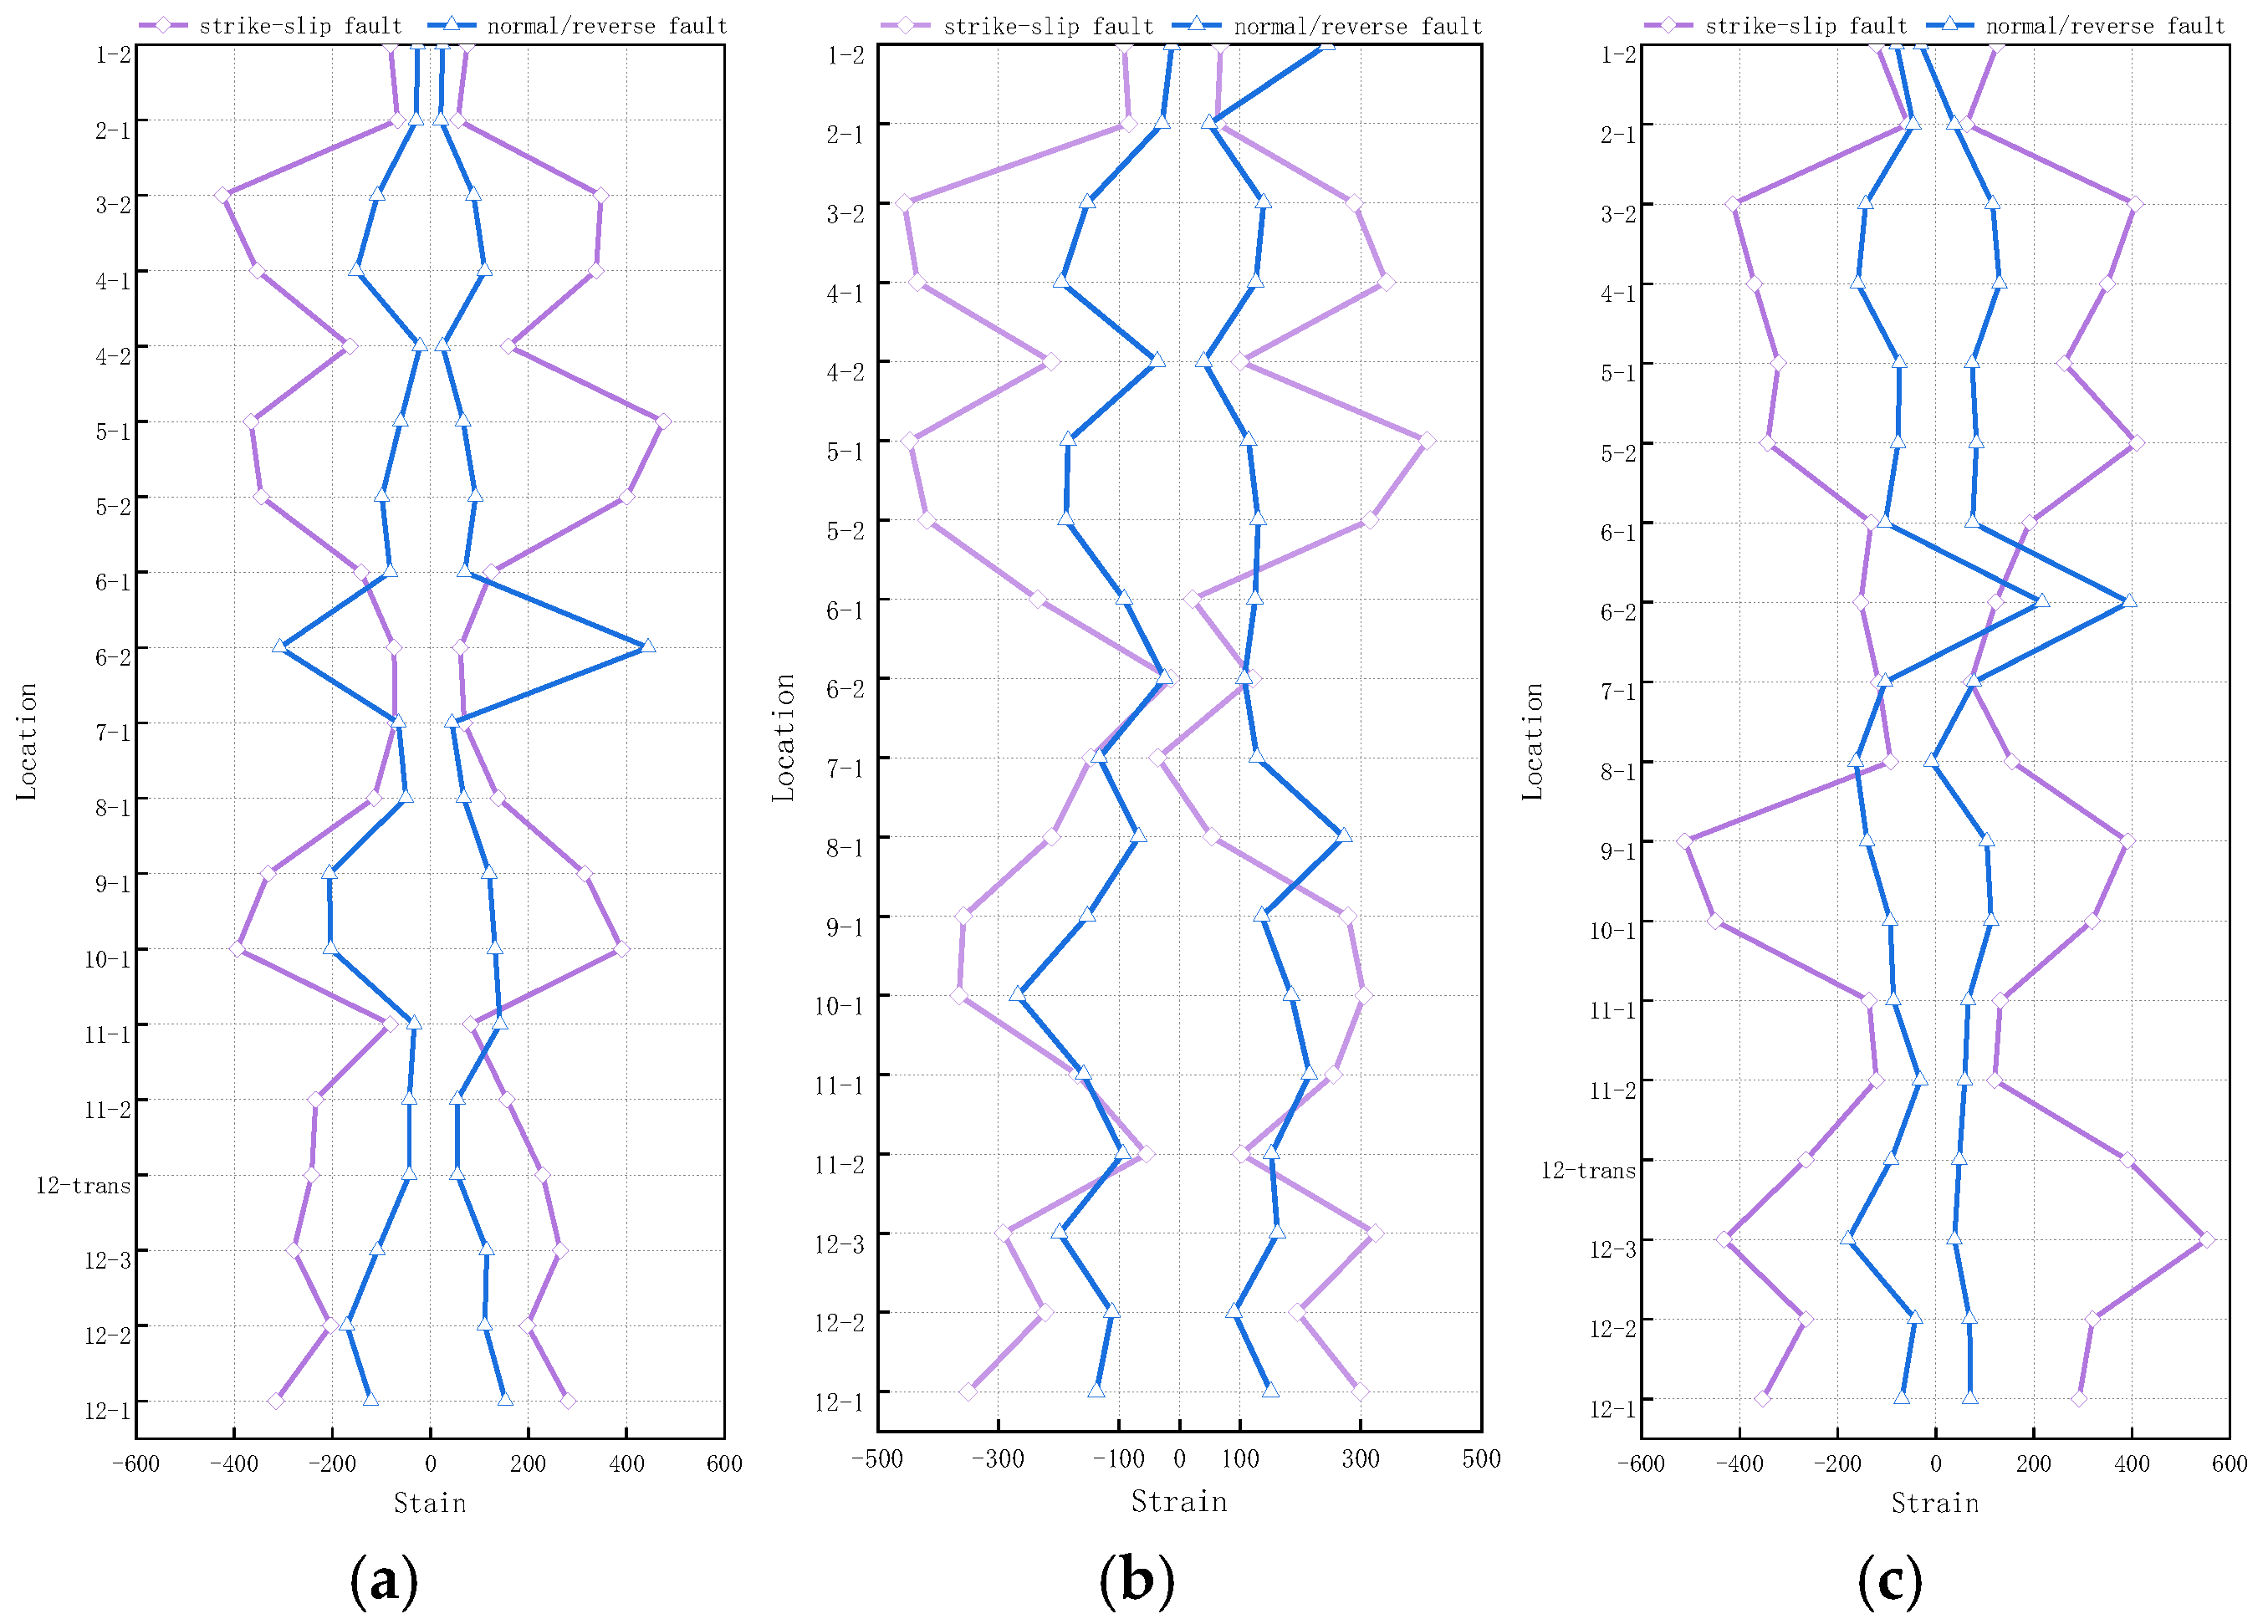
This section compares the effects of horizontal ground motions from strike-slip versus normal/reverse faults on the transmission tower-line system. Under the low-amplitude excitation (10 mm permanent displacement) shown in Figure 17, Condition 1 demonstrates a fundamental response difference: strike-slip fault motions induce maximum stress at the tower head (Segment 5), while normal/reverse fault motions generate peak stress at the adjacent Segment 6. Condition 2 reveals that strike-slip excitation maintains elevated strain at Segment 5, whereas normal/reverse fault excitation shifts the strain concentration to Segment 10. Condition 3 shows the strike-slip fault’s maximum strain migrating to the tower leg (Segment 12), contrasting with the normal/reverse fault which again produces peak stress at Segment 6. Comparative analysis indicates that while normal/reverse faults generate lower overall strain levels, they cause abrupt strain surges in localized segments, particularly Segment 6.

5.2. Displacement Response Characteristics

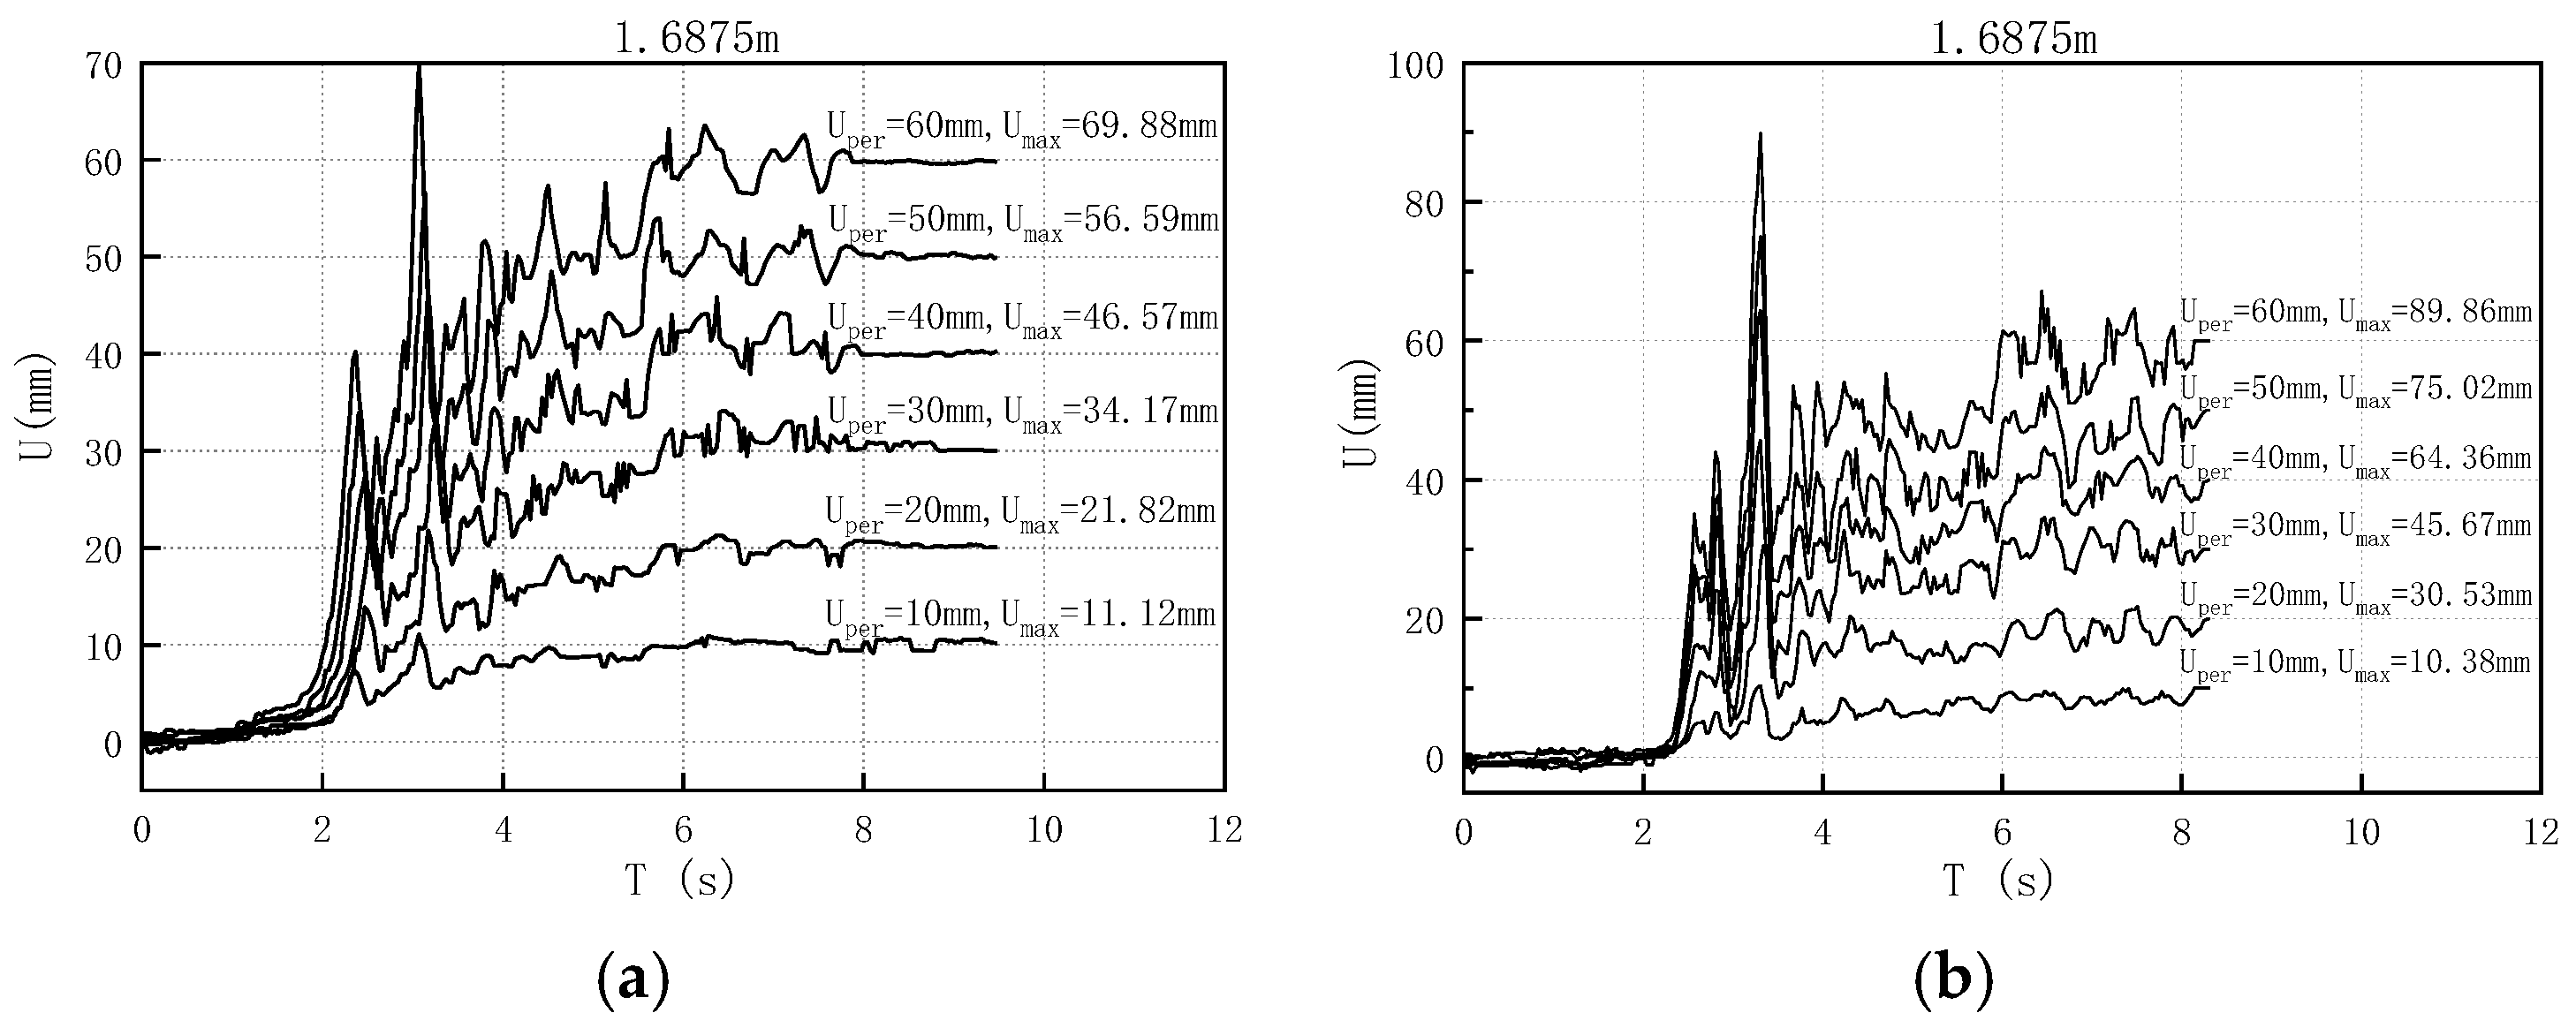
Figure 18 demonstrates the differential displacement responses of the transmission tower to distinct fault motions under varying permanent displacement conditions. Under Condition 1 (10 mm permanent displacement), normal/reverse fault motion generates a 20 mm displacement at the 1.6875 m height level—a 50% greater response compared to strike-slip fault excitation.
Figure 19 demonstrates that under Condition 3, normal/reverse fault motion generates displacement amplitudes approximately 100% greater than those induced by strike-slip motion at both monitoring heights (0.9875 m and 1.6875 m). The tower-top displacement exhibits progressive amplification with increasing permanent displacement, escalating from 1.6 to 2.1 times the base excitation. These findings reveal fundamentally distinct displacement distribution patterns between fault types, attributable to their differing energy transfer mechanisms in transmission tower systems.

6. Conclusions

This study developed a scaled transmission tower-line system model based on similarity ratios derived from actual infrastructure parameters, performing comprehensive shaking table tests. System responses were evaluated through analysis of acceleration, strain, and displacement data under both normal/reverse fault and strike-slip fault excitations, with particular emphasis on symmetry-breaking mechanisms and asymmetric damage evolution. The main conclusions are as follows:
  • The acceleration response of the tower-line system is dominated by the spectral characteristics of the ground motion, while exhibiting negligible correlation with the amplitude of input displacement. A spatiotemporally asymmetric distribution of acceleration among structural components was observed, indicating a clear deviation from ideal symmetric dynamic behavior. Notably, the acceleration fluctuation in passive plate towers was found to be 35–50% lower than that in active plate towers during seismic excitation, suggesting a significant reduction in the symmetry of the system’s inertial response.
  • Distinct damage patterns were identified in transmission towers subjected to horizontal motions from normal/reverse faults versus strike-slip faults. Nevertheless, Segments 9–10 consistently emerged as a critical vulnerable region across fault types. Under identical permanent displacement conditions, peak displacements induced by normal/reverse fault motions exceeded those from strike-slip motions by 50–100%. Accordingly, a fault-type-specific amplification factor of 1.5 is recommended for the design of towers in normal/reverse fault zones. For maintenance prioritization, special attention should be given to inspections within Segments 9–10.
  • The displacement responses of the active and passive plates demonstrated strong synchronization. As the excitation frequency approaches the natural frequency of the structure, the dynamic amplification effect is enhanced in the active plate, corroborating the mechanism of resonance response. Increased instantaneous displacement in the active plate leads to greater variability in tower displacement, whereas abrupt displacement changes in the passive plate alter the response mode of the coupled tower-line system. Additionally, step-like changes in ground motion were found to modify the dynamic characteristics of the system.
This study provides critical experimental and theoretical foundations for symmetry-aware seismic design optimization of high-voltage transmission tower-line systems, including coordinated active–passive member design, node reinforcement strategies, and fault-type correction coefficient selection. However, the conclusions are subject to limitations such as scale effects and the exclusion of vertical ground motion components. Future studies should investigate the combined influence of vertical and horizontal seismic actions.

Author Contributions

Y.W.: Writing—original draft, visualization, software, funding acquisition, data curation. X.L.: Writing—review and editing, validation, methodology, supervision, resources. X.W.: Writing—review and editing, conceptualization, methodology. M.R.: Writing—review and editing, funding acquisition, conceptualization. All authors have read and agreed to the published version of the manuscript.

Funding

This research was supported by the Key Projects of Key Laboratory of Urban Security and Disaster Engineering of China Ministry Education (2023) and the National Key R&D Program of China (2023YFC3007400).

Data Availability Statement

Data will be made available on request.

Conflicts of Interest

The authors declare that they have no known competing financial interests or personal relationships that could have appeared to influence the work reported in this paper.

References

  1. Tian, L.; Li, H.; Hou, H. Response Analysis of Transmission Tower-Line System Under Smart-1 Seismic Ground Motion Excitation. Eng. Mech. 2013, 30, 273–278. [Google Scholar]
  2. GB 50011-2010; Code for Seismic Design of Buildings, 2016 ed. China Architecture Building Press: Beijing, China, 2016. (In Chinese)
  3. Kim, J.; Nguyen, T.D.; Suleymanzade, A.; An, H.; Hong, S. Learning probabilistic symmetrization for architecture agnostic equivariance. Adv. Neural Inf. Process. Syst. 2023, 36, 18582–18612. [Google Scholar]
  4. Goel, R.K.; Chopra, A.K. Linear analysis of ordinary bridges crossing fault-rupture zones. J. Bridge Eng. 2009, 14, 203–215. [Google Scholar] [CrossRef]
  5. Gazetas, G.; Zarzouras, O.; Drosos, V.; Anastasopoulos, I. Bridge-pier caisson foundations subjected to normal and thrust faulting: Physical experiments versus numerical analysis. Meccanica 2015, 50, 341–354. [Google Scholar] [CrossRef]
  6. Yang, S.; Mavroeidis, G.P.; Ucak, A.; Tsopelas, P. Effect of ground motion filtering on the dynamic response of a seismically isolated bridge with and without fault crossing considerations. Soil Dyn. Earthq. Eng. 2017, 92, 183–191. [Google Scholar] [CrossRef]
  7. Yang, S.; Mavroeidis, G.P.; Ucak, A. Analysis of bridge structures crossing strike-slip fault rupture zones: A simple method for generating across-fault seismic ground motions. Earthq. Eng. Struct. Dyn. 2020, 49, 1281–1307. [Google Scholar] [CrossRef]
  8. Zeng, C.; Jiang, H.; Huang, L.; Guo, H.; Ma, X.; Song, G. Nonlinear seismic response characteristics of a single-tower cable-stayed bridge across a fault. China J. Highw. Transp. 2021, 34, 230–245. [Google Scholar]
  9. Hu, J.J.; Sheng, Z.Q.; Xie, L.L.; Zou, Y.L. Simulation of input ground motion and seismic response of fault-crossing structure. Earthq. Eng. Eng. Dyn. 2024, 44, 1–13. [Google Scholar]
  10. Jia, H.; Cheng, W.; Kang, W.; Zhai, Y.; Zheng, S.; Hui, Y. BPNN-predicted fault permanent dislocation and seismic response analyses of long-span suspension bridges crossing dip-slip faults. Soil Dyn. Earthq. Eng. 2024, 182, 108712. [Google Scholar]
  11. Cheng, W.; Tang, Q.H.; Jia, H.Y.; Zhong, Y.; Xu, Z.; Zheng, S.X. A prediction of fault displacement and study of seismic response of suspension bridge across fault. J. Railw. Sci. Eng. 2024, 21, 204–214. (In Chinese) [Google Scholar]
  12. Han, J.; El Naggar, M.H.; Zhao, M.; Zhong, Z.; Hou, B.; Du, X. Longitudinal response of buried pipeline under non-uniform seismic excitation from multi-point shaking table tests. Soil Dyn. Earthq. Eng. 2021, 140, 106440. [Google Scholar] [CrossRef]
  13. Guo, W.; Chen, W.Q.; He, C.J.; Jiang, L.; Wang, Y.; Guo, Z.; Yan, Q.; Zhao, L.; Lin, Y. Shaking table test research on shear behavior of cross-fault geosynthetics reinforced and pile-supported embankment. Soil Dyn. Earthq. Eng. 2022, 155, 107197. [Google Scholar]
  14. Zhang, X.; Shen, Y.; Chang, M.; Su, W.; Tao, W. Dynamic response and failure mode of a novel seismic structure for fault-crossing tunnel: Theoretical analysis and shaking table test verification. Eng. Fail. Anal. 2025, 177, 109671. [Google Scholar] [CrossRef]
  15. Li, L.; Chen, Z.; Lu, P.; Huang, Y. Dynamic response analysis of cross-fault tunnel considering source-to-structure seismic input and near-fault effect. Tunn. Undergr. Space Technol. 2025, 162, 106674. [Google Scholar] [CrossRef]
  16. Zhang, T. Effect of Sma-Utmd On Seismic Performance of Transmission Tower Line System. Master’s Thesis, Northeast Electric Power University, Changchun, China, 2023. (In Chinese). [Google Scholar]
  17. Tian, L.; Li, H.N.; Liu, G.H. Seismic Response of Power Transmission Tower-Line System Subjected to Spatially Varying Ground Motions. Math. Probl. Eng. 2010, 2010, e587317. [Google Scholar]
  18. Tian, L. Experimental Research and Response Analysis of Transmission Tower-Line System Under Multi-Component and Multi-Support Earthquake Excitations. Ph.D. Thesis, Dalian University of Technology, Dalian, China, 2011. (In Chinese). [Google Scholar]
  19. Tian, L.; Li, H.N.; Liu, G.H. Seismic Response of Power Transmission Tower-Line System Under Multi-Component Multi-Support Excitations. J. Earthq. Tsunami 2012, 6, 1250025. [Google Scholar]
  20. Tian, L.; Liu, J.C.; Pan, H.Y.; Niu, Y.H.; Guo, W. Research on shaking table test of transmission tower-line system under near-fault earthquake. China Civ. Eng. J. 2018, 51, 127–132. (In Chinese) [Google Scholar]
  21. Xie, Q.; Bai, J.; Xue, S.T. Shake table test on UHV AC double circuit transmission tower. High Volt. Eng. 2012, 38, 1410–1419. [Google Scholar]
  22. Xie, Q.; Bai, J.; Xue, S.T.; Qin, Q.Z. Shaking table test on nonlinear vibration responses of UHV transmission tower-line coupling system. Earthq. Eng. Eng. Vib. 2012, 32, 103–110. [Google Scholar]
  23. Bai, J.; Xie, Q.; Xue, S.T. Design theory and method of shaking table test model for a UHV double circuit transmission tower-line coupled system. J. Vib. Shock. 2013, 32, 47–52. [Google Scholar]
  24. Bai, J.; Xie, Q.; Xue, S.T.; Shen, D.M. Shaking table test model design for UHV latticed transmission tower-line coupling system. J. Hunan Univ. Nat. Sci. 2013, 40, 20–25. [Google Scholar]
  25. Xiong, Z.H. Experimental Study on Tower-Lines System of Ultra-High Voltage Glass-Shaped Transmission Under Multiple Array Shaking Tables. Master’s Thesis, Fuzhou University, Fuzhou, China, 2017. (In Chinese). [Google Scholar]
  26. Xin, A.Q. Experimental Research on the Cross-Fault Transmission Tower-Line System. Master’s Thesis, Shandong University, Jinan, China, 2019. (In Chinese). [Google Scholar]
  27. Wei, W.H.; Yuan, C.; Wang, H.; Hu, Y. Seismic response of transmission tower-line system under coupled horizontal and tilt ground motion. J. Build. Struct. 2019, 40, 79–88. (In Chinese) [Google Scholar]
  28. Tian, L.; Fu, Z.Y.; Pan, H.Y.; Ma, R.; Liu, Y. Experimental and numerical study on the collapse failure of long-span transmission tower-line systems subjected to extremely severe earthquakes. Earthq. Struct. 2019, 16, 513–522. [Google Scholar]
  29. Tian, L.; Dong, X.; Pan, H.; Gao, G.; Xin, A. Critical seismic incidence angle of transmission tower based on shaking table tests. Struct. Eng. Mech. 2020, 76, 251–267. [Google Scholar]
  30. Tian, L.; Bi, W.; Liu, J.; Dong, X.; Xin, A. Seismic and collapse analysis of a UHV transmission tower-line system under cross-fault ground motions. Earthq. Struct. 2020, 19, 445–457. [Google Scholar]
  31. Gai, X.; Tian, L. Collapse Analysis of Transmission Towers under Multi-dimensional Seismic Excitation Considering Hysteretic Behavior of Components. China Earthq. Eng. J. 2020, 42, 352–359. [Google Scholar]
  32. Yuan, G.Y.; Pan, H.Y.; Ma, R.S.; Tian, L. Collapse analysis of transmission tower-line system under multi-dimensional seismic excitation based on different failure criteria. World Earthq. Eng. 2019, 35, 184–192. [Google Scholar]
  33. Barenblatt, G.I. Scaling, Self-Similarity, and Intermediate Asymptotics; Cambridge University Press: Cambridge, UK, 1996. [Google Scholar]
  34. Harris, H.; Sabnis, G.M. Structural Modeling and Experimental Techniques; CRC Press: Boca Raton, FL, USA, 1999. [Google Scholar]
  35. Krawinkler, H.; Seneviratna, G.D.P.K. Pros and cons of a pushover analysis of seismic performance evaluation. Eng. Struct. 1998, 20, 452–464. [Google Scholar] [CrossRef]
  36. Moncarz, P.D.; Krawinkler, H. Theory and Application of Experimental Model Analysis in Earthquake Engineering; Stanford University: Stanford, CA, USA, 1981. [Google Scholar]
  37. Zhang, M.Z. Study on Similitude Laws for Shaking Table Tests. Earthq. Eng. Eng. Dyn. 1997, 17, 52–58. [Google Scholar]
  38. Liu, W.P. Shaking Table Test of Transmission Tower-Line System Under Different Input Directions of Multi-Dimensional Ground Motions. Master’s Thesis, Shandong University, Jinan, China, 2022. (In Chinese). [Google Scholar]
  39. Tian, L.; Li, H.N.; Huang, L.Z. Non-proportional problem in shaking table model of a power transmission tower-line system. Vib. Shock. 2012, 31, 114–118. [Google Scholar]
  40. Xie, J.J.; Wen, Z.P.; Gao, M.T. Recovery of co-seismic deformation from strong motion records during the Wenchuan earthquake. Acta Seismol. Sin. 2013, 35, 369–379. (In Chinese) [Google Scholar]
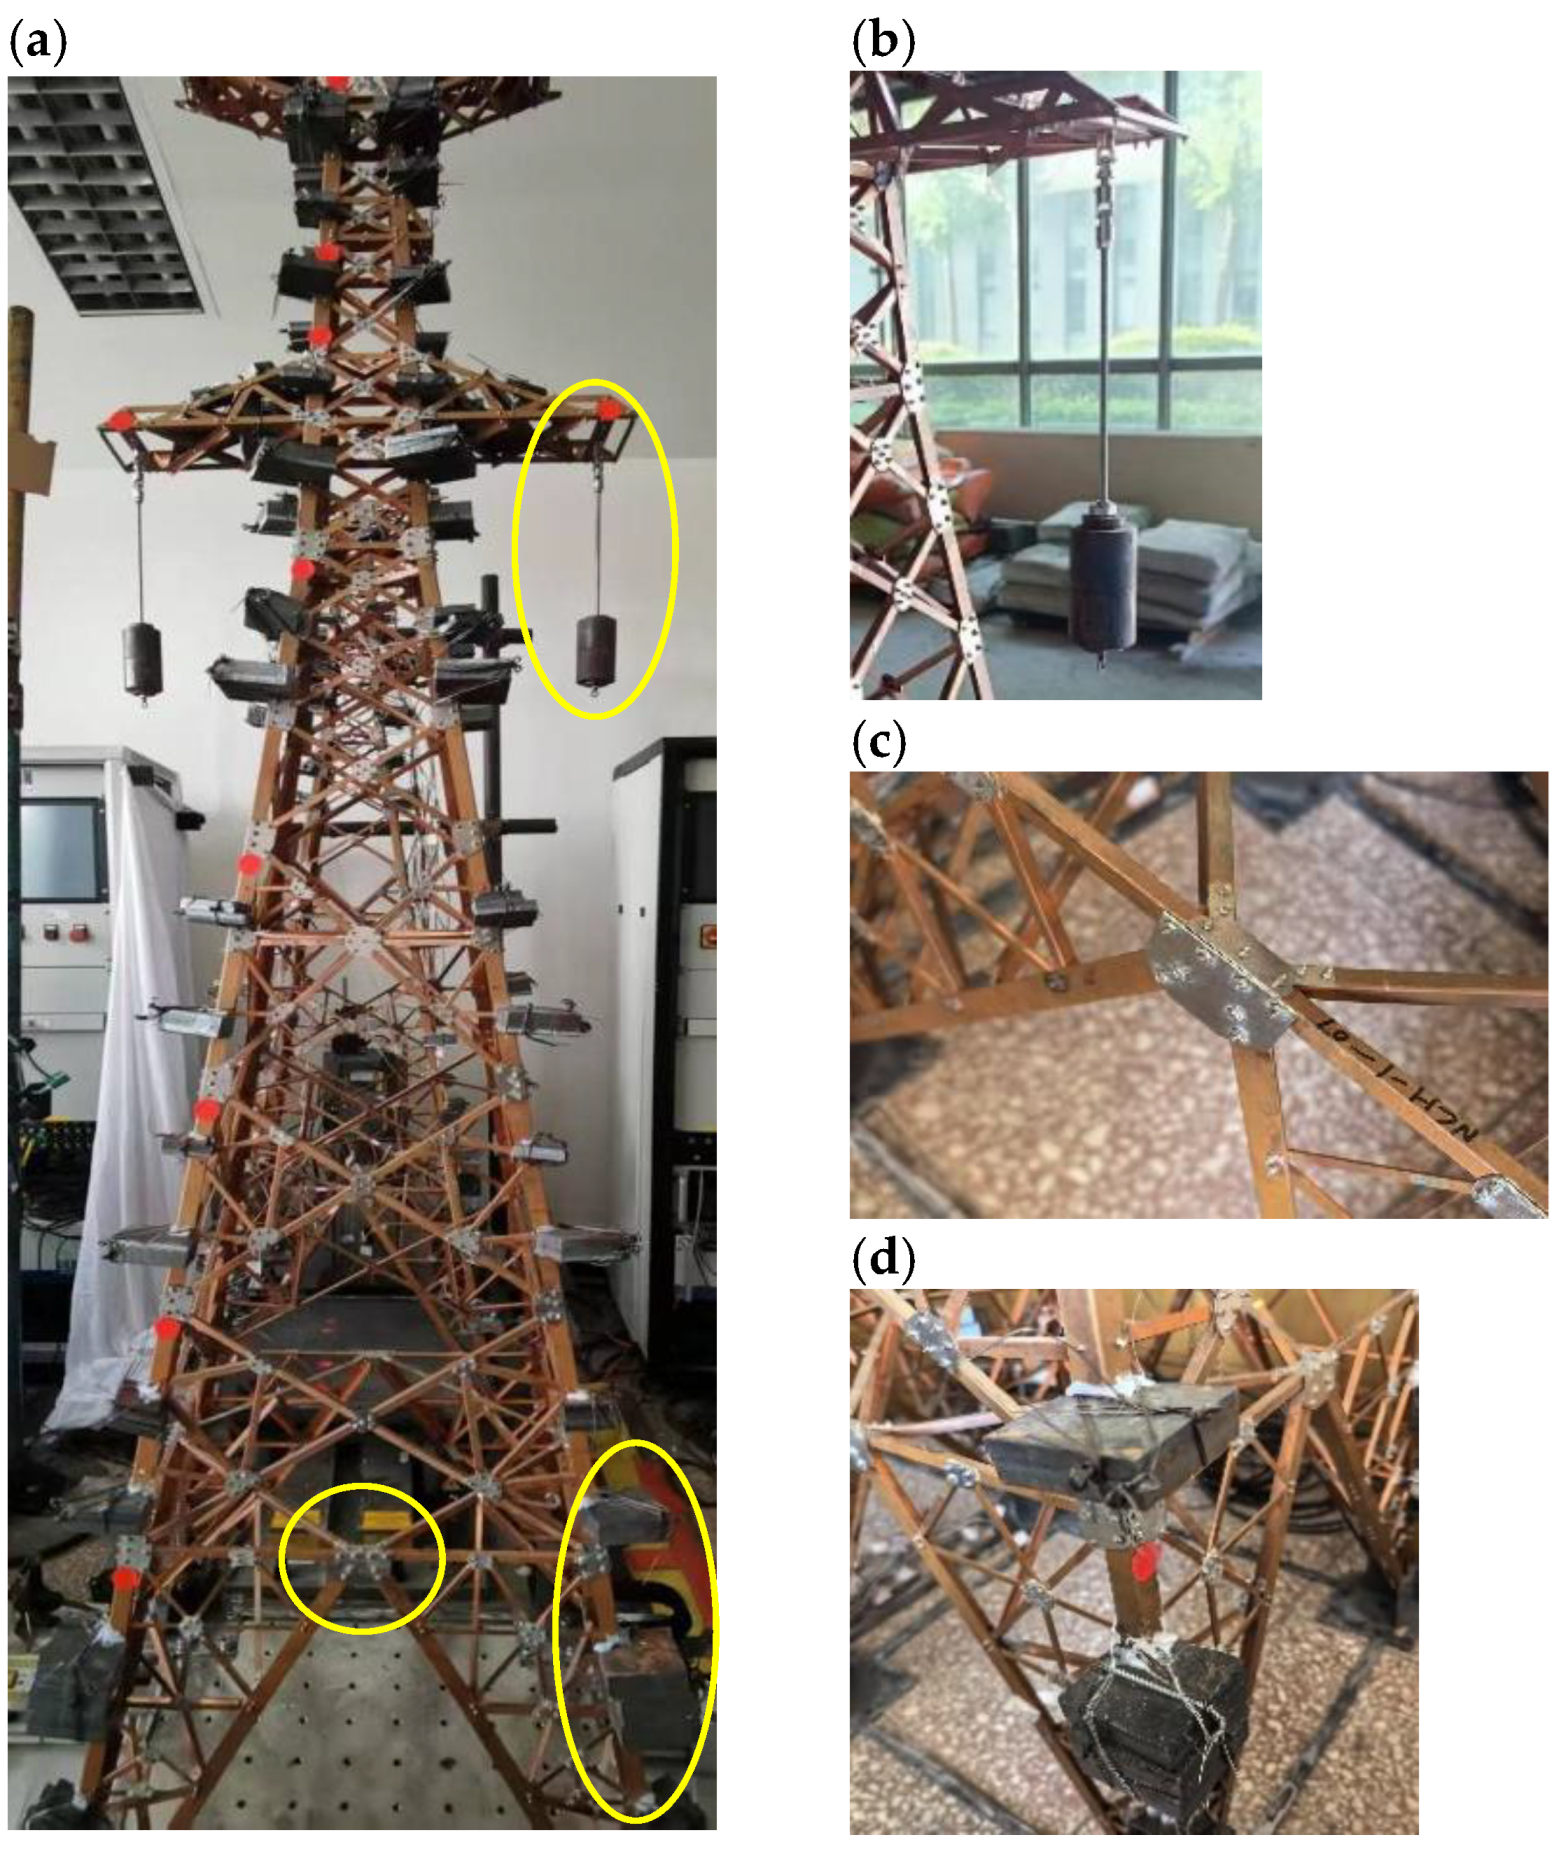
Figure 1. Modeling of 500 kV high-voltage transmission towers: (a) transmission tower, (b) insulator, (c) pylon connection, and (d) counterweight.
Symmetry 17 01646 g001
Figure 2. Electrodynamic shaking table.
Symmetry 17 01646 g002
Figure 3. Transmission tower-line system: (a) installation diagram of the laboratory, and (b) three-dimensional drawing.
Symmetry 17 01646 g003
Figure 4. Positions of strain gauges, accelerometers and displacement transducers.
Symmetry 17 01646 g004
Figure 5. Input seismic wave time diagrams and response spectra: (a) CHY024-X, (b) CHY024-Y, (c) TCU052-Z, (d) synthetic Landers-n1, (e) Landers-n2, and (f) response spectra.
Symmetry 17 01646 g005
Figure 6. Test conditions: (a) Condition 1, (b) Condition 2, and (c) Condition 3.
Symmetry 17 01646 g006
Figure 7. Nature frequency of transmission tower: (a) white noise, (b) first-order natural frequency, and (c) second-order natural frequency.
Symmetry 17 01646 g007
Figure 8. Comparison of strain under three conditions: (a) strain at the cross arm of tower, and (b) transmission tower strain.
Symmetry 17 01646 g008
Figure 9. Comparison of displacements for Condition 1 and Condition 3: (a) displacement at 1.6875 m for Condition 1, (b) displacement at 0.85 m for Condition 1, (c) displacement at 0.425 m for Condition 1, (d) displacement at 1.6875 m for Condition 3, (e) displacement at 0.85 m for Condition 3, and (f) displacement at 0.425 m for Condition 3.
Symmetry 17 01646 g009
Figure 10. Comparison of relative top–bottom displacements of transmission towers under three conditions.
Symmetry 17 01646 g010
Figure 11. Top-to-base acceleration amplification ratios of the transmission tower under three input conditions.
Symmetry 17 01646 g011
Figure 12. Fourier spectrum and response spectrum of ground motion.
Symmetry 17 01646 g012
Figure 13. Strain response at permanent displacements of 10 and 20 mm for three conditions: (a) Condition 1, (b) Condition 2, and (c) Condition 3.
Symmetry 17 01646 g013
Figure 14. Relative displacement of top–bottom of tower for Condition 2: (a) active plate, and (b) passive plate.
Symmetry 17 01646 g014
Figure 15. Comparison of displacement increase under three conditions: (a) Condition 1, (b) Condition 2, and (c) Condition 3.
Symmetry 17 01646 g015
Figure 16. Acceleration response ratio versus permanent displacement under Condition 2.
Symmetry 17 01646 g016
Figure 17. Strain response for three conditions under horizontal motion of strike-slip and forward-reversal faults: (a) Condition 1, (b) Condition 2, and (c) Condition 3.
Symmetry 17 01646 g017
Figure 18. Displacement response to different faults horizontal motion under Condition 1: (a) strike-slip fault, and (b) normal/reverse fault.
Symmetry 17 01646 g018
Figure 19. Comparative displacement response of the transmission tower to different fault horizontal motion under condition 3: (a) displacement at 0.85 m under normal/reverse fault, (b) displacement at 1.8625 m under normal/reverse fault, (c) displacement at 0.85 m under strike-slip fault, and (d) displacement at 1.8625 m under strike-slip fault.
Symmetry 17 01646 g019
Table 1. Kinetic similarity relationship.
TypeSimilarity RatioFormulaValue
Geometric* Length S l 1/40
* Elastic modulus S E 1/2
Cross-sectional area S A 1/261.3
PhysicalDensity S ρ = S E / ( S L   S a ) 6.67
Mass S m = S ρ S l S A 1/1567
DynamicTime S t = S l / S a 0.09
Frequency S f = 1 / S t 10.95
* Acceleration S a 3
Note: * Basic similarity relationship.
Table 2. Model material.
NameSectionMaterialUnitSize
Transmission TowerPrimary membersAngle coppermmL15 × 1
diagonal membersL7 × 0.5
OthersL5 × 0.5
Transmission LineConductorsSteel wiremmD3
GroundD1.5
Insulator stringConductors wireSteel rodsmm263
Ground wire20
Table 3. Test program.
NameDirectionConditionWith Permanent DisplacementSeismic Wave
The horizontal component of a strike-slip faultX-direction (vertical line)Condition 1Yes (active plate)CHY024-X
No (passive plate)CHY024-Y
Condition 2Yes (active plate)TCU052-Z
No (passive plate)CHY024-Y
Condition 3Yes (active plate)synthetic landers-n1
No (passive plate)landers-n2
The horizontal component of a normal-reverse faultY-direction (Parallel line)Condition 1Yes (active plate)CHY024-X
No (passive plate)CHY024-Y
Condition 2Yes (active plate)TCU052-Z
No (passive plate)CHY024-Y
Condition 3Yes (active plate)synthetic landers-n1
No (passive plate)landers-n2
Table 4. Basic features of the two selected records from the PEER Ground Motion Database.
NGAEarthquake NameYearStation NameMwVs30
(m/s)
PGA
(g)
Rx
(km)
Site Condition
1193Chi-Chi_Taiwan1999CHY0247.62427.730.239.62C
1492Chi-Chi_Taiwan1999TCU0527.62579.10.401.2C
879Landers1992Barstow7.2813690.7272.19B
Disclaimer/Publisher’s Note: The statements, opinions and data contained in all publications are solely those of the individual author(s) and contributor(s) and not of MDPI and/or the editor(s). MDPI and/or the editor(s) disclaim responsibility for any injury to people or property resulting from any ideas, methods, instructions or products referred to in the content.