Article

Far Transfer Effects of Multi-Task Gamified Cognitive Training on Simulated Flight: Short-Term Theta and Alpha Signal Changes and Asymmetry Changes

1
School of Information Science and Engineering, Yanshan University, Qinhuangdao 066004, China
2
Hebei Key Laboratory of Information Transmission and Signal Processing, Yanshan University, Qinhuangdao 066004, China
3
Intelligent Control System R&D Department, Computer Application Technology Research Institute, China Ordnance Industry, Beijing 100089, China
4
The Department of Anesthesiology, Peking University Third Hospital, Beijing 100191, China
5
State Key Laboratory of Cognitive Neuroscience and Learning, Faculty of Psychology, Beijing Normal University, Beijing 100875, China
*
Authors to whom correspondence should be addressed.
Symmetry 2025, 17(10), 1627; https://doi.org/10.3390/sym17101627
Submission received: 22 August 2025 / Revised: 22 September 2025 / Accepted: 26 September 2025 / Published: 1 October 2025
(This article belongs to the Special Issue Advances in Symmetry/Asymmetry and Biomedical Engineering)

Abstract

Cognitive deficiencies are significant factors affecting aviation piloting capabilities. However, due to the limited stability resulting from the insufficient appeal of traditional attention or memory cognitive training, multi-task gamified cognitive training (MTGCT) may be more beneficial in generating far transfer effects in task performance. This study explores the enhancement effects of simulated flight operation capabilities based on visuo-spatial attention and working memory MTGCT. Additionally, we explore the neurophysiological impacts through changes in EEG power spectral density (PSD) characteristics and brain asymmetry, and whether these impacts exhibit a certain retention effect. This study designed a 28-day simulated flight operation capability enhancement experiment. In addition, the behavioral performance and EEG signal changes in 28 college students (divided into control and training groups) were analyzed. The results indicated that MTGCT significantly enhanced simulated flight operational capabilities, and the neural framework formed by physiological changes remains effective for at least two weeks. The physiological changes included a decrease in the θ band PSD and an increase in the α band PSD in the frontal and parietal lobes due to optimized cognitive resource allocation, as well as the frontal θ band leftward asymmetry and the frontoparietal α band rightward asymmetry due to the formation of neural activity patterns. These findings support, to some extent, the feasibility and effectiveness of using MTGCT as a periodic training method to enhance the operational and cognitive abilities of aviation personnel.

1. Introduction

Aviation piloting is a critical and high-risk profession, both in military and civilian contexts. The ability of pilots to respond calmly and accurately to various demanding conditions, such as extreme weather, is of paramount importance. Notably, flying under deteriorating weather conditions is a significant cause of fatal accidents in general aviation [1]. In such scenarios, pilots often face significant judgment challenges and find it difficult to make accurate decisions independently. Human error is a major contributing factor to these accidents [2]. At this time, the requirement for the pilots’ operational capability to receive and quickly and accurately execute the commands of the lighthouse personnel is extremely high. However, complex environments increase brain load, potentially impairing pilots’ ability to execute concurrent tasks during emergency flights [3]. Therefore, it is essential to develop training methods that enhance pilots’ execution capabilities under special conditions in the aviation domain.
Current training methods primarily focus on adjusting training modalities or environments. Callan et al. examined training pilots’ auditory signal recognition abilities under complex noise environments [4]. Weelden et al. compared the training effects of desktop 2D and VR 3D environments for pilots [5]. Zhao et al. explored the impact of different task types and task difficulties on pilot training [6]. Nonetheless, these methods cannot simulate all environmental conditions, and cognitive deficiencies under special circumstances remain a significant factor leading to crew errors [2,7]. Pilots’ cognitive functions also change under severe hypoxia [8]. Zhou et al. investigated cognitive recognition under different tasks in simulated flight training [9]. Understanding the changes in operators’ cognitive abilities is crucial for assessing operational levels, improving training efficacy, and developing safer and healthier training systems. Cognitive issues in cockpit human-machine interaction systems are also a hotspot in the human factors research of large-scale complex systems like aviation, aerospace, and maritime [10]. In complex and dynamic flight operations, attention and memory play essential roles in task decision-making and execution [9]. Attention and working memory are regarded as key components that form executive functions together with impulse control, response inhibition, adaptation, and decision-making. Higher-order cognitive abilities enable individuals to exert self-control and successfully complete goal-directed tasks [11]. Sturman et al. highlighted that high levels of attention are necessary for effective task performance [12]. Cui et al. demonstrated that operators face high demands on attention allocation when executing multiple dynamic tasks [13]. Kobayashi et al. found a strong correlation between the performance level in visual memory tasks and prefrontal activation, and provided auxiliary information related to working memory [14]. Therefore, cognitive training, as an alternative approach to improve cognitive abilities, has broad prospects [15].
Improvement in performance on tasks involving the same cognitive abilities and highly similar following specific cognitive task training is referred to as near transfer. In contrast, improvement in performance on tasks involving broader cognitive abilities and less similar tasks is referred to as far transfer. Orienting cognitive training can positively impact cognitive abilities, thereby improving performance in practical operations [16]. Even so, the experimental results regarding Jaeggi et al.’s working memory training enhancing fluid intelligence ( G f ) have been contentious [17]. The variability in research findings may be due to inconsistent levels of participation and motivation among users in traditional cognitive training. High-immersion simulated game training can effectively achieve the goals of orienting cognitive training. Even playing video games can enhance perceptual or cognitive abilities [18]. Bavelier et al. found that game training can enhance visual attention and the distribution of spatial attention [19]. It is noteworthy that compared to single-task training, multi-task training is more effective in improving attention and memory [20]. Given that attention and working memory might underpin most cognitive functions, game-based computerized cognitive training (GCCT) focusing on these two abilities may produce transfer effects on task-switching performance [21]. The Attention Network Test (ANT), a classic psychological testing tool, enables training aimed at visuo-spatial attention [22]. This tool was initially used to simultaneously assess the functions of alerting, orienting, and executive control networks, which are three independent but interrelated neural systems that constitute attention-related cognitive functions [23]. Specific ANT training can also enhance participants’ performance in these network functions, particularly the improvement of orienting ability could enhance individuals’ capacity to rapidly shift attention in visual space. However, traditional ANT is often not engaging, and its effectiveness is significantly reduced when stable training performance is required over longer testing phases and repeated testing (such as in longitudinal studies or remedial programs), or when participants easily become bored during testing. Therefore, M. Klein et al. developed a game-like driving task, The AttentionTrip [24]. This task involves a scenario of “driving a spaceship through a wormhole,” requiring different responses to green and blue targets. The scenario design aims to engage participants in an attractive ANT task. Based on this, we incorporated the dual-N-back working memory paradigm to develop a cognitive training software variant for visuo-spatial attention and working memory. The N-back paradigm is commonly used to induce varying levels of brain load and detect working memory metrics [25]. It requires participants to compare currently presented information with information presented N trials earlier and make corresponding judgments. Typically, the higher the N value, the greater the demand on working memory. Dual-N-back increases task complexity by integrating multiple information sources [26], making the training method more challenging. Although the brain regions associated with the training tasks may vary depending on the sensory modality, cognitive training of higher cognitive functions, such as working memory training or attention training, may exhibit far transfer effects [15]. In addition, visuo-spatial attention and working memory are essential for flight operations [27]; the improvements in these cognitive abilities could further enhance pilots’ far transfer performance.
Understanding the neural processes behind cognitive training is crucial for developing systems that enhance the cognitive abilities of drivers [15]. While various neuroimaging techniques such as functional magnetic resonance imaging (fMRI), positron emission tomography (PET), and functional near-infrared spectroscopy (fNIRS) can capture brain activation changes during cognitive training, electroencephalography (EEG) has garnered significant interest and widespread use among researchers due to its low cost, portability, and high temporal resolution. Oscillatory activities in specific frequency bands (e.g., α band suppression associated with attentional engagement, θ band enhancement linked to working memory load) have been widely recognized as sensitive neural markers of visuo-spatial attention and working memory load [28,29]. After continuous 24-h language tasks or visuomotor tasks, θ activity in task-related brain regions increases, accompanied by increased sleep pressure [30]. Zhao et al. revealed the potential of quantifiable EEG metrics in capturing hidden cognitive patterns during pilot training through EEG microstate analysis [6]. Aricò et al. classified and assessed multiple levels of mental workload based on the power spectral density (PSD) of EEG frequency bands ( θ and α ) involved in mental workload estimation [31]. Furthermore, recent studies have highlighted that brain asymmetry plasticity may occur in physiological, disruptive injury, and pathological evolutions, and learning and training can also lead to changes in regional asymmetry [32]. Liu et al. found that the visual and attentional systems exhibit rightward asymmetry [33]. Sun et al. conducted a graph theory analysis of brain functional connectivity in the α band under fatigue conditions, revealing a rightward bias in frontoparietal regions associated with sustained attention [34]. The α band asymmetry is also formed during long-term memory and cognitive differentiation processes and can serve as a predictor of behavioral functions [11]. Studies have shown that physiological traces left by task processes can be detected using EEG. During visual sequence learning tasks, θ and α changes occur in frontal and posterior regions, with a significant increase in α power in the right occipitoparietal region after task completion [35]. Concurrently, EEG can track brain activity changes during training. Some cognitive training studies aimed at enhancing executive functions have found changes in the θ band due to training [11]. Borghini et al. conducted a 5-day cognitive training using the Multi-Attribute Task Battery (MATB) and found that the PSD of frontal θ and parietal α changed with cognitive demand induced by the training [15].
During the training process, the improvement in cognitive function leading to enhanced specific task abilities and neural physiological changes may have a certain retention effect. Paradela et al. summarized through a meta-analysis that the Cogmed Working Memory Training (CWMT) intervention resulted in significant short-term improvements in verbal and visuo-spatial working memory, and no significant differences were found within a period of less than 2 months [36]. Guo et al. found that combining transcranial direct current stimulation (tDCS) with cognitive training could improve individual response inhibition, with long-term effects lasting about a month [37]. Participants who underwent music and visual arts training exhibited enhanced auditory evoked responses to piano tones, with the enhancement effect lasting up to three months, demonstrating the persistence of neuroplasticity effects [38]. In the scenario of flight operation tasks, the retention effects of operational level improvements and neural feature changes following orienting cognitive training remain to be studied, which is crucial for developing an effective periodic cognitive training scheme.
To explore the effectiveness of visuo-spatial attention and working memory multi-task gamified cognitive training (MTGCT) in enhancing flight operation capabilities and the underlying neurophysiological mechanisms, we firstly designed a 28-day experiment to enhance simulated flight operational performances. The experiment followed a five-phase longitudinal design including pre-test, training, post-test, retention, and tracking test. Then, we analyzed the operational performance data of the training group and the control group who did not undergo cognitive training at three phases: pre-test, post-test, and tracking test, to assess the significance of the improvement effect of MTGCT on simulated flight operation tasks. Finally, we explored the neurophysiological basis of MTGCT through EEG PSD changes and brain asymmetry changes, as well as the retention effects of these changes.
The remainder of this paper is organized as follows: Section 2 details the MTGCT method and experimental details. Section 3 reveals the impact of orienting training in visuo-spatial attention and working memory on simulated flight operation tasks through behavioral data, EEG band PSD, and asymmetry analysis results. Section 4 further explores the process of EEG band PSD and asymmetry changes caused by cognitive training, aiming to explain the potential neural feature changes underlying these mechanisms. Section 5 describes the limitations of this paper and the future research plans, while Section 6 summarizes the content of this paper.

2. Materials and Methods

2.1. Multi-Task Gamified Cognitive Training (MTGCT) Method Design

The benefits of working memory cognitive training can transfer to other broader cognitive abilities, such as cognitive control mechanisms, reading comprehension, and adaptability to new problems [15]. G f is a key factor related to various cognitive tasks. Jaeggi et al. demonstrated that the degree of improvement in G f is positively correlated with the amount of training, indicating a dose-dependence [26]. Dual N-back training can effectively enhance working memory, and the training effects can generalize to other tasks involving executive functions [39]. Li et al. discovered that dual-N-back training has a superior far transfer effect [40]. Liu et al. found that due to potential neural process similarity in attention tasks, brain resource sharing leads to transfer effects between different sensory channels, and visual attention can be improved through adaptive force control tasks (AFCT) [41]. However, some research findings indicate that CWMT does not exhibit far transfer effects in tasks that are not directly related, and the transfer effect depends on the similarity between the training tasks and the actual tasks [42]. Traditional cognitive training tasks may lack the integration of comprehensive elements from the real world, and customizing cognitive training programs to meet the specific needs of different populations is an effective method for addressing such issues in the future [36]. For example, in the field of driving, after an 8-week comprehensive cognitive training that integrates various cognitive function tasks involved in driving, participants showed a significant reduction in traffic violations [43]. Compared to single-task cognitive training, multi-task cognitive training is more conducive to improving attention and memory [20]. At the same time, incorporating game elements into training environments can enhance engagement and universality, commonly referred to as gamification or the development of serious games [36,43]. Some meta-analyses have indicated that gamified learning approaches outperform traditional methods. Attention network training through video games can effectively improve attention [20,44].
In this study, we utilized the MTGCT method to comprehensively enhance cognitive functions while maximizing participants’ interest and engagement. The framework of the MTGCT method is illustrated in Figure 1. Since visuo-spatial attention and working memory are the main cognitive functions involved in flight operations, this study gamified the ANT and dual-N-back paradigms based on the ANT driving game developed by M. Klein et al. [24], as shown in Figure 2a. We hypothesize that the cognitive function improvements resulting from enhanced visuo-spatial attention and working memory will lead to far transfer effects in simulated flight tasks. This transfer is reflected in changes in neurophysiological characteristics and improvements in simulated flight operations performance, and it exhibits a certain retention effect after a period of time.

2.2. Experimental Protocol

The pre-test, post-test, and tracking test phases all assess the participants in the form of task tests, with consistent test content, including a simulated flight operation test and a traditional cognitive test, as shown in Figure 2c,d. These three phases recorded both EEG data and behavioral data from the participants. The performance in the simulated flight operation test was the primary focus of this study. This test was conducted on a computer running the Windows operating system, with flight operation scenarios rendered through X-Plane 12. X-Plane is a flight simulation software developed by Laminar Research and has been utilized in numerous flight simulation studies [4,6,45]. Additionally, the X-Plane software allows users to access real-time flight data via the UDP protocol. During the experiment, participants controlled the aircraft’s altitude and heading using a joystick and completed prescribed tasks by reading the cockpit’s instrument panel. Before the pre-test, all participants received instructions on operation techniques from the researchers and engaged in adaptive practice. The simulated flight operation test consisted of a baseline task and eight simulated flight operation tasks, which were divided into altitude adjustment and heading adjustment tasks. The specific task details are shown in Figure 2c. In the altitude adjustment task, operators were required to maintain a climb rate of 500–1000 ft/min, ensuring it did not exceed 1000 ft/min. In the heading adjustment task, operators were required to maintain a turn coordinator (TC) L/R 20° standard turn angle for the turn. This test aimed to assess participants’ ability to receive and execute flight commands quickly and accurately, necessitating completion within a specified time. The ANT procedure used in this study was consistent with [22], with each trial lasting a total of 4 s. The ANT experiment comprised six task blocks, each requiring responses to 20 trials. The N-back test required participants to determine whether the current numeric stimulus matched the one presented N trials earlier. The N-back procedure in this study was performed sequentially from 0-back to 7-back. Each task-block required responses to 20 trials, with each trial consisting of a 1-s numeric stimulus followed by a 2-s interval. Based on task difficulty, it was categorized into four levels to assess participants’ cognitive abilities: low cognitive load (0-back to 1-back), moderate cognitive load (2-back to 3-back), high cognitive load (4-back to 5-back), and ultra-high cognitive load (6-back to 7-back) [46,47]. There was a 40-second rest interval between each difficulty level to allow participants to recover. Schematic diagrams of the experimental paradigms of the two tests are shown in Figure 2d.
The training period involved an 11-day continuous cognitive training focused on visuo-spatial attention and working memory for the TG participants. The specific training content each day includes 30 min of spaceship flight game ANT training and 30 min of spaceship flight game dual-N-back training, as shown in Figure 2a. During the training process, the EEG data and behavioral data of the subjects were not recorded. The spaceship flight game ANT training procedure was consistent with [22]. The difference was that participants had to judge the central target type appearing around the spaceship. If the target was a green triangle, they pressed the joystick’s index finger button. If it was a blue square, they pressed the joystick’s little finger button. The spaceship flight game dual-N-back training procedure was based on the above-mentioned traditional N-back test, modeled after the dual N-back task procedure by Jaeggi et al. [26], and included eight spatial stimuli. Participants had to judge the number and location of blue squares simultaneously. If the number matched, they pressed the joystick’s index finger button. If the location matched, they pressed the joystick’s little finger button. If both the number and location matched, they had to press both the index finger and little finger buttons simultaneously. No response was required if they did not match. Since dual N-back is a more complex task, the difficulty level was adaptive. If participants’ accuracy reached 80%, the level of “N” increased by one, but if accuracy fell below 60%, the level of “N” decreased by one.

2.3. Participants

Forty-six healthy male student participants from Yanshan University were recruited for this study. Considering that flight operators in actual work environments are predominantly male, male subjects were recruited to eliminate variables arising from gender differences. At the same time, this study aimed to explore the far transfer effects of MTGCT on simulated flight operations within a more easily controlled laboratory environment, and the recruited subjects were all students. Moreover, they had no actual flying or simulated flying experience, thereby eliminating variables due to differences in flying experience and ensuring the homogeneity of the experimental sample. All participants met the following criteria: (1) no history of neurological or psychiatric disorders; (2) right-handed; (3) normal or corrected-to-normal vision (unaided vision ≥ 5.0); and (4) no involvement in other cognitive training or pharmacological intervention studies in the past month. Initially, there were 23 participants in both the control and training groups. However, due to the termination of some participants, only the performance and EEG data of 28 participants (mean age 22.3 ± 1.5 years) were retained. The CG ended up with 9 participants, while the TG had 19 remaining participants. The significant dropout in the CG was attributed to performance instability in simulated flight operation tasks, where participants either failed to meet the data recording standards or did not complete the tasks during the post-test or tracking test, rendering the data unusable. Although this dropout was anticipated in the study design, maintaining balanced group numbers proved challenging in practice.
Written informed consent was provided for all participants prior to the experiment. Participants in the CG who completed all three phases received a $60 reward, while those in the TG received $200. This study was approved by the Ethics Committee of Beijing Normal University (IRB_A_0075_2023001). Participants were instructed to maintain a healthy lifestyle during the experiment to ensure consistent physical and mental states. They were advised to avoid alcohol, coffee, and late nights, and were prohibited from playing any driving-related games during the experiment to ensure internal consistency among participants. External conditions such as lighting intensity, room temperature, and seating posture were controlled to ensure uniformity throughout the experiment.

2.4. Data Analysis Methods

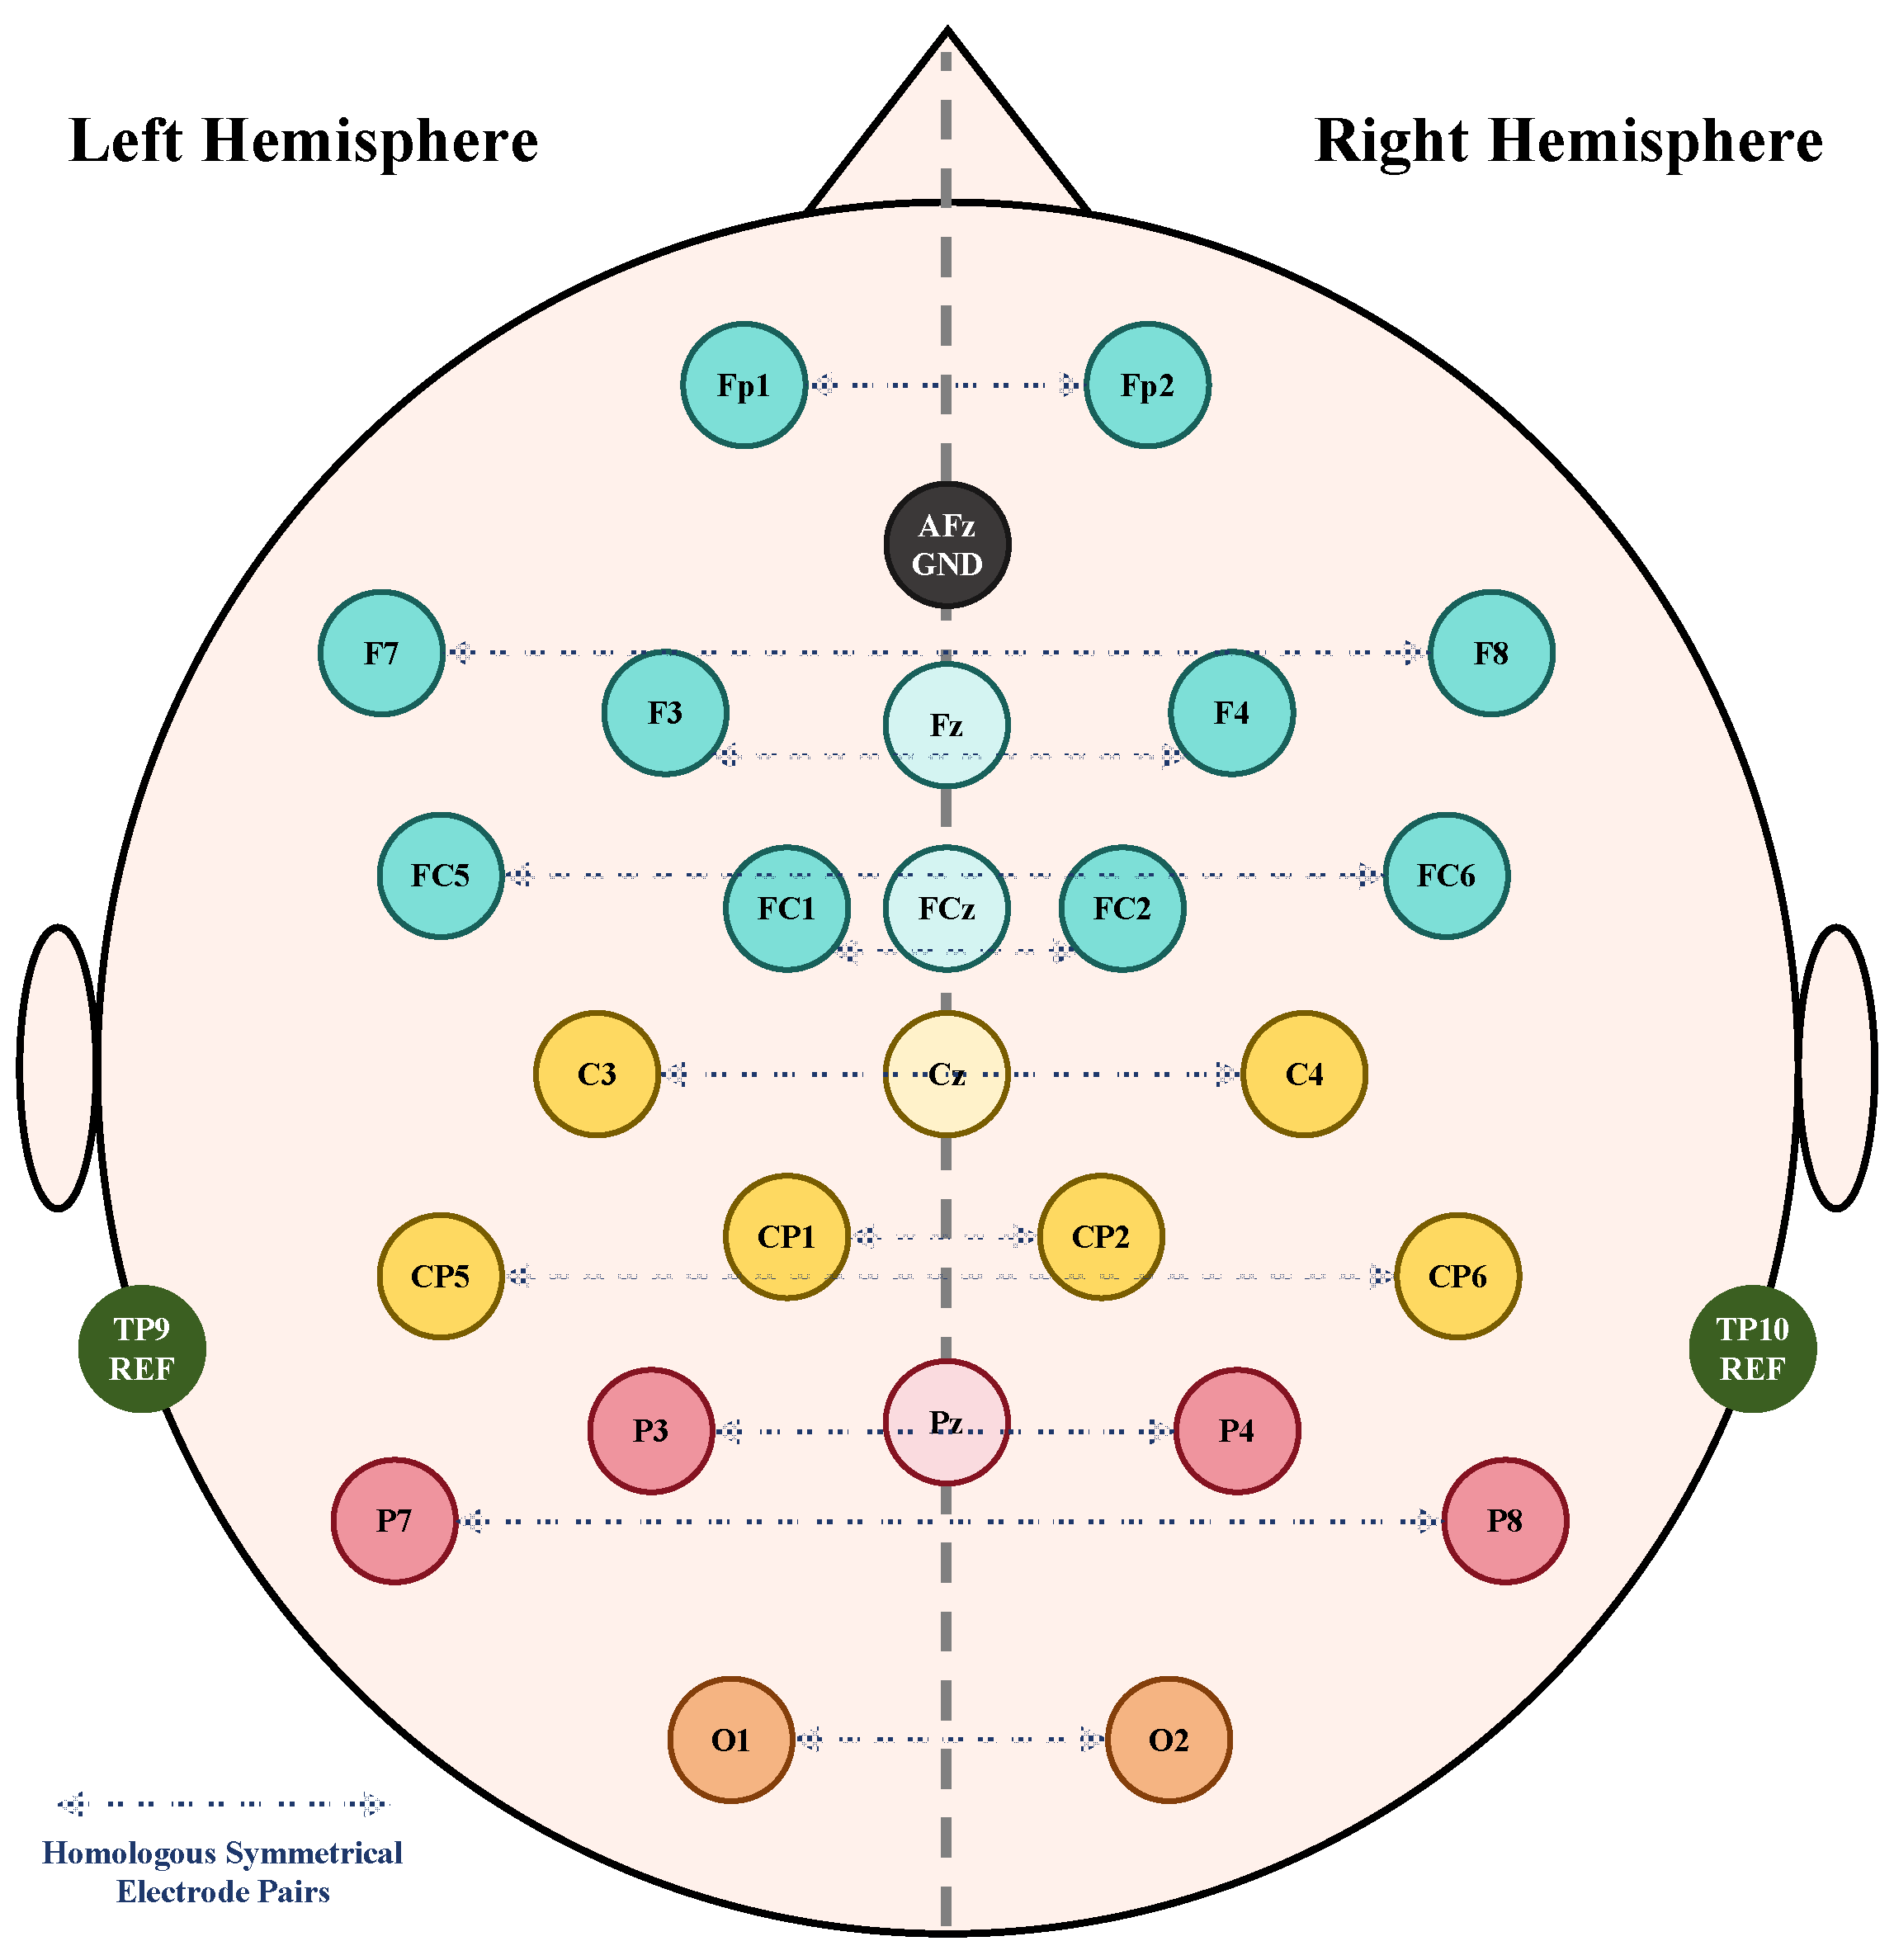
EEG data were recorded at a sampling rate of 2 kHz. According to the international 10-10 system, 29 electrodes were placed at the following positions: FP1, FP2, AFz, Fz, F3, F4, F7, F8, FCz, FC1, FC2, FC5, FC6, Cz, C3, C4, CP1, CP2, CP5, CP6, Pz, P3, P4, P7, P8, O1, O2, TP9, and TP10, as illustrated in Figure 3. The electrodes were referenced to TP9 and TP10 (binaural average reference) and grounded at AFz, with impedance maintained below 30 kΩ.
First, the data from all channels were re-referenced using the average of TP9 and TP10 signals. Then, a finite impulse response filter was applied to digitally filter the EEG signals within the 1–30 Hz range, and the data were down-sampled to 500 Hz. Downsampling is primarily aimed at reducing the computational load of data processing while retaining sufficient frequency information to study the EEG activity related to cognitive tasks. A sampling rate of 500 Hz is adequate to cover the frequency band of interest in this study, which is 1–30 Hz. Independent Component Analysis (ICA) was subsequently employed to remove artifacts related to eye blinks and horizontal eye movements from the EEG data [48]. The data were then segmented based on the task-block timestamps of the simulated flight operation test, ANT test, and N-back test. The PSD was calculated using the periodic Welch’s method, with a window length of 8 s and a step size of 1 s. Due to the varying lengths of task blocks, which range from approximately 30 s to 200 s, an 8-s window length with a 1-s step size can provide sufficient window count for smooth and stable PSD estimation. In addition, the higher frequency resolution of the 8-s window length can reduce the ambiguity of the boundaries between neighboring frequency bands in the EEG caused by spectral aliasing effects. Data processing was performed using MATLAB R2017b and scripts based on the EEGLAB 2022 toolbox.
Statistical analyses were conducted using RStudio (Windows, version 1.4). To assess the impact of different phases (pre-test, post-test, and tracking test) on the traditional cognitive test scores and the simulated flight operation performance between the training and control groups, One-Way Repeated Measures ANOVA was used, followed by Mauchly’s Test of Sphericity. For data that violated the sphericity assumption, the Greenhouse–Geisser correction was applied. Post-hoc pairwise comparisons were performed using Tukey’s test to analyze the significant differences between the three phases in detail.
To further elucidate the neurophysiological changes induced by cognitive training via EEG signals, we conducted a comprehensive analysis of the full-band PSD changes (1–30 Hz) in the simulated flight operation test, ANT test, and N-back test at three phases (pre-test, post-test, and tracking test) for both the control and training group. The 1–30 Hz full-band EEG signals encompass most frequency bands related to cognitive functions, including δ , θ , α , and β bands. We normalized the full-band EEG signals to reduce inter-individual variability and cross-time measurement differences. This analytical process helps confirm the validity of EEG data changes across different tasks and time points, thus enhancing our understanding of the brain’s overall activity state.
Subsequently, we specifically analyzed the changes in specific frequency bands during the eight simulated flight operation tasks. Previous studies have shown that changes in θ band power are closely related to working memory load [49,50], while changes in α band power are associated with attention allocation and can reflect the efficiency of cognitive control resource distribution [28,29]. Both θ and α bands change with the completion of relevant cognitive tasks and with the cognitive demands of training [35]. Cognitive training that enhances executive functions can lead to changes in the θ band, and α band asymmetry may gradually form with long-term memory and cognitive differentiation processes [11]. Therefore, to investigate whether visuo-spatial attention and working memory cognitive training positively impact simulated flight operation abilities and to attempt to explain the neurophysiological basis of these effects, this study primarily focused on the θ band (4–8 Hz) and α band (8–13 Hz) in the EEG signal analysis. To visually observe the relative changes in the TG compared to the CG, we present the results of the Inter-Group Ratio on a brain topography map. It represents the ratio of the relative band ratios of the two groups, calculated using Equation (1).
I n t e r - G r o u p R a t i o = P S D B a n d T r a i n i n g P S D 1 30 H z T r a i n i n g / P S D B a n d C o n t r o l P S D 1 30 Hz C o n t r o l
where B a n d represents the specific frequency band, either θ or α . P S D B a n d T r a i n i n g P S D 1 30 Hz T r a i n i n g is the relative band ratio of TG, and P S D B a n d C o n t r o l P S D 1 30 Hz C o n t r o l is the relative band ratio of CG. A higher I n t e r - G r o u p R a t i o indicates an enhancement of the PSD in the specific band for the TG compared to the CG, and vice versa for a reduction. Hemispheric asymmetry plays a crucial role in various cognitive and behavioral functions, and training may also lead to changes in brain regional asymmetry [32]. Therefore, this study further calculated the Asymmetry Index ( A S M I ) to reveal the relationship between cognitive training and brain asymmetry. Excluding electrodes located on the midline of the brain (Fz, FCz, Cz, Pz), the ground electrode (AFz), and reference electrodes (TP9, TP10), we organized the remaining 22 electrodes into 11 homologous electrode pairs marked with bidirectional dashed arrows in Figure 3. These 11 electrode pairs belong to four brain regions, with each pair’s associated brain region detailed in Table 1. A S M I was calculated by subtracting the natural log-transformed PSD of the specific frequency band at the left hemisphere electrode from that at the homologous right hemisphere electrode [51,52,53], as shown in Equation (2).
A S M I = l n ( P S D B a n d R i g h t ) l n ( P S D B a n d L e f t ) = l n ( P S D B a n d R i g h t P S D 1 30 Hz ) l n ( P S D B a n d L e f t P S D 1 30 Hz )
where B a n d represents the specific frequency band, either θ or α . R i g h t denotes the right hemisphere electrode of the homologous pair, and L e f t denotes the corresponding left hemisphere electrode. A positive A S M I indicates higher PSD in the specific band on the right hemisphere, while a negative A S M I indicates higher PSD on the left hemisphere. A S M I measures relative asymmetry and is sensitive to absolute differences in PSD between hemispheres. After calculating the asymmetry indices for all subjects, we used a one-sample t-test to analyze the significance, further examining the changes in brain asymmetry for control and training group subjects across different phases to better explain the physiological changes induced by cognitive training.

3. Results

This section first provides a detailed analysis of the significant differences in traditional cognitive test scores and simulated flight operation performance between the CG and the TG across the pre-test, post-test, and tracking test. Then, we analyze the changes in the EEG PSD across the full-band during the simulated flight operation test, ANT test, and N-back test for both groups at these three phases, to validate the effectiveness of physiological data at each phase and help us understand the overall changes in brain activity. Finally, we specifically analyze the changes in the θ and α bands during the eight simulated flight operation tasks for the TG compared to the CG, and attempt to explain the changes in brain asymmetry induced by cognitive training using A S M I .

3.1. Analysis of Behavioral Data

3.1.1. Statistical Analysis of Traditional Cognitive Test Scores

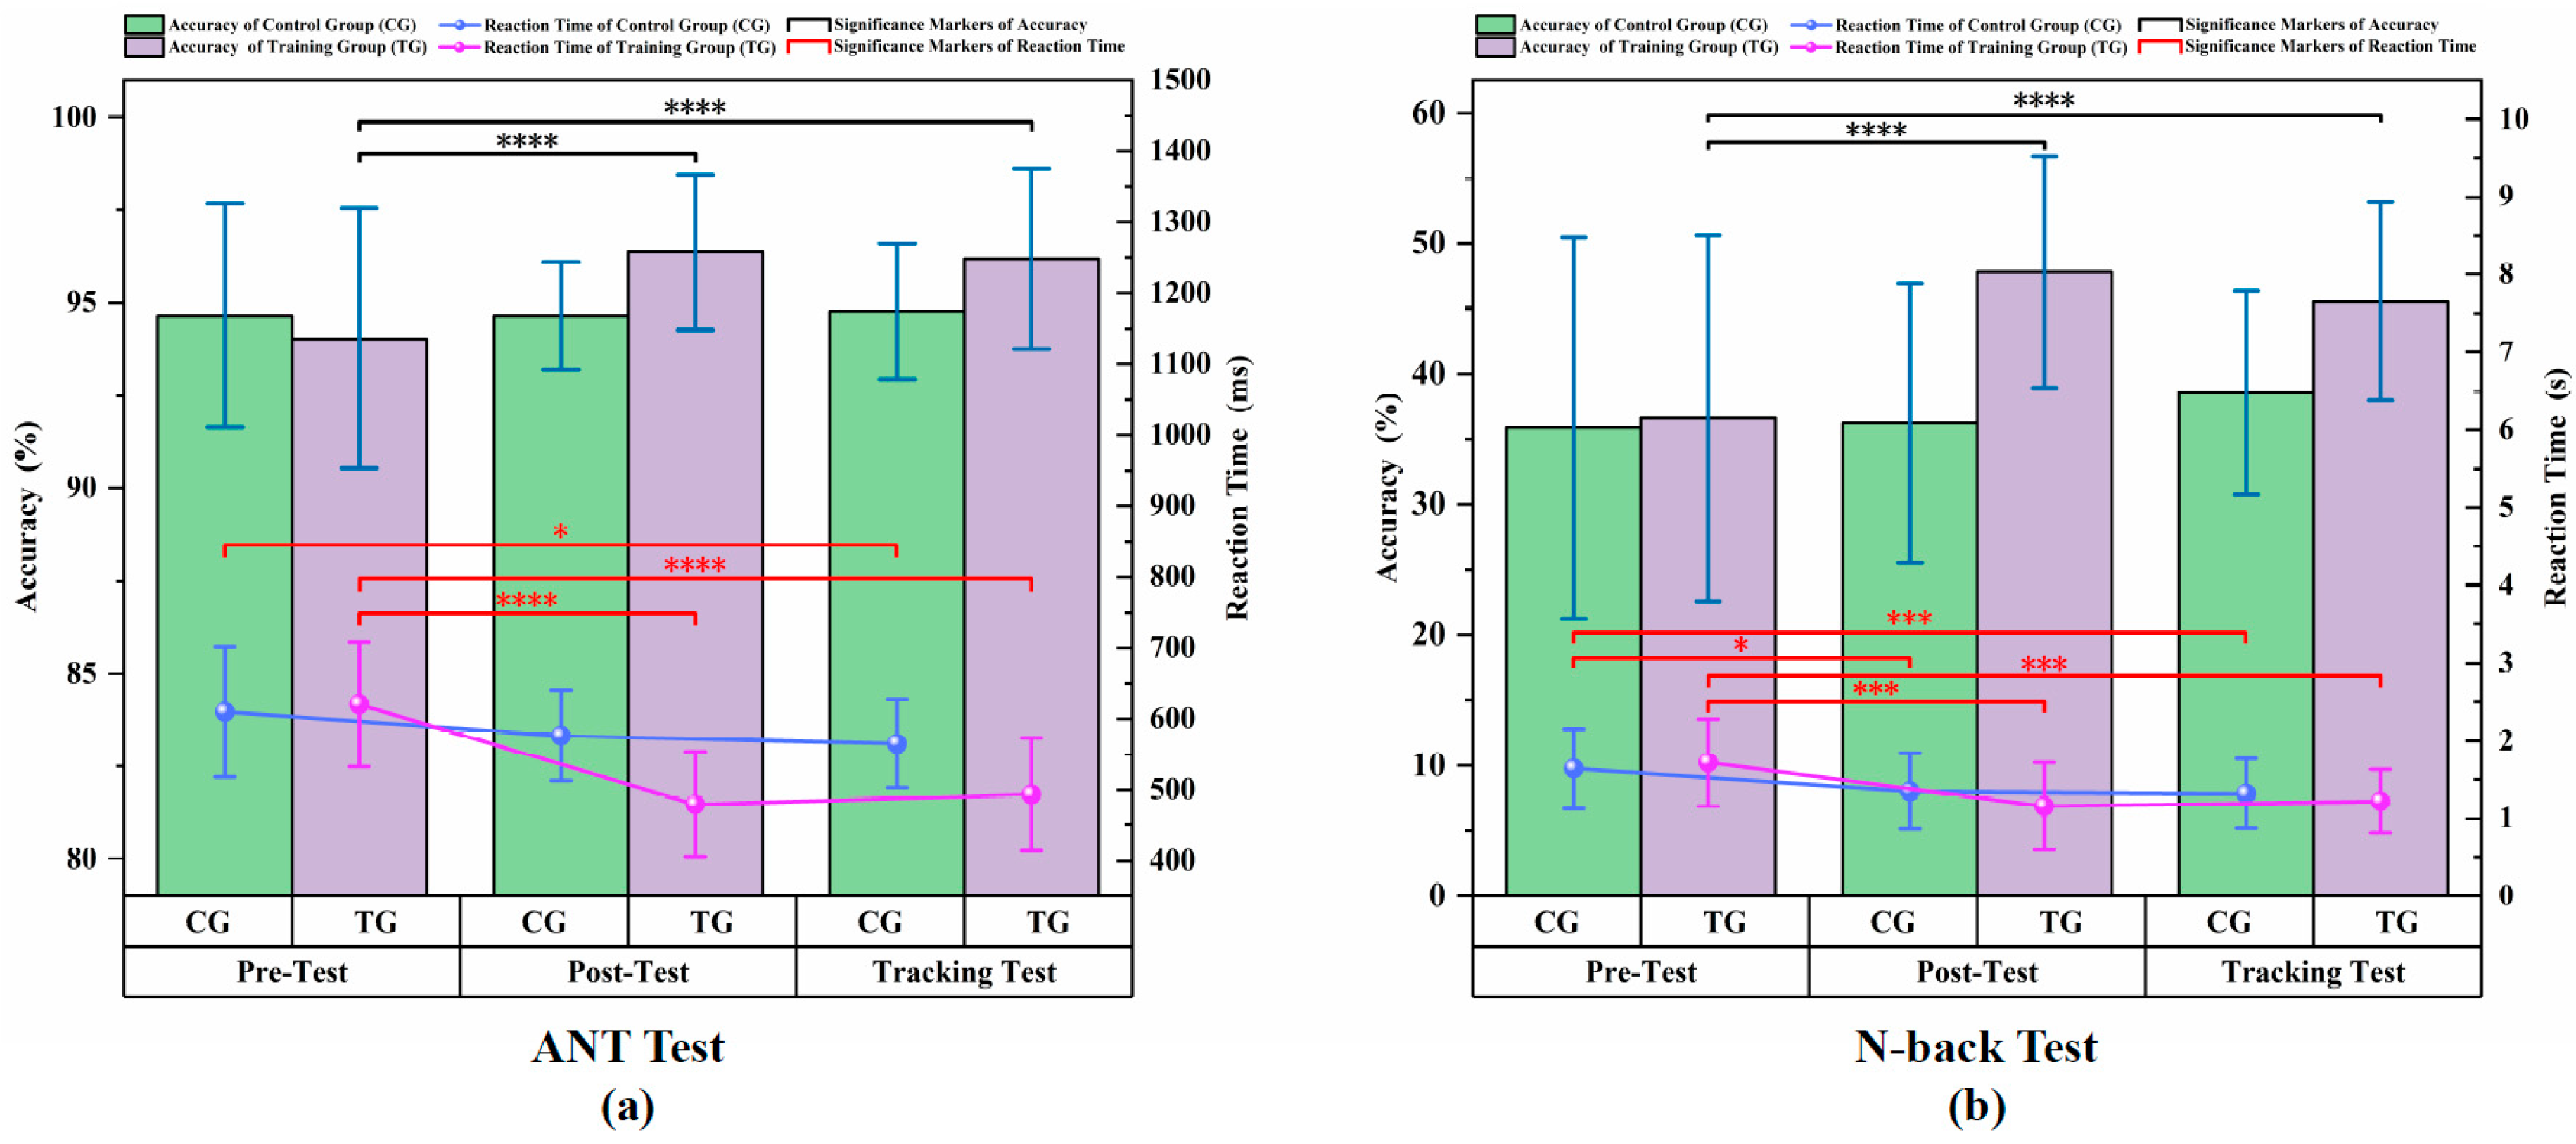
We conducted a statistical analysis of the scores of subjects in the CG and the TG who completed the traditional cognitive test across the pre-test, post-test, and tracking test. The results are shown in Figure 4. The traditional cognitive test scores include accuracy and reaction time of the ANT test and the N-back test. In the pre-test phase, the results of the unequal variances t-Test (Welch’s t-Test) show that there were no significant differences in the traditional cognitive test scores of the two groups.
Compared with the CG, the TG showed a more significant improvement in the traditional cognitive test scores during the post-test and tracking test phases, especially the effective increase in accuracy. We used One-Way Repeated Measures ANOVA to explore the main effect of time points (pre-test, post-test, and tracking test). For the traditional cognitive test scores of both groups, we tested the significance of main effect time points under the assumption of non-significant violation of sphericity. Data that violated the spherical assumption were corrected by Greenhouse–Geisser. After discovering the significant main effect, we conducted Tukey’s post-hoc pairwise comparisons of the scores at each phase.
The ANT test results in Figure 4a show that no significant main effect was found in the ANT test accuracy of the CG, and only a significant improvement in reaction time was observed in the tracking test phase compared to the pre-test phase ( p < 0.05 ). The ANT test scores of the TG showed significant improvement both in the post-test and tracking test phases ( p < 0.0001 ). From the N-back test results in Figure 4b, we found that the N-back test accuracy of the CG did not have a significant main effect, and the reaction time was significantly improved in the tracking test phase. In the post-test and tracking test phases, the accuracy of the N-back test in the TG was significantly improved ( p < 0.0001 ), and the reaction time was also significantly improved ( p < 0.001 ).
The above results indicate that, compared with the CG, the traditional cognitive test scores of the TG have improved more significantly. This indicates that MTGCT enhances the near transfer performance in similar traditional cognitive tests, and this performance can be interpreted as the cognitive function improvement of the subjects during the experiment.

3.1.2. Statistical Analysis of Simulated Flight Operation Performance

We conducted a statistical analysis of the performance data of subjects in the CG and the TG who completed the simulated flight operation tasks across the pre-test, post-test, and tracking test. The results are shown in Figure 5. The simulated flight operation performance includes the finish time and operating error. Tasks 1, 3, 5, and 7 are altitude adjustment tasks, while Tasks 2, 4, 6, and 8 are heading adjustment tasks. In the pre-test phase, the simulated flight operation performance of the CG and the TG was very similar. After conducting the unequal variances t-Test (Welch’s t-Test), it was found that, except for the finish time of Task 4 ( p < 0.05 ) and the operating error of Task 7 ( p < 0.05 ), there were no significant differences in the operational performance of the two groups across Tasks 1 to 8.
Compared to the pre-test phase, the mean performance of both groups improved to varying degrees in the post-test phase. The mean performance in the tracking test phase generally declined compared to the post-test phase. Similarly, we used One-Way Repeated Measures ANOVA to explore the main effect of time points (pre-test, post-test, and tracking test). As shown in Figure 5, the performance of the TG in the eight simulated flight operation tasks significantly improved in both the post-test and tracking test compared to the pre-test phase ( p < 0.0001 ). However, the significant improvement in the CG varied across the eight simulated flight tasks, with some tasks not showing significant improvement. After confirming the significance of the main effect time points, Tukey’s post-hoc pairwise comparisons were made to analyze the significant differences between the three phases. Detailed statistical analysis results of the eight simulated flight tasks are provided in Table 2.
The results in Table 2 indicate that the performance variability across different time points due to training effects was larger in the TG, with performance data for almost all tasks violating the sphericity assumption. Conversely, the performance of CG was relatively stable. Except for the operating error in Task 8, the effect size η p 2 for One-Way Repeated Measures ANOVA concerning time points was generally large for almost all tasks. This indicates that as the experiment progressed, the proficiency of both the CG and TG in the simulated flight operation tasks gradually improved. However, the η p 2 values for task performance in the TG were significantly larger than those in the CG, except for the finish time in Task 7, indicating that cognitive training further enhanced simulated flight operation abilities. According to the results of Tukey’s tests in Table 2, in the CG, except for Tasks 3 and 7, we did not observe significant performance changes during the post-test or tracking test compared to the pre-test. This also indicates that the performance of subjects who did not undergo MTGCT varied greatly and did not show substantial improvement in operational abilities. The fact that the task performance in the TG generally did not significantly decline in the tracking test phase compared to the post-test phase further suggests that the improvements in simulated flight operation abilities induced by MTGCT may have a certain retention effect. Moreover, this kind of far transfer performance should be accompanied by an improvement in cognitive ability, and it is necessary to deeply explore the neurophysiological change process behind it.

3.2. EEG Signal Analysis

3.2.1. Full-Band Analysis

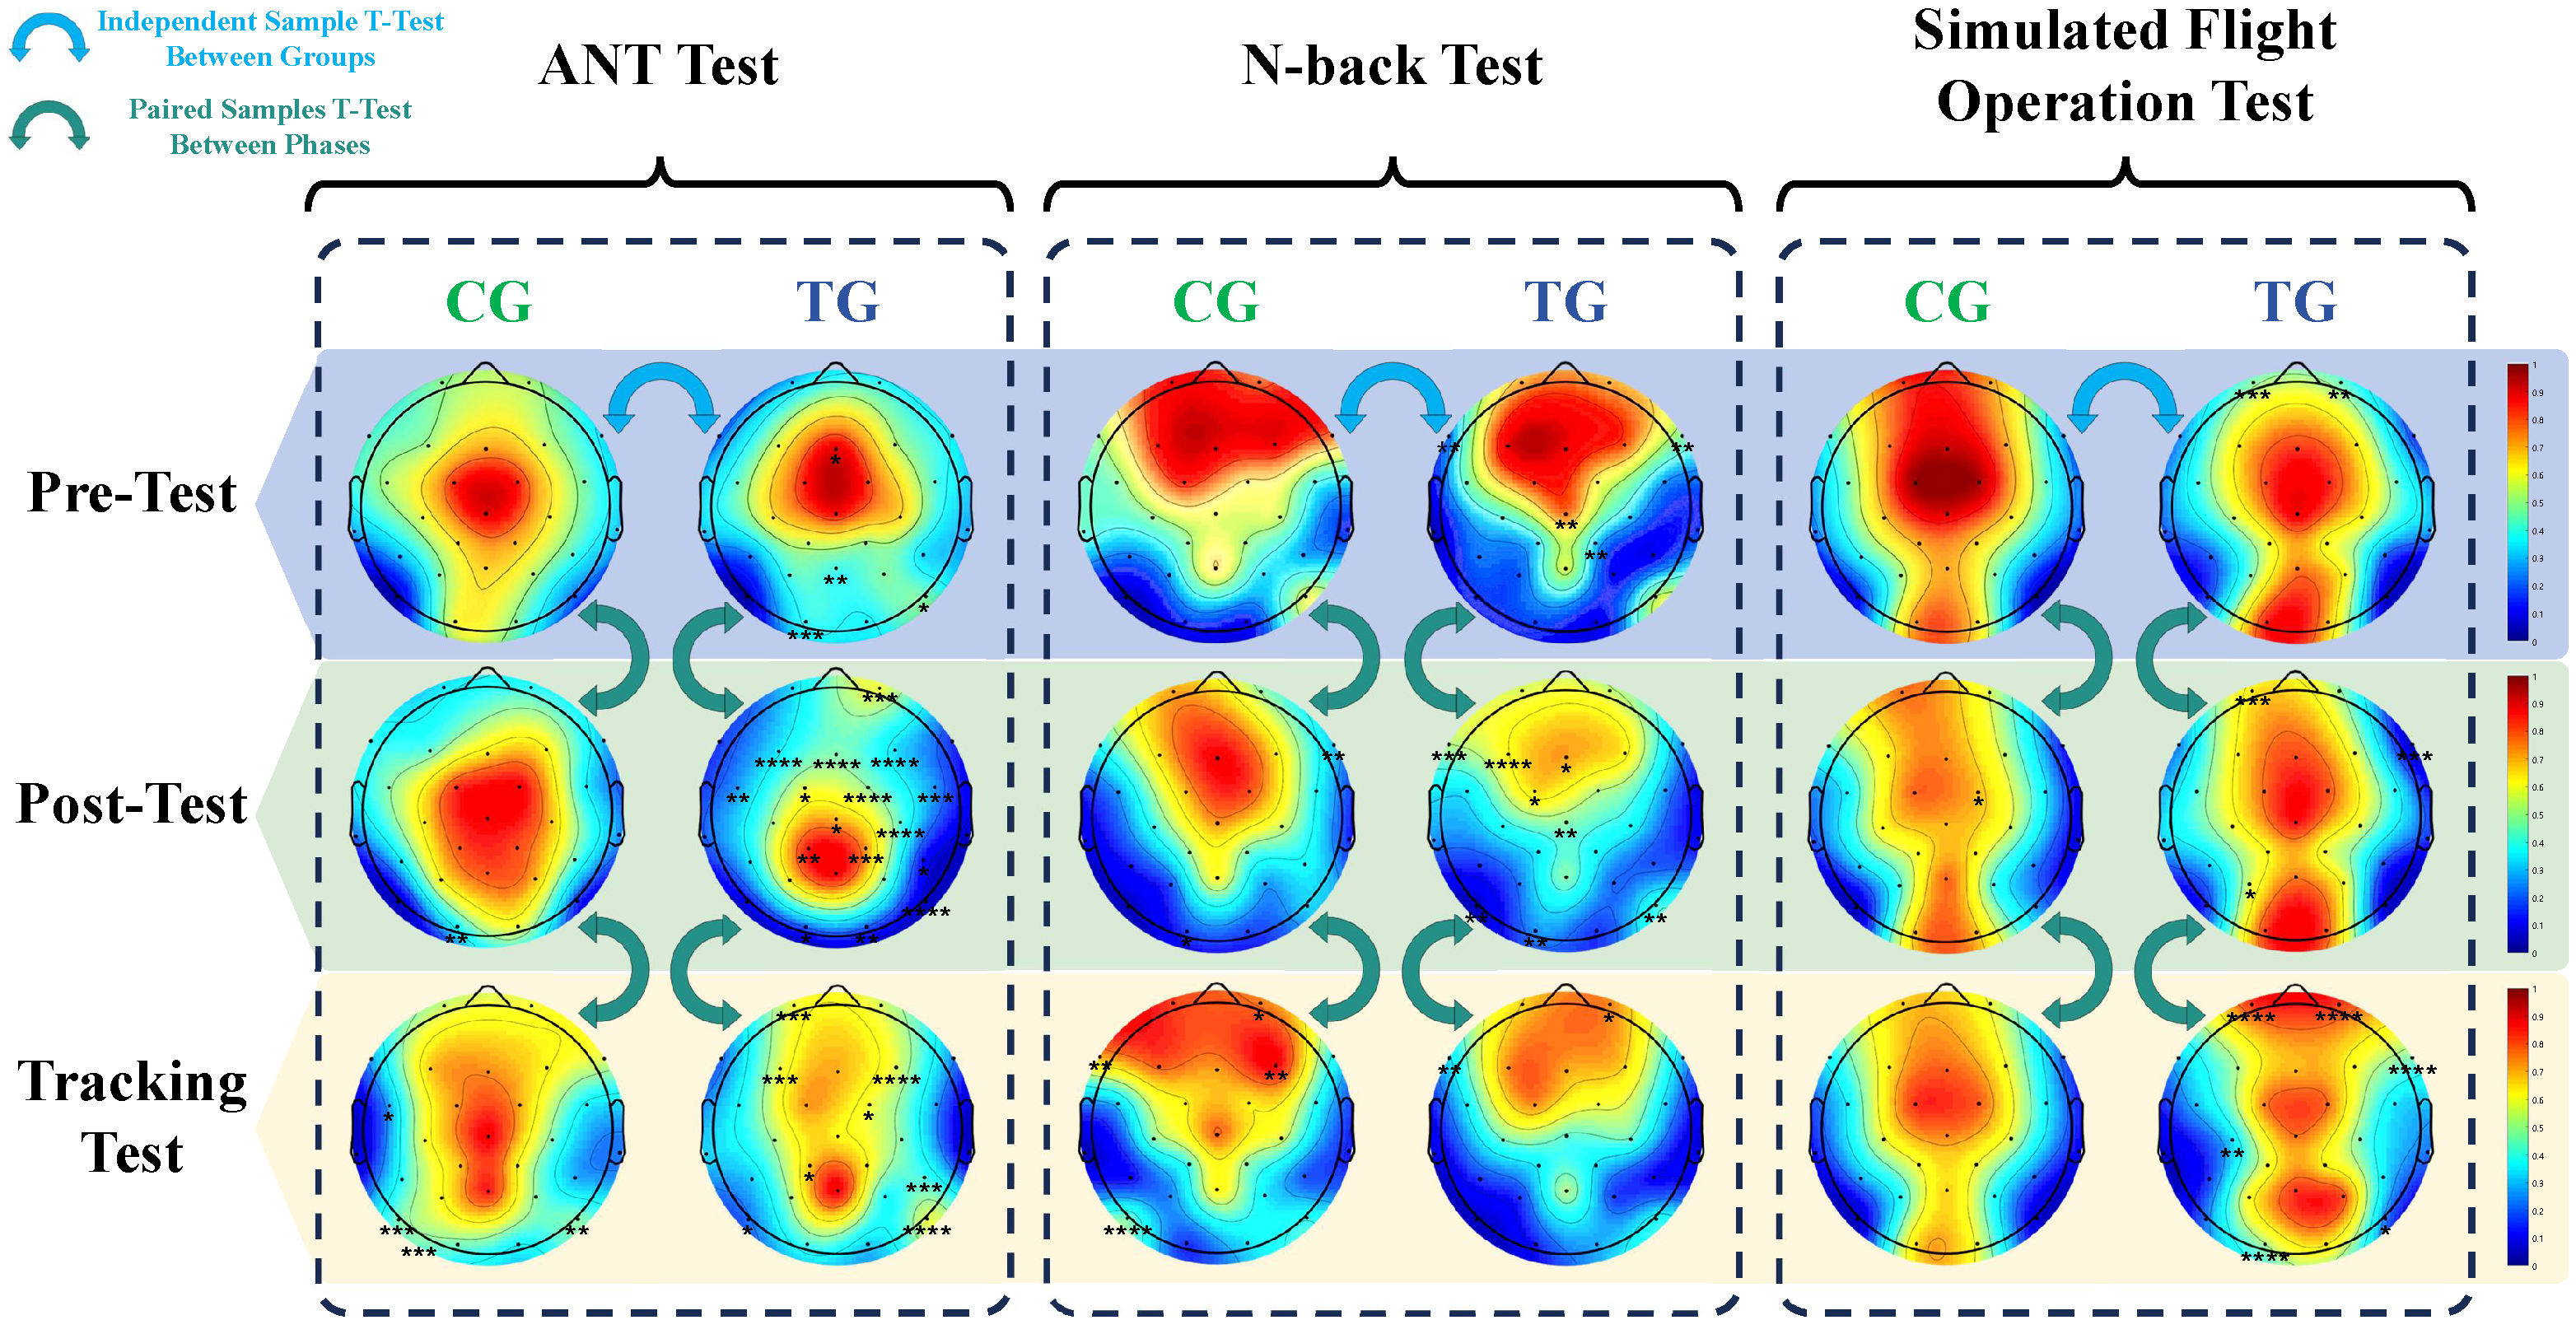
To explore the neurophysiological changes induced by MTGCT, we first analyzed the full-band PSD changes in the CG and TG during the pre-test, post-test, and tracking test phases for the simulated flight operation test, ANT test, and N-back test. The normalized average PSD of the full-band EEG was mapped onto a 3 × 3 whole-brain topography map, as shown in Figure 6.
In the pre-test phase, the inter-group independent samples t-test results of the three tests showed that the full-band PSD difference between the CG and the TG was minimal. Furthermore, a higher response was generally observed in the frontal lobe region. We believe this is because the subjects in both the CG and TG were performing these phase tests for the first time, leading to a higher cognitive load due to their lack of proficiency. The parietal and occipital lobes displayed higher responses in the ANT test and simulated flight operation test, indicating that the subjects allocated more attention.
In the post-test phase, although subjects in both the CG and TG had become somewhat familiar with and mastered the experimental test content, the untrained CG still exhibited task load. Specifically, compared to the ANT test and N-back test in the pre-test phase, the frontal lobe full-band PSD of TG significantly decreased. Compared to the simulated flight operation test in the pre-test phase, although there were no significant changes in either the CG or the TG, the TG still exhibited significant changes in the frontal and parietal regions. This suggests that the simulated flight operation tasks may have engaged multiple cognitive functions of the subjects. MTGCT enabled subjects to better integrate visual information about the aircraft’s status and perform corresponding decisions, execution, and control during tasks.
In the tracking test phase, after a 14-day retention period, the TG showed a certain degree of rebound in the full-band PSD across three tests compared to the post-test phase. In contrast, the CG did not show any significant changes in full-band PSD during the simulated flight operation test compared to the post-test phase. This indicates that MTGCT gradually helps the TG form a neural activity pattern. However, the significant increase in frontal lobe responses can be found in all tests in the tracking test phase. This also suggests that the rebound in load level somewhat affected the consolidation of this neural activity pattern. Nevertheless, MTGCT not only significantly improved the simulated flight operation ability of the subjects but also somewhat hindered the rebound of the formed neural activity pattern.

3.2.2. Analysis of θ Band PSD Relative Band Ratio Changes

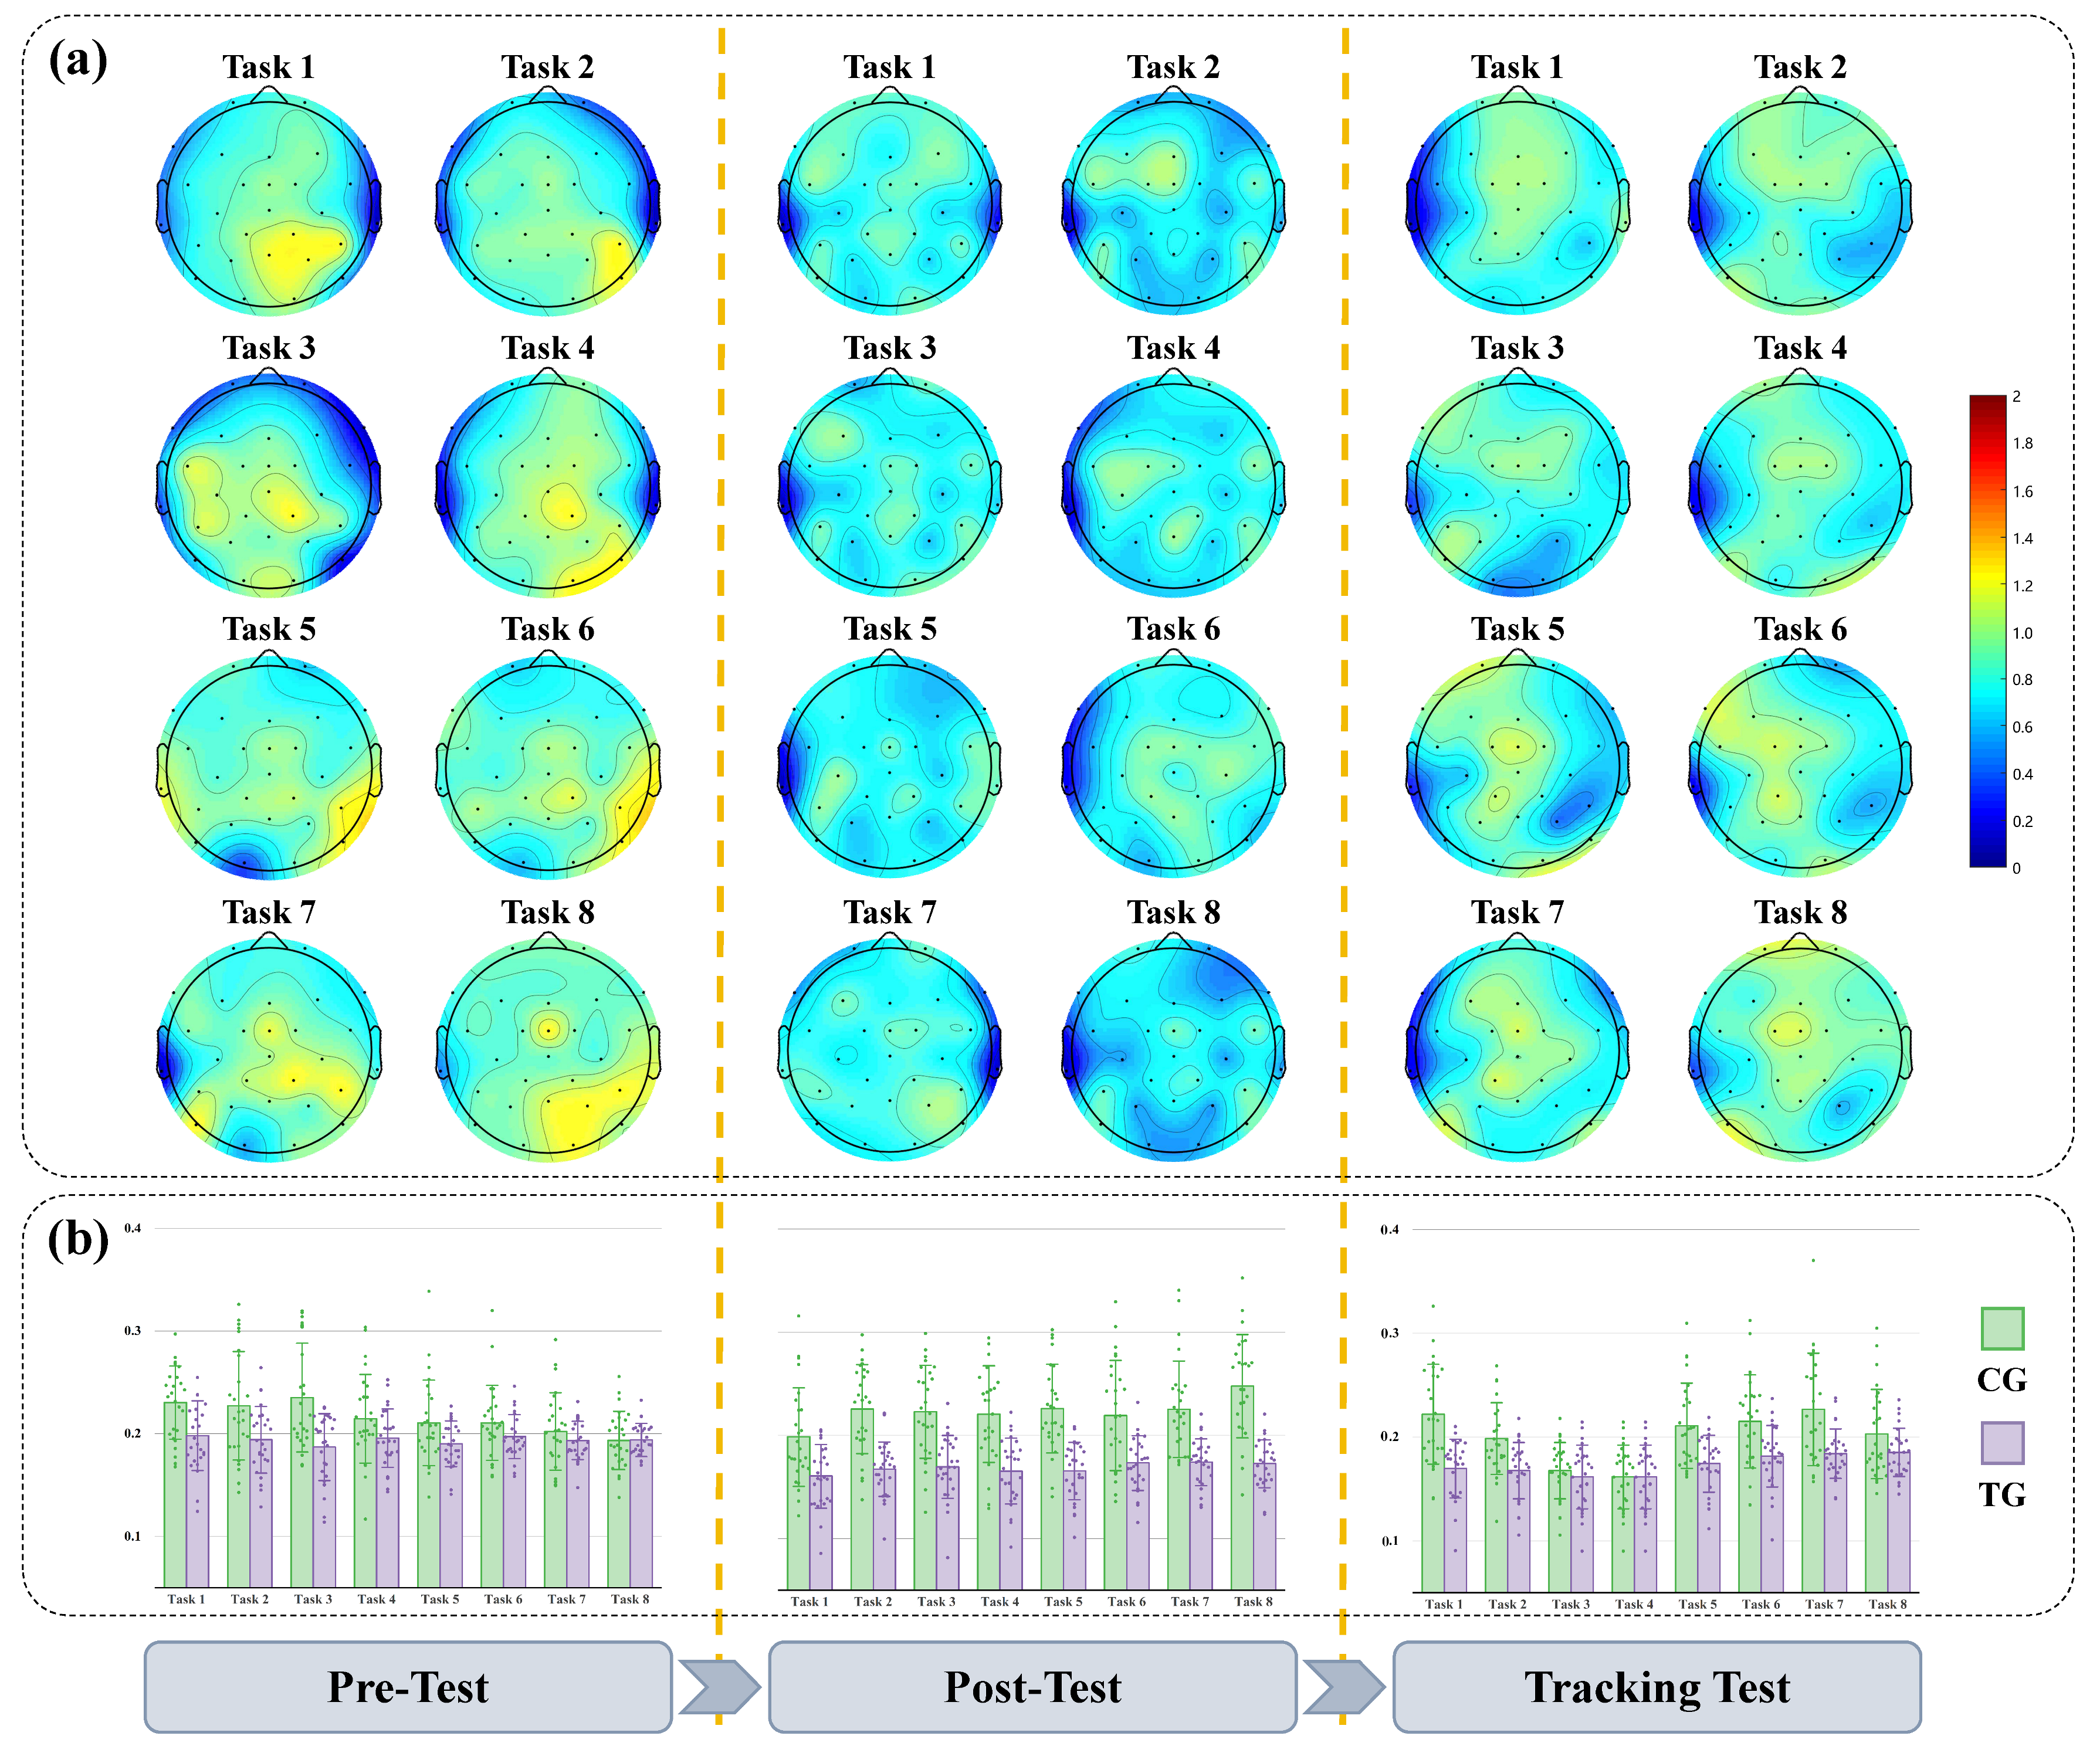
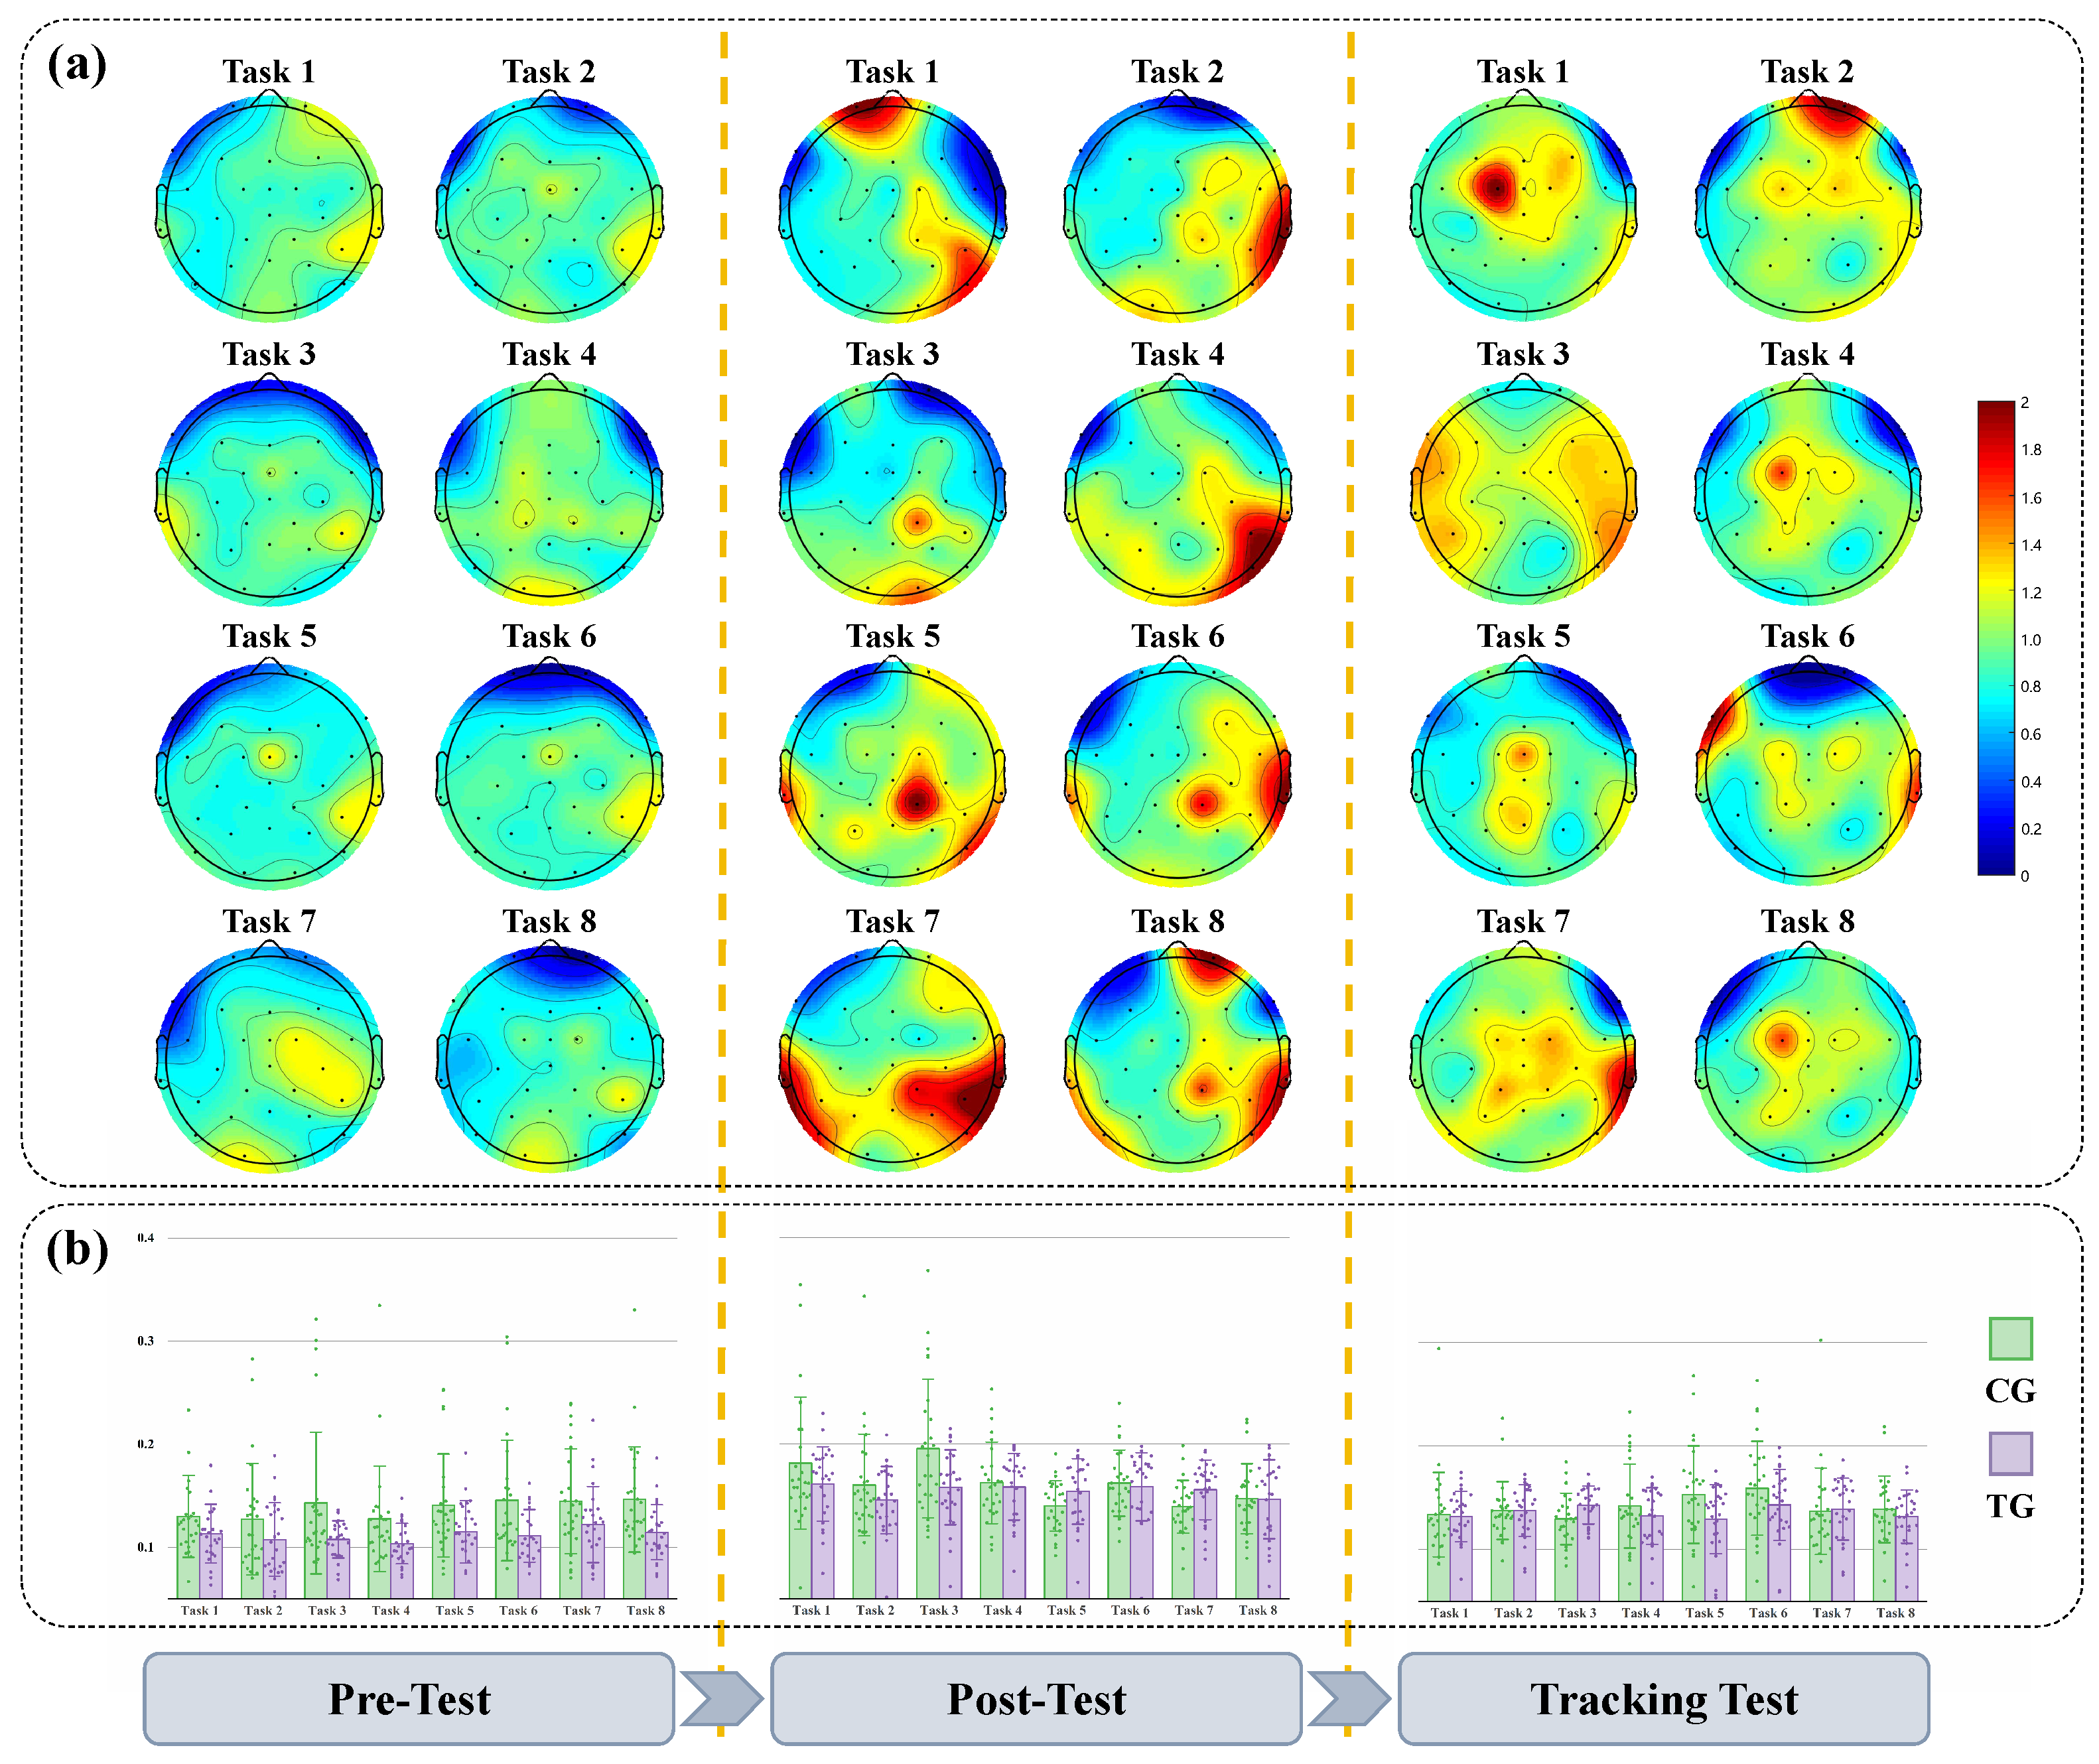
To further explore the impact of MTGCT on θ band PSD changes during simulated flight operations, this study calculated the I n t e r - G r o u p R a t i o of θ band relative differences between the TG and CG using Equation (1). The mean I n t e r - G r o u p R a t i o of the θ band for the eight simulated flight tasks across the three phases is mapped onto a whole-brain topography map, as shown in Figure 7a. Additionally, to better observe the evolution of the θ band under the influence of MTGCT, Figure 7b further presents the θ band relative band ratio of all EEG electrodes for the eight simulated flight tasks in the three phases for both the CG and TG. The θ band PSD relative band ratios and their average values of the simulated flight operation tasks of the CG and the TG in different phases are provided in Table 3.
It can be observed that in the pre-test phase, the TG had a higher θ band PSD proportion in the right parieto-occipital region, while the ratios in other regions were around 1, reflecting the similarity in physiological characteristics between the TG and CG in the early phase. Due to the first encounter with the simulated flight operation tasks, subjects needed to process a large amount of new information (such as instrument readings and operational changes), resulting in high cognitive control and working memory load, which strongly activated the θ band. The mean relative band ratio for the eight simulated flight tasks was 0.2153 for the CG and 0.1935 for the TG.
In the post-test phase, the TG that underwent MTGCT showed a decrease in overall θ band PSD proportion compared to the CG, especially in the frontal lobe. The MTGCT reduced the need for cognitive control and the consumption of cognitive resources, leading to an overall decrease in θ band PSD proportion, with the mean relative band ratio for the eight simulated flight tasks dropping to 0.1684 for the TG. In contrast, the CG showed no significant trend change, with a mean of 0.2230. This indicates that MTGCT plays a positive role in optimizing cognitive resource allocation and reducing cognitive load. Additionally, the TG exhibited a significant decrease in the θ band PSD proportion in the right frontal and parieto-occipital regions, suggesting that the θ band may exhibit a left-right asymmetry due to improvements in cognitive abilities and performance.
In the tracking test phase, the TG showed an increase in the θ band PSD proportion in the frontal lobe, but the overall brain still exhibited a lower level of θ band power proportion, with the mean relative band ratio for the eight simulated flight tasks being 0.1731. Meanwhile, the mean relative band ratio of CG showed a slight decrease to 0.2005, likely due to improved task proficiency. The differences in θ band PSD changes observed between the TG and CG in the post-test phase indicate that MTGCT reduces θ band power, and the slight rebound in the mean relative band ratio of TG in the tracking test phase suggests a certain retention effect of this change.

3.2.3. Analysis of θ Band Asymmetry

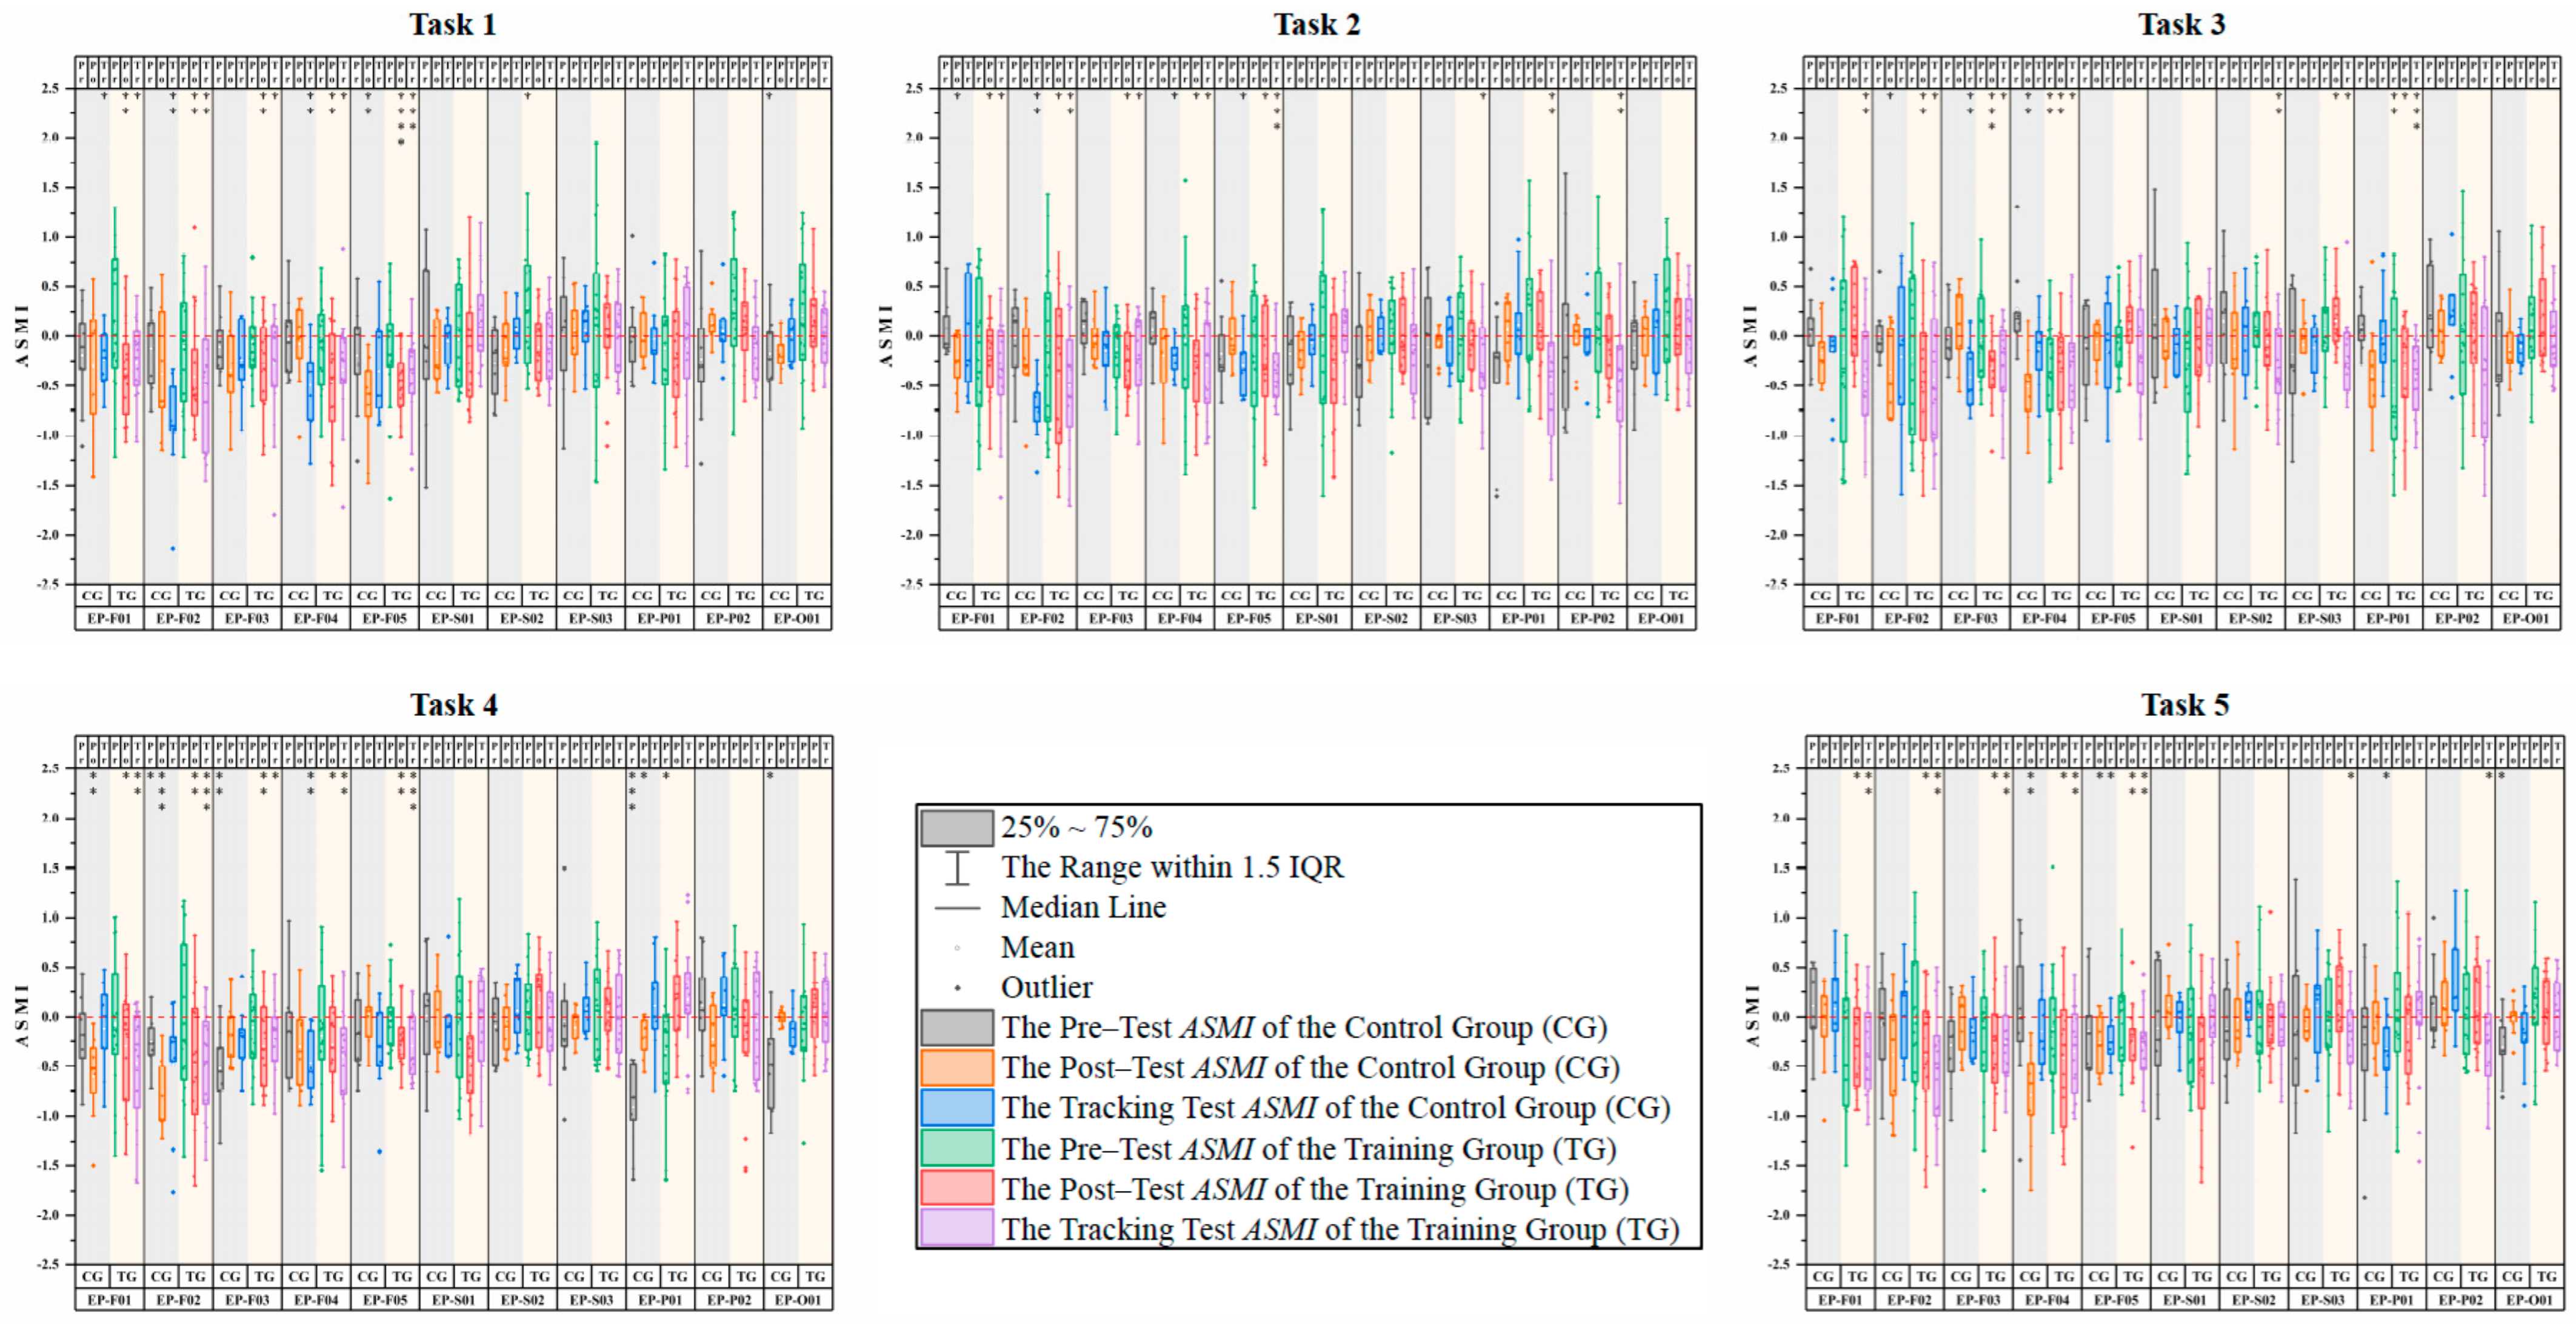
To further analyze the θ band asymmetry, we calculated the A S M I values for 11 electrode pairs belonging to four brain regions using Equation (2). The A S M I values of these electrode pairs are presented in box plots in Figure 8. The region of each electrode pair includes the A S M I values of CG and TG during pre-test, post-test, and tracking test. The red dashed line representing an A S M I value of 0 serves as a reference, where a positive A S M I value indicates rightward asymmetry, and a negative A S M I value indicates leftward asymmetry. The results of the one-sample t-test for zero-mean significance are marked on the top axis of each task frame in Figure 8.
In the pre-test phase, none of the electrode pairs exhibited significant lateralization in any of the eight tasks. As the experiment progressed, both the CG and TG displayed varying degrees of leftward asymmetry in the post-test and tracking test phases, primarily observed in five electrode pairs located in the frontal region (EP-F01, EP-F02, EP-F03, EP-F04, and EP-F05). This leftward asymmetry in the frontal lobe was more prominently observed in the TG. Compared to the pre-test phase, the absolute A S M I values of the frontal electrode pairs generally increased during the post-test and tracking test phases. This may be related to the desynchronization between the left and right hemispheres in the θ band associated with improved executive function performance.

3.2.4. Analysis of α Band PSD Relative Band Ratio Changes

Similar to the analysis process of the θ Band PSD Relative Band Ratio in Section 3.2.2, the mean I n t e r - G r o u p R a t i o of the α band for the eight simulated flight tasks across the three phases is mapped onto the whole-brain topography map shown in Figure 9a. Figure 9b presents the α band relative band ratio of all EEG electrodes for the eight simulated flight tasks in the three phases for both the CG and TG. The α band PSD relative band ratios and their average values of the simulated flight operation tasks of the CG and the TG in different phases are provided in Table 3.
It can be observed that during the pre-test phase, due to the constant visual attention and rapid decision-making required by the simulated flight operation tasks, α band suppression occurs in brain regions outside the frontal lobe. Therefore, inter-group differences result in a lower proportion of α band PSD in the frontal lobe of the TG, while the level of the α relative band ratio in other regions is comparable to that of the CG. For both the CG and TG, the α relative band ratio is at a low level, indicating a high demand for attentional resources in both groups. The mean α relative band ratio for the eight simulated flight tasks is 0.1383 for the CG and 0.1120 for the TG.
In the post-test phase, although the overall proportion of α band PSD increased for both the CG and TG, the increase was less pronounced in the CG compared to the TG. The mean α relative band ratio for the eight simulated flight tasks in the TG increased to 0.1547, while it was 0.1610 for the CG. Additionally, the frontal and right parietal α band PSD proportion in the TG, which underwent MTGCT, showed a higher increase. This indicates that the TG had a stronger capability for attentional resource allocation, and this improvement might lead to α band brain left-right asymmetry.
In the tracking test phase, the proportion of frontal α band PSD in the TG remained higher than that in the CG, while the parietal α levels were comparable between the two groups. Nonetheless, the TG still exhibited a relatively high proportion of α band PSD across the whole brain, with a mean α relative band ratio of 0.1360 for the eight simulated flight tasks. In contrast, the mean α relative band ratio of CG decreased to 0.1414, approaching the overall level of the pre-test phase. These changes suggest that MTGCT can enhance α band power, and this enhancement effect has a certain retention effect.

3.2.5. Analysis of α Band Asymmetry

The α band asymmetry is analyzed using the A S M I values of 11 electrode pairs belonging to 4 brain regions, calculated according to Equation (2). The results are presented in Figure 10, similar to Figure 8.
In the pre-test phase, none of the electrode pairs exhibited significant lateralization across the eight tasks. As the experiment progressed, the CG and TG demonstrated varying degrees of rightward asymmetry during the post-test and tracking test phases, primarily in five electrode pairs located in the frontal lobe (EP-F01, EP-F02, EP-F03, EP-F04, and EP-F05) and two electrode pairs in the parietal lobe (EP-P01 and EP-P02). Additionally, the leftward asymmetry in the frontal and parietal lobes was more readily observed in the TG. Significant asymmetry was also observed in the TG during the post-test and tracking test phases in three electrode pairs in the somatomotor region (EP-S01, EP-S02, and EP-S03) and one electrode pair in the occipital lobe (EP-O01). Although these asymmetries also exhibited rightward lateralization, they were not consistently observed across all eight tasks.

4. Discussion

This study aims to explore the efficacy of visuo-spatial attention and working memory MTGCT on enhancing simulated flight operation abilities. It also investigates the neurophysiological impacts of MTGCT through changes in EEG PSD features and brain asymmetry, and whether these effects have a certain retention effect. Unlike previous studies that typically focus on a single traditional cognitive training task to improve operational or executive ability, we designed an MTGCT scheme that closely resembles operational scenarios. As far as we know, no research has explored the brain changes induced by MTGCT in the context of simulated flight tasks. Therefore, by analyzing the changes in EEG signal characteristics, we elucidate the mechanisms of neuroactivity changes induced by MTGCT, thereby providing a theoretical foundation for developing an effective periodic training scheme in the field of aviation piloting.
The analysis results of behavioral data indicate that regular visuo-spatial attention and working memory MTGCT can enhance the capacity to handle task load and allocate attention resources. We found that the TG showed a more significant improvement in the traditional cognitive test ( p < 0.0001 ), except for a slightly lower significance in the reaction time of the N-back test ( p < 0.001 ). This reflects the optimization of cognitive resource allocation and improvement in self-control among the participants in the TG during the experiment. We also discovered that the significant improvements of TG in all simulated flight task performance ( p < 0.0001 ). This result indicates that participants who underwent MTGCT exhibited far transfer performance in simulated flight tasks that surpass specific cognitive training tasks. Moreover, this phenomenon of far transfer was accompanied by physiological changes, including alterations of θ (4–8 Hz) and α (8–13 Hz) bands PSD due to optimized cognitive resource allocation and changes in brain asymmetry due to the formation of neural activity patterns.
Regular visuo-spatial attention and working memory MTGCT led to a decrease in the θ relative band ratio and an increase in the α relative band ratio in the frontal and parietal lobes during the simulated flight tasks. These physiological changes can persist for at least two weeks. Hankins et al. found through studies of EEG indicators during different stages of flight that high cognitive load is closely associated with an increase in θ power, especially during flight stages requiring brain calculations [54]. Related studies indicate that changes in θ and α band characteristics play an important role in assessing cognitive levels in the aviation field [55]. In this study, the θ band PSD was relatively high in the pre-test phase, while the α band PSD was relatively low, reflecting the high cognitive load state and high attention demand of the subjects when they first encountered the simulated flight task. This is consistent with the findings of Verkennis et al. and Sterman et al., where high workload conditions in flight simulation tasks led to an increase in θ power, and visual attention control conditions suppressed α activity [55,56]. This result suggests that the θ and α bands play important roles in cognitive control and monitoring during simulated flight tasks. After MTGCT, the improvement in simulated flight operating performance led to changes in the θ and α bands. Related studies show that some training aiming to enhance executive functions can lead to changes in the θ band [11], and frontal θ and parietal α power change with cognitive effort induced by training [15]. Olesen et al. found that five weeks of working memory task practice led to increased activity in brain regions associated with working memory [57]. In the study of Borghini et al., subjects showed continuous improvement in MATB task performance after five days of MATB training, accompanied by an increase in frontal θ power and a decrease in parietal α power [15]. However, in this study, the TG showed a significant decrease in θ band PSD and an upward trend in α band PSD after MTGCT. Particularly compared to the CG, the decrease in θ band PSD was more pronounced in the frontal and right parietal regions, and the increase in α band PSD was more evident in the frontoparietal regions. We believe that the decrease in θ band PSD and increase in α band PSD in the post-test phase suggest that gamified cognitive training may more easily reduce the involvement demand of frontoparietal in cognitive control and attention processes by enhancing task automation. Hempel et al. found that brain activation increased after two weeks of working memory training but decreased after four weeks, suggesting that the frontal and parietal cortices contain at least two parallel mechanisms of working memory training effects: the enhancement mechanism of working memory and the automatic processing inhibition mechanism of repetitive tasks [58]. The continuous 11 days of immersive and more complex gamified cognitive training may accelerate the transition to the automatic processing inhibition mechanism. Furthermore, Liu et al. found that subjects exhibited a reduction in medial frontal θ band PSD after five consecutive days of training, indicating that local θ activity may be positively correlated with cognitive demand [41]. This is consistent with our findings, where cognitive training led to less conflict in decision-making and consumed fewer brain resources. Cognitive training may enhance control over the allocation of limited brain resources [59]. Miró-Padilla et al. used fMRI to measure participants after five weeks of N-back training, showing that cognitive training’s improvement in behavioral performance is related to reduced brain activation, and the improvement in neural processing efficiency can be maintained over time [60].
Regular visuo-spatial attention and working memory MTGCT lead to lateralization changes in the relevant brain regions during simulated flight tasks. This neuroplasticity specifically manifests as θ band leftward asymmetry in the frontal lobe and α band rightward asymmetry in the frontoparietal lobe, with the established asymmetry pattern persisting for at least two weeks. Related studies have shown that learning and training can induce asymmetric plastic changes in the relevant brain regions [32]. The cognitive workloads in different flight phases modulate prefrontal cortical asymmetry [61]. Our findings further corroborate these conclusions. In the post-test and tracking test phases of this study, the TG exhibited θ band leftward asymmetry in the frontal lobe, with the absolute values of the A S M I of the frontal electrodes generally being larger than in the pre-test phase, indicating a higher degree of lateralization. Previous studies have shown that the left frontal lobe is closely related to executive functions and cognitive control, and the desynchronization of the θ band between the left and right hemispheres is a key factor for the improvement in executive function performance [11]. Our findings are consistent with these results. Specifically, MTGCT may enhance the θ band activity in the left hemisphere to strengthen the executive function network, thereby improving the performance in simulated flight operation tasks. The leftward asymmetry in the θ band indicates that the brain gradually adapts to and optimizes cognitive demands during cognitive training by enhancing the activity of the left frontal region. Similarly, we found that in the post-test and tracking test phases, the α band in the frontal and parietal regions of the TG exhibited rightward asymmetry. This is consistent with related research findings that the α band reveals a rightward bias in the frontoparietal regions associated with the attention system [33,34,62]. Studies have shown that the activity of the α band in the right hemisphere can be seen as a potential neural characteristic related to executive functions [11]. Particularly in tasks involving highly focused simulated flight operations, the rightward asymmetry of the α band may reflect an optimized strategy for brain resource allocation. Additionally, α band asymmetry also forms during the processes of long-term memory and cognitive differentiation [11]. After MTGCT, the enhanced alpha band activity in the right hemisphere may be due to the right hemisphere being more adept at processing spatial and non-verbal information, reflecting an overall improvement of brain in cognitive efficiency during the cognitive training process. The short-term adaptive changes in θ and α band asymmetry during the MTGCT process can serve as important theoretical bases for understanding neural mechanisms. The asymmetric patterns of brain neural activity formed in this study exhibited a duration of at least two weeks, suggesting that MTGCT can lead to a reduction in brain activation levels and an improvement in neural processing efficiency in the short term. Cognitive training is associated with high levels of self-control and automation capabilities, which can induce brain asymmetry, thereby reducing task load and enhancing physical perception abilities [63]. This indicates that the performance improvements induced by MTGCT may not be limited to simulated flight tasks but could transfer to other tasks requiring high executive function and cognitive control. Regular cognitive training may result in long-term improvements in physical functions and psychological states [63].
This study preliminarily verifies the enhancement effect of visuo-spatial attention and working memory MTGCT on simulated flight operational capabilities and reveals the improvement in behavioral performance accompanying the phased PSD and asymmetry changes in the θ and α bands. These findings not only help us to better understand the neural mechanisms behind cognitive training but also provide scientific evidence for developing more effective training schemes. Nevertheless, further exploration is needed to optimize and personalize MTGCT protocols, dynamically adjusting training plans based on participants’ task performance and cognitive assessments. Additionally, it is crucial to parameterize training frequency, duration, and intensity according to factors such as age, cognitive level, and neurophysiological characteristics to understand the dose-response relationship of MTGCT in depth [43,64]. This will help implement evidence-based training interventions to maximize transfer effects.

5. Limitations and Future Research

This study has several limitations, including a small sample size with population restrictions, an imbalance in the number of individuals in the CG and TG, low ecological validity, the absence of assessments during the training period, insufficient data analysis, a lack of exploration of the dose-response effect, and a lack of assessment of long-term effects.
  • The study included a small sample size of male university students, all of whom lacked flight experience. Although these settings are designed to more easily control the laboratory environment and eliminate variables arising from gender differences, cultural differences, and differences in flying experience, they do indeed severely limit the generalizability of the research findings. Therefore, future research should expand the sample size and include professional pilots as participants to verify the applicability and effectiveness of this study’s results in a broader population;
  • After screening the 46 recruited subjects, there were 9 remaining in the CG and 19 remaining in the TG. During the experiment, we implemented strict control over experimental conditions and unified execution standards. However, due to the instability of performance in flight operation tasks, most participants in the CG were unable to meet the data recording standards or complete the tasks during the post-test or tracking test phase. Although this indirectly indicates that cognitive training generally improved the stability of participants’ operations, this limitation should be taken into full account when interpreting the results. Future research should consider the issue of sample attrition by increasing the sample size during initial recruitment or promptly supplementing participants to ensure balanced group sizes and obtain more reliable results;
  • Due to the participants’ lack of flight experience, the simulated flight tasks in this study were relatively simple. This may restrict the far transfer and generalization capabilities of MTGCT to real-world complex flight tasks. It remains to be explored whether the cognitive improvements from visuo-spatial attention and working memory MTGCT can transfer to more complex flight tasks, such as dual-task or multi-task operations and flying in adverse weather conditions. Future research should increase task complexity to verify MTGCT’s transferability and generalization performance in real-world scenarios, thereby enhancing the study’s ecological validity;
  • This study only examined changes in simulated flight task performance and EEG data characteristics before and after training. The neurophysiological changes during the training process were not thoroughly analyzed. Future research should include intermediate testing phases to explore the detailed evolution of EEG signal characteristics throughout the training period, thereby gaining a more thorough understanding of the dynamic effects and mechanisms of MTGCT;
  • The study did not analyze the specific EEG frequency band changes from traditional cognitive tests during the pre-test, post-test, and tracking test phases, and the analysis of behavioral data was also not thorough enough. In particular, the N-back test does not distinguish the difficulty of the task. In this study, we prefer to analyze data directly related to the simulated flight task to explore the far transfer effects of MTGCT. Future research should further analyze data from traditional cognitive tests to enhance and expand the theoretical foundation from near transfer to far transfer;
  • The study administered an 11-day MTGCT, with daily training comprising 30 min of visual-spatial attention training and 30 min of working memory training. The study did not sufficiently investigate different training dosages, such as training frequency, duration, and intensity. Future research should consider setting different training dosage groups to comprehensively explore the impact of varying dosages of MTGCT on performance enhancement. Additionally, future studies should account for individual differences in training dosage effects, such as age differences and cognitive sensitivity variations across a broader population;
  • The 14-day retention period after training is relatively short, limiting the ability to assess long-term effects maximum duration of neurophysiological changes caused by MTGCT. Future studies should extend the experimental period to more comprehensively evaluate the long-term efficacy of cognitive training, ensuring the durability and stability of the MTGCT in practical applications.

6. Conclusions

This study employed a longitudinal design framework encompassing five phases: pre-test, training, post-test, retention, and tracking test. A total of 28 college student participants were divided into control and training groups for a 28-day simulated flight performance enhancement experiment. Compared to the untrained CG, the TG, which underwent 11 days of visuo-spatial attention and working memory MTGCT, showed significant improvement in performance across the traditional cognitive test and eight simulated flight tasks. The gamified elements, which were more engaging and closely aligned with the operational task scenarios, led to far transfer effects beyond the specific cognitive training tasks, enhancing performance in the simulated flight tasks. Further analysis of neurophysiological changes through EEG revealed that the improvement in task performance was attributable to enhanced cognitive abilities. In terms of PSD characteristics, there was a decrease in the θ relative band ratio and an increase in the α relative band ratio in the frontal and parietal lobes. This may be due to the MTGCT accelerating the transition to automated processing inhibition mechanisms, resulting in reduced brain resource consumption during simulated flight tasks. Regarding brain asymmetry, there was θ band leftward asymmetry in the frontal lobe and α band rightward asymmetry in the frontoparietal lobe. This could be due to the enhancement of self-control and automation abilities induced by MTGCT, leading to improved perceptual capabilities during simulated flight tasks. Moreover, changes in both PSD characteristics and brain asymmetry persisted within the two-week retention period, indicating that the improvement in neural processing efficiency brought about by MTGCT has a certain retention effect. Although the maximum duration of long-term effect was not explored in this study, these findings provide a scientific basis for developing more effective flight training schemes.
Future research should aim to expand the size of the experiment by increasing the sample size, ensuring balanced experimental groups, including professional pilots, increasing the complexity of flight tasks, enriching the analysis of the experimental process, and extending the experimental period to further validate and expand upon the findings of this study. Future studies will also explore additional EEG features or incorporate other modalities of brain signals, such as fNIRS, to help us gain a deeper understanding of the neural mechanisms underlying cognitive training. This will provide theoretical support and a highly explanatory neural framework for designing scientific training schemes in the field of aviation and other practical operating scenarios requiring cognitive ability enhancement.

Author Contributions

Conceptualization, P.D., C.L. and Y.L.; methodology, P.D., C.L. and S.W.; software, Y.X. and S.W.; validation, Z.Z., Y.X. and S.W.; formal analysis, P.D. and Y.X.; investigation, Z.Z. and Y.X.; resources, X.S. and Y.L.; data curation, P.D. and C.L.; writing—original draft preparation, P.D. and Y.L.; writing—review and editing, P.D. and Y.L.; visualization, C.L. and Y.X.; supervision, X.S. and Y.L.; project administration, X.S. and Y.L.; funding acquisition, Y.L. All authors have read and agreed to the published version of the manuscript.

Funding

This research received no external funding.

Institutional Review Board Statement

The study was conducted in accordance with the Declaration of Helsinki, and approved by the Ethics Committee of Beijing Normal University (protocol code IRB_A_0075_2023001 and date of approval is 25 April 2023).

Informed Consent Statement

Informed consent was obtained from all subjects involved in the study.

Data Availability Statement

The data presented in this study are not readily available due to restrictions related to ongoing analyses and further research development. For any inquiries, please contact the corresponding author.

Conflicts of Interest

The authors declare no conflicts of interest.

References

  1. Walmsley, S.; Gilbey, A. Cognitive biases in visual pilots’ weather-related decision making. Appl. Cogn. Psychol. 2016, 30, 532–543. [Google Scholar] [CrossRef]
  2. Li, Q.; Leung, H.C.; Ho, M.H.; Leung, K.L.; Ng, K.K.; Yiu, C.Y. The effects of aeronautical decision-making models on student pilots’ situational awareness and cognitive workload in simulated non-normal flight deck environment. Int. J. Aerosp. Psychol. 2023, 33, 197–213. [Google Scholar] [CrossRef]
  3. Zhang, C.; Yuan, J.; Jiao, Y.; Liu, H.; Fu, L.; Jiang, C.; Wen, C. Variation of pilots’ mental workload under emergency flight conditions induced by different equipment failures: A flight simulator study. Transp. Res. Rec. 2024, 2678, 365–377. [Google Scholar] [CrossRef]
  4. Callan, D.E.; Durantin, G.; Terzibas, C. Classification of single-trial auditory events using dry-wireless EEG during real and motion simulated flight. Front. Syst. Neurosci. 2015, 9, 11. [Google Scholar] [CrossRef]
  5. van Weelden, E.; Wiltshire, T.J.; Alimardani, M.; Louwerse, M.M. Exploring the impact of virtual reality flight simulations on EEG neural patterns and task performance. Cogn. Syst. Res. 2024, 88, 101282. [Google Scholar] [CrossRef]
  6. Zhao, M.; Jia, W.; Jennings, S.; Law, A.; Bourgon, A.; Su, C.; Larose, M.H.; Grenier, H.; Bowness, D.; Zeng, Y. Monitoring pilot trainees’ cognitive control under a simulator-based training process with EEG microstate analysis. Sci. Rep. 2024, 14, 24632. [Google Scholar] [CrossRef] [PubMed]
  7. Dismukes, R.K.; Kochan, J.A.; Goldsmith, T.E. Flight crew errors in challenging and stressful situations. Aviat. Psychol. Appl. Hum. Factors 2018, 8. Available online: https://econtent.hogrefe.com/doi/abs/10.1027/2192-0923/a000129?journalCode=apf (accessed on 25 September 2025). [CrossRef]
  8. Heratika, D.; Kekalih, A.; Mulyawan, W.; Agustina, A.; Soemarko, D.S.; Siagian, M. The effect of the altitude zone on cognitive function for male pilots in indoctrination and aerophysiology training in 2019. Int. J. Appl. Pharm. 2020, 12, 12–14. [Google Scholar] [CrossRef]
  9. Zhou, W.G.; Yu, P.P.; Wu, L.H.; Cao, Y.F.; Zhou, Y.; Yuan, J.J. Pilot turning behavior cognitive load analysis in simulated flight. Front. Neurosci. 2024, 18, 1450416. [Google Scholar] [CrossRef] [PubMed]
  10. Young, M.S.; Brookhuis, K.A.; Wickens, C.D.; Hancock, P.A. State of science: Mental workload in ergonomics. Ergonomics 2015, 58, 1–17. [Google Scholar] [CrossRef]
  11. Basharpoor, S.; Heidari, F.; Molavi, P. EEG coherence in theta, alpha, and beta bands in frontal regions and executive functions. Appl. Neuropsychol. Adult 2021, 28, 310–317. [Google Scholar] [CrossRef]
  12. Sturman, D.; Wiggins, M.W.; Auton, J.C.; Loft, S.; Helton, W.S.; Westbrook, J.I.; Braithwaite, J. Control room operators’ cue utilization predicts cognitive resource consumption during regular operational tasks. Front. Psychol. 2019, 10, 1967. [Google Scholar] [CrossRef] [PubMed]
  13. Cui, Z.; Sato, T.; Jackson, A.; Jayarathna, S.; Itoh, M.; Yamani, Y. Gaze transition entropy as a measure of attention allocation in a dynamic workspace involving automation. Sci. Rep. 2024, 14, 23405. [Google Scholar] [CrossRef]
  14. Kobayashi, H.; Yasuda, T.; Shinozaki, S. Use of visual working memory in a manipulative task. In Proceedings of the 2008 International Conference on Control, Automation and Systems, Seoul, Republic of Korea, 14–17 October 2008; IEEE: Piscataway, NJ, USA, 2008; pp. 2807–2811. [Google Scholar]
  15. Taya, F.; Sun, Y.; Babiloni, F.; Thakor, N.; Bezerianos, A. Brain enhancement through cognitive training: A new insight from brain connectome. Front. Syst. Neurosci. 2015, 9, 44. [Google Scholar] [CrossRef]
  16. Fornette, M.P.; Bardel, M.H.; Lefrançois, C.; Fradin, J.; Massioui, F.E.; Amalberti, R. Cognitive-adaptation training for improving performance and stress management of air force pilots. Int. J. Aviat. Psychol. 2012, 22, 203–223. [Google Scholar] [CrossRef]
  17. Grinschgl, S.; Ninaus, M.; Wood, G.; Neubauer, A.C. To enhance or not to enhance: A debate about cognitive enhancement from a psychological and neuroscientific perspective. Phys. Life Rev. 2025, 54, 58–77. [Google Scholar] [CrossRef]
  18. Green, C.S.; Bavelier, D. Action video game modifies visual selective attention. Nature 2003, 423, 534–537. [Google Scholar] [CrossRef] [PubMed]
  19. Bavelier, D.; Green, C.S.; Han, D.H.; Renshaw, P.F.; Merzenich, M.M.; Gentile, D.A. Brains on video games. Nat. Rev. Neurosci. 2011, 12, 763–768. [Google Scholar] [CrossRef] [PubMed]
  20. Anguera, J.A.; Boccanfuso, J.; Rintoul, J.L.; Al-Hashimi, O.; Faraji, F.; Janowich, J.; Kong, E.; Larraburo, Y.; Rolle, C.; Johnston, E.; et al. Video game training enhances cognitive control in older adults. Nature 2013, 501, 97–101. [Google Scholar] [CrossRef]
  21. Olfers, K.J.; Band, G.P. Game-based training of flexibility and attention improves task-switch performance: Near and far transfer of cognitive training in an EEG study. Psychol. Res. 2018, 82, 186–202. [Google Scholar] [CrossRef]
  22. Fan, J.; McCandliss, B.D.; Sommer, T.; Raz, A.; Posner, M.I. Testing the efficiency and independence of attentional networks. J. Cogn. Neurosci. 2002, 14, 340–347. [Google Scholar] [CrossRef]
  23. Petersen, S.E.; Posner, M.I. The attention system of the human brain: 20 years after. Annu. Rev. Neurosci. 2012, 35, 73–89. [Google Scholar] [CrossRef]
  24. Klein, R.M.; Hassan, T.; Wilson, G.; Ishigami, Y.; Mulle, J. The AttentionTrip: A game-like tool for measuring the networks of attention. J. Neurosci. Methods 2017, 289, 99–109. [Google Scholar] [CrossRef]
  25. Scharinger, C.; Soutschek, A.; Schubert, T.; Gerjets, P. When flanker meets the n-back: What EEG and pupil dilation data reveal about the interplay between the two central-executive working memory functions inhibition and updating. Psychophysiology 2015, 52, 1293–1304. [Google Scholar] [CrossRef]
  26. Jaeggi, S.M.; Buschkuehl, M.; Jonides, J.; Perrig, W.J. Improving fluid intelligence with training on working memory. Proc. Natl. Acad. Sci. USA 2008, 105, 6829–6833. [Google Scholar] [CrossRef]
  27. Kawaguchi, K.; Nikai, Y.; Yomota, S.; Kawashima, A.; Inoue, Y.; Takahashi, M. Effects of age and flight experience on prefrontal cortex activity in airline pilots: An fNIRS study. Heliyon 2024, 10, e30242. [Google Scholar] [CrossRef] [PubMed]
  28. Klimesch, W. Alpha-band oscillations, attention, and controlled access to stored information. Trends Cogn. Sci. 2012, 16, 606–617. [Google Scholar] [CrossRef] [PubMed]
  29. Zhang, D.; Zhao, H.; Bai, W.; Tian, X. Functional connectivity among multi-channel EEGs when working memory load reaches the capacity. Brain Res. 2016, 1631, 101–112. [Google Scholar] [CrossRef]
  30. Hung, C.S.; Sarasso, S.; Ferrarelli, F.; Riedner, B.; Ghilardi, M.F.; Cirelli, C.; Tononi, G. Local experience-dependent changes in the wake EEG after prolonged wakefulness. Sleep 2013, 36, 59–72. [Google Scholar] [CrossRef] [PubMed]
  31. Aricò, P.; Borghini, G.; Graziani, I.; Taya, F.; Sun, Y.; Bezerianos, A.; Thakor, N.V.; Cincotti, F.; Babiloni, F. Towards a multimodal bioelectrical framework for the online mental workload evaluation. In Proceedings of the 2014 36th Annual International Conference of the IEEE Engineering in Medicine and Biology Society, Chicago, IL, USA, 26–30 August 2014; IEEE: Piscataway, NJ, USA, 2014; pp. 3001–3004. [Google Scholar]
  32. Zając-Lamparska, L.; Zabielska-Mendyk, E.; Zapała, D.; Augustynowicz, P. Differences in the lateralization of theta and alpha power during n-back task performance between older and young adults in the context of the hemispheric asymmetry reduction in older adults (HAROLD) Model. Symmetry 2024, 16, 1623. [Google Scholar] [CrossRef]
  33. Liu, H.; Stufflebeam, S.M.; Sepulcre, J.; Hedden, T.; Buckner, R.L. Evidence from intrinsic activity that asymmetry of the human brain is controlled by multiple factors. Proc. Natl. Acad. Sci. USA 2009, 106, 20499–20503. [Google Scholar] [CrossRef]
  34. Sun, Y.; Lim, J.; Kwok, K.; Bezerianos, A. Functional cortical connectivity analysis of mental fatigue unmasks hemispheric asymmetry and changes in small-world networks. Brain Cogn. 2014, 85, 220–230. [Google Scholar] [CrossRef]
  35. Moisello, C.; Meziane, H.B.; Kelly, S.; Perfetti, B.; Kvint, S.; Voutsinas, N.; Blanco, D.; Quartarone, A.; Tononi, G.; Ghilardi, M.F. Neural activations during visual sequence learning leave a trace in post-training spontaneous EEG. PLoS ONE 2013, 8, e65882. [Google Scholar] [CrossRef]
  36. Paradela, R.S.; de Oliveira Dias, P.; Detogni, A.; Sakaki, T.A.; Inácio, J.F.S.; Pellanda, L.C.; Rodrigues, C.G.; Irigoyen, M.C.; da Costa, D.I. Cogmed cognitive training for working memory: A systematic review and meta-analysis. Neuroscience 2025, 581, 95–103. [Google Scholar] [CrossRef]
  37. Guo, Z.; Qiu, R.; Qiu, H.; Lu, H.; Zhu, X. Long-term effects of repeated multitarget high-definition transcranial direct current stimulation combined with cognitive training on response inhibition gains. Front. Neurosci. 2023, 17, 1107116. [Google Scholar] [CrossRef] [PubMed]
  38. Alain, C.; Moussard, A.; Singer, J.; Lee, Y.; Bidelman, G.M.; Moreno, S. Music and visual art training modulate brain activity in older adults. Front. Neurosci. 2019, 13, 182. [Google Scholar] [CrossRef] [PubMed]
  39. Salminen, T.; Strobach, T.; Schubert, T. On the impacts of working memory training on executive functioning. Front. Hum. Neurosci. 2012, 6, 166. [Google Scholar] [CrossRef] [PubMed]
  40. Li, W.; Zhang, Q.; Qiao, H.; Jin, D.; Ngetich, R.K.; Zhang, J.; Jin, Z.; Li, L. Dual n-back working memory training evinces superior transfer effects compared to the method of loci. Sci. Rep. 2021, 11, 3072. [Google Scholar] [CrossRef]
  41. Liu, M.; Zhang, J.; Jia, W.; Chang, Q.; Shan, S.; Hu, Y.; Wang, D. Enhanced executive attention efficiency after adaptive force control training: Behavioural and physiological results. Behav. Brain Res. 2019, 376, 111859. [Google Scholar] [CrossRef]
  42. Aksayli, N.D.; Sala, G.; Gobet, F. The cognitive and academic benefits of Cogmed: A meta-analysis. Educ. Res. Rev. 2019, 27, 229–243. [Google Scholar] [CrossRef]
  43. Tapia, J.L.; Sánchez-Borda, D.; Duñabeitia, J.A. The effects of cognitive training on driving performance. Cogn. Process. 2025, 26, 219–230. [Google Scholar] [CrossRef]
  44. Baniqued, P.L.; Kranz, M.B.; Voss, M.W.; Lee, H.; Cosman, J.D.; Severson, J.; Kramer, A.F. Cognitive training with casual video games: Points to consider. Front. Psychol. 2014, 4, 1010. [Google Scholar] [CrossRef]
  45. Ruiz-Segura, A.; Law, A.; Jennings, S.; Bourgon, A.; Churchill, E.; Lajoie, S. Flight emotions unleashed: Navigating training phases and difficulty levels in simulated flying. J. Comput. Assist. Learn. 2024, 40, 2926–2947. [Google Scholar] [CrossRef]
  46. Wielgopolan, A.; Imbir, K.K. Cognitive load and deception detection performance. Cogn. Sci. 2023, 47, e13321. [Google Scholar] [CrossRef]
  47. Fairclough, S.H.; Ewing, K. The effect of task demand and incentive on neurophysiological and cardiovascular markers of effort. Int. J. Psychophysiol. 2017, 119, 58–66. [Google Scholar] [CrossRef] [PubMed]
  48. Liu, G.; Zhu, B. Dynamic EEG-fMRI mapping: Revealing the relationship between brain connectivity and cognitive state. arXiv 2024, arXiv:2411.19922. [Google Scholar]
  49. Sauseng, P.; Griesmayr, B.; Freunberger, R.; Klimesch, W. Control mechanisms in working memory: A possible function of EEG theta oscillations. Neurosci. Biobehav. Rev. 2010, 34, 1015–1022. [Google Scholar] [CrossRef] [PubMed]
  50. Cavanagh, J.F.; Frank, M.J. Frontal theta as a mechanism for cognitive control. Trends Cogn. Sci. 2014, 18, 414–421. [Google Scholar] [CrossRef]
  51. Andreu-Sánchez, C.; Martín-Pascual, M.Á.; Gruart, A.; Delgado-García, J.M. Brain symmetry in alpha band when watching cuts in movies. Symmetry 2022, 14, 1980. [Google Scholar]
  52. Mathewson, K.J.; Hashemi, A.; Sheng, B.; Sekuler, A.B.; Bennett, P.J.; Schmidt, L.A. Regional electroencephalogram (EEG) alpha power and asymmetry in older adults: A study of short-term test–retest reliability. Front. Aging Neurosci. 2015, 7, 177. [Google Scholar] [CrossRef]
  53. Smith, E.E.; Reznik, S.J.; Stewart, J.L.; Allen, J.J. Assessing and conceptualizing frontal EEG asymmetry: An updated primer on recording, processing, analyzing, and interpreting frontal alpha asymmetry. Int. J. Psychophysiol. 2017, 111, 98–114. [Google Scholar] [CrossRef] [PubMed]
  54. Hankins, T.C.; Wilson, G.F. A comparison of heart rate, eye activity, EEG and subjective measures of pilot mental workload during flight. Aviat. Space, Environ. Med. 1998, 69, 360–367. [Google Scholar]
  55. Verkennis, B.; Van Weelden, E.; Marogna, F.L.; Alimardani, M.; Wiltshire, T.J.; Louwerse, M.M. Predicting workload in virtual flight simulations using eeg spectral and connectivity features. In Proceedings of the 2025 IEEE International Conference on Artificial Intelligence and eXtended and Virtual Reality (AIxVR), Lisbon, Portugal, 27–29 January 2025; IEEE: Piscataway, NJ, USA, 2025; pp. 82–89. [Google Scholar]
  56. Sterman, M.B.; Mann, C.A.; Kaiser, D.A.; Suyenobu, B.Y. Multiband topographic EEG analysis of a simulated visuomotor aviation task. Int. J. Psychophysiol. 1994, 16, 49–56. [Google Scholar] [CrossRef]
  57. Olesen, P.J.; Westerberg, H.; Klingberg, T. Increased prefrontal and parietal activity after training of working memory. Nat. Neurosci. 2004, 7, 75–79. [Google Scholar] [CrossRef] [PubMed]
  58. Hempel, A.; Giesel, F.L.; Garcia Caraballo, N.M.; Amann, M.; Meyer, H.; Wüstenberg, T.; Essig, M.; Schröder, J. Plasticity of cortical activation related to working memory during training. Am. J. Psychiatry 2004, 161, 745–747. [Google Scholar] [CrossRef]
  59. Slagter, H.A.; Lutz, A.; Greischar, L.L.; Francis, A.D.; Nieuwenhuis, S.; Davis, J.M.; Davidson, R.J. Mental training affects distribution of limited brain resources. PLoS Biol. 2007, 5, e138. [Google Scholar] [CrossRef]
  60. Miró-Padilla, A.; Bueichekú, E.; Ventura-Campos, N.; Flores-Compañ, M.J.; Parcet, M.A.; Ávila, C. Long-term brain effects of N-back training: An fMRI study. Brain Imaging Behav. 2019, 13, 1115–1127. [Google Scholar] [CrossRef]
  61. Mohanavelu, K.; Poonguzhali, S.; Adalarasu, K.; Ravi, D.; Vinutha, S.; Ramachandran, K. Dynamic cognitive workload assessment for fighter pilots in simulated fighter aircraft environment using EEG. Biomed. Signal Process. Control 2020, 61, 102018. [Google Scholar]
  62. Wang, B.; Yang, L.; Yan, W.; An, W.; Xiang, J.; Li, D. Brain asymmetry: A novel perspective on hemispheric network. Brain Sci. Adv. 2023, 9, 56–77. [Google Scholar] [CrossRef]
  63. Chen, C.C.; Crews, D. Acute Effects of Cognitive Training Game on Functional Brain Asymmetry and Motor Performance in Golf Putting: A Pilot Study. Int. J. Kinesiol. High. Educ. 2023, 7, 181–193. [Google Scholar] [CrossRef]
  64. Liu, L.; Wang, H.; Xing, Y.; Zhang, Z.; Zhang, Q.; Dong, M.; Ma, Z.; Cai, L.; Wang, X.; Tang, Y. Dose–response relationship between computerized cognitive training and cognitive improvement. NPJ Digit. Med. 2024, 7, 214. [Google Scholar] [CrossRef] [PubMed]
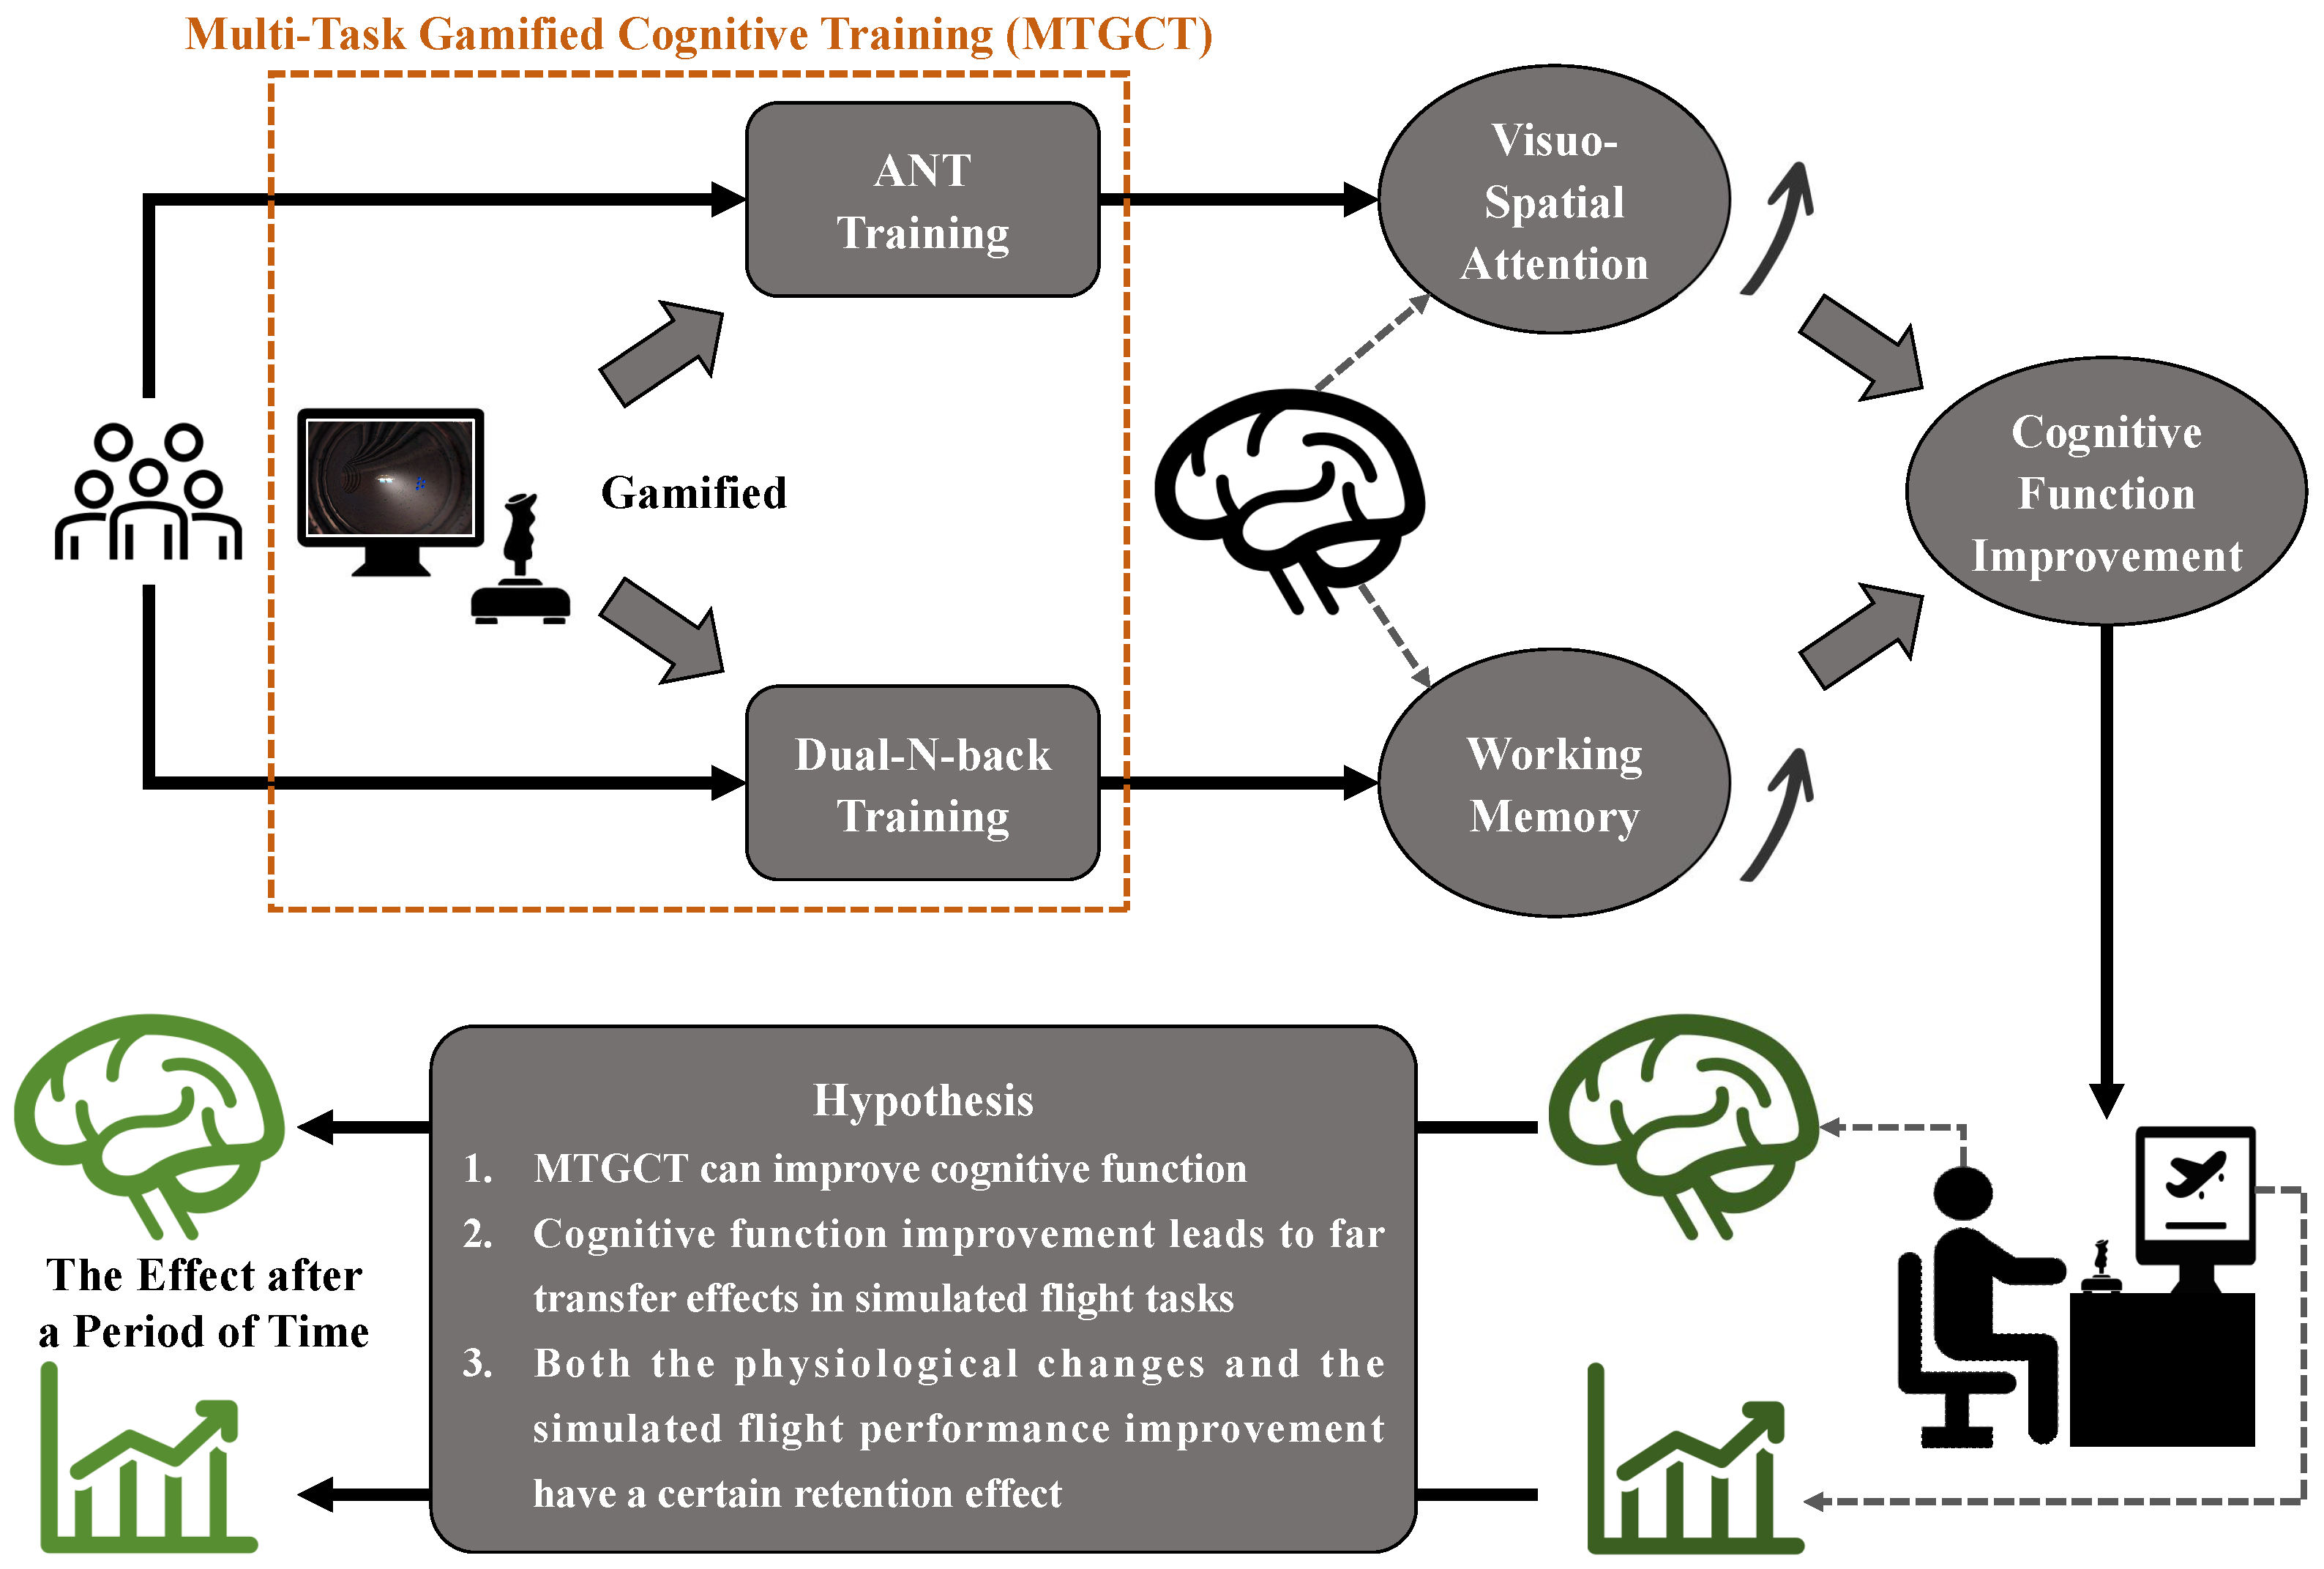
Figure 1. The framework of the MTGCT method.
Symmetry 17 01627 g001
Figure 2. Overall procedure arrangement and content of the simulated flight operation enhancement experiment. (a) The ANT and N-back training gamification design interface based on MTGCT and joystick button indicators. (b) The experiment employed a longitudinal design framework with five phases: pre-test, training, post-test, retention, and tracking test, with a total duration of 28 days. Day 1 was the pre-test, days 2 to 12 were the training period (participated only by the TG), day 13 was the post-test, days 14 to 27 were the retention period, and day 28 was the tracking test. The test contents in the pre-test, post-test, and tracking test phases were consistent, including the simulated flight operation test and traditional cognitive test. (c) Experimental scenarios and task content for the simulated flight operation test. The task content includes a baseline task and eight simulated flight operation tasks, where Tasks 1, 3, 5, and 7 are altitude adjustment tasks, and Tasks 2, 4, 6, and 8 are heading adjustment tasks. (d) Traditional cognitive test includes the ANT test and the N-back test. * represents p < 0.05 .
Symmetry 17 01627 g002
Figure 3. Electrode placement of the 29 EEG electrodes during the experiment. AFz serves as the ground electrode, and TP9 and TP10 are reference electrodes. Based on the division of the left and right hemispheres, Fp1-Fp2, F3-F4, F7-F8, FC1-FC2, FC5-FC6, C3-C4, CP1-CP2, CP5-CP6, P3-P4, P7-P8, and O1-O2 form 11 homologous symmetrical electrode pairs.
Symmetry 17 01627 g003
Figure 4. Traditional cognitive test scores for the control group (CG) and training group (TG) across the pre-test, post-test, and tracking test phases. Traditional cognitive test scores include accuracy and reaction time. The higher the accuracy and the shorter the reaction time, the better the performance. Significant differences between phases are marked. * represents p < 0.05 , *** represents p < 0.001 , and **** represents p < 0.0001 . (a) ANT test scores. (b) N-back test (2-back to 7-back) scores.
Symmetry 17 01627 g004
Figure 5. Simulated flight operation performance data for the control group (CG) and training group (TG) across the pre-test, post-test, and tracking test phases. Simulated flight operation performance includes finish time and operating error, with lower values indicating better performance. Significant differences between phases are marked. * represents p < 0.05 , ** represents p < 0.01 , *** represents p < 0.001 , and **** represents p < 0.0001 .
Symmetry 17 01627 g005
Figure 6. Normalized EEG full-band mean PSD for the control group (CG) and training group (TG), mapped onto whole-brain topography maps across three phases (pre-test, post-test, and tracking test) × three tests (ANT test, N-back test, and simulated flight operation test). Significant difference results of each electrode position have been marked. * represents p < 0.05 , ** represents p < 0.01 , *** represents p < 0.001 , and **** represents p < 0.0001 . In the pre-test phase, an independent sample t-test was used to analyze the difference in the full-band PSD mean between CG and TG at the initial phase. In the same group, a paired sample t-test was used to analyze the differential changes in the full-band PSD mean between the post-test phase and the pre-test phase, as well as between the tracking test phase and the post-test phase. All p-value results were obtained through Bonferroni correction at 26 electrode positions.
Symmetry 17 01627 g006
Figure 7. Illustration of θ band PSD relative band ratio changes during simulated flight tasks. (a) Whole-brain topography map of the θ band mean I n t e r - G r o u p R a t i o for the eight simulated flight tasks across the pre-test, post-test, and tracking test phases. (b) Trends in θ band PSD relative band ratio for all EEG electrodes during the eight simulated flight tasks in the control group (CG) and training group (TG) across the three phases.
Symmetry 17 01627 g007
Figure 8. Box plots of θ band asymmetry analysis for the eight simulated flight tasks, displaying A S M I values for the 11 electrode pairs in the control group (CG) and training group (TG) during the pre-test (pr), post-test (po), and tracking test (tr) phases. The red dashed line represents the reference line at 0, positive values indicate rightward asymmetry, while negative values indicate leftward asymmetry. Results of one-sample t-test for zero-mean significance are marked on the top axis of each task plot frame. * represents p < 0.05 , ** represents p < 0.01 , *** represents p < 0.001 , and **** represents p < 0.0001 .
Symmetry 17 01627 g008aSymmetry 17 01627 g008b
Figure 9. Illustration of α band PSD relative band ratio changes during simulated flight tasks. (a) Whole-brain topography map of the θ band mean I n t e r - G r o u p R a t i o for the eight simulated flight tasks across the pre-test, post-test, and tracking test phases. (b) Trends in α band PSD relative band ratio for all EEG electrodes during the eight simulated flight tasks in the control group (CG) and training group (TG) across the three phases.
Symmetry 17 01627 g009
Figure 10. Box plotsof α band asymmetry analysis for the eight simulated flight tasks, displaying A S M I values for the 11 electrode pairs in the control group (CG) and training group (TG) during the pre-test (pr), post-test (po), and tracking test (tr) phases. The red dashed line represents the reference line at 0, positive values indicate rightward asymmetry, while negative values indicate leftward asymmetry. Results of one-sample t-test for zero-mean significance are marked on the top axis of each task plot frame. * represents p < 0.05 , ** represents p < 0.01 , *** represents p < 0.001 , and **** represents p < 0.0001 .
Symmetry 17 01627 g010aSymmetry 17 01627 g010b
Table 1. The corresponding brain regions and electrode pair numbers of 11 homogenous symmetrical electrode pairs.
Belonging Brain RegionLeft HemisphereRight HemisphereElectrode Pair Number
FrontalFp1Fp2EP-F01
F3F4EP-F02
F7F8EP-F03
FC1FC2EP-F04
FC5FC6EP-F05
SomatomotorC3C4EP-S01
CP1CP2EP-S02
CP5CP6EP-S03
ParietalP3P4EP-P01
P7P8EP-P02
OccipitalO1O2EP-O01
Table 2. Detailed statistical analysis results of the simulated flight task performance. FT represents the finish time. OE represents the operating error. CG represents the control group. TG represents the training group.
TaskGradeGroupMauchly TestGreenhouse-
Geisser
Correction
One-Way Repeated Measures ANOVATukey Test
W χ 2 ( 2 ) p-ValueFp-Value η p 2 Pre vs.
Post
Pre vs.
Tracking
Post vs.
Tracking
Task 1FTCG0.74942.0190p = 0.3644NoF(2, 16) = 20.1625p < 0.00010.7159p < 0.05p < 0.0001p < 0.01
TG0.55599.9826p < 0.01YesF(1.3849, 24.9286)
= 87.2010
p < 0.00010.8289p < 0.0001p < 0.0001p < 0.05
OECG0.50054.8457p = 0.0887NoF(2, 16) = 10.6326p < 0.010.5706p = 0.0877p < 0.001p = 0.0802
TG0.209926.5373p < 0.0001YesF(1.173, 20.1109)
= 32.1971
p < 0.00010.6414p < 0.0001p < 0.0001p = 0.8360
Task 2FTCG0.93410.4774p = 0.7877NoF(2, 16) = 20.7936p < 0.00010.7222p < 0.0001p < 0.001p = 0.4862
TG0.460713.1737p < 0.01YesF(1.2993, 23.3879)
= 70.3690
p < 0.00010.7963p < 0.0001p < 0.0001p = 0.5971
OECG0.43885.7665p = 0.0560NoF(2, 16) = 5.0114p < 0.050.3852p < 0.05p = 0.1391p = 0.5282
TG0.67556.6688p < 0.05YesF(1.5100, 27.1803)
= 55.1079
p < 0.00010.7538p < 0.0001p < 0.0001p = 0.7460
Task 3FTCG0.96310.2630p = 0.8768NoF(2, 16) = 9.6304p < 0.010.5462p < 0.05p < 0.01p = 0.3563
TG0.440013.9552p < 0.001YesF(1.2821, 23.0775)
= 74.9872
p < 0.00010.8064p < 0.0001p < 0.0001p < 0.05
OECG0.48974.9981p = 0.0822NoF(2, 16) = 6.0235p < 0.050.4295p < 0.05p < 0.05p = 0.9239
TG0.397415.6901p < 0.001YesF(1.2479, 22.4628)
= 39.2536
p < 0.00010.6856p < 0.0001p < 0.0001p = 0.9872
Task 4FTCG0.72292.2711p = 0.3213NoF(2, 16) = 16.9581p < 0.0010.6795p < 0.01p < 0.001p = 0.4151
TG0.398115.6589p < 0.001YesF(1.2485, 22.4730)
= 60.2832
p < 0.00010.7701p < 0.0001p < 0.0001p = 0.0619
OECG0.216210.7222p < 0.01YesF(1.1212, 8.9694)
= 3.1571
p = 0.06990.2830---
TG0.419714.7593p < 0.001YesF(1.2656, 22.7806)
= 60.4451
p < 0.00010.7705p < 0.0001p < 0.0001p = 0.8841
Task 5FTCG0.95850.2971p = 0.8620NoF(2, 16) = 12.8779p < 0.0010.6168p < 0.01p < 0.001p = 0.5980
TG0.64307.5067p < 0.05YesF(1.4739, 26.5296)
= 68.6504
p < 0.00010.7923p < 0.0001p < 0.0001p = 0.2447
OECG0.71462.3522p = 0.3085NoF(2, 16) = 3.9916p < 0.050.3329p = 0.2937p < 0.05p = 0.4330
TG0.66266.9966p < 0.05YesF(1.4955, 26.9181)
= 23.8963
p < 0.00010.5704p < 0.0001p < 0.0001p = 0.6357
Task 6FTCG0.35857.1804p < 0.05YesF(1.2184, 9.7473)
= 14.9266
p < 0.0010.6511p < 0.001p < 0.001p = 0.9423
TG0.68086.5359p < 0.05YesF(1.5161, 27.2896)
= 74.2114
p < 0.00010.8048p < 0.0001p < 0.0001p = 0.9989
OECG0.40216.3776p < 0.05YesF(1.2516, 10.0131)
= 4.8218
p < 0.050.3761p < 0.05p = 0.0567p = 0.9453
TG0.58709.0566p < 0.05YesF(1.4154, 25.4776)
= 23.4713
p < 0.00010.5660p < 0.0001p < 0.0001p = 0.9531
Task 7FTCG0.71012.3960p = 0.3018NoF(2, 16) = 19.8175p < 0.00010.7124p < 0.01p < 0.0001p = 0.2626
TG0.59748.7578p < 0.05YesF(1.4259, 25.6667)
= 40.1103
p < 0.00010.6902p < 0.0001p < 0.0001p = 0.9875
OECG0.76131.9092p = 0.3850NoF(2, 16) = 8.8913p < 0.010.5264p < 0.01p < 0.01p = 0.9999
TG0.75864.6977p = 0.0955NoF(2, 36) = 102.3400p < 0.00010.8504p < 0.0001p < 0.0001p = 0.2673
Task 8FTCG0.79111.6403p = 0.4404NoF(2, 16) = 5.2577p < 0.050.3966p = 0.1522p < 0.05p = 0.4440
TG0.404015.406p < 0.001YesF(1.2532, 22.5569)
= 56.5552
p < 0.00010.7586p < 0.0001p < 0.0001p < 0.05
OECG0.69412.5557p = 0.2786NoF(2, 16) = 0.6902p = 0.51580.0794---
TG0.73285.2858p = 0.0712NoF(2, 36) = 42.4158p < 0.00010.7021p < 0.0001p < 0.0001p = 0.8695
Table 3. The θ and α bands PSD relative band ratios and their average values of the simulated flight operation tasks of the control group and the training group in different phases.
GroupPhaseSimulated Flight Operation TasksAverage
Task 1Task 2Task 3Task 4Task 5Task 6Task 7Task 8
θ Band PSD Relative Band Ratio
Control
Group
Pre-Test0.23020.22700.23500.21440.21040.21040.20200.19330.2153
Post-Test0.19830.22520.22260.22040.22570.21910.22520.24760.2230
Tracking Test0.22190.19840.16750.16150.21080.21490.22650.20280.2005
Training
Group
Pre-Test0.19800.19400.18680.19560.19000.19700.19320.19380.1935
Post-Test0.16030.16720.16930.16530.16530.17310.17390.17240.1684
Tracking Test0.16960.16750.16150.16150.17430.18150.18390.18510.1731
α Band PSD Relative Band Ratio
Control
Group
Pre-Test0.13010.12740.14310.12770.14070.14560.14470.14660.1383
Post-Test0.18140.16020.19560.16230.13990.16210.13920.14700.1610
Tracking Test0.13370.13760.12960.14200.15300.15910.13700.13880.1414
Training
Group
Pre-Test0.11340.10770.10780.10380.11510.11120.12220.11470.1120
Post-Test0.16120.14560.15790.15840.15410.15850.15560.14640.1547
Tracking Test0.13190.13770.14290.13240.12950.14300.13900.13180.1360
Disclaimer/Publisher’s Note: The statements, opinions and data contained in all publications are solely those of the individual author(s) and contributor(s) and not of MDPI and/or the editor(s). MDPI and/or the editor(s) disclaim responsibility for any injury to people or property resulting from any ideas, methods, instructions or products referred to in the content.