Article

CFD-Based Design of an Asymmetric Twisted Flap Rudder for Lift Enhancement at Small Deflection Angles

School of Physics Science and Information Engineering, Liaocheng University, Liaocheng 252000, China
*
Author to whom correspondence should be addressed.
Symmetry 2025, 17(10), 1613; https://doi.org/10.3390/sym17101613
Submission received: 12 July 2025 / Revised: 25 August 2025 / Accepted: 5 September 2025 / Published: 29 September 2025
(This article belongs to the Section Physics)

Abstract

In response to growing demand for autonomous and energy-efficient offshore operations, unmanned sailboats have emerged as promising platforms for next-generation marine applications. As the primary control surface, the rudder plays a pivotal role in enabling precise maneuvering and maintaining course stability. This study proposes an asymmetric aft-twisted flap rudder integrating a symmetric streamlined main rudder with an asymmetric flap. The design aims to enhance lift generation at small deflection angles, thus improving the hydrodynamic performance and response characteristics of rudder systems. The flap size for the conventional symmetric rudder was first determined from computational fluid dynamics (CFD) simulation results. To further improve lift performance, a 45° curved transition section was introduced at the junction between the main rudder and the flap to enhance flow attachment and reduce viscous drag. Building on this configuration, the asymmetric twisted flap was incorporated into the improved rudder design. CFD results indicate that the lift coefficient increased by approximately 27%. Comparative CFD analyses with the conventional symmetric flap rudder and the streamlined rudder revealed distinct coupled flow characteristics under various combinations of rudder and flap angles. These findings offer valuable insights into the hydrodynamic optimization of control surfaces in autonomous marine systems.

1. Introduction

Traditional ocean exploration technologies include ocean buoys, ships, submarines, and unmanned aerial vehicles (UAVs) [1,2]. As an extension of ship-based platforms, unmanned sailboats harness wind energy for propulsion using wing sails [3], while their rudder and navigation systems are electrically actuated to regulate heading and maintain course. This hybrid energy system provides several advantages, including extended endurance, wide operational range, and elimination of onboard fuel requirements, making unmanned sailboats especially suitable for applications such as marine weather monitoring and deep-sea exploration. However, in complex marine environments, the sail–rudder system faces significant challenges [4]. The sail structure is vulnerable to damage under prolonged wind loading, which can reduce mission success rates. Conventional rudders often suffer from slow response, limited lift generation, and high energy consumption [5]. These limitations negatively impact the overall stability and control efficiency of unmanned sailboats. Therefore, improving the structural integrity and hydrodynamic performance of the sail–rudder system is essential to ensure efficient and reliable operation [6].
The growing demand for autonomous maritime systems has accelerated global development of unmanned sailboat technologies. Prominent platforms include the United States’ Saildrone SD1020 [7], Australia’s sensor-equipped Bluebottle (Ocius Technology) for surveillance and communication [8], Norway’s compact Sailbuoy (Offshore Sensing AS) [9], and China’s oceanographic Seagull (Shenyang Institute of Automation, CAS) [10]. To improve platform performance, researchers have targeted key subsystems—sails, rudders, and control systems. Studies include: Liu et al. quantified the effects of rudder angle, wind, and current on maneuverability [11]; Kuang et al. used a Navier–Stokes CFD solver to show that an optimal chord length ratio between 1.5 and 3 improves lift and thrust of two-element wing sails while avoiding flow instability [12]; Ulysse Dhomé et al. evaluated the aerodynamic interaction effects between wind propulsion units and their interactions with the ship hull [13]; and Bohan Wang et al. investigated the influence of hull geometry on the self-propulsion performance of a vector-propelled streamlined Autonomous Underwater Vehicle (AUV) with a ducted propeller using CFD and overset mesh techniques [14]; Liu et al. conducted a two-dimensional Reynolds-Averaged Navier–Stokes (RANS) CFD analysis of various flapped rudder sections, corroborating these findings and identifying a rudder configuration with η = 20% and ε = 1.5 as the most effective and efficient [15]; Moritz Troll et al. demonstrated that incorporating leading-edge tubercles into flapped rudders can delay stall while retaining lift-enhancement benefits [16]; Suli Lu et al. employed RANS-based CFD and maneuvering tests to assess the impact of flap rudders on ship maneuverability, supported by regression-derived force models [17].
While advances in hull and system performance have been achieved, optimization of flap rudders for small unmanned sailboats remains comparatively unexplored. Conventional single-surface rudders—flat plates or symmetric airfoils—typically demand large deflection angles to generate sufficient lateral force. At elevated flow velocities, these large deflections induce severe flow separation, increased drag, and reduced stability, degrading steering effectiveness and autonomous control reliability. CFD approaches and performance optimization methodologies now play increasingly vital roles in naval architecture [18], specifically for unmanned sailboats operating in environmentally challenging conditions.
To improve hydrodynamic efficiency at low deflection angles, this study developed an aft-twisted asymmetric flap rudder through a systematic, three-stage design and evaluation methodology. In the initial phase, CFD simulations were performed to determine a suitable flap geometry for the symmetric rudder configuration, followed by structural refinements to improve flow characteristics through modifications to the conventional rudder geometry. The improved structure was subsequently integrated with an asymmetrically twisted trailing-edge flap, resulting in a composite rudder system that combines a symmetric main rudder with an asymmetric flap. Finally, a series of CFD simulations were conducted to quantify the hydrodynamic responses of the integrated system under low-angle maneuvering conditions. The resulting insights provide practical guidance for enhancing steering efficiency in autonomous sailboats, particularly under low-angle deflection scenarios.

2. Rudder Modeling

2.1. Rudder Selection

The cross-sectional geometries of streamlined rudders are generally categorized as either symmetric or asymmetric. Asymmetric profiles typically yield higher lift coefficients and lift-to-drag ratios. However, they are more susceptible to flow separation at large deflection angles, potentially resulting in a sharp reduction in thrust or a sudden increase in drag. In contrast, symmetric profiles tend to exhibit more stable aerodynamic behavior during acceleration and under high-angle deflections, characterized by smoother variations in both thrust and drag. Considering this trade-off, the flap rudder examined in this study incorporates a symmetric main rudder combined with a small-area asymmetric flap. This configuration takes advantage of the symmetric rudder’s stability at high deflection angles while leveraging the asymmetric flap to improve the lift-to-drag ratio, thereby achieving an effective balance between maneuvering efficiency and directional stability. Figure 1 presents the selection process for the flap rudder profile. The study employs NACA series airfoils, which were originally developed by the U.S. National Advisory Committee for Aeronautics (NACA), based near Virginia, USA. For the small-scale unmanned sailboat considered in this study, NACA 0018 was chosen as it offers a well-balanced combination of structural strength and hydrodynamic efficiency. NACA 0015, with its thinner section, provides reduced drag but less structural reserve, whereas NACA 0021, with its thicker section, improves strength but increases wetted surface area. Taking into account the trade-offs between strength, resistance, and manufacturability under the expected operating conditions, NACA 0018 was selected as the main rudder section. A three-dimensional model was then developed using SOLIDWORKS 2023 for CFD simulations to quantitatively evaluate the effects of flap geometry and deflection angle on hydrodynamic performance.

2.2. Simulation Model Establishment

This study focuses on the rudder design for small unmanned sailboats, where the hydrodynamic forces arise from its interaction with the oncoming flow, as shown in Figure 2. The drag force (FD) arises from flow resistance in the direction of the relative flow, while the lift force (FL) is generated by the pressure difference across the rudder surfaces, acting perpendicular to the flow. The resultant force (FR) combines FD and FL. Additionally, the flow produces a normal force (FN), perpendicular to the chord line, and a tangential force (FT), parallel to the chord line, both originating from integrated pressure and shear stresses on the rudder surface. The θ indicates the flap deflection angle.
Non-dimensional coefficients are used to assess hydrodynamic performance across different designs. Principal parameters include the lift coefficient (CL) and drag coefficient (CD), normal force coefficient (CN), tangential force coefficient (CT), and lift-to-drag ratio (CL/CD) are derived. These coefficients are calculated as follows [19]:
C L = F L / 0.5 ρ V 2 S A
C D = F D / 0.5 ρ V 2 S A
C N = C L cos α + C D sin α
C T = C D cos α C L sin α
where α is the angle of attack, V is the inflow velocity, ρ is the water density, and SA is the projected area of the flap rudder [20,21,22,23].
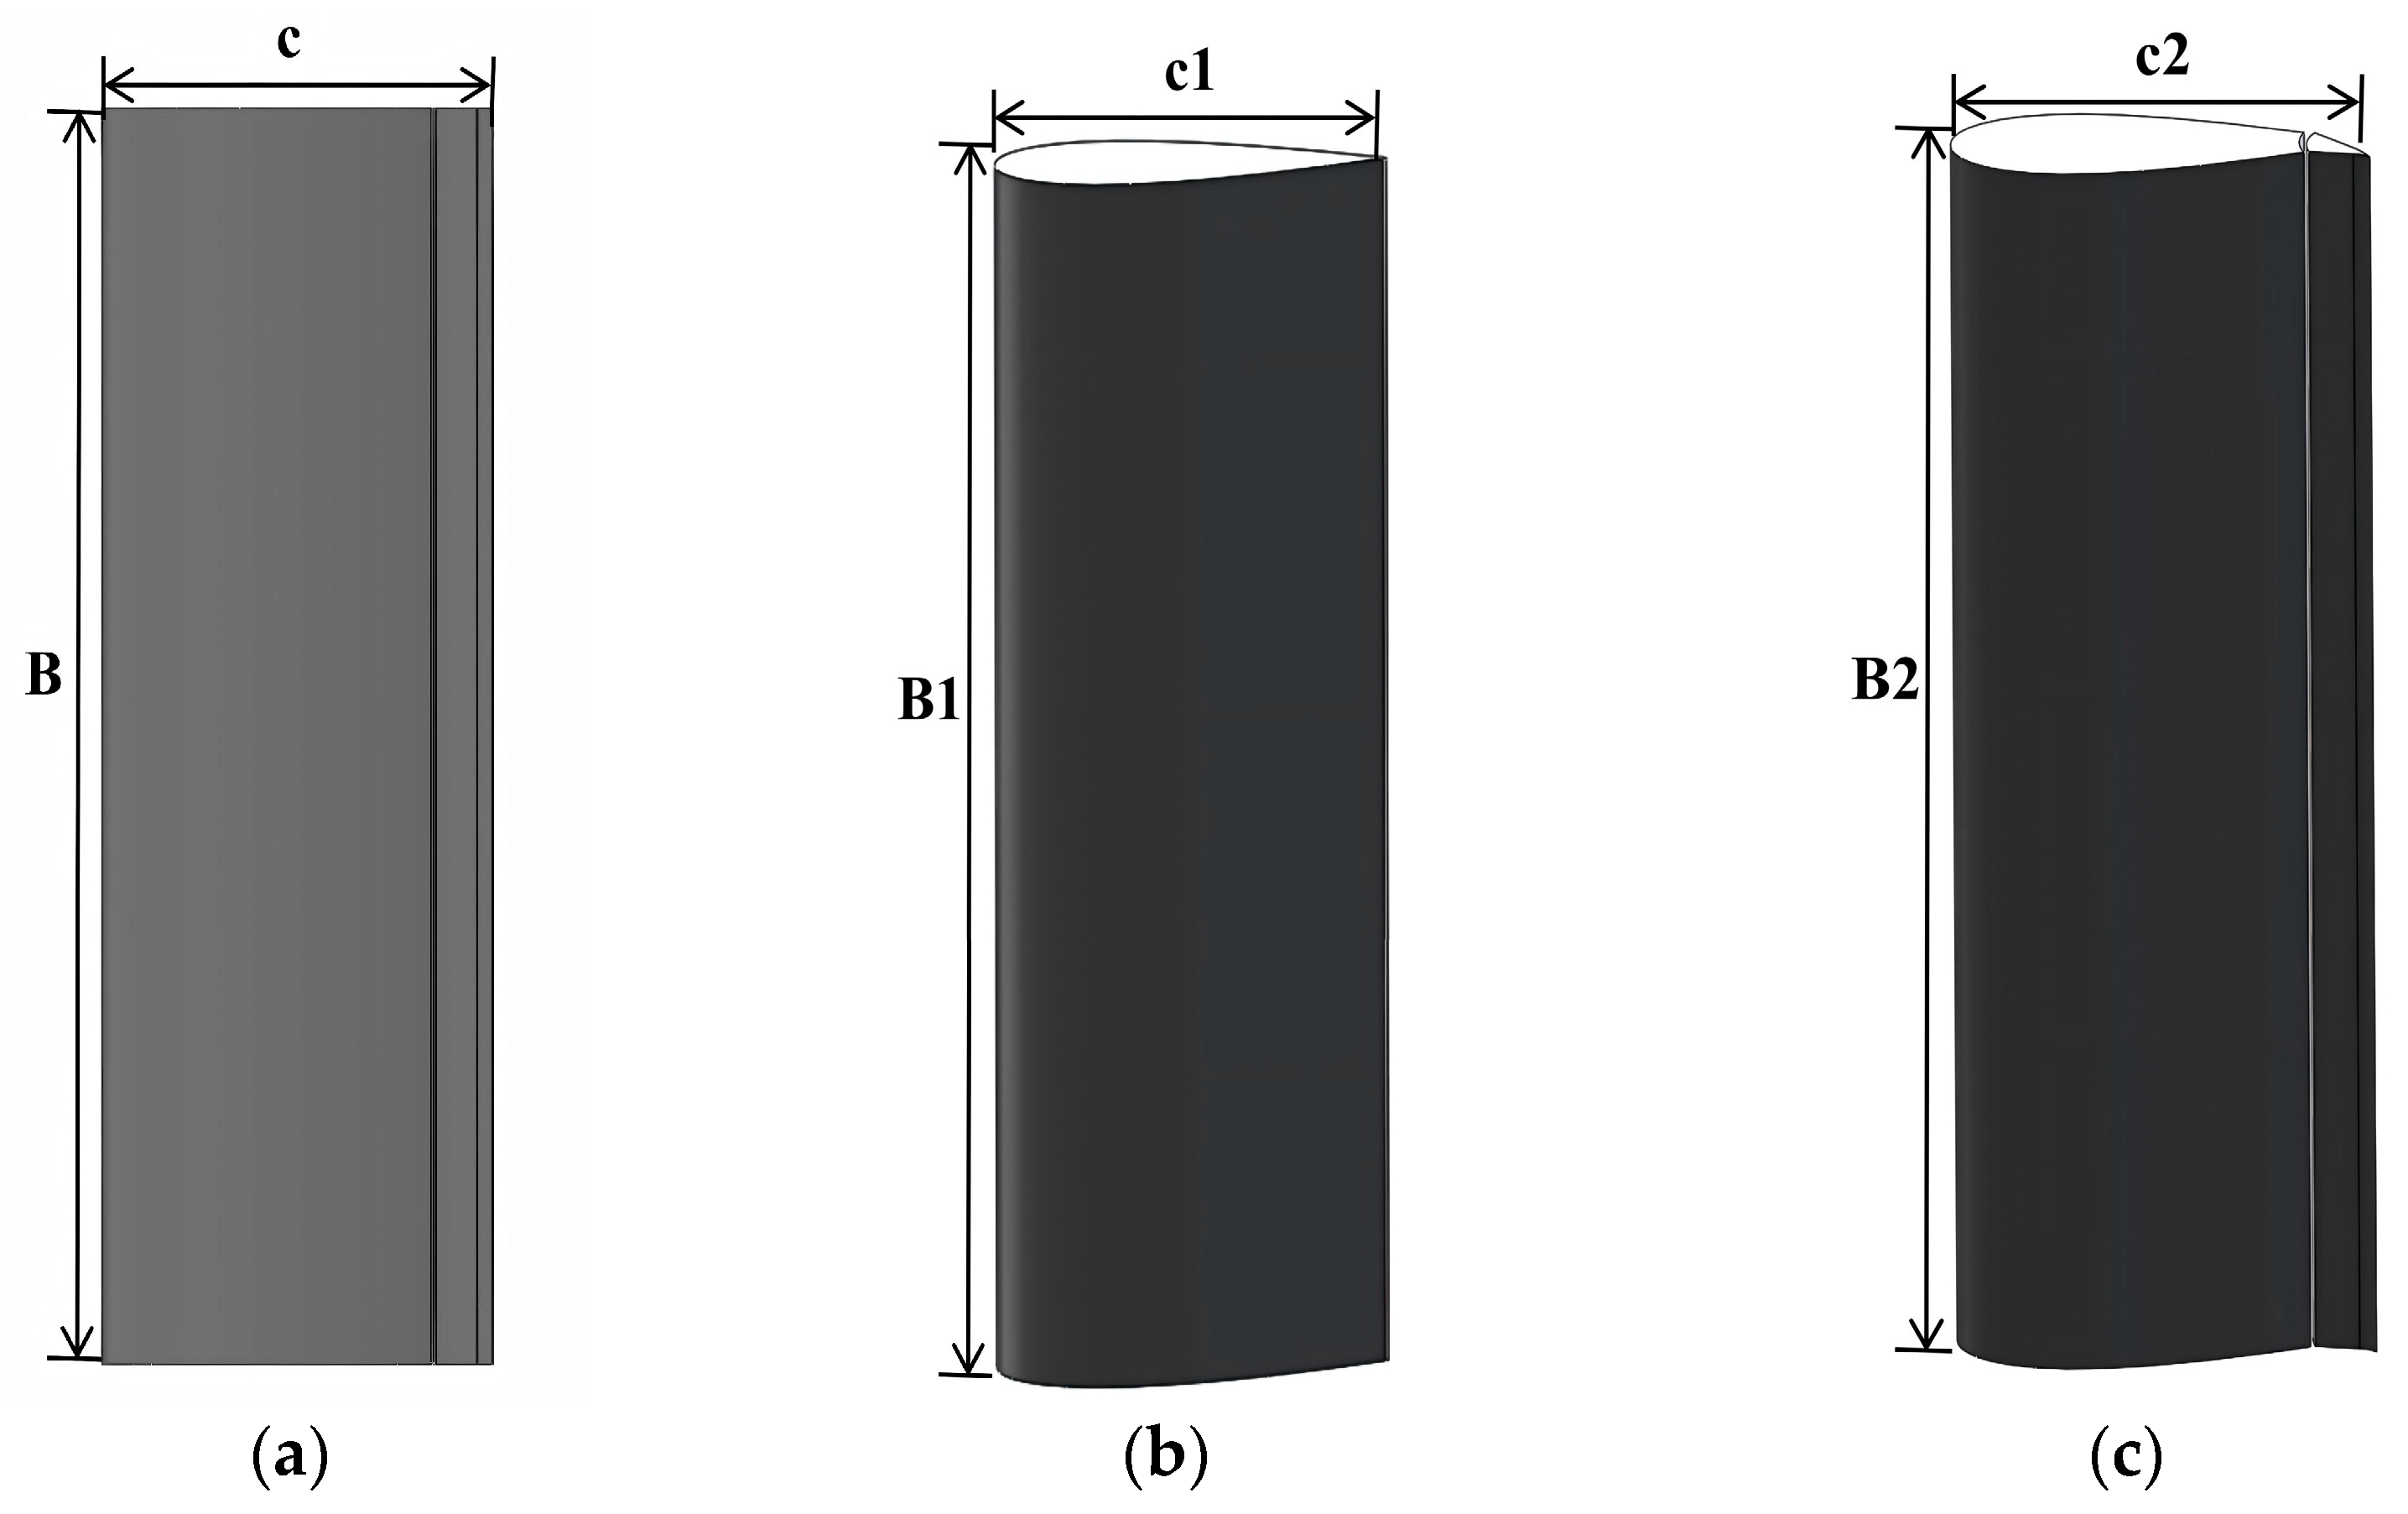
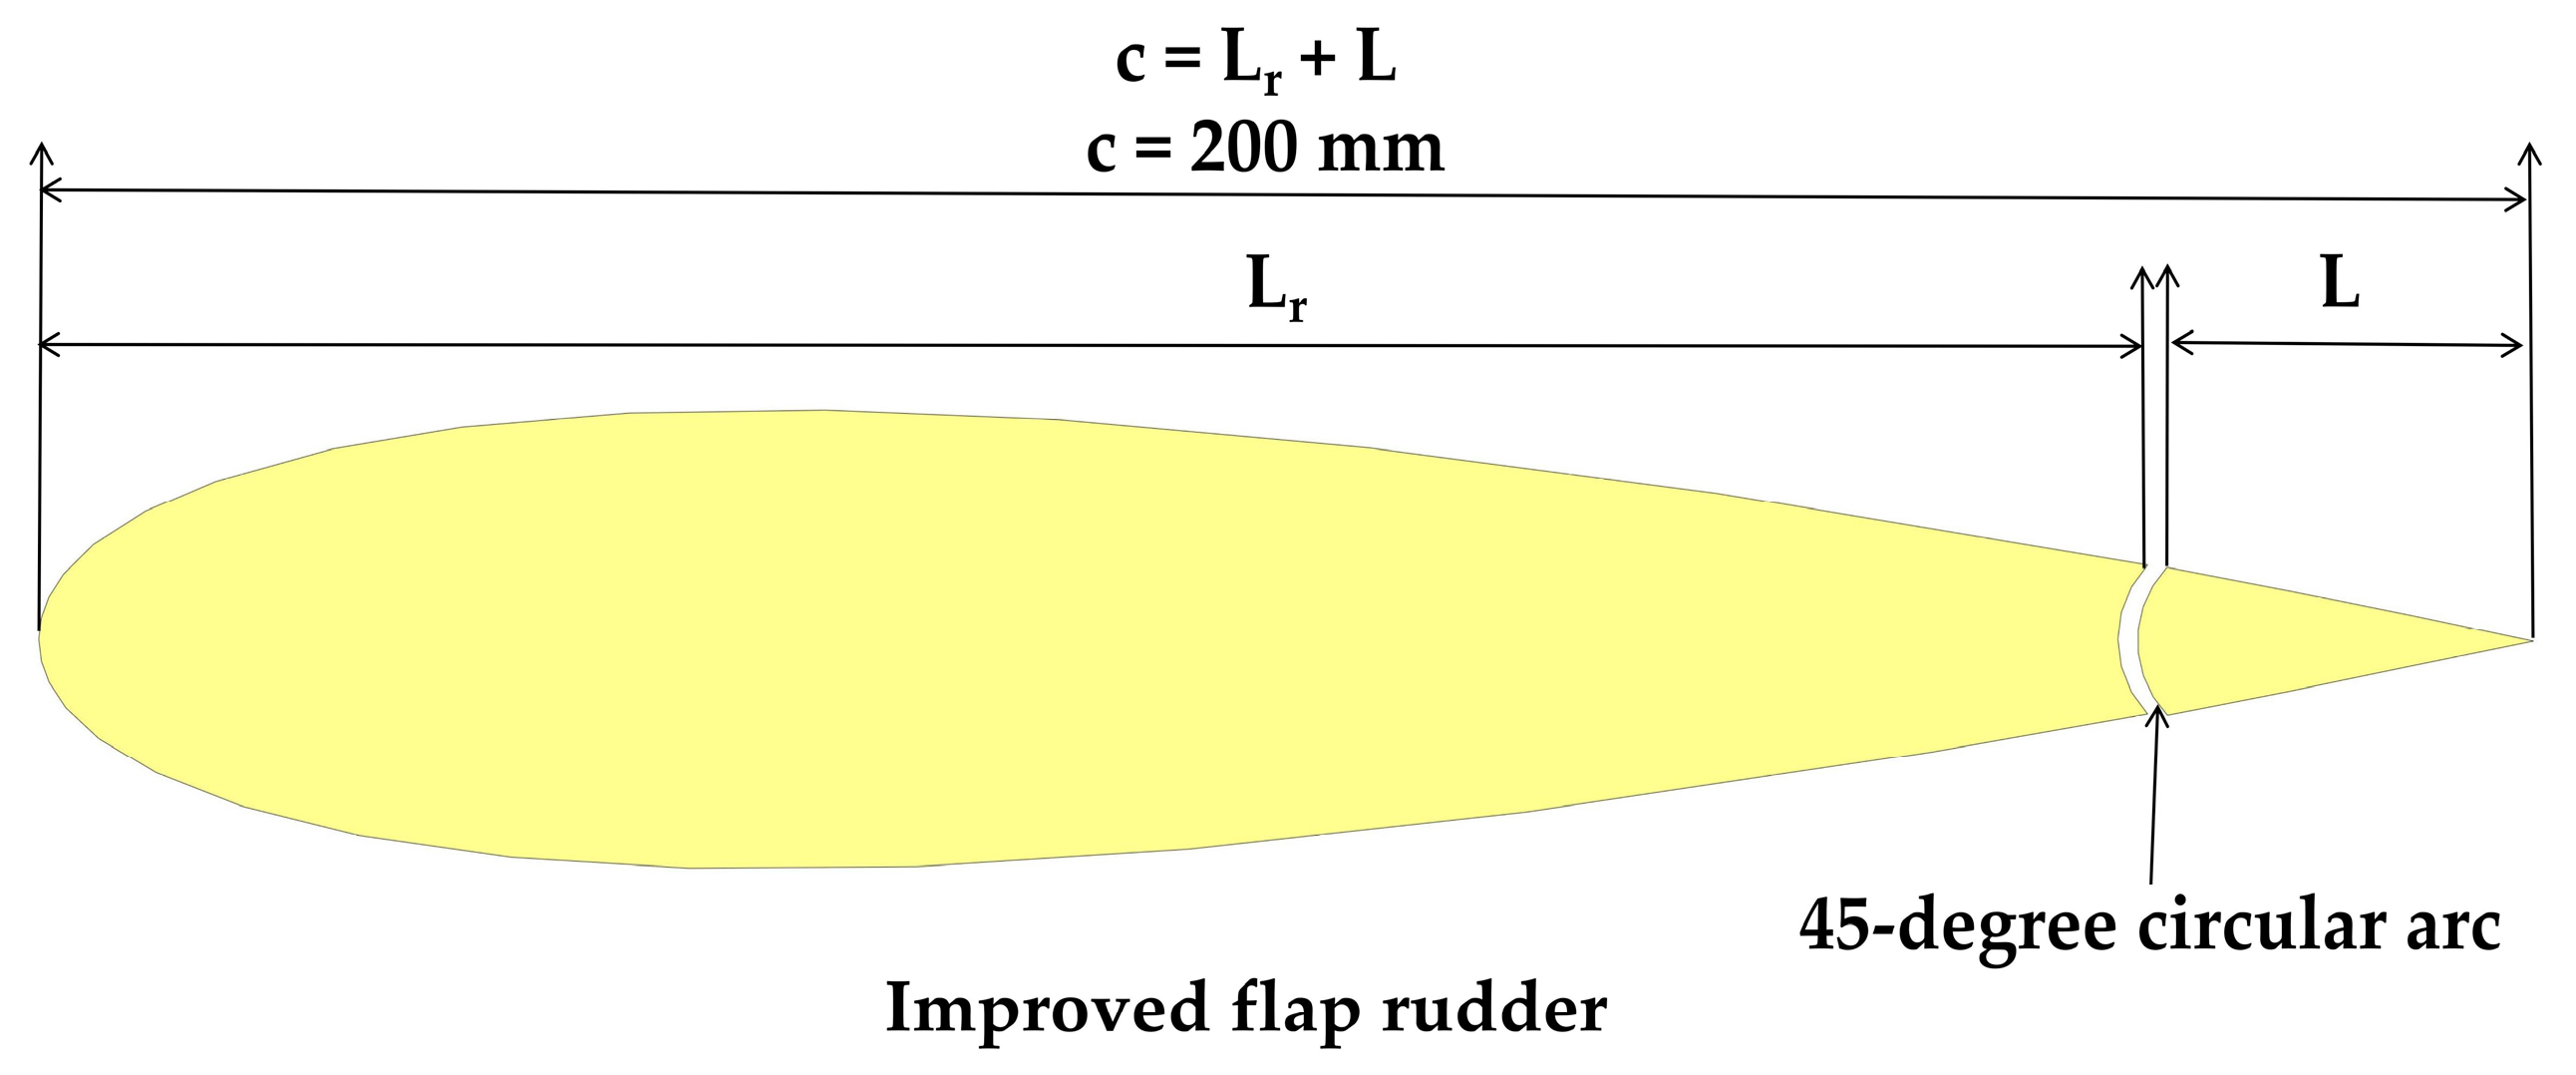
Figure 3 and Figure 4 illustrate the rudder geometries analyzed in this study. In the figures, B represents the rudder height, c the rudder chord length, Lr the main rudder length, Lc the cylinder diameter, and L the flap length. In all configurations, the rudder height B was fixed at 600 mm and the chord length c at 200 mm. Figure 3 depicts the flap-rudder arrangements, whereas Figure 4 shows the streamlined rudder along with several flap-rudder variants.
For the purpose of isolating hydrodynamic effects, the rudder models were simplified. The rudder stock and trunk were excluded, and the clearance between the main rudder and the flap was neglected. Mechanical connections between the main rudder and the flap were also omitted. These modeling assumptions reduce geometric complexity and allow the analysis to focus on the influence of rudder geometry on flow behavior, lift generation, drag characteristics, and overall hydrodynamic performance, rather than on structural interactions or assembly details.

2.3. Numerical Mode

In the present study, the water was assigned a viscosity of 0.001003 kg/(m·s) and a density of 998.2 kg/m3. An inflow velocity of 6 m/s and a rudder chord length of L = 200 mm were prescribed for the simulations. These conditions correspond to a Reynolds number of 1.19 × 10⁶, indicating turbulent flow. Several Reynolds-Averaged Navier–Stokes (RANS) turbulence models are applicable for such flows, including the standard k-ε, SST k-ω, and Spalart–Allmaras formulations. Considering the high Reynolds number and the need to resolve near-wall regions and flow separation accurately—particularly under adverse pressure gradients and at high angles of attack—the SST k-ω model was chosen. This model combines the near-wall precision of the k-ω approach with the free-stream stability of the k-ε model, eliminating reliance on wall functions. Furthermore, by incorporating turbulence shear stress transport into the effective viscosity, the SST k-ω model enhances the prediction of separation onset and wake development compared with the standard and RNG k-ε models, while providing higher accuracy for complex separated flows than the one-equation Spalart–Allmaras model [24,25].
The hydrodynamic performance of the flap rudder airfoil under open-water conditions was investigated by solving the steady-state Reynolds-Averaged Navier–Stokes (RANS) equations. The continuity and momentum (Navier–Stokes) equations are given as follows [26]:
U i X i = 0  
U i t + ρ U i U j X i = - P X i + ρ X j μ U i X j + U j X i + ρ g i  
In Equations (1) and (2), U i denotes the velocity component along the   X i direction within the three-dimensional Cartesian coordinate system, ρ represents the fluid density, P is the pressure, μ is the hydrodynamic viscous coefficient, and g i is the mass force.
Although the full RANS equations contain time-dependent terms, this study used a steady-state approach, and the time derivatives were not included. The continuity equation ensures that mass is conserved, meaning the amount of fluid entering a control volume equals the amount leaving. The momentum equation describes how the fluid’s momentum changes under the effects of pressure, viscous forces, and external body forces. Together, these equations define the velocity and pressure distribution around the rudder.
To account for turbulence effects in the flow, the Shear-Stress Transport (SST) k-ω model was applied, and its transport equations are given as follows [27]:
ρ ¯ k t + ρ ¯ u j k x j = x j [ ( μ + σ μ t ) k x j ] + P k β ρ ω k
ρ ¯ ω t + ρ ¯ u j ω x j = x j [ ( μ + σ μ t ) ω x j ] + α ω k P k β   ρ ¯ ω 2
where k denotes the turbulent kinetic energy, ω represent the specific dissipation rate, Pk signifies the generating term of turbulent kinetic energy k, and μt is the eddy viscosity.
This formulation enables accurate resolution of the near-wall boundary layer while maintaining reasonable computational cost, making it suitable for simulating the hydrodynamic performance of the rudder under turbulent flow conditions.

3. Mesh Generation for Flap Rudder

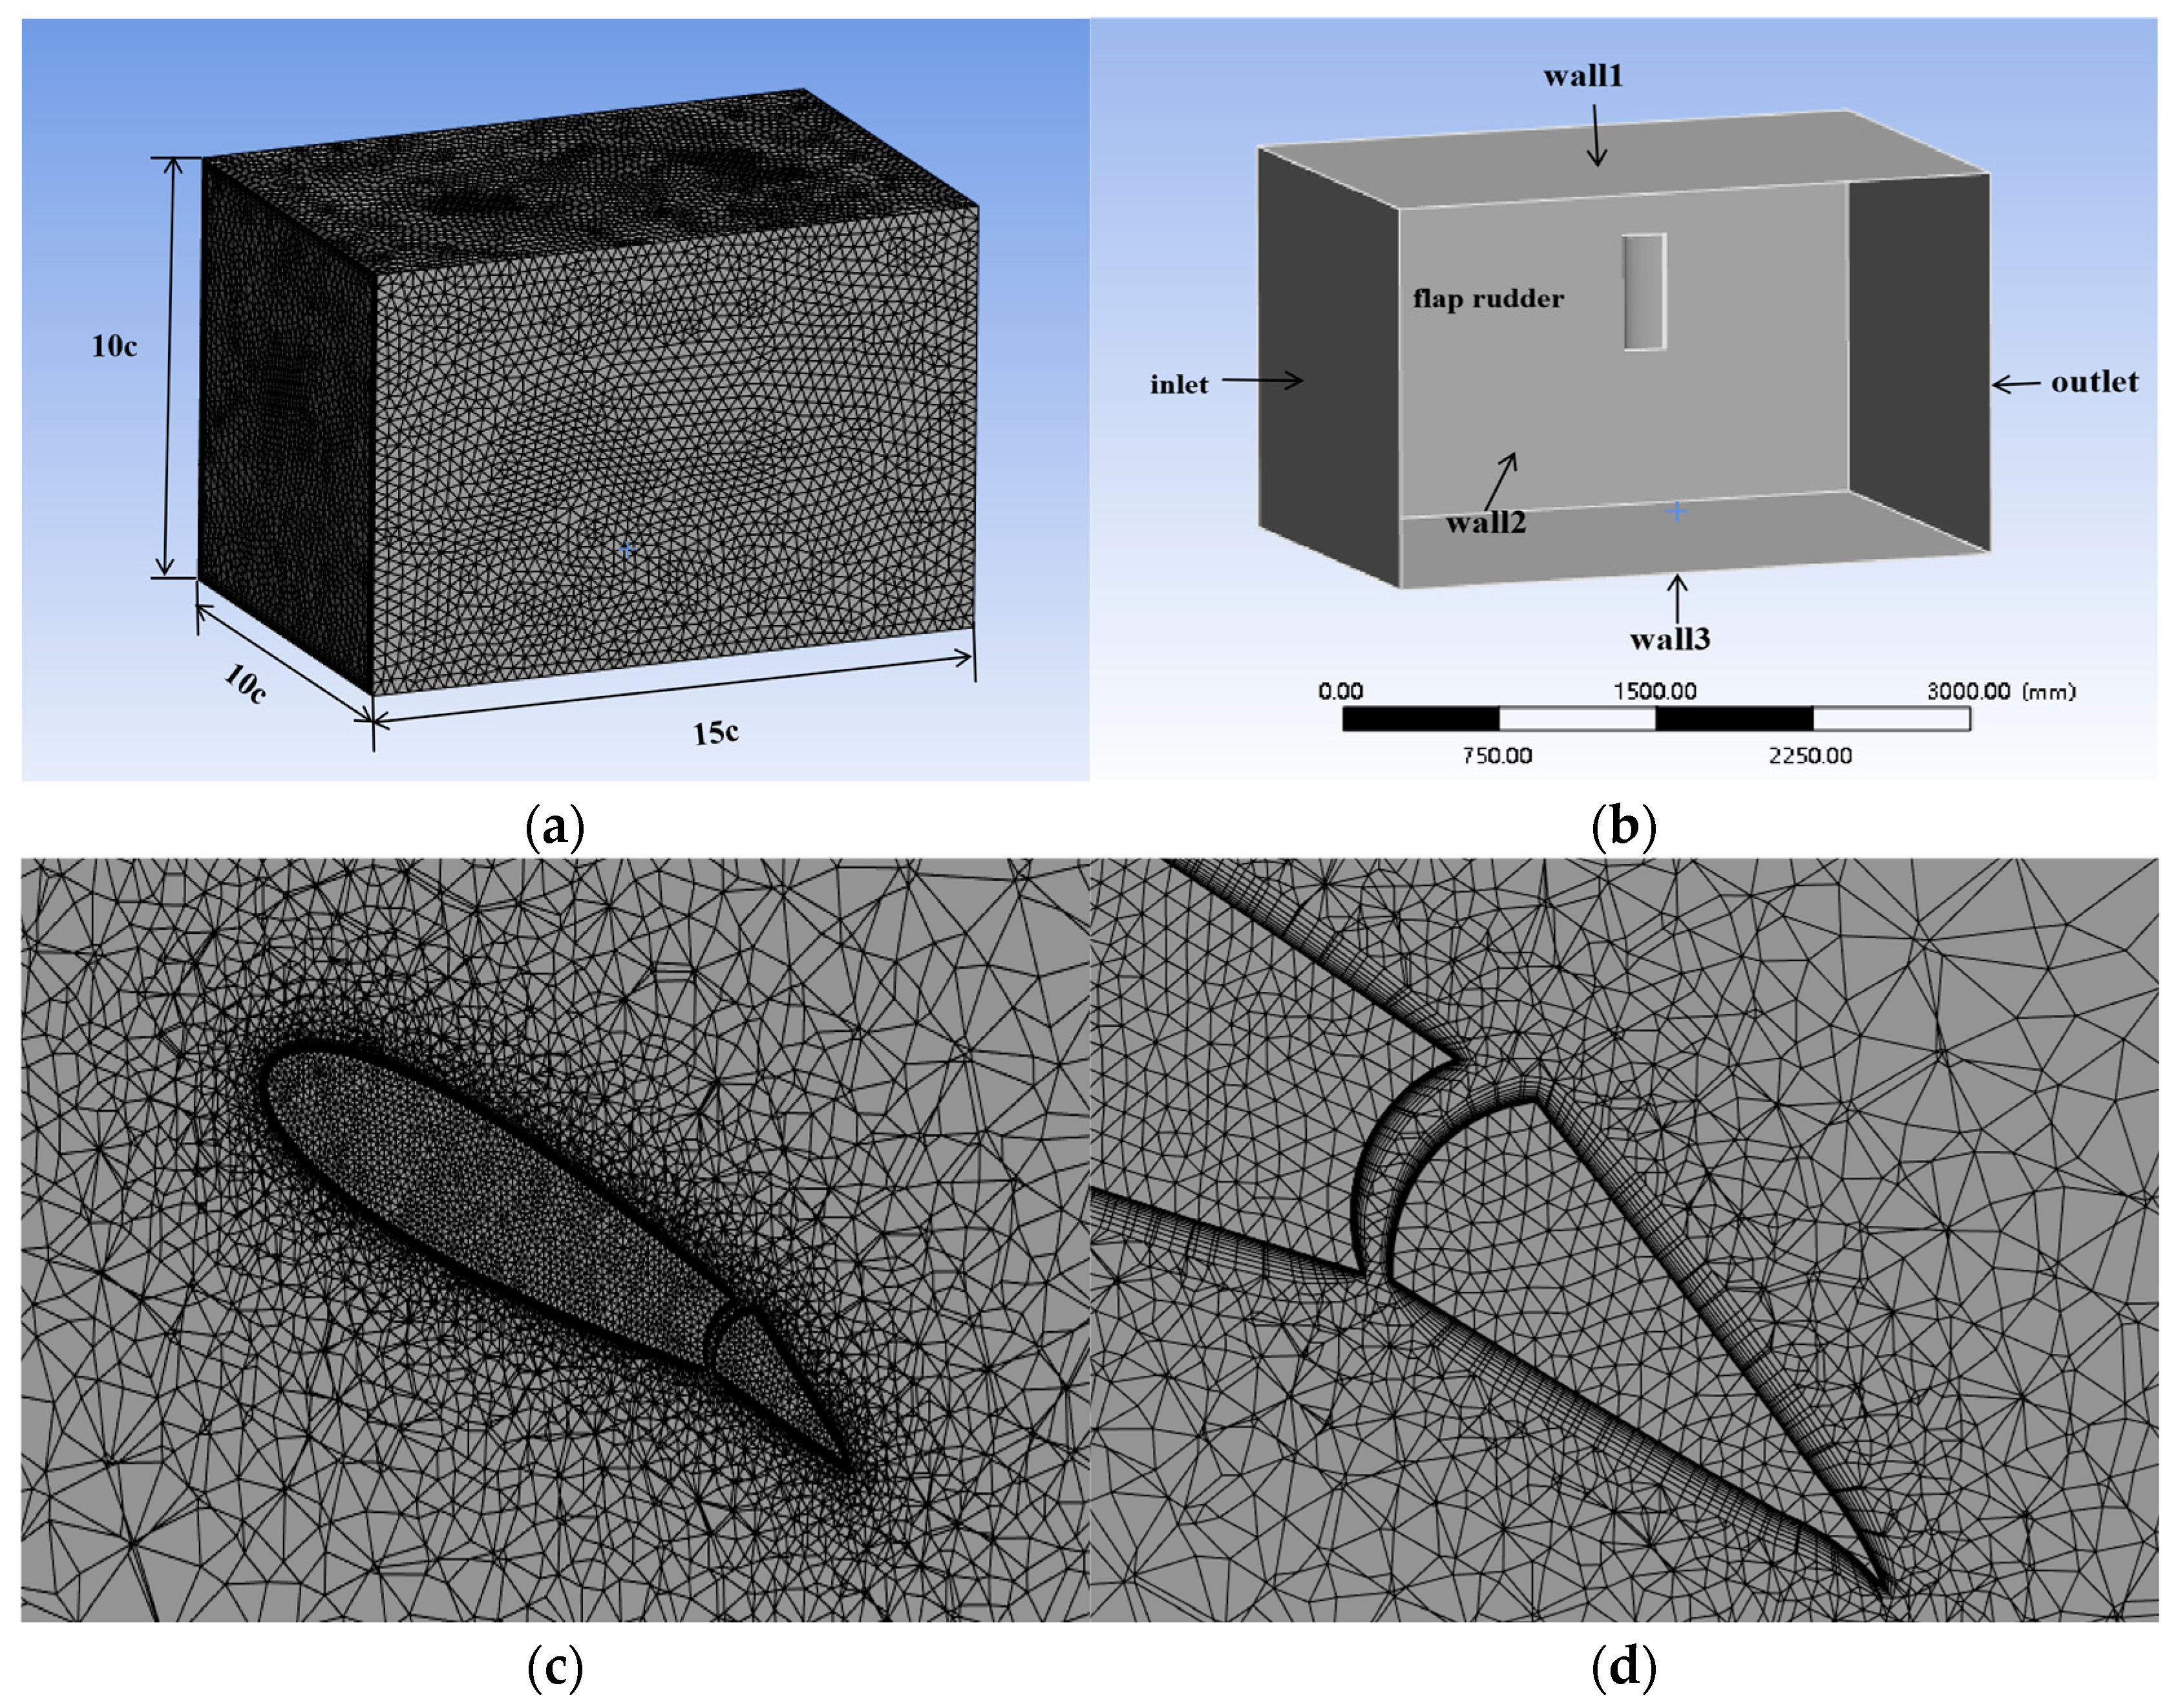
In fluid simulations, selecting an appropriate fluid domain size and mesh resolution is essential for balancing computational accuracy and efficiency [28], the mesh configuration is shown in Figure 5. This study uses a rectangular domain with dimensions set to 15, 10, and 10 times the chord length of the flap rudder along the streamwise, spanwise, and vertical directions, respectively. This setup fully contains the rudder and its surrounding flow regions, reducing the influence of domain boundaries. The rudder is positioned near the water surface to reflect realistic conditions. The inlet is specified as a velocity boundary with a flow speed of 6 m/s, and the outlet as a pressure boundary with zero relative pressure, providing stable flow conditions while maintaining moderate constraint levels.
To improve computational efficiency, geometric features that do not significantly influence hydrodynamic performance are removed from the model [29], concentrating analysis on the flap rudder. No-slip wall conditions were applied to the rudder and domain surfaces to properly resolve viscous effects. The mesh consists of quadrilateral cells, refined locally around the rudder, with 10 inflation layers to capture the velocity boundary layer adequately. Mesh quality metrics were maintained within acceptable limits, with maximum skewness kept below 0.9 to ensure stable and accurate computations. The all-y+ wall treatment is utilized to predict the flow and turbulence parameters across the wall boundary layer [30], with the near-wall mesh refined to maintain y⁺ values around 2.5, thereby ensuring accurate resolution of the viscous sublayer in the RANS simulations.
To reduce computational time while maintaining simulation accuracy, a mesh independence study was conducted for the flap rudder [31]. Based on the previously described setup, the computational domain and boundary conditions were defined, and the SST k–ω turbulence model was employed to simulate the external flow. Lift and drag coefficients were evaluated under various mesh densities, with the results summarized in Table 1. The mesh independence study revealed that when the total cell count exceeds approximately 2.8 × 10⁶, the variations in both lift and drag coefficients become negligible. Therefore, in all subsequent simulations, the grid resolution was maintained above 2.8 × 10⁶ cells to achieve a suitable compromise between numerical accuracy and computational cost.

4. Result Analysis

4.1. Case Study

For validation of the RANS approach, reference is made to the wind-tunnel experiments on a spade NACA0020 rudder reported by Molland and Turnock (1993) [32]. In their study, the rudder had a chord length of 0.667 m, a span of 1 m, and a geometric aspect ratio of 1.5. Because the clearance between the rudder tip and the tunnel floor was only 2.5 mm, the effective aspect ratio increased to 3. The test section of the tunnel measured 3.5 m in length and 2.5 m in both width and height, with air at 20 m/s as the inflow [33].
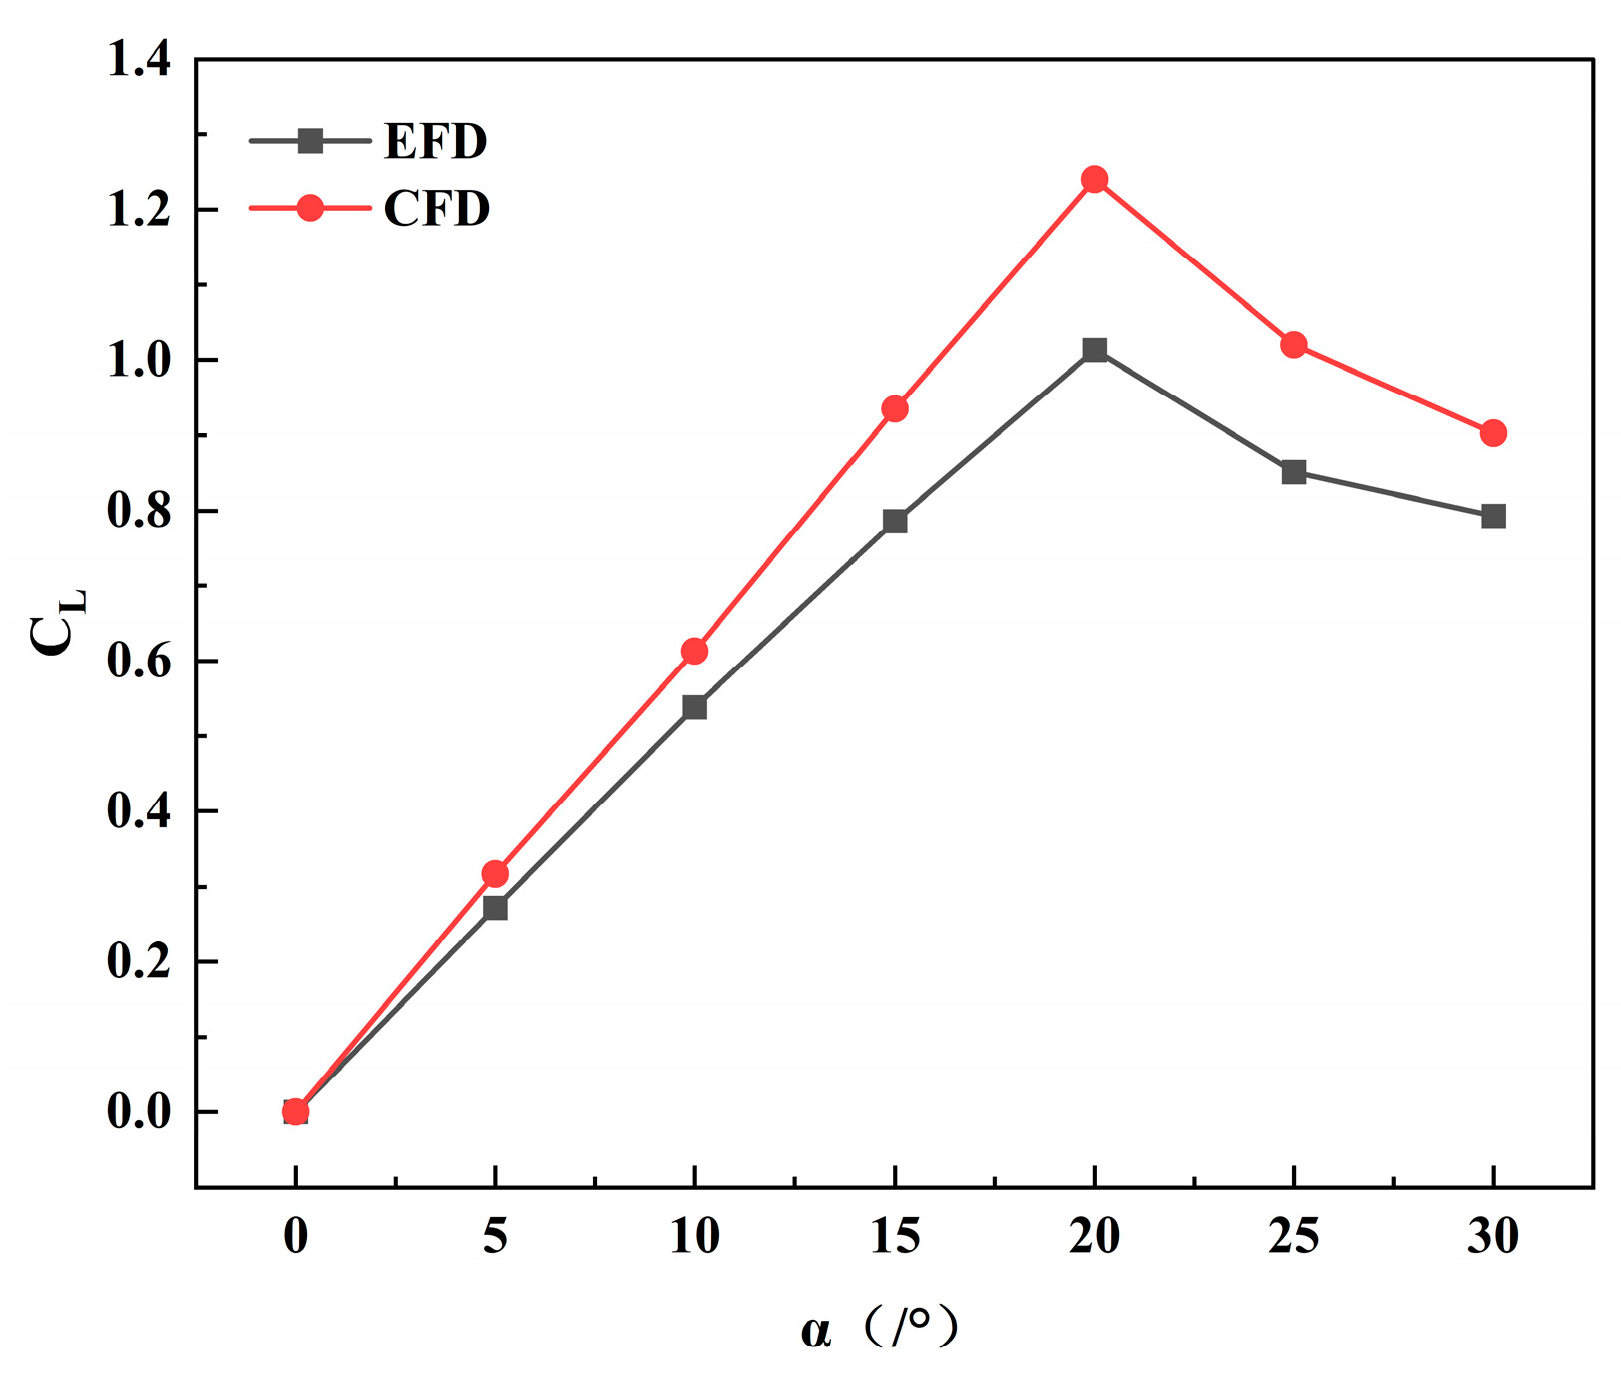
In the present work, simulations are carried out using water as the working fluid at an inflow velocity of 6 m/s, corresponding to a Reynolds number of 1.19 × 10⁶. The rudder section employed is NACA0018. The computed results are compared with the experimental data of the NACA0020 rudder reported by Molland and Turnock (1993) [32], as shown in Figure 6. The comparison indicates that the absolute relative error in lift coefficient lies between 13.5% and 22.3%. In the stall region at an angle of attack of about 20°, the deviation increases slightly to approximately 22.3%. Nevertheless, the simulations reproduce the general behavior of the experiments, with the lift coefficient increasing with angle of attack and dropping sharply after stall. Although the two rudder sections are not identical, both are symmetric foils with similar hydrodynamic responses. The present model reproduces the main characteristics of the lift variation, and the agreement with experiments is considered reasonable.
To perform fluid simulations in Fluent, the key operating parameters were established as summarized in Table 2. In this work, variations in the flap rudder angle were achieved by adjusting the rotation angle of the model, the pressure–velocity coupling equations were solved using the coupled algorithm, while spatial discretization employed second-order accurate schemes to enhance solution precision. Based on a turbulence intensity of I = 5% and a turbulence length scale of Lm = 0.014 m, the inlet turbulence quantities are initialized as k = 0.135 m2/s2  and ω ≈ 26 s−1.

4.2. Influence of Flap Size on the Hydrodynamic Performance of the Flap Rudder

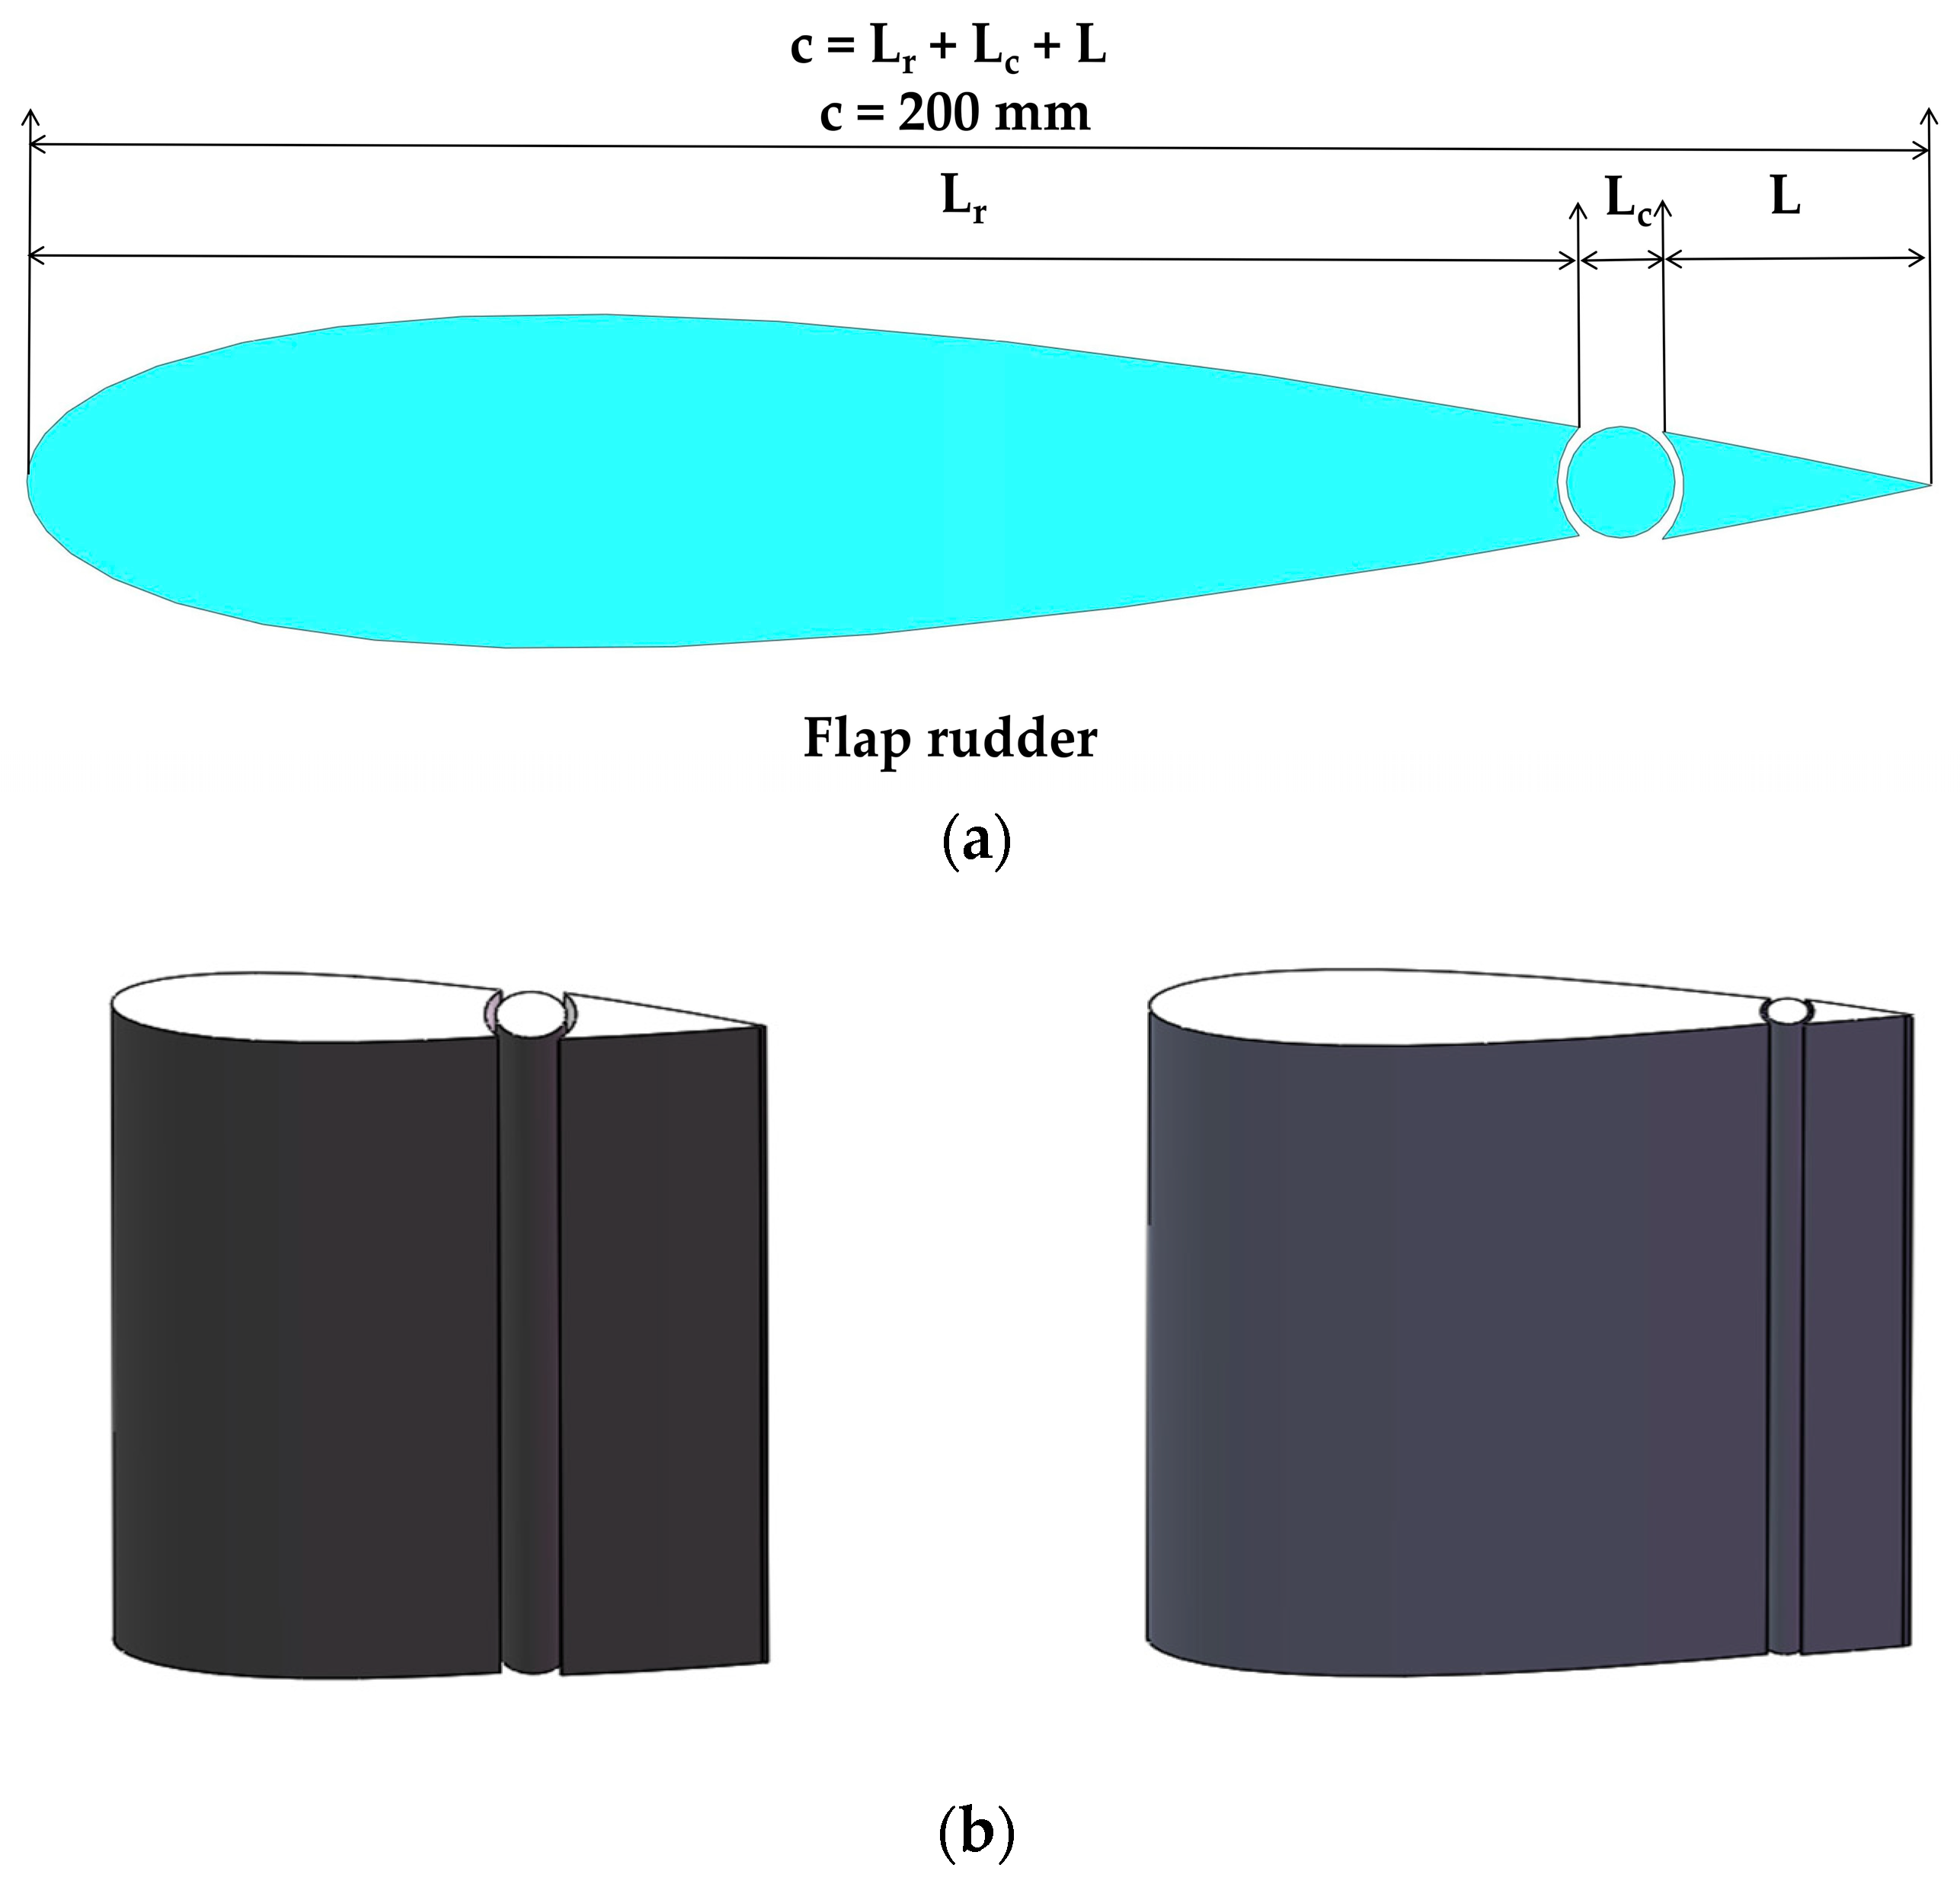
Within the intelligent control system of an unmanned sailboat, the flap rudder functions as the primary hydrodynamic actuator, and its flow field characteristics play a critical role in determining heading accuracy. In this study, a standard main rudder/flap linkage configuration is adopted for the symmetric flap rudder, with an aspect ratio (AR) of 3. As illustrated in Figure 7, hydrodynamic performance is evaluated under a fixed flap deflection angle of 35°, while the flap span length (L) is systematically varied from 10 mm to 130 mm in increments of 20 mm, keeping the total chord length (c) of the flap rudder constant. Here, Lr represents the main rudder length, Lc the diameter of the cylindrical section, and L the flap length; therefore, the flap rudder’s chord length is composed of these three components. The gap between the main rudder and the flap is maintained below 2 mm and is considered negligible. CFD simulations are conducted using Fluent within ANSYS Workbench 2023 R1 to quantify the influence of flap span on the hydrodynamic performance of the rudder system [34].
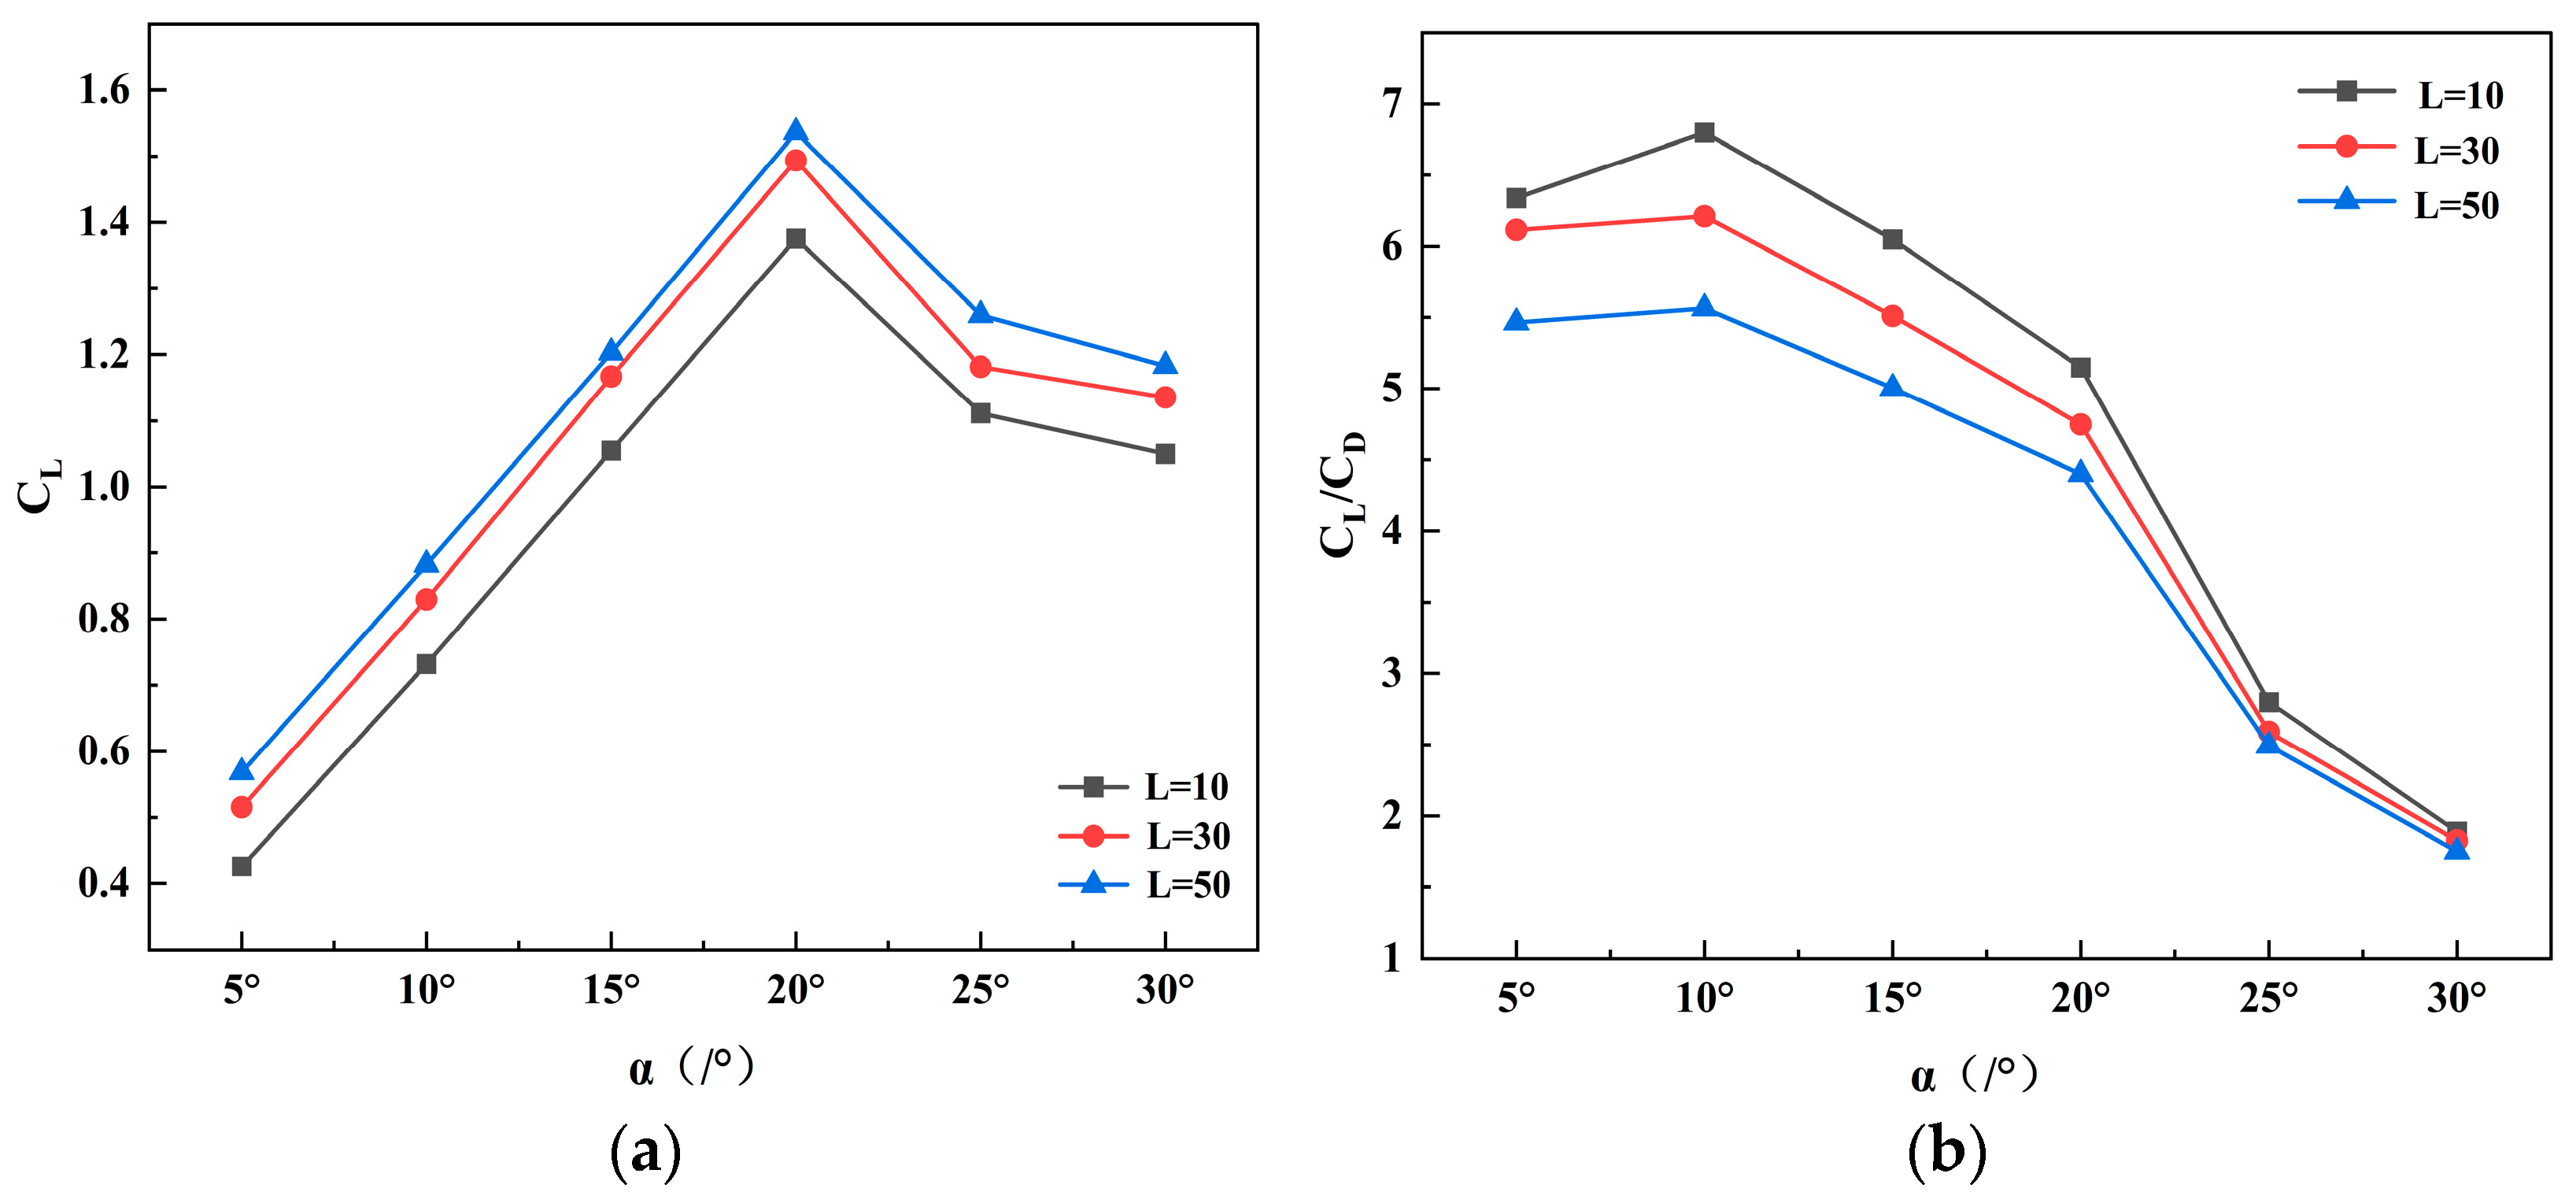
As shown in Figure 8, the flap length significantly affects rudder hydrodynamics. For L = 10, 30, and 50 mm, the lift coefficient peaks at a 20° rudder rotation, then gradually decreases, while other lengths show a smoother variation. The drag coefficient increases steadily with rudder rotation, and larger flap lengths produce higher drag. Consequently, the lift-to-drag ratio declines with increasing flap span. Among the cases, L = 10 mm yields the highest lift-to-drag ratio and is designated as flap rudder A for further analysis. This configuration was subsequently compared with the baseline NACA 0018 rudder to evaluate the effects of the geometric modification on overall hydrodynamic performance.
As shown in Figure 9, flap rudder A produces a maximum lift coefficient increase of 25.67% over the streamlined rudder, which occurs at a rudder deflection angle of 20°, indicating its effectiveness in boosting lift. This comes with a higher drag at larger angles of attack. The lift-to-drag ratio follows a regime-dependent pattern: for α ≤ 8°, flap rudder A maintains a higher CL/CD than the streamlined rudder, whereas for α > 8°, the faster rise in parasitic drag causes its CL/CD to drop below that of the streamlined design. The performance enhancement is driven by the circulation induced by the 35° flap deflection. This effect expands the low-pressure region on the suction side while strengthening the adverse pressure gradient on the pressure side, producing secondary lift improvement that is most pronounced at moderate angles of attack. Among the configurations analyzed, flap rudder A shows controlled drag growth, weaker vortex formation, and turbulence dissipation comparable to the streamlined rudder. Confinement of wake separation zones within low-drag regions further contributes to its improved hydrodynamic efficiency.
These results demonstrate the hydrodynamic benefits of the compact flap configuration, particularly at low angles of attack (α < 8°), where flap rudder A achieves substantially higher CL/CD than the streamlined rudder. Beyond this critical angle, performance declines due to increased flow separation and parasitic pressure drag, consistent with classical fluid dynamics principles linking rudder deflection to drag escalation [35]. To enhance performance within the subcritical regime (α < 15°), the following sections examine modifications to the flap rudder design aimed at increasing CL/CD while keeping drag low, thereby supporting more responsive and energy-efficient maneuvering of unmanned sailboats.

4.3. Improved Flap Rudder Design

Based on the aforementioned design objectives, an improved symmetric flap rudder—hereafter referred to as flap rudder B—is proposed, as illustrated in Figure 10. In this configuration, the leading-edge geometry of the main rudder is retained, while a single-sided coupling mechanism structurally integrates the flap with the rudder body. To enhance computational efficiency, non-essential structural details are omitted during the modeling process. A 45° circular arc is introduced at the junction between the main rudder and the flap to improve aerodynamic continuity and suppress flow separation. For consistency and comparability, the flap deflection angle is fixed at 15° for both flap rudder A and flap rudder B, and all other geometric parameters are maintained identical to those used in the preceding simulations. This controlled setup ensures that any observed variations in hydrodynamic performance can be directly attributed to the structural modifications.
As illustrated in Figure 11, the flap rudder B demonstrates a notable improvement in hydrodynamic performance over the flap rudder A under low-angle conditions (α < 15°), with consistent increases observed in both the lift coefficient and lift-to-drag ratio. These enhancements are primarily attributed to the incorporation of the 45° arc transition at the flap–rudder junction, which promotes smoother flow continuity and mitigates boundary layer separation. Furthermore, the revised structural coupling enhances the hydrodynamic interaction between the flap and the main rudder, thereby contributing to improved overall performance. These findings confirm that the proposed design effectively enhances rudder performance in small-angle maneuvers.
To ensure hydrodynamic consistency with flap rudder A, three representative flap lengths (L = 10, 30, and 50 mm) were selected for comparative evaluation. As shown in the comparative analysis in Figure 12, these variants exhibit performance trends consistent with those of the reference design. This indicates that the revised configuration maintains stable hydrodynamic behavior across a range of flap dimensions and operating conditions.
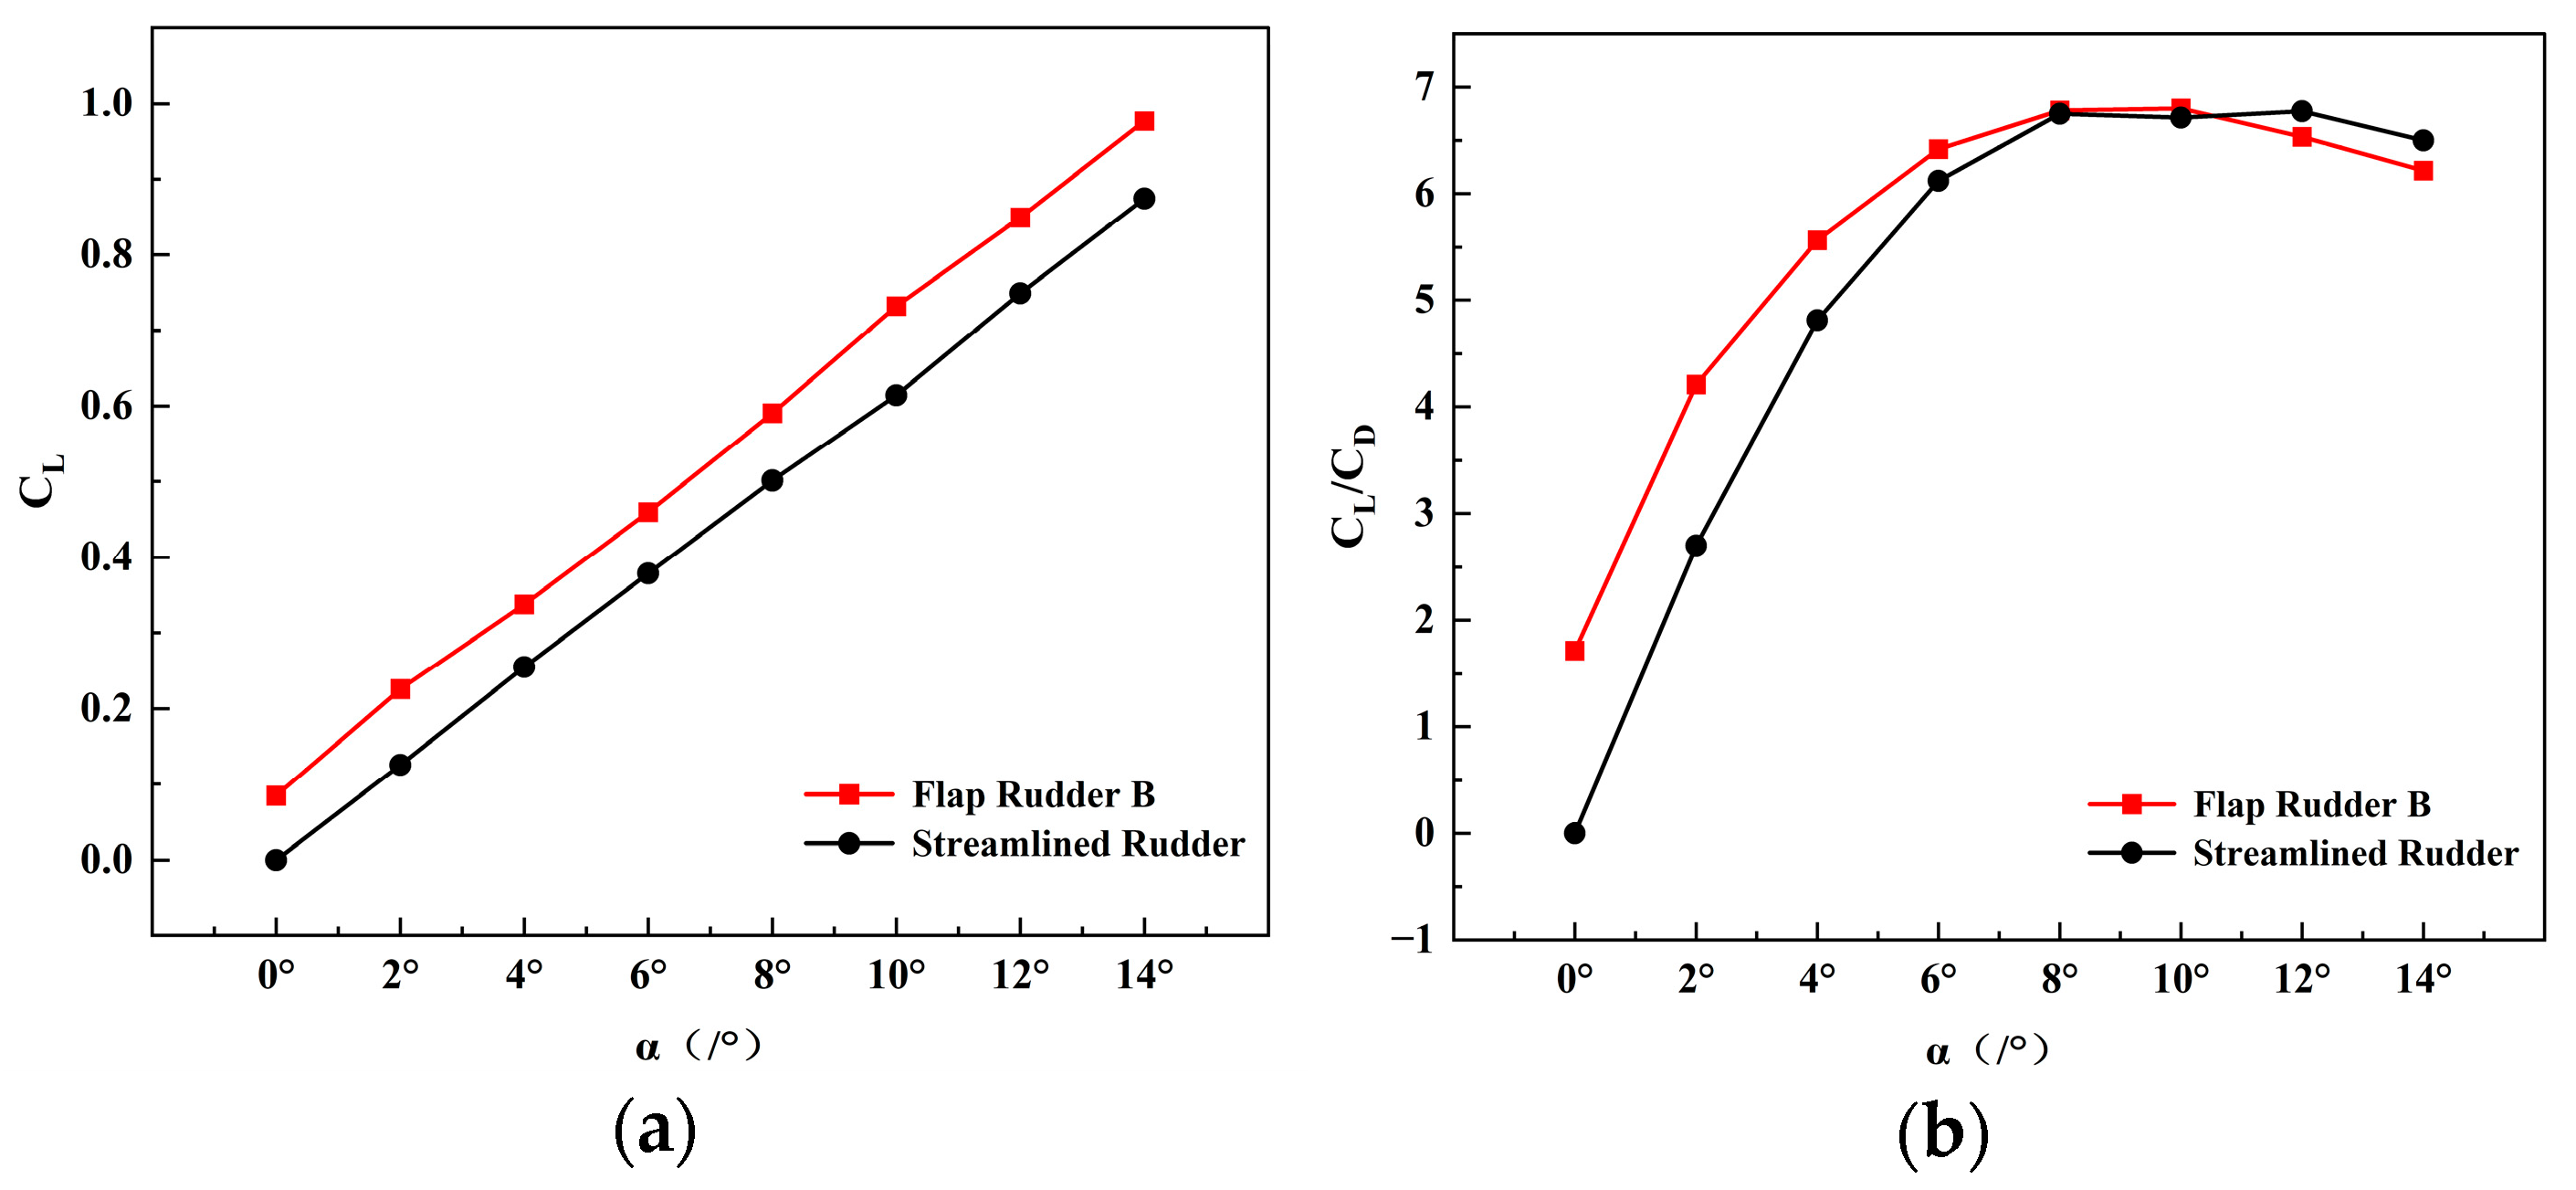
Simulation results comparing flap rudder B with the streamlined rudder are shown in Figure 13. At deflection angles below 10°, flap rudder B delivers higher lift and a better lift-to-drag ratio while keeping drag increases limited, due to its refined aerodynamic shape and unilateral coupling. Above 10°, the streamlined rudder achieves a higher lift-to-drag ratio. This shift is related to the flow regime: at low yaw angles, the 45° arc transition and unilateral coupling of flap rudder B help maintain smooth flow attachment and delay boundary layer separation, enhancing lift efficiency; at higher yaw angles, the simpler streamlined rudder geometry reduces flow disturbances and vortex-induced drag. These findings demonstrate the effectiveness of the structural improvements in flap rudder B for low-angle operation.

4.4. Design of an Aft-Asymmetric Flap Rudder with Trailing-Edge Twist

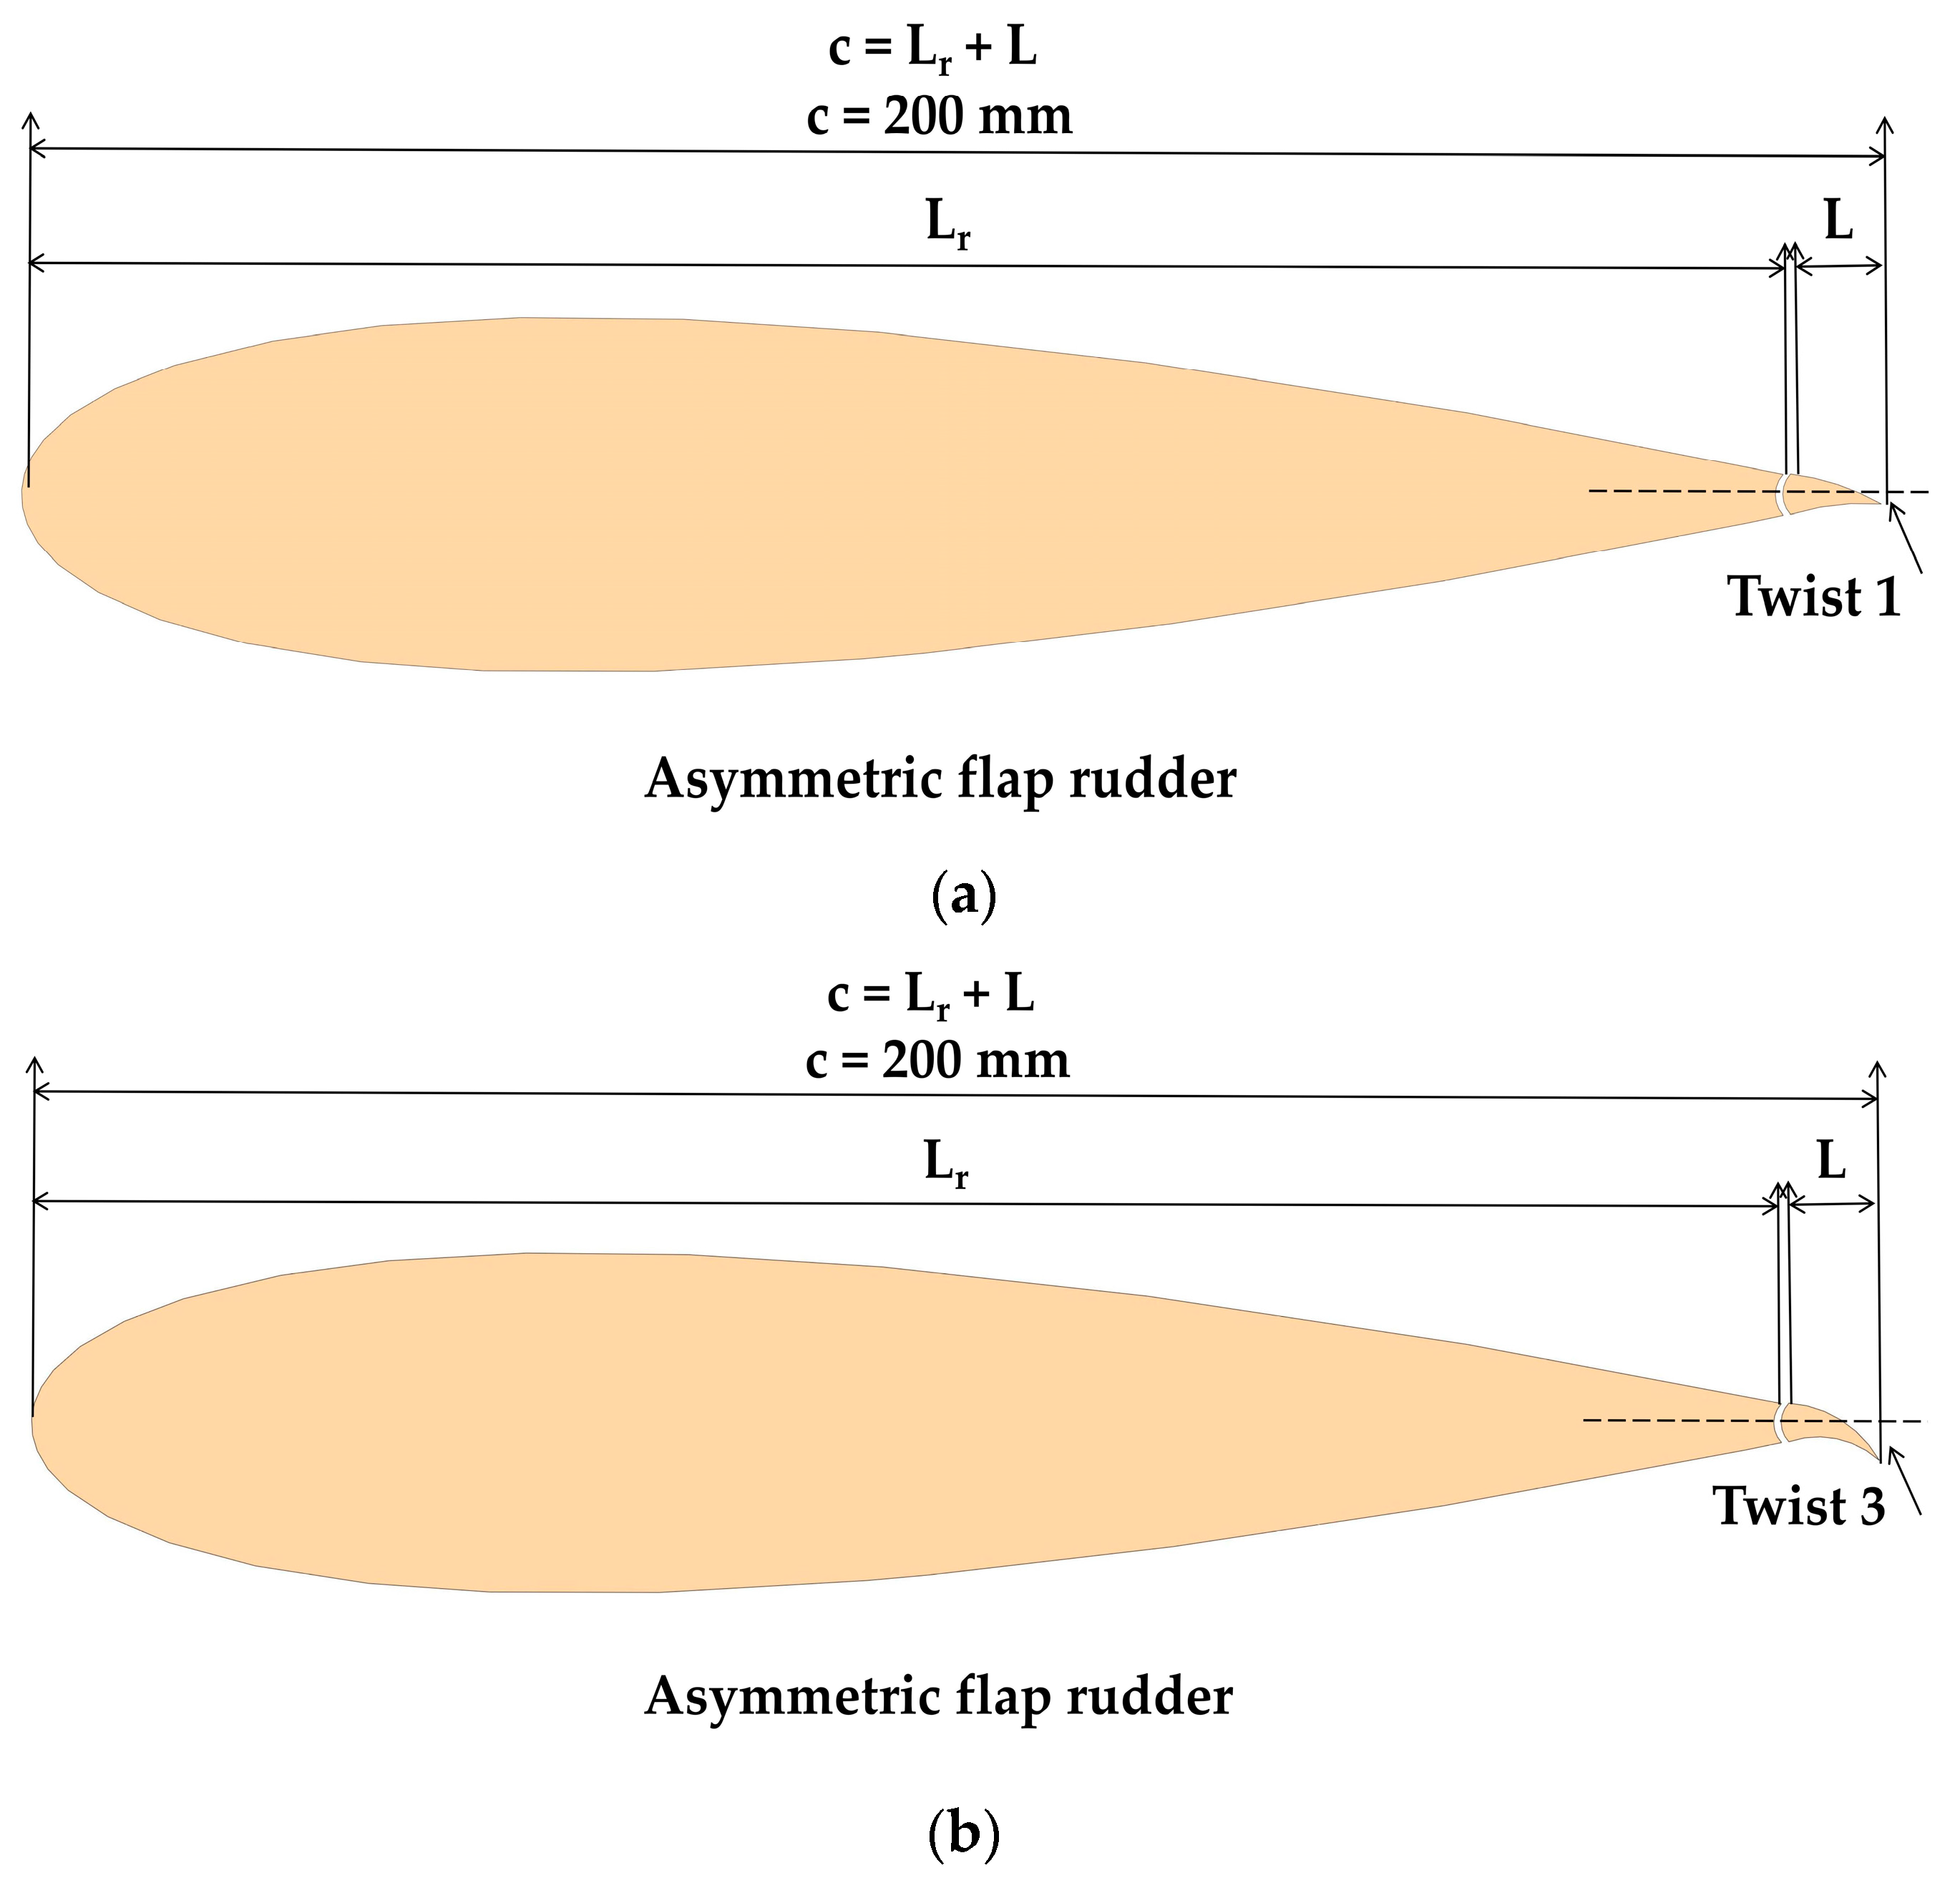
To enhance the hydrodynamic performance of flap rudders—particularly CL and CL/CD at low deflection angles—an asymmetric trailing-edge torsion model is proposed. This design modulates torsion intensity by altering the trailing-edge engagement position while maintaining constant chord length. Vertical offsets from the baseline engagement point, denoted Twist 1 to Twist 5 (corresponding to 1–5 mm displacements), define these positional variations. To ensure structural feasibility, this aft twisted configuration is first coupled with a streamlined rudder (as shown in Figure 14) and compared against a symmetric streamlined rudder. This study focuses on investigating the effects of this structural modification on the rudder’s hydrodynamic performance.
As shown in Figure 15, simulation results indicate that when the deflection angle exceeds 10°, the Twist 2, Twist 3, and Twist 4 configurations experience a significant drop in hydrodynamic efficiency, as reflected by the continuous decline in lift-to-drag ratio (CL/CD). In contrast, the Twist 1 configuration maintains superior performance up to an angle of attack of 15°, achieving the highest efficiency within this range. Beyond this point, however, its effectiveness diminishes due to intensified flow separation at the trailing edge. Notably, all twisted configurations with asymmetric trailing edges produce higher lift coefficients than the streamlined rudder across the entire deflection range (α = 0–20°). Given its optimal balance between lift enhancement and drag control, the Twist 1 design was ultimately selected and integrated into the symmetric flap rudder B.
Figure 16 illustrates the geometric configuration of the rudder system examined in this study. It consists of a symmetric main rudder combined with an asymmetric trailing-edge twisted flap, referred to as flap rudder C. The figure clearly shows the relative positioning of the main rudder and the flap, the flap length, and the spanwise twist distribution along the trailing edge. As shown in Figure 17, flap rudder C, incorporating a trailing-edge twist, demonstrates superior lift performance compared with flap rudder B and the streamlined rudder. Its hydrodynamic response varies notably across different angles of attack. At low angles (α ≤ 8°), flap rudder C achieves the highest lift-to-drag ratio among all configurations. In the intermediate range (8° < α ≤ 10°), flap rudder B slightly surpasses flap rudder C; beyond α = 10°, the streamlined rudder exhibits improved aerodynamic efficiency due to enhanced flow stability and reduced drag.
As part of the evaluation of the hydrodynamic performance of flap rudder C, flow field visualizations—including pressure distribution and velocity contours—are presented in Figure 18. The pressure contour map (Figure 18a) reveals a pronounced low-pressure zone on the suction side, particularly near the leading edge, indicative of strong lift generation. Compared to conventional designs, flap rudder C exhibits a more favorable pressure gradient, which promotes improved flow attachment and delays flow separation. The velocity contour map (Figure 18b) demonstrates smoother and more uniform flow acceleration around the rudder surface. The presence of high-speed regions on the upper surface, along with a reduced wake zone, suggests lower drag and enhanced boundary layer stability. These results confirm that flap rudder C delivers superior hydrodynamic performance under small angles of attack, supporting its effectiveness in improving lift and reducing drag—particularly beneficial for small unmanned sailboats.
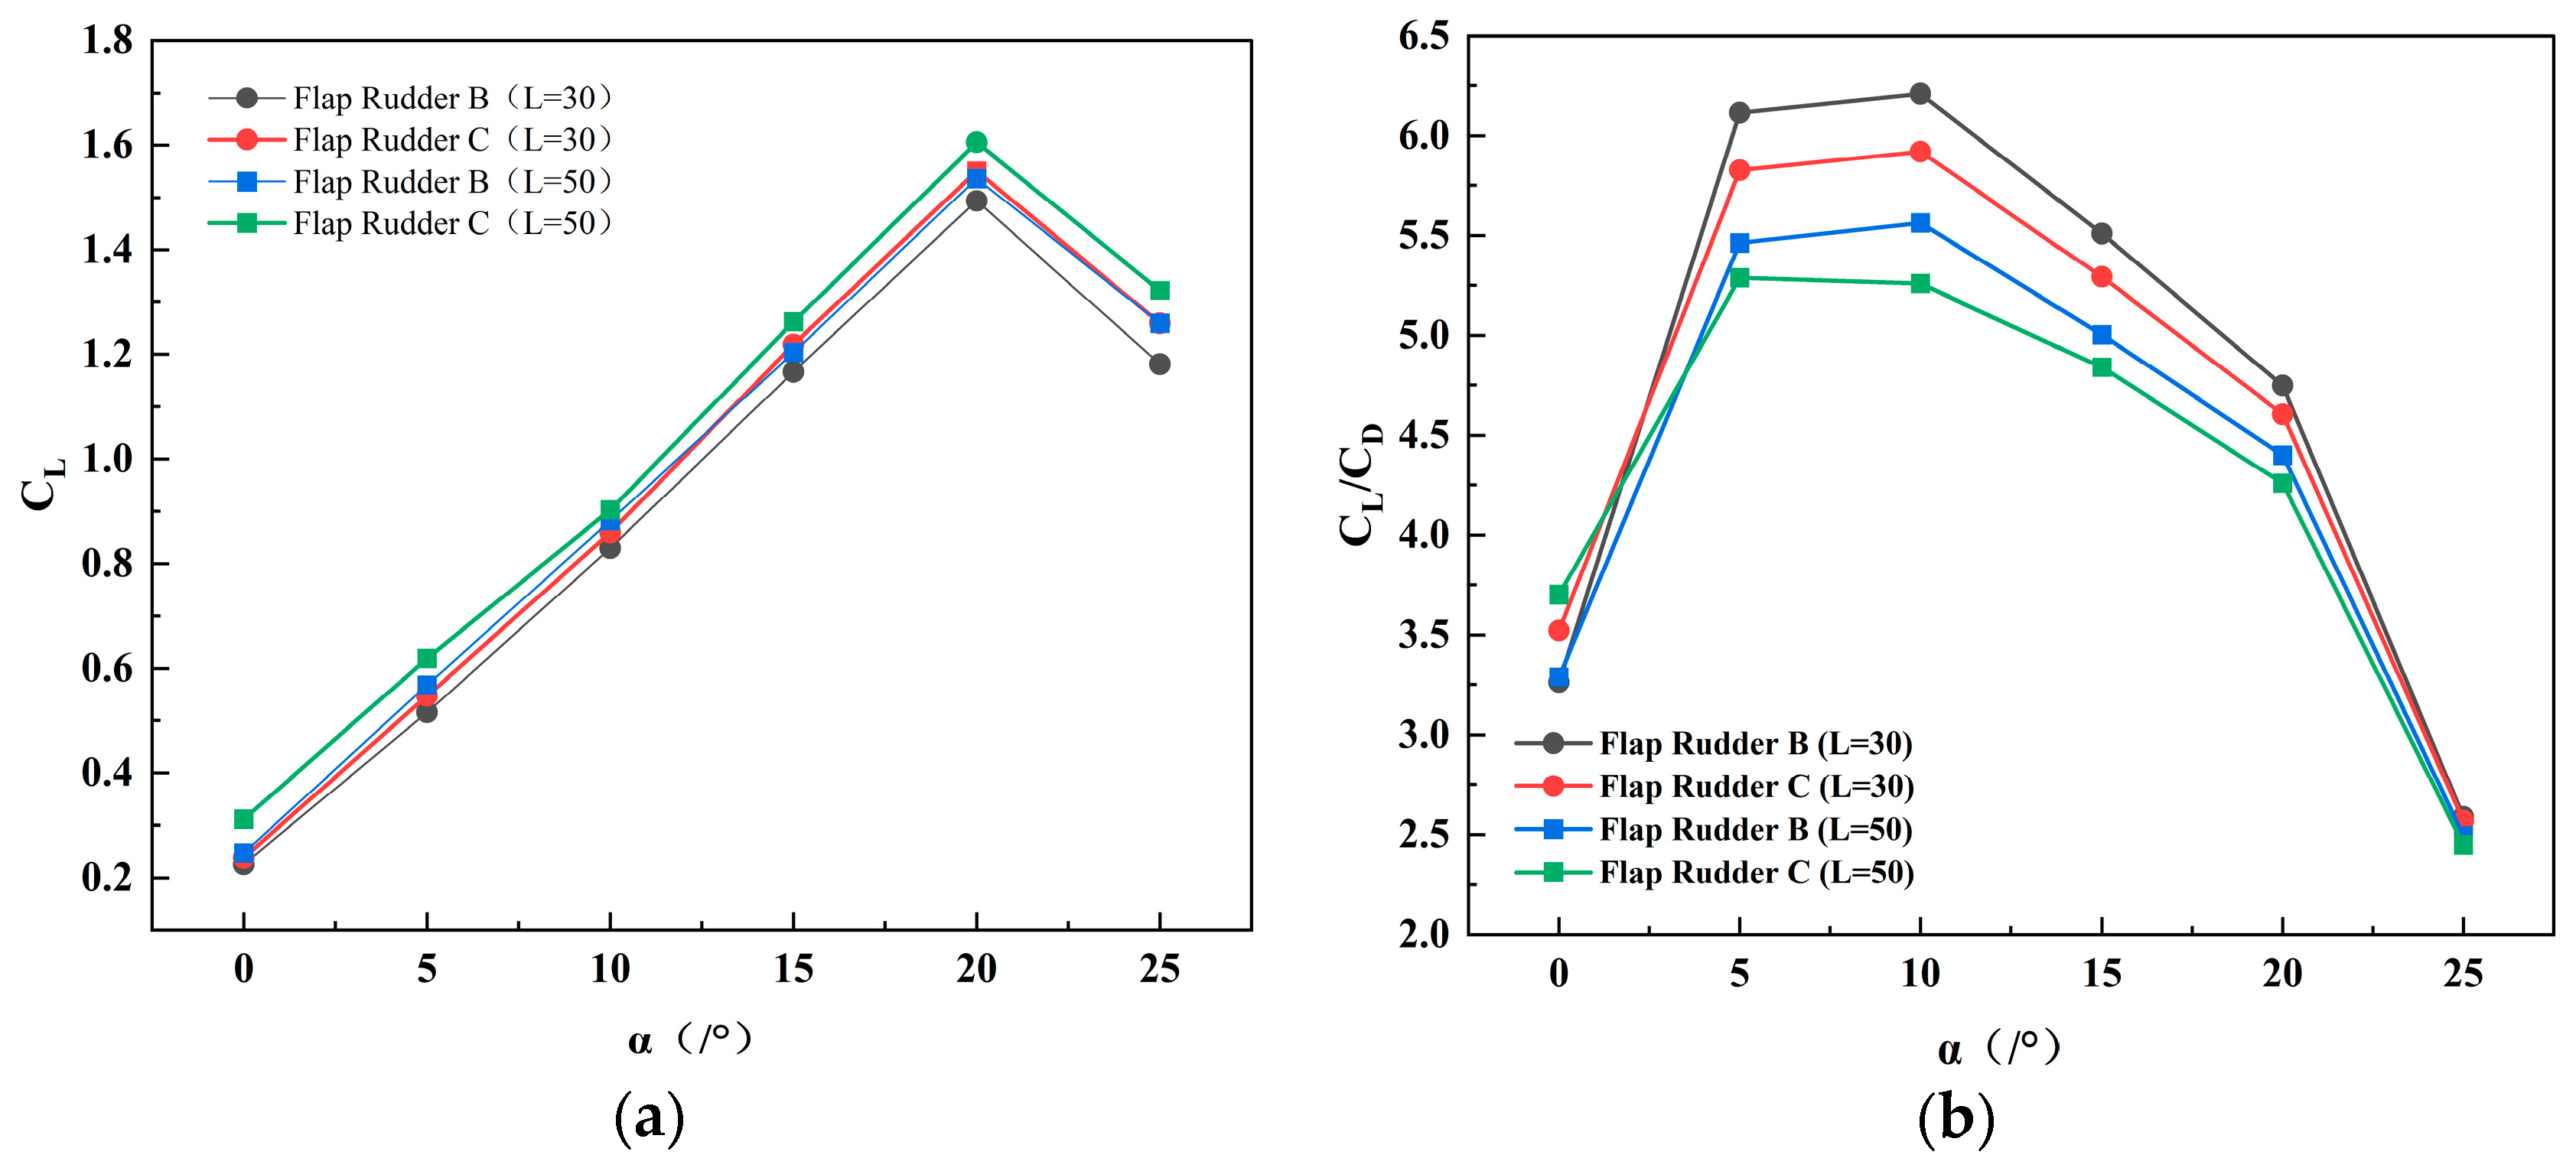
Figure 19 presents the CFD performance curves for flap rudders with lengths of L = 30 mm and L = 50 mm under the Twist 1 asymmetric arrangement. Figure 20a,b show the pressure and velocity distributions for the L = 30 mm configuration. The pressure contour (Figure 20a) exhibits a high-pressure region at the leading edge due to stagnation, and a low-pressure region near the trailing edge from flow acceleration along the suction surface. The asymmetric twist generates a distinct pressure difference between suction (upper) and pressure (lower) surfaces, enhancing lift. The velocity contour (Figure 20b) shows accelerated flow over the suction side, peaking near the leading edge, while the pressure side remains slower and uniform, indicating attached flow. The smooth velocity transition along the flap suggests that the asymmetric twist maintains flow attachment and limits local separation, supporting higher lift-to-drag ratios.
Comparisons from Figure 19, based on CFD simulation results, indicate that adding an asymmetric section to the symmetric main flap consistently increases the lift coefficient, also validating the effectiveness of the asymmetric flap modification on the symmetric rudder model. At a rudder deflection angle of 20°, the lift coefficient reaches its maximum for all simulated configurations, with flap rudder C exceeding flap rudder B regardless of whether L = 30 mm or L = 50 mm. The lift-to-drag ratio exhibits a more complex pattern: beyond a 4° deflection, the L = 30 mm cases for both flap rudders B and C show higher lift-to-drag ratios than the L = 50 mm cases, with flap rudder B at L = 30 mm achieving the highest ratio, while flap rudder C at L = 50 mm shows the lowest. For deflection angles below 4°, further simulations are needed to clarify the trend; however, preliminary CFD results suggest that flap rudder C attains the highest lift-to-drag ratio regardless of L = 30 mm or 50 mm. Notably, the lift-to-drag ratio curves intersect near a 4° deflection angle, highlighting the sensitivity of hydrodynamic performance to flap geometry and relative positioning.

4.5. Performance Analysis of Coupled Rotation Between Main Rudder and Flap in Flap Rudder C

Coupled rotational simulations were performed to investigate the interaction between the main rudder and the flap in flap rudder C. Two parameters were varied: the overall rotation angle of the flap rudder and the relative rotation of the flap. The flap rudder was rotated from 5° to 30°, and for each rudder angle, the flap was adjusted from 0° to 30° in 5° increments (e.g., at a rudder angle of 5°, the flap angles were 0°, 5°, 10°, …, 30°). As shown in Figure 21a, the lift coefficient reaches its maximum when the flap rudder is at 20°, independent of the flap angle. Figure 21c,d present the corresponding variations in lift-to-drag ratio and lift coefficient across the range of flap angles. Increasing the flap angle generally enhances lift, while the lift-to-drag ratio exhibits a non-linear trend: it increases up to approximately 6° flap deflection and decreases beyond this point. These results indicate that the asymmetric flap configuration improves the hydrodynamic performance of the rudder, producing higher lift and maintaining favorable lift-to-drag characteristics.

5. Conclusions

This study examines a flap rudder arrangement combining a symmetric main rudder with an asymmetric flap to evaluate its hydrodynamic characteristics at low deflection angles for small unmanned sailboats. CFD simulations indicate that this configuration generally produces higher lift coefficients, maintains moderate lift-to-drag ratios, and limits flow separation under the simulated conditions. The interaction between the symmetric and asymmetric elements may also affect control precision, energy consumption, and navigational stability. Some uncertainty is associated with assumptions in the turbulence model, mesh resolution, and boundary conditions, which could influence the quantitative results.
Detailed analysis of the simulation results can be summarized as follows:
  • At a deflection angle of 5°, the lift coefficient is 0.3167 for the streamlined rudder, 0.4261 for the conventional flap rudder, and 0.4599 for the asymmetric flap configuration. This corresponds to an increase of about 45% compared with the streamlined rudder and roughly 7.93% relative to the conventional flap rudder. The lift-to-drag ratios are 5.559, 5.87, and 6.342, reflecting improvements of 14% and 7.99%, respectively. These results indicate that the asymmetric configuration provides a notable enhancement in low-angle hydrodynamic performance compared with the baseline designs.
  • Despite the improvements at low deflection angles, the asymmetric configuration exhibits limitations at large deflection angles, where drag increases and the lift-to-drag ratio can drop below that of the streamlined rudder. Further investigations are needed to enhance flap rudder performance under high-angle conditions.
  • The selection of flap rudder geometries in this study was primarily guided by the maximization of the lift-to-drag ratio. For flap lengths of L = 30 and L = 50, simulations indicate that the asymmetric configuration consistently improves hydrodynamic performance. However, additional research is required to optimize the relative proportion between the flap and the asymmetric section, as well as to determine the optimal twist intensity of the asymmetric flap.
Overall, the results offer a clear view of the flow behavior of asymmetric flap rudders at low deflection angles and can serve as a useful reference for further computational studies.

Author Contributions

Conceptualization, H.W. and C.T.; methodology, H.W.; software, C.T.; validation, H.W., T.D. and C.X.; formal analysis, J.Y.; investigation, A.G.; resources, C.T.; data curation, C.T.; writing—original draft preparation, H.W.; writing—review and editing, H.W.; visualization, M.L.; supervision, C.T.; funding acquisition, C.T. All authors have read and agreed to the published version of the manuscript.

Funding

This research was funded by the Shandong Province science and technology SMES innovation ability improvement project of China (Grant No. 2023TSGC0350).

Data Availability Statement

All data generated during this study are included in this published article.

Acknowledgments

The authors would like to thank Tao Xia for his supervision, technical guidance, and support throughout this study. His valuable advice and oversight greatly facilitated the progress of the project.

Conflicts of Interest

The authors declare no conflicts of interest.

Abbreviations

The following abbreviations are used in this manuscript:
CFDComputational Fluid Dynamics
UAVs Unmanned Aerial Vehicles
CASChinese Academy of Sciences
AUVAutonomous Underwater Vehicle
RANSReynolds-averaged Navier–Stokes
FDDrag force
FLLift force
FRResultant force
FNNormal force
FTTangential force
CLLift coefficient
CDDrag coefficient
CNNormal force coefficient
CTTangential force coefficient
αAngle of attack
θFlap deflection angle
cRudder chord length
BRudder height
LFlap length
SAProjected area of the flap rudder
ρWater density
VInflow velocity
N-SNavier–Stokes
SSTShear-Stress Transport
kTurbulent kinetic energy
ωSpecific dissipation rate
PkGenerating term of turbulent kinetic energy k
μtEddy viscosity
PPressure
μHydrodynamic viscous coefficient
giMass force

References

  1. Agarwala, N. Monitoring the Ocean Environment Using Robotic Systems: Advancements, Trends, and Challenges. Mar. Technol. Soc. J. 2020, 54, 42–60. [Google Scholar] [CrossRef]
  2. Kabanov, A.; Kramar, V. Marine Internet of Things Platforms for Interoperability of Marine Robotic Agents: An Overview of Concepts and Architectures. J. Mar. Sci. Eng. 2022, 10, 1279. [Google Scholar] [CrossRef]
  3. Fang, S.; Tian, C.; Zhang, Y.; Xu, C.; Ding, T.; Wang, H.; Xia, T. Aerodynamic Analysis of Rigid Wing Sail Based on CFD Simulation for the Design of High-Performance Unmanned Sailboats. Mathematics 2024, 12, 2481. [Google Scholar] [CrossRef]
  4. Malmek, K.; Larsson, L.; Werner, S.; Ringsberg, J.W.; Bensow, R.; Finnsgård, C. Rapid aerodynamic method for predicting the performance of interacting wing sails. Ocean Eng. 2024, 293, 116596. [Google Scholar] [CrossRef]
  5. Xu, J.; Zhao, J.; Chang, J. Effect of Different Voltage Frequencies of Plasma Actuators on Wind Turbine Blade Lift and Rudder Efficiency. Processes 2025, 13, 1032. [Google Scholar] [CrossRef]
  6. Mei, Y.; Gao, J.; Lin, J.; Song, X. An AUV stability estimation method by considering rudder design parameters. Ocean Eng. 2024, 313, 119358. [Google Scholar] [CrossRef]
  7. Zhang, D.; Chiodi, A.M.; Zhang, C.; Foltz, G.R.; Cronin, M.F.; Mordy, C.W.; Cross, J.; Cokelet, E.D.; Zhang, J.A.; Meinig, C.; et al. Observing Extreme Ocean and Weather Events Using: Innovative Saildrone Uncrewed Surface Vehicles. Oceanography 2023, 36, 70–77. [Google Scholar] [CrossRef]
  8. Sun, Z.; Feng, A.; Yu, J.; Zhao, W.; Huang, Y. Development of autonomous sailboat sails and future perspectives: A review. Renew. Sustain. Energy Rev. 2025, 207, 114918. [Google Scholar] [CrossRef]
  9. Yang, A.; Jiancheng, Y.; Jin, Z. Autonomous sailboat design: A review from the performance perspective. Ocean Eng. 2021, 238, 109753. [Google Scholar] [CrossRef]
  10. An, Y.; Hu, F.; Chen, K.; Yu, J. Optimising General Configuration of Wing-Sailed Autonomous Sailing Monohulls Using Bayesian Optimisation and Knowledge Transfer. J. Mar. Sci. Eng. 2023, 11, 703. [Google Scholar] [CrossRef]
  11. Liu, H.; Yang, Y.; Yin, S. Study on the Turning Characteristics and Influencing Factors of the Unmanned Sailboat. J. Mar. Sci. Eng. 2024, 12, 1374. [Google Scholar] [CrossRef]
  12. Lina, K.; Hongyu, L.; Xin, S.; Xin, S.; Zongsheng, W.; Yu, Z.; Weizhuang, M. Effect of chord length ratio on aerodynamic performance of two-element wing sail. Ocean Eng. 2023, 287, 115946. [Google Scholar] [CrossRef]
  13. Dhomé, U.; Hillenbrand, A.; Kuttenkeuler, J.; Rolleberg, N. Unsteady pressure measurements at sea on the rigid wings of a model wind propelled ship. Part A: Measurement system development. Ocean Eng. 2025, 331, 121229. [Google Scholar] [CrossRef]
  14. Wang, B.; Huang, T.; Sun, Z.; Li, Z.; Zhao, Y.; Wang, Y.; Zhang, D.; Qian, P. Influence of hull geometry on self-propulsion performance of vector-propelled streamlined AUV with a ducted propeller. Ocean Eng. 2025, 338, 121959. [Google Scholar] [CrossRef]
  15. Liu, J.; Hekkenberg, R.; Zhao, B. RANS study on hydrodynamic characteristics of flapped rudders. In Proceedings of the International Conference on Offshore Mechanics and Arctic Engineering, Madrid, Spain, 17–22 June 2018; American Society of Mechanical Engineers: New York, NY, USA, 2018; p. V11BT12A002. [Google Scholar]
  16. Troll, M.; Das, T.K.; Shi, W.; Jia, L.; Li, C. Experimental analysis of a high-lift flap rudder with leading-edge tubercles. Ocean Eng. 2025, 340, 122208. [Google Scholar] [CrossRef]
  17. Lu, S.; Li, F.; Liu, J.; Liu, Z. Case studies on the impact of flap rudders on ship maneuverings. In Proceedings of the 2021 6th International Conference on Transportation Information and Safety (ICTIS), Wuhan, China, 22–24 October 2021; IEEE: Piscataway, NJ, USA, 2021; pp. 998–1003. [Google Scholar]
  18. Hao, Z.; Li, K.; Liu, G.; Liu, S. Optimizing the Hydrodynamic Performance of Unmanned Sailboats by Adjusting the Structure of the Keel and Rudder. J. Mar. Sci. Eng. 2025, 13, 414. [Google Scholar] [CrossRef]
  19. Liu, J.; Hekkenberg, R. Sixty years of research on ship rudders: Effects of design choices on rudder performance. Ships Offshore Struct. 2017, 12, 495–512. [Google Scholar] [CrossRef]
  20. Whicker, L.F.; Fehlner, L.F. Free-Stream Characteristics of a Family of Low-Aspect-Ratio, All-Movable Control Surfaces for Application to Ship Design; David Taylor Model Basin: Washington, DC, USA, 1958. [Google Scholar]
  21. Abbott, I.H.; Von Doenhoff, A.E. Theory of Wing Sections: Including a Summary of Airfoil Data; Courier Corporation: Chelmsford, MA, USA, 2012. [Google Scholar]
  22. Thieme, H. Design of Ship Rudders (zur Formgebung Von Schiffsrudern); David Taylor Model Basin: Washington, DC, USA, 1965. [Google Scholar]
  23. Molland, A.F.; Turnock, S.R. Marine Rudders and Control Surfaces: Principles, Data, Design and Applications; Elsevier: Amsterdam, The Netherlands, 2011. [Google Scholar]
  24. Ahmed, T.; Amin, M.T.; Islam, S.R.; Ahmed, S. Computational study of flow around a NACA 0012 wing flapped at different flap angles with varying Mach numbers. Glob. J. Res. Eng. 2014, 13, 4–16. [Google Scholar]
  25. Tasif, T.H.; Rahman, M.H.; Fazle, A.B.; Karim, M.M. Numerical prediction of flow past a marine rudder. Procedia Eng. 2017, 194, 59–66. [Google Scholar] [CrossRef]
  26. Guo, C.; Hu, W.; Huang, S. Using RANS to simulate the interaction and overall performance of propellers and rudders with thrust fins. J. Mar. Sci. Appl. 2010, 9, 323–327. [Google Scholar] [CrossRef]
  27. Moshfeghi, M.; Song, Y.J.; Xie, Y.H. Effects of near-wall grid spacing on SST-K-ω model using NREL Phase VI horizontal axis wind turbine. J. Wind Eng. Ind. Aerodyn. 2012, 107, 94–105. [Google Scholar] [CrossRef]
  28. Clara, I.; d’Adamo, A.; Stefano, F.; Giovanni, D.I.; Krassimirov, K.V. A wall-adapted zonal URANS/LES methodology for the scale-resolving simulation of engine flows. Int. J. Engine Res. 2022, 23, 1732–1747. [Google Scholar]
  29. Gao, H.; Xu, H.; Ma, Y.; Liu, Y.; Liang, X. Simulation study on the hydrodynamic characteristics and stability of an Open-Frame underwater towed body. Ocean Eng. 2025, 337, 121902. [Google Scholar] [CrossRef]
  30. Hou, L.; Han, Y.; Wang, R. Optimization design about end plates of ship rudder based on hydrodynamic numerical simulations. Brodogradnja 2025, 76, 76404. [Google Scholar] [CrossRef]
  31. Lee, M.; Park, G.; Park, C.; Kim, C. Improvement of Grid Independence Test for Computational Fluid Dynamics Model of Building Based on Grid Resolution. Adv. Civ. Eng. 2020, 2020, 8827936. [Google Scholar] [CrossRef]
  32. Molland, A.F.; Turnock, S.R. Wind Tunnel Tests on the Influence of Propeller Loading on Ship Rudder Performance: Four Quadrant Operation, Low and Zero Speed Operation. 1993. Available online: https://eprints.soton.ac.uk/46044/ (accessed on 11 July 2025).
  33. Liu, J.-l.; Hekkenberg, R. 3D RANS simulations of shallow water effects on rudder hydrodynamic characteristics. In Proceedings of the Proceedings 2016 International Conference on Maritime Technology, Harbin, China, 16–18 July 2016; pp. 35–39. [Google Scholar]
  34. Wang, X.; Qian, W.; Zhao, T.; He, L.; Chen, H.; Sun, H.; Tian, Y.; Cui, J. Fast Prediction of Airfoil Aerodynamic Characteristics Based on a Combined Autoencoder. Symmetry 2024, 16, 791. [Google Scholar] [CrossRef]
  35. Albert, H.F. On Quasisympletic Formulation and Formal Integration of Classical Fluid Dynamic Conservation Laws. ZAMM-J. Appl. Math. Mech./Z. Angew. Math. Mech. 2001, 81, 17–29. [Google Scholar] [CrossRef]
Figure 1. NACA symmetric hydrofoil: (a) NACA 0015; (b) NACA 0018; (c) NACA 0021.
Symmetry 17 01613 g001
Figure 2. Force analysis of the flap rudder: (a) schematic of forces acting on the main rudder; (b) flap deflection angle.
Symmetry 17 01613 g002
Figure 3. Flap rudder models: (a) two-dimensional view of the flap rudder; (b) NACA 0018 streamlined rudder; (c) flap rudder.
Symmetry 17 01613 g003
Figure 4. Flowchart of the flap rudder shape design process.
Symmetry 17 01613 g004
Figure 5. Grid division diagram: (a) computational domain mesh configuration; (b) boundary definitions; (c) flap rudder mesh configuration; (d) enlarged view of the local mesh near the flap rudder.
Symmetry 17 01613 g005
Figure 6. Comparison between simulation results and experimental data.
Symmetry 17 01613 g006
Figure 7. Flap rudders with different flap sizes: (a) top view of the flap rudder geometry; (b) elevation view of the flap rudder geometry.
Symmetry 17 01613 g007
Figure 8. Hydrodynamic performance of the flap rudder at different flap positions: (a) lift coefficient; (b) coefficient of drag; (c) lift-drag ratio.
Symmetry 17 01613 g008
Figure 9. Comparison of hydrodynamic performance between flap rudder A and streamlined rudder: (a) lift coefficient; (b) coefficient of drag; (c) lift-drag ratio.
Symmetry 17 01613 g009
Figure 10. Improved flap rudder.
Symmetry 17 01613 g010
Figure 11. Performance comparison between flap rudder A and flap rudder B: (a) lift coefficient; (b) coefficient of drag; (c) lift-drag ratio.
Symmetry 17 01613 g011
Figure 12. Lift and drag characteristics of flap rudder B with different flap chord lengths: (a) lift coefficient; (b) lift-drag ratio.
Symmetry 17 01613 g012
Figure 13. Flap rudder B vs. streamlined rudder: (a) lift coefficient; (b) lift-drag ratio.
Symmetry 17 01613 g013
Figure 14. Twisted model.
Symmetry 17 01613 g014
Figure 15. Hydrodynamic characteristics of the twisted tail rudder compared with the streamlined rudder: (a) lift coefficient; (b) coefficient of drag; (c) lift-drag ratio.
Symmetry 17 01613 g015
Figure 16. Twist magnitude along the span of the asymmetric flap rudder: (a) Twist 1; (b) Twist 3.
Symmetry 17 01613 g016
Figure 17. Performance comparison of flap rudder B, C and streamlined rudder: (a) lift coefficient; (b) coefficient of drag; (c) lift-drag ratio.
Symmetry 17 01613 g017
Figure 18. Flow field contour plots of flap rudder C at different angles of attack: (a) pressure contour map; (b) velocity contour map.
Symmetry 17 01613 g018
Figure 19. Computational results for rudder geometries with asymmetric Twist 1, comparing the hydrodynamic performance at flap lengths of L = 30 mm and L = 50 mm: (a) lift coefficient; (b) lift-to-drag ratio.
Symmetry 17 01613 g019
Figure 20. Contour plot of the flap rudder at a flap length of L = 30 mm: (a) pressure contour map; (b) velocity contour map.
Symmetry 17 01613 g020
Figure 21. Interaction between flap rudder and flap: (a) lift coefficient; (b) lift-to-drag ratio at small angles; (c) lift-drag ratio; (d) lift-to-drag ratio at small angles; (e) coefficient of drag.
Symmetry 17 01613 g021
Table 1. Mesh independence verification.
Number of Grids (No.)Lift Coefficient CL of Flap RudderDrag Coefficient CD of Flap Rudder
6.56 × 1051.1160.194
12.3 × 1051.1100.191
17.3 × 1051.1110.190
27.5 × 1051.1130.189
35.3 × 1051.1130.189
45.5 × 1051.1130.189
Table 2. Simulation parameter configuration.
Flow field velocity6 m/s
α0°, 5°, 10°, 15°, 20°, 25°, 30°
The viscosity equationSST k-ω
Fluid domain materialswater
Calculate the reference areaThe flap rudder’s projected area in the Y-direction
Calculate the reference length0.2 m
Report definitionLift coefficient, drag coefficient, lift force, drag force
Disclaimer/Publisher’s Note: The statements, opinions and data contained in all publications are solely those of the individual author(s) and contributor(s) and not of MDPI and/or the editor(s). MDPI and/or the editor(s) disclaim responsibility for any injury to people or property resulting from any ideas, methods, instructions or products referred to in the content.