Article

A Wasserstein Distance-Based Distributionally Robust Optimization Strategy for a Renewable Energy Power Grid Considering Meteorological Uncertainty

1
Power Research Institute of State Grid Shaanxi Electric Power Co., Ltd., Xi’an 710100, China
2
State Grid Shaanxi Electric Power Co., Ltd., Xi’an 710048, China
3
School of Automation, Guangdong University of Technology, Guangzhou 510006, China
*
Author to whom correspondence should be addressed.
Symmetry 2025, 17(10), 1602; https://doi.org/10.3390/sym17101602
Submission received: 19 August 2025 / Revised: 16 September 2025 / Accepted: 19 September 2025 / Published: 26 September 2025
(This article belongs to the Special Issue Symmetry in Digitalisation of Distribution Power System)

Abstract

With the large-scale integration of renewable energy into the power system, meteorological uncertainty poses challenges to the safe and stable operation of the system. Traditional uncertainty optimization methods struggle to balance robustness and economy. This paper proposes a Wasserstein distance-based distributionally robust optimization strategy that considers covariate factors for a renewable energy power grid considering meteorological uncertainty. By introducing covariate factors to construct the Wasserstein ambiguity set, the intrinsic connection between weather uncertainty and the output of new energy is effectively depicted. The optimization problem is transformed into a solvable form of mixed integer linear programming by using linear decision rules and duality theorems, and the distributionally robust optimization scheduling problem is solved based on the improved cross optimization algorithm. Simulation results based on the IEEE 33 system show that under the same worst-case expected energy shortage of 20 kWh, the proposed method achieves an expected total dispatch cost of approximately CNY 0.534 million, reducing cost by about 0.4%, 0.9%, and 1.8% compared with conventional Wasserstein DRO, KL-divergence DRO, and Moment Information DRO; when the radius of the Wasserstein ball is 1, using the CSO algorithm reduces the runtime by 59.4% compared with the solver. It effectively reduces operating costs and solution speed while ensuring system security, offering a new approach for the optimal dispatch of power systems with a high penetration of renewable energy.

1. Introduction

The power system is a comprehensive and symmetrical system for the supply and consumption of electric energy. With the global energy landscape undergoing a profound transition, the installed capacity of renewable energy sources such as photovoltaic (PV) and wind power is expanding at an unprecedented rate. This rapid growth is a cornerstone of international efforts to achieve decarbonization and combat the climate crisis [1,2]. However, with the continuous penetration and large-scale grid integration of distributed renewable energy sources, the inherent characteristics of renewable energy sources such as intermittency, volatility, and uncertainty are posing significant challenges to the secure, stable, and economic operation of modern power systems [3,4]. Therefore, the power system is confronted with numerous unprecedented threats and challenges, including increased uncertainty, stable operation, and declining power quality, exacerbating the asymmetry problem of the power system [5].
In recent years, with global climate change, the increasing global extreme weather events have exacerbated the above problem, leading to significant deviations and asymmetries between predicted and actual renewable energy generation [6,7,8,9,10]. When the power system faces multiple uncertainties, conventional deterministic optimization methods become ineffective. To cope with the uncertainty of renewable energy sources, academic and industry researchers have proposed various uncertainty optimization methods. The stochastic optimization (SO) method relies on probability distribution information of uncertain parameters and characterizes uncertainty by constructing multiple scenarios. However, its computational complexity increases significantly with the number of scenarios [11,12]. The robust optimization (RO) method does not require probability distribution information; only the variation ranges of uncertain parameters are needed, but its conservatism often leads to higher cost [13,14].
Consequently, the academic and engineering researchers explored the distributionally robust optimization (DRO) method to handle the uncertainty problems [15,16,17,18,19]. As a method that balances the advantages of RO and SO, DRO has been widely applied in the uncertainty optimization. Based on the differences in ambiguity sets, DRO can be categorized into moment-based and probability-distribution-based approaches [20]. Moment-based DRO constructs an uncertainty set using first- and second-order moments, avoiding inaccuracies caused by incorrect assumptions about the probability distribution function of the renewable energy output. However, the quantity and completeness of historical data significantly impact the moment information, which can be uncertain. Therefore, the distribution-based DRO method defines an ambiguity set by measuring the distance between the theoretical and empirical probability distributions of renewable energy output, often using a ball-shaped set where the radius can be adjusted to control the model’s conservatism [21,22].
Among distance-based DRO methods, the Wasserstein distance-based DRO method has garnered particular attention due to its excellent statistical and computational properties [23,24,25]. The Wasserstein distance measures the “distance” between two probability distributions, and can effectively capture the distributional information of uncertain parameters and obtain good convergence properties. Compared to conventional DRO methods, Wasserstein distance-based DRO does not require precise probability distribution information; it constructs an ambiguity set of probability distributions centered around the empirical distribution and measured by the Wasserstein distance, seeking the optimal decision under the worst-case distribution within this set, effectively balancing system economy and robustness [26,27]. For the field of renewable power systems, the Wasserstein distance-based DRO method has been widely applied in various fields, including handling wind power prediction errors; power generation dispatching and multi-energy collaboration in electricity-thermal-hydrogen integrated energy systems; voltage fluctuations in distribution networks; flexible interconnection devices and distribution networks and distributed resource optimization for coordinating the dispatching of power distribution and sales service providers and microgrids; new energy stations; and the field of emerging technology integration and evaluation systems for energy storage capacity planning, ancillary services, and market mechanism design [28,29,30,31,32].
However, the existing DRO research measured by Wasserstein distance still faces the following challenges:
  • It gnores their correlations and dependencies on external factors, especially the impact of meteorological conditions on renewable energy output. In actual application, the operational parameters of power systems with renewable energy are significantly influenced by covariates such as weather conditions, seasonal changes, and geographical locations, exhibiting the complex spatiotemporal correlations [33,34].
  • The Wasserstein distance-based DRO method still faces theoretical shortcomings and application difficulties such as high computational complexity, reliance on empirical assumptions for construction of ambiguity sets, and the lack of multi-type uncertainty coupling mechanisms [35,36].
To solve the above problems, a Wasserstein distance-based DRO strategy for a renewable energy power grid considering meteorological uncertainty is proposed in this paper. The main contributions are highlighted as follows:
  • The proposed optimization method based on the improved Wasserstein distance introduces covariates to quantify the correlation between uncertain parameters such as meteorological conditions, and builds a probability distribution ambiguity set centered on the empirical distribution and measured by the Wasserstein distance. By adjusting the Wasserstein sphere radius to quantify the degree of uncertainty and solving the optimal decision under the most unfavorable distribution in this ambiguity set, the robustness of the system under adverse weather conditions is improved.
  • By employing the linear decision rules (LDRs) and duality theory, the optimization problem is transformed into a solvable mixed-integer linear programming form, and the crisscross optimization (CSO) algorithm is applied to solve the large-scale DRO problem.
The CSO algorithm has been applied to deterministic dispatch and renewable energy forecasting; however, its application in uncertainty optimization for power grid remains unexplored. The CSO algorithm’s crossover operations recombine elite parameters, and enhance population diversity and global search capabilities and the interplay of horizontal and vertical crossovers in the algorithm escape local optima, demonstrating strong global optimization potential.
The simulation verification on the IEEE 33 bus system verified the effectiveness and superiority of the proposed strategy in the precise quantification of meteorological uncertainties and the economic robust comprehensive optimization dispatching of the power grid. Therefore, the proposed strategy provides a new technical path for optimal dispatching and maintaining the symmetry of power supply and consumption in renewable energy power systems considering weather uncertainties, and effectively expands the theoretical and application scope of both the Wasserstein distance-based DRO and CSO algorithms.

2. Meteorological Uncertainty Quantification Method Based on Wasserstein Distance

2.1. The Wasserstein Distance

The ambiguity set based on the Wasserstein distance utilizes the Euclidean norm to describe the distance between the true distribution P0 and the empirical distribution P of an uncertain variable. The Wasserstein distance can be conceptualized as the minimum cost required to transport the probability mass from distribution P to distribution P0. For two probability distributions, P and P0, their k-order Wasserstein distance is expressed as:
W k ( P , P 0 ) = inf π Π ( P , P 0 ) E × E x y k d π ( x , y ) 1 / k
where Π(P,P0) represents the set of all joint distributions with marginals P and P0, π is a coupling in Π(P,P0), inf represents the infimum, and ‖⋅‖ denotes the Euclidean norm. When k = 1, the Wasserstein distance is interpreted as the minimum transportation cost.
Based on this distance, a Wasserstein ball can be constructed with the empirical distribution P ^ N as its center and a radius of r, forming the ambiguity set F :
F = P P ( Ξ ) | W k ( P , P ^ N ) r
where P(Ξ) represents all probability distributions on the support set Ξ, and P ^ N is the empirical distribution constructed from N historical samples ξ ^ 1 , ξ ^ 2 , , ξ ^ N :
P ^ N = 1 N i = 1 N δ ξ ^ i
where δ ξ ^ i denotes the Dirac measure at sample ξ ^ i . N is the number of historical samples.

2.2. The Wasserstein Distance Ambiguity Set with Covariates

Considering the covariate factors, the Wasserstein ambiguity set can be extended to:
F = P P ( E × Ω ) | E P [ ξ | ω ] F ω ,   ω Ω
where Ω represents the value space of covariates, ω∈Ω represents one specific observed value of the covariate random vector, E P represents expectation under P, and F ω represents the Wasserstein ambiguity set under the condition of the covariate ω, which is:
F ω = P ξ | ω P ( Ξ ) | W ¯ p ( P ξ | ω , P ^ N , ω ) r ω
where Pξ|ω represents the conditional distribution of the uncertain parameter ξ under the condition of the covariate ω; P ^ N , ω represents the empirical distribution constructed from historical samples under the condition of the covariate ω; and rω is the radius of the Wasserstein ball under the condition of the covariate ω.
By introducing covariate information, the distribution characteristics of uncertain parameters can be more accurately depicted, thereby enhancing the economy and robustness of the optimization results. For renewable energy output, meteorological conditions are used as covariates, and the temperature, global horizontal irradiance, direct normal irradiance, and diffuse horizontal irradiance are used and affect the values of covariates ω. Therefore, by constructing the distinct Wasserstein distance ambiguity set based on varying meteorological uncertainties and determining the specific radius for each covariate through cross-validation, we can more accurately describe renewable energy output while balancing total operating costs and system reliability.

2.3. Linear Decision Rules

In DRO problems, decision variables are typically divided into first-stage variables x, determined before the uncertainty is realized, and second-stage variables y(ξ), which can be adjusted after. LDRs are an effective method to approximate the second-stage variables as a linear function of the uncertain parameters:
y ξ = y 0 + i = 1 d y i ξ i
where y(ξ) represents second-stage variables, and y0 and y are the coefficients to be optimized. When covariates are included, this rule can be extended to allow the decision to adapt to the side information ω:
y ξ , ω = y 0 ω + i = 1 d y i ω ξ i
where y0(ω), yi(ω) represent the coefficients as functions of ω. In power grid dispatch, LDRs can represent the response strategy of generation units to uncertainty. For a thermal power unit i at time t, its actual output can be expressed as:
P g , i , t = P g , i , t 0 + k W α i , k , t P p v , k , t P ^ p v , k , t
where P g , i , t 0 is the base output; Ppv,k,t and P ^ p v , k , t is the actual and predicted output of PV unit k; and αi,k,t is the participation factor. When considering covariates, this factor can be adjusted αi,k,t(ω). This approach transforms the multi-stage problem into a single-stage optimization problem concerning x and LDRs coefficients, simplifying the solution process.

3. Distributionally Robust Dispatch Strategy

3.1. Objective Function

Based on the ambiguity set defined above, the two-stage distributionally robust dispatch model with covariates is formulated as follows:
min x C ( x ) + sup P F E Q x , v
where x represents the first-stage (day-ahead) decision variables, C(x) is the day-ahead operational cost, and the second term represents the worst-case expected cost over the ambiguity F for the second-stage (intra-day) decisions. Q(x, v) is the total cost function given the day-ahead decision x and the realization of uncertainty v.
(1)
Day-ahead Decision Costs
The day-ahead costs primarily include the start-up costs of thermal units and the investment and maintenance costs of energy storage systems.
min t = 1 T i G C i gen P i , t DA + C i start S i , t
where T is the total number of dispatch periods, t is the index for a single time period, G is the set of generation units in the power system, C i g e n is the generation cost coefficient for unit i, P i , t D A is the day-ahead planned output for unit i at time t; Si,t is the start-up status of unit i at time t; and Si,t = 1 indicates the unit is starting up.
(2)
Intra-day Decision Costs
The intra-day costs arise from re-dispatching controllable units to compensate for prediction errors in power sources and loads.
min ξ U t = 1 T i G C i gen P i , t RT
where P i , t R T is the intra-day output of unit i, which is a function of the uncertainty realization v.

3.2. Operational Constraints

The dispatch plan must satisfy the following constraints for power balance, grid security, and equipment operation in both day-ahead and intra-day stages.
(1)
Power Flow Constraints:
The model uses a linearized DistFlow formulation to represent the AC power flow constraints in the distribution network. For each node i and time period t:
P i + 1 , t bus = P i , t bus + P i , t vir + P i , t load Q i + 1 , t bus = Q i , t bus + Q i , t vir + Q i , t load V i + 1 , t bus = V i , t bus r i P i bus + x i Q i bus V base P i , t vir = λ i H P j , t H + λ i wind P k , t wind + λ i PV P l , t PV + λ i E S S P l , t E S S Q i , t vir = λ i H Q j , t H + λ i wind Q k , t wind + λ i PV Q l , t PV + λ i E S S Q l , t E S S
where P i , t b u s and Q i , t b u s are the net active and reactive power injections at node i; P i , t l o a d and Q i , t l o a d are the active and reactive load at node i during time period t. P i , t v i r and Q i , t v i r are virtual variables introduced to unify the format, representing the total active and reactive power output of all units at node i during time period t. P i , t v i r is composed of the active power output from thermal, PV, and ESS units at node i. Q i , t v i r is composed of the reactive power output from thermal, PV, and ESS units at node i. λ i H , λ i w , λ i P V , and λ i E S S are 0/1 binary variables indicating whether the corresponding unit type exists at node i. V i , t b u s is the voltage value at node i during time period t. ri and xi are the resistance and reactance parameters. Vbase is the base voltage value.
(2)
Generation Unit Constraints:
Ramping Constraints:
P i , t H P i , t 1 H R i up ,   i , t P i , t 1 H P i , t H R i down ,   i , t
where R i u p and R i d o w n are the maximum ramp-up and ramp-down rates for unit i.
Spinning Reserve Constraints:
P i , t H + r ¯ i , t H P ¯ i H ,   r ¯ i , t H 0 P i , t H r _ i , t H P _ i H ,   r _ i , t H 0
where r ¯ i , t H and r _ i , t H are the upward and downward spinning reserve capacities of unit i.
(3)
Uncertainty Parameter Constraints:
The actual output of a PV unit P i , t PV is modeled as its forecasted value plus an uncertain deviation term, which is the random variable in our DRO model.
P i , t PV = P ¯ i , t PV + ν t PV
where P ¯ i , t PV is the uncertain deviation for PV unit i at time t. ν t PV is the fluctuation value of an uncertain quantity.
(4)
Energy Storage System Constraints:
u c s , t c h + u c s , t d i s 1 ,   t T 0 P e s , t c h u e s , t c h P e s c h , m a x 0 P e s , t d i s u e s , t d i s P e s d i s , m a x E e s , t = E e s , t 1 + P e s , t c h η c h Δ t P e s , t d i s η d i s Δ t S O C m i n E e s r a t e d E e s , t S O C m a x E e s r a t e d
where u c s , t c h and u c s , t d i s are 0–1 binary variables, representing the charging and discharging states of the energy storage system, respectively; P e s c h , m a x and P e s d i s , m a x are the maximum charging and discharging power of the energy storage system; P e s , t c h and P e s , t d i s are the charging and discharging power of the energy storage system at time period t; ηch and ηdis are the charging and discharging efficiencies; Δt is the length of each dispatch period, and in this paper, Δt = 1 h; Ees,t and Ees,t − 1 are the energy stored in the energy storage system at the end of time period t and time period t − 1, respectively; SOCmax and SOCmin are the maximum and minimum state of charge of the energy storage system, respectively; and E e s r a t e d is the rated capacity of the energy storage system.

3.3. Model Dualization

The application of LDRs ensures that the second-stage problem is convex, satisfying the strong duality condition required for this transformation. Then the primary difficulty in solving the distributionally robust optimization problem lies in the inner-level, worst-case expectation term:
sup P F E P [ Q ( x , ξ , ω ) ]
where x represents first-stage decision vector, and Q(x, ξ, ω) is second-stage cost under (x, ξ, ω).
For an ambiguity set based on the Wasserstein distance, strong duality theory allows this term to be reformulated into a tractable form. The general dual problem is given by:
sup P : W p ( P , P ^ N ) ε E P [ Q ( x , ξ ) ] = inf λ 0 λ ε + λ E P ^ N sup ξ Ξ Q ( x , ξ ) λ d ( ξ , ξ ^ )
where λ ≥ 0 is the dual variable, and d(ξ, ξ ^ ) is the distance function in the space of uncertain parameters.
When Linear Decision Rules (LDRs) of the form y(v, z) are applied, and assuming the second-stage cost function Q(x, v) is convex with respect to v, the problem can be further simplified. Considering the covariate factors, the dual problem is extended to:
sup P F E P [ Q ( x , ξ , ω ) ] = inf λ ( ω ) 0 { E P ^ ω [ λ ( ω ) ε ω + λ ( ω ) E P ^ N , ω [ sup ξ Ξ { Q ( x , ξ , ω ) λ ( ω ) d ( ξ , ξ ^ ) } ] ] }
Through the duality transformations described above, the original distributionally robust optimization problem is converted into a deterministic Mixed-Integer Linear Program (MILP). This resulting MILP is then solved using the CSO algorithm.

3.4. Distributionally Robust Optimal Dispatching

3.4.1. Uncertainty Optimization Methods

After the series of model transformations in previous sections, the original two-stage DRO problem is reformulated into a large-scale mixed-integer linear program. In theory, this MILP can be solved to global optimality using commercial solvers like CPLEX or Gurobi. However, in practical power system dispatch, achieving theoretical optima is not the sole objective. The curse of dimensionality is where the number of variables and constraints in the MILP explodes as the grid scale, number of units, and scheduling resolution increase. Therefore, seeking a more efficient solution method that balances solution quality with computational speed is of significant engineering value.
To clarify the positioning and advantages of the proposed approach relative to existing uncertainty optimization methodologies, a comparative summary is presented in Table 1. This comparison highlights trade-offs between computational complexity, conservatism of solution and the resulting economic performance.
We then propose a distributionally robust optimization strategy based on the CSO algorithm for a renewable energy power grid dispatching considering meteorological uncertainty. The CSO algorithm possesses strong global search capabilities and potential for parallel computation due to its unique horizontal and vertical crossover mechanisms, obtaining high-quality, near-optimal feasible solutions within an acceptable timeframe, achieving an effective trade-off between solution quality and computational efficiency.
The CSO algorithm balances global exploration and local exploitation through its unique crossover operators: horizontal and vertical crossover. In the context of power system dispatch, a dispatch plan can be considered an individual particle. Horizontal crossover is analogous to exchanging the unit outputs for the same time period between two different dispatch plans (parents) to generate new offspring. In contrast, vertical crossover involves exchanging parameters of different units or time periods within a single dispatch plan to explore its local solution space. This dual-crossover mechanism enables the algorithm to effectively escape local optima and find high-quality solutions that balance computational cost and dispatch effectiveness.

3.4.2. Distributionally Robust Optimal Dispatching Based on the CSO Algorithm

The specific steps for solving the single-level deterministic problem resulting from the dual transformation, using the CSO algorithm, are shown in Figure 1 and below:
(1)
Population Initialization: Define the population as the set of all possible dispatch plans X, where X = [X1;…;XN]. The dimension of each particle is m = d × 24, where d represents the number of nodes with dispatchable units, and each dimension’s value corresponds to the power output at that node for each of the 24 h. Let N be the population size, Pve be the vertical crossover probability, and f be the maximum number of iterations.
(2)
Fitness Calculation: The objective function of the distributionally robust optimization model is used as the fitness function for each particle. The fitness of each particle in the population is calculated in every generation. The particle with the optimal fitness value is recorded as the generation’s best.
(3)
Vertical Crossover: Vertical crossover is performed across all particles in the population, exchanging parameters between different dimensions. The decision to perform the crossover is based on the vertical crossover probability Pve. If a crossover is executed, a new offspring individual is generated as follows:
L E l ( i , m 1 ) = c r X ( i , m 1 ) + ( 1 c r ) X ( i , m 2 ) + r 1 ( X ( i , m 1 ) X ( i , m 2 ) ) i ( 1 , N ) , m 1 , m 2 ( 1 , m )
where cr is a crossover coefficient in [0, 1], and r1 is a random number in [−1, 1]. m1, m2 are two random dimension indices. The particles generated through vertical crossover form the new generation. Any values exceeding the upper or lower bounds are replaced by the boundary values.
(4)
Horizontal Crossover: Horizontal crossover randomly selects two parent particles, X(i) and X(j), and performs a parameter crossover within the same dimension to produce offspring individuals LEk(i,m), LEk(j,m):
L E k ( i , m ) = c 1 X ( i , m ) + ( 1 c 1 ) X ( j , m ) + s 1 ( X ( i , m ) X ( j , m ) ) L E k ( j , m ) = c 2 X ( j , m ) + ( 1 c 2 ) X ( i , m ) + s 2 ( X ( j , m ) X ( i , m ) )
where c1, c2 are crossover coefficients in [0, 1], and s1, s2 are random numbers in [−1, 1]. The particles generated through horizontal crossover form the new generation. Any values exceeding the upper or lower bounds are replaced by the boundary values.
(5)
Termination Condition: The fitness of each particle in every new generation is calculated to find the particle with the best fitness value, gbest. The algorithm checks if the current iteration count has reached the maximum number of iterations, f. If not, it returns to step (3) for the next iteration cycle. If yes, the loop terminates, and the fitness value of the optimal particle gbest is output.

4. Results and Discussion

4.1. Simulation Setup

To validate the distributionally robust dispatch model, simulations were conducted on the standard IEEE 33-bus distribution system, as depicted in Figure 2. The locations and capacities of the generation units are detailed in Table 2. The meteorological data, including temperature, global horizontal irradiance, direct normal irradiance, and diffuse horizontal irradiance, were sourced from a full year of records (2023) for Yulin, Shaanxi Province, China. The PV output data corresponds to the actual 2023 output of the FengRong PV power station in Shaanxi. In the comparative analysis, the Improved DRO model, solved by the CSO algorithm, is benchmarked against deterministic, robust, and stochastic optimization models. For comparison, the RO model was formulated with a box uncertainty set whose bounds were determined by the 95th percentile of historical deviations. The SO model was configured using 100 scenarios generated via Monte Carlo sampling from a fitted probability distribution.
In this study, the key economic and technical parameters, including the operational and start-up costs for thermal generating units and the operational costs for energy storage systems, were adopted from established benchmark values in Table 3.

4.2. Analysis of the Distributionally Robust Optimization Results

4.2.1. Impact of the Wasserstein Radius on System Dispatch

This section analyzes the effectiveness of the Improved DRO model, focusing on how the key parameter—the Wasserstein radius r—affects the system’s dispatch strategy, economic performance, and renewable energy integration.
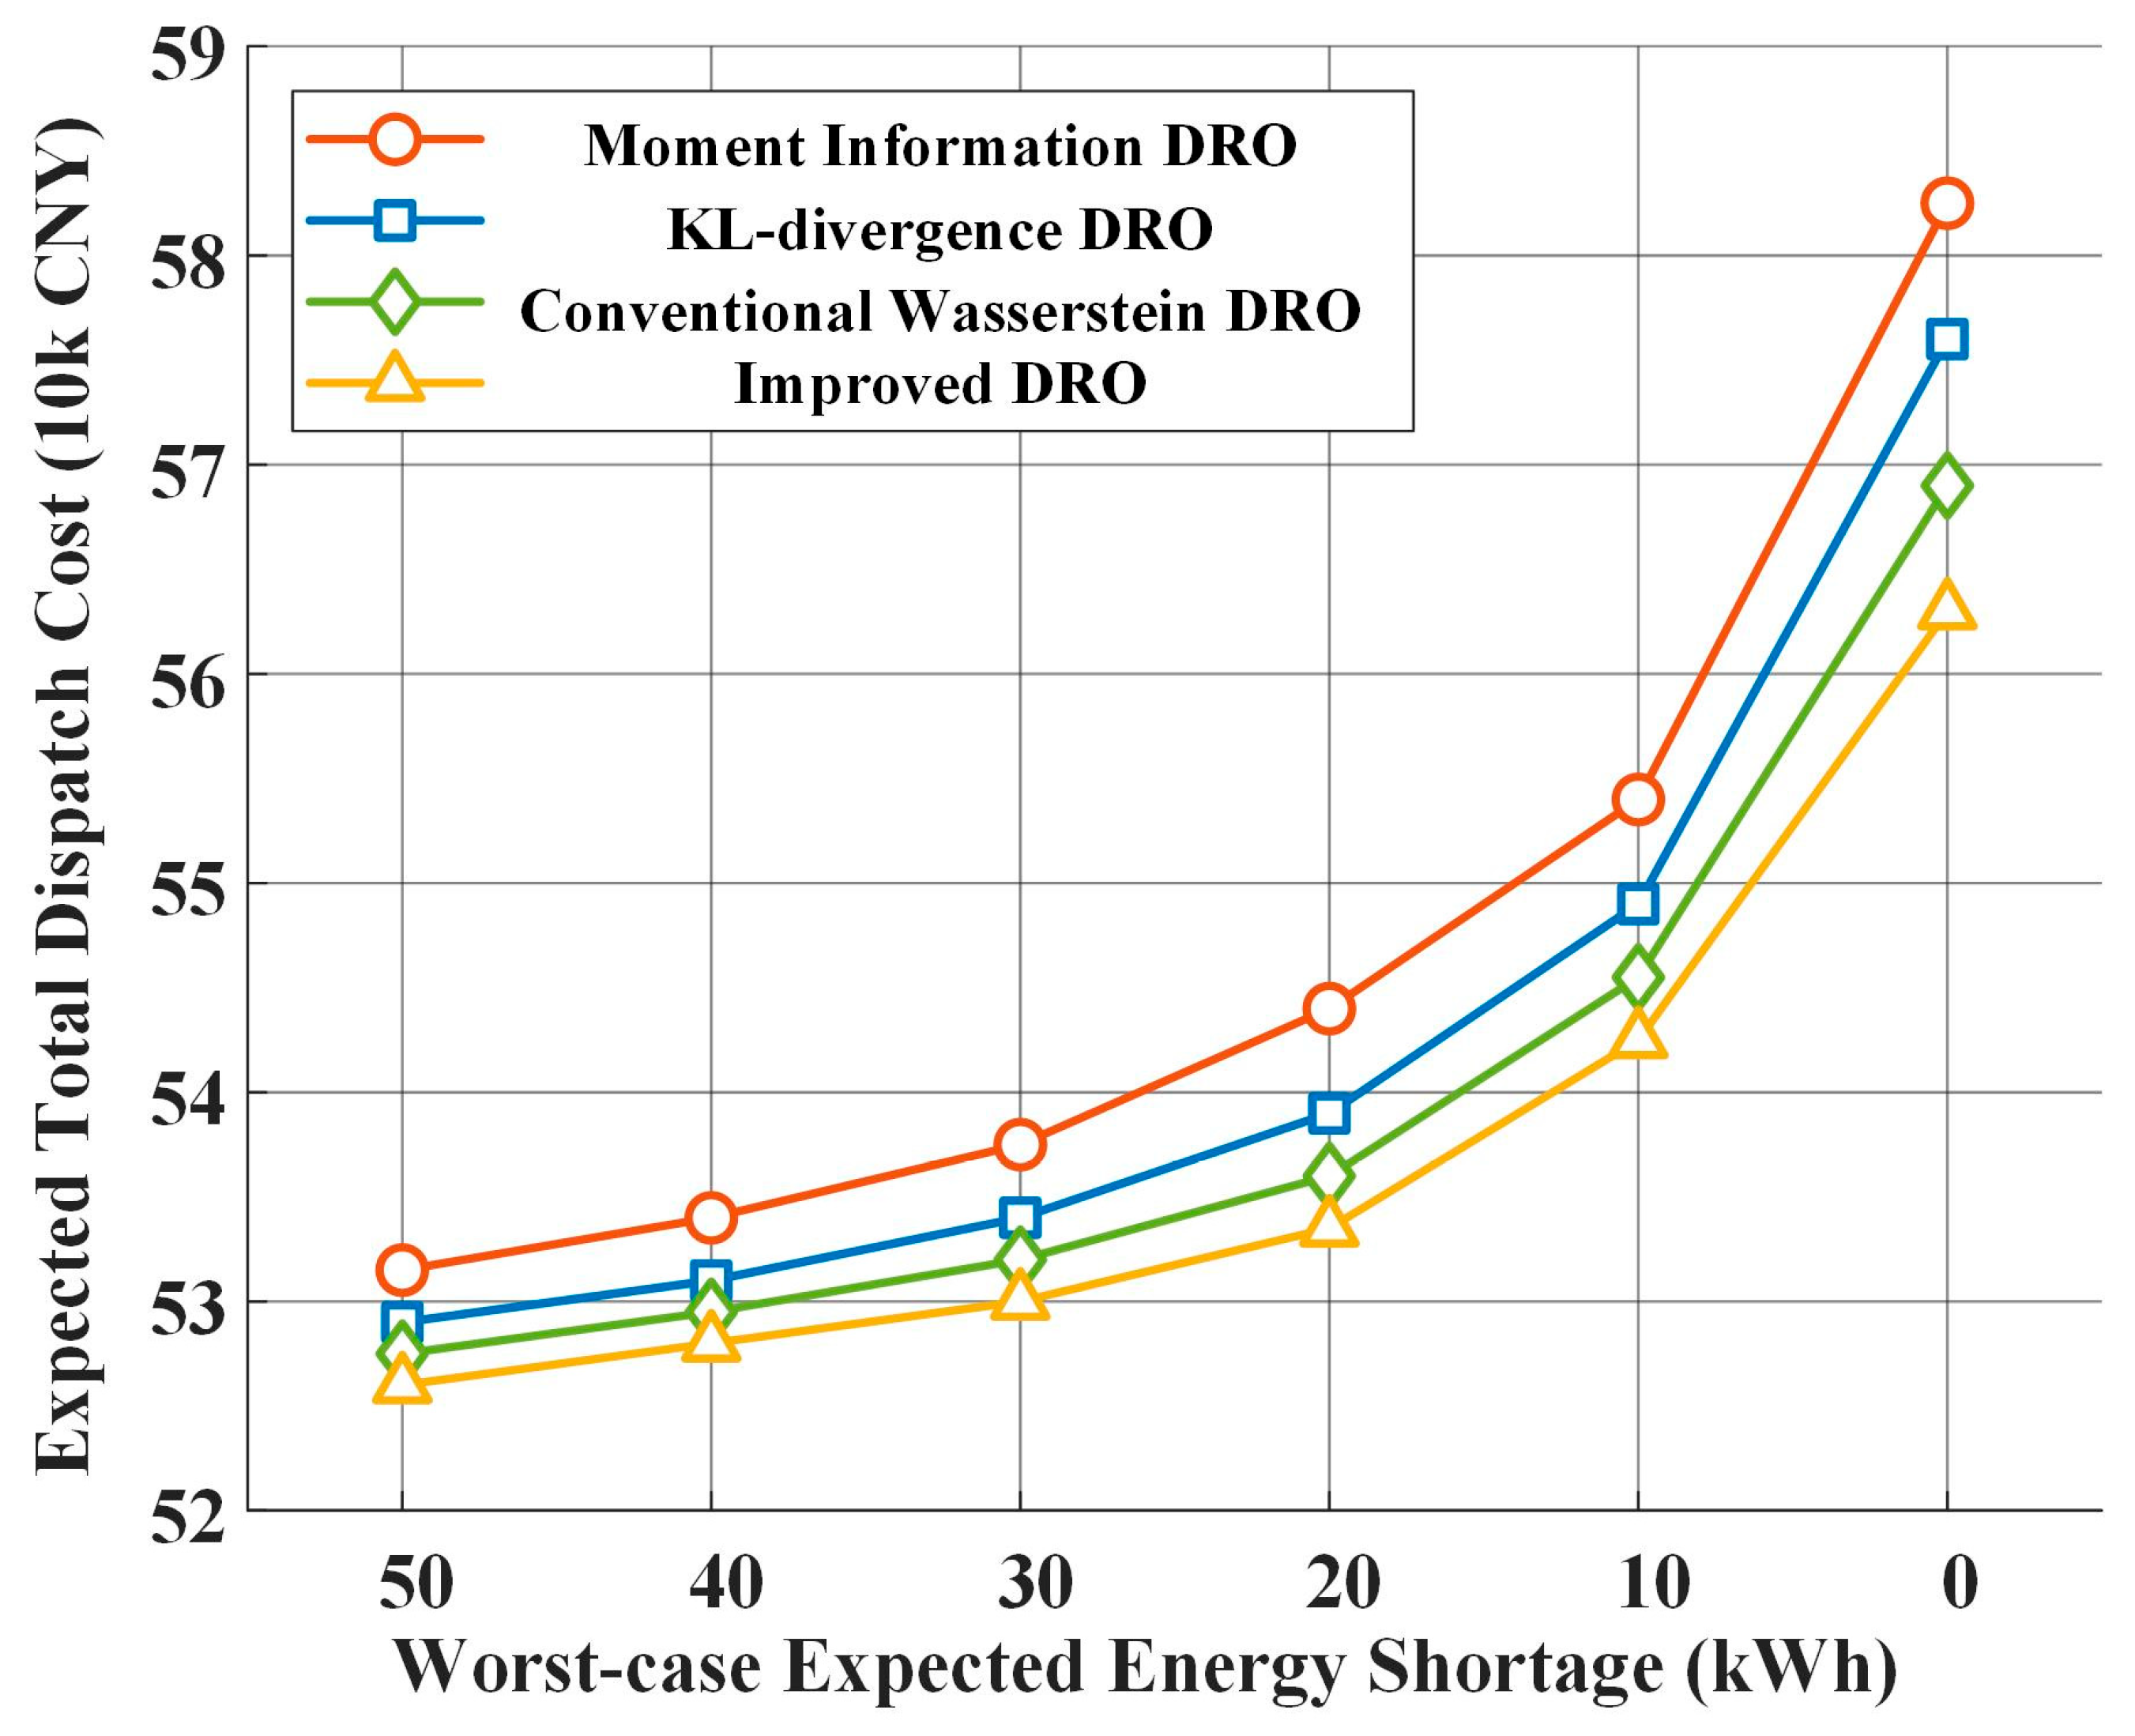
To fix the “worst-case expected energy shortage” at the same value, solve each DRO variant, and draw the total cost as the Y-axis. As can be seen from Figure 3, all four DRO methods exhibit the same trade-off relationship: to achieve higher operational robustness, the system must incur a higher expected total dispatch cost, which clearly reveals the inherent conflict between economy and security in power system dispatch. Across all robustness levels, the Moment Information DRO curve consistently remains at the top, indicating that its dispatch scheme is the least economical; the KL-divergence DRO is second; and Conventional Wasserstein DRO outperforms the former two. Correspondingly, Improved DRO comprehensively outperforms the other three methods across the entire trade-off frontier. Specifically, taking the worst-case expected energy shortage of 20 kWh as an example for analysis: the expected total dispatch cost using Improved DRO is approximately CNY 0.534 million, which saves about 0.4% compared to the CNY 0.536 million of Conventional Wasserstein DRO, saves about 0.9% compared to the CNY 0.539 million of KL-divergence DRO, and saves a significant 1.8% compared to the CNY 0.544 million of the least economical Moment Information DRO. This result indicates that Improved DRO can more effectively utilize data to construct the uncertainty ambiguity set, thereby more accurately characterizing the uncertainty of future renewable energy output, and ultimately, it effectively reduces the model’s conservatism while guaranteeing the same level of robustness, leading to a significant improvement in the system’s overall economic efficiency.
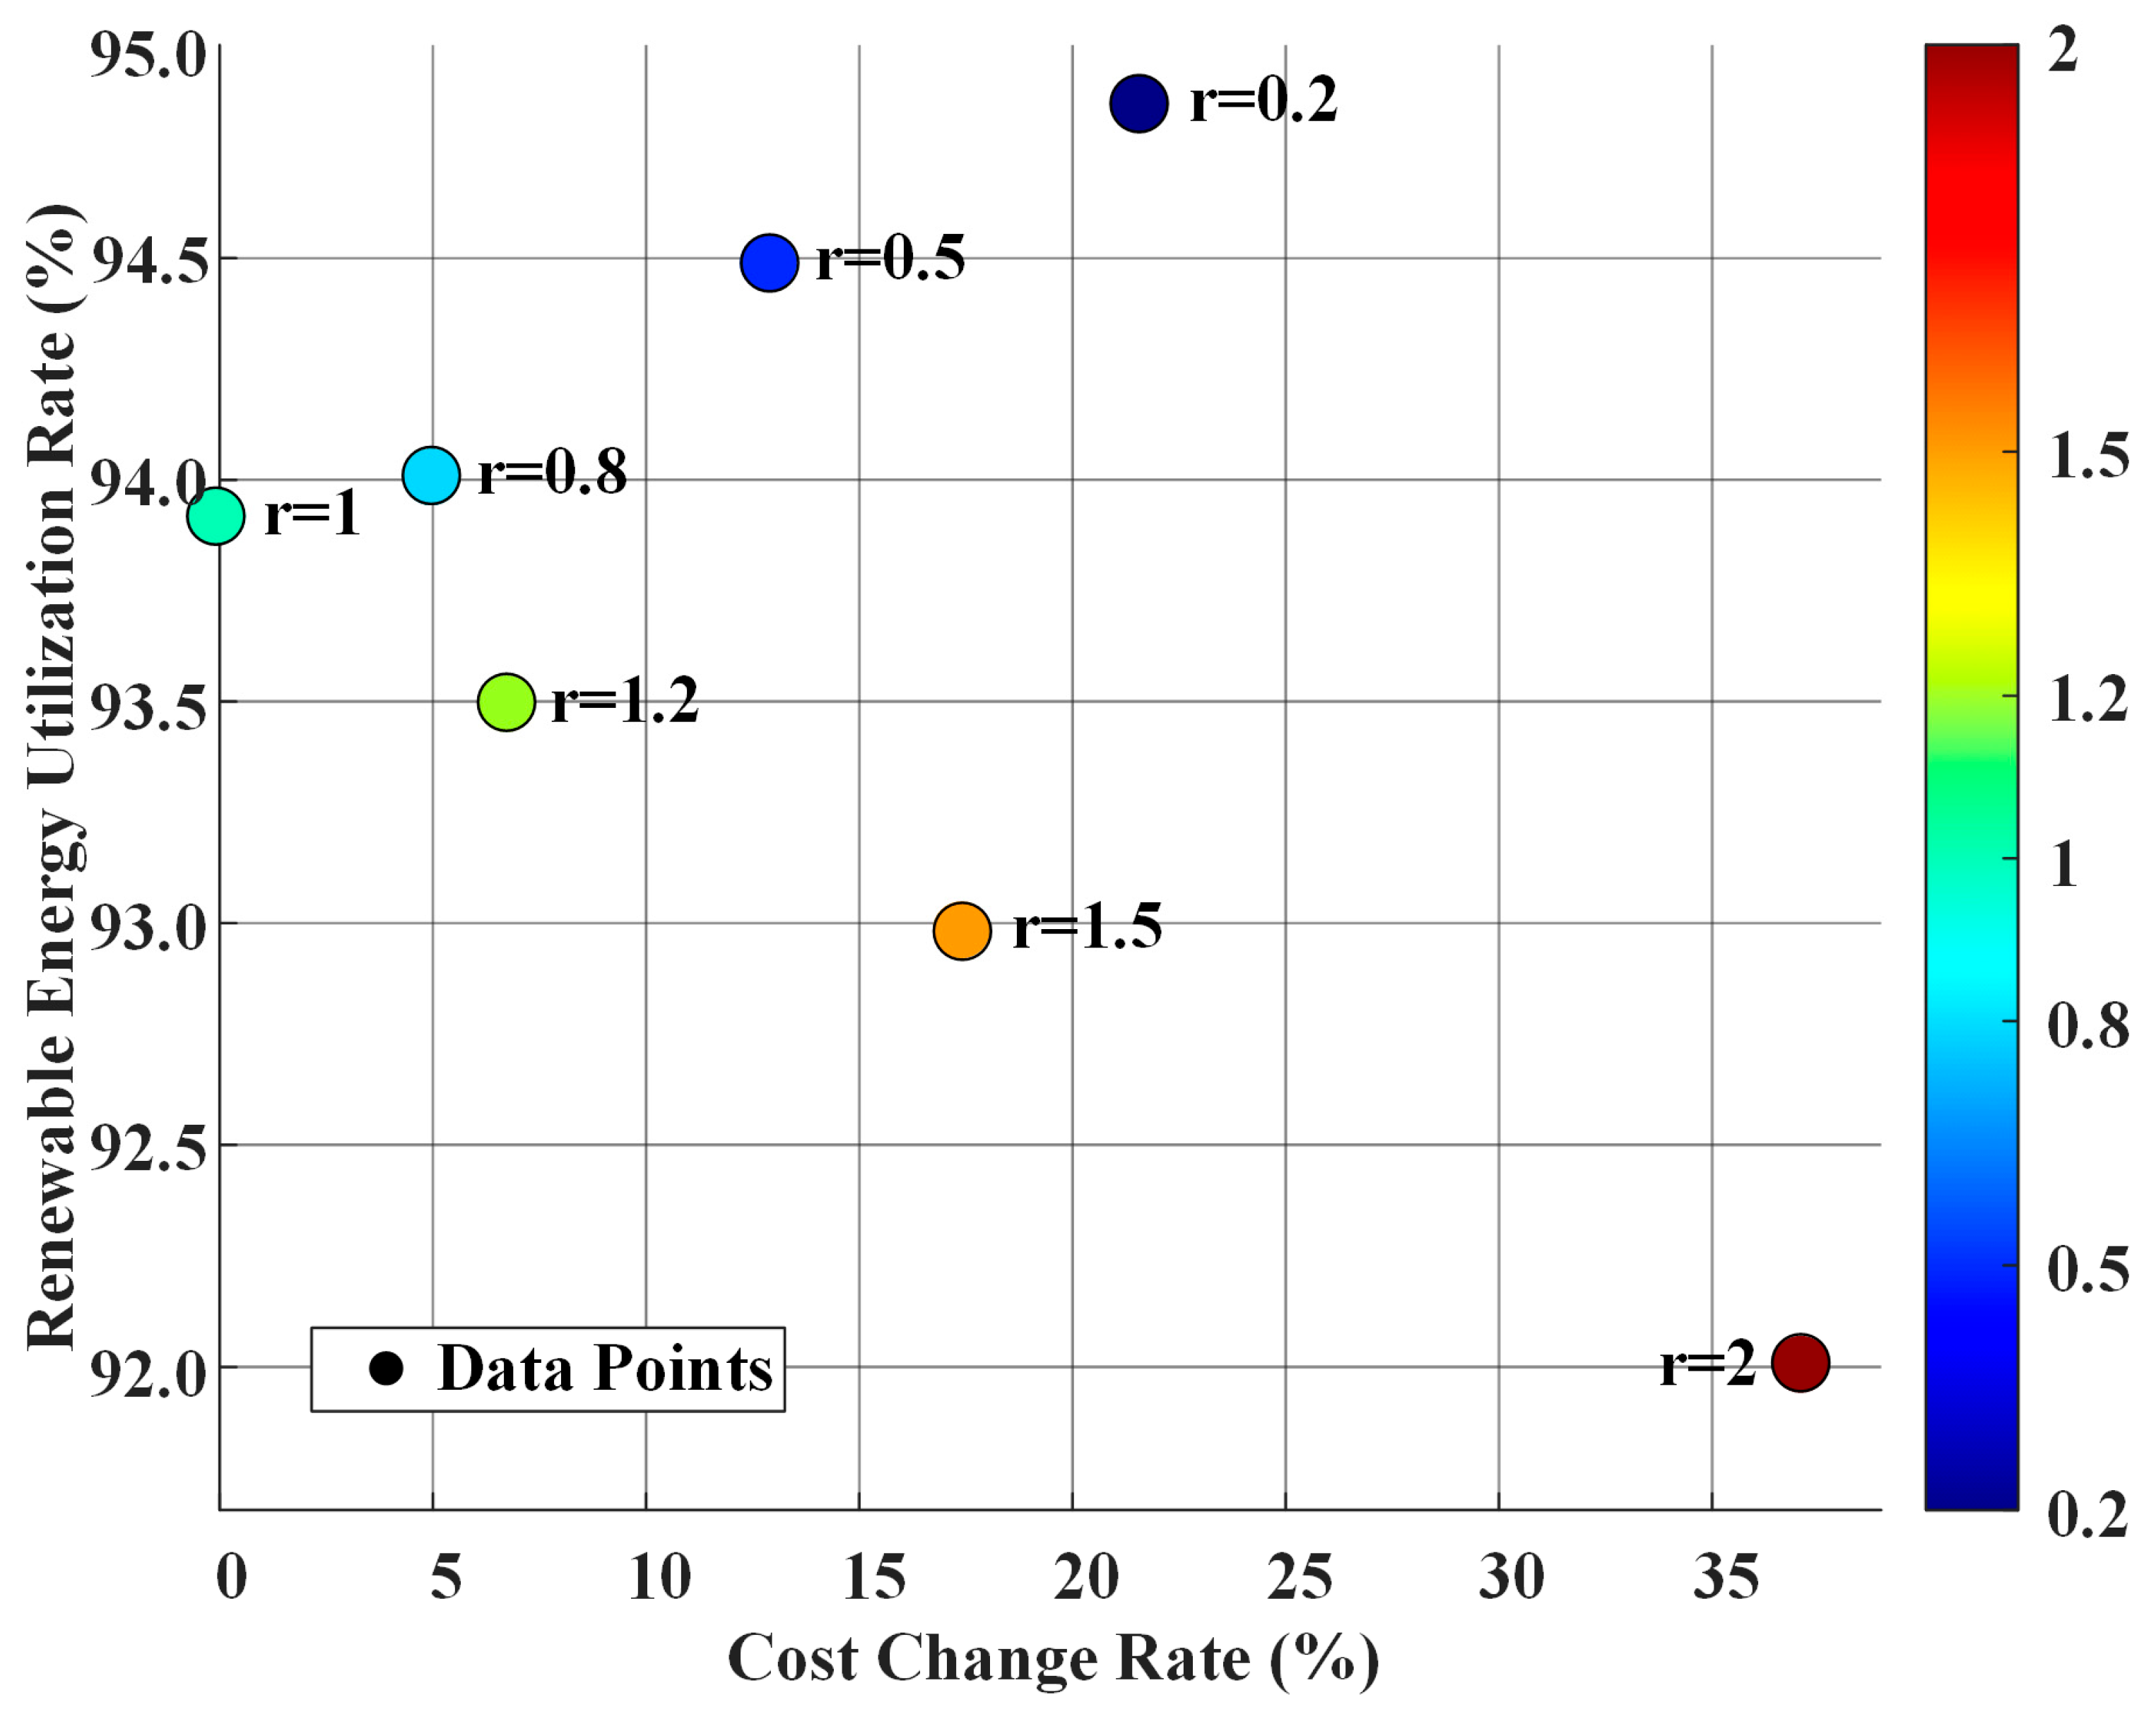
To select the optimal radius for the Wasserstein distance, in Figure 4, Figure 5 and Figure 6, the corresponding total unit output, renewable energy unit output, renewable energy utilzation rate, and total operating cost are respectively solved with radii of 0.2, 0.5, 0.8, 1, 1.2, 1.5, and 2. Figure 4 illustrates the impact of the Wasserstein radius on the output of each unit type. The total scheduled output from all generation units peaks at approximately 2750 kW when the radius is 0 (the deterministic case). It then maintains a relatively stable high output level in the 0.5 to 1.0 range, but shows a clear downward trend after the radius exceeds 1.5, dropping to about 2450 kW at a radius of 2, which constitutes an 11% overall decrease. The output of PV unit 1 is relatively stable in the 0 to 1.0 range, maintaining about 550 kW, but slightly decreases to about 450 kW after the radius exceeds 1.5, a drop of approximately 18%. The output of PV unit 2 is the most stable, remaining between 250–300 kW across the entire range of the Wasserstein radius, with a variation of no more than 8%. The energy mix remains relatively stable for radii between 0 and 1.0, with conventional energy accounting for about 67%, PV 1 for about 20%, and PV 2 for about 13%. However, when the radius exceeds 1.5, a structural shift occurs: the share of conventional energy rises to about 71%, while the shares of the two PV systems drop to approximately 18% and 11%, respectively. These results confirm that as meteorological uncertainty (represented by a larger radius) increases, the system conservatively reduces the dispatch of weather-dependent renewable energy and increases the output of conventional thermal units to ensure supply reliability.
Figure 5 further quantifies this impact. As the radius increases, the total operating cost rises from CNY 502,000 to CNY 578,000, while the total renewable energy output decreases from 872 kW to 583 kW. This occurs because the system must procure more reserve capacity to handle potential uncertainty, while simultaneously reducing its use of weather-sensitive renewables to mitigate risk, and also the trade-off, where the renewable energy utilization rate drops from approximately 94.8% to 92.1% as the radius increases from 0.2 to 2.0.
Figure 6 presents a risk–return analysis by plotting the rate of cost change against the utilization rate for different radii. When r = 0.2, the system achieves the highest renewable utilization of 94.8%, but the corresponding cost change rate is high, at about 22%. As r increases to 0.5, the utilization rate slightly drops to 94.5% (a 0.3% decrease), but the cost change rate falls sharply to about 14% (a 36% improvement), showing a clear shift toward economic optimization. When r further increases to the 0.8–1.0 range, the utilization rate stabilizes around 94.0%, and the cost change rate drops below 5%.
This region can be identified as the system’s “economy-energy balance point,” maintaining high renewable utilization with good economic performance. A critical turning point occurs at r = 1.2, where the cost begins to rise while utilization falls. At r = 2, utilization drops further to 92.0% while the cost change rate rises to about 35%, indicating that the system is relying more on expensive conventional energy. From a system engineering perspective, the optimal comprehensive performance is achieved in the 0.8 to 1.2 radius range. Therefore, for subsequent comparisons, we select r = 1.
With the DRO and Improved DRO model parameter set to r = 1, we now compare its performance against RO, SO, and DRO. As shown in Figure 7, different optimization methods exhibit distinct performances in the risk–return dimension. Robust optimization, due to its highly conservative strategy, achieves the lowest cost change rate of about 6%, but its renewable energy utilization is limited to 91.5%, leading to poor economic performance. Stochastic optimization provides a moderate compromise with a renewable utilization of around 93.0% and a cost change rate of approximately 16%, but its effectiveness heavily relies on the accurate modeling of probability distributions, which restricts its practical applicability. In contrast, the conventional DRO method at r = 1 achieves 93.8% renewable utilization with a cost change rate of 10%, significantly improving renewable utilization while maintaining relatively low risk, thereby demonstrating a balanced trade-off. Building upon this, the Improved DRO proposed in this paper further enhances dispatch performance, achieving 94.2% renewable utilization while reducing the cost change rate to 8%, representing improvements of 0.4% and 2% compared to conventional DRO, respectively. These results indicate that the Improved DRO achieves a superior risk–return balance under meteorological uncertainty, simultaneously ensuring high renewable energy utilization and enhanced cost stability, and thus outperforms other methods in overall performance.
Under the same 100 Monte Carlo scenarios, we compute total-cost samples for each method and draw box plots. The cost stability of these methods across multiple scenarios is further confirmed by the box plot in Figure 8, where the black lines represent the upper and lower limits, the blue lines represent the upper and lower quartiles, and the red line represents the median. The Improved DRO method demonstrates exceptional performance in cost control, achieving a median cost of approximately CNY 504,000, which is the lowest among all uncertainty-aware methods, and its interquartile range is tightly controlled at about CNY 20,000, indicating high cost stability. The standard DRO method also shows strong performance; its median cost is CNY 505,000, nearly as low as that of the improved version, and its interquartile range is also a mere CNY 20,000, showing the most concentrated and stable cost distribution among all compared methods. In contrast, RO has the highest median cost, at around CNY 585,000, but is relatively stable, with the smallest interquartile range, reflecting its characteristic excessive conservatism. SO shows a moderate-to-high cost level with a median of approximately CNY 535,000 and the largest interquartile range of about CNY 45,000, indicating significant cost volatility under the intermittent and random nature of renewable energy. Overall, the Improved DRO method demonstrates the most balanced and superior performance in variable weather conditions, offering low operational costs while ensuring high stability.
Finally, at r = 1, we compute time-averaged over 24 h energies for Conventional, PV 1, and PV 2. Figure 9 illustrates the impact of each method on the energy supply structure. The RO method is the most conservative, maximizing the use of conventional energy at approximately 2150 kW, which constitutes about 78% of its total generation. This approach ensures safety but is uneconomical and results in the lowest renewable energy utilization. SO and the standard DRO method show a better balance. The standard DRO dispatches about 1800 kW of conventional energy and 800 kW of renewable energy, striking a reasonable compromise. The proposed Improved DRO method achieves the most optimal energy structure among all strategies. It maximizes the utilization of renewable energy, with PV 1 and PV 2 contributing approximately 900 kW, while keeping conventional energy output at around 1550 kW. This strategy not only incorporates the highest share of renewable power but also, as shown in Figure 8, maintains excellent cost stability. It effectively strikes an advanced balance, considering the uncertainty of weather conditions while striving to maximize the use of green energy, thus avoiding the excessive conservatism of RO and achieving a more economically and environmentally sound dispatch plan than other methods.

4.2.2. Comparison of Dispatching Strategy with the Proposed and Other Methods

To validate the efficiency of the proposed CSO solution strategy, its performance was compared against another solver under the same conditions (r = 1). The results are shown in Table 4. From the table, a clear performance trade-off between the two solution strategies is apparent. On the IEEE 33-bus test system used in this study, the advanced commercial solver, Gurobi, found a feasible solution with a cost of CNY 532,000 in 32 s. While this is an efficient performance for a small-scale system, it must be emphasized that the computation time for such mixed-integer linear programs tends to grow exponentially with the expansion of the grid scale. For real-world power systems with hundreds or thousands of nodes, the runtime of an exact solver can extend to several hours, which is unacceptable for practical dispatch scenarios that require decisions within minutes.
In contrast, the proposed CSO algorithm demonstrates a significant advantage in computational efficiency, obtaining a high-quality solution in just 13 s, which represents a 59.4% decrease in speed. Therefore, although Solver performs well on small-scale problems, the CSO algorithm offers a more scalable and practical path for solving the uncertainty optimization problems of future large-scale power systems. Its ability to rapidly provide high-quality solutions in time-critical applications allows it to effectively bypass the computational burden of exact algorithms, thus offering significant engineering value.
To further validate the performance of the proposed CSO algorithm in solving the DRO problem proposed in this paper, the power system dispatching under proposed CSO algorithm and three classic metaheuristic algorithms—including particle swarm optimization (PSO), whale optimization algorithm (WOA), and the gray wolf optimizer (GWO)—are carried out, and Figure 10 illustrates the convergence curves of the four algorithms when solving the model. As can be seen from the figure, the CSO algorithm demonstrates significant advantages in both convergence speed and solution accuracy. CSO rapidly converges to the lowest-cost solution (approximately CNY 538,000) within about 50 iterations, whereas the other three algorithms converge more slowly and become trapped in different local optima, failing to find a solution of comparable quality. This result indicates that for the distributionally robust optimization problem constructed in this paper, the CSO algorithm possesses superior global search capabilities and convergence performance, thus enhancing the technicality and economy of renewable energy power system dispatching.

5. Conclusions

This paper proposes a distributionally robust optimization method based on the Wasserstein distance that considers meteorological uncertainty to solve the problem of balancing robustness and economy in a power system containing thermal, photovoltaic, and energy storage units. The main conclusions are as follows:
(1)
The ambiguity set constructed based on the improved Wasserstein distance can effectively describe the uncertainty of renewable energy output under meteorological conditions. The Wasserstein distance DRO model, which introduces covariate factors, can more accurately describe the correlation between meteorological conditions and the output of renewable energy. By taking into account meteorological factors such as temperature, surface horizontal radiation, normal direct radiation, and scattered radiation, the model can adjust the decision-making strategy according to the uncertain characteristics under different meteorological conditions, improving the adaptability and accuracy of the model.
(2)
The optimization problem is transformed into a solvable mixed integer linear programming form by adopting linear decision rules and dual theorems, and an improved DRO strategy based on the CSO algorithm is proposed to solve large-scale optimization problems, which significantly improves the solution efficiency. The simulation results of the IEEE-33 node system verify the effectiveness of the proposed method in balancing the economy and robustness of the power system, providing a new technical path for the optimal dispatching of the power system with a high proportion of renewable energy.
(3)
Regarding the energy structure, the proposed method achieves a rational allocation between conventional and renewable energy, avoiding the overly optimistic drawback of deterministic optimization and the overly conservative drawback of robust optimization. It is a known theoretical property that as the amount of historical data increases, the ambiguity set shrinks, and the model’s solution tends to converge toward that of stochastic optimization. This indicates that the proposed model possesses lower conservatism than traditional robust optimization, enabling it to reduce operating costs while ensuring system security.
(4)
For grid operators, this method provides a practical decision-making tool that balances economic costs and renewable energy integration while ensuring system security. Although the dualized MILP problem faces the “curse of dimensionality” in large-scale systems, the proposed CSO algorithm demonstrates excellent scalability by finding high-quality, near-optimal solutions within an acceptable timeframe, thereby offering significant engineering value for practical dispatch in real-world power grids.
(5)
When scaling the model to larger, geographically dispersed transmission systems, the spatial correlation between photovoltaic outputs is indeed an important factor that cannot be ignored. In this study, modeling of the spatial correlation among PV sites in different geographical locations in the IEEE-33 node system failed. In future research, we will incorporate this correlation into the construction of ambiguity sets to further enhance the accuracy and economy of the model.
In summary, the proposed distributionally robust optimization method provides an effective dispatch strategy for power systems with high penetration of renewable energy, capable of achieving safe, stable, and economical operation under uncertainty.

Author Contributions

Conceptualization, Y.L. and Z.Y.; methodology, Z.Y. and Y.W.; software, Z.Y. and X.L.; validation, Z.Y. and H.L.; formal analysis, L.L. and H.L.; investigation, L.L.; resources, X.L.; data curation, X.L.; writing—original draft preparation, Y.L. and Z.Y.; writing—review and editing, Z.Y. and Y.W.; visualization, Z.Y.; supervision, Y.W.; project administration, Y.L.; funding acquisition, Y.L. All authors have read and agreed to the published version of the manuscript.

Funding

This research was supported by the Science and Technology Project of State Grid Shaanxi Electrical Power Co., Ltd. under grant No. 5226KY24000S, the National Key R&D Program of China under grant No. 2024YFB4206901, and the Guangdong Basic and Applied Basic Research Foundation under grant No. 2023A1515240082.

Data Availability Statement

The original contributions presented in this study are included in the article. Further inquiries can be directed to the corresponding author.

Conflicts of Interest

Authors Yao Liu, Xiaoteng Li, and Haolu Liu were employed by the company Power Research Institute of State Grid Shaanxi Electric Power Co., Ltd. Author Lei Luo was employed by the company State Grid Shaanxi Electric Power Co., Ltd. The authors declare that this study received funding from Science and Technology Project of State Grid Shaanxi Electrical Power Co., ltd. under grant No. 5226KY24000S, National Key R&D Program of China under grant No. 2024YFB4206901, and the Guangdong Basic and Applied Basic Research Foundation under grant No. 2023A1515240082. The funder had the following involvement with the study: Study design: Yao Liu and Zihan Yu; Collection: Lei Luo; Analysis: Lei Luo and Haolu Liu; Interpretation of data: Xiaoteng Li; The writing of this article: Yao Liu and Zihan Yu; The decision to submit it for publication: Yao Liu and Yu Wang.

References

  1. Swadi, M.; Kadhim, D.J.; Salem, M.; Tuaimah, F.M.; Majeed, A.S.; Alrubaie, A.J. Investigating and predicting the role of photovoltaic, wind, and hydrogen energies in sustainable global energy evolution. Glob. Energy Interconnect. 2024, 7, 429–445. [Google Scholar] [CrossRef]
  2. Harmailil, I.O.; Sultan, S.M.; Tso, C.P.; Fudholi, A.; Mohammad, M.; Ibrahim, A. The State of the Art of Photovoltaic Module Cooling Techniques and Performance Assessment Methods. Symmetry 2024, 16, 412. [Google Scholar] [CrossRef]
  3. Qiu, J.; Zhao, J.; Wen, F.; Zhao, J.; Gao, C.; Zhou, Y.; Tao, Y.; Lai, S. Challenges and Pathways of Low-Carbon Oriented Energy Transition and Power System Planning Strategy: A Review. IEEE Trans. Netw. Sci. Eng. 2024, 11, 5396–5416. [Google Scholar] [CrossRef]
  4. Gui, Y.; Nainar, K.; Bendtsen, J.D.; Diewald, N.; Iov, F.; Yang, Y.; Blaabjerg, F.; Xue, Y.; Liu, J.; Hong, T.; et al. Voltage Support With PV Inverters in Low-Voltage Distribution Networks: An Overview. IEEE J. Emerg. Sel. Top. Power Electron. 2024, 12, 1503–1522. [Google Scholar] [CrossRef]
  5. Caetano, N.R. Review on the Theoretical and Practical Applications of Symmetry in Thermal Sciences, Fluid Dynamics, and Energy. Symmetry 2025, 17, 1240. [Google Scholar] [CrossRef]
  6. Jordan, D.C.; Perry, K.; White, R.; Deline, C. Extreme Weather and PV Performance. IEEE J. Photovolt. 2023, 13, 830–835. [Google Scholar] [CrossRef]
  7. Qin, Z.; Chen, X.; Hou, Y.; Liu, H.; Yang, Y. Coordination of Preventive, Emergency and Restorative Dispatch in Extreme Weather Events. IEEE Trans. Power Syst. 2022, 37, 2624–2638. [Google Scholar] [CrossRef]
  8. Belaïd, F.; Al-Sarihi, A.; Al-Mestneer, R. Balancing climate mitigation and energy security goals amid converging global energy crises: The role of green investments. Renew. Energy 2023, 205, 534–542. [Google Scholar] [CrossRef]
  9. Yu, G.Z.; Lu, L.; Tang, B.; Wang, S.Y.; Chung, C.Y. Ultra-Short-Term Wind Power Subsection Forecasting Method Based on Extreme Weather. IEEE Trans. Power Syst. 2023, 38, 5045–5056. [Google Scholar] [CrossRef]
  10. Wang, J.; Zhang, X.; Wang, Y.; Yang, S.; Wang, S.; Xie, Y.; Gong, J.; Lin, J. Power system source-load forecasting based on scene generation in extreme weather. Energy 2025, 330, 136991. [Google Scholar] [CrossRef]
  11. Fang, F.; Yu, S.; Xin, X. Data-Driven-Based Stochastic Robust Optimization for a Virtual Power Plant With Multiple Uncertainties. IEEE Trans. Power Syst. 2022, 7, 456–466. [Google Scholar] [CrossRef]
  12. Wang, Q.; Ortega-Vazquez, M.; Tuohy, A.; Ela, E.; Bello, M.; Kirk-Davidoff, D.; Hobbs, W.B.; Kumar, V. Assessing Dynamic Reserves vs. Stochastic Optimization for Effective Integration of Operating Probabilistic Forecasts. IEEE Trans. Sustain. Energy 2025, 16, 2132–2143. [Google Scholar] [CrossRef]
  13. Xiong, H.; Shi, Y.; Shahidehpour, M.; Guo, C.; Zhou, Y. Multi-Stage Robust Optimization of Real-Time Dynamic Dispatch With Fast-Acting Units in Resilient Power Systems. IEEE Trans. Power Syst. 2025, 40, 18–30. [Google Scholar] [CrossRef]
  14. Xu, X.; Gao, Y.; Wang, H.; Yan, Z.; Shahidehpour, M.; Tan, Z. Distributionally Robust Optimization of Photovoltaic Power With Lifted Linear Decision Rule for Distribution System Voltage Regulation. IEEE Trans. Sustain. Energy 2024, 15, 758–772. [Google Scholar] [CrossRef]
  15. Zhang, X.; Liu, S.; Pan, J. Two-Stage Distributionally Robust Optimization for an Asymmetric Loss-Aversion Portfolio via Deep Learning. Symmetry 2025, 17, 1236. [Google Scholar] [CrossRef]
  16. Qu, K.; Chen, Y.; Zhao, C. Distributionally Robust Energy and Reserve Dispatch with Distributed Predictions of Renewable Energy. IEEE Trans. Power Syst. 2025, in press. [CrossRef]
  17. Lin, Z.; Wu, Q.; Chen, H.; Ji, T.; Xu, Y.; Sun, H. Scenarios-Oriented Distributionally Robust Optimization for Energy and Reserve Scheduling. IEEE Trans. Power Syst. 2023, 38, 2943–2946. [Google Scholar] [CrossRef]
  18. Son, Y.G.; Kim, S.Y. Optimal planning and operation of integrated energy systems in South Korea: Introducing a Novel ambiguity set based distributionally robust optimization. Energy 2024, 307, 132503. [Google Scholar] [CrossRef]
  19. Lin, B.; Huang, Y.; Yu, D.; Fu, C.; Chen, C. Stochastic Distributionally Robust Optimization Scheduling of High-Proportion New Energy Distribution Network Considering Detailed Modeling of Energy Storage. Processes 2025, 13, 2230. [Google Scholar] [CrossRef]
  20. Xie, R.; Wei, W.; Li, M.; Dong, Z.; Mei, S. Sizing capacities of renewable generation, transmission, and energy storage for low-carbon power systems: A distributionally robust optimization approach. Energy 2023, 263, 125653. [Google Scholar] [CrossRef]
  21. Arrigo, A.; Kazempour, J.; De Grève, Z.; Toubeau, J.F.; Vallée, F. Embedding Dependencies Between Wind Farms in Distributionally Robust Optimal Power Flow. IEEE Trans. Power Syst. 2023, 38, 5156–5169. [Google Scholar] [CrossRef]
  22. Ryu, M.; Nagarajan, H.; Bent, R. Mitigating the Impacts of Uncertain Geomagnetic Disturbances on Electric Grids: A Distributionally Robust Optimization Approach. IEEE Trans. Power Syst. 2022, 37, 4258–4269. [Google Scholar] [CrossRef]
  23. Poolla, B.K.; Hota, A.R.; Bolognani, S.; Callaway, D.S.; Cherukuri, A. Wasserstein Distributionally Robust Look-Ahead Economic Dispatch. IEEE Trans. Power Syst. 2021, 36, 2010–2022. [Google Scholar] [CrossRef]
  24. Maghami, A.; Ursavas, E.; Cherukuri, A. A Two-Step Approach to Wasserstein Distributionally Robust Chance- and Security-Constrained Dispatch. IEEE Trans. Power Syst. 2024, 39, 1447–1459. [Google Scholar] [CrossRef]
  25. Yin, C.; Dong, J.; Zhang, Y. Distributionally Robust Bilevel Optimization Model for Distribution Network With Demand Response Under Uncertain Renewables Using Wasserstein Metrics. IEEE Trans. Sustain. Energy 2025, 16, 1165–1176. [Google Scholar] [CrossRef]
  26. Ma, X.; Ning, C.; Li, L.; Qiu, H.; Gu, W.; Dong, Z. Bayesian Nonparametric Two-Stage Distributionally Robust Unit Commitment Optimization: From Global Multimodality to Local Trimming-Wasserstein Ambiguity. IEEE Trans. Power Syst. 2024, 39, 6702–6715. [Google Scholar] [CrossRef]
  27. Esfahani, M.; Alizadeh, A.; Amjady, N.; Kamwa, I. A distributed VPP-integrated co-optimization framework for energy scheduling, frequency regulation, and voltage support using data-driven distributionally robust optimization with Wasserstein metric. Appl. Energy 2024, 361, 122883. [Google Scholar] [CrossRef]
  28. Zhai, J.; Jiang, Y.; Shi, Y.; Jones, C.N.; Zhang, X.P. Distributionally Robust Joint Chance-Constrained Dispatch for Integrated Transmission- Distribution Systems via Distributed Optimization. IEEE Trans. Smart Grid 2022, 13, 2132–2147. [Google Scholar] [CrossRef]
  29. Jin, X.; Liu, B.; Liao, S.; Cheng, C.; Zhang, Y.; Zhao, Z.; Lu, J. Wasserstein metric-based two-stage distributionally robust optimization model for optimal daily peak shaving dispatch of cascade hydroplants under renewable energy uncertainties. Energy 2022, 260, 125107. [Google Scholar] [CrossRef]
  30. Chen, G.; Zhang, H.; Hui, H.; Song, Y. Fast Wasserstein-Distance-Based Distributionally Robust Chance-Constrained Power Dispatch for Multi-Zone HVAC Systems. IEEE Trans. Smart Grid 2021, 12, 4016–4028. [Google Scholar] [CrossRef]
  31. Dong, G.; Zhu, Z.; Lou, Y.; Yu, J.; Wu, L.; Wei, J. Optimal Charging of Lithium-Ion Battery Using Distributionally Robust Model Predictive Control With Wasserstein Metric. IEEE Trans. Ind. Inform. 2024, 20, 7630–7640. [Google Scholar] [CrossRef]
  32. Chen, B.; Liu, T.; Liu, X.; He, C.; Nan, L.; Wu, L.; Su, X.; Zhang, J. A Wasserstein Distance-Based Distributionally Robust Chance-Constrained Clustered Generation Expansion Planning Considering Flexible Resource Investments. IEEE Trans. Power Syst. 2023, 38, 5635–5647. [Google Scholar] [CrossRef]
  33. Zhou, A.; Khodayar, M.E.; Wang, J. Distributionally Robust Optimal Scheduling With Heterogeneous Uncertainty Information: A Framework for Hydrogen Systems. IEEE Trans. Sustain. Energy 2024, 15, 1933–1945. [Google Scholar] [CrossRef]
  34. Liu, H.; Qiu, J.; Zhao, J. A data-driven scheduling model of virtual power plant using Wasserstein distributionally robust optimization. Int. J. Electr. Power Energy Syst. 2022, 137, 107801. [Google Scholar] [CrossRef]
  35. Li, J.; Khodayar, M.E.; Wang, J.; Zhou, B. Data-Driven Distributionally Robust Co-Optimization of P2P Energy Trading and Network Operation for Interconnected Microgrids. IEEE Trans. Smart Grid 2021, 12, 5172–5184. [Google Scholar] [CrossRef]
  36. Li, J.; Xu, Z.; Liu, H.; Wang, C.; Wang, L.; Gu, C. A Wasserstein Distributionally Robust Planning Model for Renewable Sources and Energy Storage Systems Under Multiple Uncertainties. IEEE Trans. Sustain. Energy 2023, 14, 1346–1356. [Google Scholar] [CrossRef]
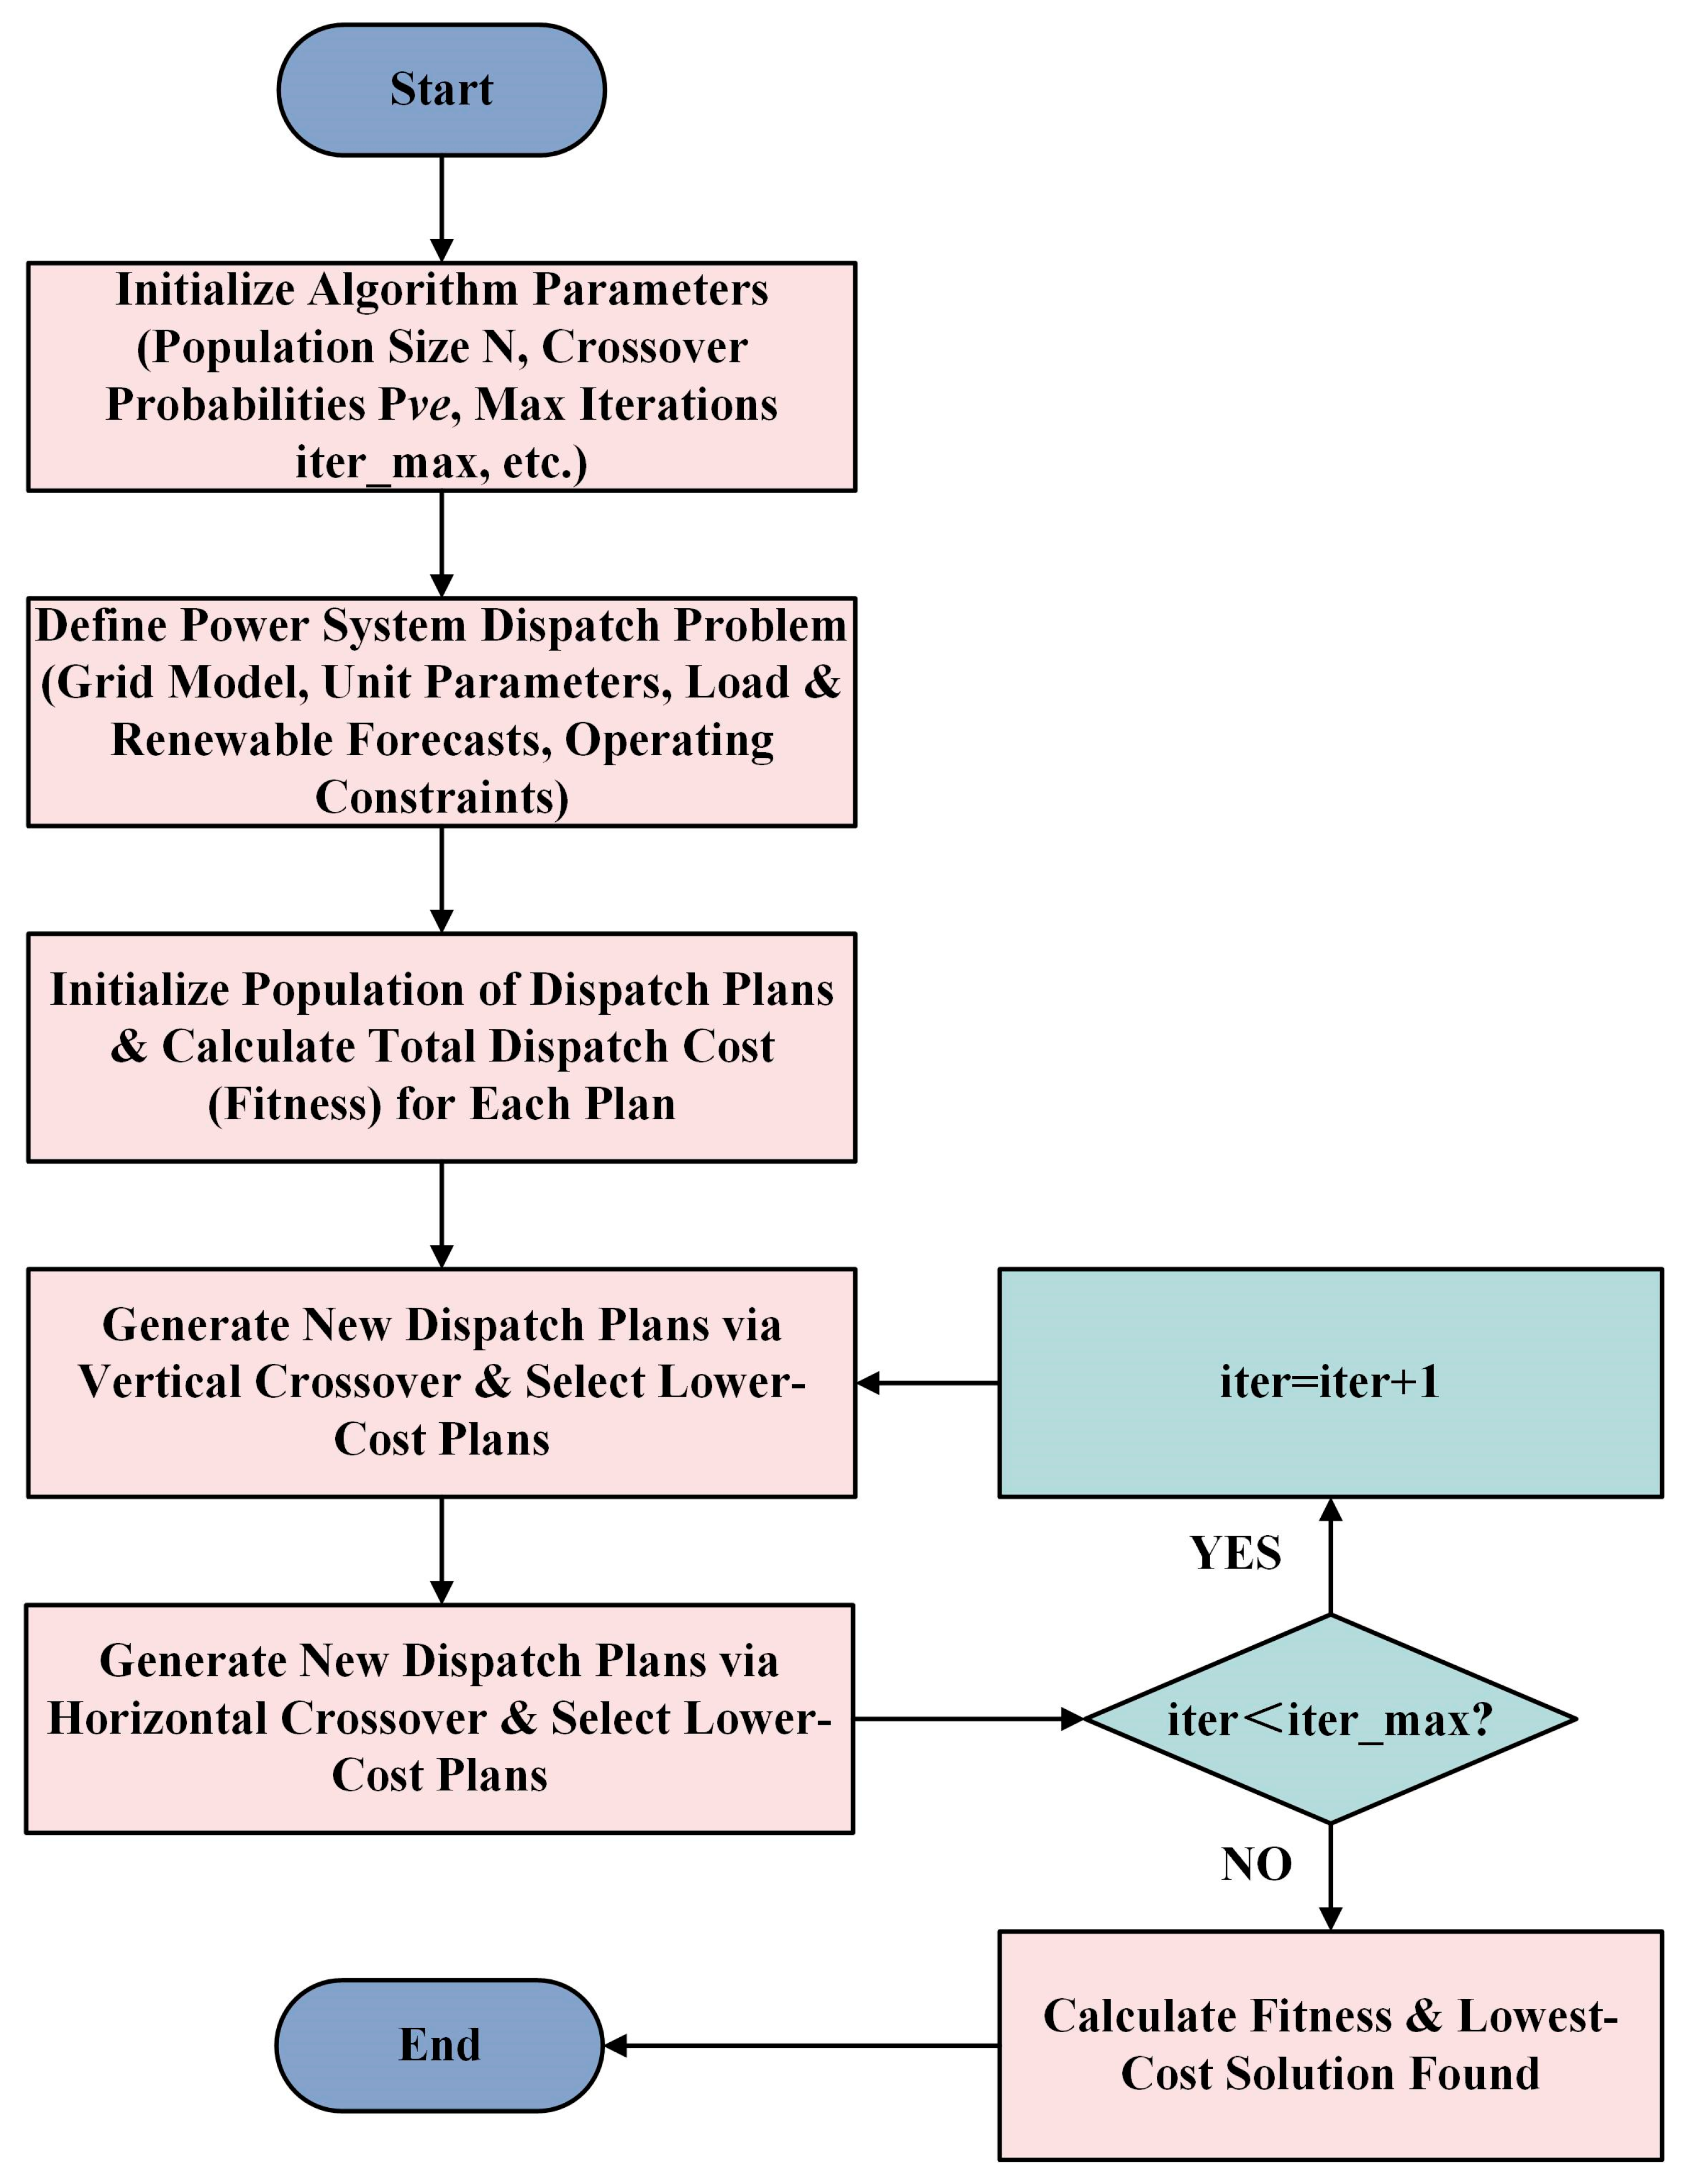
Figure 1. Flowchart of the crisscross optimization algorithm.
Symmetry 17 01602 g001
Figure 2. The IEEE 33-bus standard power distribution system.
Symmetry 17 01602 g002
Figure 3. Cost comparison under the same worst-case scenario of power shortage.
Symmetry 17 01602 g003
Figure 4. The influence of the Wasserstein radius on the output of each unit.
Symmetry 17 01602 g004
Figure 5. The influence of the radius on system total cost and renewable utilization.
Symmetry 17 01602 g005
Figure 6. Risk–return distribution map showing the relationship between cost change rate, utilization rate, and the Wasserstein radius.
Symmetry 17 01602 g006
Figure 7. Risk–return comparison chart of different optimization methods.
Symmetry 17 01602 g007
Figure 8. Cost stability of different optimization methods shown via a box plot.
Symmetry 17 01602 g008
Figure 9. The energy supply structure under different strategies.
Symmetry 17 01602 g009
Figure 10. Comparison of convergence curves for different strategies.
Symmetry 17 01602 g010
Table 1. Comparison of uncertainty optimization methods.
MethodComplexityConservatismEconomy
ROLowHighLow
SOMediumLowHigh
Conventional DROHighMediumMedium
Improved DROHighAdjustable, Low-MediumHigh
Table 2. The connection location and capacity of units.
Unit TypeConnection NodeCapacity (kW)
Thermal1, 63500, 1000
PV18, 25960, 500
ESS16500
Table 3. Key economic and technical parameters.
ParametersUnit Value
Operational costs for thermal generating units149.52 CNY/MWh
Start-up costs for thermal generating unitsCNY 5268.81
Operational costs for energy storage systems0.85 CNY/MWh
System reference voltage12.66 kV
Ramp-up and ramp-down limits of thermal units0.30 p.u./h
Table 4. Performance comparison of different solving strategies.
Solving MethodCost (CNY 10 k)Time (s)
Solver (Gurobi)53.232
PSO56.722
CSO53.813
Disclaimer/Publisher’s Note: The statements, opinions and data contained in all publications are solely those of the individual author(s) and contributor(s) and not of MDPI and/or the editor(s). MDPI and/or the editor(s) disclaim responsibility for any injury to people or property resulting from any ideas, methods, instructions or products referred to in the content.