Abstract
Microgrids have emerged as a crucial solution for addressing environmental concerns, such as reducing greenhouse gas emissions and enhancing energy sustainability. By incorporating renewable energy sources like solar and wind, microgrids improve energy efficiency and offer a cleaner alternative to conventional power grids. Among various microgrid architectures, DC microgrids are gaining significant attention due to their higher efficiency, reduced reactive power losses, and direct compatibility with renewable energy sources and energy storage systems. However, DC microgrids face stability challenges, particularly due to the presence of constant power loads (CPLs), which exhibit negative incremental impedance characteristics. These loads can destabilize the system, leading to oscillations and performance degradation. This paper explores various control strategies designed to enhance the stability and dynamic response of DC microgrids, with a particular focus on interleaved boost converters (IBCs) interfaced with CPLs. Traditional control methods, including proportional–integral (PI) and sliding mode control (SMC), have shown limitations in handling dynamic variations and disturbances. To overcome these challenges, this paper proposes a novel RST-based control strategy for IBCs, offering improved stability, adaptability, and disturbance rejection. The efficacy of the RST controller is validated through extensive simulations tests, demonstrating competitive performance in maintaining DC bus voltage regulation and current distribution. Key performance indicators demonstrate competitive performance, including settling times below 40 ms for voltage transients, overshoot limited to ±2%, minimal voltage deviation from the reference, and precise current sharing between interleaved phases. The findings contribute to advancing the stability and efficiency of DC microgrids, facilitating their broader adoption in modern energy systems.
1. Introduction
Microgrids are increasingly recognized as a vital solution to pressing environmental challenges, such as reducing greenhouse gas emissions and combating climate problems. By enabling the integration of renewable energy sources like solar and wind, microgrids enhance energy efficiency and provide a cleaner alternative to conventional power grids. They can operate either independently or in parallel with the main grid, offering enhanced resilience, flexibility, and reliability—key attributes for achieving sustainable energy [1,2]. A microgrid is a localized energy system that integrates distributed energy resources (DERs), energy storage systems (ESSs), and loads, allowing for efficient energy management and distribution. This localized approach not only improves power supply reliability but also supports the transition to decentralized energy systems, which are critical for modern energy infrastructure [3,4].
Microgrid architectures are generally categorized into three categories: AC, DC, and hybrid. Among these, DC microgrids are gaining prominence due to their distinct advantages over AC microgrids. DC microgrids eliminate the necessity for synchronization, avoid frequency-related issues and harmonics, and reduce reactive power losses. They also offer higher efficiency, better compatibility with renewable energy sources and energy storage systems, and the ability to directly power DC loads, which are increasingly common in modern applications. These features make DC microgrids a highly attractive option for modern energy networks [5,6]. A critical component of DC microgrids is the DC/DC converter, which plays a pivotal role in interfacing renewable energy sources, energy storage systems, and loads. However, despite their numerous benefits, DC microgrids face significant stability challenges, primarily due to the presence of constant power loads (CPLs) [7,8]. CPLs are nonlinear loads with incremental negative impedance (INI), meaning they draw less current when voltage rises and more current when voltage drops. This counterintuitive behavior can destabilize the system by reducing its ability to absorb disturbances, leading to oscillations. Common examples of CPLs include power electronic converters, LED drivers, welding machines, and battery chargers, all of which require precise regulation to ensure stable operation [9].
To mitigate these stability issues, advanced control strategies and robust converter designs are being developed. These solutions aim to enhance system damping, improve dynamic response, and ensure stable operation under varying load conditions. By addressing the challenges posed by CPLs, researchers and engineers are paving the way for the broader adoption of DC microgrids, which hold significant potential for creating more sustainable and resilient energy systems. Several studies have explored different controller designs to improve the stability of interleaved boost converters (IBCs). Traditional proportional–integral (PI) controllers have been widely implemented due to their simple structure and easiness of implementation. However, PI controllers struggle to handle parameter variations and disturbances effectively, leading to performance degradation under dynamic operating conditions [10]. The lack of adaptability in these controllers limits their ability to handle the nonlinear behavior of CPLs, leading to poor transient response and instability. Sliding mode control (SMC) has emerged as a robust nonlinear control technique for DC/DC converters, offering excellent disturbance rejection and fast dynamic response [11]. SMC operates by forcing the system trajectory to slide along a predefined surface, ensuring robustness against parameter variations and external disturbances. Several studies have demonstrated the effectiveness of SMC in stabilizing DC microgrids with CPLs [12,13]. However, SMC suffers from the chattering phenomenon, which causes high-frequency oscillations in the control signal, leading to increased switching losses and potential damage to power electronic components. Moreover, the design of SMC requires accurate system models, which may not always be available in practical applications [14]. Model predictive control (MPC) has gained attention for its ability to handle multivariable systems and constraints effectively. MPC uses a predictive model to optimize control actions over a finite horizon, making it suitable for applications with varying load conditions. In [15], an MPC-based approach was utilized for a boost converter interfaced with CPLs, demonstrating improved voltage regulation and dynamic performance. However, MPC requires significant computational resources, which can be a limitation for real-time implementation in high-frequency power converters. Additionally, the performance of MPC is highly reliant on the accuracy of the plant model, and any mismatch between the model and the actual system can lead to suboptimal control [16]. Active disturbance rejection control (ADRC) has been widely adopted for its ability to estimate and compensate for instabilities in real time, making it highly robust against uncertainties and external disturbances. ADRC employs an extended state observer (ESO) to estimate the overall disturbance, which contains both internal uncertainties and external disturbances and compensates for it in the control law. Several studies have applied ADRC to DC/DC converters in DC microgrids, demonstrating superior performance compared to traditional PI controllers [17,18]. However, conventional ADRC designs often rely on fixed control gains, which may not adapt well to changes in system parameters or operating conditions. This limitation can lead to degraded performance in scenarios where the number of active phases in interleaved converters varies, such as during light-load operation or fault conditions [19].
IBCs have gained popularity in DC microgrids due to their ability to reduce input current ripple, improve efficiency, and handle higher power levels. The interleaving technique involves operating multiple converter phases in parallel with phase-shifted switching signals, which reduces the overall current ripple and distributes the thermal stress across multiple components. Several control strategies have been proposed for IBCs, including current-sharing control, voltage regulation, and disturbance rejection techniques [20,21]. However, the presence of CPLs in DC microgrids introduces additional challenges, such as uneven current distribution among phases and instability during dynamic load changes. Existing control strategies often fail to address these issues effectively, particularly in scenarios where the number of active phases varies due to load conditions or fault events [22]. RST controllers, which are based on polynomial control theory, have been explored for their ability to provide robust and flexible control solutions for power electronic systems. RST controllers use a combination of reference tracking (R), state feedback (S), and disturbance rejection (T) to achieve desired performance. In [23], an RST controller was proposed for a DC/DC buck converter, demonstrating improved voltage regulation and robustness against load variations. However, the application of RST controllers in IBCs with CPLs has not been extensively studied. The combination of RST control with IBCs could offer significant advantages, such as enhanced stability, improved dynamic response, and better disturbance rejection, particularly in the presence of CPLs. Despite the advancements in control strategies for DC/DC converters, several challenges remain unaddressed, particularly in the context of IBCs operating in DC microgrids with CPLs. Existing control methods, such as PI, SMC, MPC, and ADRC, often fail to provide robust performance under varying operating conditions, such as changes in the number of active phases or dynamic load variations. Additionally, the integration of RST controllers with IBCs has not been thoroughly explored, leaving a significant gap in the literature. A comparative summary of the main control methods is presented in Table 1.

Table 1.
Comparison of common control methods and the RST controller.
This paper proposes a novel control approach that combines the benefits of RST control with IBCs to address the challenges posed by CPLs in DC microgrids. The proposed approach leverages the robustness and flexibility of RST controllers to achieve stable operation, improved dynamic response, and effective disturbance rejection. Unlike conventional methods, the proposed controller dynamically adapts to changes in system parameters and operating conditions, ensuring consistent performance across a wide range of scenarios. Furthermore, the integration of RST control with IBCs offers a unique solution to the problem of uneven current distribution and instability during dynamic load changes. The key contributions of this paper are as follows:
- Development of a robust RST controller: A novel RST-based control strategy is proposed for IBCs, offering enhanced stability and dynamic performance in the presence of CPLs.
- Adaptive control mechanism: The proposed controller incorporates an adaptive mechanism to adjust control parameters in real time, ensuring robust performance under varying operating conditions.
- Simulation validation: The efficacy of the RST control strategy is validated through extensive simulations tests, demonstrating competitive performance compared to existing methods.
By addressing the limitations of existing control strategies and introducing a novel approach, this paper aims to advance the state of the art in DC microgrid control, paving the way for more reliable and efficient energy systems.
2. Modeling of the DC Microgrid with CPL
Figure 1 illustrates a typical DC microgrid, commonly employed in various applications, including naval electric aircraft and ships and automotive systems. The DC microgrid shown comprises several CPLs, DC power sources, and an integrated energy storage system. Furthermore, Figure 1 includes a diagram of an interleave boost converter, which delivers power to both constant voltage loads (CVLs) and CPLs. The circuit features essential components such as a capacitor an inductor load resistance , and an input voltage source. Critical parameters in this setup include the capacitor voltage (Vout), the inductor current , and the duty cycle , which varies between 0 and 1. The design parameters of the DC/DC interleave boost converter are derived using the equations provided in Section 3.1 [23,24].
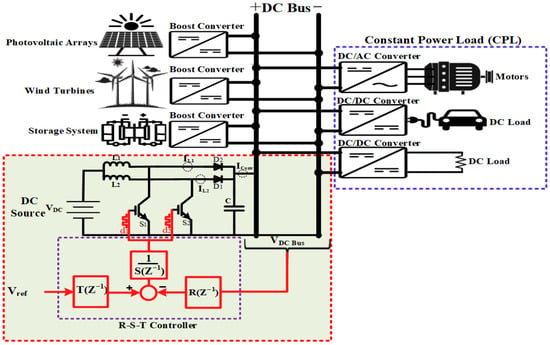
Figure 1.
A standard DC microgrid configuration featuring an IBC. The RST controller is highlighted within the red dashed block, while the CPL is enclosed in the blue dashed block.
3. Mathematical Modeling of Two-Phase IBC
The topology of the two-phase IBC is illustrated in Figure 2. It comprises two independent input inductors, L1 and L2, each paired with a corresponding switch (S1, S2) and diode (D1, D2). These two phases share a common output filter capacitor C, which is connected across the load, modeled as a resistive element R. The switches S1 and S2 operate at the same switching frequency but with a phase shift of 180°, ensuring interleaved operation.
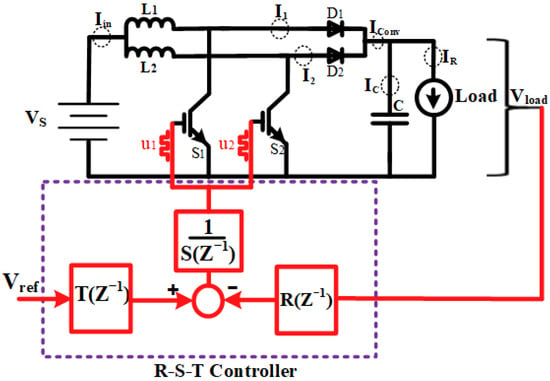
Figure 2.
Schematic diagram of a two–phase interleaved boost converter (IBC).
During the ON state of the switches, energy is stored in the inductors L1 and L2, and during the OFF state, this energy is transferred through the diodes to the output, contributing to the voltage boost. The shared capacitor CCC functions as a filter to reduce output voltage ripple Vo, thereby stabilizing the output.
The switching actions of S1 and S2 are represented by the control signals and , respectively, where u1, ∈{0, 1} indicate the OFF (0) and ON (1) states. The 180° phase shift between u1 and u2 ensures that the input current is effectively split between the two phases, reducing current ripple and improving overall performance [24].
3.1. Switched Function Model
The two-phase IBC operates in four distinct switching modes over a complete switching cycle, determined by the ON/OFF states of switches S1 and S2. The analysis assumes operation under Continuous Conduction Mode (CCM), where inductor currents never fall to zero.
To enhance model realism, the inductor winding resistance is incorporated into the model. However, other parasitic elements—including the ON-state resistance of the switches, diode forward voltage drops, and the Equivalent Series Resistance (ESR) of the capacitor—are neglected to maintain modeling simplicity.
For symmetry and ease of analysis, both inductors are assumed to have equal inductance values (L1 = L2 = L). Each switch operates with a 50% duty cycle and is phase-shifted by 180°, resulting in four possible switching combinations that define the system’s operating states. These modes are used to derive the state-space representation and average model of the converter for control design and stability analysis.
Mode 1: In this mode, switch S1 is turned ON ( = 1) while switch S2 is turned OFF (u2 = 0). As a result, inductor L1 is directly connected to the input source and begins storing energy, whereas inductor L2 transfers its stored energy to the output through diode D2. The load is supplied by the energy released from L2 and the output capacitor C. This mode enables partial energy transfer to the load while maintaining continuous current flow in both inductors. The equivalent circuit for this operating condition is illustrated in Figure 3.
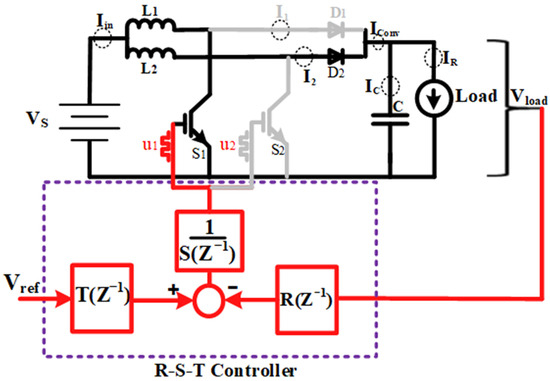
Figure 3.
Equivalent circuit for Mode 1.
For the equivalent circuit of Mode 1, the differential equations governing the system dynamics are derived using Kirchhoff’s Voltage Law (KVL) and Kirchhoff’s Current Law (KCL). Applying KVL to the loop containing inductor L1, the input voltage Vin, and its internal resistance r, we obtain the voltage across the inductor. Simultaneously, KVL is applied to the second loop comprising inductor L2, diode D2, and the output capacitor C to describe the energy transfer to the load. KCL is used at the output node to relate the currents from L2 and C to the load resistor R. These equations form the basis of the state-space model for Mode 1, capturing the inductor currents and output voltage behavior during this switching state.
Mode 2: Switch S1 is turned OFF (0), while switch S2 is turned ON (1). The equivalent circuit for this mode is depicted in Figure 4. During this mode, inductor L1 releases its stored energy through diode D1 to the output, while inductor L2 stores energy from the input source. KVL is applied to both loops involving L1 and L2 to derive the voltage relationships, considering the inductor resistance r. KCL is used at the output node to express the relationship between the inductor currents, capacitor current, and load current. These equations define the dynamic behavior of the converter in Mode 2 and contribute to the overall switched model formulation.
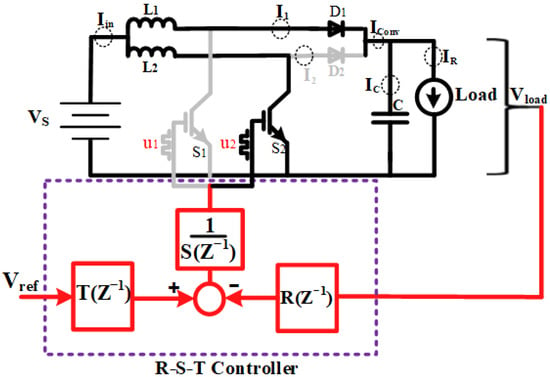
Figure 4.
Equivalent circuit for Mode 2.
Mode 3: Both switches are turned ON, i.e., = = 1. The corresponding equivalent circuit is illustrated in Figure 5. In this configuration, both inductors L1 and L2 are directly connected to the input source, simultaneously storing energy. Since both diodes D1 and D2 are reverse-biased in this mode, no current flows from the inductors to the output. The output capacitor C is responsible for supplying the load current during this interval. Using KVL, the input loop voltages across both inductors can be expressed, and KCL is applied at the output to model the capacitor’s discharge behavior. This mode contributes to energy storage in the inductors and affects the ripple behavior of the output voltage.
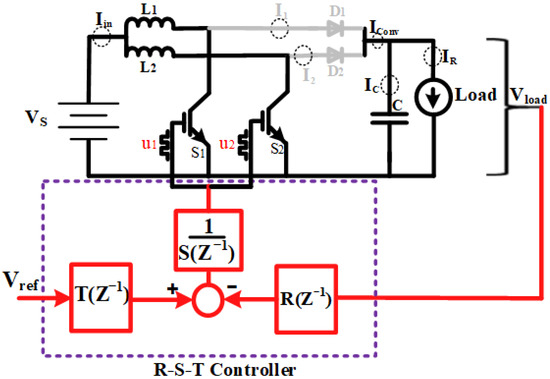
Figure 5.
Equivalent circuit for Mode 3.
Mode 4: In this mode, both switches are turned OFF, i.e., = = 0. The corresponding equivalent circuit is shown in Figure 6. During this mode, both inductors L1 and L2 are disconnected from the input source and instead discharge their stored energy through the respective diodes D1 and D2 into the output capacitor and load. The diodes are forward-biased, allowing current flow from the inductors to the output stage. As a result, the load is powered by both the inductor currents and the capacitor. The system continues to operate in Continuous Conduction Mode (CCM), ensuring uninterrupted current through the inductors. The differential equations are expressed using a switching function approach.
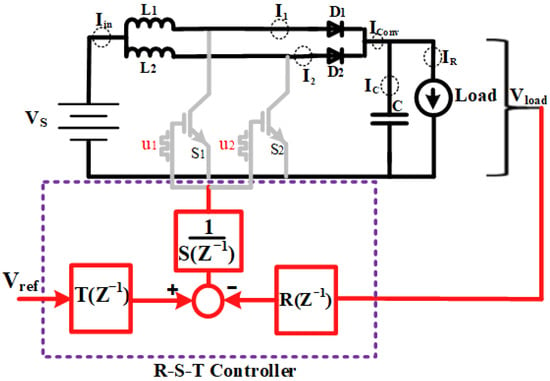
Figure 6.
Equivalent circuit for Mode 4.
The system’s dynamic behavior across the four modes can be unified using a switching function approach, which simplifies the modeling by expressing all modes with a single set of differential equations. In this formulation, the switching states u1 and u2 take binary values (0 or 1), representing the OFF and ON states of switches S1 and S2, respectively. The governing differential equations, incorporating inductor resistance r, are expressed as follows:
3.2. Steady-State Equations of the System
To analyze the system under steady-state conditions, the average model approach is employed. In this method, the binary switching signals and in the dynamic Equations (13)–(15) are replaced with their respective average values over one switching period, denoted as and . The averaged dynamic equations become
In this context, represent the average positions of the switches. The quantities and are determined by combining their average values with a small-signal component.
When the condition holds, the term can be disregarded by applying the small-signal approximation. Under steady-state conditions, both and are equivalent to As a result, At steady state, Equations (16)–(18) reduce to
Equation (20)–(22) can be expressed in matrix form as follows:
Equation (24) is obtained by applying (23) and signifies the system’s equilibrium state under steady conditions.
3.3. Parameters Selection
The load resistance is determined based on the power consumed by the load. The inductance value is selected by specifying the desired ripple current in the inductor, as outlined in Equation (25). The magnitude of the output voltage ripple is used to determine the required capacitance value, as expressed in (26).
Under steady-state conditions, the output voltage for an ideal scenario can be determined using (27).
4. Design of a Robust Digital RST Controller
4.1. System Identification Process
The RST control methodology is a computational technique that depends on the dynamic characteristics of a system, represented through a mathematical model. Accurately formulating this model is a crucial challenge, as the effectiveness of the control system is directly influenced by its precision. By utilizing MATLAB 2024b’s identification toolbox, a discrete-time model with adaptable parameters is constructed, as illustrated in Figure 7. A parameter adaptation approach is implemented to minimize the prediction error, which is defined as the difference between the actual system output and the estimated output . from the model. To enhance accuracy, these parameters are updated at each sampling instance. The system is stimulated by a discrete input sequence for t = 0, 1, 2, …, n, which is subsequently converted into a continuous signal using a Zero-Order Hold (ZOH) [25].
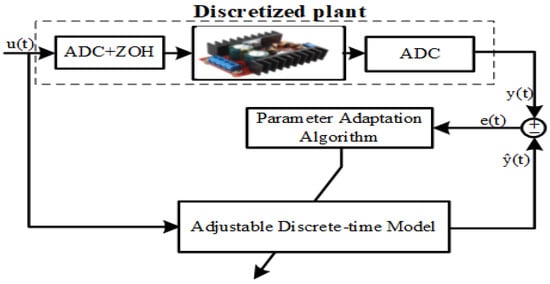
Figure 7.
Discrete-time model parameter estimation [25].
4.2. The RST Digital Controller
Implementing an RST controller efficiently requires establishing uncertainty bounds that accommodate fluctuations in the plant model parameters. Choosing appropriate RST polynomials that satisfy control system requirements can be computationally demanding, especially in self-tuning and auto-tuning control strategies. Consequently, designing a versatile RST controller for industrial applications remains a challenging task [26]. This section presents the development of a robust digital RST feedback controller that integrates pole placement techniques with sensitivity function tuning [27]. This approach enhances closed-loop system performance and improves its ability to counteract disturbances. Figure 1 provides an overview of the RST controller’s structure and deployment. To aid in the design of digital controllers, a discrete-time plant model (G) is derived by discretizing the model from Equation (28) using the ZOH transformation, as depicted in Figure 7. This step results in a reformulation of the discrete-time plant model, as shown in Equation (28).
In the proposed controller, the digital polynomials and are formulated to fulfill the required regulation objectives, while the polynomial T is included to ensure optimal tracking performance. These three polynomials collectively serve as the fundamental components of the RST digital controller, which is structured as follows:
where the numerical coefficients are
- R(z−1): [r0, r1, …, rn] = [0.1, −0.09, −0.1, 0.09];
- S(z−1): [s0, s1, …, sm] = [1, −0.79, −0.07, −0.14];
- T(z−1): [t0, t1, …, tp] = [0.002].
To ensure proper operation, is adjusted so that it matches , guaranteeing that its gain corresponds to the sum of the coefficients of . This modification helps maintain a unit gain between the desired and actual outputs during steady-state conditions. In an IBC, the key goal is to achieve precise reference tracking while maintaining stability and robustness. These objectives are typically addressed by carefully designing the closed-loop sensitivity functions [26]. The controller was sampled at Ts = 0.0001 s, and anti-windup/saturation handling was implemented using clamping of the control signal. Sensitivity shaping was performed according to the design targets summarized in Table 2 and following the closed-loop sensitivity constraints:
where

Table 2.
Limitations on the forms of sensitivity functions.
;
→ Complementary sensitivity function, with γ1 = 3.5 dB;
.
The output sensitivity function represents the effect of load disturbances on the plant output, while the sensitivity function describes how measurement noise influences the plant output. Similarly, the input sensitivity function characterizes the relationship between control disturbances and the plant input. To shape the closed-loop sensitivity functions, suitable closed-loop poles are selected, and specific polynomials are incorporated into the controller design. An important factor is that all three sensitivity functions share a common denominator, given by , which governs the positioning of the closed-loop poles. This denominator distinguishes between dominant and auxiliary poles, as outlined in Equation (33).
The expression represents the auxiliary poles, while denotes the dominant poles necessary for the closed-loop system’s performance. The predefined polynomials ) and S) are formulated as presented in Equations (34) and (35).
In this context, and denote predetermined polynomials. The controller’s polynomials and are determined by solving the following equations:
To ensure precise tracking and maintain unity gain between the reference and output signals during steady-state conditions, the polynomial is set equal to . Additionally, to improve system stability, strengthen robustness against potential instabilities, and achieve accurate tracking, an RST controller is employed in a closed-loop setup.
As shown in Figure 8, the sensitivity So, complementary sensitivity To, and input sensitivity Ti functions confirm the stability and robustness of the closed-loop system under CPL conditions. The small-signal model, which includes the negative incremental impedance of the CPL, yields closed-loop poles located in the left half-plane, ensuring asymptotic stability. The Bode plots verify that the design constraints (γ0, γ1, γ2) are satisfied, with sufficient gain and phase margins. In addition, the eigenvalue/eigenlocus analysis shows that the closed-loop system trajectories remain bounded and do not encircle the critical point, further validating robust stability. These results demonstrate that the proposed R-S-T controller achieves stable operation while suppressing CPL-induced instabilities.
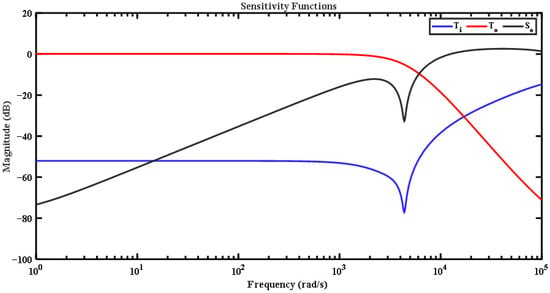
Figure 8.
Sensitivity functions of the closed-loop system under the proposed R-S-T controller.
4.3. Design Guidelines and Parameter Selection
Based on the identified transfer function, the RST digital controller was designed using the pole placement method. The R, S, and T polynomials were computed by solving the Diophantine equation, ensuring explicit assignment of closed-loop poles according to desired dynamic specifications. The tuning targeted a settling time of approximately 40 ms, minimal overshoot (<2%), and balanced sensitivity/complementary sensitivity trade-offs. To further clarify the design procedure of the proposed RST controller, this subsection provides the guidelines followed for polynomial selection and parameter tuning.
Step 1—Define closed-loop objectives
The design goals were specified as (i) settling time < 2 s, (ii) overshoot < 5%, (iii) zero steady-state error for step inputs, and (iv) robustness to ±10% parameter variations.
Step 2—Select desired closed-loop polynomial
A reference model was formulated from a second-order system with a damping ratio ζ = 0.7 and natural frequency ωn = 4 rad/s. Its poles were mapped into the z-domain using the transformation z = esTs, ensuring stability and proper transient dynamics. This defined the desired characteristic polynomial .
Step 3—Determine degrees of R and S polynomials
To ensure a unique solution of the Diophantine Equation (36), the degrees were chosen as deg(R) = deg(B) and deg(S) = deg(A). This selection balances controller complexity and performance.
Step 4—Solve for R and S coefficients
The coefficients were obtained by solving the Diophantine equation using MATLAB’s symbolic tools. The initial solution guaranteed closed-loop stability by placing poles inside the unit circle.
Step 5—Tune parameters by performance indices
The preliminary solution was validated by simulation, and adjustments were made based on Integral of Squared Error (ISE) and Integral of Time-weighted Absolute Error (ITAE) criteria. Slight shifts in pole locations were applied to reduce overshoot and improve settling time.
Step 6—Compute the T polynomial
The polynomial was designed to ensure accurate tracking. It was defined as
so that the steady-state gain is unity, guaranteeing zero steady-state error for step inputs.
By following these steps, the RST controller parameters were systematically derived rather than arbitrarily chosen. This procedure enhances the reproducibility of the proposed design and demonstrates how the theoretical framework in Section 3.2 is practically applied.
5. Simulation Results and Discussion
This section provides a comprehensive analysis of the simulation results for the interleaved DC-DC boost converter under both CVL and CPL conditions. The primary objective is to demonstrate the robustness and effectiveness of the proposed RST controller in regulating output voltage and suppressing disturbances. The simulation model is subjected to a range of scenarios, including step changes in load type (CVL to CPL), fluctuations in load demand, and variations in input voltage, to rigorously evaluate the controller’s performance. The dynamic response, voltage regulation, and current sharing between phases are key performance indicators examined throughout the analysis. The parameters listed in Table 3 were selected to ensure realistic operating conditions for the DC–DC interleaved boost converter. The input voltage Vin = 90 V and reference output voltage Vref = 200 V reflect typical step-up conversion requirements. A switching frequency of Fs = 30 kHz was chosen to balance efficiency and component size, while the constant power load PCPL = 1000 W represents a practical medium-power application. The load resistance RL = 53 Ω, along with inductors L1 = L2 = 1.125 mH and capacitor C = 670 μF, were selected to ensure stable operation, reduced current ripple, and acceptable voltage regulation under dynamic conditions. These specifications provide a reliable basis for validating the effectiveness of the proposed R-S-T controller in simulation.

Table 3.
DC-DC interleave boost converter.
5.1. CASE I: Variations in Constant Power Load (CPL)
Figure 9, Figure 10 and Figure 11 demonstrate the effectiveness of the proposed control strategy in regulating the DC bus voltage and ensuring accurate current sharing among the converters under dynamic CPL conditions. As depicted in Figure 9, the CPL power demand is varied in steps: it initially increases from 500 W to 1000 W at t = 1 s, followed by a rise to 2500 W at t = 2 s. Subsequently, the load decreases to 1500 W and finally to 1000 W in two discrete steps. Figure 10 illustrates the dynamic performance of the DC bus voltage in response to abrupt changes in the CPL. The blue solid line represents the measured DC bus voltage, while the red dashed line denotes the voltage reference. Each load disturbance introduces a brief deviation in DC bus voltage, as highlighted in the magnified insets for each event. Despite these transients, the system quickly recovers and re-aligns with the reference voltage, demonstrating strong voltage regulation and dynamic robustness. The limited overshoot and fast settling time following each disturbance indicate the effectiveness of the proposed control strategy in maintaining voltage stability under varying load conditions.
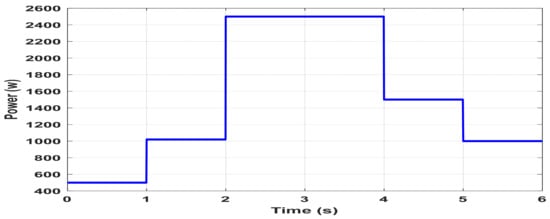
Figure 9.
The system’s dynamic response to changes in the constant power load (CPL).
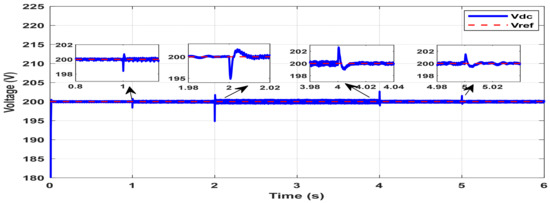
Figure 10.
DC bus voltage response under step changes in constant power load (CPL).
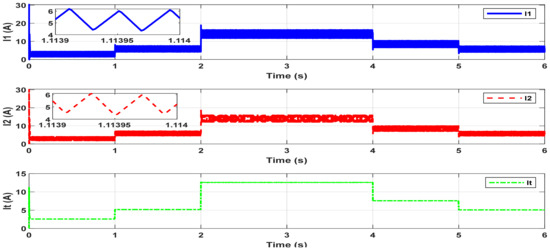
Figure 11.
Current responses of the IBC under CPL variations. I1 (top) and I2 (middle) represent the inductor currents of two interleaved phases, while It (bottom) is the total output current.
Figure 11 presents the current waveforms of the IBC under step changes in the CPL. The top and middle subplots show the inductor currents I1 (blue, solid) and I2 (red, dashed), respectively, while the bottom subplot displays the total output current It (green, dash-dotted), computed as the phasor sum of I1 and I2, which are designed to be 180° out of phase. At each transition point (t = 1 s, 2 s, 4 s, and 5 s), corresponding to changes in CPL power, I1 and I2 exhibit stepwise adjustments, maintaining symmetrical ripple profiles, as shown in the zoomed insets. These insets reveal the high-frequency triangular ripple resulting from interleaving operation. Notably, the control strategy maintains balanced current sharing between the phases throughout all operating conditions, with both I1 and I2 adapting consistently to the total current demand. The total output current It tracks the CPL load dynamics with high fidelity, increasing or decreasing in response to step changes in power demand. This behavior confirms that the system effectively distributes the current between converter phases while preserving overall current accuracy, dynamic responsiveness, and system stability.
5.2. CASE II: Constant Voltage Load Variation (CVL)
Figure 12, Figure 13 and Figure 14 evaluate the performance of the proposed control scheme under variations in a constant voltage load (CVL). In this scenario, the load resistance is reduced to 50% of its nominal value at t = 2 s and is restored to 20 Ω at t = 4 s, as illustrated in Figure 12. Figure 13 illustrates the dynamic behavior of the DC bus voltage in response to abrupt changes in the CVL. At t = 2 s, the load resistance is decreased to 10 Ω and subsequently restored to 20 Ω at t = 4 s. These load perturbations induce noticeable but brief transients in the bus voltage. As shown in the zoomed inset, a sharp deviation occurs at each transition point; however, the voltage promptly re-stabilizes to the reference value, confirming the effectiveness of the proposed control strategy in mitigating voltage disturbances and maintaining regulation. This response highlights the system’s robustness in handling resistive load variations, as well as the controller’s ability to reject disturbances and restore steady-state conditions within a short time frame. The minimal overshoot and fast settling time underscore the high-performance nature of the voltage regulation loop under varying CVL conditions.
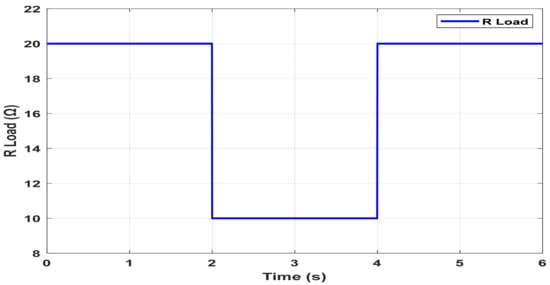
Figure 12.
Constant voltage load (CVL) variations.
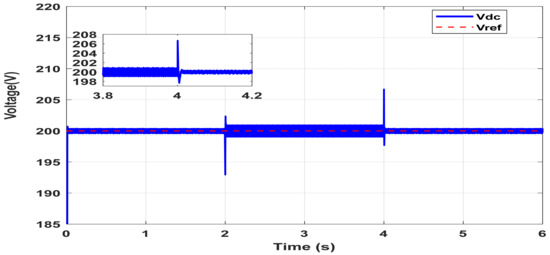
Figure 13.
DC bus voltage response under constant voltage load (CVL) variations.
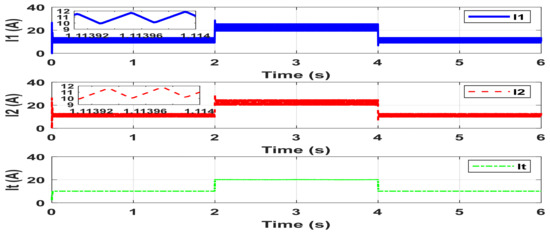
Figure 14.
Time-domain current waveforms of the two-phase IBC under dynamic CVL. I1 and I2 represent the individual inductor currents, while It is the total output current.
Figure 14 illustrates the time-domain waveforms of the individual inductor currents (I1 and I2) and the total output current in the two-phase IBC, emphasizing the system’s dynamic performance and current-sharing effectiveness. The converter is subjected to two step changes in load: the total output current increases from approximately 11 A to 22 A at t = 2 s and subsequently decreases back to 11 A at t = 4 s. Throughout these transitions, the control scheme maintains balanced current distribution, with I1 and I2 each supplying nearly half of the total load current. The magnified insets highlight the high-frequency triangular ripple characteristic of switched-mode converters and demonstrate the 180° phase shift between I1 and I2. This interleaved operation results in partial ripple cancellation at the output, yielding a smoother total current waveform. This behavior underscores a key benefit of interleaving: improved output current quality with reduced ripple, which translates to relaxed filtering requirements and enhanced system efficiency.
5.3. CASE III: Voltage Input Variation
Figure 15, Figure 16 and Figure 17 evaluate the robustness of the proposed control strategy under fluctuations in the input voltage supplied to the converters. This case simulates a realistic scenario in which the input voltage experiences multiple step changes: it increases from 90 V to 100 V, then decreases to 90 V, and finally settles at 92 V. These variations are depicted in Figure 15.
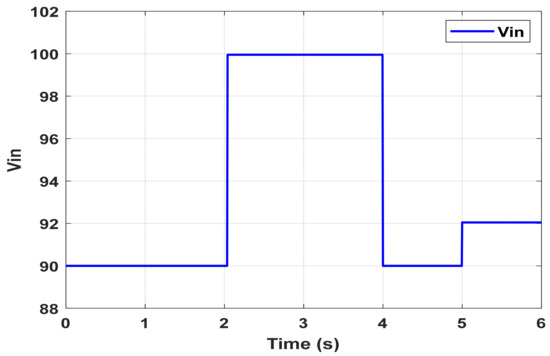
Figure 15.
The input voltage variations designed to test the line regulation and transient response of the IBC.
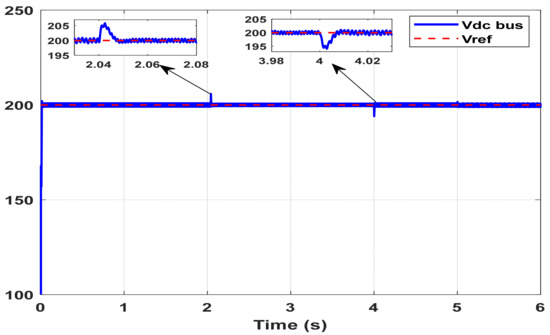
Figure 16.
DC bus voltage response under input voltage variations.
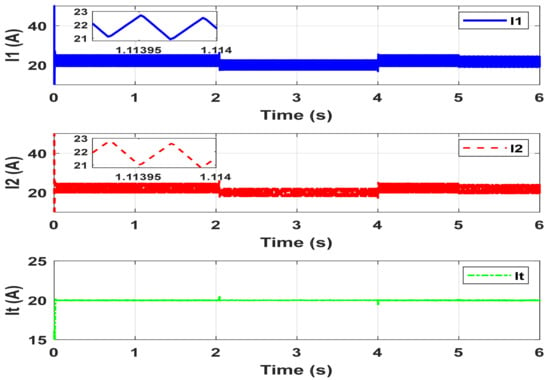
Figure 17.
Converter current response under input voltage variations. The top and middle plots show the individual phase currents I1 and I2. The bottom plot displays the total output current It.
Figure 16 illustrates the dynamic performance of a high-performance closed-loop control system tasked with regulating the DC bus voltage to a constant reference value of 200 V. The system demonstrates exceptional steady-state regulation, maintaining the voltage with negligible deviation throughout normal operating conditions. However, the controller’s robustness is most evident during its response to significant input-side disturbances occurring at t = 2 s and t = 4 s. As shown in the first magnified inset, a voltage overshoot is observed at t = 2 s, with DC bus voltage peaking at approximately 204 V, corresponding to a +2% deviation from the reference. The controller swiftly mitigates this disturbance, restoring the voltage to its nominal value within approximately 40 milliseconds—indicating a fast settling time and effective damping characteristics. At t = 4 s, the system encounters a second disturbance, resulting in a brief undershoot where the DC bus voltage dips to around 196 V (a −2% deviation). This event is followed by an even faster recovery, as captured in the second inset. The prompt correction of both overvoltage and undervoltage transients underscores the high level of dynamic responsiveness provided by the control scheme.
Overall, the minimal voltage deviation under substantial transient conditions, combined with the rapid recovery times, confirms the controller’s competitive line and load regulation capabilities. These results validate the robustness and precision of the control design, making it well suited for applications requiring stable DC voltage under fluctuating input or load scenarios—such as renewable energy systems, microgrids, or DC distribution networks.
Figure 17 presents the dynamic current response of the two-phase IBC under varying input voltage conditions. The subplots display the time-domain waveforms of the individual inductor currents I1 (top, blue) and I2 (middle, red) and the total output current It (bottom, green). Both I1 and I2 exhibit an initial transient response followed by a rapid convergence to a steady-state value. The oscillatory nature observed during the transient phase is indicative of the system’s dynamic adjustment to input disturbances. The symmetry and phase shift between I1 and I2 confirm proper interleaving operation, which is essential for balanced current sharing and ripple mitigation. In contrast, the total current It, representing the vector sum of I1 and I2, remains essentially constant throughout the entire simulation. This behavior highlights the system’s ability to decouple output performance from input voltage fluctuations, maintaining a stable load current despite variations on the source side. The consistent current distribution and ripple-cancelling characteristics confirm the effectiveness of the control strategy in maintaining both dynamic and steady-state performance under variable input conditions.
6. Conclusions
DC microgrids present a promising approach for integrating renewable energy sources, enhancing energy efficiency, and reducing dependence on traditional power grids. However, their stability is significantly impacted by the presence of CPLs, which introduce nonlinear characteristics that can lead to system instability. This paper has examined various control strategies, highlighting the limitations of conventional methods in managing CPL-induced instability. To address these challenges, an RST-based control strategy was proposed and applied to interleaved boost converters (IBCs), demonstrating enhanced stability, improved dynamic response, and effective disturbance rejection. Simulation results confirmed that the proposed controller effectively maintains voltage regulation and ensures proper current distribution among IBC phases. Importantly, the design leverages symmetry in both the interleaving structure of the converter and the RST polynomial formulation, which ensures balanced current sharing, reduces stress on individual components, and simplifies closed-loop sensitivity shaping. By adapting to changing load conditions and system parameters, future research can explore further optimization of the RST controller and its integration with advanced artificial intelligence-based adaptive control techniques to enhance real-time performance in complex microgrid environments.
Author Contributions
Conceptualization, A.A.A.-S. and H.M.H.F.; data curation, A.-W.I.; formal analysis, A.A.A.-S., H.M.H.F., H.O.O. and A.-W.I.; funding acquisition, A.A.A.-S.; investigation, A.A.; methodology, A.A.A.-S. and H.O.O.; project administration, H.M.H.F. and A.A.; software, A.-W.I., A.M.A. and A.A.; supervision, A.A.A.-S.; validation, A.-W.I.; visualization, A.A.A.-S., H.M.H.F. and A.M.A.; writing—original draft, A.A.A.-S. and H.O.O.; writing—review and editing, H.M.H.F., A.-W.I., A.M.A. and A.A. All authors have read and agreed to the published version of the manuscript.
Funding
This work was supported and funded by the Deanship of Scientific Research at Imam Mohammad Ibn Saud Islamic University (IMSIU) (grant number IMSIU-DDRSP2503).
Data Availability Statement
No new data were created or analyzed in this study. Data sharing is not applicable to this article.
Conflicts of Interest
The authors declare no conflicts of interest to report regarding the present study.
References
- Alturki, F.A.; Omotoso, H.O.; Al-Shamma, A.A.; Farh, H.M.H.; Alsharabi, K. Novel Manta Rays Foraging Optimization Algorithm Based Optimal Control for Grid-Connected PV Energy System. IEEE Access 2020, 8, 187276–187290. [Google Scholar] [CrossRef]
- Pires, V.F.; Pires, A.; Cordeiro, A. DC microgrids: Benefits, architectures, perspectives and challenges. Energies 2023, 16, 1217. [Google Scholar] [CrossRef]
- Zhang, W.; Chen, J.; Riaz, S.; Zheng, N.; Li, L. Research on distributed cooperative control strategy of microgrid hybrid energy storage based on adaptive event triggering. CMES-Comput. Model. Eng. Sci. 2022, 132, 585–604. [Google Scholar] [CrossRef]
- Firuzi, M.F.; Roosta, A.; Gitizadeh, M. Stability analysis and decentralized control of inverter-based ac microgrid. Prot. Control Mod. Power Syst. 2019, 4, 6. [Google Scholar] [CrossRef]
- Omotoso, H.O.; Al-Shammaa, A.A.; Alharbi, M.; Farh, H.M.H.; Alkuhayli, A.; Abdurraqeeb, A.M.; Alsaif, F.; Bawah, U.; Addoweesh, K.E. Machine learning supervisory control of grid-forming inverters in islanded mode. Sustainability 2023, 15, 8018. [Google Scholar] [CrossRef]
- Boubaker, S.; Mellit, A.; Ghazouani, N.; Meskine, W.; Benghanem, M.; Kraiem, H. Demand forecasting of a microgrid-powered electric vehicle charging station enabled by emerging technologies and deep recurrent neural networks. Comput. Model. Eng. Sci. 2025, 143, 2237–2259. [Google Scholar] [CrossRef]
- Xu, P.; Wen, H.; Bu, Q.; Dai, L.; Zhu, Y.; Khan, S.S.; Shi, H.; Zhou, J.; Ma, J.; Hu, Y.; et al. Large-signal stability for DAB converters feeding constant power load based on state trajectory analysis. IEEE Trans. Trans. Electrif. 2024, 11, 1. [Google Scholar] [CrossRef]
- Huang, L. Reduced-order discrete modeling method and nonlinear analysis of a discontinuous conduction mode buck converter. Energy Rep. 2023, 9, 1021–1036. [Google Scholar] [CrossRef]
- Hassan, M.A.; Su, C.L.; Pou, J.; Sulligoi, G.; Almakhles, D.; Bosich, D.; Guerrero, J.M. DC shipboard microgrids with constant power loads: A review of advanced nonlinear control strategies and stabilization techniques. IEEE Trans. Smart Grid 2022, 13, 3422–3438. [Google Scholar] [CrossRef]
- Hassan, M.A.; Worku, M.Y.; Eladl, A.A.; Elkadeem, M.R.; Hossain, M.I.; Abido, M.A. Instability mitigation of constant power load in microgrid. Arab. J. Sci. Eng. 2024, 49, 7341–7358. [Google Scholar] [CrossRef]
- Mustafa, G.; Ahmad, F.; Zhang, R.; Haq, E.U.; Hussain, M. Adaptive sliding mode control of buck converter feeding resistive and constant power load in DC microgrid. Energy Rep. 2023, 9, 1026–1035. [Google Scholar] [CrossRef]
- Muktiadji, R.F.; Ramli, M.A.M.; Bouchekara, H.R.; Milyani, A.H.; Rawa, M.; Seedahmed, M.M.; Budiman, F.N. Control of boost converter using observer-based backstepping sliding mode control for DC microgrid. Front. Energy Res. 2022, 10, 828978. [Google Scholar] [CrossRef]
- Na, W.; Chen, P.; Kim, J. Elimination of chattering by control strategy based on the multiphase sliding mode control for efficient power conversion in a DC-DC circuit. Energies 2017, 10, 1389. [Google Scholar] [CrossRef]
- Hu, J.; Shan, Y.; Guerrero, J.M.; Ioinovici, A.; Chan, K.W.; Rodriguez, J. Model predictive control of microgrids-An overview. Renew. Sustain. Energy Rev. 2021, 136, 110422. [Google Scholar] [CrossRef]
- Karami, Z.; Shafiee, Q.; Khayat, Y.; Yaribeygi, M.; Dragievi, T.; Bevrani, H. Decentralized model predictive control of DC microgrids with constant power load. IEEE J. Emerg. Sel. Top. Power Electron. 2019, 9, 451–460. [Google Scholar] [CrossRef]
- Xiang, Y.; Chung, H.S.; Shen, R.; Lo, A.W. An ANN-based output-error-driven incremental model predictive control for buck converter against parameter variations. IEEE J. Emerg. Sel. Top. Power Electron. 2023, 12, 1230–1248. [Google Scholar]
- Zhuo, S.; Gaillard, A.; Guo, L.; Xu, L.; Paire, D.; Gao, F. Active disturbance rejection voltage control of a floating interleaved DC-DC boost converter with switch fault consideration. IEEE Trans. Power Electron. 2019, 34, 12396–12406. [Google Scholar]
- Jin, S.; Zhuo, S.; Huangfu, Y. Design of ADRC based on improved ESO for enhanced robustness of bidirectional DC/DC converters in DC microgrid. In Proceedings of the IECON 2023—49th Annual Conference of the IEEE Industrial Electronics Society, Singapore, 16–19 October 2023; Volume 16, pp. 1–6. [Google Scholar]
- Qie, T.; Zhang, X.; Xiang, C.; Yu, Y.; Iu, H.H.C.; Fernando, T. A new robust integral reinforcement learning based control algorithm for interleaved DC/DC boost converter. IEEE Trans. Ind. Electron. 2023, 70, 3729–3739. [Google Scholar] [CrossRef]
- Valarmathy, A.S.; Prabhakar, M. High gain interleaved boost-derived DC-DC converters—A review on structural variations, gain extension mechanisms and applications. e-Prime-Adv. Electr. Eng. Electron. Energy 2024, 8, 100618. [Google Scholar] [CrossRef]
- Wang, L.; Jiao, H.; Yang, G.; Li, J.; Zhang, Y. Current sharing compensation control method for interleaved current source isolated bidirectional DC/DC converters. J. Power Electron. 2022, 22, 1–9. [Google Scholar] [CrossRef]
- Wu, H.; Pickert, V.; Ma, M.; Ji, B.; Zhang, C. Stability study and nonlinear analysis of DC–DC power converters with constant power loads at the fast timescale. IEEE J. Emerg. Sel. Top. Power Electron. 2020, 8, 3225–3236. [Google Scholar] [CrossRef]
- Farhani, S.; NDiaye, A.; Djerdir, A.; Bacha, F. Design and practical study of three-phase interleaved boost converter for fuel cell electric vehicle. J. Power Sources 2020, 479, 228815. [Google Scholar] [CrossRef]
- Mouli, G.R.; Schijffelen, J.H.; Bauer, P.; Zeman, M. Design and comparison of a 10-kW interleaved boost converter for PV application using Si and SiC devices. IEEE J. Emerg. Sel. Top. Power Electron. 2016, 5, 610–623. [Google Scholar]
- Abdurraqeeb, A.M.; Al-Shamma’a, A.A.; Alkuhayli, A.; Alharbi, M.; Farh, H.M.H.; Alsaif, F.; Omotoso, H.O.; Addoweesh, K.E.; Qamar, A. Stabilization of constant power loads and dynamic current sharing in DC microgrid using robust control technique. Electr. Power Syst. Res. 2024, 230, 110258. [Google Scholar] [CrossRef]
- Landau, I.D. The R-S-T digital controller design and applications. Control Eng. Pract. 1998, 6, 155–165. [Google Scholar] [CrossRef]
- Cyrot, C.; Landau, I.D.; Rey, D.; Barnier, J. Robust control of a 360° flexible robot arm using the combined pole placement/sensitivity function shaping method. IFAC Proc. Vol. 1994, 27, 681–686. [Google Scholar] [CrossRef]
Disclaimer/Publisher’s Note: The statements, opinions and data contained in all publications are solely those of the individual author(s) and contributor(s) and not of MDPI and/or the editor(s). MDPI and/or the editor(s) disclaim responsibility for any injury to people or property resulting from any ideas, methods, instructions or products referred to in the content. |
© 2025 by the authors. Licensee MDPI, Basel, Switzerland. This article is an open access article distributed under the terms and conditions of the Creative Commons Attribution (CC BY) license (https://creativecommons.org/licenses/by/4.0/).