Article

Analysis of Symmetrical Three-Point Bending and Springback Process of Pipes

1
School of Mechanical Engineering, Dalian University, Dalian 116622, China
2
Key Laboratory of Advanced Forging & Stamping Technology and Science, Yanshan University, Ministry of Education of China, Qinhuangdao 066004, China
*
Author to whom correspondence should be addressed.
Symmetry 2025, 17(1), 95; https://doi.org/10.3390/sym17010095
Submission received: 24 November 2024 / Revised: 29 December 2024 / Accepted: 8 January 2025 / Published: 9 January 2025
(This article belongs to the Special Issue Symmetry Problems in Metal Forming)

Abstract

:
This study presents a theoretical analysis of the single-pressure straightening process for large-scale pipes, addressing the challenges of inadequate straightening precision and low efficiency associated with the current practice, which heavily relies on operator expertise. The straightening process of pipes through pressure is fundamentally a symmetrical three-point bending elastic–plastic deformation process. With the assumption of small deformations, the symmetric three-point bending of the pipe can be divided into two distinct deformation stages: fully elastic and elastic–plastic. For each stage, calculation models are developed, yielding the deflection formulae for any point on the pipe before and after unloading under varying punch strokes. The accuracy and reliability of the theoretical models are confirmed through finite element analysis and physical simulation experiments on smaller pipes. These models enhance the accuracy of single-pressure straightening and lay the groundwork for online material performance parameter identification based on load–stroke curves during the initial straightening phase. Both theoretical analysis and experimental outcomes demonstrate that the relationship between the maximum deflection after springback and the punch stroke are nearly linear, offering a practical method for developing intelligent control systems for pressure straightening.

1. Introduction

Large straight-seam welded pipes for oil and gas transportation require straightness as a critical quality metric. The American Petroleum Institute’s API Spec 5L standard mandates that the straightness deviation of finished welded pipes must not surpass 0.2% of the pipe’s length [1]. During the production of large straight-seam welded pipes, factors such as material variability, the overall straightness of the forming equipment and molds, and welding thermal stresses can compromise the straightness of the final product, leading to non-compliance with industry standards. Considering the geometric features of large straight-seam welded pipes, manufacturers predominantly employ pressure straightening to rectify deviations in straightness [2]. However, the straightening pressure is often determined by operators based on experience and estimation, leading to a process that is both time-consuming and prone to inaccuracies, as depicted in Figure 1.
The pressure straightening method is renowned for its flexibility, precision, and controllability, making it a widely adopted technique. It imposes minimal demands on the cross-sectional characteristics of the workpiece being straightened and offers a high degree of control over residual stress [3,4]. Consequently, in applications where linear accuracy and overall performance are paramount, pressure straightening is the preferred method. The process of pipe straightening by pressure is fundamentally a symmetrical three-point bending elastic–plastic deformation of the pipe. Drawing from the theory of small curvature plane bending springback [5] and the equivalent principle of over-bending straightening [2], it is understood that straightening a curved beam into a straight one through pure bending is analogous to bending a straight beam of the same material and cross-sectional characteristics into the curved beam that needs to be straightened through pure bending. Thus, the study of straightening curved pipes can be initiated by examining the pure bending of pipes. In recent years, several scholars have analyzed the elastic–plastic deformation in the over-bending straightening of symmetrical-cross-section components such as shaft tubes [5,6] and vertically asymmetric components such as elevator guide rails [7,8,9,10]. Ling et al. elucidated the stress evolution in linear guides during pressure straightening and utilized the initial stress generated by straightening to forecast the residual stress induced by grinding [4]. Song proposed a relationship between load and bending deflection during the straightening of T-shaped rails based on the power-exponent hardening model and straightened rails with varying initial deflections [8]. Lu introduced a three-point bending straightening model predicated on stroke to predict the straightening process of the D-axis, which was confirmed through finite element simulations and bending experiments [7]. Kim and Chung automated the straightening of gear racks by employing online material performance recognition modules and fuzzy self-learning controller systems [9]. However, the aforementioned theories oversimplify the three-point bending mechanics model as a simply supported beam under concentrated load, neglecting the impact of mold parameters and the coefficient of friction. Moreover, in the resolution of the bending moment, the stress–strain relationship is treated as an ideal elastic–plastic model, failing to account for the strain hardening effect of metals during the elastic–plastic stage [11,12].
To address the limitations of the aforementioned model, this paper introduces a bilinear hardening model to develop a calculation model for the symmetrical three-point bending and springback of large-scale pipes, incorporating mold parameters and the friction coefficient. This theoretical model elucidates the deformation process of a pipe during a single three-point bending straightening operation. The development of this model not only enhances the precision of single-pressure straightening but also lays a theoretical foundation for the online identification of material performance parameters throughout the straightening process.

2. Basic Assumptions and Mechanical Models

2.1. Basic Assumptions

  • The cross-sections of the pipes remain planar after bending and deformation, with no distortion occurring.
  • Throughout the deformation process, the stress state at any point on any cross-section of the pipe is either uniaxial tension or uniaxial compression.
  • The conventional elastic–plastic material model posits that the pipe is a continuous and homogeneous elastic–plastic body, where elastic deformation follows Hooke’s law for linear elasticity and plastic flow adheres to the unloading principles of stable material conditions and classical elastoplastic theory.
  • The small-deformation assumption implies a linear distribution of strain across the cross-section, as
ε = w ρ
where ε is strain, w is the distance from the particle to the neutral layer on the cross-section, and ρ is bending radius.

2.2. Material Model

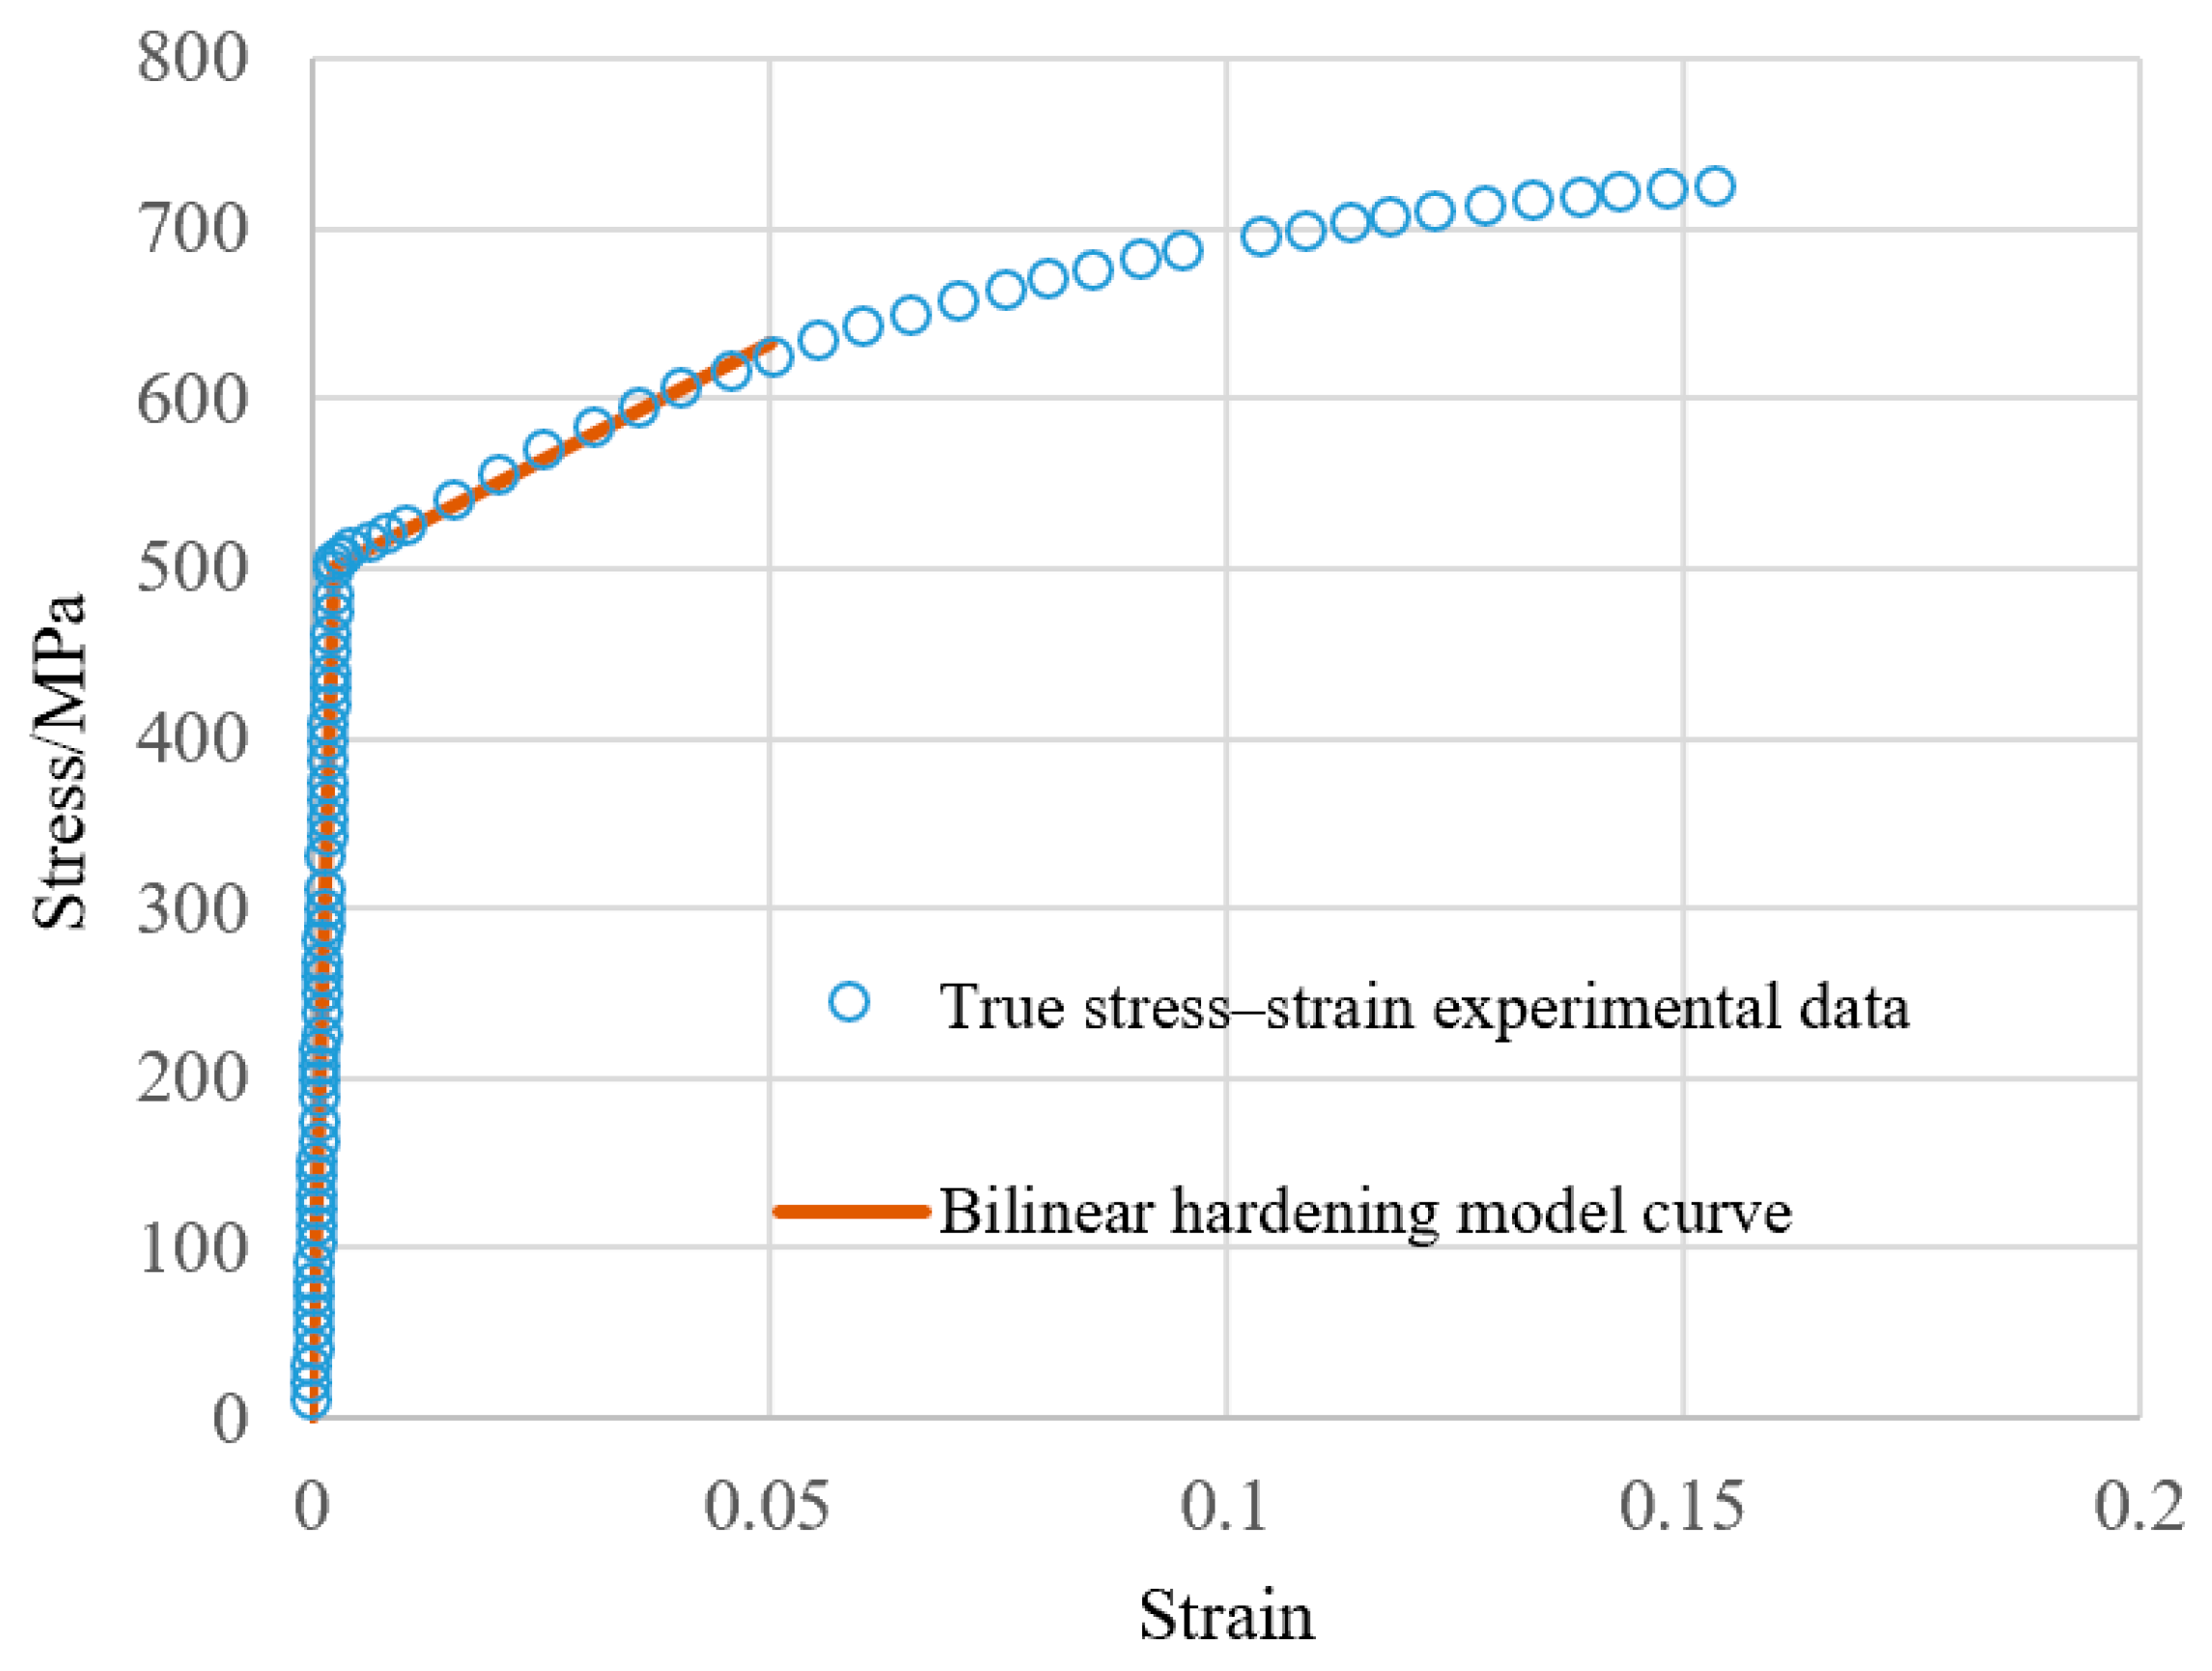
Two prevalent types of elastic–plastic material models are commonly utilized: the linear hardening elastic–plastic material model (bilinear hardening model) and the exponential hardening elastic–plastic material model [12,13]. For practical applications, it is essential to select the model that most closely aligns with the actual stress–strain relationship of the material to address material-straightening challenges. Large straight-seam welded pipes typically employ X65 and X70 grade pipeline steels [14]. Using X70 pipeline steel as an illustrative example, its true stress–strain relationship curve is depicted in Figure 2. As observed in Figure 2, X70 is a plastic material that lacks a pronounced yield stage. Given the minor deformations that occur during the pressure straightening of large straight-seam welded pipes, their true strain ranges from 0.01 to 0.04 [2,15]. Consequently, fitting the bilinear hardening material model curve to experimental data points where the true strain ε is below 0.05 not only satisfies practical application requirements but also enhances the accuracy of the bilinear model fit.
We adopt the bilinear hardening model
σ = E ε σ = D ε + σ 0 ε ε s ε > ε s
and
ε s = σ s E σ 0 = σ s ( 1 D E )
where E is the elastic modulus, D is the plastic tangent modulus, σ s is the yield stress, σ 0 is the intercept stress, and ε s is the elastic limit strain.

2.3. Symmetrical Three-Point Bending Mechanical Model of Pipes

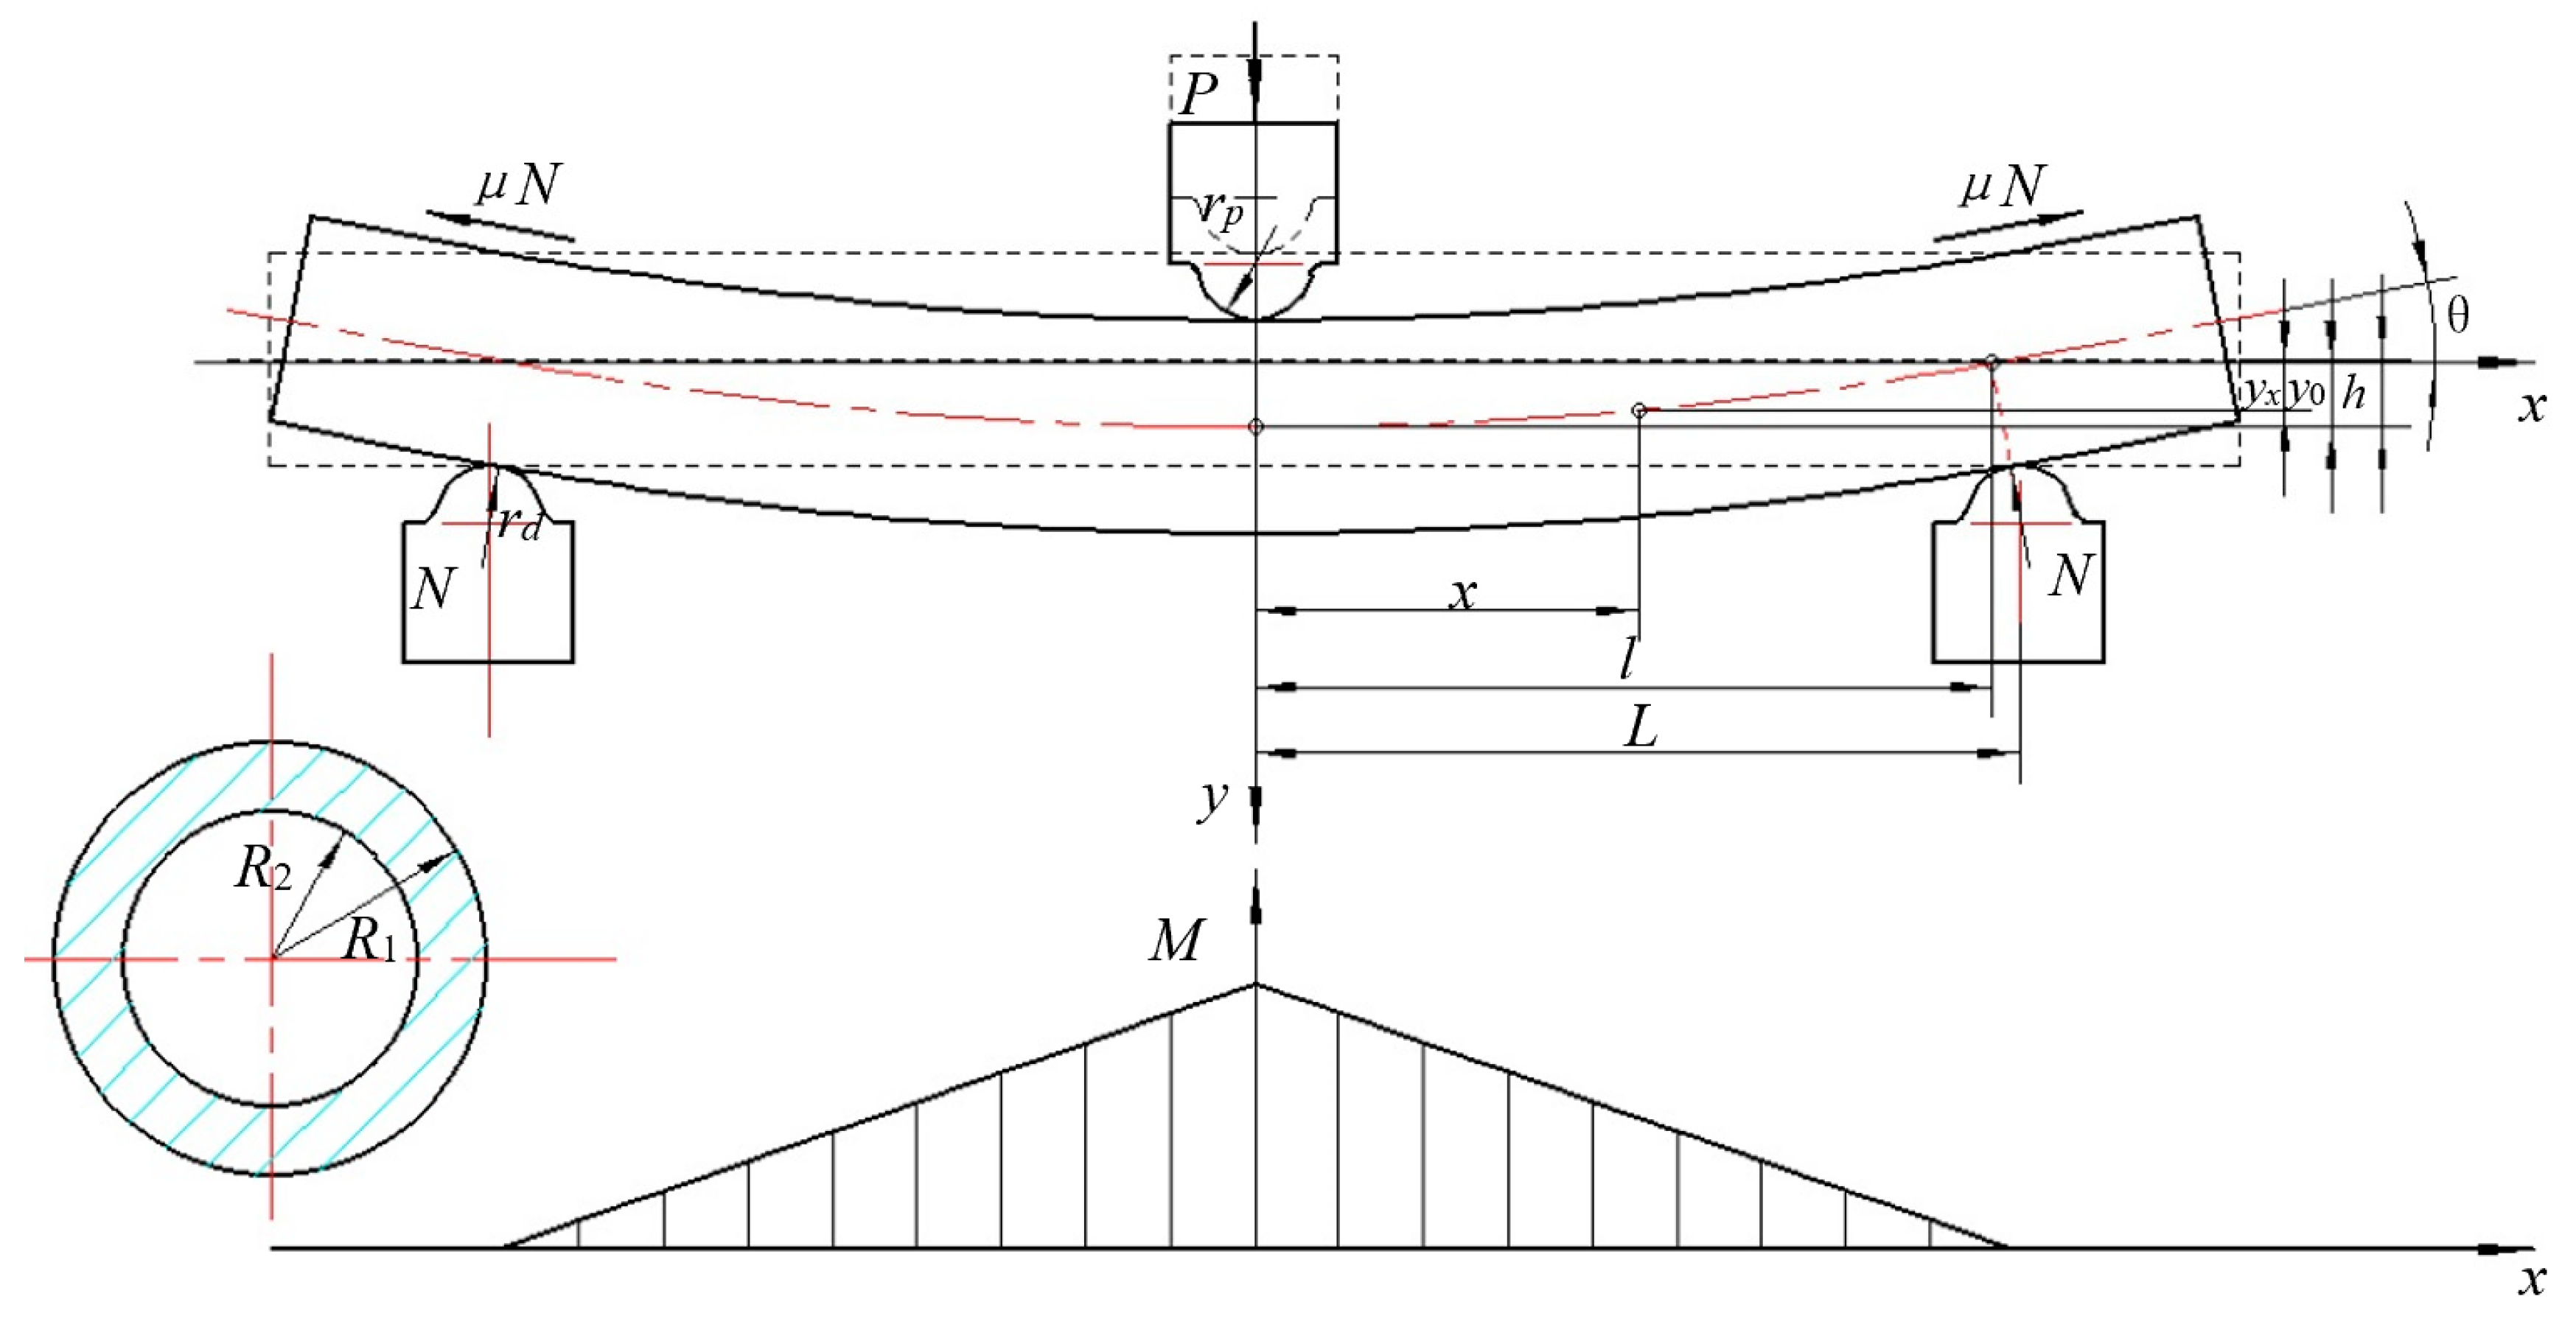
The symmetrical three-point bending mechanical model of pipes is shown in Figure 3.
This is known from the static equilibrium equation and geometric relationships
N = 1 cos θ + μ sin θ P 2
l = L 2 ( r d + R 1 ) sin θ
where P is the punch load; N is the reaction force; θ is the angle at the fulcrum; μ is the friction coefficient; L is half the distance between the two lower molds; l is the x-coordinate at the intersection of the line connecting the fulcrum, the center of the lower mold, and the axis of the pipe; rd is the radius of the lower mold fillet; R1 is the outer radius of the pipe; and R2 is the inner radius of the pipe.
If we define the bending moment of the pipe section at point x as M x , then
M x = N l x 1 cos θ x 0 , l
When the punch stroke is minimal, the pipe’s bending radius is comparatively large, and the stress at the outer diameter’s upper and lower edges remains below the yield limit. This phase is designated as the fully elastic bending stage. As the punch continues to descend, the pipe’s bending radius diminishes, leading to the outer diameter’s upper and lower edges transitioning first into a plastic deformation state, which then gradually propagates towards the pipe’s interior. This phase is referred to as the elastic–plastic bending stage. The bending radius at which the outer diameter’s upper and lower edges initially enter the plastic deformation state is defined as the elastic limit bending radius, ρ lim , expressed as
ρ lim = E R 1 σ s

3. Analysis of Fully Elastic Bending Stage

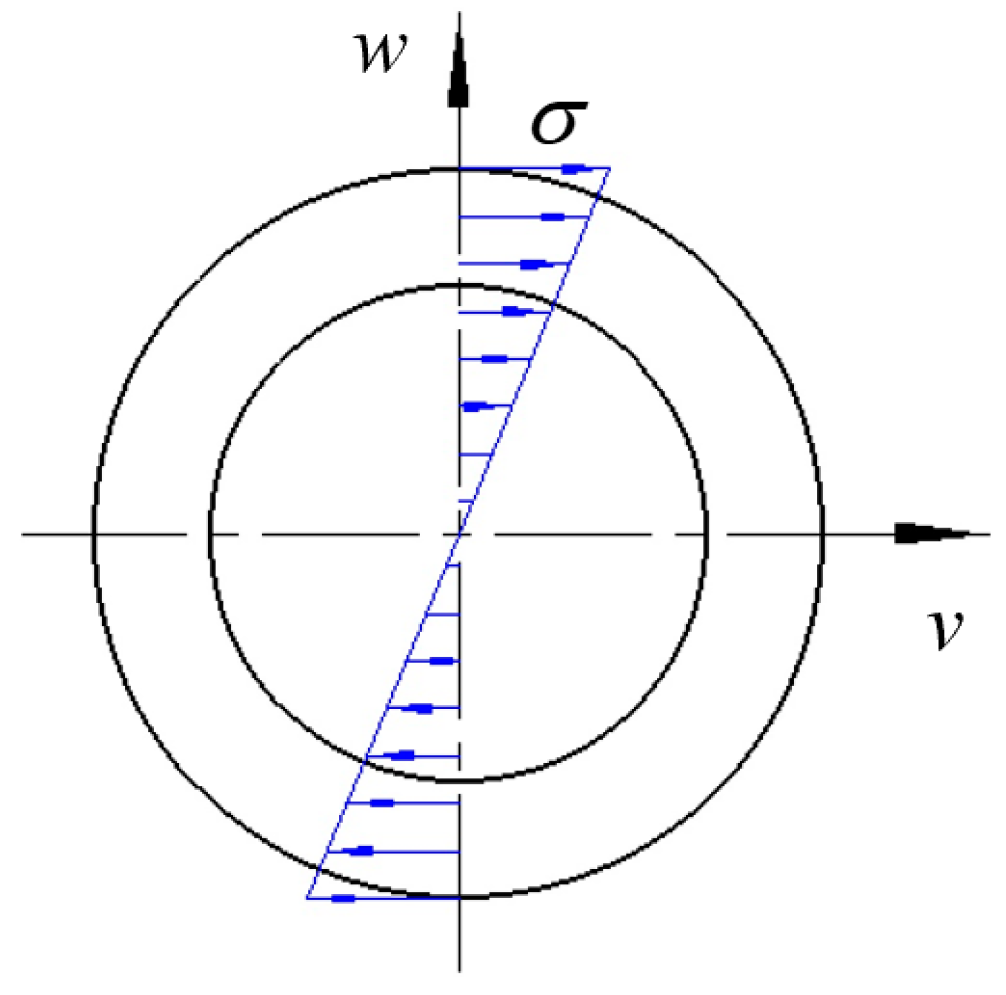
During this phase, every particle within the pipe remains in an elastic state, hence it is termed the fully elastic bending stage. Figure 4 illustrates the stress distribution across the pipe section at a certain distance of x from the origin under load. The stress distribution across the section is linear, and all stresses are below the yield point.
The following equation can be used to calculate the bending moment of the pipe section using the cross-sectional area method
M x = A σ w d A = A E ε w d A = E ρ x A w 2 d A = E I ρ x
By combining this with Equation (6), the bending radius at point x can be obtained
1 ρ x = N l E I cos θ ( 1 x l )
Since the curvature at point x is K x 0 , in the xoy Cartesian coordinate system shown in Figure 2, due to d y d x = tan u and d 2 y d 2 x = 1 cos 2 u d u d x , K x can be inferred
K x = 1 ρ x = cos u d u d x = N l E I cos θ ( 1 x l )
We can solve differential Equation (11) and, based on the boundary condition d y d x x = 0 = 0 , obtain
sin u = N l E I cos θ x 1 x 2 l
Let
g ( x , P ) = N l E I cos θ x 1 x 2 l
From d y d x = tan u , Equation (13) can be concluded that
d y d x = tan u = sin u cos u = g ( x , P ) 1 g 2 ( x , P )
If we define the angle of rotation at point x as α x , then
α x = u = arcsin g ( x , P )
And the absolute value of the rotation angle when x = l is the rotation angle at the fulcrum, which is
θ = α x | x = l = arcsin g ( l , P )
Based on Equation (13) and the boundary condition y x = l = 0 , the deflection at the point x is obtained
y x = l x g ( x , P ) 1 g 2 ( x , P ) d x
The maximum deflection occurs when x = 0 , which is
y 0 = y x | x = 0 = l 0 g ( x , P ) 1 g 2 ( x , P ) d x
In the fully elastic bending stage, the expression for the punch stroke h is
h = y 0 + ( r d + R 1 ) ( 1 cos θ ) = l 0 g ( x , P ) 1 g 2 ( x , P ) d x + ( r d + R 1 ) ( 1 cos θ )
Due to the minimum bending radius of the particle on the axis of the pipe occurring at x = 0 , it can be inferred from Equation (9) that in the fully elastic stage, its expression is
ρ min = E I cos θ N l
When ρ min = ρ lim , the limit of fully elastic deformation is reached. By combining Equations (7), (14), (17) and (18), it can be concluded that at the fully elastic deformation limit of the pipe, the load and punch stroke are
P e = σ s I 1 + cos 2 θ e + μ sin 2 θ e R 1 L / 2 ( r d + R 1 ) sin θ e
h e = 0 l g ( x , P e ) 1 g 2 ( x , P e ) d x + ( r d + R 1 ) ( 1 cos θ e )
where
θ e = arcsin L σ s 2 E R 1 + 2 σ s ( r d + R 1 )
During this bending stage, the particles inside the pipe are in an elastic deformation state, and the pipe is straightened again after the external load is removed.

4. Analysis of Elastic–Plastic Bending Stage

4.1. Analysis of Bending Process

In the region x [ 0 , l ] , x s is the boundary point where the particle enters plastic deformation in the x direction, meaning ρ x x = x s = ρ lim . By combining Equations (7) and (9), we can obtain
x s = l σ s I cos θ N R 1
1.
Elastic–plastic deformation zone
When x 0 , x s , the particle resides within the elastic–plastic deformation zone, and Figure 5 displays the stress distribution across the pipe section at a distance of x from the origin. Given that the extent of plastic deformation penetrating into the inner radius of the pipe directly influences the relationship between the bending moment and the loading curvature, the bending radius at which the upper and lower edges of the inner radius of the pipe section first encounter plastic deformation is defined as the boundary bending radius, ρ d , expressed as
ρ d = E R 2 σ s
The expression of the loading moment during elastic–plastic deformation can be obtained from the section integral
M x = 4 σ 0 ρ x 3 3 R 1 ρ x 2 ε s 2 3 2 + σ 0 ρ x 3 2 2 ε s 2 R 1 ρ x 2 R 1 ρ x 2 ε s 2 + ( E D ) 2 ρ x R 1 4 arcsin ε s ρ x R 1 + π 4 ρ x ( D R 1 4 E R 2 4 ) ρ x ρ d 4 σ 0 ρ x 3 3 R 1 ρ x 2 ε s 2 3 2 R 2 ρ x 2 ε s 2 3 2 + σ 0 ρ x 3 2 2 ε s 2 R 1 ρ x 2 R 1 ρ x 2 ε s 2 2 ε s 2 R 2 ρ x 2 R 2 ρ x 2 ε s 2 + ( E D ) 2 ρ x R 1 4 arcsin ε s ρ x R 1 R 2 4 arcsin ε s ρ x R 2 + π 4 ρ x D ( R 1 4 R 2 4 ) ρ x < ρ d
From the above equation, it can be seen that it is the equation of the bending moment with respect to bending radius, which can be uniformly expressed as
M x = ϕ 1 ρ x
Therefore, it can also be expressed as
1 ρ x = ϕ 1 ( M x ) = cos u d u d x = χ ( x , P )
We can solve differential Equation (27) and, based on the boundary condition d y d x x = 0 = 0 , obtain
sin u = 0 x χ ( x , P )   d x
We can define
η ( x , P ) = 0 x χ ( x , P )   d x
From d y d x = tan u , it can be concluded that
d y d x = tan u = sin u cos u = η ( x , P ) 1 η 2 ( x , P )
then
α x = arcsin η ( x , P )
When x = x s , the rotation angle is
α x | x = x s = arcsin η ( x s , P )
If we let the deflection at x = x s be y x = x s = y s and solve the differential Equation (30), then, when x 0 , x s , the expression for the deflection at the point x is
y x = x s x η ( x , P ) 1 η 2 ( x , P ) d x + y s
2.
Elastic deformation zone
When x x s , l , the particle is in the fully elastic deformation zone, and the solution method is the same as that in the fully elastic bending stage. From the boundary condition α x x = x s = arcsin η ( x s , P ) , we can obtain
sin u = g ( x , P ) g ( x s , P ) + η ( x s , P )
We can define
φ ( x , P ) = g ( x , P ) g ( x s , P ) + η ( x s , P )
Therefore, during the elastic bending stage, the expression for the rotation angle at the fulcrum is
θ = α x | x = l = arcsin φ ( l , P )
From d y d x = tan u and the boundary condition y x = l = 0 , the deflection at the point x ( x x s , l ) can be obtained
y x = l x φ ( x , P ) 1 φ 2 ( x , P ) d x
When x = x s , the deflection y s is
y s = y x | x = x s = l x s φ ( x , P ) 1 φ 2 ( x , P ) d x
By combining Equations (33) and (38), it can be concluded that when x 0 , x s , the deflection expression at the point x is
y x = x s x η ( x , P ) 1 η 2 ( x , P ) d x + l x s φ ( x , P ) 1 φ 2 ( x , P ) d x
When x = 0 , the deflection is
y 0 = y x | x = 0 = x s 0 η ( x , P ) 1 η 2 ( x , P ) d x + l x s φ ( x , P ) 1 φ 2 ( x , P ) d x
Therefore, in the stage of elastic–plastic deformation, the expression for the punch stroke h is
h = x s 0 η ( x , P ) 1 η 2 ( x , P ) d x + l x s φ ( x , P ) 1 φ 2 ( x , P ) d x + ( r d + R 1 ) ( 1 cos θ )

4.2. Analysis of the Springback Process

When x 0 , x s , plastic deformation occurs in the region, and, according to the unloading law, the curvature of the point x after springback is
K x u = K x K x e
due to the elastic deformation bending moment M e = E I K x e and M x = M e . By substituting these into Equation (6) to obtain the expression K x e , and combining Equations (27) and (42), the curvature at the point x after springback can be obtained
K x u = χ ( x , P ) N l E I cos θ ( 1 x l )
By combining the boundary conditions d y d x | x = 0 = 0 and y x u | x = x s = y s u , it can be concluded that the expressions for the angle α x u and deflection y x u after springback at the point x are
α x u = u = arcsin ϕ ( x , P )
y x u = x x s ϕ ( x , P ) 1 ϕ 2 ( x , P ) d x + y s u
where
ϕ ( x , P ) = η ( x , P ) g ( x , P )
When x [ x s , l ] , due to this region being an elastic deformation zone, its springback after removing the external load forms a diagonal line. By combining the boundary conditions α x u | x = x s = arcsin ϕ ( x s , P ) and y x u | x = l = 0 , it can be concluded that the expressions for the angle and deflection after springback at the point x are
α x u = arcsin ϕ ( x s , P )
y x u = ϕ ( x s , P ) 1 ϕ 2 ( x s , P ) ( x l )

5. Experimental Validation

5.1. Material Properties of the Experimental Pipes

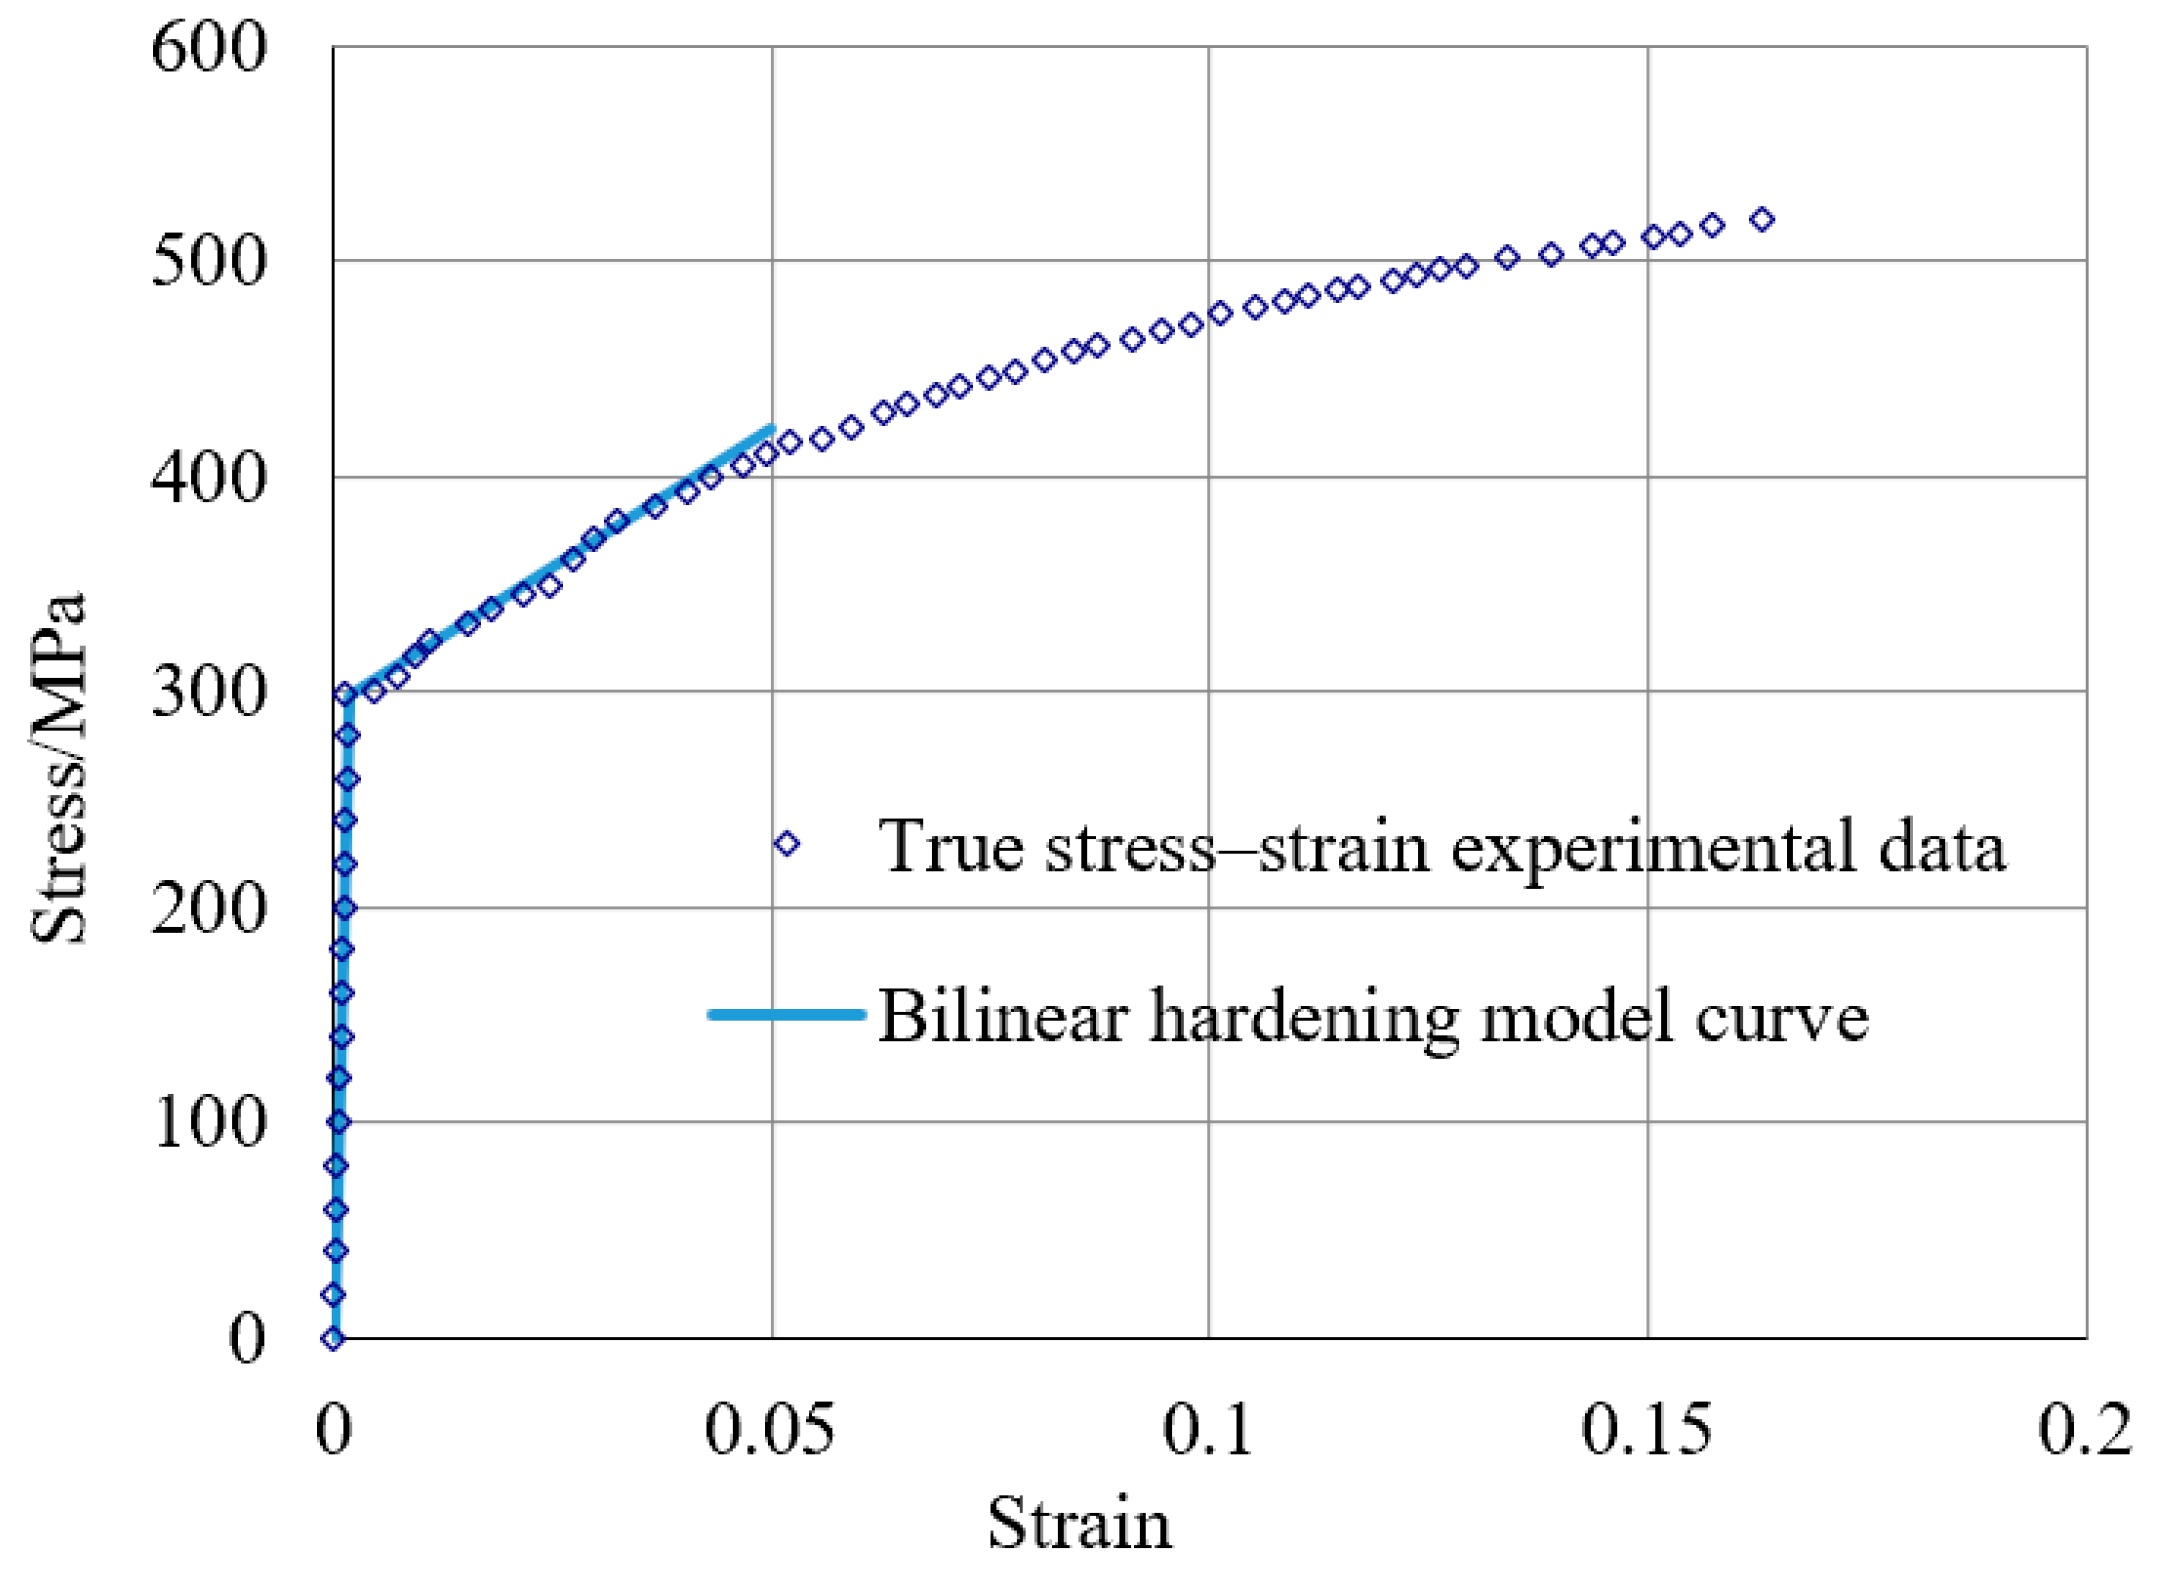
The experimental subject was a 20 steel seamless steel pipe with an outer diameter of 76 mm, a wall thickness of 4 mm, and a length of 1000 mm. To precisely determine the material’s performance parameters, a unidirectional tensile test specimen was fabricated from the steel pipe. The specimen, with a thickness of 2 mm and a gauge width of 10 mm, was machined using the wire electro-discharge machining (EDM) method. Through unidirectional tensile testing, accurate material performance parameters were established for both experimental research and theoretical calculations. A photograph of the specimen is depicted in Figure 6. The uniaxial tensile test results for the material are presented in Figure 7, with the detailed material performance parameters summarized in Table 1.

5.2. Experimental Molds and Equipment

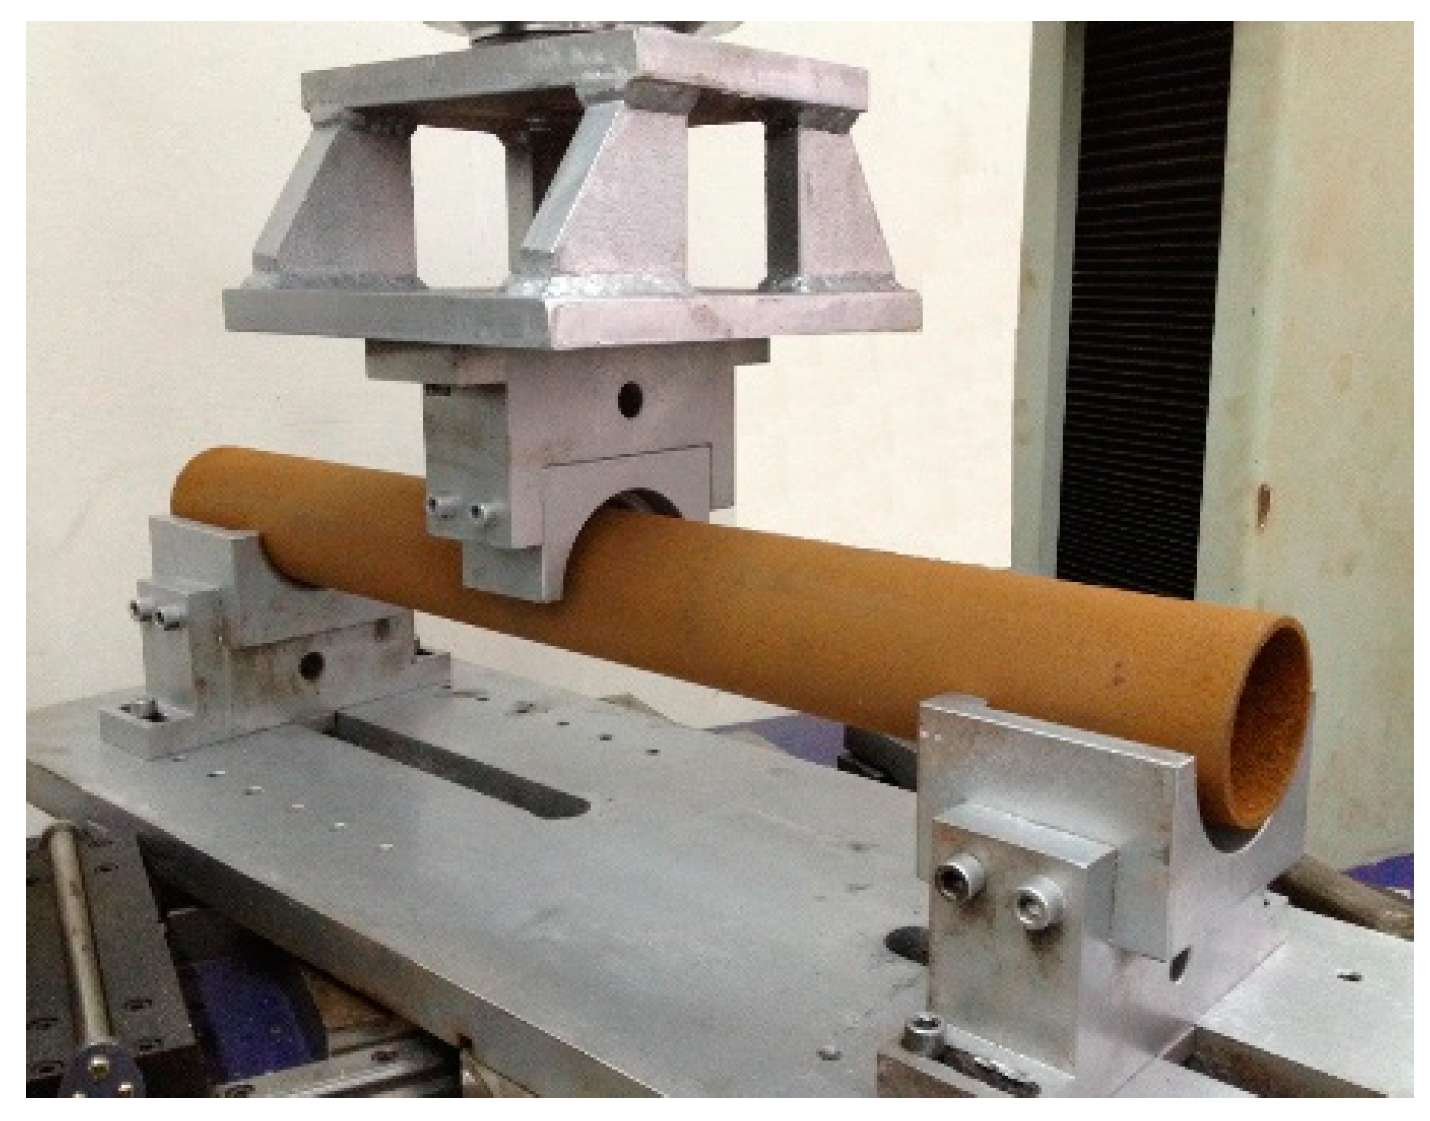
The experimental mold was crafted adhering to the principle of similarity, taking an actual production mold from an enterprise as a reference. The mold’s geometric dimensions were scaled down by a factor of 10, featuring a fillet radius of 8 mm for both the upper and lower molds, and a spacing of 2L = 600 mm between the two lower molds, as depicted in Figure 8. The friction coefficient was taken as the friction between steels during the bending process, μ = 0.12 . The WDD-LCT-150 electronic tension–torsion combination multifunctional testing machine served as the bending apparatus, with a portable coordinate measuring instrument used to assess the pipe’s deflection before and after unloading.

5.3. Finite Element Simulation Model

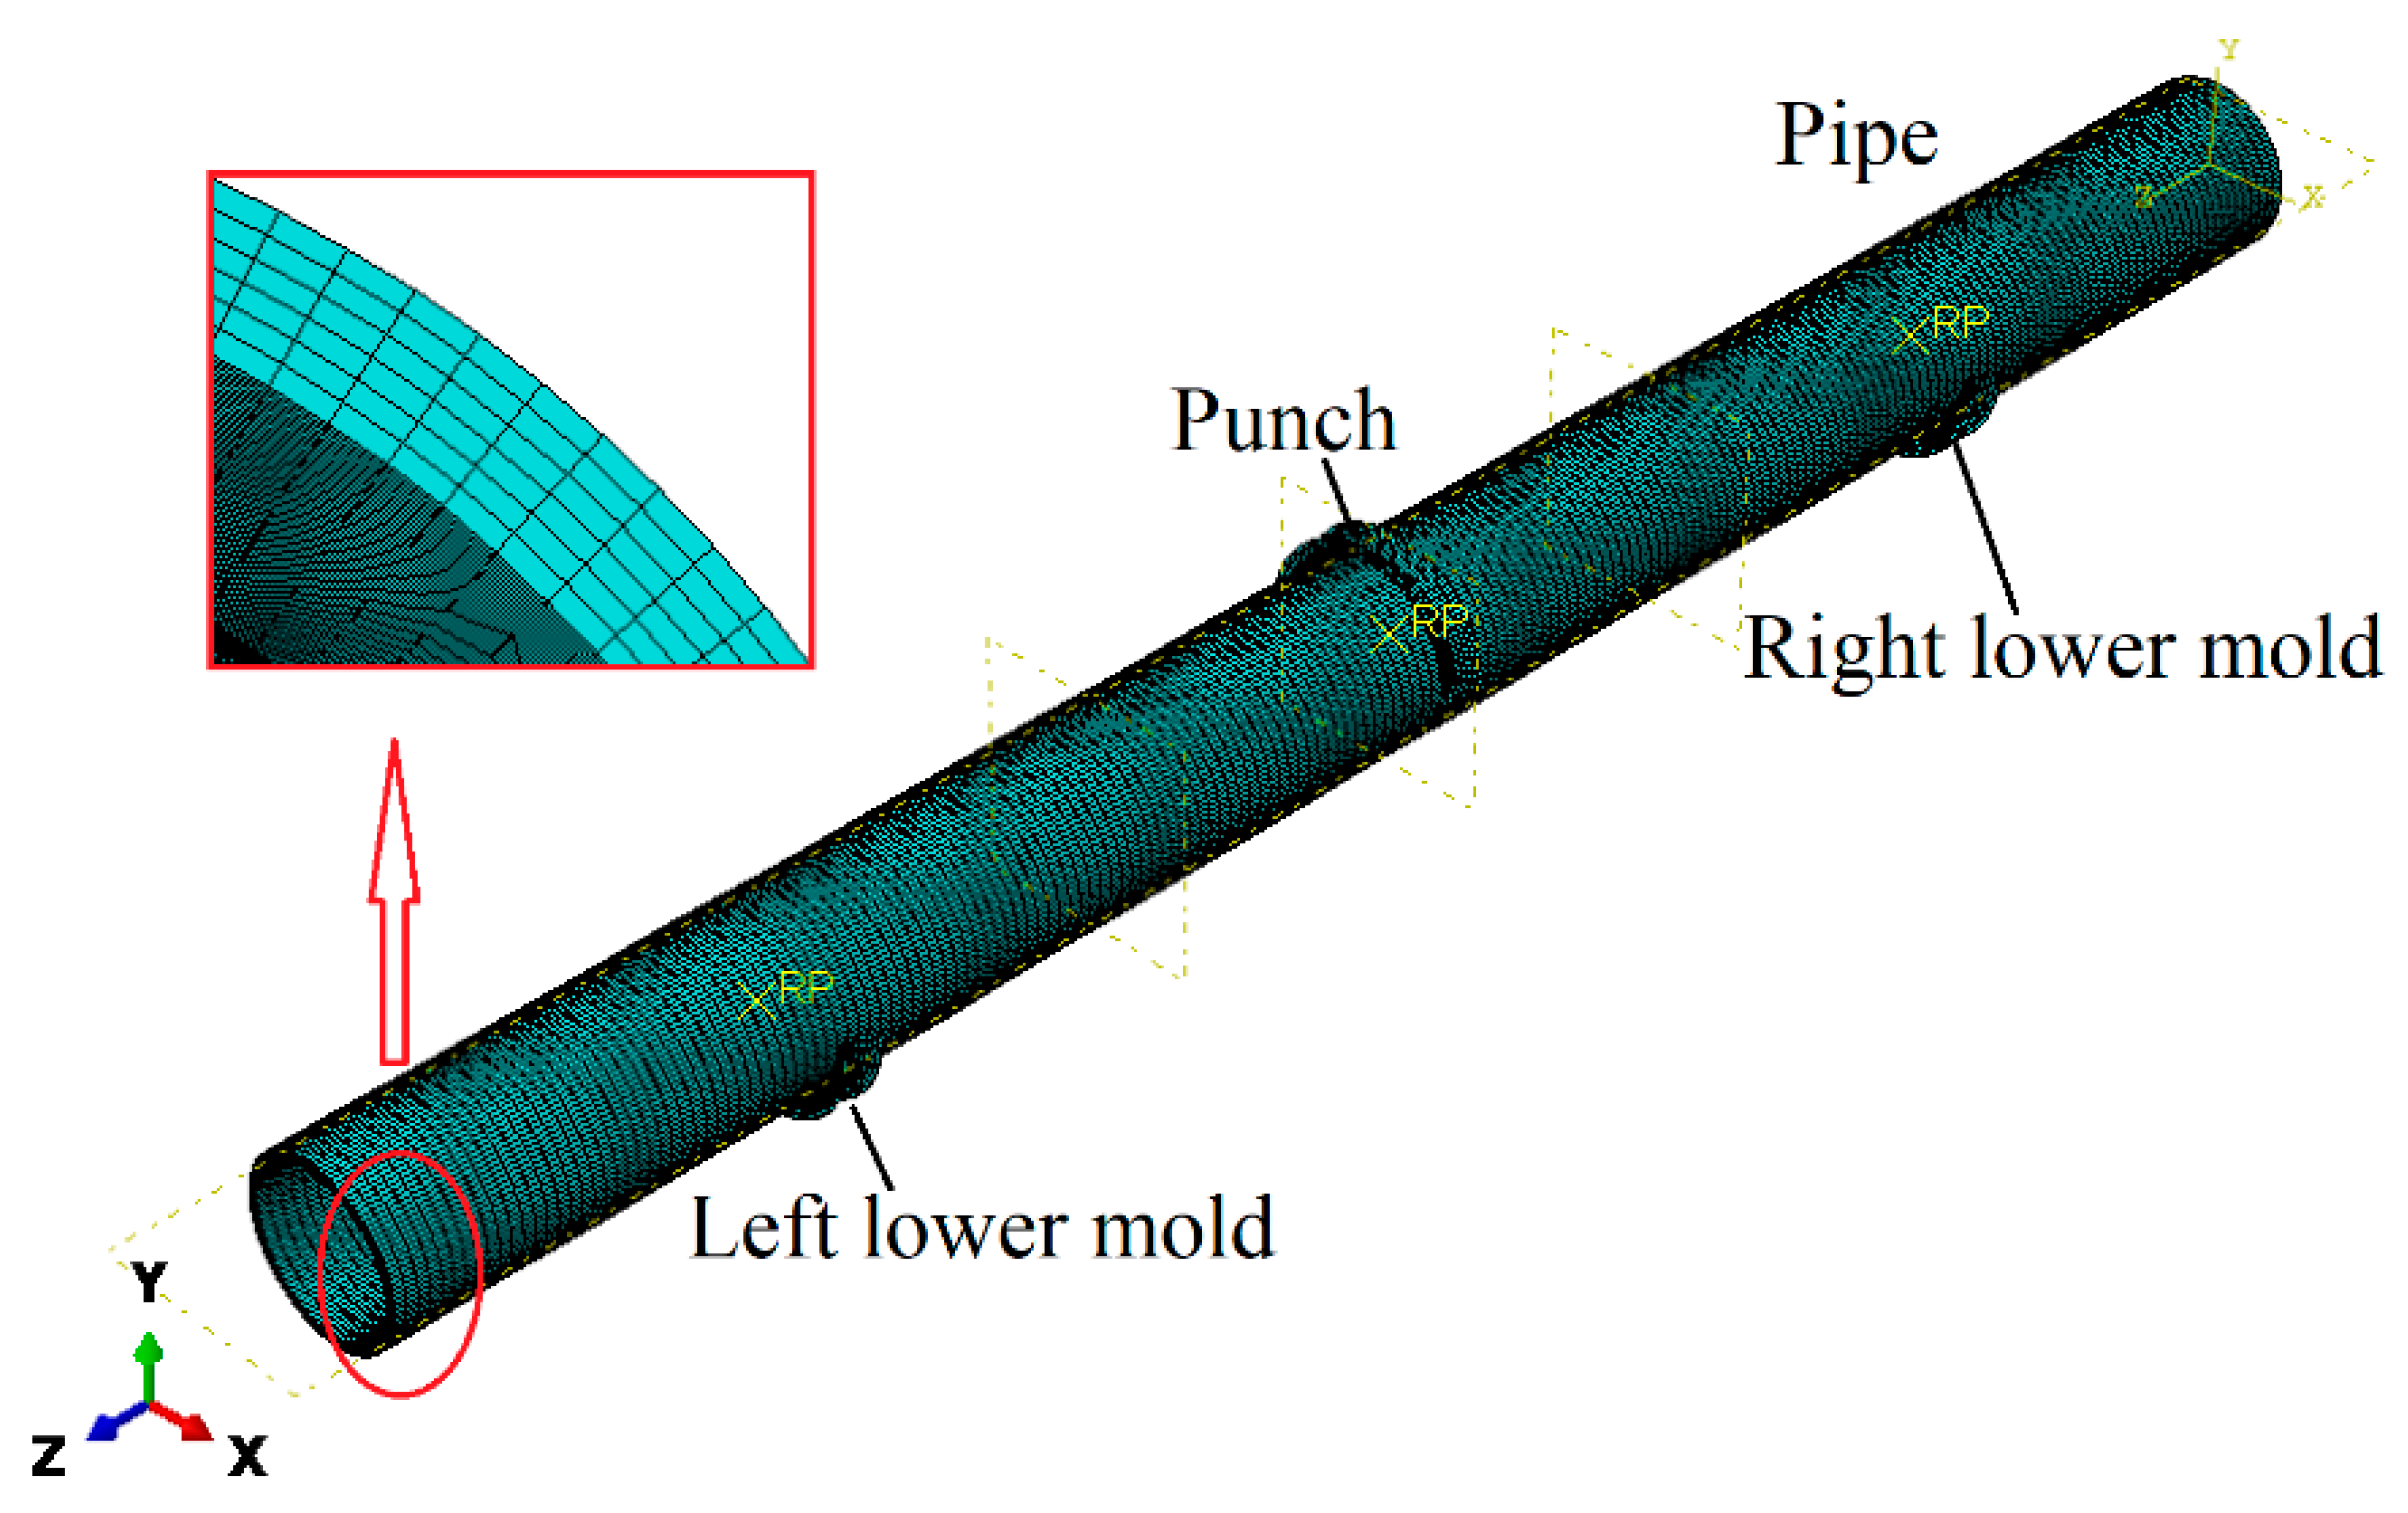
A model was established using the finite element analysis software ABAQUS, as shown in Figure 9. The pipe was considered a deformable body, with additional material property parameters derived from Figure 7 and a Poisson ratio, ν = 0.3. To ensure precision, the element type was specified as 3D solid and incompatible (C3D8I) and divided into 6 layers along the thickness direction, totaling 144,000 elements for the pipe. Both the punch and the lower molds was modeled as discrete rigid bodies. The contact interaction between the pipe and the mold was surface-to-surface, with a friction coefficient of 0.12.

5.4. Results and Discussion

Figure 10 presents the load–stroke curve of the punch. It is evident that the theoretical curve aligns with the experimental and simulation results, exhibiting a small overall error, thus validating the reliability of the theoretical model. The accurate theoretical model can more effectively guide the straightening process and provide precise load or stroke values. In engineering applications, the creation of theoretical models can guide operators to perform precise straightening, thus reducing reliance on the experience of skilled operators and improving straightening efficiency and stability. This model incorporates the effects of mold parameters, material performance parameters, and other factors on pipe forming, aligning with the actual conditions of pipe pressure straightening. Compared with an ideal elastic–plastic model, the bilinear hardening model can more accurately describe the strain hardening effect of pipes during the elastic–plastic stage of the pressure straightening process. According to theoretical analysis, the load–stroke curve encompasses the geometric parameters of the pipes, material performance parameters, and mold parameters. In practical engineering, with known mold parameters and geometric parameters of the pipe to be straightened, if the material performance parameters are unknown, they can be calculated based on the load–stroke experimental data during the straightening process. These calculated parameters can then guide subsequent straightening processes. If the initial material performance parameters of the pipe are known, the system can adjust these parameters in real-time and dynamically modify the straightening load by comparing the real-time-collected load-deflection experimental data with the theoretical curve.
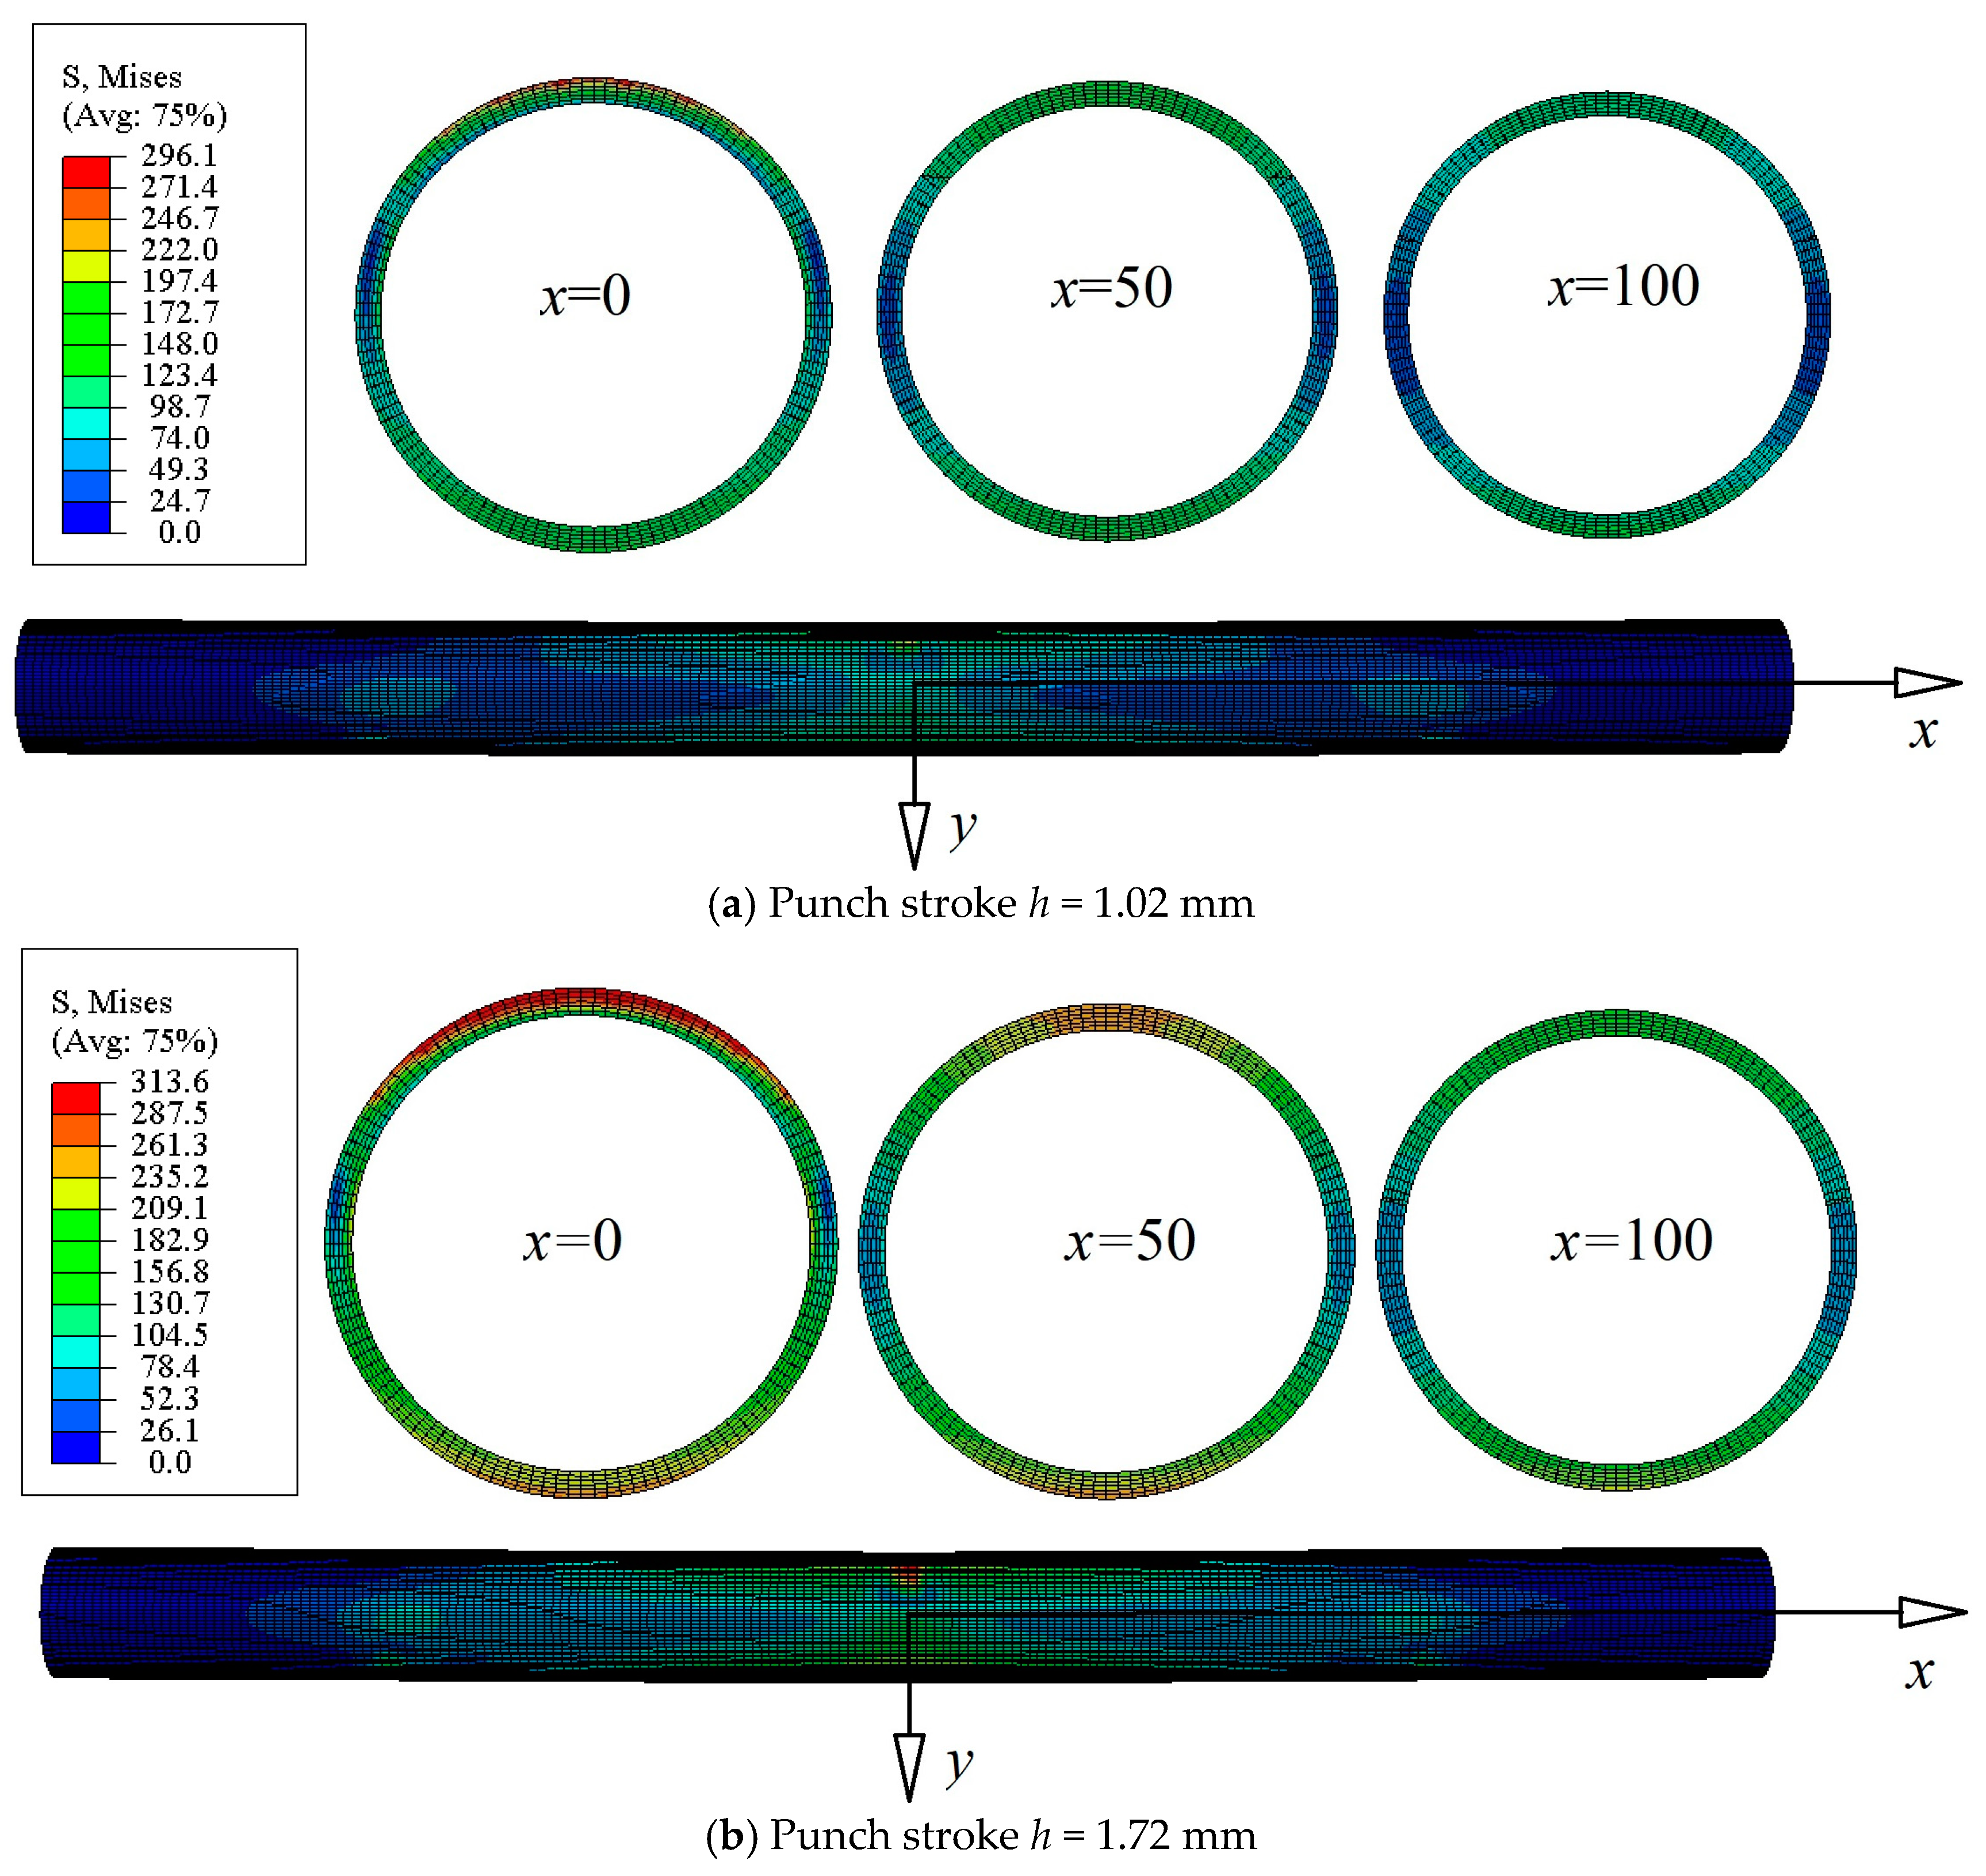
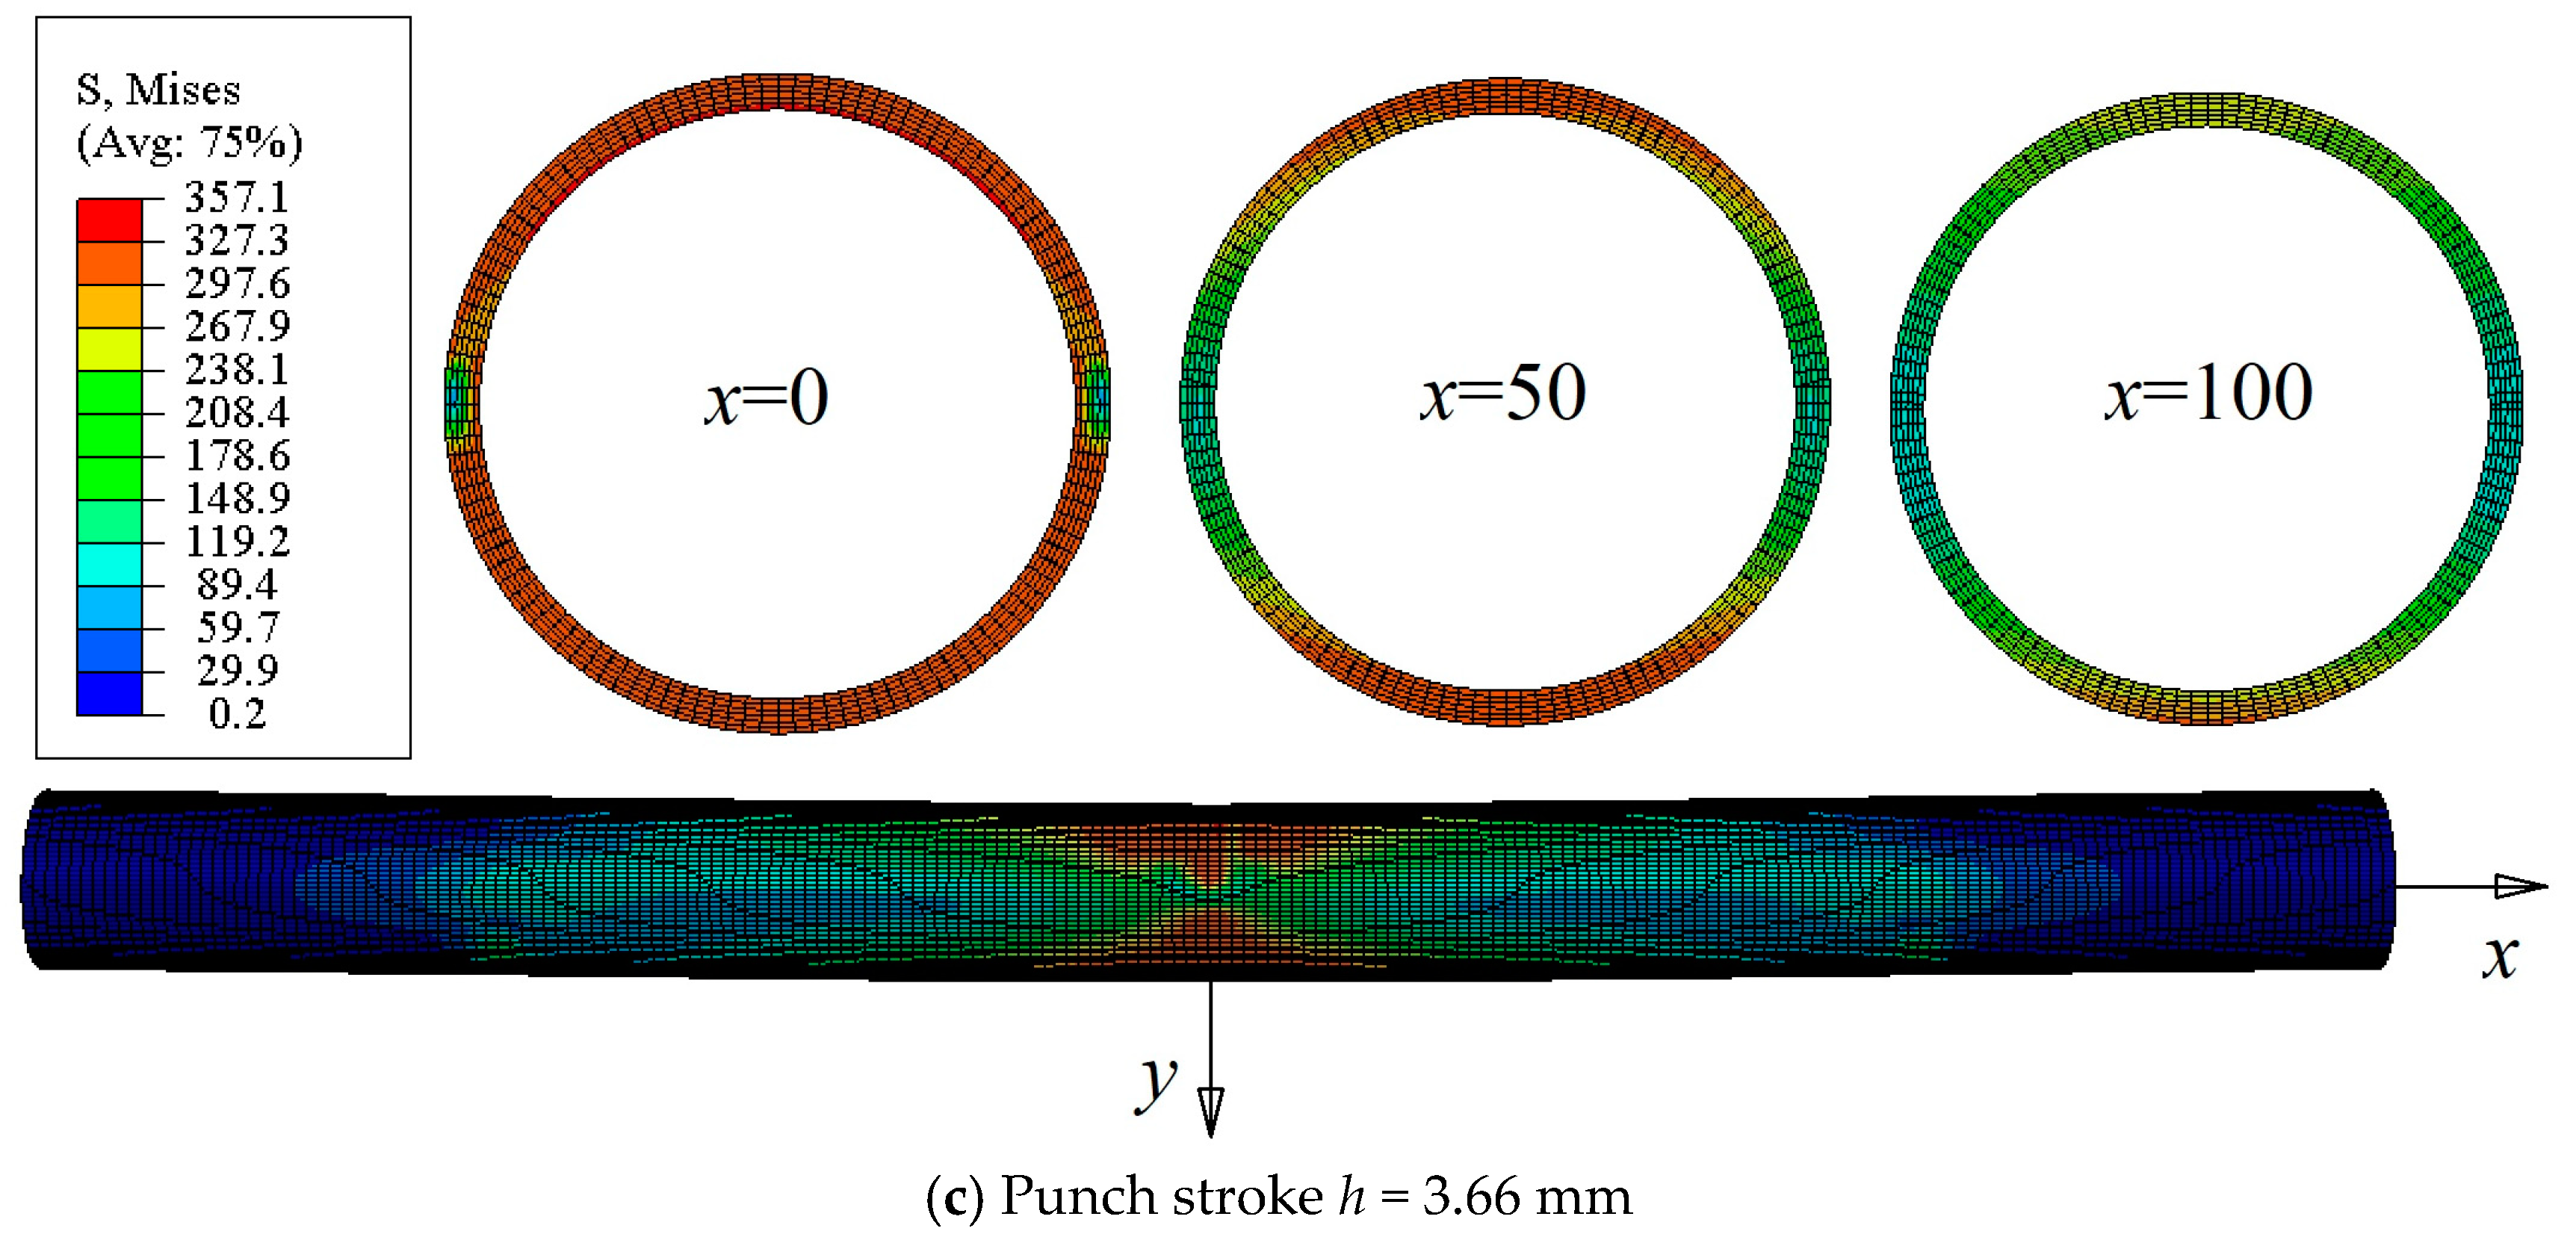
The Mises equivalent stress distribution of the pipe when the punch stroke is 1.05 mm is shown in Figure 11a. The entire pipe undergoes elastic deformation with a maximum equivalent stress of 296.1 MPa. The Mises equivalent stress distribution of the pipe when the punch stroke is 1.72 mm is shown in Figure 11b. The elastic–plastic deformation zone of the pipe is concentrated on both sides of the punch, with the maximum equivalent stress of 313.6 MPa for the pipe being greater than the yield stress of 298.7 MPa. The stress distribution of the pipe section at x = 0 indicates that the pipe’s elastic–plastic deformation has not yet penetrated the inner radius of the pipe. The area of the pipe away from the punch is in elastic deformation. The Mises equivalent stress distribution of the pipe when the punch stroke is 3.66 mm is shown in Figure 11c. It can be observed that the elastic–plastic region of the pipe has increased, and the maximum equivalent stress is 357.1 MPa, as compared to Figure 11b. Furthermore, an examination of the stress distribution of the pipe section at x = 0 reveals that the elastic–plastic deformation has penetrated into the inner radius of the pipe.
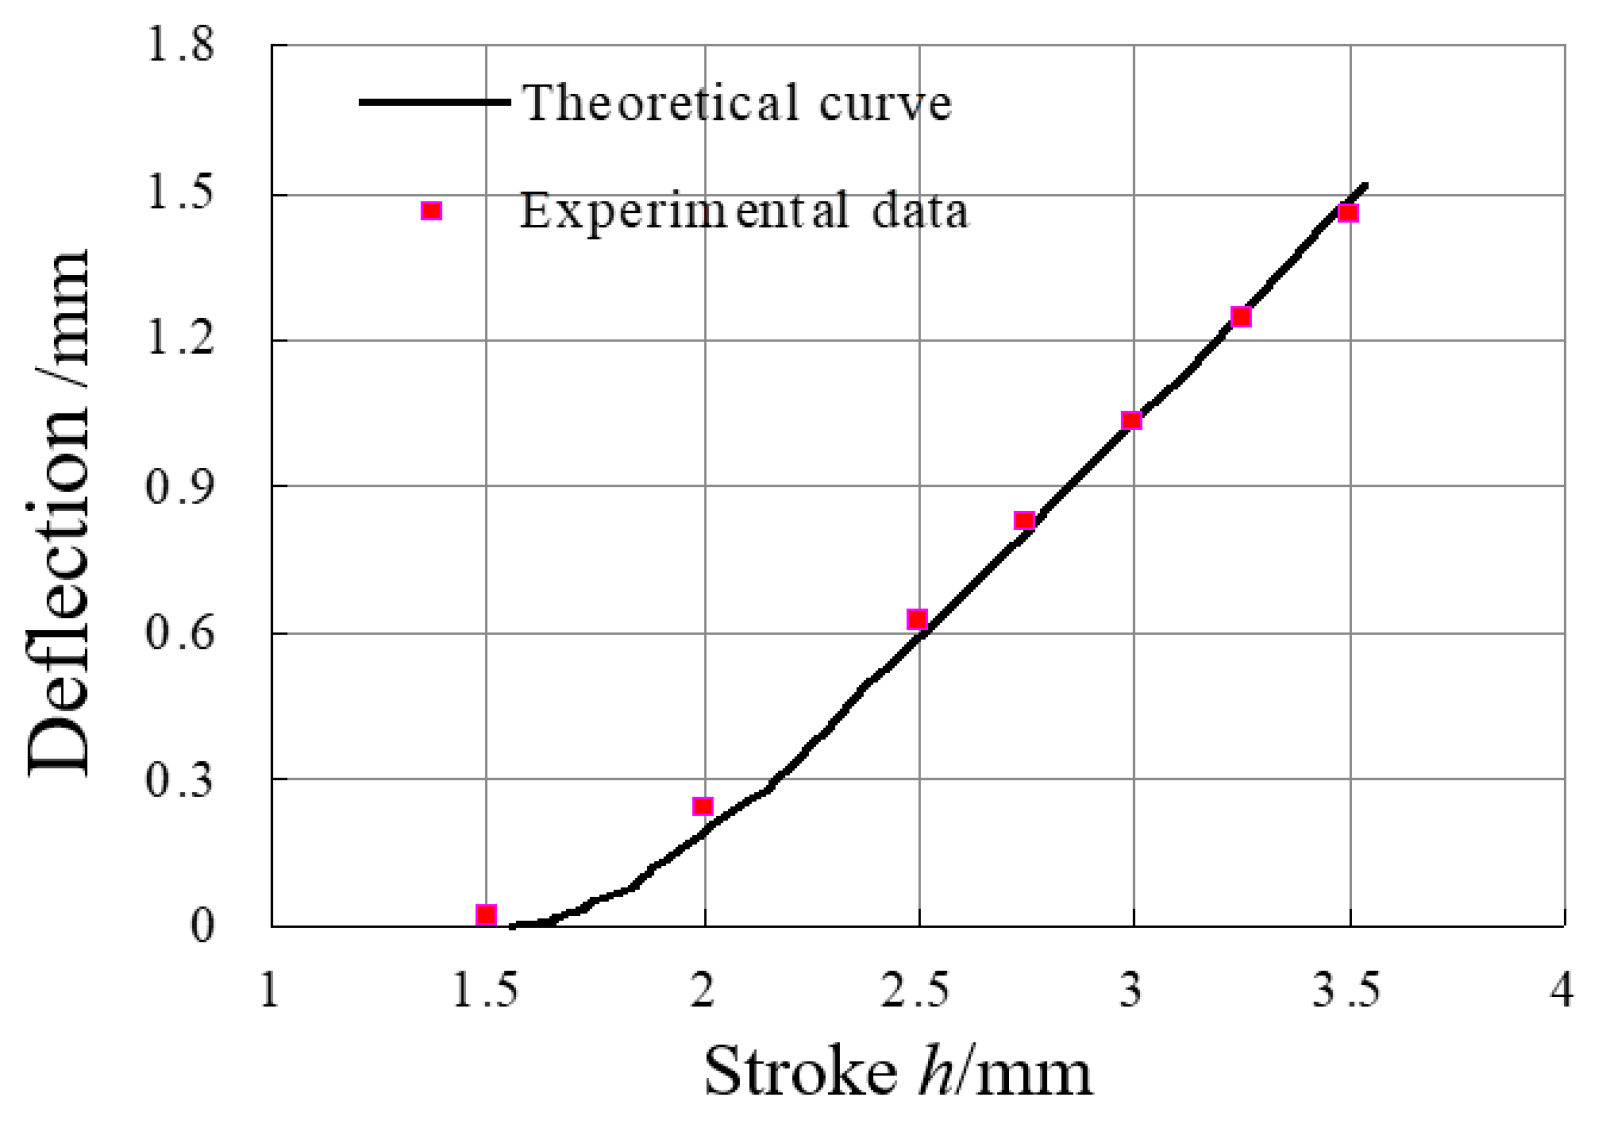
Figure 12 illustrates the relationship between the maximum deflection after springback and the punch stroke. The comparison between the theoretical curve and experimental data demonstrates that the theoretical model for the three-point bending and springback of pipes, established in this paper based on the small-deformation assumption and bilinear hardening material model, is accurate. Furthermore, the figure shows that when the punch stroke is large, both theoretical results and experimental data indicate a very close linear relationship between the maximum deflection after springback and the punch stroke. According to the equivalent principle of over-bending straightening, when the initial maximum deflection of the pipe to be straightened is known, the required stroke for straightening can be determined using this linear relationship. This offers a convenient method for an intelligent control system of the pressure straightening process to identify the springback law.

6. Conclusions

  • Based on the assumption of small deformation, a mechanical model of symmetrical three-point bending and its springback process for pipes was developed using a bilinear hardening material model. This model incorporates the effects of mold parameters, material performance parameters, and other factors on pipe forming, aligning with the actual conditions of pipe pressure straightening.
  • The finite element analysis and physical simulation experiment results of smaller pipes have confirmed the accuracy and reliability of the theoretical model. The establishment of this model not only enhances the accuracy of single-pressure straightening but also provides a theoretical foundation for the online identification of material performance parameters during the straightening process.
  • Theoretical analysis and experimental results both indicate that the relationship between the maximum deflection after springback and the stroke of the indenter is very close to linear, offering a convenient method to establish an intelligent straightening control system for identifying springback laws.

Author Contributions

Conceptualization, X.S. and J.L.; Validation, J.Z.; Investigation, R.M.; Writing—original draft, X.S.; Writing—review and editing, R.M. and J.L.; Supervision, J.Z. and J.L.; Project administration, J.L. All authors have read and agreed to the published version of the manuscript.

Funding

This research received no external funding.

Data Availability Statement

The original contributions presented in this study are included in the article. Further inquiries can be directed to the corresponding author.

Conflicts of Interest

The authors declare no conflict of interest.

References

  1. American Petroleum Institute. ANSI/API Specification 5L, Specification for Line Pipe, 45th ed.; American Petroleum Institute: Washington, DC, USA, 2012. [Google Scholar]
  2. Wang, C.; Yu, G.; Zhao, J.; Liu, W. Pure-Bend and Over-Bend Straightening Theory for In-Plane Curved Beams with Symmetrical Section and Straightening Mechanism Analysis. Metals 2022, 12, 1362. [Google Scholar] [CrossRef]
  3. Ling, H.; Yang, C.; Feng, S.; Lu, H. Predictive model of grinding residual stress for linear guideway considering straightening history. Int. J. Mech. Sci. 2020, 176, 105536. [Google Scholar] [CrossRef]
  4. Kaiser, R.; Hatzenbichler, T.; Buchmayr, B.; Antretter, T. Simulation of the roller straightening process with respect to residual stresses and the curvature trend. Mater. Sci. Forum 2014, 768–769, 456–463. [Google Scholar] [CrossRef]
  5. Zhao, J.; Yin, J.; Ma, R.; Ma, L. Springback equation of small curvature plane bending. Sci. China Technol. Sci. 2011, 54, 2386–2396. [Google Scholar] [CrossRef]
  6. Song, Y. Load-deflection model for T-section rail press straightening process under lateral loads. Clust. Comput. 2018, 22, 2955–2961. [Google Scholar] [CrossRef]
  7. Lu, H.; Zang, Y.; Zhang, X.; Zhang, Y.; Li, L. A General Stroke-Based Model for the Straightening Process of D-Type Shaft. Processes 2020, 8, 528. [Google Scholar] [CrossRef]
  8. Zhang, Y.; Lu, H.; Ling, H.; Lian, Y.; Ma, M. Analytical Model of a Multi-Step Straightening Process for Linear Guideways Considering Neutral Axis Deviation. Symmetry 2018, 10, 316. [Google Scholar] [CrossRef]
  9. Kim, S.-C.; Chung, S.-C. Synthesis of the multi-step straightness control system for shaft straightening processes. Mechatronics 2002, 12, 139–156. [Google Scholar] [CrossRef]
  10. Wang, K.; Wang, B.; Yang, C. Research on the multi-step straightening for the elevator guide rail. Procedia Eng. 2011, 16, 459–466. [Google Scholar] [CrossRef]
  11. Wang, J.; Afshan, S.; Gkantou, M.; Theofanous, M.; Baniotopoulos, C.; Gardner, L. Flexural behaviour of hot-finished high strength steel square and rectangular hollow sections. J. Constr. Steel Res. 2016, 121, 97–109. [Google Scholar] [CrossRef]
  12. Song, F.; Yang, H.; Li, H.; Zhan, M.; Li, G. Springback prediction of thick-walled high-strength titanium tube bending. Chin. J. Aeronaut. 2013, 26, 1336–1345. [Google Scholar] [CrossRef]
  13. Oliveira, M.; Alves, J.; Chaparro, B.; Menezes, L. Study on the influence of work-hardening modeling in springback prediction. Int. J. Plast. 2007, 23, 516–543. [Google Scholar] [CrossRef]
  14. Li, L.; Zhang, C.G. Effects of Heat Treatment Process on Microstructure and Mechanical Properties of X70 Pipeline Steel. Hot Work. Technol. 2025, 54, 64–68. [Google Scholar]
  15. Wang, C.; Zhang, Z.; Zhai, R.; Yu, G.; Zhao, J. Cross-sectional distortion of LSAW pipes in over-bend straightening process. Thin-Walled Struct. 2018, 129, 85–93. [Google Scholar] [CrossRef]
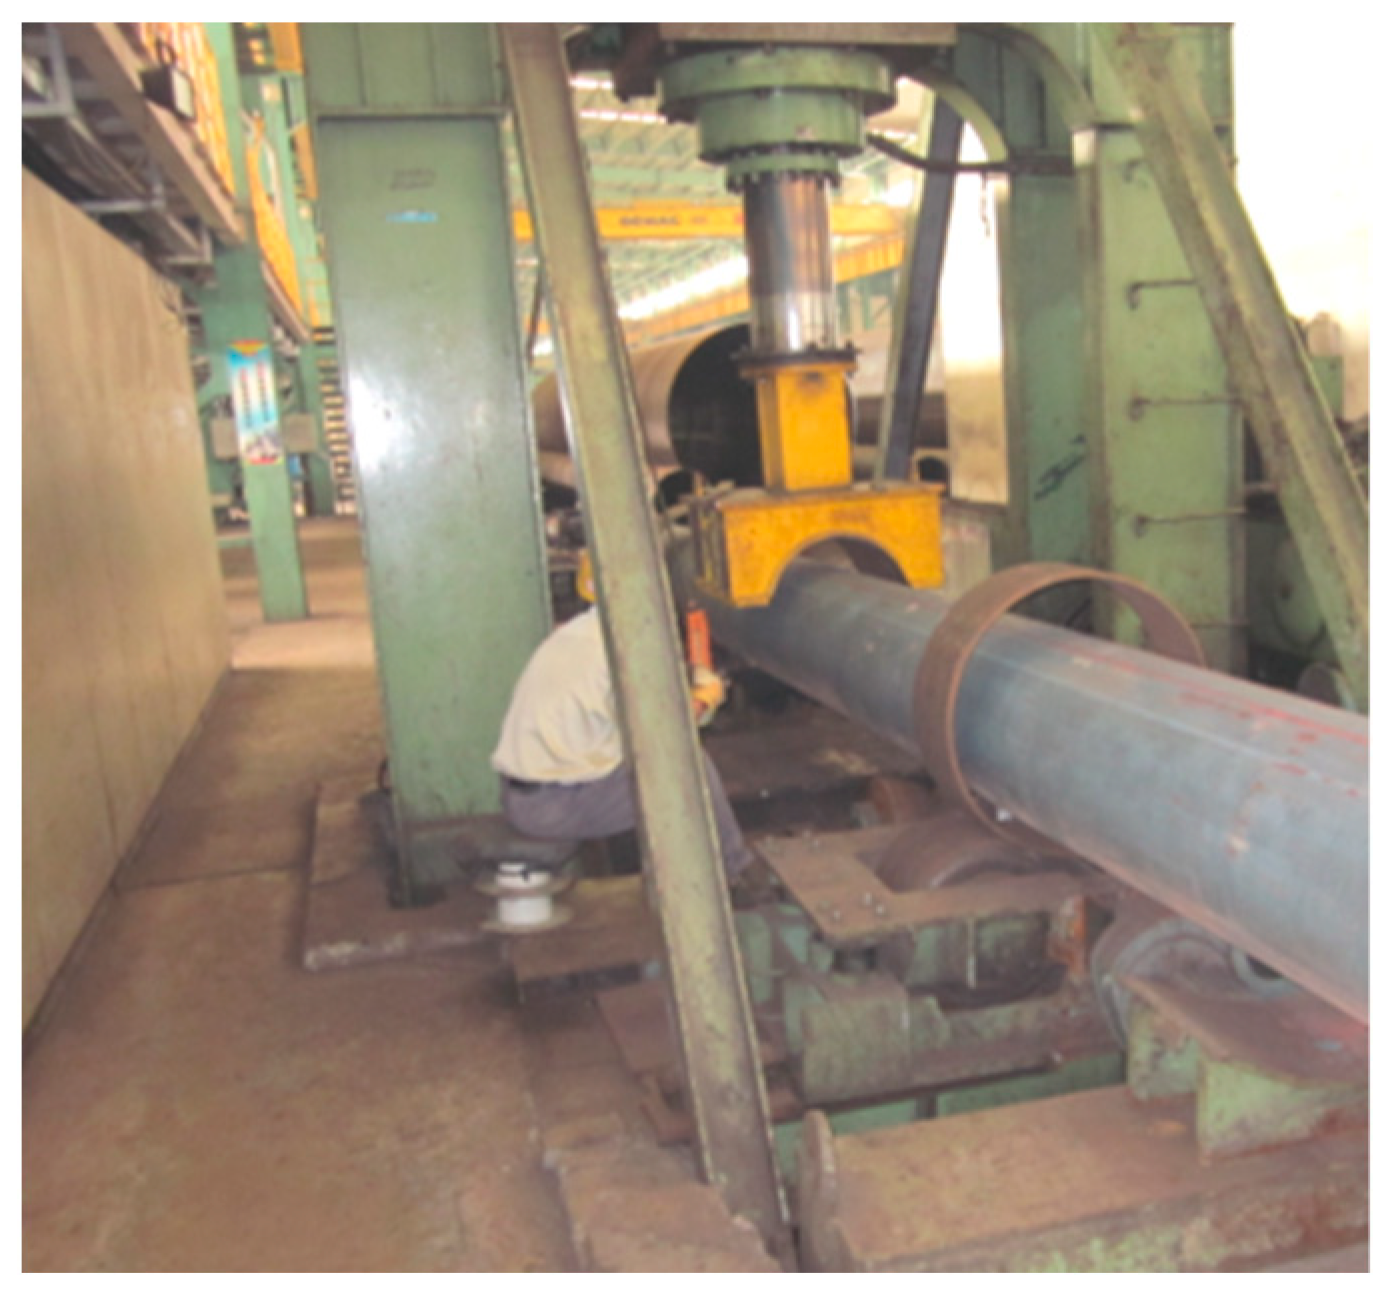
Figure 1. Large straight-seam welded pipe pressure straightening operation site.
Symmetry 17 00095 g001
Figure 2. Unidirectional tensile stress–strain relationship curve of X70 steel.
Symmetry 17 00095 g002
Figure 3. Symmetrical three-point bending mechanical model of pipes.
Symmetry 17 00095 g003
Figure 4. Stress distribution during the fully elastic stage.
Symmetry 17 00095 g004
Figure 5. Stress distribution in elastic–plastic zone.
Symmetry 17 00095 g005
Figure 6. Dimensions of Unidirectional Tensile Test Piece.
Symmetry 17 00095 g006
Figure 7. Unidirectional tensile stress–strain relationship curve of 20 steel.
Symmetry 17 00095 g007
Figure 8. Symmetric three-point bending experimental mold.
Symmetry 17 00095 g008
Figure 9. Finite element simulation model.
Symmetry 17 00095 g009
Figure 10. Load–stroke curve of the punch.
Symmetry 17 00095 g010
Figure 11. Mises stress distribution of pipes.
Symmetry 17 00095 g011aSymmetry 17 00095 g011b
Figure 12. Maximum deflection of the pipe after springback plotted against punch stroke.
Symmetry 17 00095 g012
Table 1. Material performance parameters of experimental pipe.
Pipes GradeE/GPaD/MPa σ s /MPa
201722564298.7
Disclaimer/Publisher’s Note: The statements, opinions and data contained in all publications are solely those of the individual author(s) and contributor(s) and not of MDPI and/or the editor(s). MDPI and/or the editor(s) disclaim responsibility for any injury to people or property resulting from any ideas, methods, instructions or products referred to in the content.