Abstract
As the demand for air transport continues to increase, air traffic congestion in the terminal area is becoming more and more serious. In order to assist the controller in efficiently handling the symmetrical activities of aircraft take-off or landing and alleviate traffic congestion, this paper proposes a method for identifying traffic congestion situations based on complex networks and a multiclass random forest algorithm with symmetrical characteristics. First, the approach points, departure points, waypoints, and navigation stations are used as nodes, the flight paths as edges, and the busyness of the paths as edge weights to construct a traffic network model for the terminal area. On this basis, five congestion situation recognition indicators are selected from the perspective of network topology, and a symmetric multiclass random forest algorithm is proposed to recognize the congestion situation. Finally, this method is compared with the situation recognition method based on the traditional random forest algorithm. The results of the simulation experiment show that compared with the traditional random forest algorithm, the proposed recognition model improves the recognition accuracy by 17.5%, can better handle symmetry information, and can accurately determine the traffic congestion situation in the terminal area.
1. Introduction
With the gradual opening up of low-altitude airspace and the optimization and upgrading of aircraft and of communication, navigation, and surveillance equipment, the demand for global air transport is also growing rapidly. The terminal area is an important area for aircraft to operate and switch between routes and airports. The problem of air traffic congestion is also more serious. To alleviate congestion, it is first necessary to accurately and efficiently identify the overall air traffic congestion situation in the terminal area so as to further formulate congestion mitigation strategies, thereby improving the operational efficiency of the terminal area and adapting to the rapidly growing demand for air transport. Therefore, research on how to accurately and efficiently identify air traffic congestion situations is of great significance in the field of air traffic control.
Traditional methods for identifying air traffic situations are mainly divided into two types: clustering and multifactor comprehensive evaluation. Xu Xiaohao [1] constructed terminal area congestion situation indicators based on changes in the number and speed of aircraft, as well as spatial complexity, and used the fuzzy C mean clustering algorithm to identify the congestion situation in the terminal area. Zhao Yifei [2] constructed an evaluation index of sector congestion from the perspective of flow matching and established a sector operation status diagnosis chart. Yuan Ligang [3] extracted the feature vector of the spatiotemporal changes in traffic flow in the terminal area based on the clustering results of the trajectory spectrum and then used the expectation–maximization clustering algorithm to classify and identify the traffic flow in the terminal area. Wu Minggong [4] used aircraft as nodes and communication links between aircraft as edges to construct a flight situation network and used a multi-attribute decision evaluation method to evaluate the flight situation. Zhao Y [5] established a congestion evaluation index system for different airspace objects and used evidence theory to identify air traffic congestion situations.
In recent years, more scholars have applied machine learning methods to the study of situation recognition. For example, Liu, F [6] proposed an integrated learning algorithm that is conducive to the construction of an air traffic congestion recognition model. Ding S F [7] constructed a fuzzy non-parallel support vector machine (F-NPSVM) model and an interval-valued fuzzy support vector machine (IVF-NPSVM) model and verified that these two methods have higher classification accuracy than the traditional SVM algorithm. Zhu Chengyuan [8] used an SVM algorithm optimized using the sparrow search algorithm (SSA) to identify traffic congestion in rasterized airspace, overcoming the problem of overfitting and improving the accuracy of identification. Yuan Yuan [9,10] proposed a support vector machine algorithm based on a centrally constrained minimum closed ball, which was verified to not only improve the classification accuracy of the algorithm but also improve the training speed and solve the problem of excessive space occupation. Li Guiyi [11] combined the decision tree and k-nearest neighbor learning algorithms using the stacking learning method to obtain an ensemble learning model for air traffic congestion identification.
In summary, it can be seen that with the increasing requirements for situational identification speed and accuracy, it is no longer possible to meet requirements by relying solely on experience or analyzing the air traffic congestion situation from a single perspective. Therefore, in addition to constructing a model that covers all the important elements of the air traffic congestion situation in the terminal area, it is also necessary to find a method that can quickly and accurately identify the congestion situation in order to ensure the safety and efficiency of aircraft operations under the current high flight demand. Therefore, based on a further understanding of the dynamics, complexity, and global nature of the air traffic congestion situation, this paper first uses complex network theory to construct a traffic network model of the terminal area and extract congestion situation recognition indicators from both a structural and operational perspective. After that, the improved multiclass random forest algorithm is used to identify the overall traffic congestion situation in the terminal area, providing new ideas for solving the problem of identifying traffic congestion situations in the terminal area.
2. Modeling of Air Traffic Congestion Situation in the Terminal Area Based on Complex Networks
2.1. Analysis of the Traffic Congestion Situation in the Terminal Area
An air traffic congestion situation refers to the phenomenon of flight delays and increased airspace traffic complexity caused by the flow of aircraft exceeding the capacity of the airspace within a certain time and space.
A terminal area is a control area [12] located at the confluence of air traffic service airways near two or more airports. As shown in Figure 1, the terminal area contains three airports. A is the approach point, D is the departure point, and the remaining points are waypoints, important navigation stations, and instrument approach fixes (IAFs). M is the holding pattern. The solid lines in the figure indicate the approach routes for aircraft, and the dashed lines indicate the departure routes.
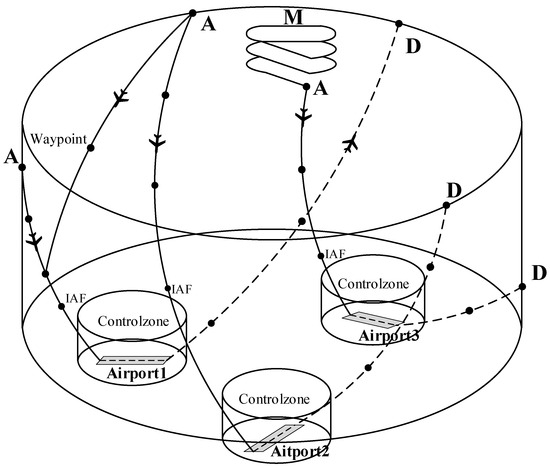
Figure 1.
Terminal area structure diagram.
The terminal area is an important area for aircraft to operate and switch between air routes and airports. Its air traffic congestion situation has three characteristics:
- First, it is complex. There are a large number of arrival and departure points, waypoints, flight paths, etc., in a large terminal area, and the flight path planning and intersection settings for aircraft flying in and out of different airports are also complicated.
- Second, it is dynamic in nature. The adjustment of aircraft speed during operation, changes in flight altitude, path deviations, and the complex spatiotemporal interdependence between different flight segments cause the congestion situation to be highly dynamic over a short period of time.
- Third, it is global in nature. The terminal area is a large airspace set up to guide multiple aircraft in and out of different airports in an orderly manner. The mutual influence of each aircraft constitutes the congestion situation in the entire terminal area. Therefore, when analyzing it, we must not only focus on the microscopic perspective but also grasp it from a global perspective.
Compared with the traditional analysis method based on the local characteristics of the terminal area, complex networks can better abstract the various complex elements that are interrelated within the terminal area, turning them into nodes and edges in its network, and identify the overall traffic congestion situation in the terminal area from a global perspective. Therefore, it is appropriate to use complex network theory to analyze the traffic congestion situation in the terminal area from a network structure perspective.
2.2. Definition of Nodes and Edges
2.2.1. Physical Significance
Through the above analysis, combined with the large-scale background of the terminal area, the airport, holding pattern, approach and departure points, waypoints, and important navigation stations are now abstracted as nodes in a complex network. The flight route of the aircraft between each node is abstracted as weighted directed edges in the complex network, edges, where the direction represents the approach or departure direction, and the weight is determined by the degree of busyness. Finally, a weighted directed network model of the terminal area’s traffic congestion situation can be obtained, as shown in Figure 2. M is the holding pattern, A is the approach point, and D is the departure point.
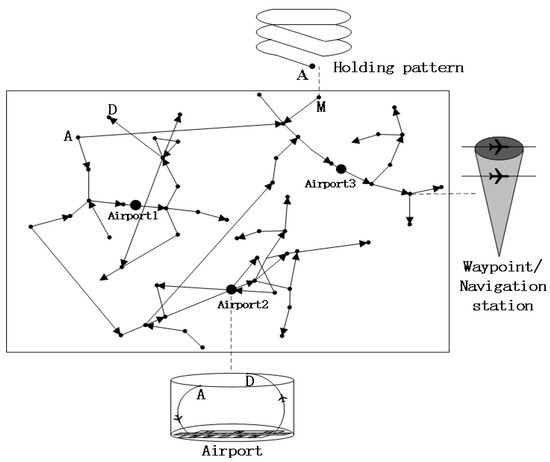
Figure 2.
Weighted directed network diagram of a terminal area traffic congestion situation.
2.2.2. Edge-Weight Setting
- Extraction of busyness (edge weight) recognition indicators;
According to the analysis of the traffic congestion situation in the terminal area in Section 1, it is first necessary to extract indicators at the micro level that can assess the busyness of each connected edge in the terminal area [13,14,15], and determine the edge weight according to the busyness. The fundamental reason for the poor operation and situation in the terminal area is the mismatch between airspace capacity and flight traffic demand. Combining the operating characteristics of the terminal area, indicators that can be extracted at the micro level to identify the busyness of each connected edge in the terminal area are density and flow; length is measured in kilometers, time in minutes.
Density : the ratio of the number of aircraft with “following” properties in the connected area to the length of the connected area during the period from to ; the greater the ratio, the greater the density. The effect of the distance of the nose of the aircraft on the density is also considered. The greater the distance of the nose, the lower the density:
represents the length of the connecting edge, dividing the time period to into m unit moments. is the number of aircraft on the connecting edge at the th unit moment, is the spacing between the noses of aircraft and on the connecting edge with the “follow” property at the th unit moment. The density of an edge with only one aircraft is usually lower than that of an edge with multiple aircraft, so it can be set to a larger fixed value for comparison purposes. is a parameter that controls the weight. The larger the value, the more significant the effect of aircraft spacing on density.
Flow ratio : the ratio of the flow rate over a period of time to the historical average flow rate over the same period of time; the larger the value, the heavier the traffic during that time period, which will increase the busyness of the edges.
represents the number of aircraft that passed along edge during the period from to , and represents the average flow along the same edge during the same period of history.
- Busyness (edge weight) recognition;
The density and flow ratio are normalized by scaling the values to the range [0, 1]:
After that, the busyness of each edge is calculated comprehensively, and the busyness level and edge weight are set according to the historical flow data of the terminal area and expert opinions:
3. Extraction of Indicators for Recognizing Traffic Congestion Situations in the Terminal Area
The weight of an edge is determined by the degree of its busyness, which can reflect the congestion of the edge from a microscopic perspective. However, in order to assess the overall air traffic congestion situation in the terminal area, it is also necessary to combine it with the identification of congestion situation indicators from a global perspective. For the entire terminal area, the air traffic congestion situation is mainly affected by the following factors: first, the length of the approach and departure paths; second, the size and balance of flight traffic; and third, the density and operational efficiency of the edges. Therefore, the topological structure indicators of the complex network can be extracted from these perspectives to comprehensively reflect the air traffic congestion situation in the terminal area [16,17,18], as follows:
- Average path length ;
Divided into the average path length for approaches and the average path length for departures; the average path length for approaches indicates the average of the number of edges with a non-zero weight contained in all paths from the approach point or holding pattern to the airport; the average path length for departures indicates the average of the number of edges with a non-zero weight contained in all paths from the airport to the departure point. This indicator can to some extent reflect the complexity of flight paths and the pressure of air traffic control:
Among them, is the set of all paths from the approach point or holding pattern to the airport, is the set of all paths from the airport to the departure point, is the total number of approach paths, is the total number of departure paths, and represents the length of path , that is, the number of edges the path has.
- Average point strength ;
The average of the sum of the edge weights (edge weights) of the edges between each node and its adjacent nodes. The higher the degree of congestion, the greater the weight and the greater the average degree of congestion of the nodes in the network:
where is the total number of nodes in the network, is the weight of the edge connecting nodes and , and is the set of all neighbor nodes connected to node .
- Degree distribution ;
It is divided into the weighted in-degree distribution and the weighted out-degree distribution , which reflect the distribution of the number of edges received by nodes in the network and the number of edges sent from nodes, respectively. This makes it possible to analyze the distribution of flows within the terminal area and the balance of inbound and outbound flows:
where is the total number of nodes in the network, is the number of nodes with weighted in-degree , the weighted in-degree of node , represents the set of all neighbor nodes pointing to node , represents the weight of the edge from node to node , is the number of nodes with weighted out-degree , the weighted out-degree of node , is the set of all neighbor nodes pointing from node , and is the weight of the edge from node to node .
- Network density ;
This represents the ratio between the actual number of edges in the network and the maximum possible number of edges. A higher network density indicates that edges in the network are denser and that the congestion situation is more complex:
where represents the actual number of edges in the network, represents the weight of each edge, is the number of nodes in the network, and is the maximum possible number of edges in a directed network in the terminal area (nodes cannot be connected to themselves).
- Network efficiency ;
This is used to measure the efficiency of traffic flow between nodes and is determined by the average of the weighted shortest paths between nodes. If there is no edge between two nodes, it is not included in the calculation:
Among them, is the set of node pairs for all entry paths, and is the set of node pairs for all exit paths. is the number of approach node pairs, is the number of departure node pairs, is the weighted shortest path length from node to node for an approach node, and is the weighted shortest path length from node to node for an departure node.
4. Terminal Area Traffic Congestion Situation Recognition Method
4.1. Multiclass Random Forest Algorithm
Random forests are a machine learning method developed by Leo Breiman in 2001 [19]. The principle of this method is to first train multiple decision trees to split the feature values of the sample and ensure that the sample purity of each node after the split is as high as possible. Then, the trained multiple decision trees are combined to form a forest, and the final classification result of each test sample is determined by voting. The random forest algorithm can not only handle high-dimensional data but also does not require a linear relationship between data features, so it is suitable for macroscopically identifying traffic congestion situations in the terminal area based on multiple indicators.
The traditional random forest algorithm is a binary classification model in which the selection and splitting of features at each node is random, and only one split point is selected for splitting. Although this approach ensures the diversity of individual decision tree types, it also leads to the possibility that each tree’s classification performance may be poor, and a large number of decision trees need to be constructed to enhance the overall performance of the model.
Therefore, in order to achieve better classification results, in this manuscript, we changed the dichotomous splitting characteristic of traditional random forests to multi-splitting. The main principle is to improve the decision tree from only dividing a feature into two intervals at each node to dividing it into two or more intervals, and to use Gini impurity to select the optimal combination of split points and splitting features, thereby changing dichotomous splitting to multi-splitting. The traditional random forest algorithm only splits random features once, which may result in the purity of the samples in the two intervals after the split being very low and, continuing with subsequent splits, may also ultimately fail to achieve the desired purity, resulting in poor performance of the decision tree. However, training a model using the proposed symmetrical multiclass random forest algorithm can greatly reduce the randomness of the splits, thereby improving the classification performance of the tree while retaining a certain diversity of the decision tree, ensuring the accuracy of the results.
- Construct the feature matrix and the label vector that characterize the traffic congestion situation in the terminal area:
Among them, , , , , and are the indicators for identifying traffic congestion situations in the terminal area extracted in Section 2.1, indicates different time periods, and indicates the classification of the situation.
- Construct a single decision tree model;
First, the eigenvalues of all the samples are arranged in ascending order, and candidate split points are selected for each eigenvalue at certain intervals. Then, for each node of the tree, several features are randomly selected first, and then several groups of split points are randomly selected among the candidate split points of these features. The samples are divided into different intervals based on the eigenvalues of each group of split points. After that, the optimal combination of split points is selected by calculating the Gini impurity of each interval, and the weighted Gini impurity after this set of split points is calculated as the Gini impurity of this feature:
where is an interval, is the number of categories, and , which indicates the ratio of the sample size of category to the total sample size . is a characteristic, is the number of intervals under this characteristic, and indicates the number of samples in interval .
Finally, by comparing the Gini impurity of each feature, the feature to be split by the node is selected, and the branches of the node are created based on the previously selected optimal split point combination of the feature. The main process of constructing the decision tree is shown in Figure 3. The entire decision tree construction process uses the symmetrical principle to ensure that the selection of the optimal split feature and each optimal split point is fair and reasonable.
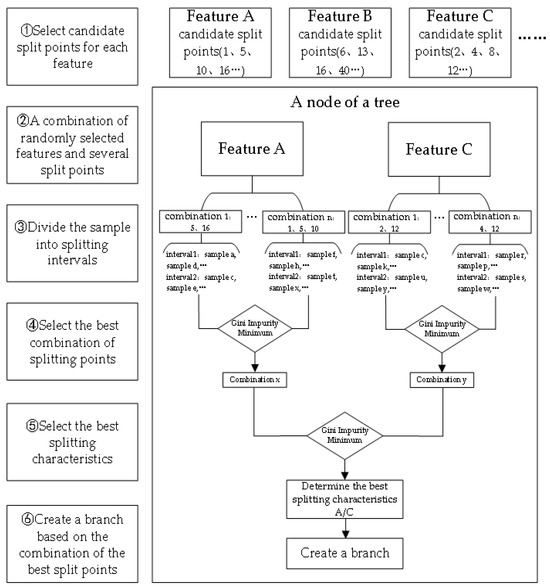
Figure 3.
Main process of constructing a decision tree.
- Construct a random forest;
A random forest is set up that contains several decision trees. Each decision tree recognizes the congestion situation in the terminal area and outputs the final classification result through a voting mechanism:
where is the judgment of each tree on the congestion situation in the terminal area, and is the final classification result of the congestion situation.
4.2. Congestion Situation Recognition Process
- Data collection and collation: collect and collate data on the position of each node in the terminal area and the connecting edges, as well as the position, altitude, heading, etc., of aircraft over a period of time.
- Calculate the busyness of the connecting edges (edge weights). Calculate the busyness of each connecting edge based on the aircraft location information at different times and convert the busyness into edge weights.
- Calculate the terminal area congestion situation recognition index. Calculate the overall terminal area congestion situation recognition index for each period based on the edge weights obtained in step 2.
- Recognize the overall terminal area traffic congestion situation. Use the random forest algorithm to recognize the overall terminal area traffic congestion situation and compare it with the actual congestion situation assessed by experts.
5. Simulation Analysis
5.1. Data Collection and Calculation of Busyness (Side Weight)
In this paper, we used the airspace structure and operation of Beijing’s terminal area (including the three airports ZBAA, ZBAD, and ZBTJ) as an example for empirical analysis. A traffic network model of the terminal area is constructed using Python, as shown in the Figure 4. The blue nodes are airports, the terminal area edge nodes are arrival and departure points, and the remaining nodes are waypoints or navigation stations. The connecting edges are the approximate historical flight paths of each aircraft under radar control.
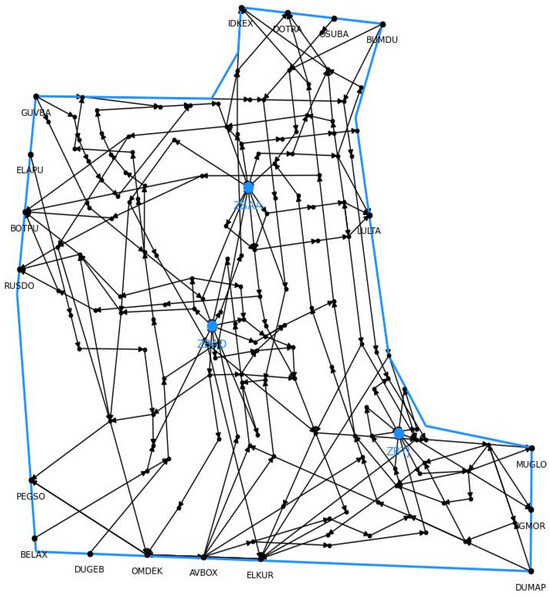
Figure 4.
Network structure of the terminal area in Beijing.
The aircraft operation data from the Beijing terminal area from 28 October to 3 November 2024 were selected for cleaning and statistics, and experts in related fields were invited to evaluate the congestion situation during the above periods based on historical flow distribution.
Since aircraft move an average of about 8–18 km every 2 min, changes in congestion can also be better represented. Therefore, every 10 min is used as a time period, and every 2 min is used as a unit of time. The number and spacing of aircraft on each edge at each moment are counted. Due to limited accuracy, the aircraft closest to the connecting line within 1 km are counted as aircraft on that connecting line. The position of aircraft from 13:00 to 13:10 on a certain day is shown in Figure 5. Approaching aircraft are colored green, and departing aircraft are colored red. The position of aircraft at 13:00 to 13:10 on a certain day is shown in the figure. Figure 5a–e show the position of aircraft at 13:00, 13:02, 13:04, 13:06, and 13:08, respectively.
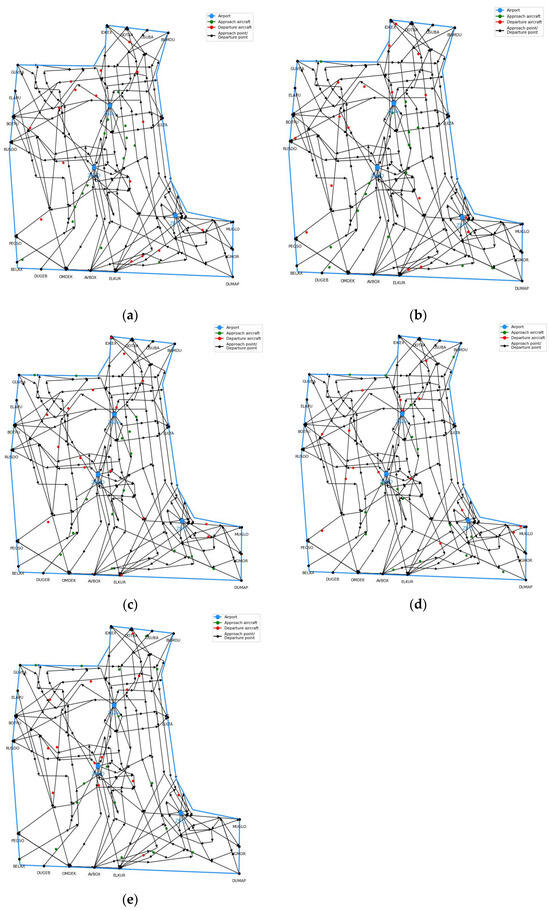
Figure 5.
The position of aircraft at (a) 13:00, (b) 13:02, (c) 13:04, (d) 13:06, and (e) 13:08.
After that, the busyness of the link is calculated according to the method in Section 2.2.2 and converted into an edge weight. For comparison purposes, the density is also multiplied by 1000. Since the spacing between the noses of the aircraft in the Beijing terminal area is more than 5.6 km and is combined with the definition of the traffic congestion situation identification index in Section 3, the value of parameter , where there is only one aircraft on the link, is set to a larger 10. Since the number of aircraft on the edge and the distance between aircraft have the same impact on the busyness of the edge, the value of is set to 1. Combining expert opinions with the actual situation in Beijing’s terminal area, the weight of edges with busyness B within 0 and 0.1 (inclusive) is 25%, the weight of edges with B within 0.1 and 0.2 (inclusive) is set to 50%, the weight of edges with B within 0.2 and 0.3 (inclusive) is set to 75%, and the weight of edges with B at 0.3 and above is set to 100%. If no aircraft passes over the edge during that period, the edge weight is set to 0. Some of the calculated data segments are shown in Table 1.

Table 1.
Partial edge-weight calculation data from 13:00 to 13:10.
5.2. Training of a Congestion Situation Recognition Model
After determining the weight of each edge in each period, calculate the indicators for identifying traffic congestion situations in the terminal area for each period. Some of the results after standardization are shown in Table 2.
Table 2.
Congestion situation recognition indicator in the terminal area during certain periods of time.
A single decision tree is constructed based on the symmetrical multiclass random forest algorithm proposed in Section 4.1, and multiple verifications are carried out by bringing in samples to ensure that the parameter settings can ensure both good performance and a certain degree of randomness in the decision tree. The maximum depth of the decision tree is set to 10, and a minimum sample size of 50 is required for reclassifying a feature. The step size for selecting candidate split points is set to 30, the number of split point selection schemes is 50, the number of split points in each scheme is between 1 and 4, and the Gini impurity threshold is 0.3. According to this, a random forest model for identifying traffic congestion situations is constructed, with the number of trees being 20 and the training sample proportion of each tree being 80%. The calculated congestion situation recognition indicators for each time period from 28 October 2024 to 2 November 2024 and the expert assessment of the congestion situation level are used as the training set for a total of 8640 samples. Some of the samples are shown in Table 3.
Table 3.
Identification indicators and congestion situations for a sample of training sets.
5.3. Congestion Situation Identification Result Analysis
The indicators of congestion situation identification and expert assessment at various times on November 3, 2024, were used as a test set, with a total of 1440 samples. Samples of different congestion situation levels were randomly selected, and a schematic diagram was drawn, as shown in Figure 6. Figure 6a–d represent the unblocked situation, slight congestion, medium congestion, and severe congestion, respectively. The busier the section, the darker the color. From the schematic diagram, it can be seen that the results of the identified congestion situation are basically in line with reality.
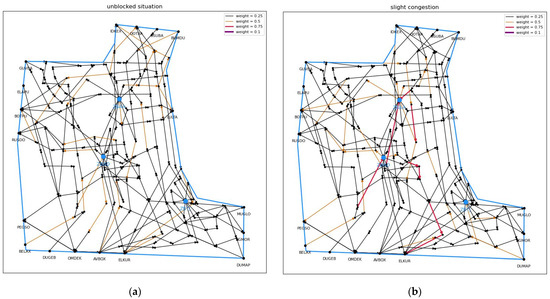
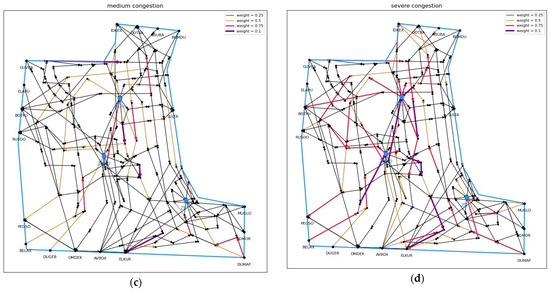
Figure 6.
A schematic diagram of the four congestion levels: (a) unblocked situation, (b) slight congestion, (c) medium congestion, and (d) severe congestion.
Statistics: the number of time periods with an air traffic congestion situation in the terminal area that is above “slight congestion” throughout the day on November 3, as well as the number of arrival and departure edges with a weight of more than 75%, are shown in Figure 7. As can be seen, the terminal area was more congested between 7:00 and 10:00, and the congestion was mainly affected by departing aircraft. The air traffic congestion situation in the terminal area from 10:00 to 13:00, 13:00 to 16:00, and 16:00 to 19:00 was also relatively high, but it was more evenly affected by the arrival and departure of aircraft. The air traffic congestion situation in the terminal area from 22:00 to 1:00 was slightly higher, and the congestion situation was mainly affected by the aircraft approaching. The congestion levels at other times of the day were relatively low. Overall, the identification results were more in line with the actual situation.
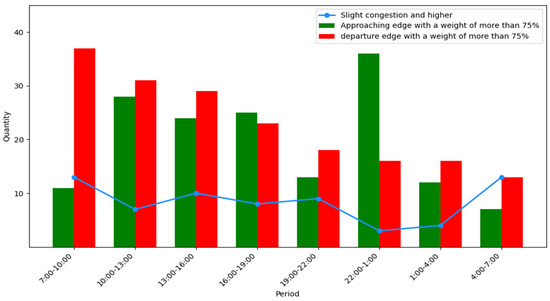
Figure 7.
Congestion situation in the terminal area and edge weight statistics for various time periods on November 3.
The identification results based on this model and the traditional random forest model are compared with the expert assessment results, as shown in Figure 8 and Figure 9. Figure 8 shows the identification results of this method, with an identification accuracy of 98.7%. Figure 9 shows the identification results based on the traditional random forest model in Python, with an identification accuracy of 81.2%. Compared with the traditional random forest model, the identification accuracy of this model is improved by 17.5%.
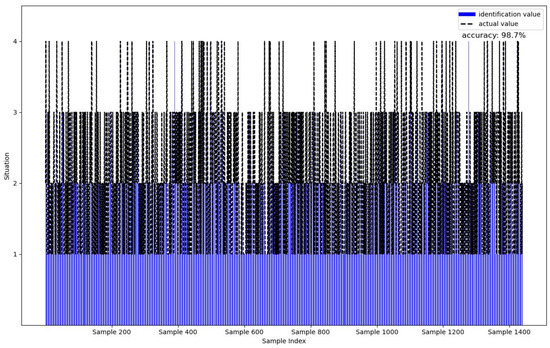
Figure 8.
Congestion situation recognition results of the multiclass random forest algorithm.
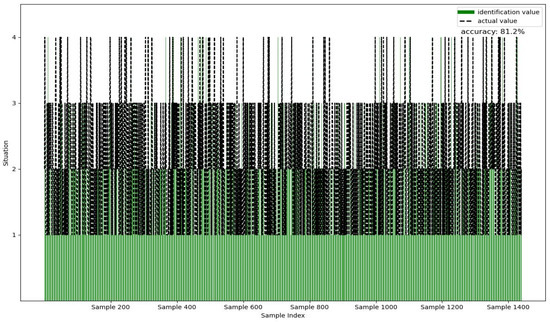
Figure 9.
Congestion situation recognition results of the traditional random forest algorithm.
In summary, it can be seen that the symmetrical multiclass random forest algorithm can be used to accurately identify the air traffic congestion situation in the terminal area of Beijing at different times of day. By using historical operational data from a specific terminal area, a model can be trained to quickly identify the terminal area’s congestion situation level based on congestion situation assessment indicators, thereby identifying the terminal area’s traffic congestion situation in real time and laying the foundation for subsequent deployment of aircraft and mitigation of traffic congestion.
6. Conclusions
Air traffic congestion situation recognition is of great significance for the efficient deployment of aircraft and for intelligent operation of air traffic control. In this paper, a congestion situation model for the terminal area is constructed based on a complex network, and the congestion situation is recognized using an improved random forest algorithm. The effectiveness of the model is verified. The research results show that:
- Using a complex network to abstract the elements of the terminal area into nodes and edges, and using the degree of busyness as the edge weight, can closely match the actual situation in the terminal area and lay the foundation for subsequent congestion situation recognition.
- A multiclass random forest algorithm is proposed which improves the performance of a single decision tree compared to the traditional random forest algorithm, and, in turn, improves the accuracy of congestion situation recognition, laying the groundwork for subsequent aircraft deployment and congestion mitigation.
- Visual elements were added to the congestion situation recognition process to facilitate controllers’ identification of busy flight segments and, thus, the rapid formulation of flow control plans.
- The model uses the actual terminal area airspace structure and measured aircraft operation data to train the congestion situation recognition model, which can objectively and truly reflect actual operation.
First, this research has certain practical value. One is that the situation identification results in this research can be applied to air traffic control radar charts to visualize the situation identification results, thereby integrating with the existing air traffic control system to achieve real-time air traffic congestion monitoring and mitigation. The second is that this research also has certain reference value for other transportation fields such as the high-speed railway network. The high-speed railway network has many similarities with the air traffic network, and its transportation system also contains complex elements such as transportation hubs, railway paths, and traffic volume. Therefore, the methods of this study can also be used to analyze the performance of other transportation networks.
Second, this research still has certain limitations. One is that the identification of key nodes and edges that affect the air traffic congestion situation in the terminal area still needs to be improved. Second, the setting of model parameters and the selection of data sets need to be based on the general operation of a specific terminal area. Therefore, applying this model to other terminal areas or to situation identification under conditions of weather changes and large fluctuations in the number of aircraft also requires resetting the parameters and training the model based on its specific circumstances. Third, the model still needs to be tested in a real operating environment to ensure the accuracy of its congestion identification. Further research and improvements will be carried out in the future.
Author Contributions
Conceptualization: Y.J. and F.Y.; methodology: Y.J.; software: Y.J.; validation: Y.J.; formal analysis: Y.J., F.Y., and Y.P.; investigation: Y.J. and Y.P.; resources: F.Y. and D.S.; data curation: Y.J. and Y.P.; writing—original draft preparation: Y.J.; writing—review and editing: D.S., F.Y., and Y.P.; visualization: Y.J.; supervision: F.Y. and D.S.; project administration: F.Y. and D.S.; funding acquisition: F.Y. and D.S. All authors have read and agreed to the published version of the manuscript.
Funding
This research received no external funding.
Data Availability Statement
Data are contained within the article.
Conflicts of Interest
The authors declare no conflict of interest.
References
- Xu, X.; Ren, J.; Li, N. Traffic Situation Recognition in Terminal Area Based on FCM. Aeronaut. Comput. Technol. 2014, 44, 1–4. [Google Scholar]
- Zhao, Y.; Lv, L.; Zhang, X. Airspace sector operation status assessment. Sci. Technol. Eng. 2014, 14, 105–109. [Google Scholar]
- Yuan, L.; Hu, M.; Zhang, H.; Ma, Y. State recognition of traffic flow in the Terminal Area based on the fusion of prior experience clustering. J. Transp. Eng. 2016, 16, 83–94. [Google Scholar]
- Wu, M.; Wang, Z.; Gan, X.; Yang, G.; Wen, X. Identification of critical flight conflict points based on complex network theory. J. Northwest. Polytech. Univ. 2020, 38, 279–287. [Google Scholar] [CrossRef]
- Zhao, Y.; Chen, K. Northeastern Univ, Air Traffic Congestion Assessment Method Based on Evidence Theory. In Proceedings of the 2010 Chinese Control and Decision Conference, Xuzhou, China, 26–28 May 2010; Volume 1–5, pp. 426–429. [Google Scholar]
- Liu, F.; Li, J.; Wen, X.; Wang, Y.; Tong, R.; Liu, S.; Chen, D. Situation Assessment of Air Traffic Based on Complex Network Theory and Ensemble Learning. Appl. Sci. 2023, 13, 11957. [Google Scholar] [CrossRef]
- Ding, S.; Huang, H.; Yu, J.; Zhao, H. Research on the hybrid models of granular computing and support vector machine. Artif. Intell. Rev. 2015, 43, 565–577. [Google Scholar] [CrossRef]
- Zhu, C.; Zhang, C.; Guan, J. Airspace traffic situation recognition method based on improved support vector machine. Traffic Inf. Saf. 2023, 41, 76–85. [Google Scholar]
- Yuan, Y.; Chen, B.; Xu, T.; Wang, J. A multi-class CVM flight delay early warning model based on prior knowledge. J. Jilin Univ. Eng. Ed. 2010, 40, 752–757. [Google Scholar]
- Yuan, Y. Research and Application of the Minimum Closed Ball SVM Algorithm. Master’s Thesis, Nanjing University of Aeronautics and Astronautics, Nanjing, China, 2011. [Google Scholar]
- Li, G. Research on Traffic Operation Situation Recognition and Prediction Technology in Airway Networks Based on Track Data. Ph.D. Thesis, Nanjing University of Aeronautics and Astronautics, Nanjing, China, 2020. [Google Scholar]
- Li, Y. Research on Key Technologies for Airspace Resource Allocation in Complex Airport Terminal Areas. Ph.D. Thesis, Nanjing University of Aeronautics and Astronautics, Nanjing, China, 2016. [Google Scholar]
- Jiang, J.; Zhang, H.; Qiu, Q. Evaluation method of air traffic congestion status for traffic flow entering the Terminal Area. J. Wuhan Univ. Technol. Transp. Sci. Eng. Ed. 2016, 40, 1043–1049. [Google Scholar]
- Jiang, J. Research on the Evolution Mechanism of Air Traffic Congestion in the Terminal Area. Master’s Thesis, Nanjing University of Aeronautics and Astronautics, Nanjing, China, 2017. [Google Scholar]
- Wang, H.; Ma, L. Complexity assessment and evolution analysis of traffic in Terminal Areas. Sci. Technol. Eng. 2024, 24, 9235–9243. [Google Scholar]
- Tang, K.; Xu, T.; Guo, T. Research on the topological characteristics and resilience of China’s high-speed railway network from a hypernetwork perspective. Syst. Eng. Theory Pract. 2024, 44, 3639–3649. [Google Scholar]
- Peng, Y.; Wen, X.; Wu, M.; Yang, Z.; Wang, N. Complexity analysis of air traffic based on complex networks in TBO mode. J. Beijing Univ. Aeronaut. Astronaut. 2023, 1–17. [Google Scholar] [CrossRef]
- Peng, Y.; Wen, X.; Wu, M.; Zhu, D.; Ding, L. Flight situation assessment based on complex networks and MFIM-TOPSIS. J. Northwest. Polytech. Univ. 2024, 42, 435–445. [Google Scholar] [CrossRef]
- Breiman, L. Random forests. Mach. Learn. 2001, 45, 5–32. [Google Scholar] [CrossRef]
Disclaimer/Publisher’s Note: The statements, opinions and data contained in all publications are solely those of the individual author(s) and contributor(s) and not of MDPI and/or the editor(s). MDPI and/or the editor(s) disclaim responsibility for any injury to people or property resulting from any ideas, methods, instructions or products referred to in the content. |
© 2025 by the authors. Licensee MDPI, Basel, Switzerland. This article is an open access article distributed under the terms and conditions of the Creative Commons Attribution (CC BY) license (https://creativecommons.org/licenses/by/4.0/).