Article

Research on Mathematical Modeling of Critical Impact Force and Rollover Velocity of Coach Tripped Rollover Based on Numerical Analysis Method

Fujian Key Laboratory of Digital Simulations for Coastal Civil Engineering, School of Architecture and Civil Engineering, Xiamen University, Xiamen 361005, China
*
Author to whom correspondence should be addressed.
Symmetry 2024, 16(5), 543; https://doi.org/10.3390/sym16050543
Submission received: 24 March 2024 / Revised: 21 April 2024 / Accepted: 28 April 2024 / Published: 1 May 2024

Abstract

:
Although the probability of a rollover accident is lower than that of other forms of collision, rollover is a serious accident that can break the symmetry of the vehicle and cause serious loss of life and property. There are many factors affecting rollovers, such as the environment, the vehicle, and the driving control. A coach comprises a complex dynamic system; as such, the accuracy and rationality of the used mathematical model are decisive in the study of coach rollover warning and control. By analogy with the modeling method of an automobile collision accident, the general process of a coach rollover accident is analyzed in this study in combination with the contact form and freedom of motion characteristic of the coach body and external environment. According to the principle of conservation of energy, the mathematical models of critical rollover impact force in a collision between vehicles and obstacles and in a collision between two vehicles are established, allowing for analysis of the relationships between the critical tripped rollover impact forces required for a 90° rollover and the continuous action time and collision point height. During the collision between the vehicle and the obstacle, the occurrence of a vehicle rollover is related not only to the impact force in the collision process but also to the collision duration time. Even if the impact force is relatively small, the collision lasts long enough that a second collision may occur until the vehicle rolls over. In the process of a two-vehicle collision, the critical rollover impact force is not only related to the vehicle mass but also to the vehicle wheelbase and the height of the collision point. Based on the law of conservation of momentum, the mathematic models of 90-degree rollover and 180-degree rollover are established, and the critical rollover velocities are calculated. The purpose of this study is to provide reference and guidance for the research methods of vehicle rollover stability and anti-rollover control in the intelligent vehicle era.

1. Introduction

With the popularization and use of cars in production and life, the requirements for car reliability and safety continue to increase; however, vehicle rollover accidents often occur, especially when considering heavy trucks and coaches. Due to the large size and high center of mass of such vehicles, when the driver urgently avoids obstacles and turns sharply, the vehicle can easily roll over, resulting in greater personal injury and economic losses [1]. From the point of view of symmetry, the coach is symmetrical when it is running normally. This means that the front and back and left and right sides of the vehicle are designed and built to balance each other to ensure driving stability and safety. However, when the vehicle rolls over, this symmetry is broken. According to statistics from Australia and Europe, the number of deaths caused by rollover accidents every year exceeds 20% of the total number of deaths from all vehicular accidents [2,3]. The percentage of rollover accidents in the United States is less than 3% of all vehicular accidents each year; however, fatalities account for 33% of all fatalities from vehicular accidents [4], with economic losses exceeding USD 50 billion [5,6]. In China, taking 2013 for example, a total of 5910 rollover accidents occurred, accounting for 2.98% of the total number of traffic accidents and resulting in 3851 deaths, accounting for 6.58% of the total number of deaths from traffic accidents [7]. A rollover accident can not only lead to casualties but may also cause other serious consequences. For example, for transport vehicles carrying items such as weapons, equipment, and radioactive material (generally medium and large transport vehicles), if there is a rollover or rolling accident, a serious safety incident such as a chemical explosion or radioactive pollution may occur. Therefore, it is particularly important to carry out rollover safety research. There are obvious differences between a vehicle rollover accident and other collisions. First, rollovers have diverse types and complex causes, which are closely related to the topography, climate, road traffic structural elements (e.g., curbs, slopes, guardrails, and so on), and the vehicle driving state (e.g., speed and driving angle). Second, the rolling and rolling motion processes are complicated, and the collision position and attitude of the car—as well as what it collides with—are uncertain. This poses challenges for the prediction and re-enactment of vehicle rollover and rollover motion; furthermore, it is difficult to fully re-enact various rollover accident scenes and accident characteristics as there are few test methods.
Based on the main causes of vehicle rollover, rollovers can be divided into curve rollovers and tripped rollovers. A curve rollover occurs when the lateral acceleration of a car reaches a certain limit value, the vertical force of the inner tire of the car is 0 N, and the vehicle rotates more than 90° around the longitudinal axis of the vehicle. A tripped rollover refers to the lateral slip of a moving vehicle; the vehicle “trips” by hitting an obstacle [8]. A curve rollover is caused by the instability of the vehicle under the condition of its own large lateral acceleration, which is mainly due to rapid steering at a fast speed. A tripped rollover is caused by the instability derived from an external instantaneous large lateral or vertical force or acceleration, which is mainly caused by lateral slip tripping or a single sidewheel passing through the convex hull of the road. Statistics indicate that the number of tripped rollovers far exceeds the number of other types of rollovers. The lateral acceleration, lateral load transfer rate, and roll angle [9,10,11,12,13,14,15] are common indices for evaluating rollover stability. The main methods used for automobile active anti-rollover control are the differential braking control system [16], active suspension control [17], active steering control [18], and active anti-roll stabilizer bar control [19,20]. Due to its high cost and complex structure, active suspension control is rarely used in practice. The active anti-roll stabilizer bar is rather simple in structure but only has one function. Differential braking and active steering have strong practical value and wide application prospects, as they can be integrated with the relatively mature automotive stability control system, and only the upper controller needs to be designed; thus, there is no additional hardware burden [21].
Vehicle dynamics involves the mechanical modeling of vehicles, as well as the mathematical description and analysis of vehicles [22]. A coach comprises a relatively complex multi-variable, non-linear, intrinsically unstable, and strongly coupled system, which is easily affected by internal and external uncertainties; therefore, it is difficult to control a coach’s stability [23,24,25]. To study the rollover stability of a coach, it is important to establish a mathematical model that is accurate, reasonable, practical, and close to the actual situation [26]. A constrained lateral dynamics model for articulated vehicles and an algorithm for estimating sideslip angle and cornering stiffness have been proposed [27]. A bicycle model, a linear tire model, and an improved Dugoff model are used to model articulated vehicles. A model is also proposed to simulate the lateral rollover test, which includes the effect of the change in the center of gravity position, and calculates the maximum speed of the bus traveling in the curve without rollover [28]. Reference [29] proposes a six-degree-of-freedom non-linear mathematical model to study the influence of different factors (braking angle, speed, acceleration, etc.) on the stability of the vehicle on the curve trajectory. Reference [30] presents an application that combines dynamic and finite element (FE) simulations to evaluate rollover crashes in buses. A six-degree-of-freedom beam finite element model was used to analyze the influence of several parameters (namely height of center of gravity, weight distribution between axes, torsional stiffness of chassis, etc.) on the rollover stability of passenger cars during lane change maneuvering [31]. Zhu Tianjun et al. [32] added a machine learning algorithm to the adaptive boost (AdaBoost) algorithm, allowing for efficient prediction of the rollover condition of heavy vehicles under extreme conditions. Shi Qiujuan et al. [33] have proposed a new sliding mode control algorithm, which could reduce the roll trend of buses to a certain extent, thus improving the anti-rollover ability of buses. In order to prevent forklift rollover, the model predictive control (MPC) algorithm was used to adjust the roll posture of a forklift [34,35]. The algorithm was proven to be effective through forklift experiments. Zhang Yang et al. [36] have proposed a hierarchical control anti-rollover control method and proved, in a real forklift experiment, that this method could effectively prevent forklift rollover. Pan Gongyu et al. [37] have calculated an electro-hydraulic control active lateral stabilizer with the advantages of hydraulic control and motor control, which can improve the roll stability of vehicles under extreme steering to a certain extent. Jin Liqiang et al. [38,39] have improved the zero moment point roll index and designed an evaluation index that effectively reflects the rollover of vehicles. Huang Kang et al. [40] have developed a vehicle dynamics model with an active anti-rollover function and verified, through co-simulation, that the active anti-rollover system can reduce the rollover risk of vehicles. Based on fuzzy logic and proportional integral derivative, multi-objective optimization of a non-linear active suspension system of a 4 × 4 in-wheel motor-driven electric vehicle was studied by using the non-dominated sorting genetic algorithm II [41].
Tripped rollovers are considered the focus of this paper. The mathematical models of critical impact force and rollover velocity of coach tripped rollover are designed by using a rigid body system, and the virtual or mathematical models (ordinary differential equation system) are generated. The rollover process of a vehicle is a complicated process of movement through space. In order to describe the position state of a vehicle at any time, it is necessary to have at least the vehicle’s coordinates of the centroid position and the vehicle’s rotation angles around the longitudinal and vertical axes of the vehicle body. Based on a modeling method for an automobile crash, the general processes of a coach rollover accident are analyzed, according to the contact form and freedom of motion characteristic of a vehicle rollover accident. According to the principle of conservation of energy, the mathematical models of critical rollover impact force in a collision between vehicles and obstacles and in a collision between two vehicles are established, allowing for analysis of the relationships between the critical tripped rollover impact forces required for a 90° rollover and the continuous action time and collision point height. Based on the law of conservation of momentum, the mathematic models of 90-degree rollover and 180-degree rollover are established, and the critical rollover velocities are calculated. This study can provide an important reference for the calculation and analysis of critical impact force and critical rollover velocity of coach tripped rollover and has clear practical significance.

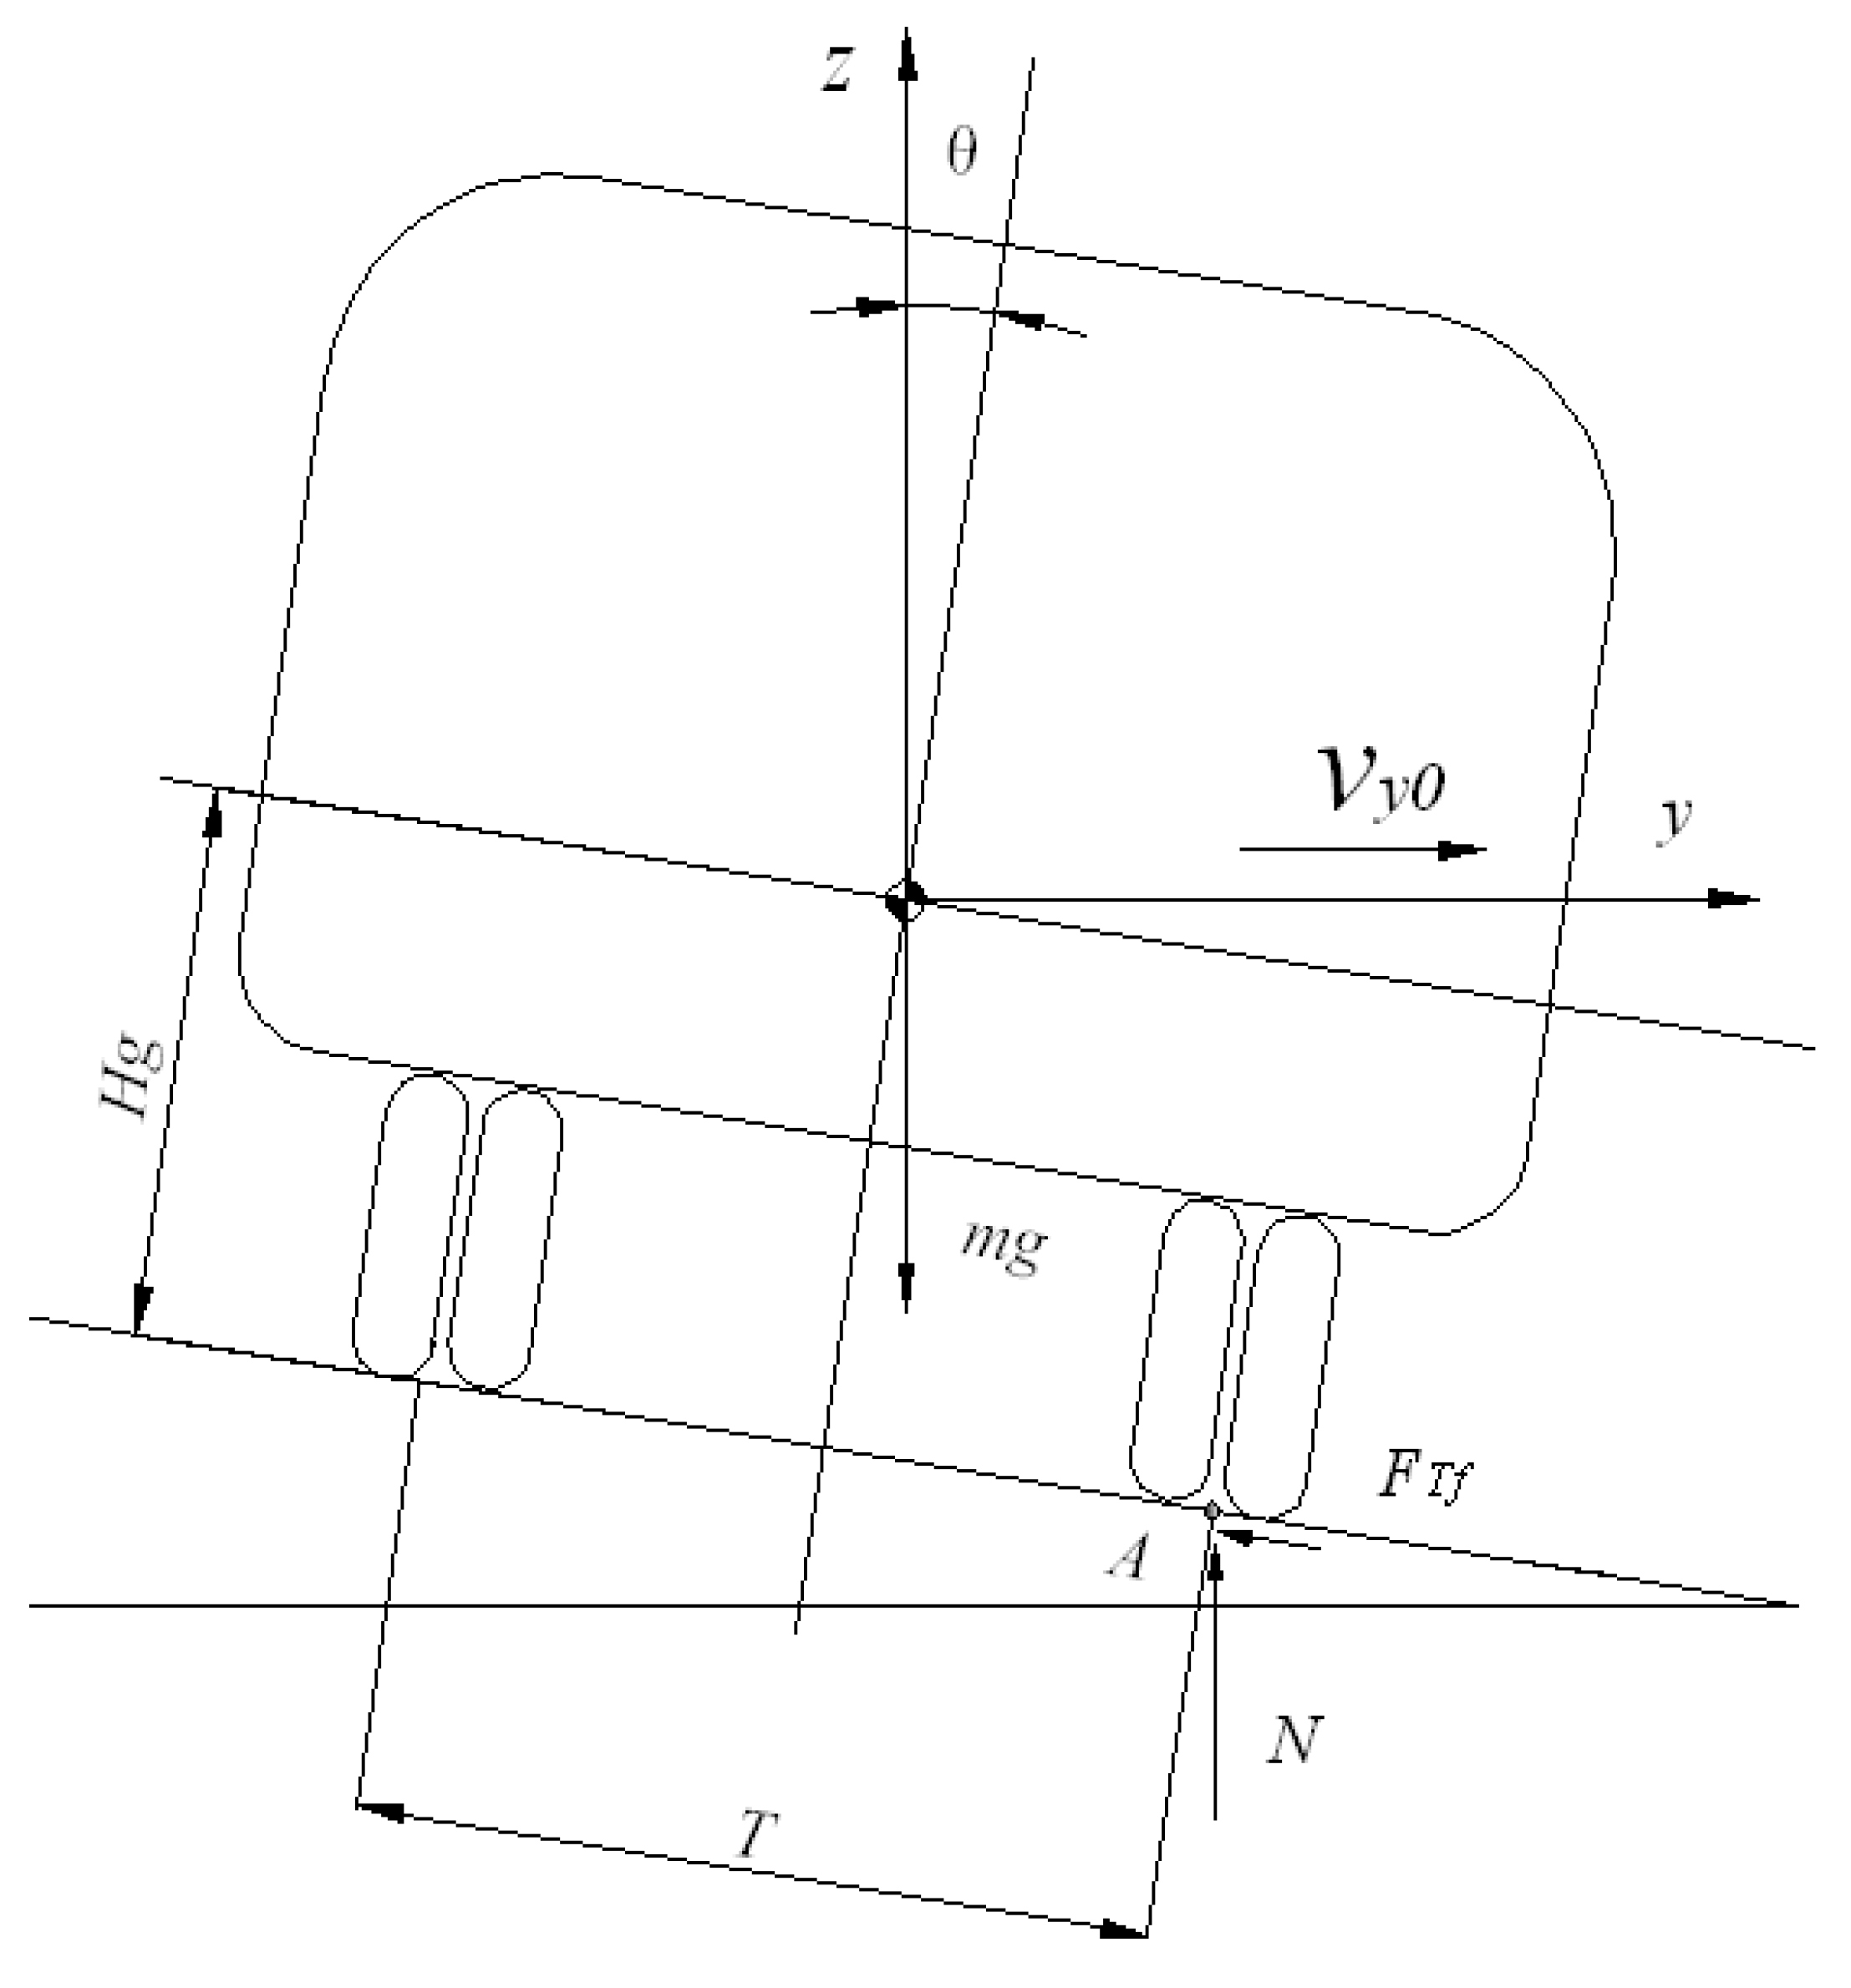
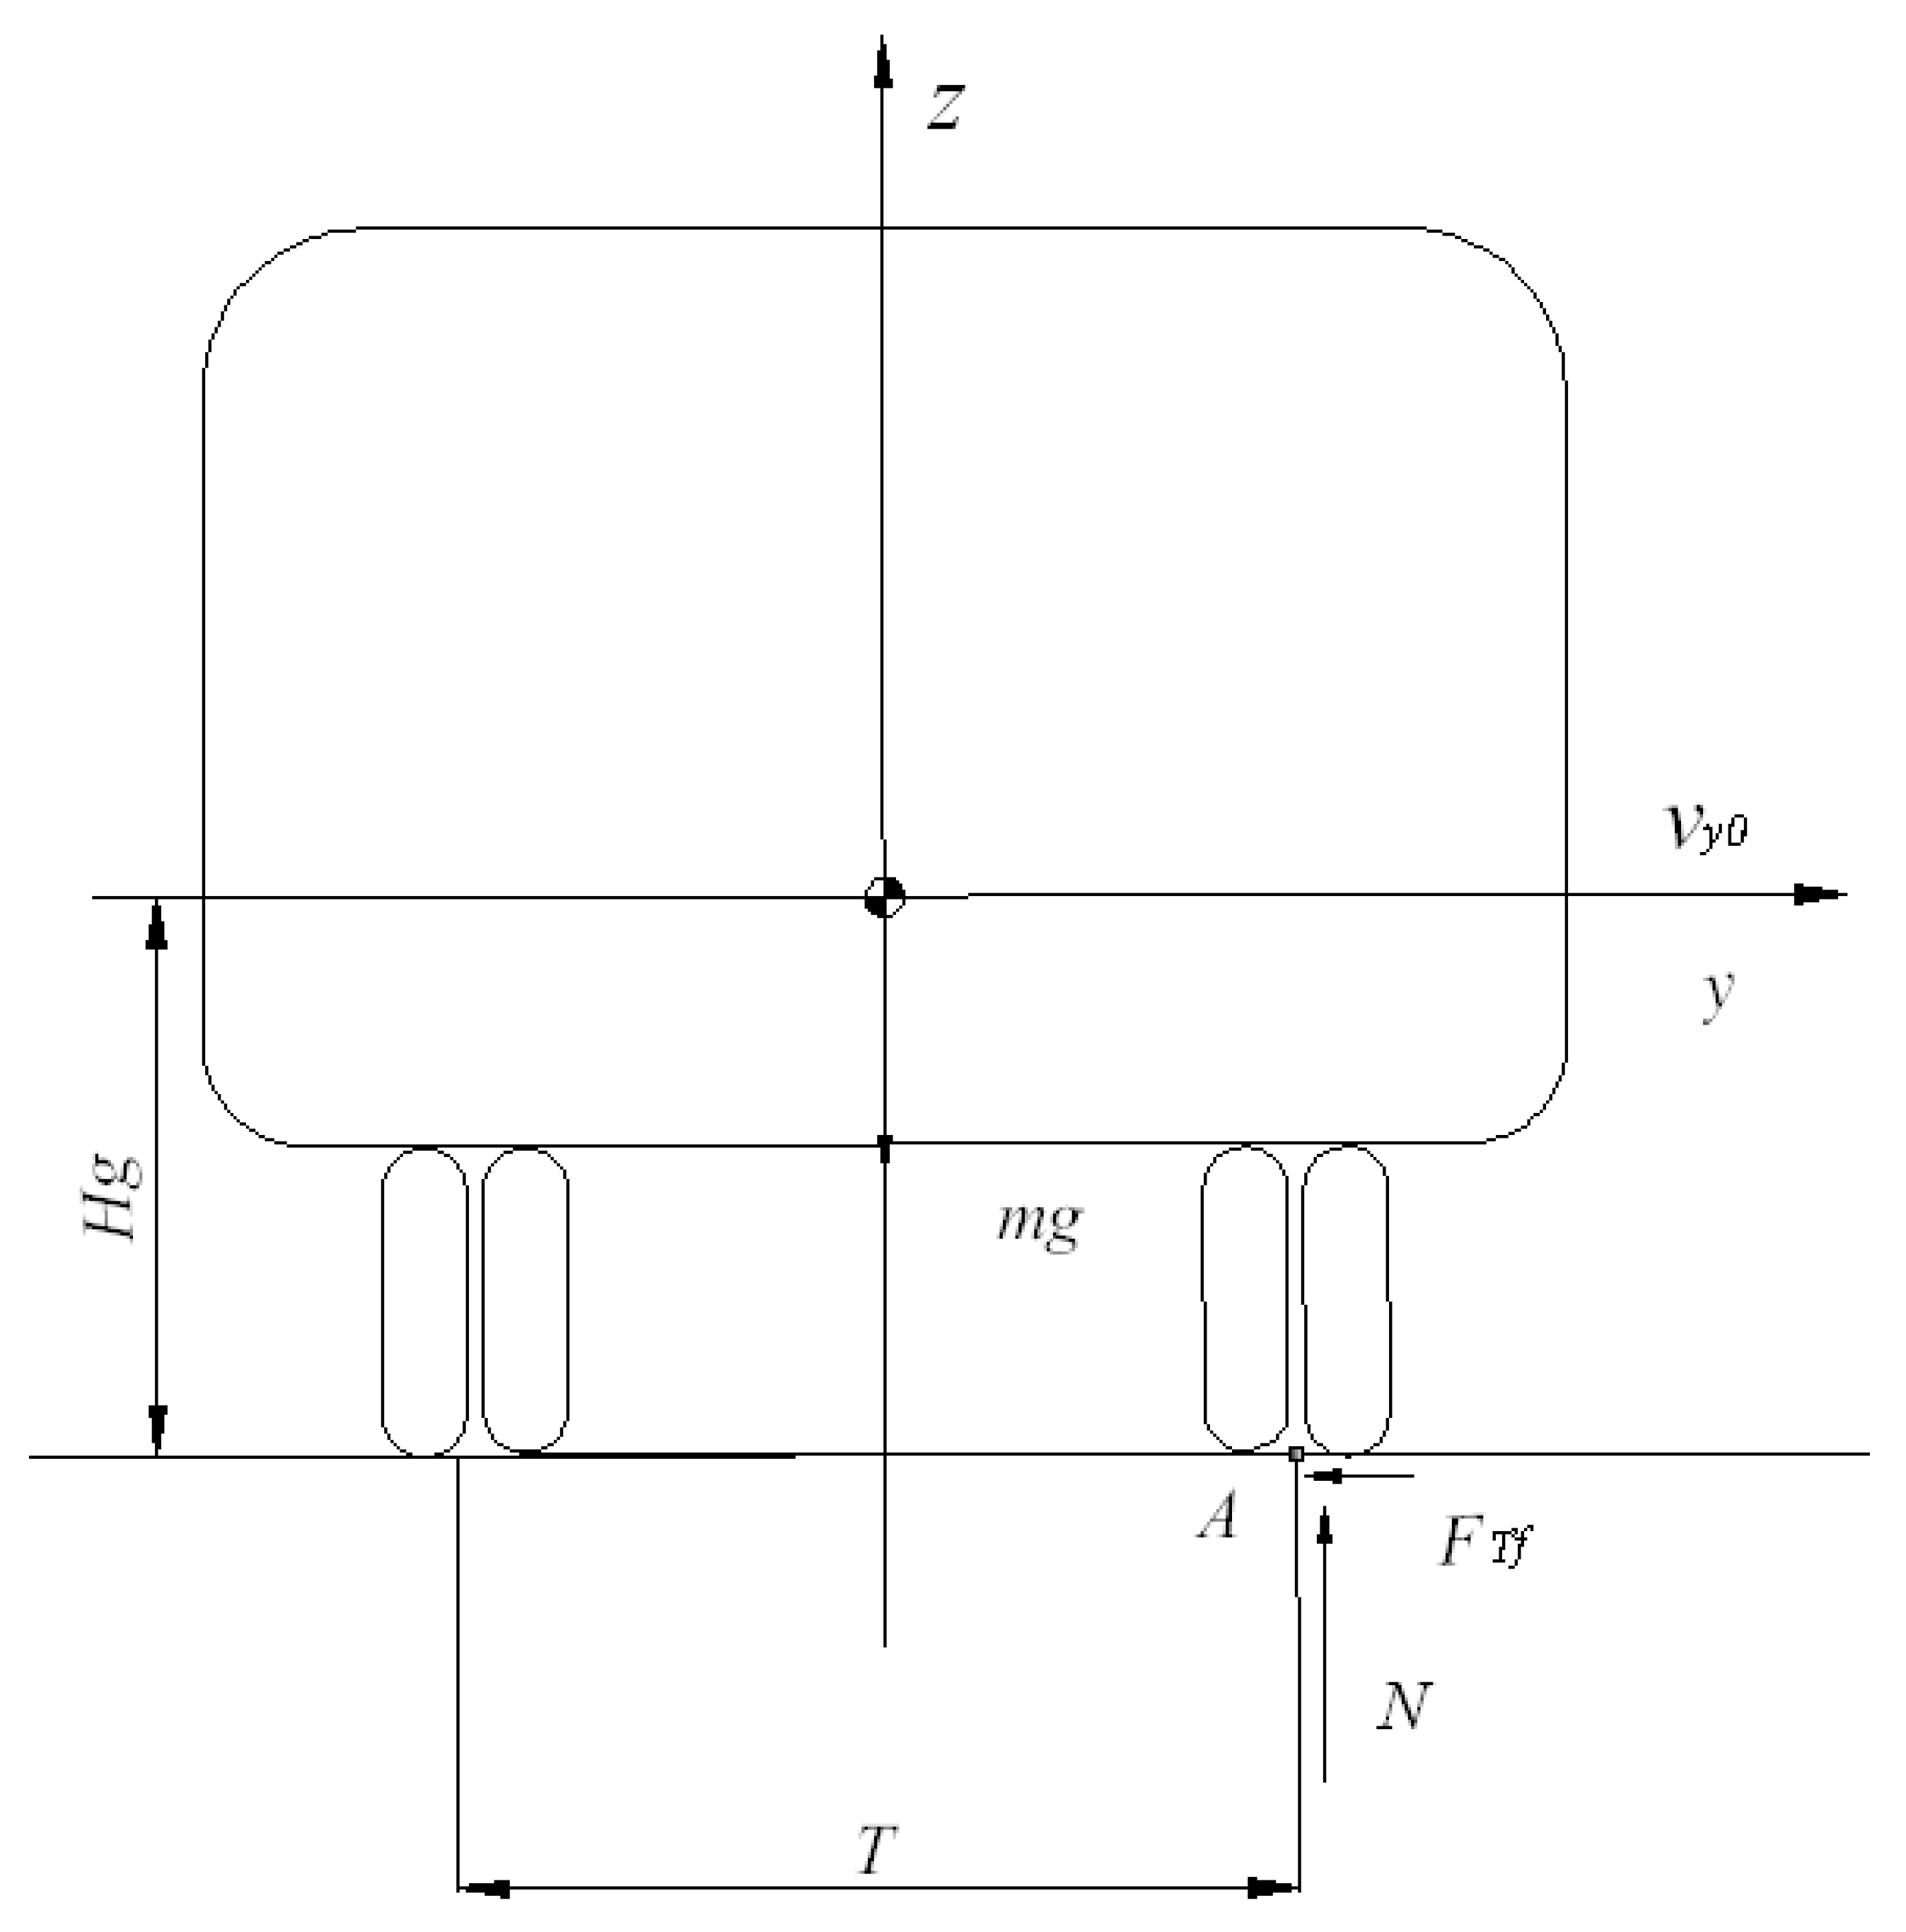
2. Mathematical Modeling of the Critical Rollover Impact Force

In the process of a rollover collision, whether considering the impact force between two vehicles or the impact force between the car and a road obstacle, the impact force is a function of the collision action time. The modeling of critical rollover impact force for tripped rollover is a complex engineering problem, which involves many factors such as vehicle dynamics, collision mechanics, and road conditions. Because the collision time is relatively small, the following factors are mainly taken into account when calculating the equation:
(1)
The vehicle as a whole is regarded as a rigid body;
(2)
The center of mass of the vehicle is in the vertical plane of the center of the axle;
(3)
The vertical reaction point on the inner and outer wheels is at the midpoint of the vertical twin tires;
(4)
The differences in the parameters of each axis are ignored.
In this section, the mathematical model of the critical impact force is established according to the principle of the conservation of energy, which can be used to analyze the relationships between the critical rollover impact force of a 90° rollover and the continuous action time and collision height. The mechanism of tripped rollover was analyzed, and the critical rollover condition was determined. Based on the critical rollover condition, the critical collision force leading to rollover was calculated through the dynamics equation and the collision mechanics principle.

2.1. Mathematical Modeling of Critical Rollover Impact Force between a Vehicle and a Road Obstacle

In Figure 1, point A is the collision point between the vehicle and a road obstacle, and the impact force F T f is parallel to the ground. Considering that the collision process is extremely short, and both the vehicle displacement and rollover angle θ are very small, the equation of motion for the collision process can be written as follows [42]:
m y ¨ = F T f
m z ¨ = N m g
I x x θ ¨ = F T f H g N T 2
where H g represents the height of the center of mass (m), T represents the wheelbase (m), I x x represents the moment of inertia in the X-axis around the center of mass (kg·m2), N represents the ground supporting force (N), and F T f represents the impact force (N).
Considering that the collision process time is very short, and the displacement and rotation angle of the vehicle are very small, we obtain the Z-direction velocity and acceleration as
z ˙ = T 2 θ ˙ z ¨ = T 2 θ ¨ } .
Substituting this into the equation of motion (1b), we obtain
N = m z ¨ + m g = m ( T 2 θ ¨ + g ) .
Substituting Formula (3) into the equation of motion (1c), we obtain
( I x x + m T 2 4 ) θ ¨ = m g T 2 + F T f H g .
Let T x x = ( I x x + m T 2 4 ) and M T = F T f H g m g T 2 .
Then,
θ ¨ = M T T x x .
Integrating the above formula, the rollover angular velocity and rollover angle are obtained as
θ ˙ = θ ¨ d t = M T T x x t θ = θ ˙ d t = M T 2 T x x t 2 } .
It is assumed that the collision action time is Δ t . When the rollover impact is over, the rollover angular velocity ω 1 and rollover angle of the vehicle θ 1 are
ω 1 = M T T x x Δ t
θ 1 = M T 2 T x x ( Δ t ) 2 .
The Z-direction velocity and displacement are
V z 1 = T M T 2 T x x Δ t
z 1 = T M T 4 T x x ( Δ t ) 2 .
The Y-direction velocity, V y 1 , is
V y 1 = V y 0 F T f m Δ t   ( V y 0   is the initial lateral velocity).
The vehicle starts the rolling motion at the initial angular speed of ω 1 . If the vehicle rolls over a quarter of a circle, it is considered to be a 90° rollover. The initial kinetic energy of the rollover translates into the potential energy needed to lift the car to a critical state; that is,
I x x ω 1 2 + 1 2 m V z 1 2 + 1 2 m V y 1 2 = m g ( W T 2 4 + H g 2 H g z 1 ) .
Substituting the expressions for ω 1 , Vz1, Vy1, and z1 into Formula (12), we obtain
1 2 T x x ( F T f H g m g T 2 ) 2 ( Δ t ) 2 + m g T 4 T x x ( F T f H g m g T 2 ) ( Δ t ) 2 + 1 2 m ( V y 0 F T f m Δ t ) 2 = m g ( T 2 4 + H g 2 H g ) .
Let k G = F T f m g . Then, we can rewrite the above formula as
( k G T 2 H g ) 2 ( Δ t ) 2 + T 2 H g ( k G T 2 H g ) ( Δ t ) 2 + T x x m H g 2 ( V y 0 g k G Δ t ) 2 = 2 T x x m g H g ( ( T 2 H g ) 2 + 1 1 )
In Equation (14), k G is a function of the duration Δ t of the rollover collision. According to the original data in Table 1, the curve representing the relationship between k G and Δ t can be calculated.
(1)
Relationship between the impact force k G and collision duration Δ t under different values of Vy0.
It can be clearly seen, from Figure 2, Figure 3, Figure 4 and Figure 5, that with a continuous increase in Vy0, the value of k G in the same period of time also increases quite rapidly. This also means that, when the lateral speed is high, the vehicle will collide with the obstacle in a short time with a force several times its own weight, resulting in vehicle damage and possibly even death.
(2)
Relationship between the impact force k G and collision duration Δ t under different Hg (Vy0 = 15 km/h).
From Figure 6, Figure 7 and Figure 8, it can be seen that the height of the center of mass Hg has little influence on the impact force. Although the height of the center of mass Hg was changed by ±20%, the three impact force curves remained basically unchanged, indicating that the impact force is not obviously affected by the height of the center of mass Hg.
In brief, the curves shown in Figure 6, Figure 7 and Figure 8 can be described as follows:
(1)
When the collision duration is short ( Δ t < 0.01 s), the critical rollover impact force is very large and FTf rapidly increases to its maximum value;
(2)
The vehicle rollover is not only related to the impact force but also to the duration of the collision effect; even if the impact force is relatively small, if the collision effect lasts long enough, a second collision may occur or cause rollover;
(3)
Theoretically, as long as the impact force–action time relationship is above the curve, it can lead to rollover.

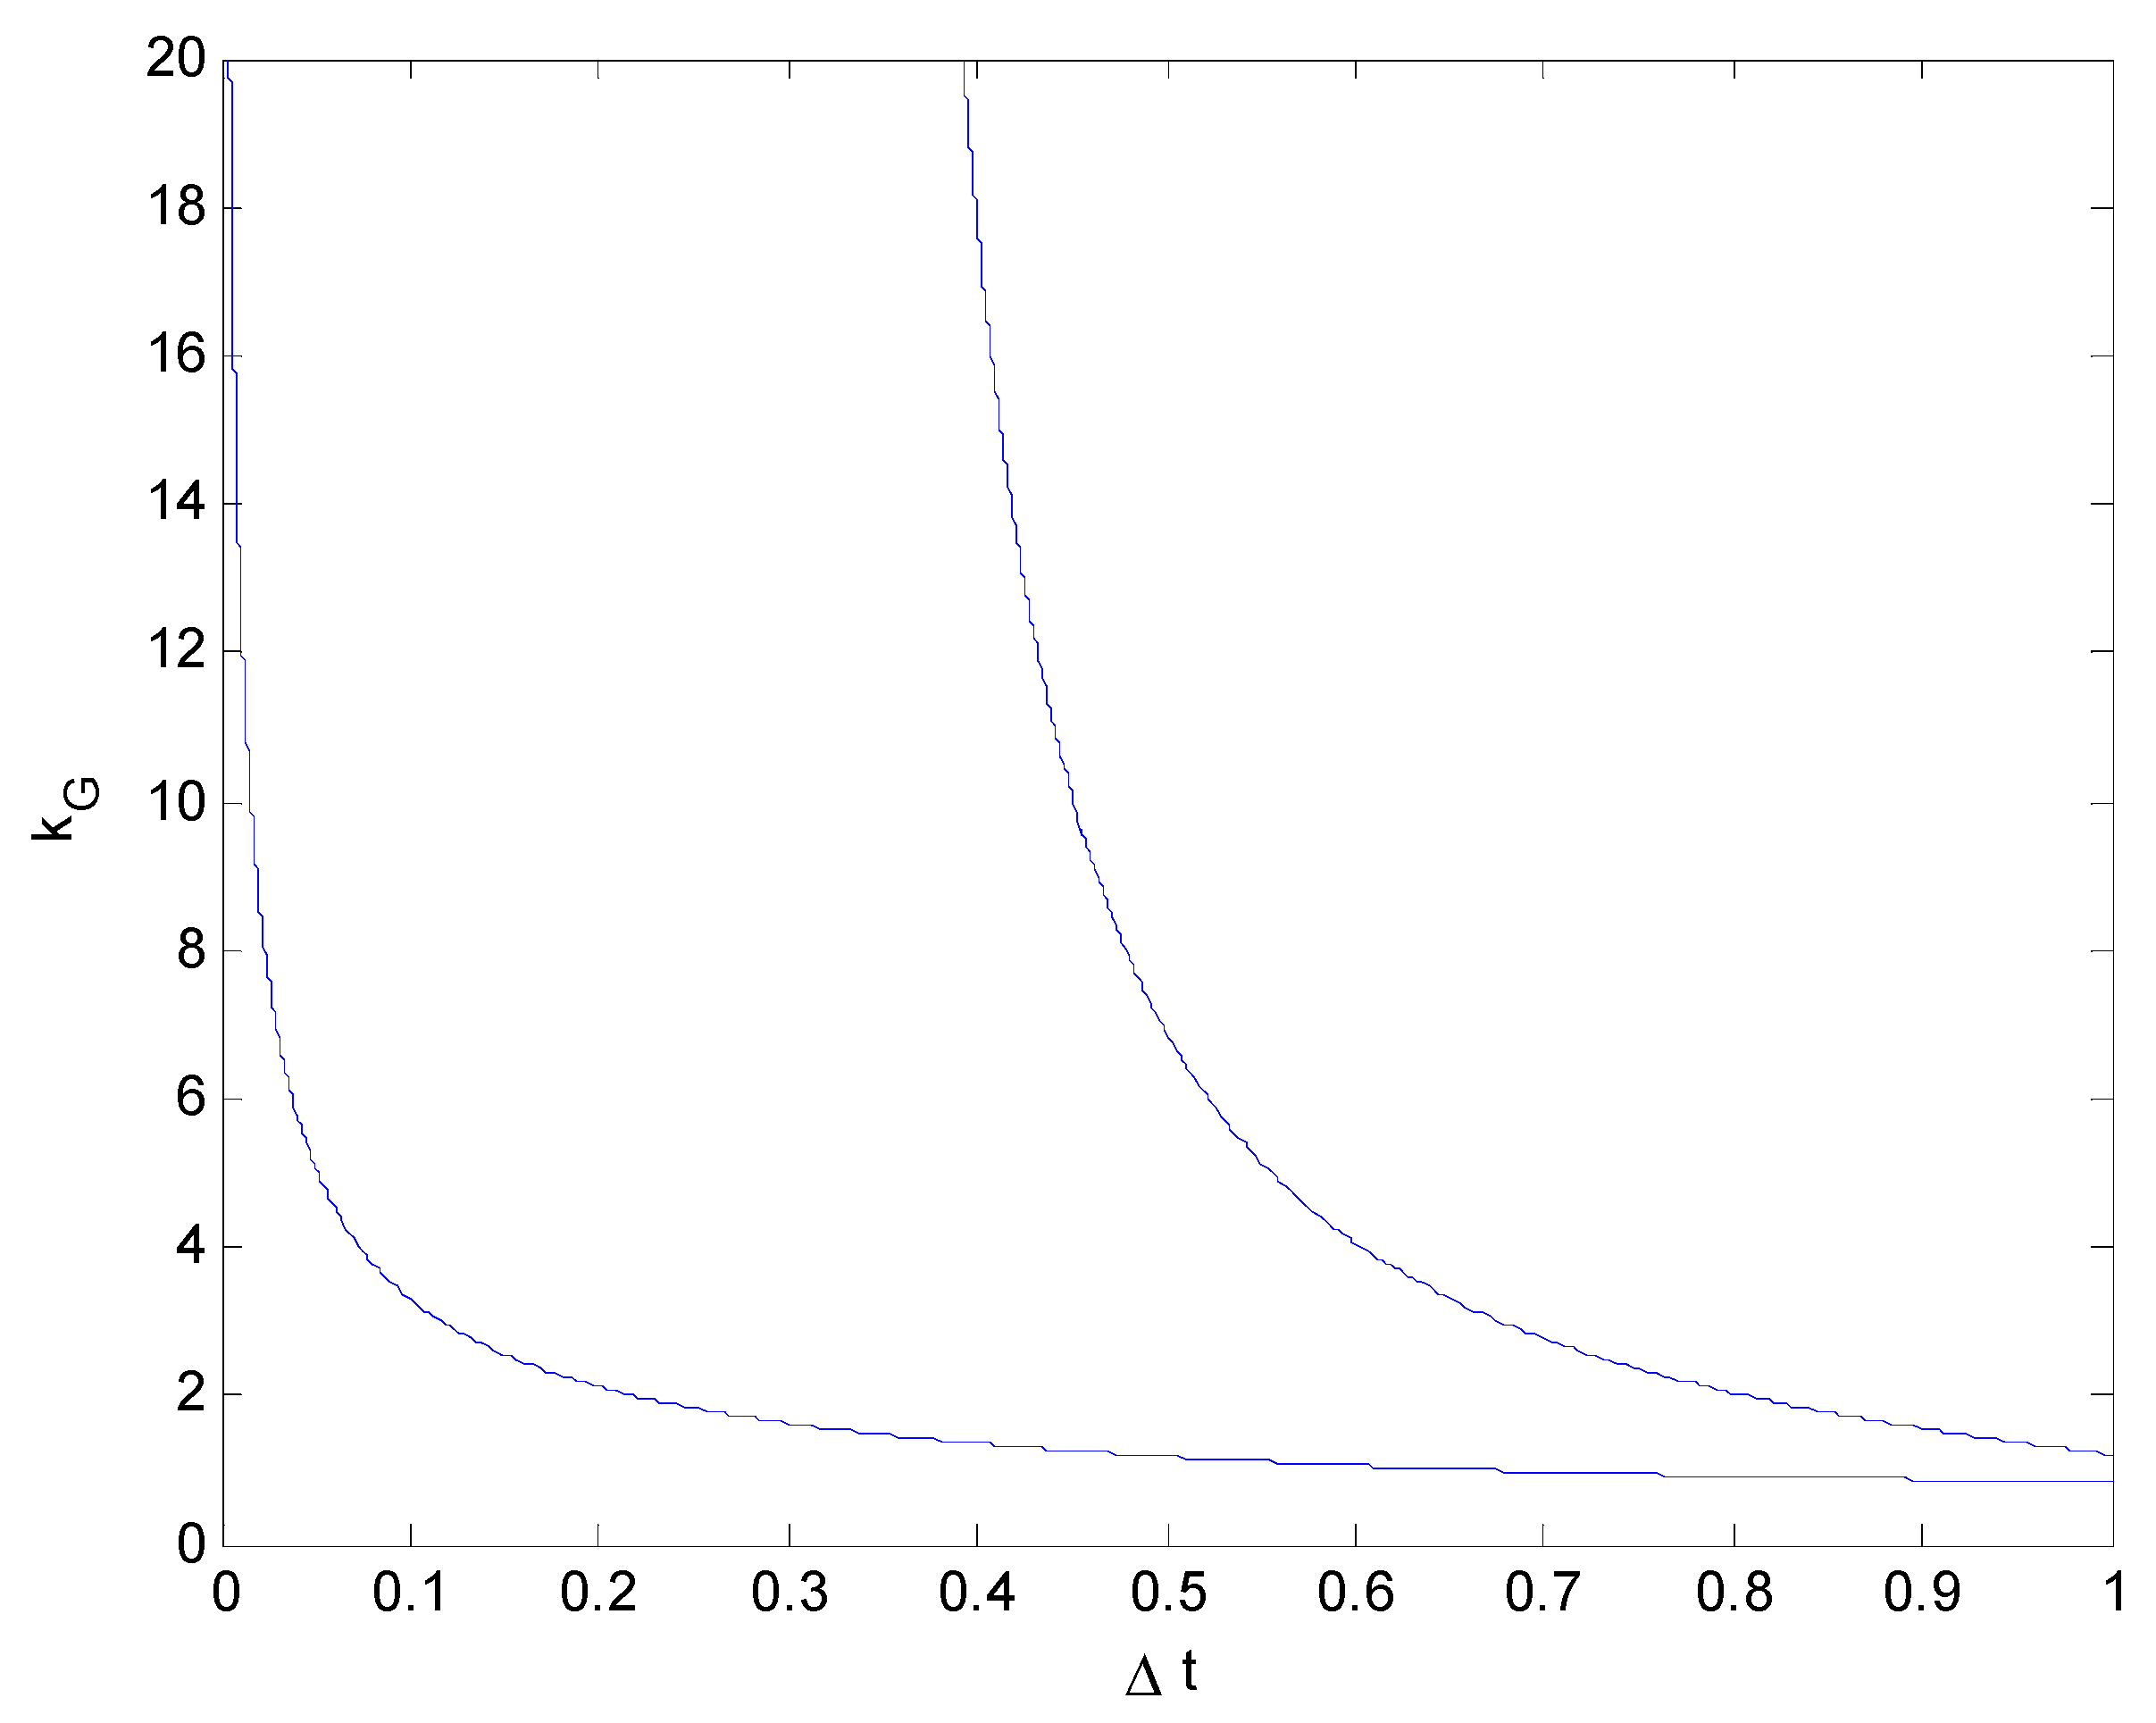
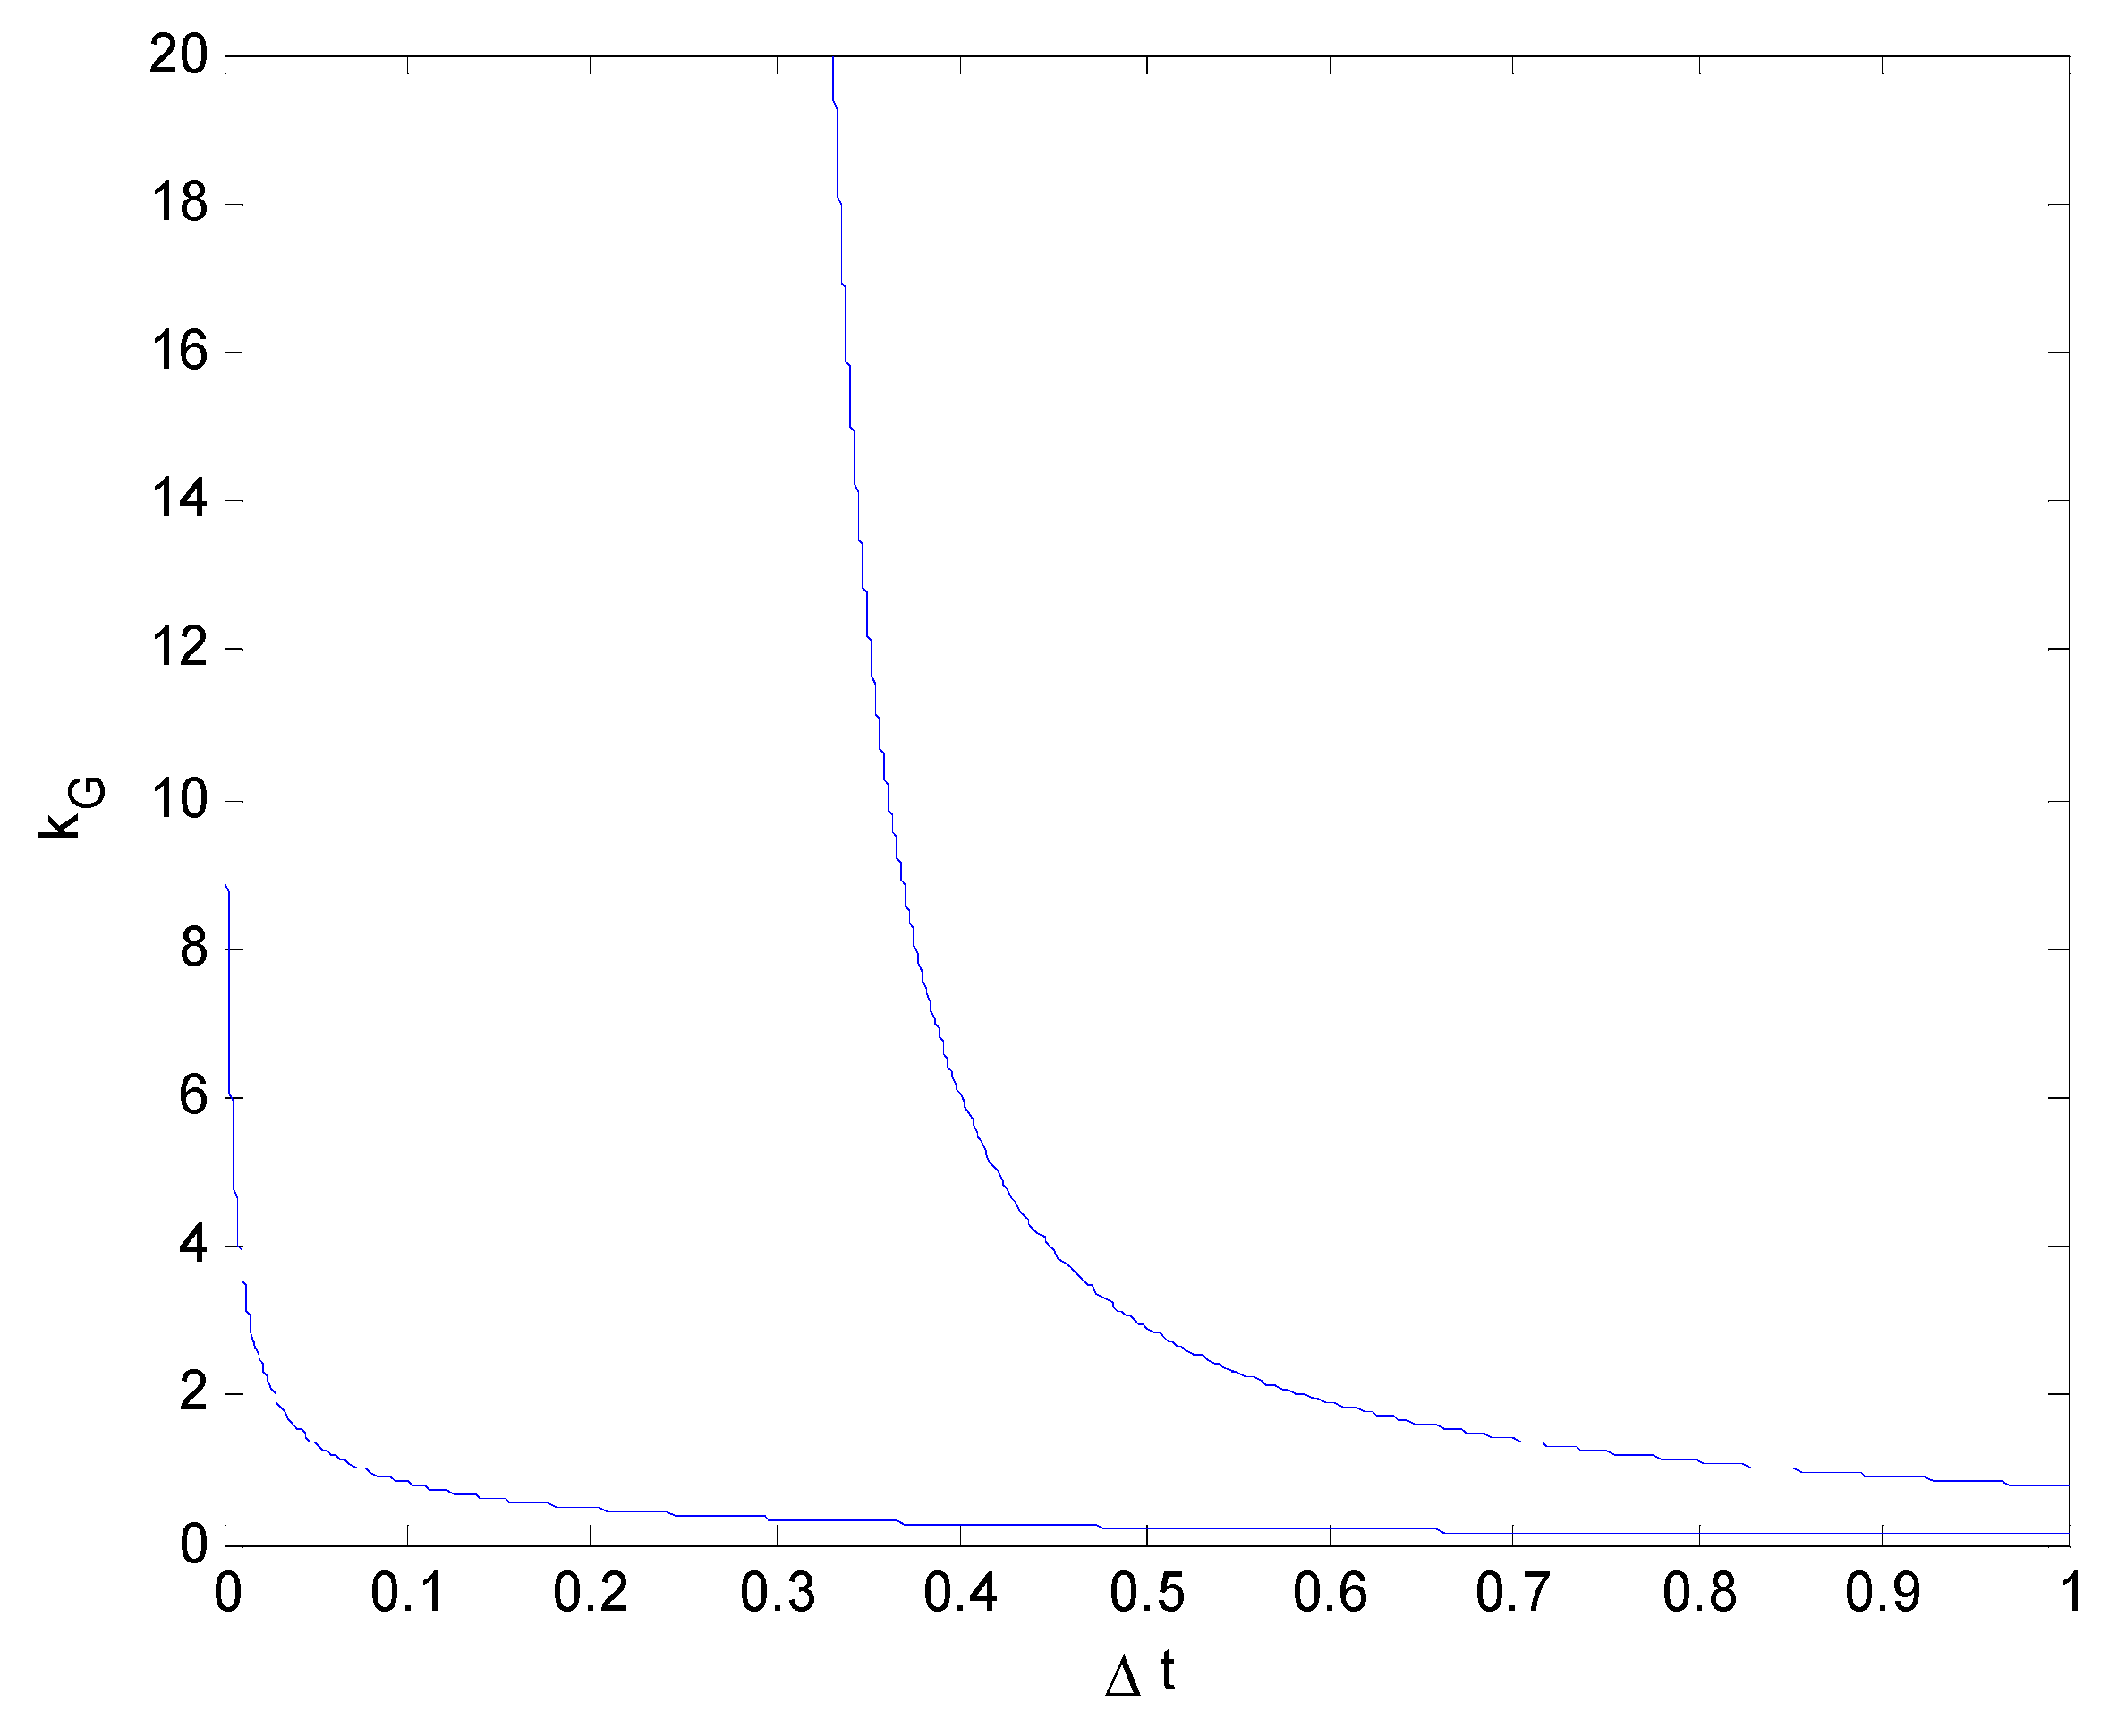
2.2. Mathematical Modeling of Critical Rollover Impact force of Two Vehicles
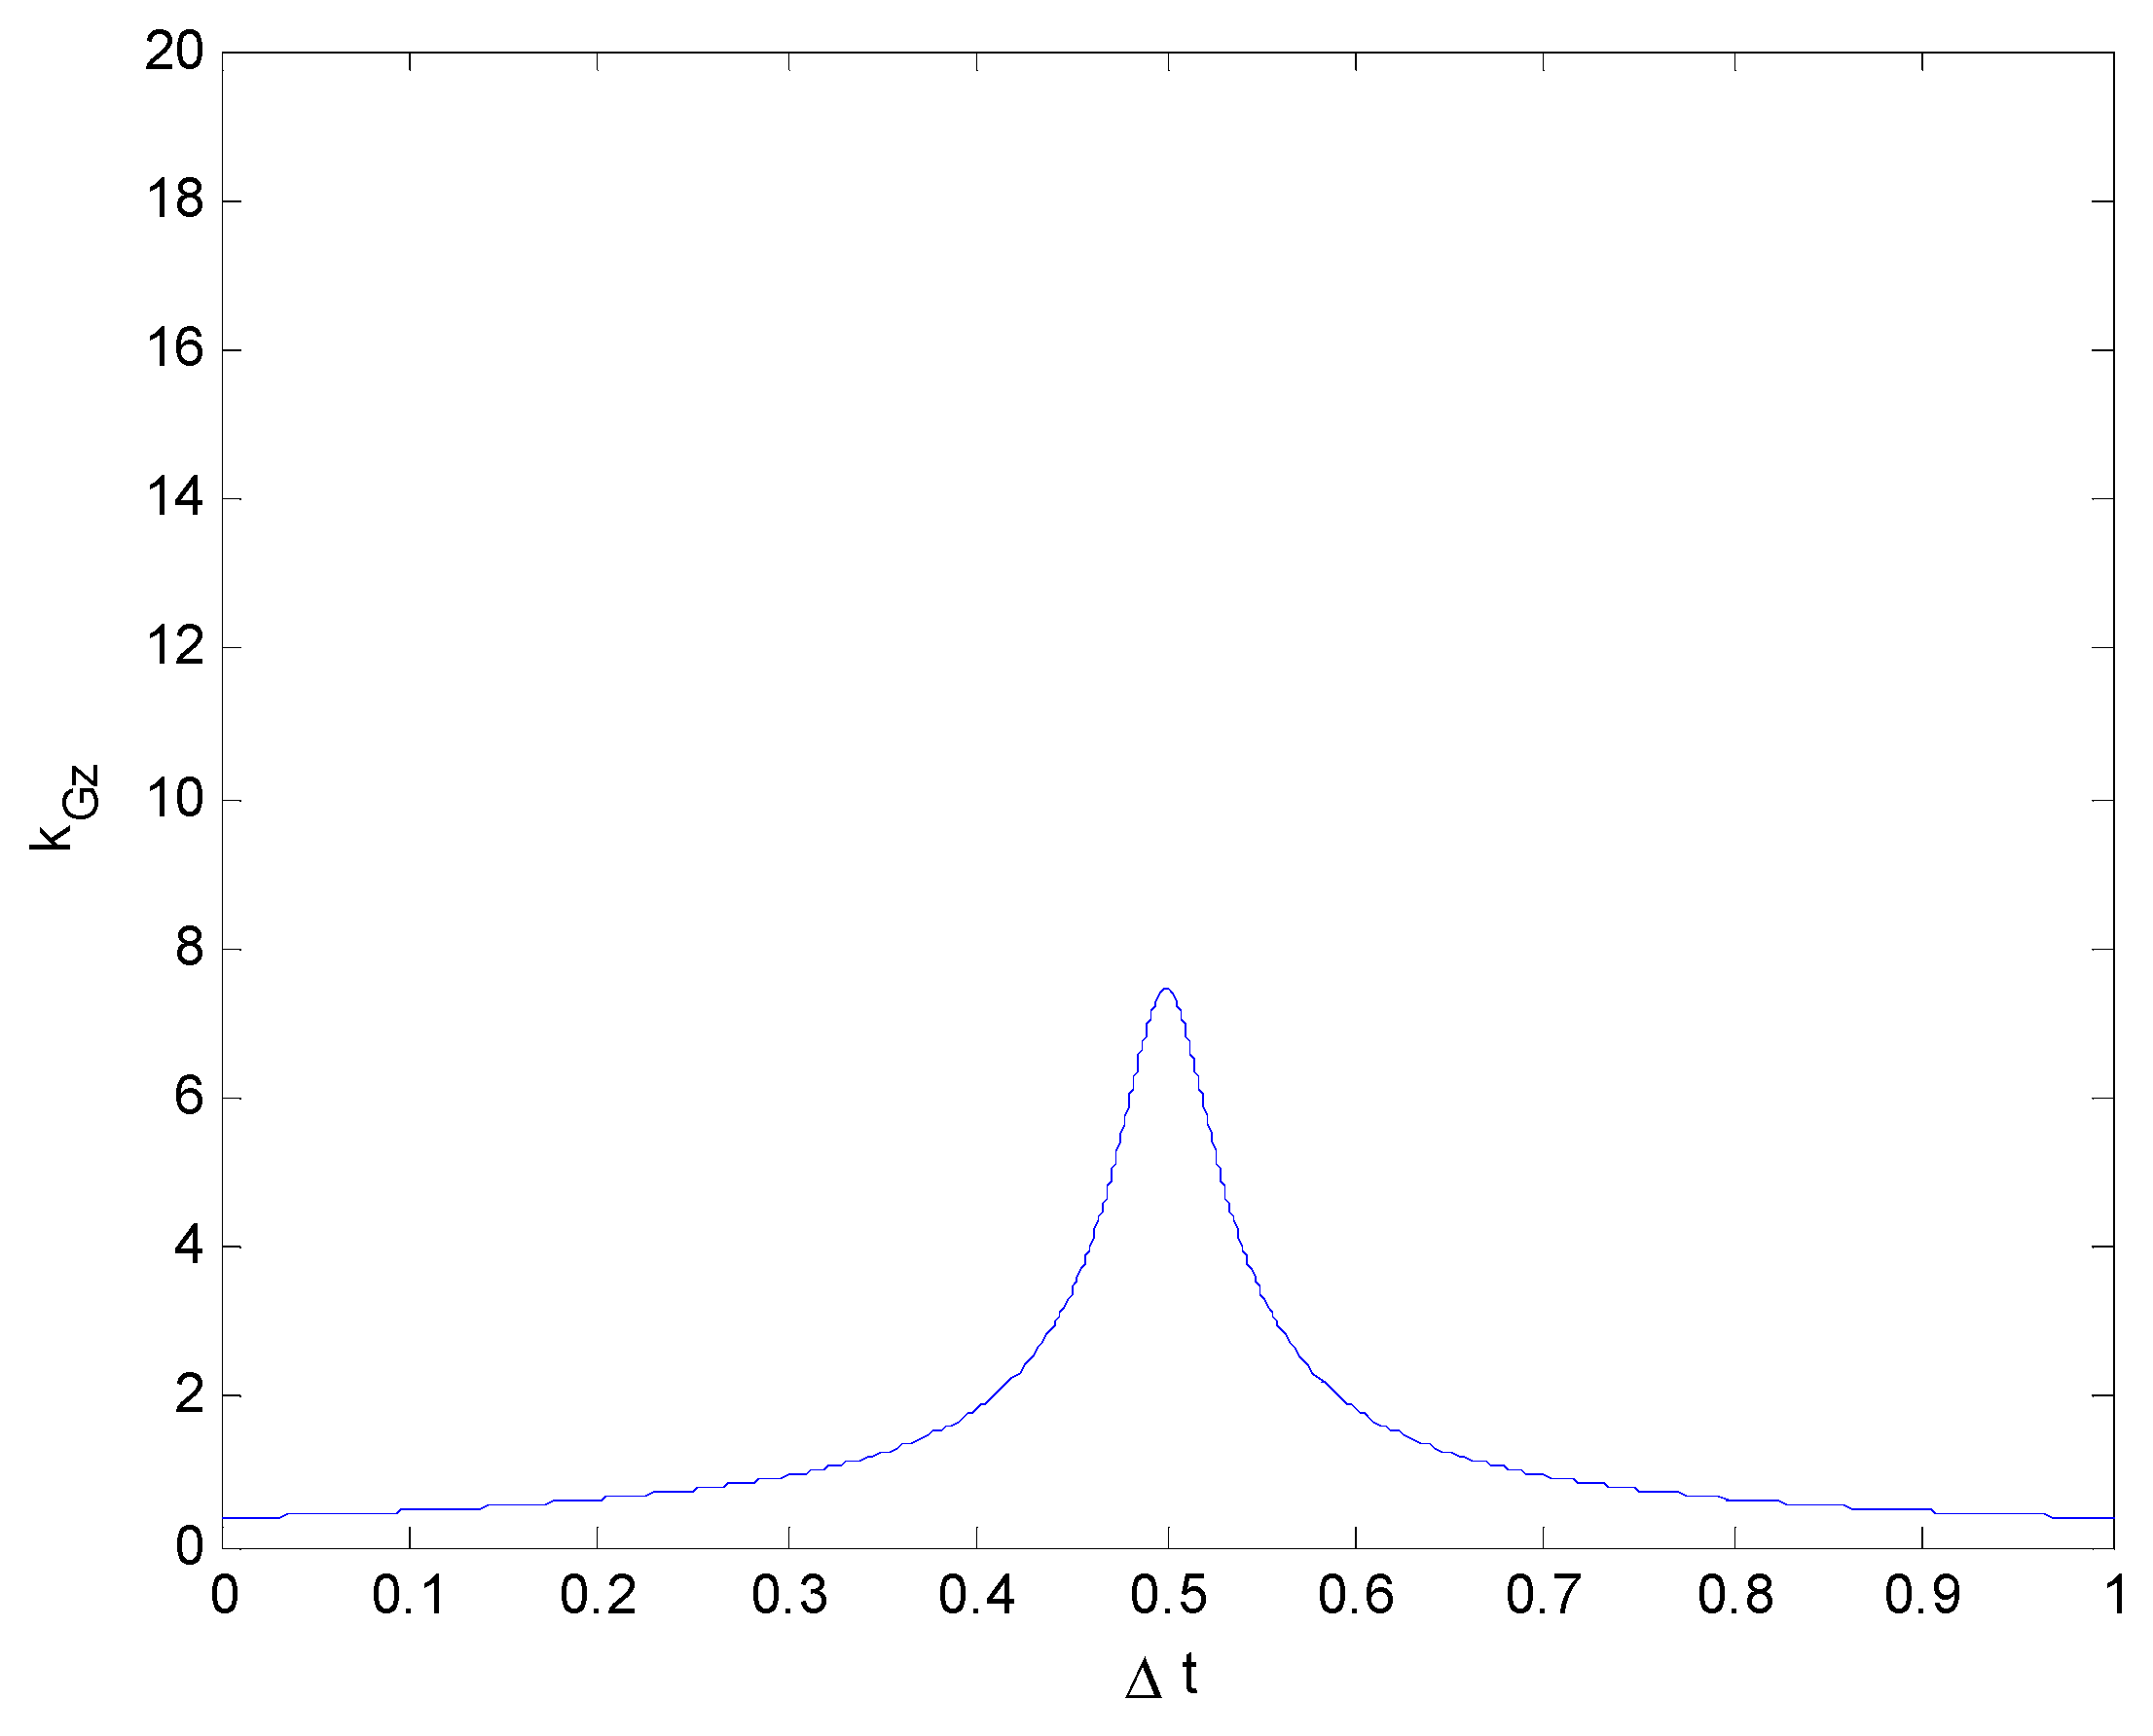
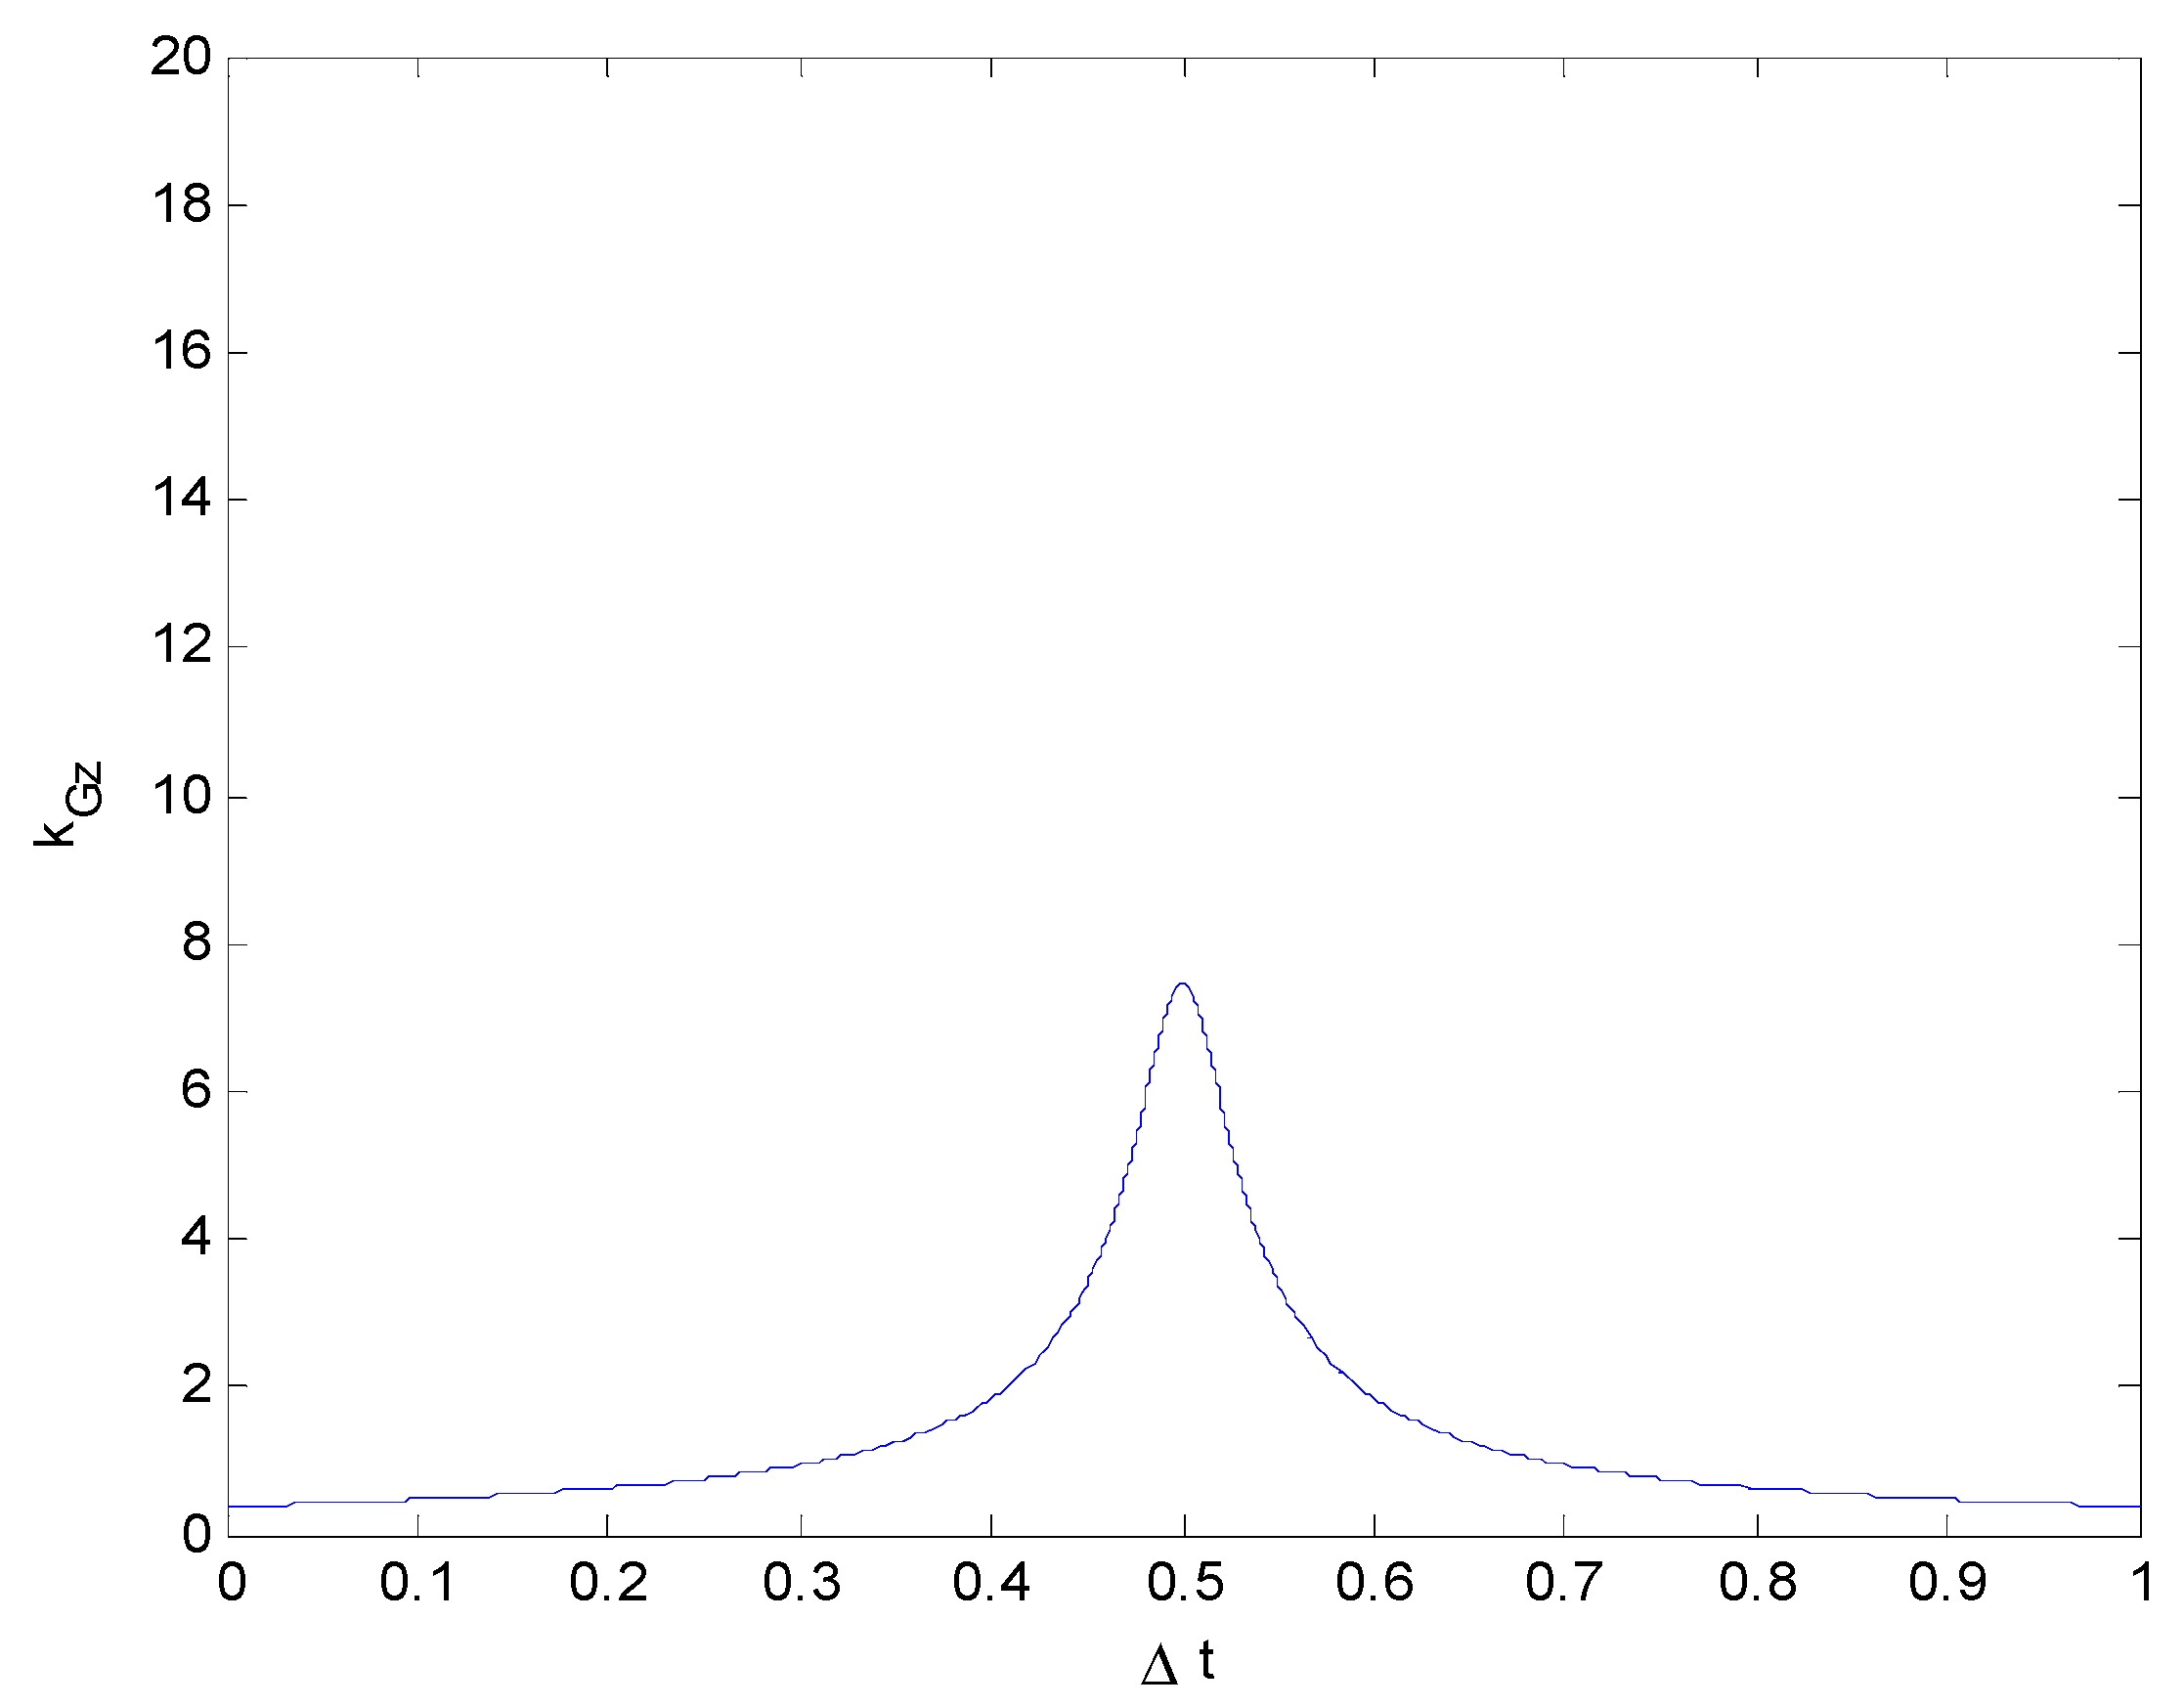
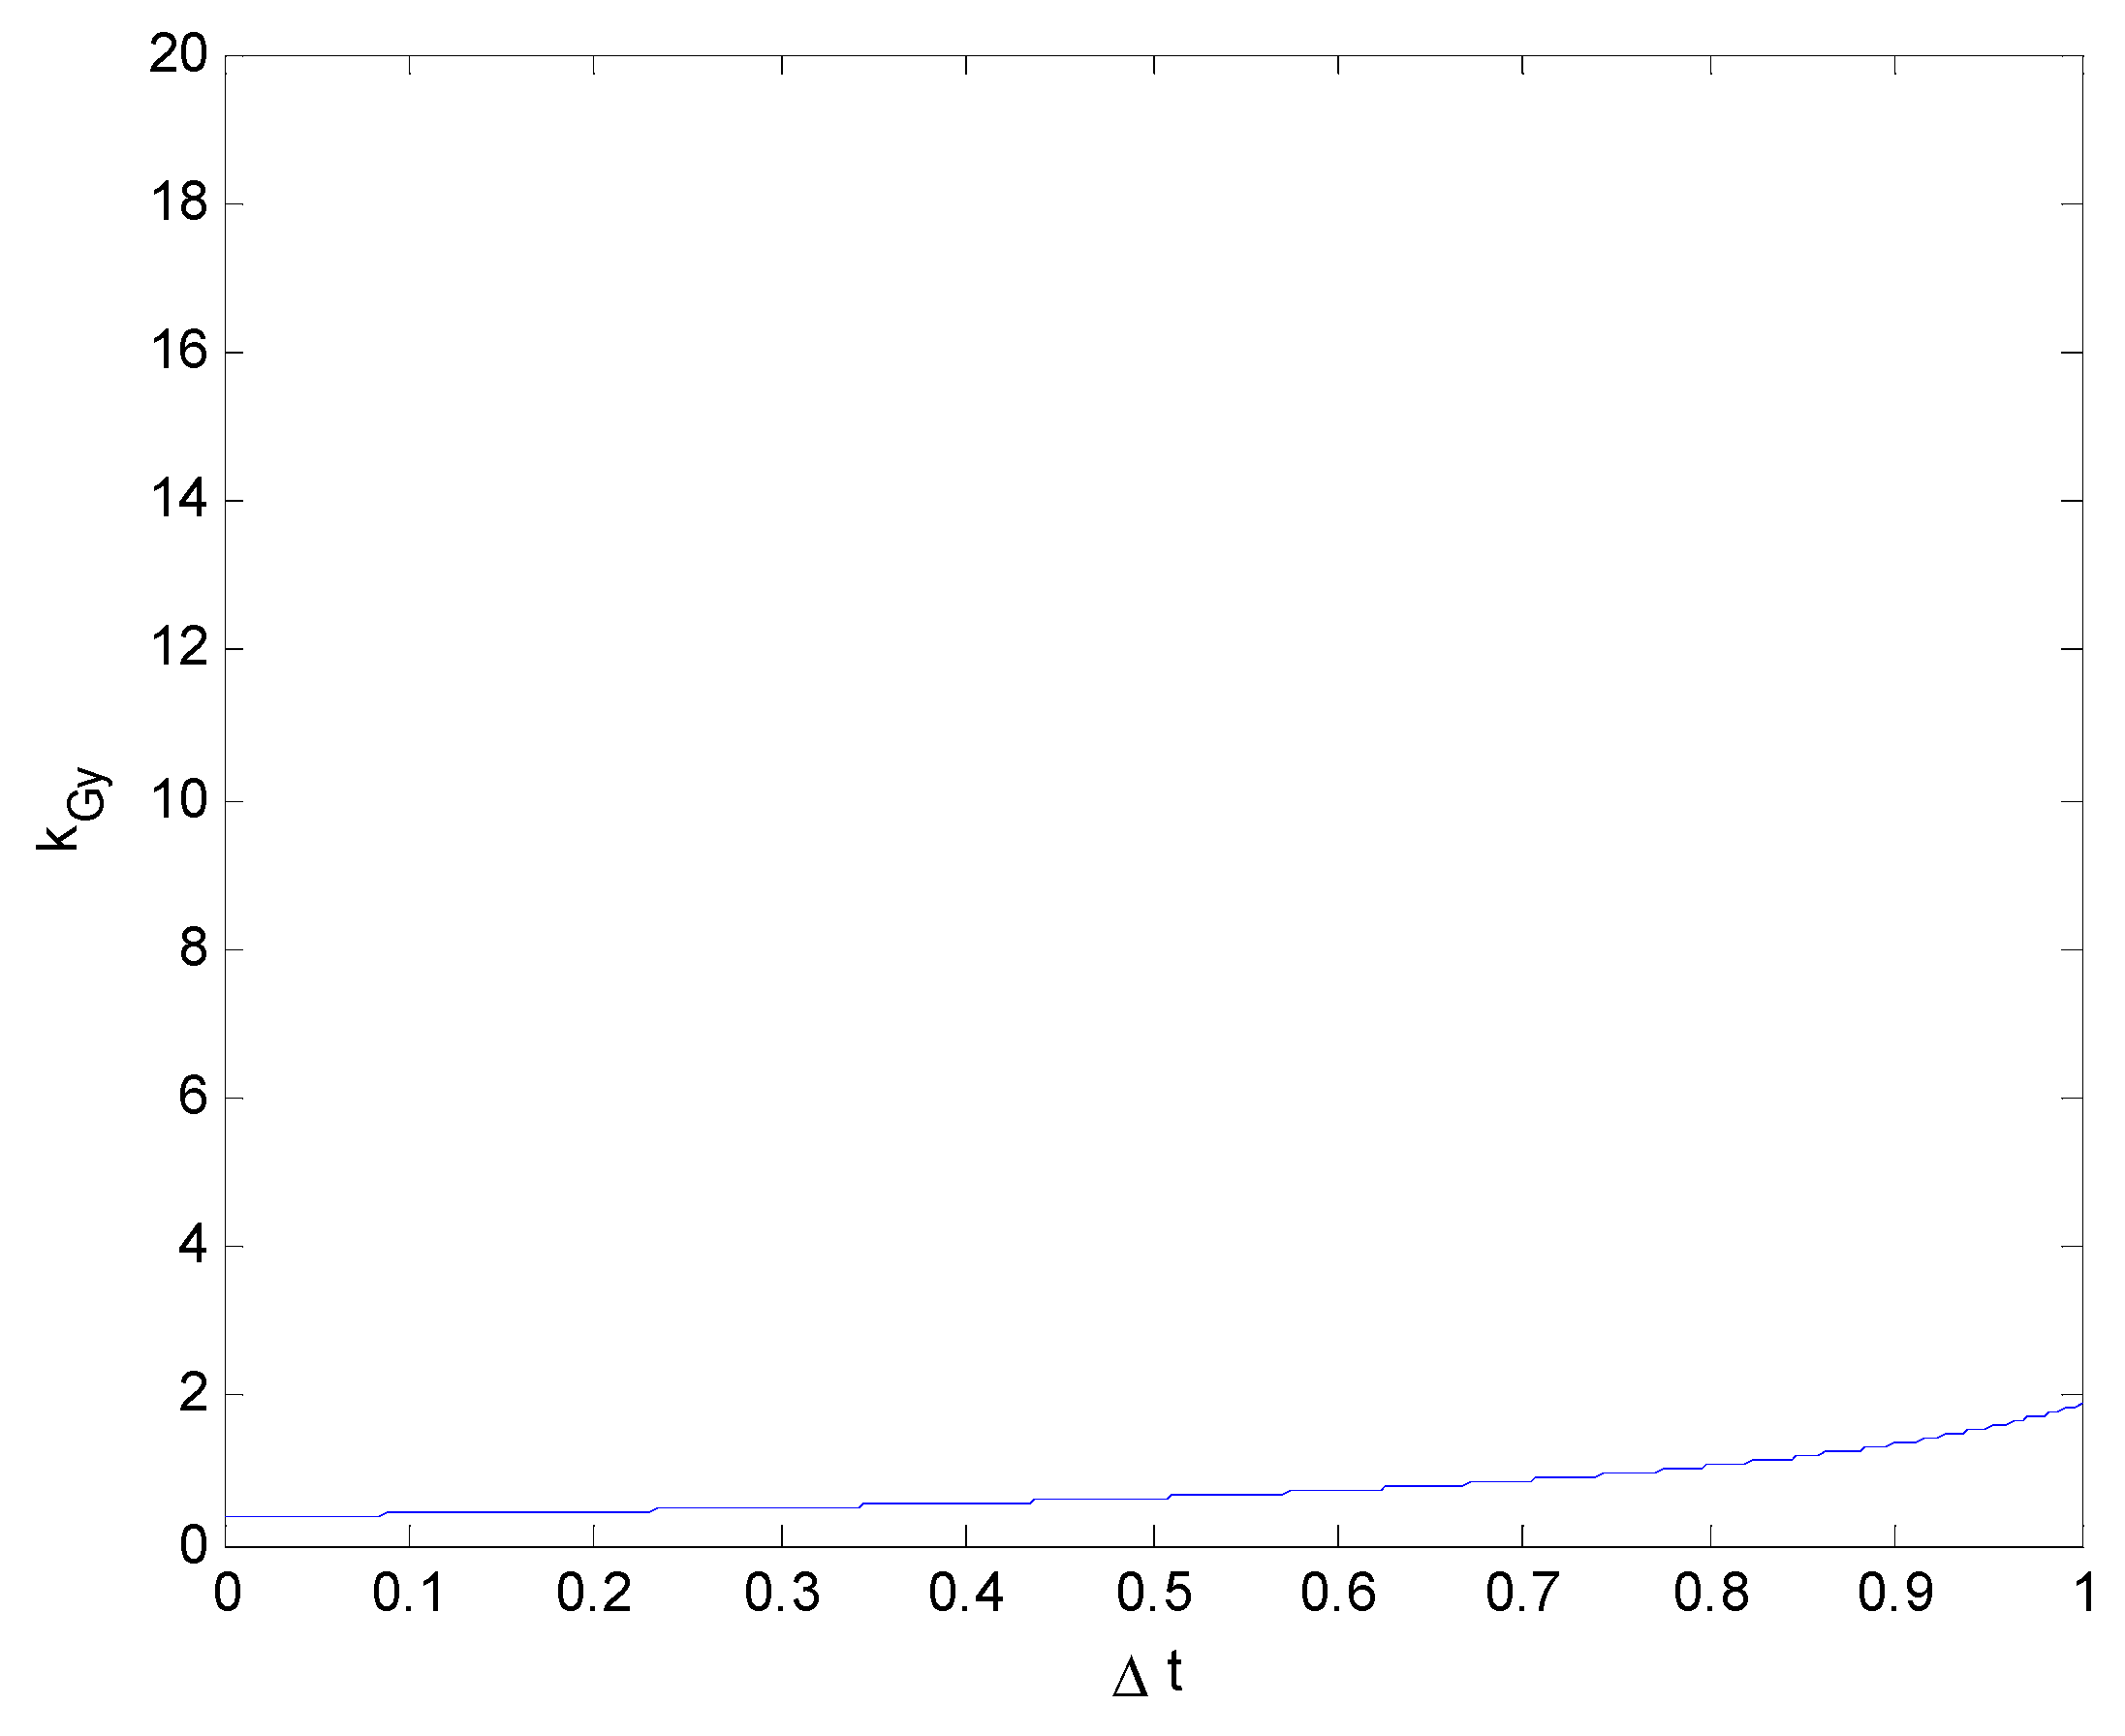
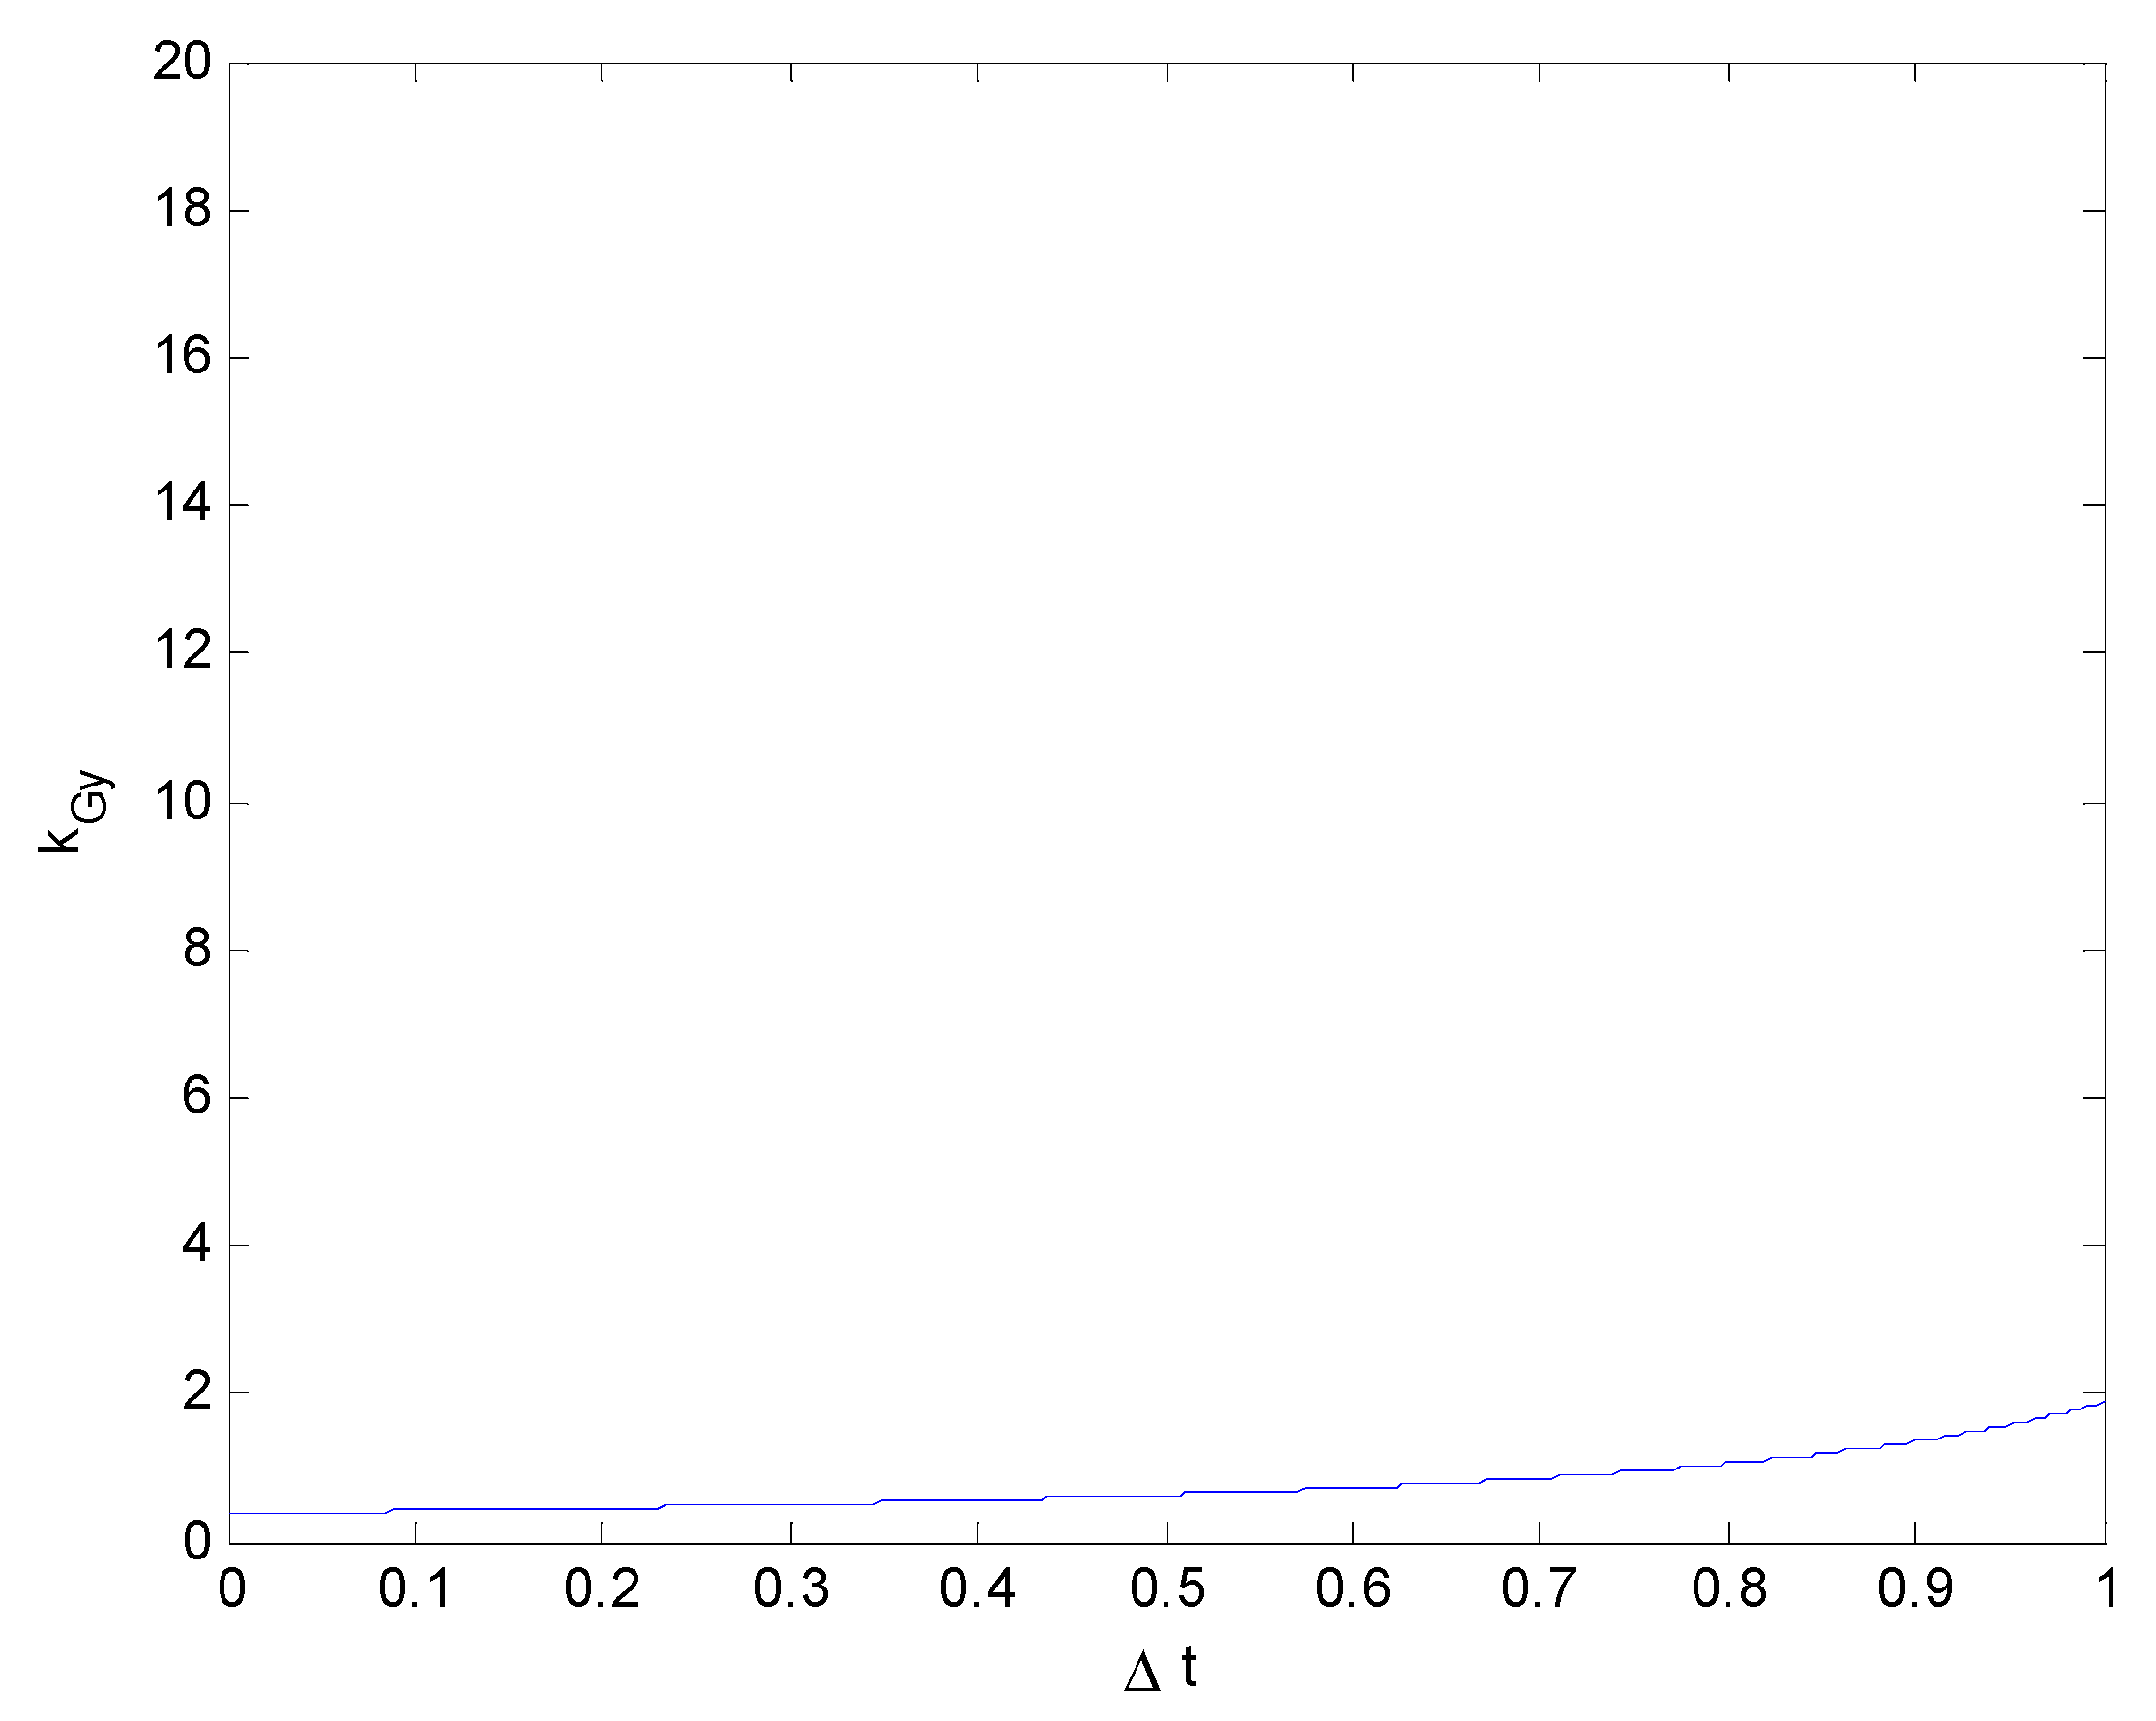
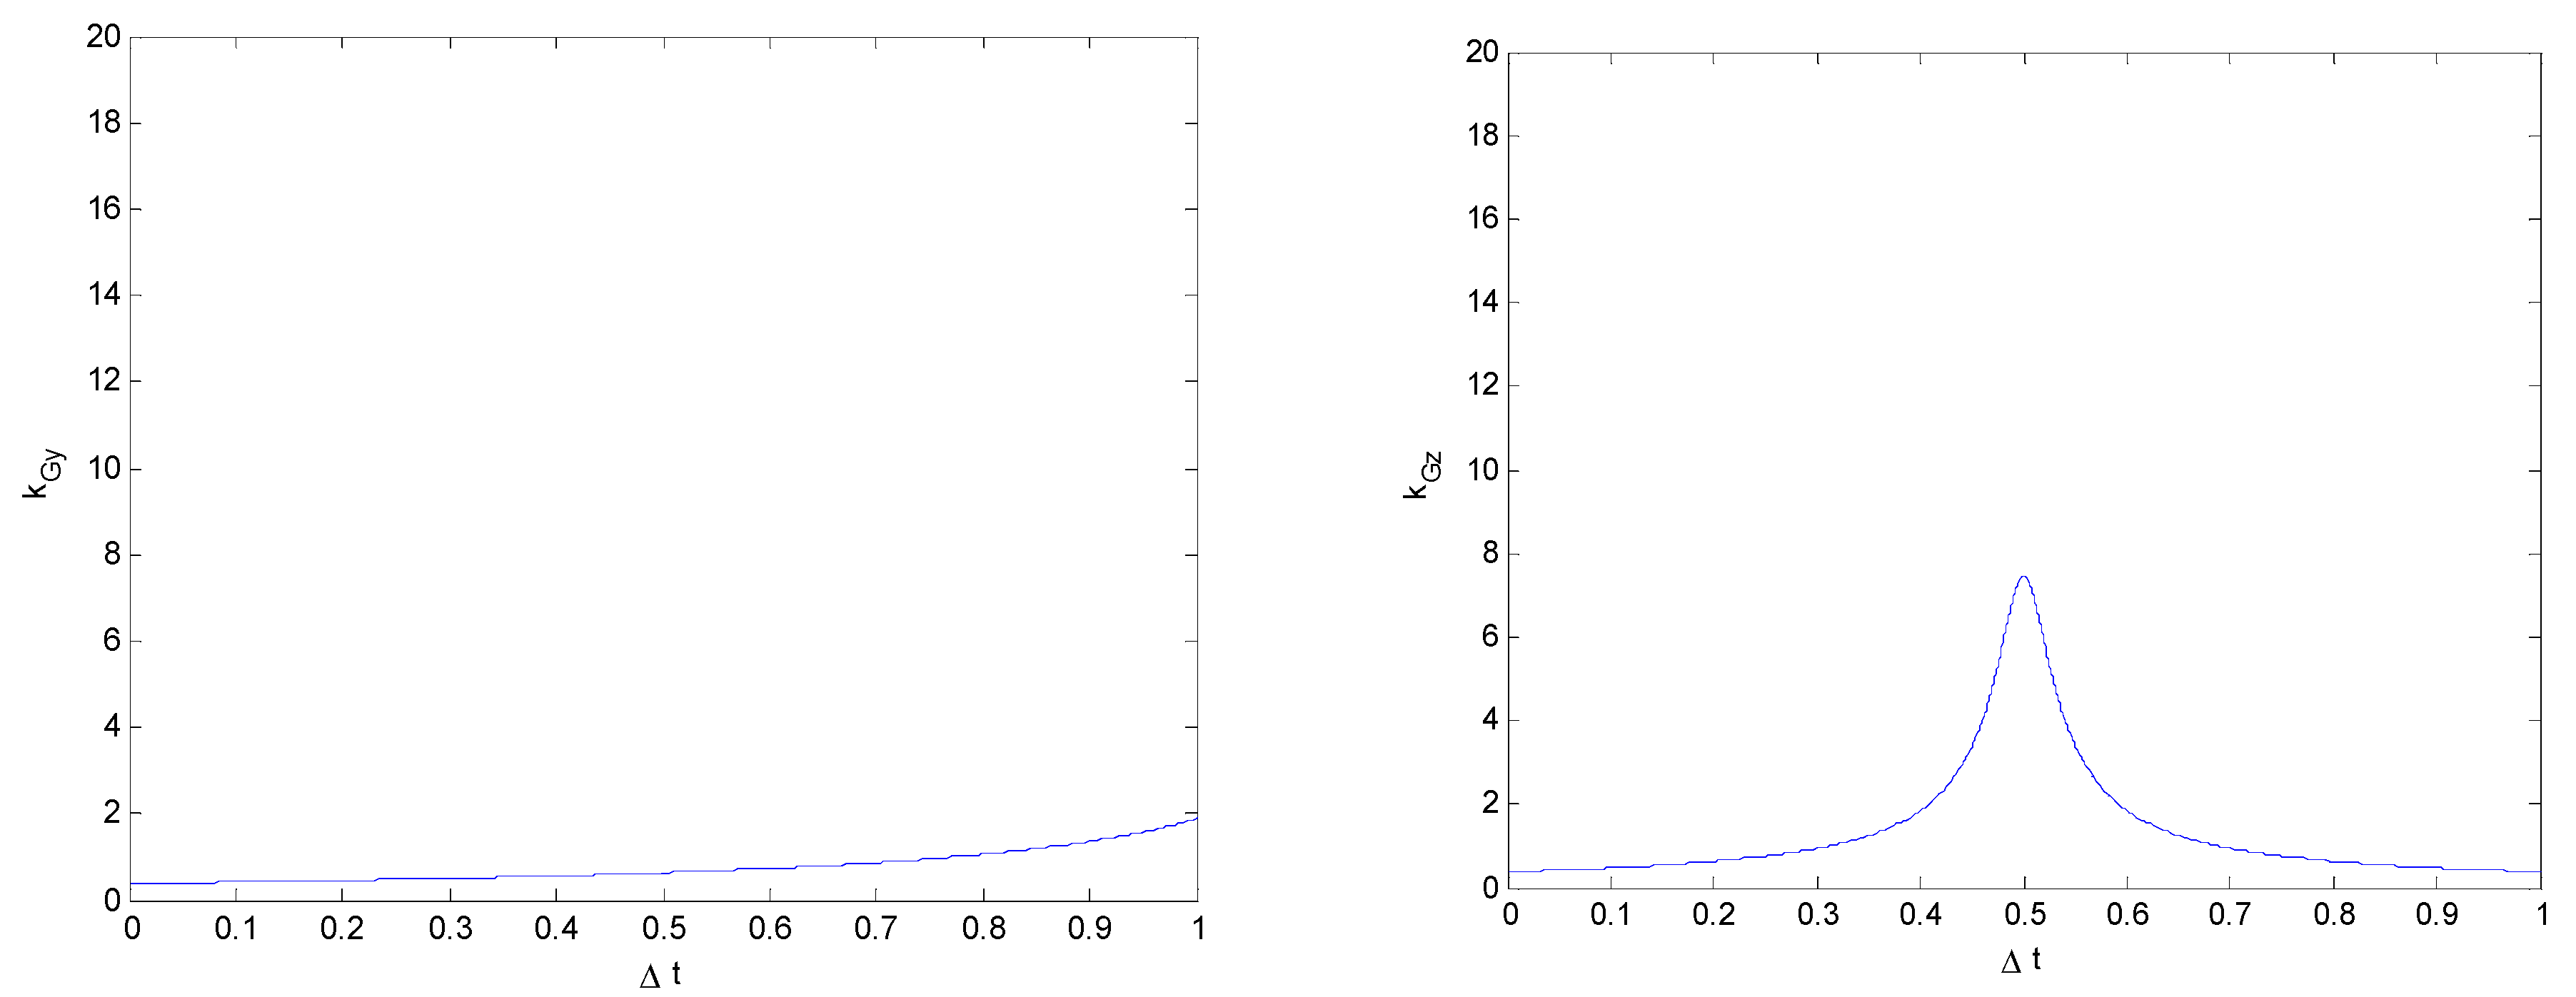
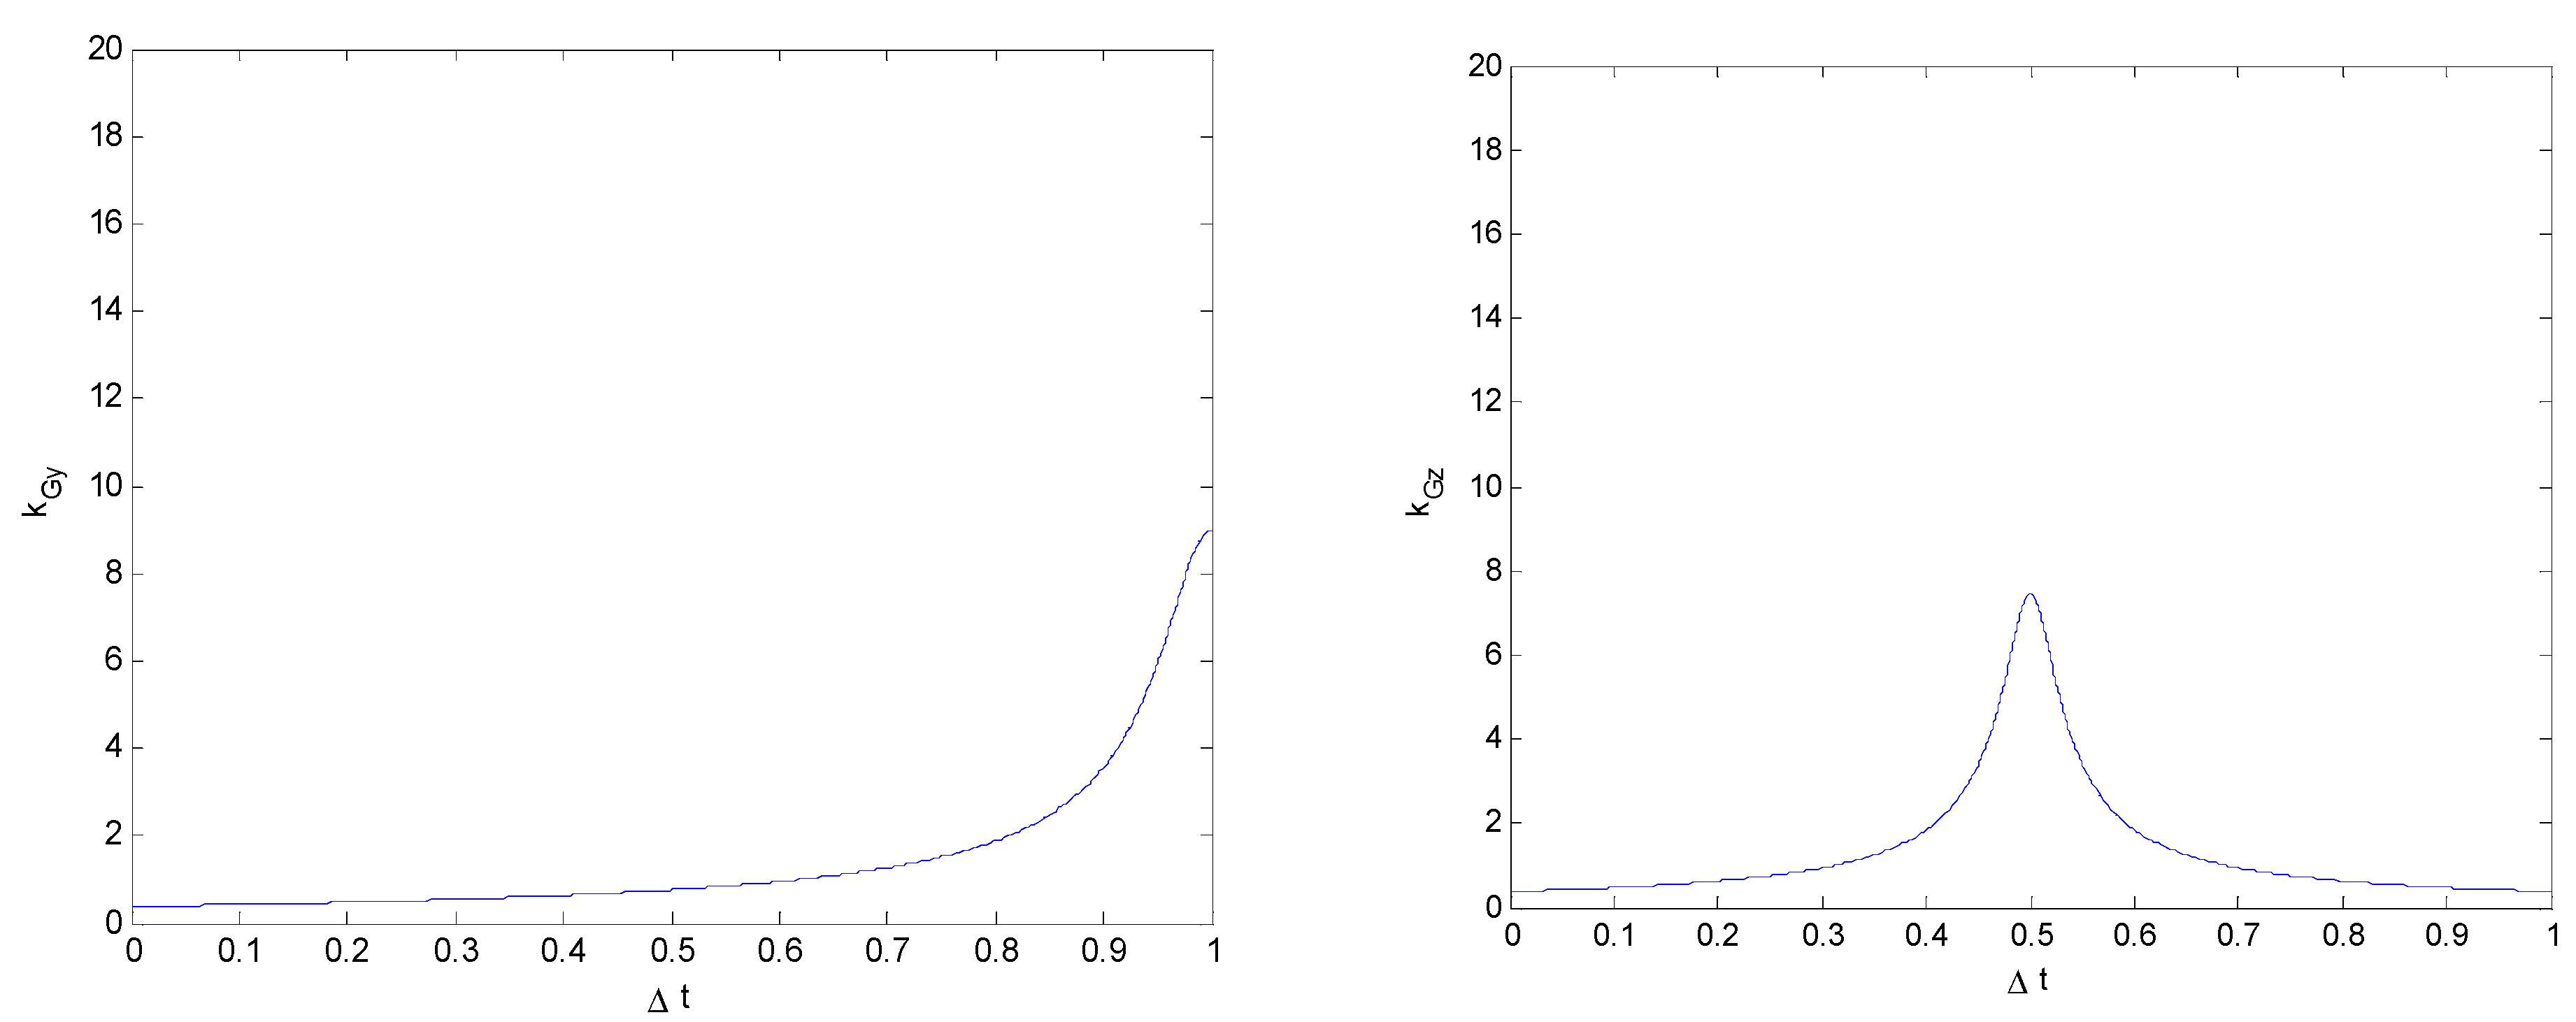
In Figure 9, two vehicles are shown to collide at point P. At this point, the impact force FT can be broken down into components in two directions: FTy parallel to the ground and FTz perpendicular to the ground. The ground friction force is F T f . Then, the equation of motion of the collision process is as follows:
m y ¨ = F T y F T f
m z ¨ = F T z + N m g
I D θ ¨ = F T y H p + F T z T m g T 2
In Formula (15), I D = I x x + m ( T 2 4 + H g 2 ) ,
M D = F T y H P + F T z T m g T 2 .
Similar to the rollover collision model analysis considering vehicles and road obstacles, the approximate expression of the Z-direction displacement and rotation angle is given as
z = T 2 sin θ T 2 θ
z ˙ = T 2 θ ˙
z ¨ = W T 2 θ ¨
The following equations are obtained by integrating Equation (15c):
θ ˙ = θ ¨ d t = ( M D I D ) t
θ = θ ˙ d t = 1 2 ( M D I D ) t 2
At the end of the rollover collision, the ω 1, Vz1, Vy1, and z1 values of the vehicle are, respectively,
V z 1 = T M D 2 I D Δ t
z 1 = T M D 4 I D ( Δ t ) 2
ω 1 = M D I D Δ t
V y 1 = V y 0 F T y F T f m Δ t .
Using the conservation of energy,
( F T y H P + F T z T m g T 2 ) 2 ( Δ t ) 2 + m g T 2 ( I D I D + m T 2 4 ) ( F T y H P + F T z T m g T 2 ) ( Δ t ) 2 + m ( V y 0 ( F T y F T f ) m Δ t ) 2 = 2 m g ( T 2 4 + H g 2 H g ) ( I D 2 I D + m T 2 4 )
Let k G z = F T z m g and k G y = F T y m g .
Then, the above formula can be rewritten as
( k G y H P T + k G z 0.5 ) 2 ( Δ t ) 2 + 1 2 ( I D I D + m T 2 4 ) ( k G y H P T + k G z 0.5 ) ( Δ t ) 2 + 1 m T 2 ( V y 0 g ( k G y F T f m g ) Δ t ) 2 = 2 m g T ( 1 4 + ( H g T ) 2 H g T ) ( I D 2 I D + m T 2 4 )
Let k G y z = k G y H p T + k G z . Then, Formula (23) can be written as
( k G y z 0.5 ) 2 ( Δ t ) 2 + 1 2 ( I D I D + m T 2 4 ) ( k G y z 0.5 ) ( Δ t ) 2 + 1 m T 2 ( V y 0 g ( k G y F T f m g ) Δ t ) 2 = 2 m g T ( 1 4 + ( H g T ) 2 H g T ) ( I D 2 I D + m T 2 4 )
The relationships between kGy (kGz = 0), kGz (kGy = 0), and Δt are considered separately.
(1)
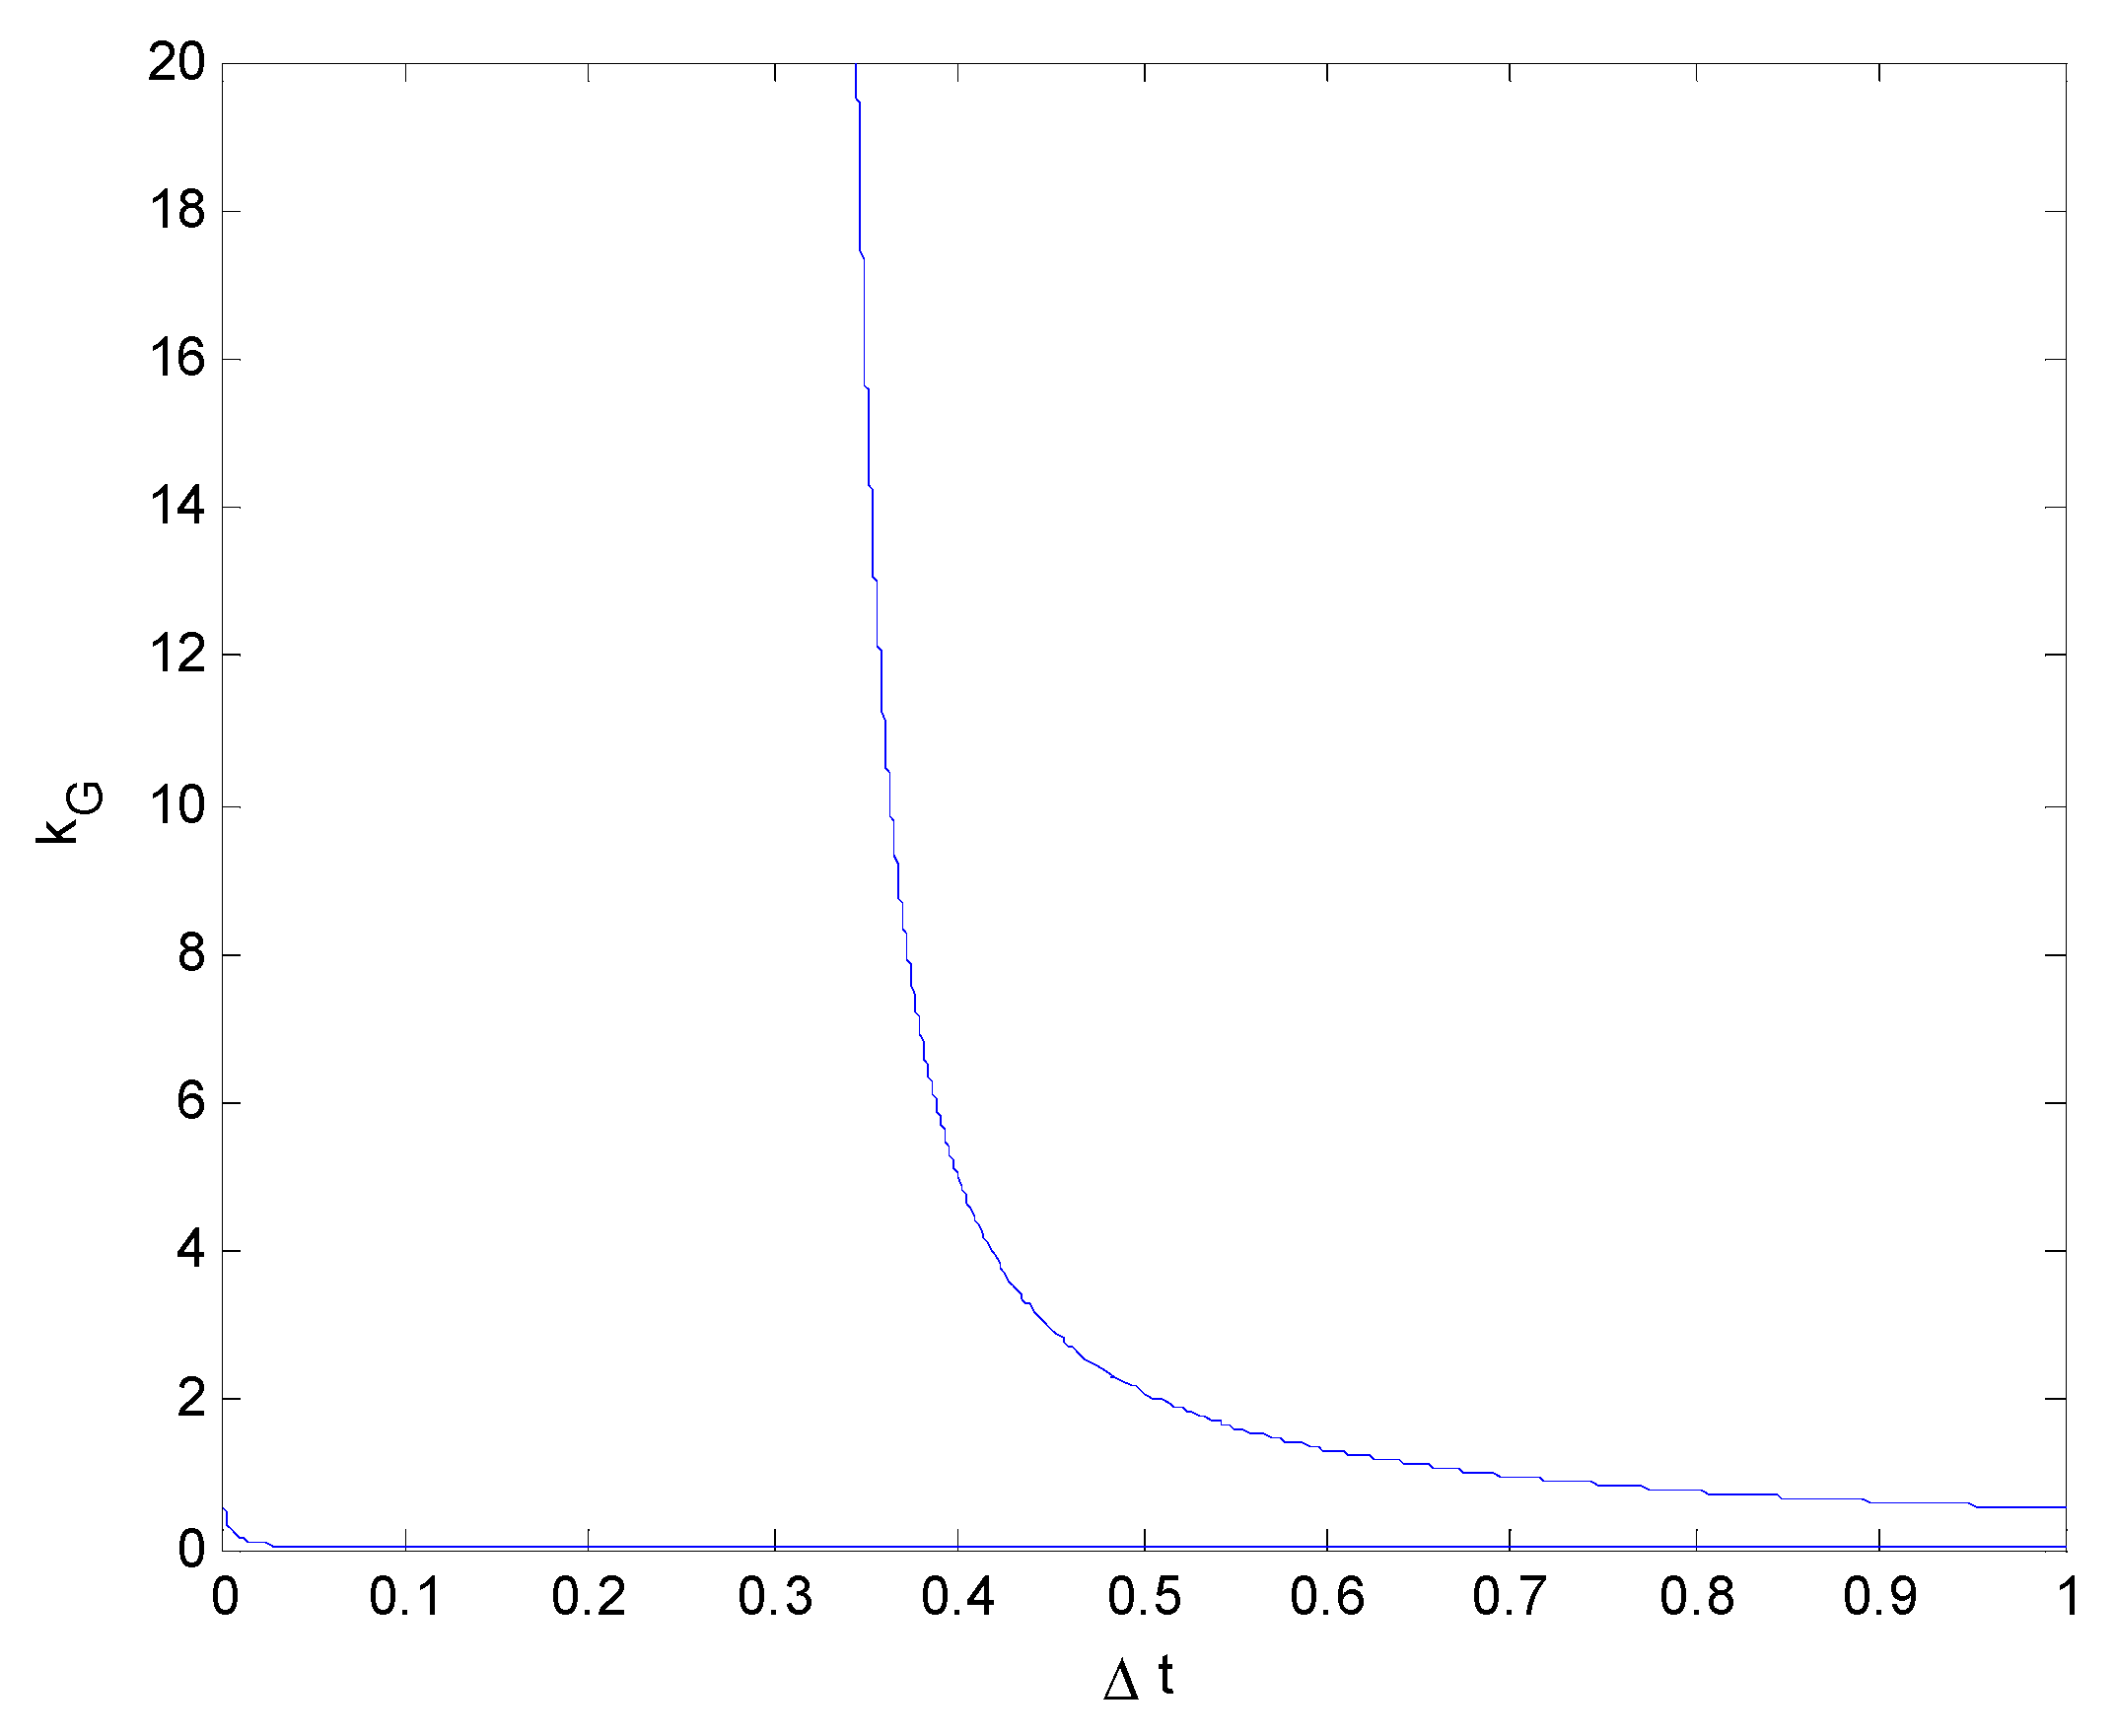
The relationship between kGz (kGy = 0) and the collision duration Δt.
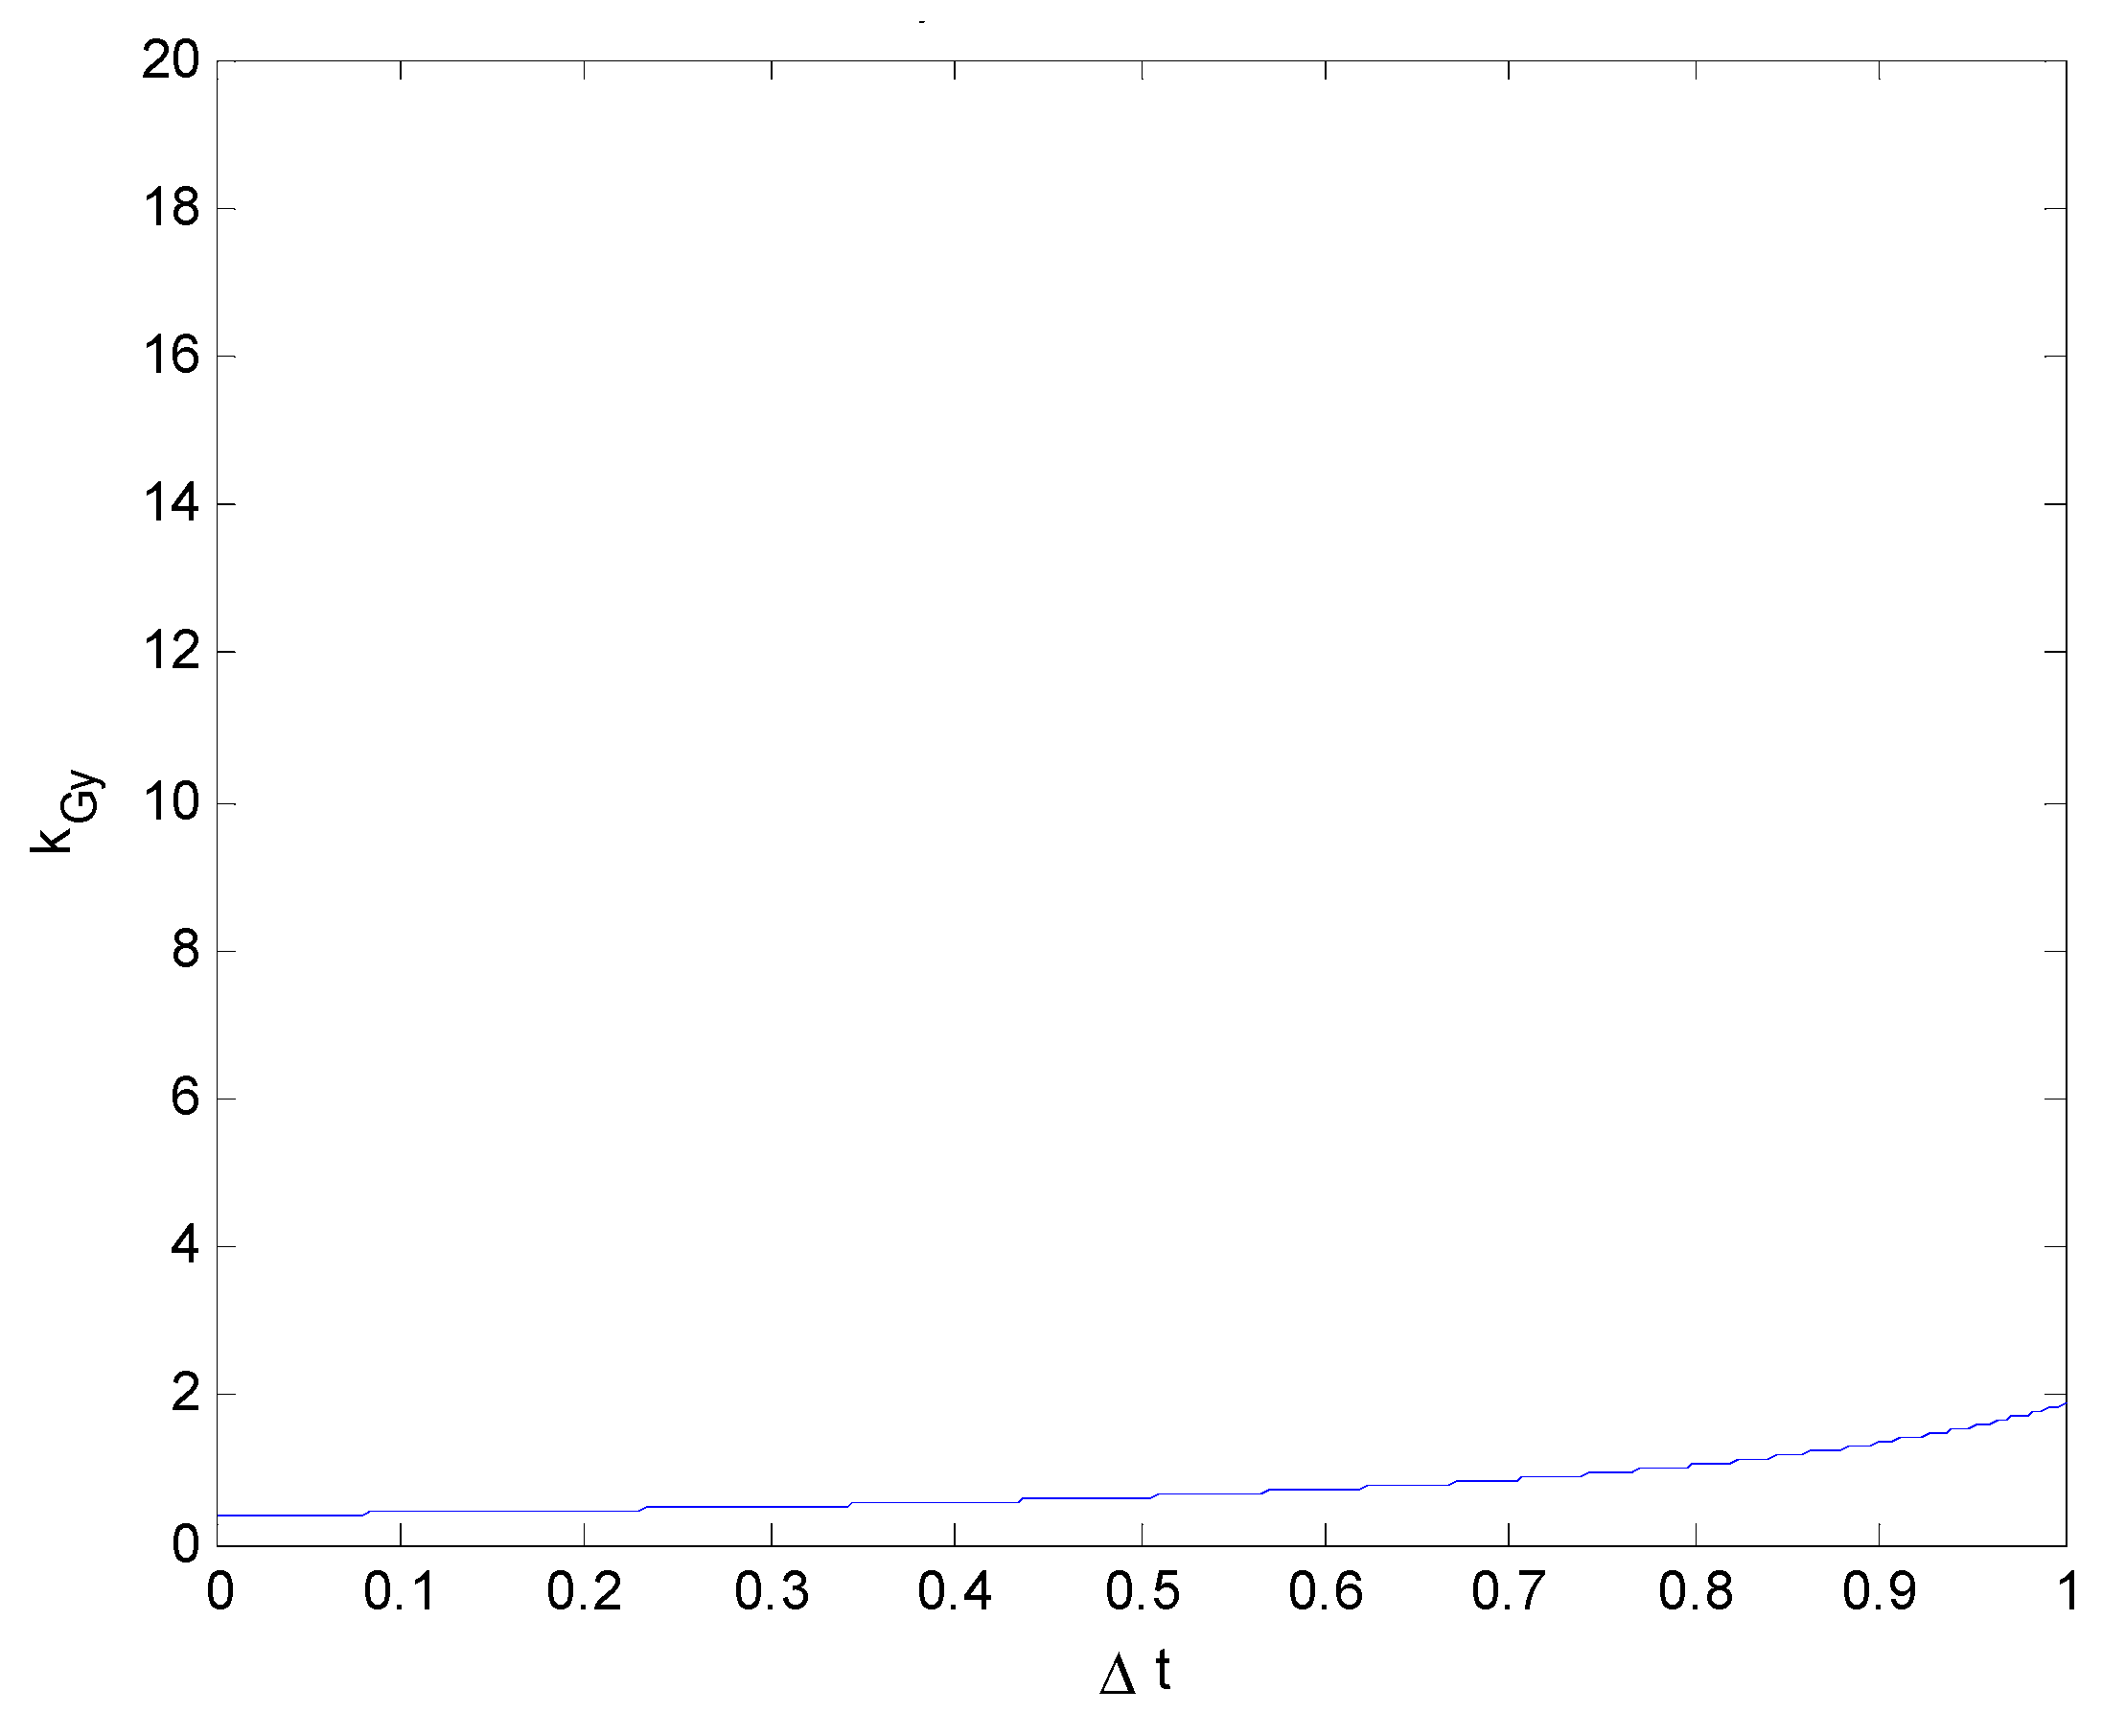
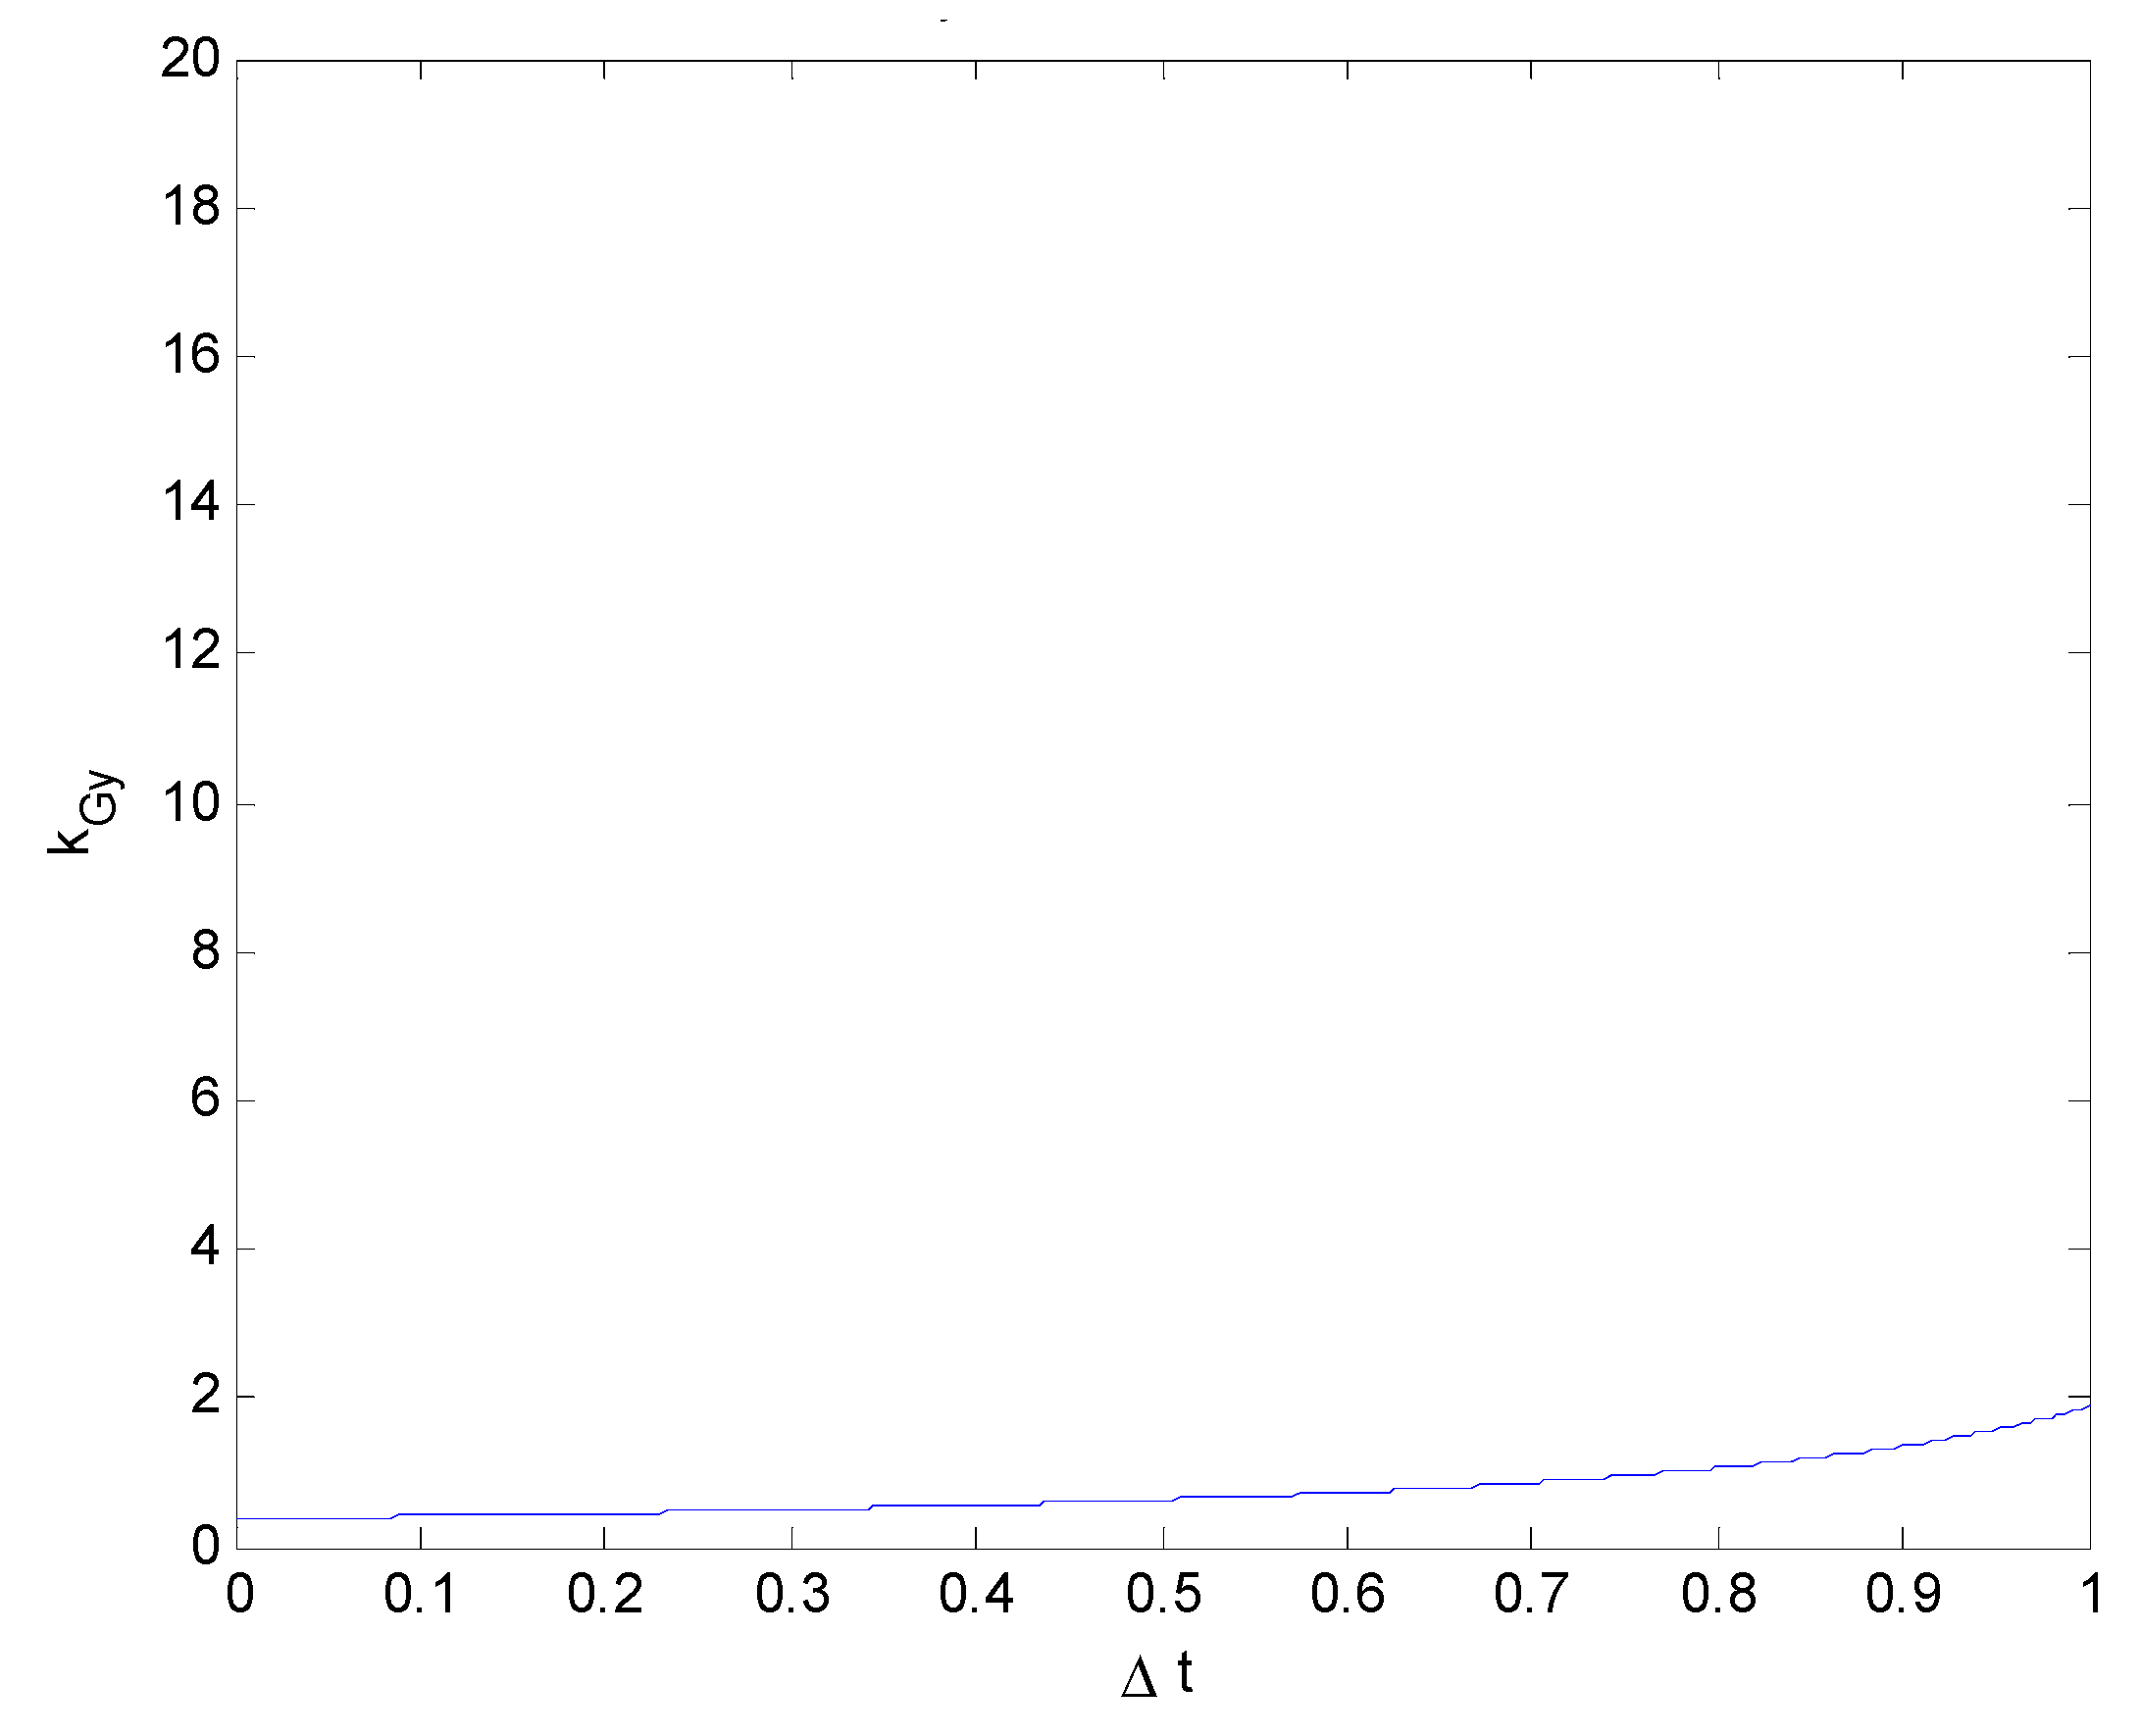
It can be clearly seen, from Figure 10, Figure 11, Figure 12 and Figure 13, that although the values of vy0 differ, they have little impact on kGz, which is consistent with reality: when the value of the lateral velocity vy0 changes, it does not strongly affect the impact force in the Z-direction.
(2)
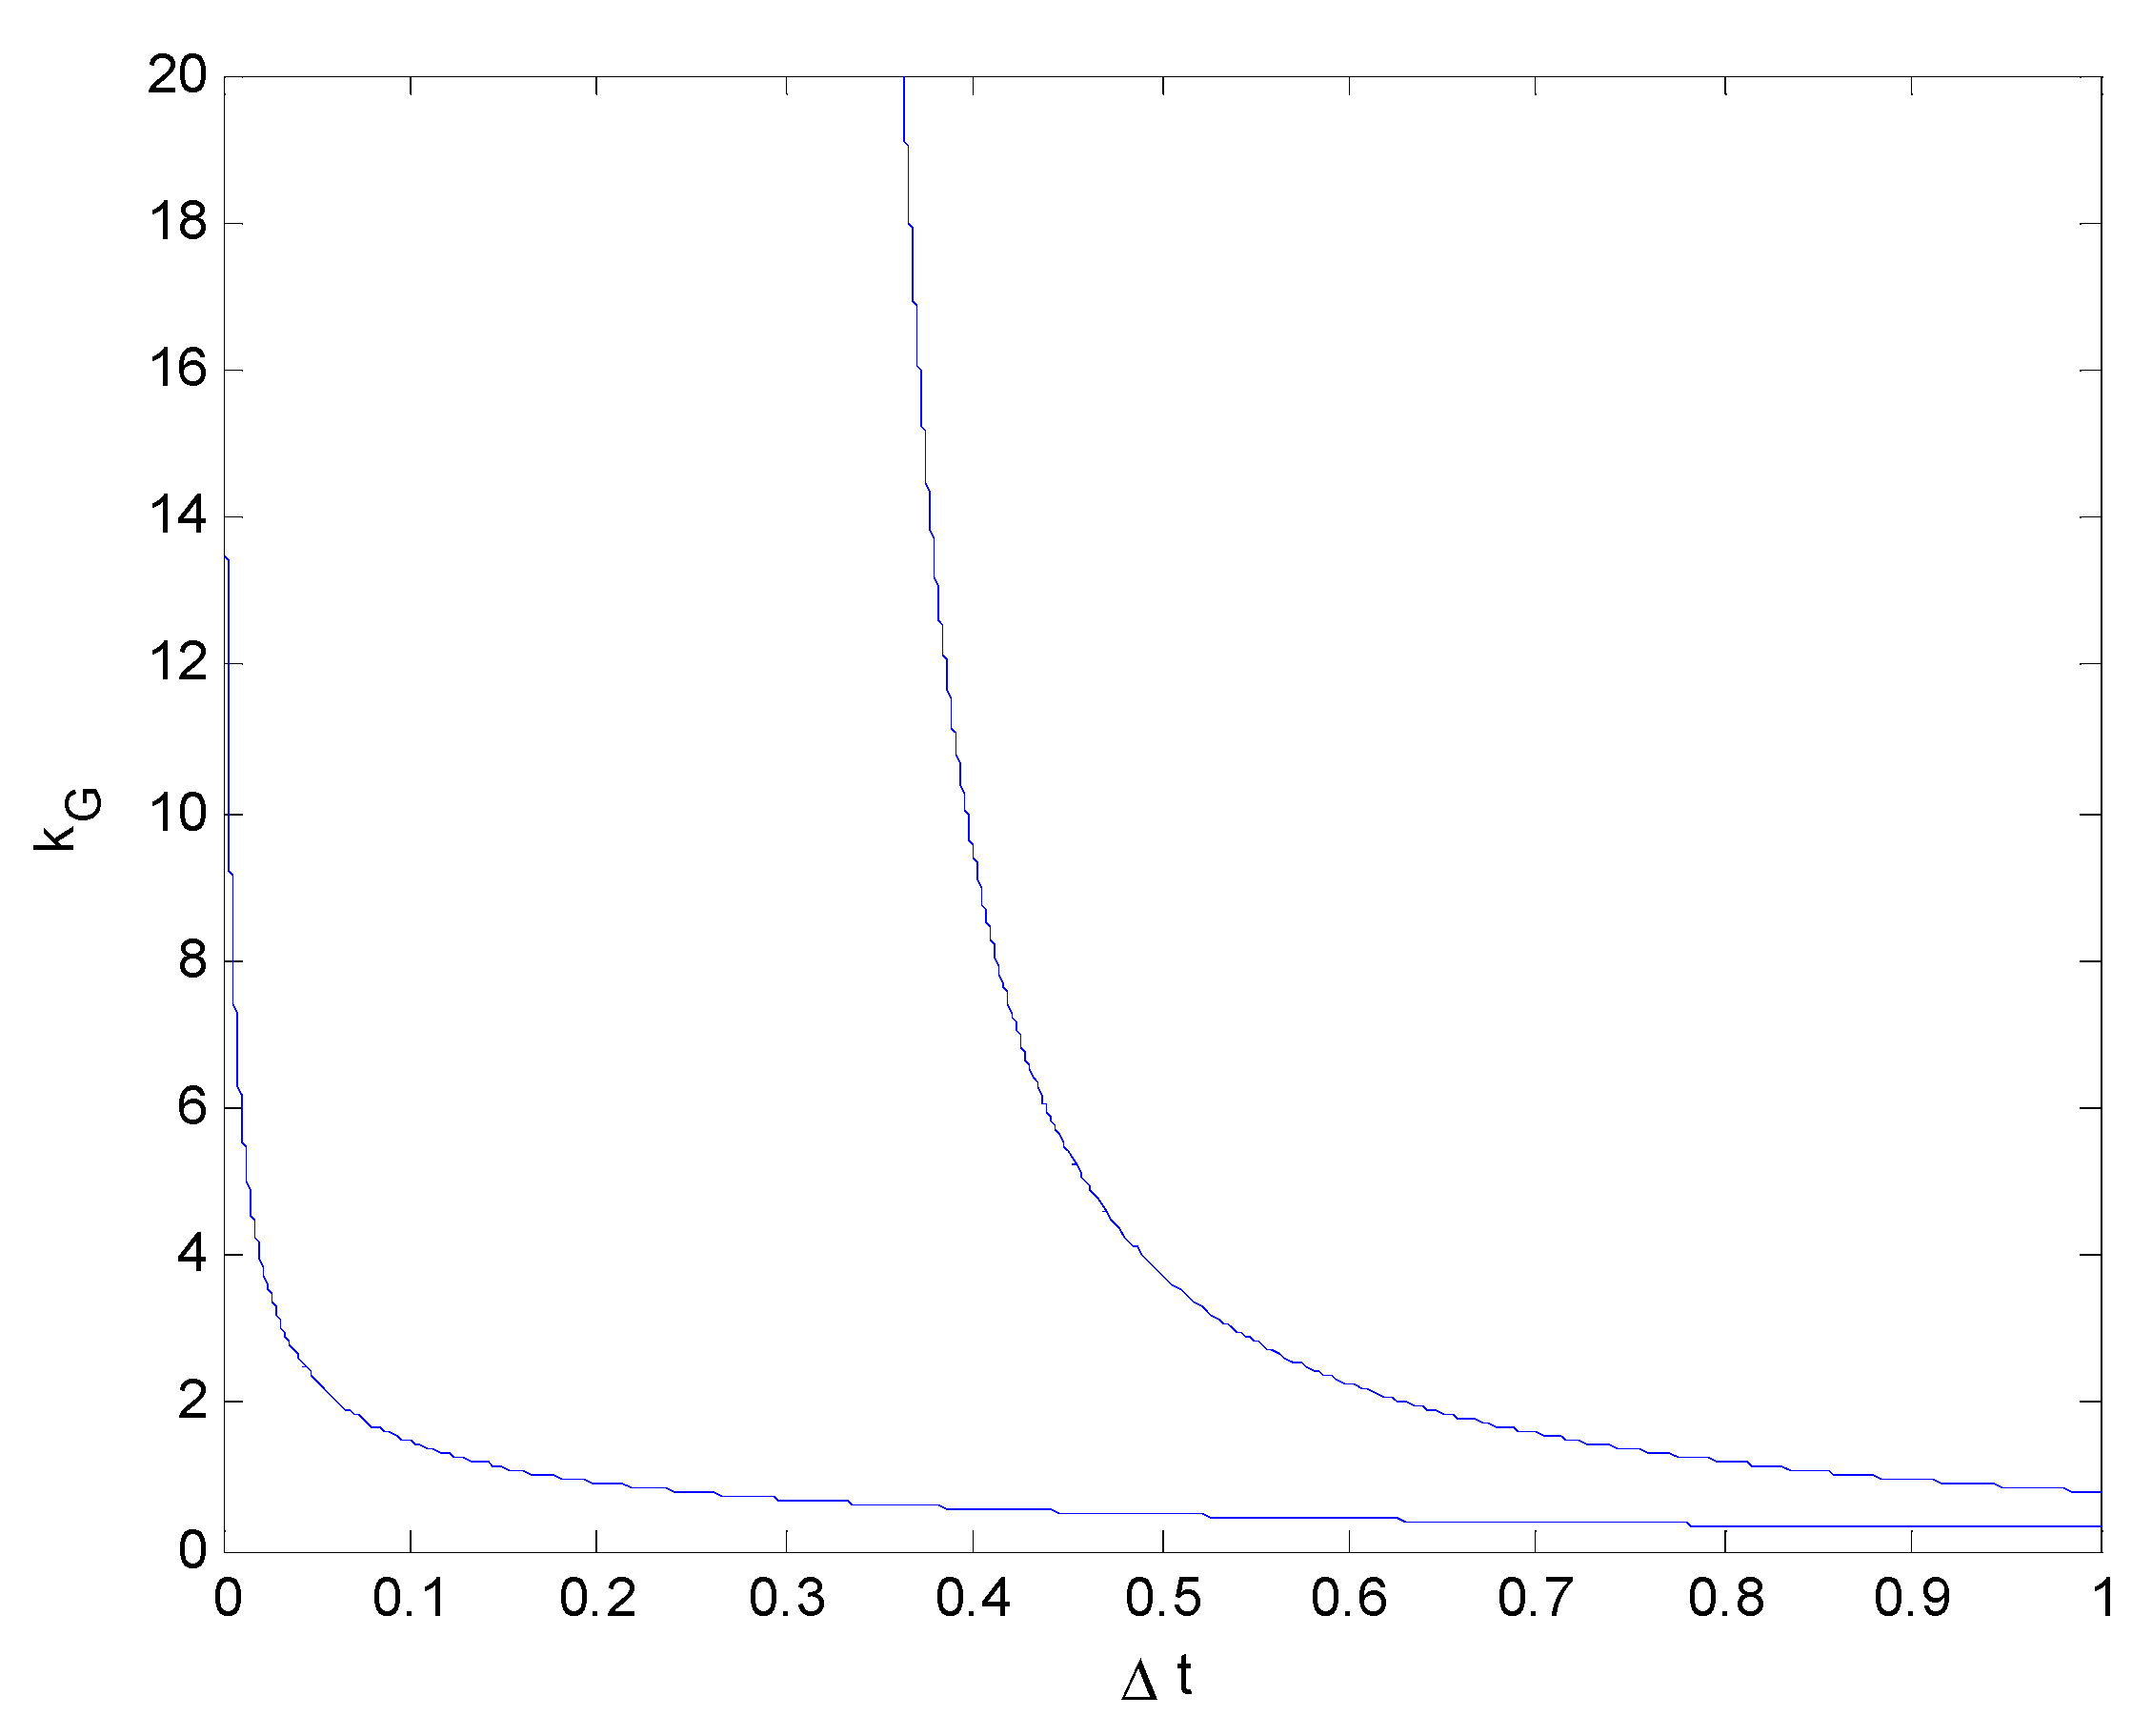
The relationship between kGy (kGz = 0) and the collision duration Δt.
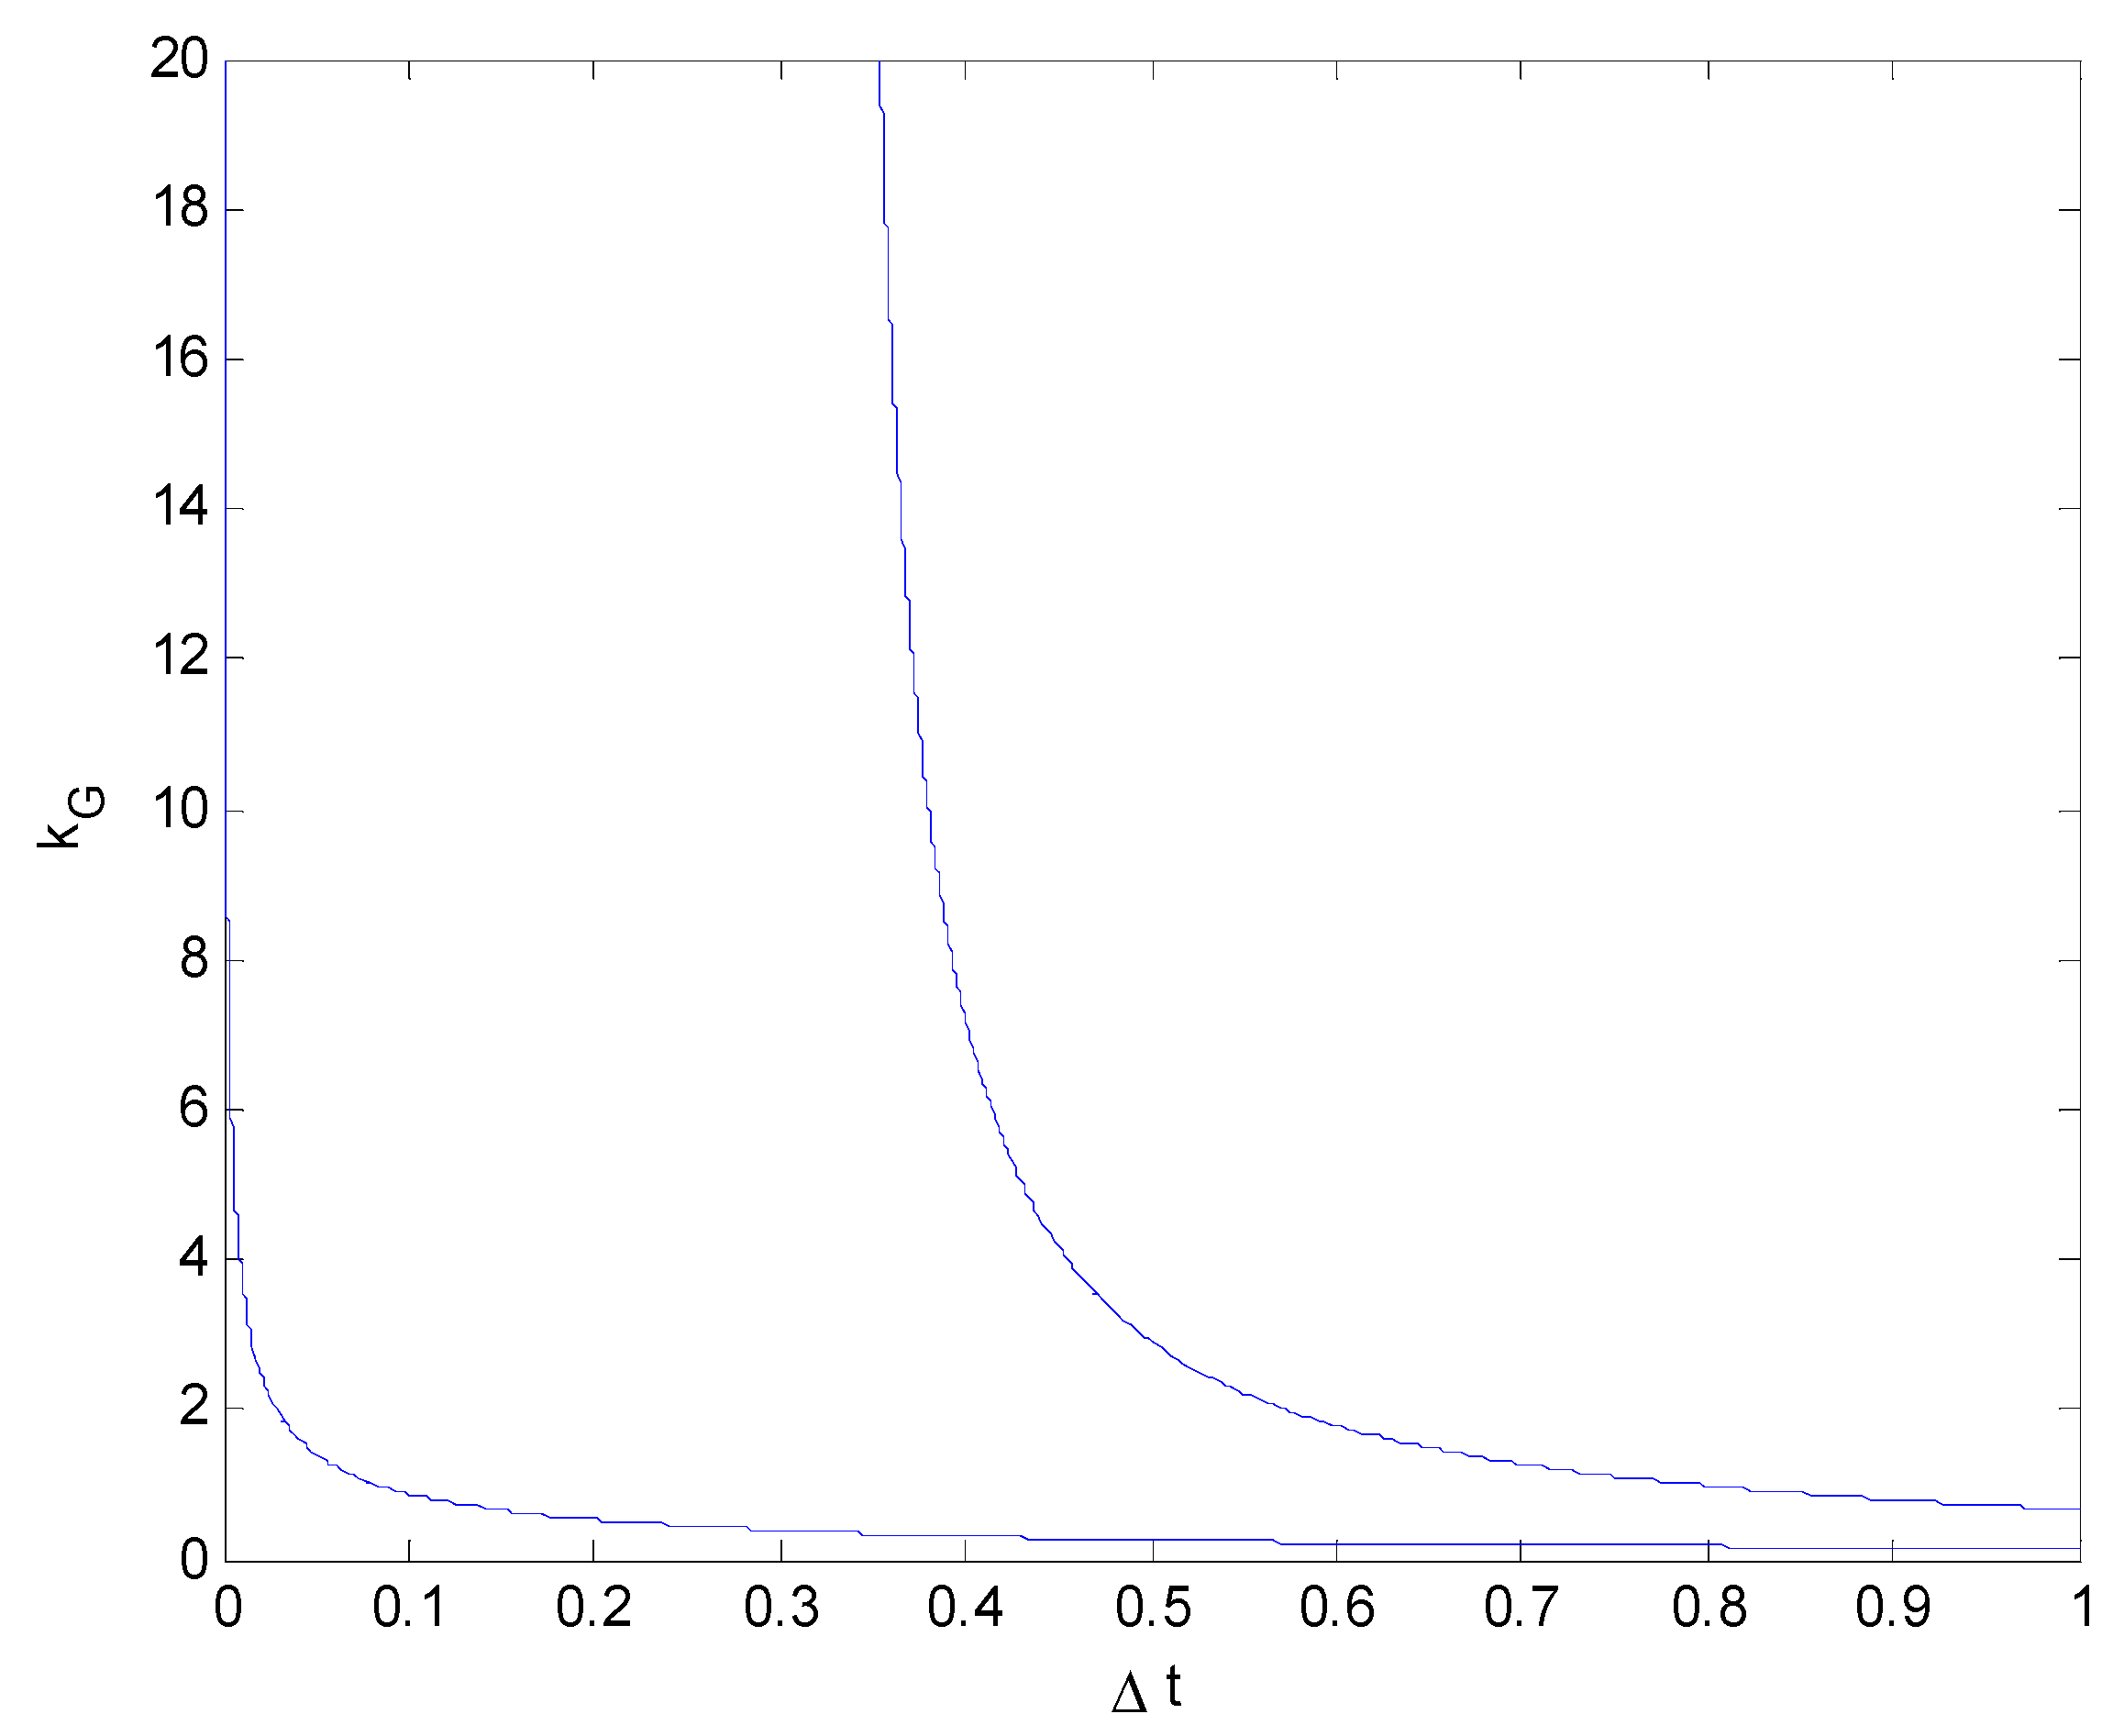
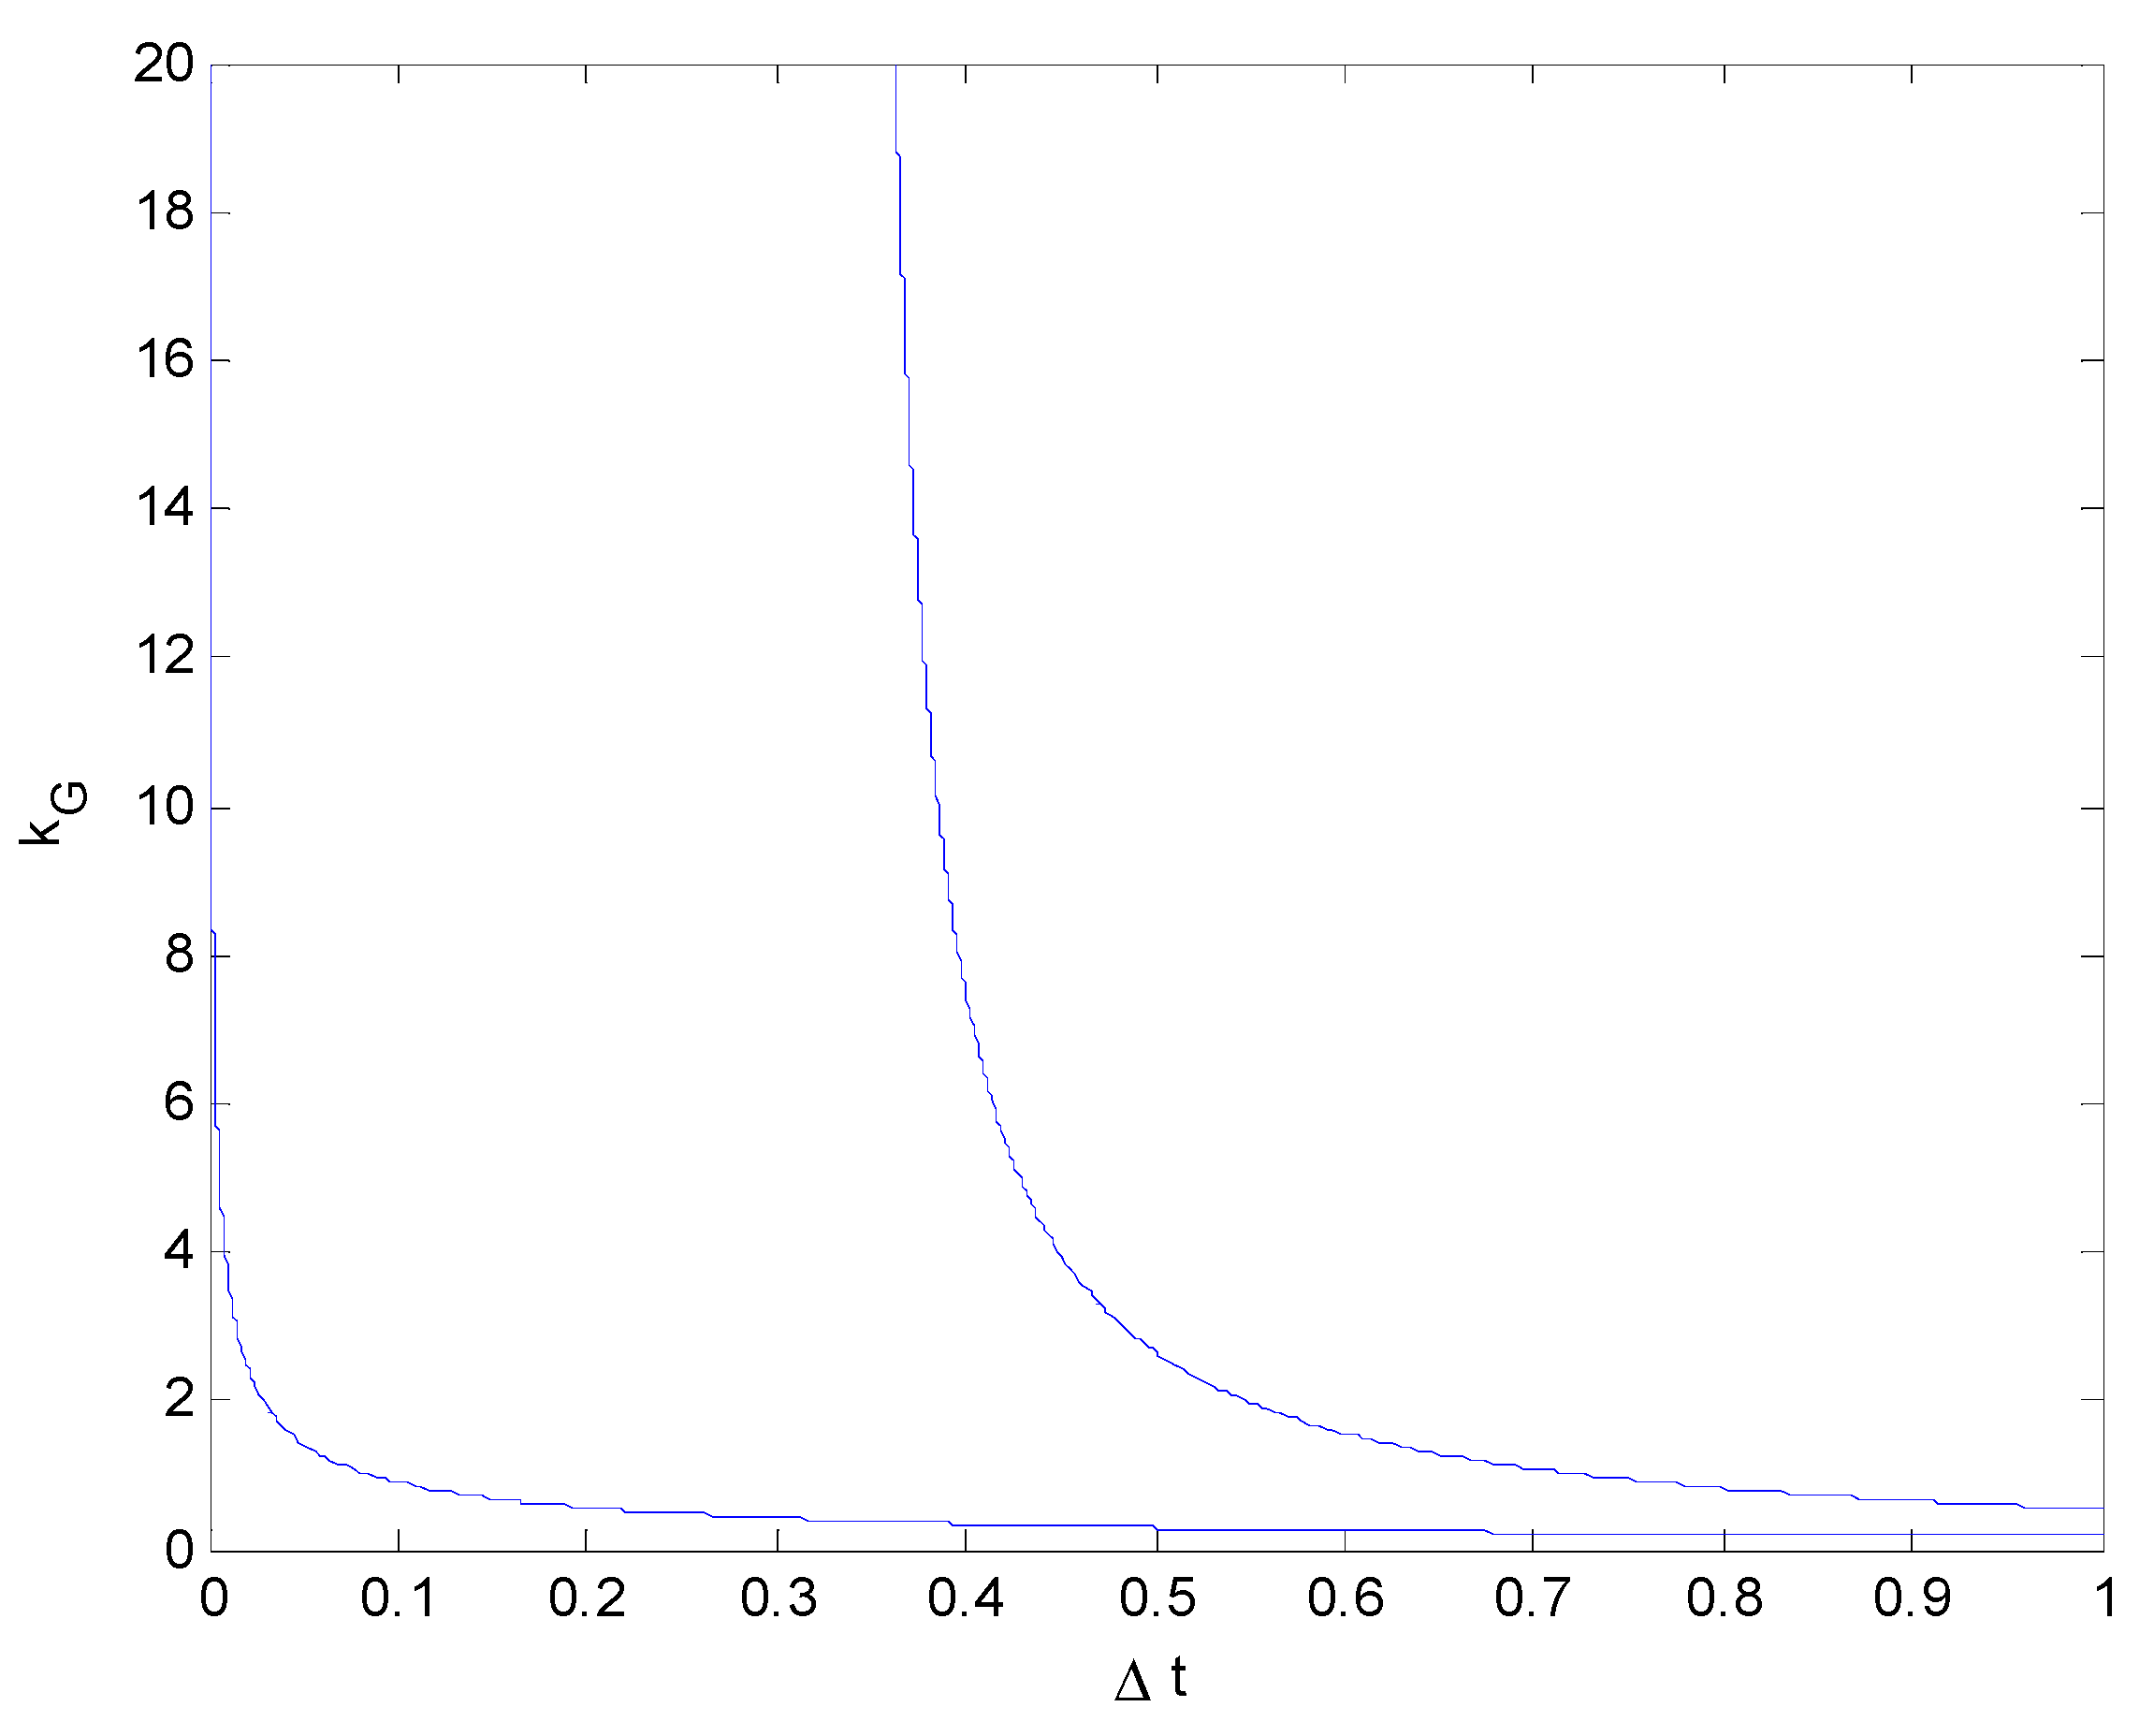
From Figure 14, Figure 15, Figure 16 and Figure 17, it can be clearly seen that, although the values of vy0 differed, this difference had little effect on kGy. This is also consistent with reality: although the value of the lateral velocity vy0 changes, it does not strongly affect the impact force in the Y-direction. A change in the lateral velocity vy0 will only affect the collision duration.
(3)
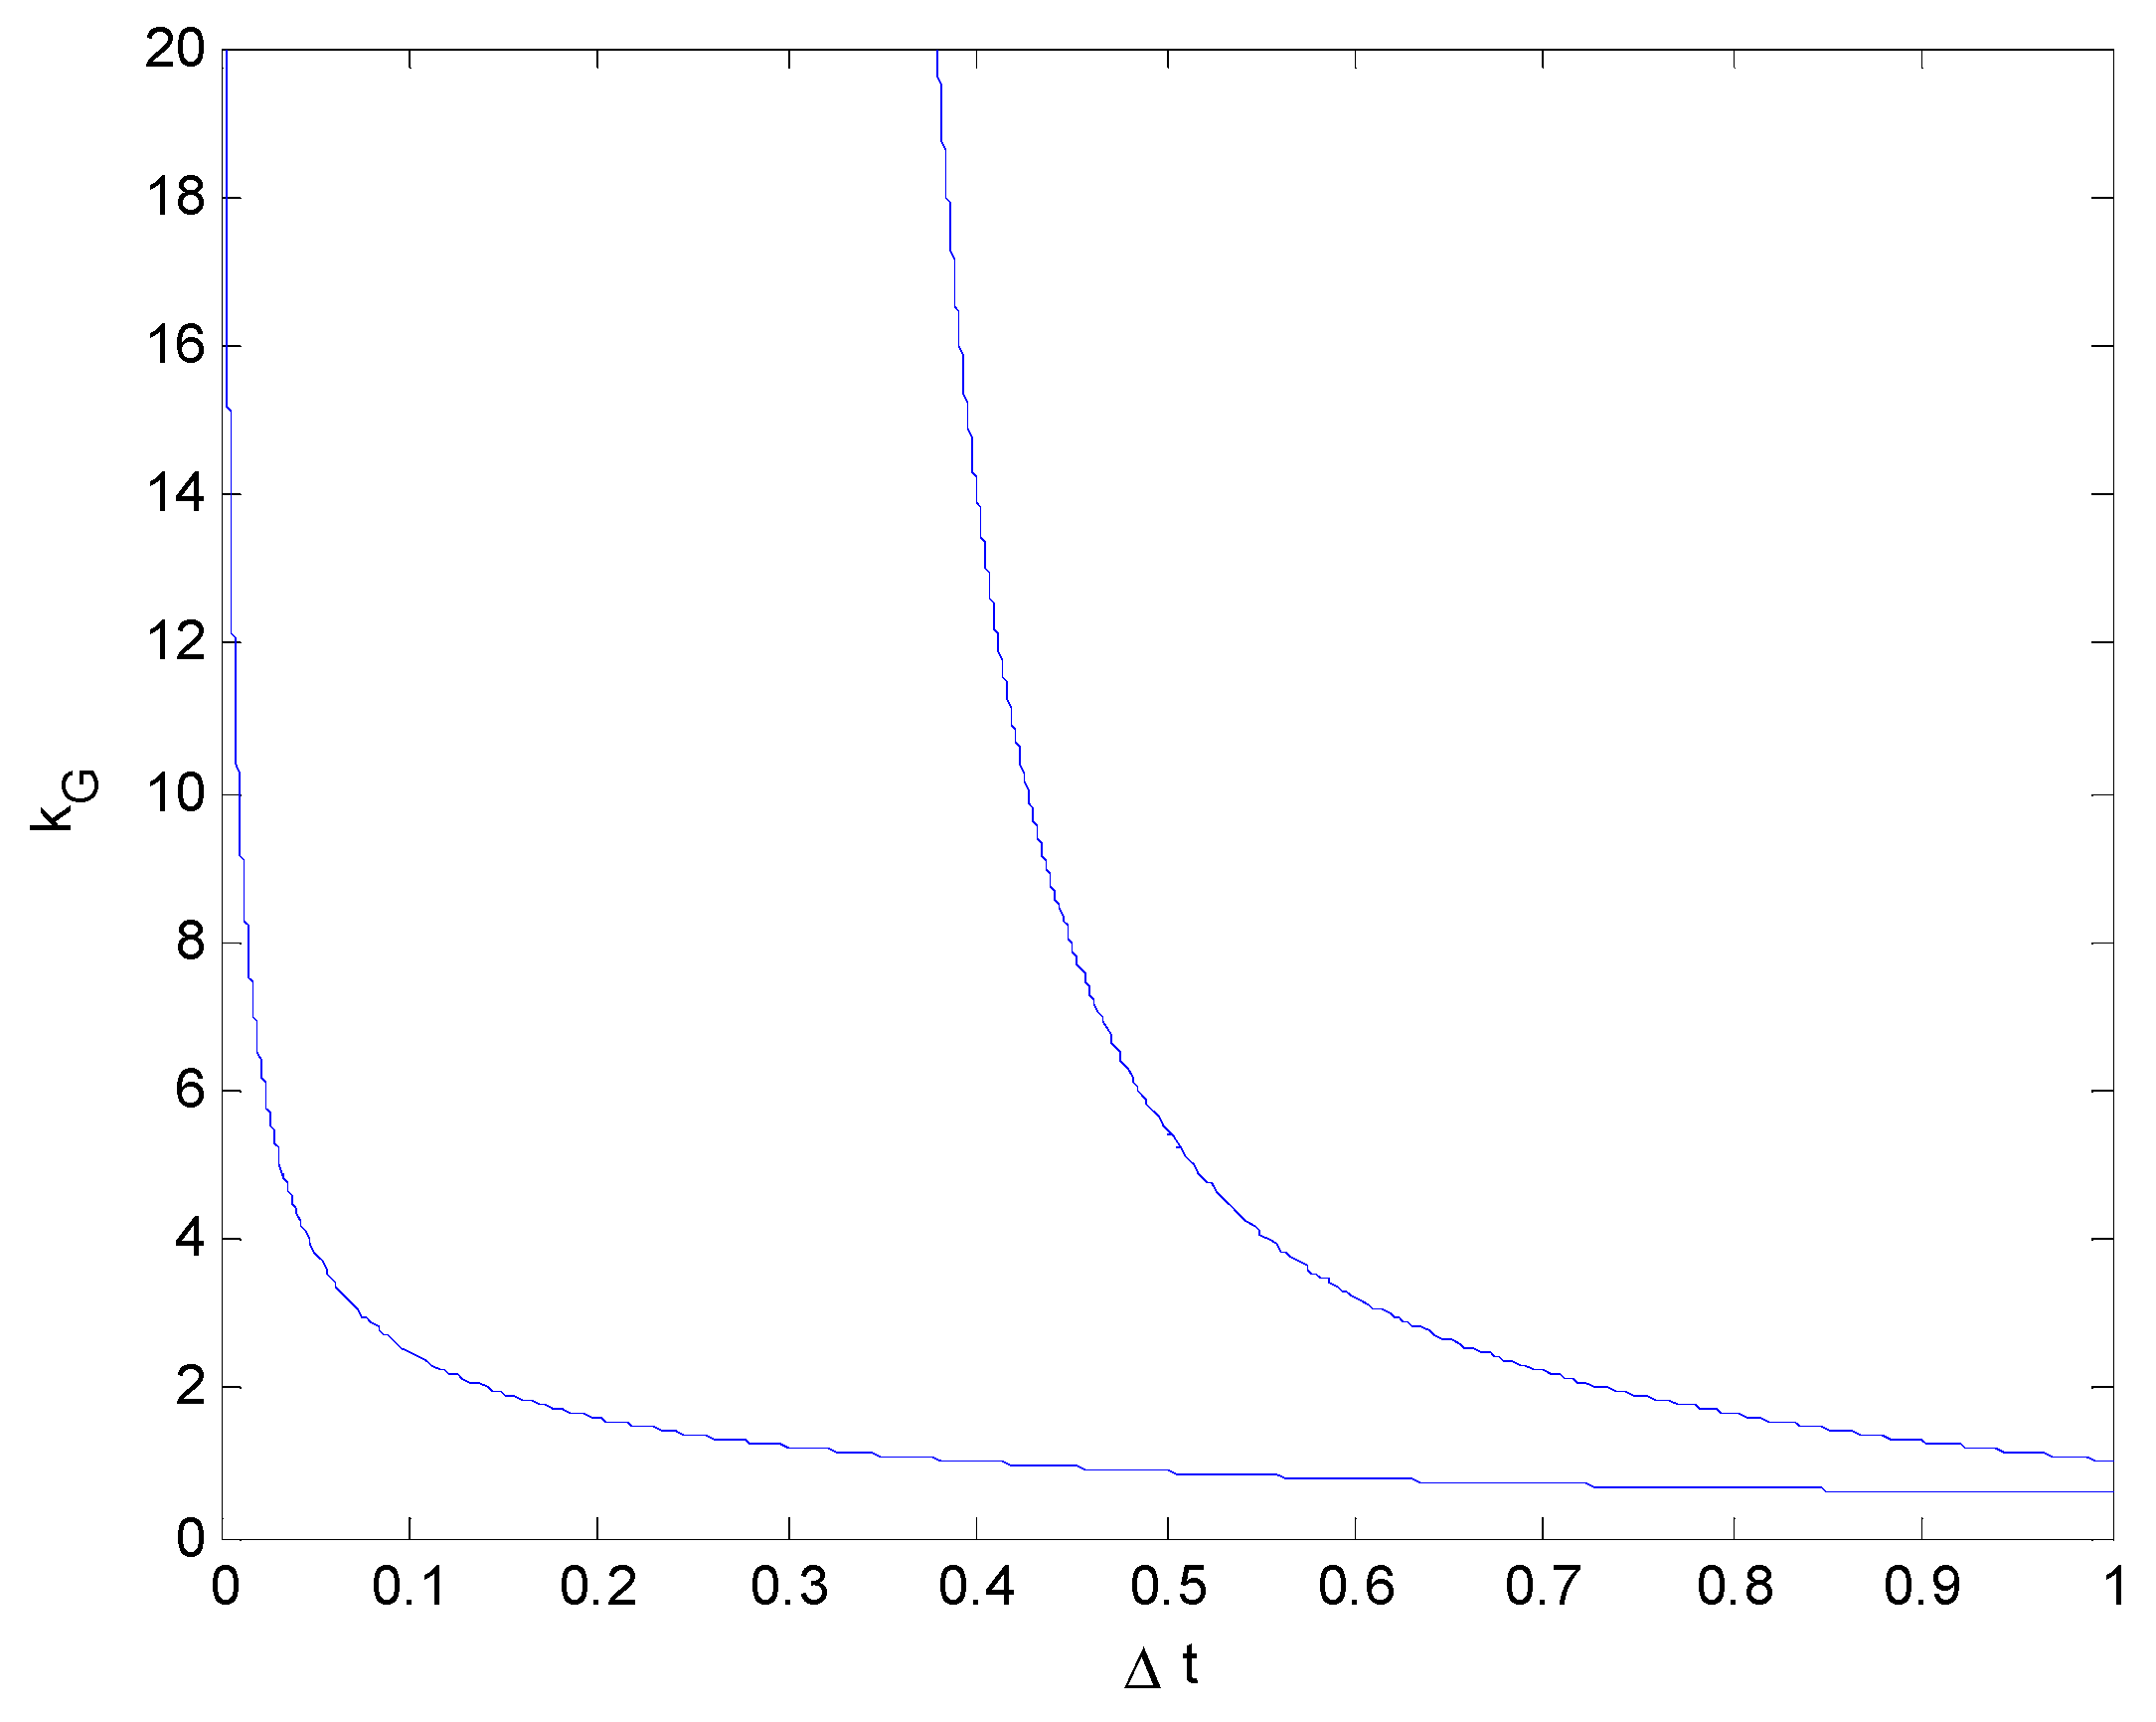
The relationships between KGy and KGz and the collision duration Δt under different Hp (vy0 = 15).
It can be seen from Figure 18, Figure 19 and Figure 20, that KGy has a strong influence on Hp and changes quite clearly with an increase in Hp, while KGz barely changes. The KG–Δt relationship in the critical rollover force model of two vehicles colliding is similar to that for a vehicle colliding with a road obstacle; however, the kG of the vehicle and road obstacle collision model is only related to the vehicle mass while, here, kGyz is not only related to the vehicle mass but also to the wheelbase of the vehicle and the height of the collision point. It is obtained by combining relevant factors such as the impact force, collision point, and vehicle structure. As the rollover collision model for two vehicles is similar to that for vehicles and road obstacles, if only the magnitude of the impact force is considered and the influence of its direction and the position of the collision point is not considered, the two types of collision can be unified to simplify the analysis.

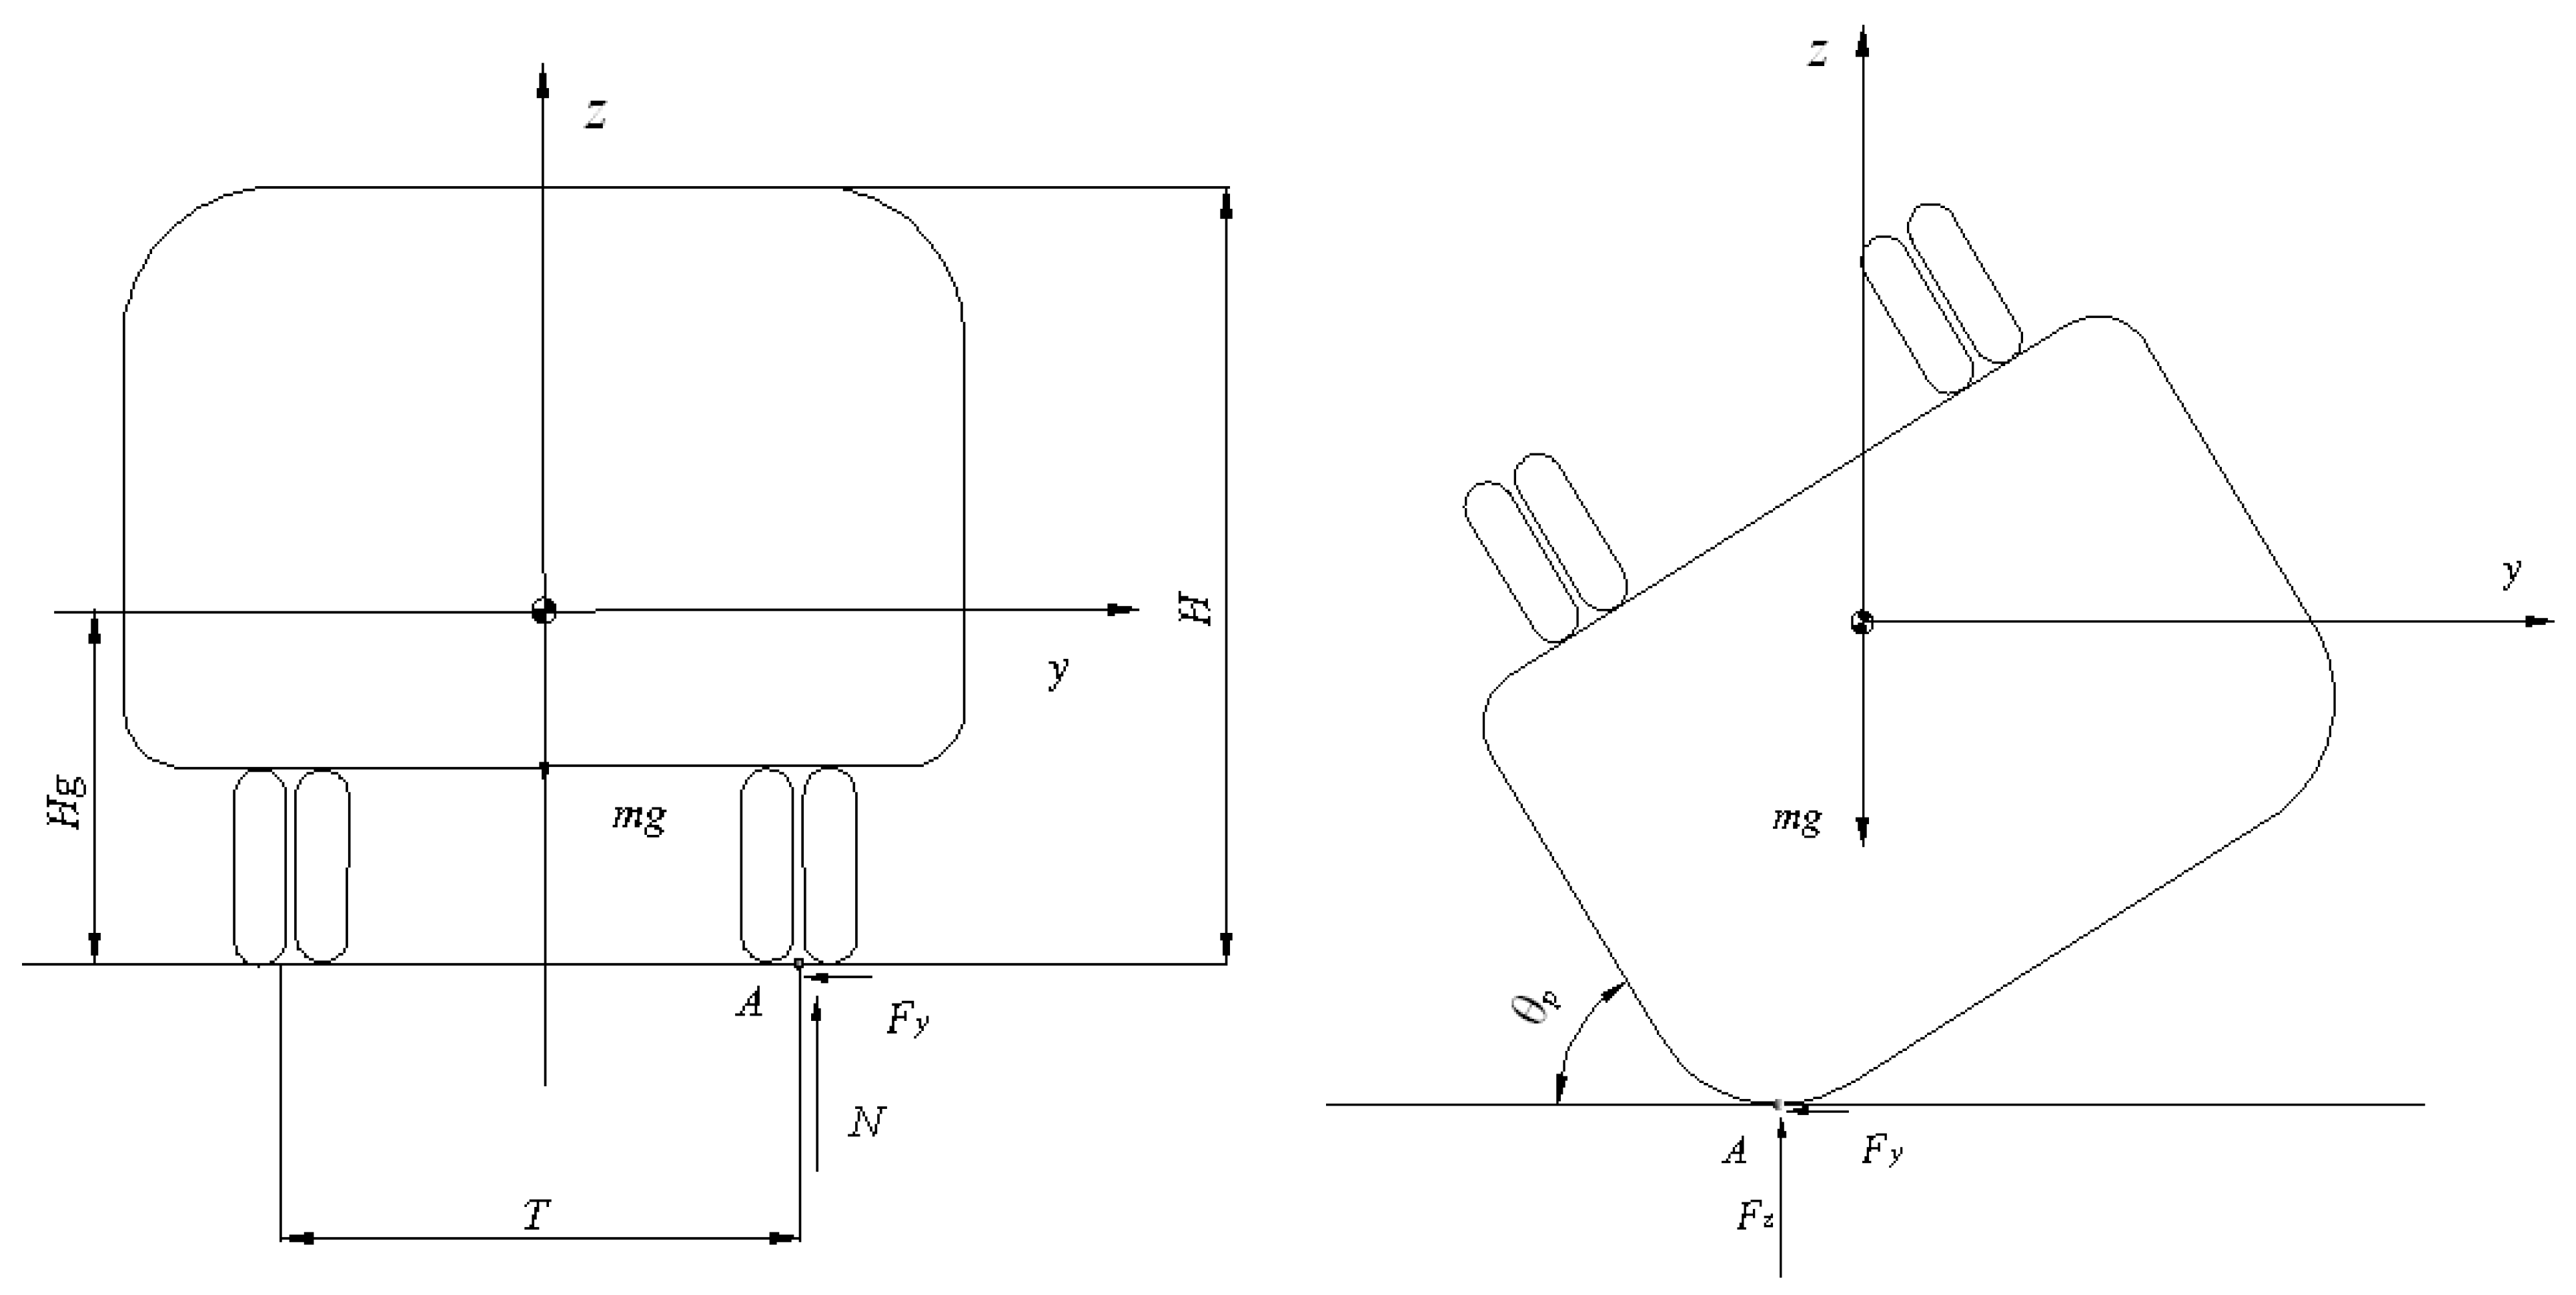
3. Mathematical Modeling of the Critical Rollover Velocity

3.1. Mathematical Modeling of Critical Rollover Speed of a 90° Rollover

It is assumed that the lateral velocity of the center of mass of the vehicle is Vy0 at the beginning of the rollover collision, and the vehicle rotates around point A after the collision. The initial angular velocity is ω 1 . From Figure 21, using the law of conservation of momentum,
I D ω 1 = m V y 0 H g .
If the vehicle rolls over a quarter of a circle after collision, then
1 2 I D ω 1 2 m g ( T 2 4 + H g 2 H g ) .
Substituting Formula (25) into Formula (26),
V y 0 2 2 g m H g I D ( ( T 2 H g ) 2 + 1 1 ) .
Then, the critical speed, CVS, for a 90° rollover is as follows:
C V S = 2 g m H g I D ( ( T 2 H g ) 2 + 1 1 ) .
In the formula, I D = I x x + m [ ( T 2 ) 2 + H g 2 ] .
As Ixx is difficult to determine; however, it can be approximated using the following formula:
I x x = k 1 m [ ( T 2 ) 2 + H g 2 ] .
Substituting the above formula into Equation (33),
C V S = 2 g ( k 1 + 1 ) H g [ ( T 2 H g ) 2 + 1 ] ( ( T 2 H g ) 2 + 1 1 ) .
In Formula (29), if the value of k1 is given, then the CVS can be directly calculated. If the vehicle is regarded as a rectangle with an evenly distributed mass, we have
k 1 = 1 3 ,   I c g = m 3 [ ( T 2 ) 2 + H g 2 ] C V S 1 = 8 g H g 3 [ ( T 2 H g ) 2 + 1 ] ( ( T 2 H g ) 2 + 1 1 )
However, the mass of the vehicle is typically not uniformly distributed, and the moment of inertia is related to the mass distribution. If the mass distribution function for the vehicle is given, the moment of inertia can be calculated; however, the mass distribution function for the vehicle cannot be obtained through theoretical analysis. Therefore, through the test method, the relationship between the moment of inertia and the mass of the vehicle can be statistically summarized, yielding the following correction:
k 1 = 0.404 ,   I c g = 1.21 m 3 [ ( T 2 ) 2 + H g 2 ] C V S 2 = 8.43 g H g 3 [ ( T 2 H g ) 2 + 1 ] ( ( T 2 H g ) 2 + 1 1 )
The moment of inertia measured in the test is calculated using Equations (28)–(30). The error of 99% of the calculation results was within 5% [43], and Equation (31) was found to be more reasonable than Equation (30).

3.2. Mathematical Modeling of Critical Rollover Speed of a 180° Rollover

From the above analysis, as long as the vehicle’s lateral speed is greater than the critical rollover collision speed, it can lead to at least a 90° rollover. However, in order to cause a more than 180° rollover, there must be a new critical rollover speed, which was further analyzed on the basis of the previous results.
Assuming that the vehicle rotates around point A after a collision with the lateral velocity V2 and the initial angular velocity of rotation is ω 2 , as shown in Figure 22, the following is obtained using the law of conservation of momentum:
I D ω 2 = m V 2 H g .
The initial velocity in the Z- and Y-axes after the collision is
V z = ω 2 R 1 sin θ 10 V y = ω 2 R 1 cos θ 10 ,
where R 1 = ( T 2 ) 2 + H g 2 and θ 10 = tan 1 ( 2 H g T ) .
If energy is conserved after collision, then
1 2 I D ω 2 2 + m g R 1 sin θ 10 = C _ .
The equation of motion for the rotation around point A after the collision is given as follows [43]:
{ m a y = m y · · = F y m a z = m z · · = N m g I D ε = I D θ · · = m g R 1 cos θ .
If there is a force between the vehicle and the ground during the rotation process—that is, if contact is maintained—then the following formula can be obtained from Formula (35):
{ ε = m g R 1 cos θ I D ω = ε d t θ = ω d t
Y - axis :   V y = ω 1 R 1 sin θ
a y = V · y = R 1 ( ε sin θ + ω 2 cos θ )
Z - axis :   z = R 1 sin θ
V z = z · = ω 1 R 1 cos θ
a z = z · · = R 1 ( ε cos θ ω 2 sin θ )
At a certain time t, we have that the vehicle satisfies a z > g ; that is, N < 0, which means that the vehicle is no longer in contact with the ground. From time t, the car follows a parabolic motion, falls back to the ground after time Δ t , and collides with the ground at time t t + Δ t ; hence, a motion equation can be obtained.
{ a z = g a y = 0 ε = 0
At time t—that is, the moment when the vehicle left the ground—the velocity components ω , Vy, and Vz can be obtained using Equations (36), (37), and (40), respectively. The velocity at this moment is taken as the initial condition, and the velocity components at the moment ( t + Δ t ) before the vehicle falls back to and collides with the ground are calculated using ω p 1 , Vpy1, Vpz1, and the angle of rotation θ p . Assuming that the velocity components of the vehicle after a collision with the ground are ω p 2 , Vpy2, and Vpz2, the following equations are obtained from the conservation of momentum.
{ m ( V p z 1 V p z 2 ) = P z m ( V p y 1 V p y 2 ) = P y I x x ( ω p 1 ω p 2 ) = P y R 2 sin θ p P z R 2 cos θ p
In the above formula, R 2 = T 2 4 + ( H H g ) 2 .
{ V p y 2 = ω p 2 R 2 sin θ p V p z 2 = ω p 2 R 2 cos θ p .
If the vehicle is capable of turning over to a critical point after collision with the ground, then
1 2 I x x ω p 2 2 + 1 2 m V p y 2 2 + 1 2 m V p z 2 2 m g R 2 ( 1 sin θ p ) ;
that is,
1 2 ( I x x + m R 2 2 ) ω p 2 2 m g R 2 ( 1 sin θ p ) .
From the above analysis, the critical rollover speed V2 for a 180° rollover can be obtained.
If the lateral velocity V2 is large enough at the beginning, there will be movement immediately after the collision, when a z > g , and even during the “top-up” motion off the ground, and the rolling angle will be more than 180°. When the vehicle falls back and collides with the ground, the situation a z > g will occur again. This situation can be analyzed according to the previous process until the kinetic energy after a collision with the ground is insufficient to lift the vehicle to a critical point. In fact, due to the loss of energy during the collision, it is impossible to have a phenomenon such as multiple bounces.
The theoretical values for the critical rollover velocity shown in Table 2 were calculated according to the aforementioned 90° and 180° critical rollover velocity models.

4. Conclusions

According to the determined stable conditions of a dynamic tripped rollover of a coach, the general process of a coach rollover accident was analyzed using a vehicle crash modeling method, in combination with the unique contact form between the body and the external environment and the characteristics of its freedom of motion. A mechanical model that is relatively easy to implement and consistent with real coach test data was adopted to analyze the critical rollover impact force and speed. According to the principle of conservation of energy, the mathematical models of critical rollover impact force in a collision between vehicles and obstacles and in a collision between two vehicles are established. During the collision between the vehicle and the obstacle, the vehicle rollover is related not only to the collision force in the collision process but also to the collision duration. Even if the impact force is relatively small, the impact lasts long enough that a second collision may occur until the vehicle rolls over. In the process of a two-vehicle collision, the critical roll impact force is not only related to the vehicle mass but also to the vehicle wheelbase and the height of the collision point. Based on the law of conservation of momentum, the mathematic models of 90° rollover and 180° rollover are established, and the critical rollover velocities are calculated. The aim of this study is to provide a reference and guidance for further research focused on vehicle rollover stability and anti-rollover control in the intelligent vehicle era.

Author Contributions

The authors confirm their contributions to the paper as follows: study conception and design: X.W., Z.W. and S.C.; data collection: Z.W. and S.C.; analysis and interpretation of results: X.W., Z.W. and S.C.; draft manuscript preparation: X.W., Z.W. and S.C. All authors have read and agreed to the published version of the manuscript.

Funding

This research was funded by the Natural Science Foundation of China (Grant No. 51305372), the Open Fund Project of the Transportation Infrastructure Intelligent Management and Maintenance Engineering Technology Center of Xiamen City (Grant No. TCIMI201803), and the Project of the 2011 Collaborative Innovation Center of Fujian Province (Grant No. 2016BJC019).

Data Availability Statement

Data are contained within the article.

Conflicts of Interest

The authors declare no conflict of interest.

References

  1. Gong, X.L.; Fang, J.; Tan, X.P.; Liao, A.M.; Xiao, C.H. Current situation analysis of road traffic accidents in 31 provinces and cities in China and trend prediction of halving SDGs casualties. Chin. J. Dis. Control 2020, 24, 4–8+36. [Google Scholar]
  2. Grzebieta, R.H.; Mcintosh, A.S.; Bambach, M. How stronger roofs prevent diving injuries rollover crashes. In Proceedings of the International Crashworthiness Conference, Washington, DC, USA, 22–24 September 2010. [Google Scholar]
  3. Frimberger, M.; Wolf, F.; Scholpp, G.; Schmidt, J. Influences of parameters at vehicle rollover. In Proceedings of the International Body Engineering Conference & Exposition, Detroit, MI, USA, 3–5 October 2000. [Google Scholar] [CrossRef]
  4. Strashny, A. An Analysis of Motor Vehicle Rollover Crashes and Injury Outcomes. Ejection. 2007. Available online: https://trid.trb.org/view/809180 (accessed on 1 March 2024).
  5. Bedewi, P.; Godrick, D.; Digges, K.; Bahouth, G. An in vesti-gation of occupant injury in rollover: Nasscds analysis of injury severity and source by rollover attributes. In Proceedings of the 18th International Technical Conference On The Enhanced Safety Of Vehicles, Nagoya, Japan, 19–22 May 2003; National Highway Traffic Safety Administration: Washington, DC, USA, 2003. [Google Scholar]
  6. China Automotive Technology Research Center. Research on Vehicle Rollover Safety Test Method; China Automotive Technology Research Center: Tianjin, China, 2016. [Google Scholar]
  7. Traffic Administration of the Ministry of Public Security. Annual Report on Road Traffic Accidents; Traffic Administration of the Ministry of Public Security: Beijing, China, 2014.
  8. Chen, T.; Cai, Y.F.; Chen, L.; Xu, X.; Sun, X.Q. Trajectory tracking control of steer-by-wire autonomous ground vehicle considering the complete failure of vehicle steering motor. Simul. Model. Pract. Theory 2021, 109, 1–15. [Google Scholar] [CrossRef]
  9. Yu, W.; Gao, W.; Feng, Y. Anti-rollover control of differential Brake Bus based on Fuzzy Control. Automot. Pract. Technol. 2021, 46, 30–34. [Google Scholar]
  10. Phanomchoeng, G.; Rajamani, R. New rollover index for detection of tripped and un-tripped rollovers. In Proceedings of the Decision & Control & European Control Conference, Orlando, FL, USA, 12–15 December 2011; IEEE: Piscataway, NJ, USA, 2011. [Google Scholar]
  11. Zhu, J.; Li, Y.B. Research on Vehicle Rollover and Roll Accident Modeling. Automot. Eng. 2006, 28, 254–258. [Google Scholar]
  12. Xu, Z.M.; Yu, H.X.; Wu, X.L.; Zhang, Z.F. Analysis of Rollover Indicators and Rollover risk Factors of Vehicles. J. Chongqing Univ. 2013, 36, 25–31. [Google Scholar] [CrossRef]
  13. He, H.; Sun, T.; Wang, Y.S. Research on Rollover warning Algorithm for Heavy Vehicles. Comput. Eng. Appl. 2013, 49, 256–261. [Google Scholar]
  14. Hac, A.; Brown, T.; Martens, J. Detection of Vehicle Rollover. In Proceedings of the SAE 2004 World Congress & Exhibition, Detroit, MI, USA, 8–11 March 2004. [Google Scholar]
  15. Hac, A. Rollover stability index including effects of suspension design. In SAE Technical Paper Series; 2002-01-0965; SAE International: Warrendale, PA, USA, 2002; pp. 1403–1413. [Google Scholar]
  16. Solmaz, S.; Akar, M.; Shorten, R. Adaptive Rollover Prevention for Automotive Vehicles with Differential Braking. Int. Fed. Autom. Control 2008, 41, 4695–4700. [Google Scholar] [CrossRef]
  17. Yao, J.L.; Wang, M.; Li, Z.H.; Ren, B.; Sun, N. Vehicle active roll control based on active suspension Research. J. Mech. Strength. 2018, 40, 534–539. [Google Scholar]
  18. Imine, H.; Fridman, L.M.; Madani, T. Steering control for rollover avoidance of heavy vehicles. IEEE Trans. Veh. Tech. 2012, 61, 3499–3509. [Google Scholar] [CrossRef]
  19. Zong, C.F.; Zhu, T.J.; Zheng, H.Y.; Tian, C.W. Semi-truck train with quadratic optimal control. Research on Active Roll Control Algorithm. China Mech. Eng. 2008, 19, 872–877. [Google Scholar]
  20. Chen, S.; Xia, C.G.; Pan, D.Y. The utility model relates to a novel switching type active lateral stabilizer bar device control research. Automot. Technol. 2018, 9, 56–62. [Google Scholar]
  21. Chen, Z.M.; Cheng, C.; Chen, B.; Fu, J.H. Torque Optimal Distribution Control for 4WID electric vehicles Strategy Research. Mach. Des. Manuf. 2020, 12, 50–54. [Google Scholar]
  22. Olmeda, E.; Carrillo Li, E.R.; Rodríguez Hernández, J.; Díaz, V. Lateral Dynamic Simulation of a Bus under Variable Conditions of Camber and Curvature Radius. Mathematics 2022, 10, 3081. [Google Scholar] [CrossRef]
  23. Morales, G.C.; Alexandrov, V.V.; Arias, J.E.M.G. Dynamic model of a mobile robot with two active wheels and the desing an optimal control for stabilization. In Proceedings of the 2012 9th Electronics Robotics and Automotive Mechanic Conference, Cuernavaca, Mexico, 19–23 November 2012; pp. 219–224. [Google Scholar]
  24. Zheng, B.G.; Huang, Y.B.; Qiu, C.Y. LQR+PID control and implementation of two-wheeled self-balancing robot. Appl. Mech. Mater. 2014, 590, 399–406. [Google Scholar] [CrossRef]
  25. Blana, D.; Kirsch, R.F.; Chadwick, E.K. Combined feedforward and feedback control of a redundant nonlinear dynamic musculoskeletal system. Med. Biol. Eng. Comput. 2009, 47, 533–542. [Google Scholar] [CrossRef] [PubMed]
  26. Shi, H.W.; Shi, S.B.; Li, L. Mathematics modeling of automobile suspension system based on seven degree-of-freedom. Tract. Farm. Transp. 2009, 36, 26–27. [Google Scholar]
  27. Jeong, D.; Ko, G.; Choi, S.B. Estimation of sideslip angle and cornering stiffness of an articulated vehicle using a constrainedlateral dynamics model. Mechatronics 2022, 85, 102810. [Google Scholar] [CrossRef]
  28. Gauchia, A.; Olmeda, E.; Aparicio, F.; Díaz, V. Bus mathematical model of acceleration threshold limit estimation in lateral rollover test. Veh. Syst. Dyn. 2011, 49, 1695–1707. [Google Scholar] [CrossRef]
  29. Niculescu-Faida, O.-C.; Niculescu-Faida, A. Vehicle dynamics modeling during moving along a curved path. Mathematical model usage on studying the robust stability. UPB Sci. Bull. 2008, 4, 49–60. [Google Scholar]
  30. Seyedi, M.; Jung, S.; Wekezer, J. A comprehensive assessment of bus rollover crashes: Integration of multibody dynamic andfinite element simulation methods. Int. J. Crashworthiness 2020, 27, 273–288. [Google Scholar] [CrossRef]
  31. Gauchia, A.; Díaz, V.; Boada, M.J.L.; Olatunbosun, O.A.; Boada, B.L. Bus Structure Behaviour under Driving Manoeuvring and Evaluation of the Effect of an Active Roll System. Int. J. Veh. Struct. Syst. 2010, 2, 14–19. [Google Scholar] [CrossRef]
  32. Zhu, T.J.; Ma, W.; Wang, Z.F.; Yin, X.X. Research on Rollover Warning of Heavy Vehicle Based on AdaBoost Algorithm. J. Chongqing Jiaotong Univ. (Nat. Sci. Ed.) 2021, 40, 25–33. [Google Scholar]
  33. Shi, Q.J.; Li, J. Anti-rollover Control of Bus Based on Nonlinear Disturbance Estimation. Automot. Eng. 2020, 42, 1224–1231, 1239. [Google Scholar]
  34. Xia, G.; Li, J.C.; Tang, X.W.; Zhang, Y.; Chen, W.W. Research on Anti-rollover Model Predictive Control of Balanced Heavy Truck. China Mech. Eng. 2021, 32, 987–996. [Google Scholar]
  35. Xia, G.; Li, J.C.; Tang, X.W.; Zhao, L.; Sun, B. Study on Anti-Rollover of the Counterbalance Forklift Based on Extension Hierarchical Control. Int. J. Automot. Technol. 2021, 22, 643–656. [Google Scholar] [CrossRef]
  36. Zhang, Y.; Xia, G.; Tang, X.W.; Wang, S.J.; Sun, B.Q. Research on Extended Hierarchical Anti-rollover Control of Balanced Heavy Duty Forklift [J/OL]. China Mech. Eng. 2021, 32, 2705–2715. [Google Scholar]
  37. Pan, G.Y.; Ding, C.; Wang, W.Q.; Li, A. Application of Extended Zero Moment Point in Vehicle Pitch Control Evaluation and Active Control. J. Jiangsu Univ. (Nat. Sci. Ed.) 2021, 42, 85–91. [Google Scholar]
  38. Jin, L.Q.; Shi, G.N.; Kong, D.J.; Yu, Y.J. Vehicle Rollover Warning Based on Zero Moment Point Index and Rollover Time Algorithm. Automot. Eng. 2017, 39, 281–287+316. [Google Scholar]
  39. Jin, L.Q.; Shi, G.N.; Yu, Y.J.; Wang, B.W. Anti-rollover Control of Commercial Vehicle Based on Zero Moment Point Position and Fuzzy Control. Automot. Eng. 2017, 39, 1062–1067. [Google Scholar]
  40. Huang, K.; Pan, Y.; Zhao, P. Modeling and Experimental Analysis of Vehicle Active Anti-rollover System. China Mech. Eng. 2017, 28, 2701–2706+2731. [Google Scholar]
  41. Bingül, Ö.; Yildiz, A. Fuzzy logic and proportional integral derivative based multi-objective optimization of active suspension system of a 4 × 4 in-wheel motor driven electrical vehicle. J. Vib. Control 2023, 29, 1366–1386. [Google Scholar] [CrossRef]
  42. Cooperrider, N.K.; Thomas, T.M.; Hammoud, S.A. Testing and Analysis of Vehicle Rollover Behavior; SAE900366; SAE International: Warrendale, PA, USA, 1990. [Google Scholar]
  43. Lund, Y.I.; Bernard, J.E. Analysis of Simple Rollover Metrics; SAE 950306; SAE International: Warrendale, PA, USA, 1995. [Google Scholar]
Figure 1. Rollover impact model of a vehicle and a road obstacle.
Symmetry 16 00543 g001
Figure 2. Relationship between the impact force and collision duration ( k G vs. Δ t ) (Vy0 = 10 km/h).
Symmetry 16 00543 g002
Figure 3. Relationship between the impact force and collision duration ( k G vs. Δ t ) (Vy0 = 20 km/h).
Symmetry 16 00543 g003
Figure 4. Relationship between the impact force and collision duration ( k G vs. Δ t ) (Vy0 = 30 km/h).
Symmetry 16 00543 g004
Figure 5. Relationship between the impact force and collision duration ( k G vs. Δ t ) (Vy0 = 40 km/h).
Symmetry 16 00543 g005
Figure 6. Relationship between the impact force and collision duration ( k G vs. Δ t ) (Hg = 0.8664 m).
Symmetry 16 00543 g006
Figure 7. Relationship between the impact force and collision duration ( k G vs. Δ t ) (Hg = 1.083 m).
Symmetry 16 00543 g007
Figure 8. Relationship between the impact force and collision duration ( k G vs. Δ t ) (Hg = 1.2996 m).
Symmetry 16 00543 g008
Figure 9. Rollover collision model of two vehicles.
Symmetry 16 00543 g009
Figure 10. Relationship between the impact force and collision duration (kGz vs. Δ t ) (vy0 = 10 km/h).
Symmetry 16 00543 g010
Figure 11. Relationship between the impact force and collision duration (kGz vs. Δ t ) (vy0 = 20 km/h).
Symmetry 16 00543 g011
Figure 12. Relationship between the impact force and collision duration (kGz vs. v) (vy0 = 30 km/h).
Symmetry 16 00543 g012
Figure 13. Relationship between the impact force and collision duration (kGz vs. Δ t ) (vy0 = 40 km/h).
Symmetry 16 00543 g013
Figure 14. Relationship between the impact force and collision duration (kGy vs. Δ t ) (vy0 = 10 km/h).
Symmetry 16 00543 g014
Figure 15. Relationship between the impact force and collision duration (kGy vs. Δ t ) (vy0 = 20 km/h).
Symmetry 16 00543 g015
Figure 16. Relationship between the impact force and collision duration (kGy vs. Δ t ) (vy0 = 30 km/h).
Symmetry 16 00543 g016
Figure 17. Relationship between the impact force and collision duration (kGy vs. Δ t ) (vy0 = 40 km/h).
Symmetry 16 00543 g017
Figure 18. Relationships between KGy and KGz and collision duration Δt (Hp = 0.6 m).
Symmetry 16 00543 g018
Figure 19. Relationships between KGy and KGz and collision duration Δt (Hp = 0.8 m).
Symmetry 16 00543 g019
Figure 20. Relationships between KGy and KGz and collision duration Δt (Hp = 1 m).
Symmetry 16 00543 g020
Figure 21. Critical rollover speed model for a 90° rollover [43].
Symmetry 16 00543 g021
Figure 22. Critical rollover velocity model of a 180° rollover.
Symmetry 16 00543 g022
Table 1. Real test parameters of a coach.
m/kgWT/mHg/mIxx/kg·m2g/m·s−2
10,1381.99511.08311,5299.787
Table 2. Theoretical calculation values for critical rollover velocity.
Speed TypeCSV1 (km/h)CSV2 (km/h)V2 (km/h)
Calculated value70.031173.8491100.368
Disclaimer/Publisher’s Note: The statements, opinions and data contained in all publications are solely those of the individual author(s) and contributor(s) and not of MDPI and/or the editor(s). MDPI and/or the editor(s) disclaim responsibility for any injury to people or property resulting from any ideas, methods, instructions or products referred to in the content.

