Abstract
Presently, active detectors are widely used to detect mines, providing high accuracy. However, the principle of the operation of active detectors can lead to the explosion of hidden mines. The novelty of this work is the development of the morphology of a neural network for the classification of mines made of different materials (metallic, semi-metallic, plastic) with high accuracy (99.23%), based on a vector of input features with the following components: the value of the output voltage of the FLC-100 magnetic field sensor, which measures magnetic field anomalies in the vicinity of mines with an accuracy of 10−10–10−4 Tesla; six different soil types, depending on the humidity; and the height at which the magnetic field sensor is located above the mine. Due to the fact that mines, when made of different materials (metallic, semi-metallic, plastic), have different magnetic properties, the neural network method of mine classification, based on the sensor data regarding anomalies of the magnetic field in the vicinity of mines, allows the classification of mines made of different materials. The accuracy of mine classification was assessed with two-layer and three-layer neural networks on various metrics (confusion matrix, ROC curves, accuracy–loss curves), using ADAM, RMSprop, and SGD optimisers, and analyses and comparisons were then carried out. The impact of asymmetry in the neuron number and the types of activation functions in the first and second hidden layers on the values of the accuracy and loss metrics was studied. In particular, it was established that the asymmetry of the number of neurons in the first and second hidden layers relative to the plane of symmetry between the hidden layers has a significant effect on the accuracy of the model (decrease in accuracy by 25%), while the loss function, when the symmetry of the neurons number in the hidden layers is violated, increases to a maximum of 50%.
1. Introduction
The detection of mines remains a constant and growing problem that affects millions of people worldwide due to the significant danger that mines can pose to human life. In 2016, an average of 23 individuals worldwide encountered mine-related fatalities or injuries each day. Landmines still afflict approximately 61 countries and territories, posing a constant threat of lethal consequences [1]. Mine detection and clearance are critical tasks for ensuring safety in conflict-affected areas.
Classical methods of mine detection and identification no longer provide the required level of reliability and effectiveness in addressing these issues. The use of active detectors, which emit electrical signals upon mine detection, can sometimes unintentionally trigger the mine’s detonation mechanism, thus leading to explosions. To mitigate this risk, an effective strategy involves using passive detectors that rely on measuring anomalies in the magnetic field at the mine’s location. Addressing this problem requires the implementation of modern automated processing techniques, such as neural networks.
This paper proposes a method for the detection and classification of mines (metallic, semi-metallic, and plastic) using a deep multilayer perceptron with high accuracy (>99%) based on data obtained from magnetic field sensors, with sensitivity levels ranging from 10−10 to 10−4 Tesla in terms of the magnetic field anomalies within the vicinity of mines.
There are several reasons why neural network-based mine detection technology using data regarding magnetic field anomalies at mine locations is relevant; these include the following:
- The safety of military and civilian personnel: Mine detection is critical for preventing injuries and fatalities during warfare or conflicts and for clearing hazardous areas of explosive devices after the cessation of hostilities.
- Speed and accuracy: Using magnetic field sensors allows for the rapid and efficient detection of underground mines, thus enabling quick response and reducing risks for operators. Additionally, neural networks can classify these signals and differentiate them from noise or other objects.
- Risk reduction: Employing automated systems based on neural networks helps to reduce the risk of human errors and enhances the reliability of mine detection and classification.
One way to improve the robustness of a neural network to noise and distortions in object recognition and pattern detection is by using symmetry in the neural network. Therefore, developing a neural network architecture which considers symmetry for precise mine classification, based on a passive mine detection method and using magnetic field sensor data, is a relevant task.
In this context, the aim of this work is to investigate the impact of neural network morphology and symmetry regarding the number of neurons and types of activation functions in the first and second hidden layers on the mine detection metric, and to find the most optimal architecture and optimiser for mine classification tasks using data from magnetic anomaly sensors.
The novelty of this work lies in developing neural network morphology for the classification of mines of different materials (metallic, semi-metallic, plastic) with high accuracy (>99%) based on the input feature vector, including the output voltage value of the FLC-100 magnetic field sensor, six different types of soil depending on moisture levels, and the height at which the magnetic field sensor is located above the mine.
The results of the study demonstrate that the asymmetry in the number of neurons in the first and second hidden layers relative to the symmetry plane between these layers has a significant impact on the model’s accuracy (reduction in accuracy by 25%), while the loss function when the symmetry in the number of neurons in hidden layers is violated increases up to 50%. In particular, the influence of using different types of activation functions in hidden layers and in the output layer on mine detection accuracy has been investigated.
2. Related Work
Classical means of detecting and recognising explosive devices include the following groups: equipment with penetrating radiation, vapour and explosive detectors (gas analysers, chemical analysis equipment), magneto-mechanical means, and search equipment [2]. Equipment with penetrating radiation can use X-rays and ionising radiation. In this direction, nuclear-physical methods are being developed based on neutron sources and the detection of gamma radiation following the neutron interacting with the search object [2]. Methods of detecting explosive devices based on their release of chemical compounds are being developed in the field of robotics [3]. The search equipment includes the metal detectors. These methods are now being developed in the direction of creating controlled metal detectors. These methods reduce the risk to humans and increase the accuracy of mine detection, as metal detectors are part of robotics [4].
Mine detectors fall into two categories as follows: active and passive. Active detectors transmit a signal to the target, using the reflected signal to identify the mine. While these detectors boast high accuracy, there is a potential risk of triggering the mine’s detonation mechanism. On the other hand, passive mine detectors identify anomalies in the magnetic field, specifically those generated by mines. Although these detectors exhibit lower detection accuracy, they are considered safer [5].
Numerous studies explore the application of machine learning algorithms to classify detected mines based on magnetic field anomalies. One such study involves the use of a specially tuned convolutional neural network (CNN), named an auto-encoder for buried mine classification, achieving a notable accuracy rate of 93% and an AUC of 98% [6]. In another investigation [7], the k-NN algorithm was employed for mine detection using data from a sensor network comprising 32 magnetic sensors, yielding a classification accuracy of 91.66%. Additionally, the researchers in [8] devised a neural network approach for mine classification using magnetic field sensor data, employing the Adam’s optimization algorithm to attain an accuracy of 99.23%. However, the study in [8] did not explore the impact of neural network morphology symmetry on mine recognition metrics.
There are several different ways to introduce symmetry into the morphology of a neural network. One way is to use symmetric convolutional neural network architectures with symmetric kernels. This type of neural network architecture enables the detection of patterns in symmetrical images.
Another way to introduce symmetry into the morphology of a neural network is to use symmetric activation functions that preserve the symmetric properties of even distorted images.
The use of symmetry in the morphology of a neural network is an effective way to improve its ability in order to recognise patterns and detect patterns in image databases [9,10].
The authors of [11] proposed a new type of symmetric neural network morphology called “symmetric convolution”, which has layers consisting of filters that are symmetric in their properties. This allows the network to detect features of symmetrical objects. Experiments have shown that a symmetric convolutional network can achieve an accuracy of 99.6% in face recognition, which is 2% more than a conventional convolutional network for the dataset specified in paper [11].
The paper [12] presents the structure of a convolutional neural network with diagonalised pooling (DiagPooling), which is symmetrical with respect to the main diagonal of the diagonalised pooling matrix. This symmetrical diagonalised pooling increases the model’s performance when compared to CNNs that use classical pooling by 4%.
The symmetry of neural network weights was studied in [13]. It was shown that weights located at the same distance from the centre of the network can be equal or inversely proportional. The symmetry of weights in neural networks, in which some neuronal weights can be interchangeable or symmetrical with respect to a certain point or axis, is vital. This approach can be used to improve the performance of information storage.
The purpose of this paper is to study the effect of asymmetry on the number of neurons and activation functions relative to the symmetry plane between the first and second hidden layers on the mine recognition metric.
3. Materials and Methods
This article employed data from the [5] study to categorise mines based on magnetic field anomaly characteristics, with the parameter values outlined in Table 1. Additionally, an examination was conducted regarding the correlation between the magnetic field anomaly and both the soil type and distance from the magnetic sensor to the mine. The overall pattern of the magnetic field anomaly for each type of mine was also described. To measure the magnetic anomaly near a buried mine, the FLC100 ferroelectric sensor [14] was utilised in [5], and the FLC100 ferroelectric sensor [15] was employed in [5].

Table 1.
Data parameters [5].
Prior to the classification process, addressing the challenge of generating new values within the sample is essential. The sample, comprising 45 instances (representing the magnetic field anomaly at depths of 26 cm–34 cm with the soil type “Dry and Humus” for each of the five mines), requires augmentation. This augmentation is crucial to impart generalizing properties to the neural network during the training phase. That is, the size of the training set N satisfied the ratio of , where N—size of the training set; —the total number of free parameters of the neural network (the number of synaptic connections, including offsets); —is the permissible error of the neural network during classification; and —denotes the order of the value in parentheses. One approach to solving this subtask is to generate pseudo-random values [15] using a normal distribution function [16].
where
Vi—the value of the magnetic field anomaly at the height Hi and soil type Si;
Vi*— the new value of the magnetic field anomaly at the height of Hi and soil type Si;
σ3—mean square deviation of the Earth’s magnetic field anomaly;
—a pseudo-random value generation function based on a normal distribution function. The function takes two parameters as follows: µ—arithmetic mean, and σ—mean square deviation [16]. In this case, the value of µ and σ take the values of Vi and σ3, accordingly.
Thus, new values will be generated closer to the value in the training sample as an arithmetic mean, and based on the standard deviation of the Earth’s magnetic field anomaly. The standard deviation is calculated as follows:
where
σ3—standard deviation of the Earth’s magnetic field anomaly;
σi—standard deviation of the Earth’s magnetic field anomaly at altitude Hi;
i—takes values from 1 to 15, since according to the study [14]; this is the distance at which the intensity of the magnetic anomaly of the mine is not recorded.
The data preprocessing process consists of the following steps: normalising the magnetic field anomaly data, applying the coding to the soil type, converting the mine class labels to a numerical value, and then coding them.
The normalisation of the magnetic field anomaly is calculated using the mean value and standard deviation (4) [17].
V’—normalised value of the magnetic field anomaly;
V—initial value of the magnetic field anomaly;
—average value of the magnetic field anomaly;
—standard deviation of the magnetic field anomaly value.
The coding was applied to the soil type because the data were recorded as categorical. The soil type takes on the six following values: “Dry and Sandy, Dry and Humus, Dry and Limy, Humid and Sandy, Humid and Humus, Humid and Limy”. According to research [5] (show Table 2), the type of soil affects the classification of mines, meaning it is necessary to pre-process the data for use in the neural network. We chose the one-hot-encoding type of encoding. One-hot-encoding transforms a variable into a vector of binary variables of size n, where n is the number of unique values of the variable. The algorithm transforms the soil value into a vector of six values. The position corresponding to the soil type will be 1, and all other positions will be 0 [18].
Table 2.
Dependence of the magnetic field anomaly in the vicinity of mines on the type of soil [5].
The main task considered in the article is multi-class classification. To solve the problem, machine learning algorithms, such as artificial neural networks and their subtypes, support vector machine, Bayesian method, decision trees, etc., are used [19].
Let X—a set of object descriptions, X = {V,H,S}, where V—value of the magnetic field anomaly in the vicinity of the mine in volts; H—height of the sensor above the ground where the mine is located; S—soil type; Y = {0,1,2,3,4}—a set of numbers (or names) of classes corresponding to mine types as follows: “no mine”, “anti-tank mine”, “anti-personnel mine”, “booby trap”, and “M14”, respectively (show Table 3). The task of classification is to find the mapping operator Y*: X → Y for any objects that are not included in the training set, with a minimum norm in Euclidean space.
where y—target classifier, and y*—neural network classifier [13].
Table 3.
Dependence of the magnetic field anomaly in the vicinity of mines on the distance from the sensor to the ground [5].
The mapping operator is known only in terms of the objects of the finite training sample:
where Xm is a set of training set elements of dimension m. You need to build an algorithm that can determine the affiliation of an arbitrary object x ∈ X to class y ∈ Y [20,21].
Xm = {(x1, y1), …, ( xm, ym)},
In order to analyse the impact of the number of hidden layers and the number of neurons in them regarding the accuracy of mine classification, neural networks with one and two hidden layers with ADAM, RMSprop SGD optimisers are proposed. The size of the input layer is 3, the size of the first hidden layer is 7 and has the activation function relu, and the output layer has a size of 5 and the activation function softmax. The optimiser is Adam, the loss function is categorical cross entropy, and the accuracy metric is accuracy (Figure 1). The output of this neural network will be described by the relation (7).
where yi—element of the output vector of probabilities of the object belonging to each class of mines; fsoftmax—softmax activation function; wij—the element of the weight matrix between the first and second tacked layer; wjk—element of the weighting matrix between the input layer and the first hidden layer; and xk—element of the input vector of mine characteristics [12].
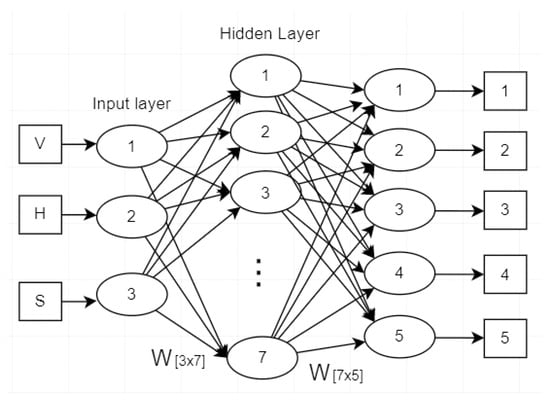
Figure 1.
Architecture of a neural network with one hidden layer.
The size of the input layer is 3, the size of the first hidden layer is 7 and has the relu activation function, the second hidden layer has the same characteristics as the first, and the output layer has a size of 5 and the softmax activation function. The optimiser is Adam, the loss function is categorical cross entropy, and the accuracy metric is accuracy (Figure 2). The output of this neural network will be described by the relation (8).
where yi—element of the output vector of probabilities of the object belonging to each class of mines; fsoftmax—softmax activation function; frelu—relu activation function; wli—an element of the weighting matrix between the second hidden layer and the original layer; wij—element of the weighting matrix between the first and second hidden layer; wjk—element of the weighting matrix between the input layer and the first hidden layer; and xk—element of the input vector of mine characteristics [12].
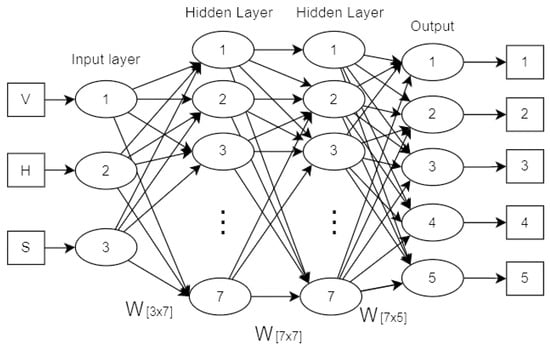
Figure 2.
Architecture of a neural network with two hidden layers.
Thus, the main flow chart that describes the algorithm for classifying mines from different materials using the FLC-100 magnetic field sensor, depending on the types of soil and the height at which the sensor is located, is shown in Figure 3.
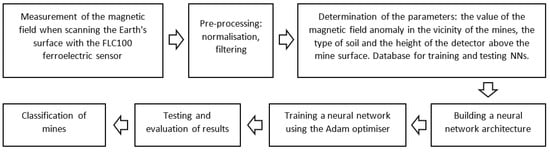
Figure 3.
Main flow chart.
4. Results
The initial training sample consists of 45 samples, which were taken from the study mentioned above. The sample size is insufficient for the further training of the neural networks; therefore, it was expanded to 9000 samples using the normal partition function, as described in the problem statement. The initial data are processed as described in the previous section. Thus, the processed data are then transferred to the neural network training.
The results of neural networks are described using the following diagrams.
4.1. Confusion Matrix of the Neural Network Classification Results of the Test Sample
1. Heatmap showing the confusion matrix of the neural network classification results of the test sample. In the diagram, the X-axis is responsible for the samples that have been classified, and the Y-axis for the real values (Figure 4). For the convenience of displaying large numbers, the entry “e+02” is used, which means that it is necessary to multiply this number by 102. According to the indicators on the heatmap diagram, there are significantly fewer incorrectly predicted classes. The number of correctly classified classes for each class is more than 180, and the number of incorrectly classified classes is less than 10 in total [22].
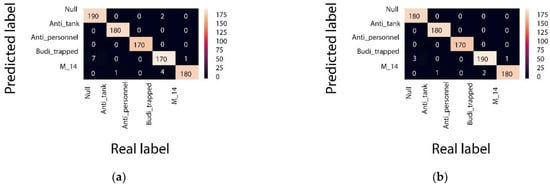
Figure 4.
Confusion matrix. (a)—neural network with one hidden layer, (b)—neural network with two hidden layers.
4.2. ROC Curve for Each Type of Mine
2. ROC curve, which evaluates the quality of the classification of each class separately. The x-axis shows the growth of true positive classified objects, and the y-axis shows the growth of false positive objects (Figure 5) [23,24,25].
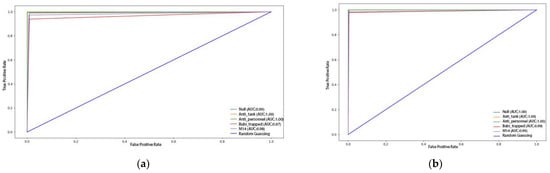
Figure 5.
ROC curves for each type of mine. (a)—neural network with one hidden layer, (b)—neural network with two hidden layers.
4.3. Accuracy-Loss Curves
3. Accuracy and loss curves, which display the accuracy metric and the result of the loss function after each epoch. The y-axis shows the accuracy and loss values, and the x-axis shows the sequence of training epochs (Figure 6) [26].
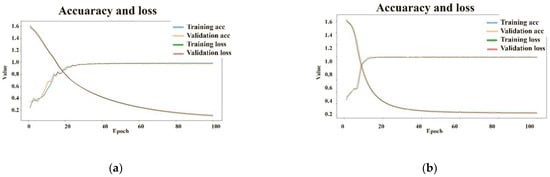
Figure 6.
Accuracy–loss curves. (a)—neural network with one hidden layer, (b)—neural network with two hidden layers.
This section provides a detailed analysis of the graphs described above. According to the heatmap, there are significantly fewer incorrectly predicted classes as follows: the number of correctly classified classes for each class is more than 180, and the number of incorrectly classified classes is less than 10.
The training process of the neural network with two hidden layers is faster, as can be seen in Figure 5. Thus, it will be possible to train the model faster, and its accuracy will increase faster than the neural network with one hidden layer.
The ROC curve values are higher than in a similar study of a neural network with one hidden layer. The graphs in Figure 5 have a larger area under them, regardless of the class of the mine.
An AUC of more than 0.99 was achieved, which demonstrates high efficiency when classifying each class of mine. The neural network model clearly distinguishes one type of mine from another.
The loss rate for the neural network was found to be lower when compared to the results of another study, where it reached a maximum value of 0.1. This means that the neural network is trained efficiently.
4.4. Dependence of Accuracy and Loss on the Type of Activation Function in the Output Layer
The symmetry in the structure of a neural network consists of the same number of neurons and the same activation functions relative to the symmetry plane between the first and second hidden layer. This section describes the results when this symmetry is broken. The following studies were conducted: recording the results when changing the number of neurons in the first and second hidden layers from 3 to 49, and changing the activation functions in the first and second hidden layers. Additionally, the results of the model’s performance when changing the activation function in the output layer were investigated. In Figure 7, the orange line corresponds to the accuracy indicator, and the blue line to the loss function. The y-axis represents the accuracy and loss metrics, and the x-axis represents the number of neurons in the first hidden layer (Figure 7a) and in the second hidden layer (Figure 7b).
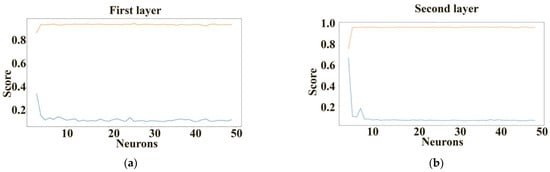
Figure 7.
Dependence of accuracy and loss on the number of neurons in the first (a) and second (b) hidden layers.
According to these results, the asymmetry between the first and second hidden layer does not have a significant impact on the model’s accuracy (≤2%), while the loss function when the symmetry is broken increases to a maximum of 75%. The type of activation function in the output layer of the neural network has a significant impact. In particular, when replacing the relu function in the output layer with the softmax, softplus, sigmoid, and exponential functions, the accuracy metric increases from 21% to 98%, whereas the loss function is the largest (more than 6) for the activation functions relu, selu, elu, and tanh, and the smallest for the activation functions softplus, softmax, sigmoid, and exponential.
5. Discussion
The accuracy and loss indicators can be explained via the damping and explosion of gradients (Figure 8 and Figure 9). In Figure 8, in the case of the relu function, there is no gradient decay and explosion since the derivative of the relu function is a constant for positive argument values. In all other activation functions, there is a decay and explosion of gradients since the derivative of these functions in the domain of definition is a variable value. Figure 8 shows the opposite effect.
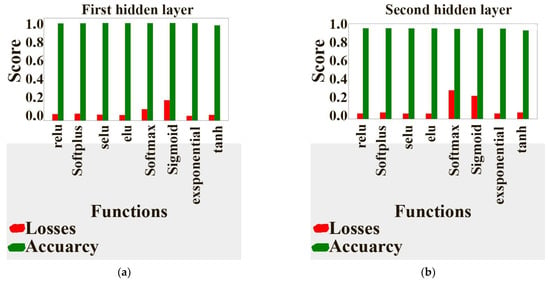
Figure 8.
Dependence of accuracy and loss on the type of activation function in the first (a) and second (b) hidden layers with 7 neurons.
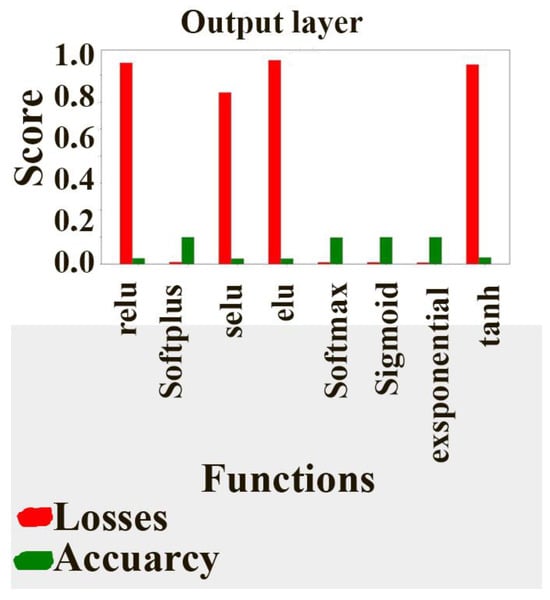
Figure 9.
Dependence of accuracy and loss on the type of activation function in the output layer.
The results of the study of the accuracy and loss function in the classification of mines using a neural network with two hidden layers show (Figure 8) that the asymmetry of the types of neuron activation functions between the first and second hidden layers leads to a slight effect on the classification accuracy (2%), while the loss function, when decreasing the symmetry of function types between the first and second hidden layers, increases to 75%. Decreasing the symmetry with respect to the number of neurons in the first and second hidden layers (Figure 9) leads to a decrease in the accuracy of mine classification and a significant increase in the loss function. In particular, if there are twenty neurons in the second hidden layer and four neurons in the first, then the accuracy of mine classification decreases by 25%, and the loss function increases by 50%. The decrease in the accuracy of mine classification due to the asymmetry of the number of neurons in the first and second hidden layers is explained by the decrease in the number of synaptic weights, which leads to a decrease in the performance of information storage in the neural network learning algorithm.
Experiments were conducted using neural networks with one and two hidden layers. The performance of the networks was evaluated using the accuracy and AUC-score metrics. The Adam, RMSprop, and SGD optimisers were chosen in order to select the best one. The optimisers were evaluated using the accuracy metric. The results are shown in Table 4 and Table 5.
Table 4.
The results of mine classification accuracy with neural networks using the accuracy metric relative to optimisers.
Table 5.
The results of mine classification accuracy with neural networks using the accuracy and AUC score metrics.
6. Conclusions
The morphology of neural networks with one and two hidden layers was developed for the classification of mines (“no mine”, “anti-tank mine”, “anti-personnel mine”, “booby trap”, “M14”), depending on the type of soil (“Dry and Sandy”, “Dry and Humus”, “Dry and Limy”, “Humid and Sandy”, “Humid and Humus”, “Humid and Limy”) and the height of the sensor above the ground where the mine is located, with an accuracy of 97.9% and 99.2%, respectively.
It was established that the asymmetry of the neuron number in the first and second hidden layers relative to the plane of symmetry between these layers has a significant impact on the model accuracy (25% reduction in accuracy), while the loss function, when the symmetry of the number of neurons in the hidden layers is violated, increases to a maximum of 50%.
It is shown that when replacing the relu function in the output layer with the softmax, softplus, sigmoid, and exponential functions, the accuracy metric increases from 21% to 98%. On the other hand, the loss function is the largest (more than 6) for the activation functions relu, selu, elu, and tanh, and the smallest for the activation functions softplus, softmax, sigmoid, and exponential. The accuracy and loss indicators can be explained using the decay and explosion of gradients.
7. Patents
Utility model patent. The method of diagonalised convolutional layer data merging in a neural network/R. M. Peleshchak, V. V. Lytvyn, I. R. Peleshchak; Lviv Polytechnic National University.—C—2384.
Author Contributions
Conceptualization, R.M.P., V.V.L. and M.A.N.; methodology: R.M.P., V.V.L. and I.R.P.; validation, I.R.P., M.A.N. and H.Y.N.; formal analysis, M.A.N., I.R.P. and H.Y.N.; resources, R.M.P., V.V.L. and I.R.P.; writing—original draft preparation, I.R.P., H.Y.N. and M.A.N.; writing—review and editing, M.A.N., I.R.P. and H.Y.N.; supervision, R.M.P., V.V.L. and I.R.P.; project administration, V.V.L., R.M.P. and I.R.P. All authors have read and agreed to the published version of the manuscript.
Funding
This research was funded by the Ministry of Education and Science of Ukraine “Methods and means of identification of combat vehicles based on deep learning technologies for automated control of target distribution” under Project №. 0124U000925 from 27 January 2024.
Data Availability Statement
No new data were created or analyzed in this study. Data sharing is not applicable to this article.
Conflicts of Interest
The authors declare no conflicts of interest.
References
- International Campaign to Ban Landmines, Landmine Monitor 2023 (ICBL-CMC: January 2023). Available online: https://www.the-monitor.org (accessed on 20 October 2023).
- Ishchenko, A.V.; Kobets, M.V. Means and Methods of Detecting Explosive Substances and Devices in the Fight against Terrorism: Training and Practice; NAVSU Publishing House: Kyiv, Ukraine, 2005; p. 144. [Google Scholar]
- Krausa, M.; Massong, H.; Rabenecker, P.; Ziegler, H. Chemical methods for the detection of mines and explosives. In Detection of Explosives and Landmines; Schubert, H., Kuznetsov, A., Eds.; NATO Science Series; Springer: Dordrecht, The Netherlands, 2002; Volume 66. [Google Scholar] [CrossRef]
- Masunaga, S.; Nonami, K. Controlled metal detector mounted on mine detection robot. Int. J. Adv. Robot. Syst. 2007, 4, 237–245. [Google Scholar] [CrossRef]
- Yilmaz, C.; Kahraman, H.T.; Söyler, S. Passive Mine Detection and Classification Method Based on Hybrid Model. IEEE Access 2018, 6, 47870–47888. [Google Scholar] [CrossRef]
- Bestagini, P.; Lombardi, F.; Lualdi, M.; Picetti, F.; Tubaro, S. Landmine Detection Using Autoencoders on Multi-Polarization GPR Volumetric Data. Available online: https://arxiv.org/pdf/1810.01316.pdf. (accessed on 11 March 2023).
- SGürkan, M.; Karapinar, S.; Doğan. Classification of explosives materials detected by magnetic anomaly method. In Proceedings of the 2017 4th International Conference on Electrical and Electronic Engineering (ICEEE), Ankara, Turkey, 8–10 April 2017; pp. 347–350. [Google Scholar] [CrossRef]
- Peleshchak, R.; Lytvyn, V.; Peleshchak, I.; Voloshyn, S. Neural Network Technology of Mine Recognition Based on Data from Magnetic Field Sensors. In Proceedings of the 2023 IEEE 12th International Conference on Intelligent Data Acquisition and Advanced Computing Systems: Technology and Applications (IDAACS), Dortmund, Germany, 7–9 September 2023; pp. 546–549. [Google Scholar] [CrossRef]
- Ilina, O.; Ziyadinov, V.; Klenov, N.; Tereshonok, M. A survey on symmetrical neural network architectures and applications. Symmetry 2022, 14, 1391. [Google Scholar] [CrossRef]
- Nguyen, T.N.; Guo, Y.; Qin, S.; Frew, K.S.; Xu, R.; Agar, J.C. Symmetry-aware recursive image similarity exploration for materials microscopy. Npj Comput. Mater. 2021, 7, 166. [Google Scholar] [CrossRef]
- Wang, J.; Zhang, Y.; Zhang, Z.; Wang, X. Symmetry-Based Convolutional Neural Networks for Image Recognition. Pattern Recognit. 2022, 124, 108058. [Google Scholar]
- Peleshchak, R.; Lytvyn, V.; Mediakov, O.; Peleshchak, I. Morphology of Convolutional Neural Network with Diagonalized Pooling. In Modelling and Development of Intelligent Systems. MDIS 2022. In Communications in Computer and Information Science; Simian, D., Stoica, L.F., Eds.; Springer: Cham, Switzerland, 2023; Volume 1761. [Google Scholar] [CrossRef]
- Hu, S.X.; Zagoruyko, S.; Komodakis, N. Exploring weight symmetry in deep neural networks. Comput. Vis. Image Underst. 2019, 187, 102786. [Google Scholar] [CrossRef]
- Yılmaz, C.; Sönmez, Y.; Kahraman, H.T.; Soyler, S.; Güvenç, U. Developing of decision support system for land mine classi-fication by metaheuristic classifier. In Proceedings of the International Symposium Innovations Intelligent System and Applications (INISTA), Sinaia, Romania, 2–5 August 2016; pp. 1–5. [Google Scholar]
- NumPy Community. NumPy User Guide. 2020. Available online: https://numpy.org/doc/stable/user/ (accessed on 11 March 2024).
- Glasserman, P.; Yao, D.D. Some guidelines and guarantees for common random numbers. Manag. Sci. 1992, 38, 884–908. [Google Scholar] [CrossRef]
- Ali, P.J.M.; Faraj, R.H.; Koya, E.; Ali, P.J.M.; Faraj, R.H. Data Normalization and Standardization. A Technical Report. Mach. Learn. Tech. Rep. 2014, 1, 1–6. [Google Scholar] [CrossRef]
- Potdar, K.; Pardawala, T.S.; Pai, C.D. A Comparative Study of Categorical Variable Encoding Techniques for Neural Network Classifiers. Int. J. Comput. Appl. 2017, 175, 7–9. [Google Scholar] [CrossRef]
- Stenvatten, D. A Comparative Study for Classification Algorithms on Imbalanced Datasets: An Investigation into the Performance of RF, GBDT and MLP. Bachelor’s thesis, Högskolan i Skövde, Skövde, Sweden, 2020. [Google Scholar]
- Peleshchak, R.; Lytvyn, V.; Peleshchak, I.; Khudyy, A.; Rybchak, Z.; Mushasta, S. Text Tonality Clas-sification Using a Hybrid Convolutional Neural Network with Parallel and Sequential Connections between Layers. CEUR Workshop Proc. 2022, 3171, 904–915. [Google Scholar]
- Pol, A.A. Machine Learning Anomaly Detection Applications to Compact Muon Solenoid Data Quality Monitoring. Ph.D. Thesis, Université Paris-Saclay, Gif-sur-Yvette, France, 2020. [Google Scholar]
- Markoulidakis, I.; Rallis, I.; Georgoulas, I.; Kopsiaftis, G.; Doulamis, A.; Doulamis, N. Multiclass Confusion Matrix Reduction Method and Its Application on Net Promoter Score Classification Problem. Technologies 2021, 9, 81. [Google Scholar] [CrossRef]
- Majnik, M.; Bosnić, Z. ROC analysis of classifiers in machine learning: A survey. Intell. Data Anal. 2013, 17, 531–558. [Google Scholar] [CrossRef]
- Sasaki, Y. The truth of the F-measure. Teach Tutor Mater. 2007, 1, 1–5. [Google Scholar]
- Pedregosa, F.; Varoquaux, G.; Gramfort, A.; Michel, V.; Thirion, B.; Grisel, O.; Blondel, M.; Prettenhofer, P.; Weiss, R.; Dubourg, V.; et al. Scikit-learn: Machine Learning in Python. J. Mach. Learn. Res. 2011, 12, 2825–2830. [Google Scholar]
- Lu, Y. Food Image Recognition by Using Convolutional Neural Networks (CNNs). arXiv 2016, arXiv:1612.00983. [Google Scholar]
Disclaimer/Publisher’s Note: The statements, opinions and data contained in all publications are solely those of the individual author(s) and contributor(s) and not of MDPI and/or the editor(s). MDPI and/or the editor(s) disclaim responsibility for any injury to people or property resulting from any ideas, methods, instructions or products referred to in the content. |
© 2024 by the authors. Licensee MDPI, Basel, Switzerland. This article is an open access article distributed under the terms and conditions of the Creative Commons Attribution (CC BY) license (https://creativecommons.org/licenses/by/4.0/).