Abstract
Behavioural asymmetries displayed by individuals, such as hand preference and foot preference, tend to be lateralized in the same direction (left or right). This may be because their co-ordination conveys functional benefits for a variety of motor behaviours. To explore the potential functional relationship between key motor asymmetries, we examined whether footedness, handedness, or throwing arm was the strongest predictor of eyedness. Behavioural asymmetries were measured by self-report in 578 left-handed and 612 right-handed individuals. Cluster analysis of the asymmetries revealed four handedness groups: consistent right-handers, left-eyed right-handers, consistent left-handers, and inconsistent left-handers (who were left-handed but right-lateralized for footedness, throwing and eyedness). Supervised machine learning models showed the importance of footedness, in addition to handedness, in determining eyedness. In right-handers, handedness was the best predictor of eyedness, followed closely by footedness, and for left-handers it was footedness. Overall, predictors were more informative in predicting eyedness for individuals with consistent lateral preferences. Implications of the findings in relation to the origins and genetics of handedness and sports training are discussed. Findings are related to fighting theories of handedness and to bipedalism, which evolved after manual dexterity, and which may have led to some humans being right-lateralized for ballistic movements and left-lateralized for hand dexterity.
1. Introduction
Understanding the origins of hand preference has been a central focus of much research in human laterality. Handedness, however, is only one type of lateralized behavioural asymmetry that humans exhibit. Left-handed and right-handed individuals also show differences in other lateralized behaviours such as throwing, kicking, and eye use, which may be as important as handedness for understanding the origins of lateralization [1,2]. The question of how different lateral asymmetries are related to each other during different classes of movement requires explanation by any adequate theory of handedness [2], and is a fundamental question for neuropsychology [3]. The aim of this research was to build on previous findings and examine the relationship between the lateral asymmetries of footedness, throwing, eyedness, and handedness.
Footedness has been defined as having a preference for using a particular foot for an action, such as kicking an object. In this respect, it is equivalent to the way handedness is typically defined. As one foot implements the action (the right in most people), the other foot is used to support the body [4,5]. Similarly, eyedness has also typically been defined as a preference for using one eye for various activities, such as looking through a telescope, or at a distant object (see [6] for a detailed discussion). Bourassa [7] found that, for sighting tasks, 57.14% of left-handers and 34.43% of right-handers preferred to use their left eye (see also [8]).
Research has often focused on one type of asymmetry, especially handedness, but lateral asymmetries do not exist in isolation. Different types of motor asymmetry can be functionally related, forming part of co-ordinated motor behaviours that consist of lateralized movements of the feet, arms, and the rotation of the body. For example, during throwing, the throwing arm and foot are complementary and coupled together [4]. Forcefully throwing a ball (or spear) determines the positioning of the legs and feet, with a right-arm throw leading to planting the left leg and, as the object is launched, the follow-through of the right leg and foot and rotation of the right torso. Similarly, in fighting with weapons, footedness is co-ordinated with the arm holding the weapon, so that for a right-handed individual duelling with a pistol or fencing weapon, “the right foot faces the adversary” ([4] (p. 181); see also [9,10]). Indeed, the effectiveness of a variety of motor behaviours in bipedal species, including unimanual predation, throwing, and hand-to-hand combat, appear to necessitate the interrelated lateralization of the limbs and body [11,12,13,14,15,16]. For example, humans are capable of a two-handed punch, but a lateralized unimanual punch, with synchronized lateral movements of the body and feet, is considerably more powerful.
It is likely that a number of functional relationships between lateral asymmetries exist, providing benefits in many activities [17,18]. For example, an ipsilateral arrangement for hand and eye dominance appears to convey an advantage in different throwing and aiming behaviours [6,19,20,21], so that novice archers with ipsilateral hand–eye patterns have an advantage compared to archers who are cross-lateralized for hand and eye [22]. Conversely, a cross-lateralized hand–eye profile may enhance perceptual–motor performance in other ways, providing an advantage in sports such as tennis, golf, football, and other team sports (see [23] for a review). It has been suggested that being cross-lateralized may be particularly advantageous in duels when an individual is left-handed and right-eye-dominant [24]. If functional associations between different lateral asymmetries convey a fitness advantage, certain patterns of co-occurrence may be more frequent [9], and the nature of their association may be important for understanding their origin.
Many studies have demonstrated that lateral preferences tend to correlate in individuals, with the strongest correlations typically between handedness and footedness [3,7,8,25,26,27], and weaker relationships between handedness and eyedness [28]. This indicates that lateral preferences may share an underlying biological cause [7,29,30,31,32,33]. However, the neural basis of hand, foot, and eye preferences in right- and left-handers is complex. Movements of the fingers of the dominant hand in both handedness groups are associated with activation of the contralateral hemisphere [34,35], but right-handers show greater levels of deactivation of the ipsilateral primary motor cortex relative to left-handers [36]. The neural control of footedness differences from that of handedness in some respects [37,38]. Compared to upper limb movements, lower limb movements show less lateralized cortical activity and more activity in the motor cortex ipsilateral to the moving limb, indicating less inter-hemispheric inhibition for foot movements [38]. While movement of the dominant hand and foot causes greater activity in the contralateral hemisphere, eye dominance is associated with a larger ipsilateral visual cortex [39] and its increased role in visual processing [21,40]. Therefore, the contralateral neural arrangement for foot and hand dominance, and the ipsilateral arrangement for eyedness, means that in the brain they often will not be lateralized in the same direction in individuals. It may also be one reason why eyedness has a weaker relationship to other asymmetries. Despite this, handedness influences the neural control and motor behaviour of each of these lateralized behaviours [21,36,41], underlining the importance of handedness in determining perceptual–motor actions involving the hand, eye, and foot.
Left-handers, compared to right-handers, show less-consistent lateral asymmetries for footedness, handedness, and throwing [4]. The reduced consistency in left-handers led to the proposal that handedness may comprise three categories: consistent right-handers, consistent left-handers, and inconsistent handers [2,4,42]. Inconsistent handers were originally defined as individuals who used one hand for writing and their other hand for throwing [2,28,43]. Therefore, in this definition, the inconsistency in handedness is for ballistic movements versus skilled movements, with a higher proportion of left-handers than right-handers falling into the inconsistent category. It has been estimated that approximately a third of left-handers are inconsistent left-handers but only around 1.6% of right-handers are inconsistent right-handers [42,43].
The question of why a greater proportion of left-handers is inconsistent is not resolved but, as indicated above, one possibility is that inconsistent left-handers might have an advantage in some perceptual–motor tasks enabling them “to be more flexible in allocating attention to one or the other hand than is the case for…” right-handers and consistent left-handers [2] (p. 184). Certainly, some evidence from sport indicates that left-handedness (where a third may be inconsistent) could convey a benefit in some sporting interactions [44], particularly when the sport is interactive and played under time pressure [45]. Any perceptual–motor advantage which transfers to competitive interactions, such as hand-to-hand fighting, may have provided a fitness benefit for inconsistent left-handers [9,46].
Evidence for Peters’ categorization came from a range of sources, including motor performance data [2,47,48], cluster analysis [42], and psychometric research which suggested that hand skill (typically reflected by writing) may be a form of lateralized motor behaviour that is distinct from less-skilled motor behaviours [49]. However, there is no generally agreed classification or measure of handedness in the literature [29], and the term “mixed” handedness is frequently used alongside “inconsistent” handedness. Mixed handedness refers to individuals who use their non-dominant hand for at least one common manual activity [50]. Although some researchers use the terms interchangeably (e.g., [51]), mixed handedness is a broader definition than inconsistent handedness as originally defined by Peters, and makes no distinction between ballistic and skilled movements.
Despite the use of different terms, Peters’ [2] classification of inconsistent handedness by writing versus throwing appears to be an important one, as it may help clarify potential functional advantages of co-ordinated lateral asymmetries of the limbs. This is because the co-ordination of lateralized ballistic movements involving the foot and arm may be more common than the co-ordination of fine motor skills of the hand with ballistic movements of the limbs. Peters’ classification also appears particularly relevant because research which has explored the relationship between different lateral asymmetries suggests that throwing hand and footedness may be better predictors than handedness of other lateral asymmetries [28,52]. For example, McManus et al. [28] found that throwing hand was more strongly associated with eyedness than was handedness. This was replicated by Searleman and Porac [43], who calculated a laterality index, comprising the measure of sidedness preferences for the eye, foot, and ear, and found that the throwing hand was most associated with sidedness, and was so “much more” [43] (p. 179) strongly than the writing hand.
McManus et al.’s [28] data also suggested a degree of independence between lateral preferences, with throwing hand and writing hand independently related to eyedness. They suggested that handedness was primary, whereas eyedness was downstream and phenotypically secondary to handedness. Despite this, it is important to note that it was the throwing hand, rather than handedness per se, which was more strongly associated with eyedness. This could indicate the primacy of the ballistic movement of throwing, rather than the skilled movement of writing, for determining eye dominance.
Footedness has been viewed as a purer and more accurate measure than handedness of innate lateral preferences because it is less subject to cultural pressures to conform [1,4,53,54,55,56]. Interestingly, footedness has been found to be a better predictor than handedness of the lateralization of language ([54,57], but see [58,59]) and emotion [60], while also showing greater heritability than handedness [56,61]. Importantly, research also indicates that footedness may be a better predictor than handedness of other lateral preferences [57]. For example, Tran et al. [32] measured multiple lateral asymmetries and found that footedness and handedness predicted eyedness to a similar extent. However, footedness was a stronger predictor than handedness of earedness and of overall lateral preference, derived from multiple measures. They concluded that footedness had a more important role than handedness in determining lateral preferences.
Taken together, these findings indicate that preferences involving ballistic movements of the throwing arm and foot may be stronger predictors of global measures of lateral asymmetries [32,43], and of specific lateral asymmetries such as eyedness [28], than are skilled movements by the hand. From a functional perspective, the fact that throwing arm and footedness may be better predictors of eyedness appears somewhat surprising and paradoxical. “Hand–eye” co-ordination is a fundamental aspect of human motor behaviour [62] and is part of the English lexicon, whereas “foot–eye” co-ordination appears to reflect a less-important relationship and appears less closely coupled functionally. We return to this point in the discussion, but one reason why eyedness might be predicted more strongly by footedness and throwing arm is that having an ipsilateral relationship may be important for accurate aiming during throwing [6], which would have been crucial in the evolution of early humans [63,64,65,66].
In sum, we suggest that patterns of lateral asymmetries may co-occur due to the functional advantages they convey. Moreover, a proportion of left-handers may show inconsistent handedness between ballistic limb movements and skilled hand movements because it has fitness benefits in some circumstances [2,9]. A question which arises from past research is whether throwing arm, footedness, or handedness, is the best predictor of eyedness. McManus et al. [28] and Searleman and Porac [43] found throwing arm to be most strongly associated with eyedness, but McManus et al. did not measure footedness and Searleman and Porac did not report the separate effect of footedness as a predictor of eyedness. In addition, Tran et al. [32] found handedness and footedness to be equally good at predicting eyedness, but footedness to be better at predicting a global measure of sidedness, which suggests that it may have a more primary role in determining other lateral asymmetries. However, a comparison between throwing hand and footedness at predicting asymmetries was not reported. Moreover, no distinction was made between ballistic actions and skilled hand movements, which may be important for understanding the evolutionary origins of handedness and the lateral asymmetries displayed by inconsistent left-handers.
Based on past research findings, it was predicted that footedness would be as good as skilled handedness at predicting eyedness [32]. It could also be predicted that throwing hand would be better than skilled handedness at predicting eyedness [28,43]. However, it was unclear whether footedness or throwing arm would be the strongest predictor of eyedness, because little research had directly made that comparison and opposing arguments could be proposed. If the lateralization of footedness is to some extent primary [32], then it could be expected that footedness would be the best predictor of eyedness. Alternatively, if throwing arm is more closely coupled functionally with the eye, then the throwing arm may be a better predictor of eyedness. Therefore, determining which lateral asymmetry is the best predictor of eyedness was expected to help elucidate the primacy of the different lateral asymmetries and their functional relationships in left-handed and right-handed individuals. To test these ideas, we analysed self-report data of the four relevant measures. We first conducted a cluster analysis to determine whether individuals could be grouped according to shared behavioural asymmetries. We expected to find the same handedness groups as described by Peters and Murphy [42]. We then used machine learning models to explore whether handedness, footedness, or throwing arm was the strongest predictor of eyedness in each handedness group.
2. Method
2.1. Participants
Participants were tested online via Qualtrics. They were recruited via Prolific (a participant recruitment website). Prolific advertises the study to eligible candidate participants, who can opt in to participate. We included data from 1190 participants, from two studies. Relevant data from 402 UK participants were taken from a previously published dataset (“Study 1”, i.e., Rodway et al. [67], data collection March 2021; 4 participants from the original data were excluded due to missing a response to “Throwing”). An additional 788 participants from the UK and the USA had been newly tested (“Study 2”, data collected in October 2023), in part for the current study and in part for separate research, to be more fully reported elsewhere. In both studies, we used Prolific pre-screening to separately recruit self-declared left-handers and right-handers, and a balanced number of male and female participants defined via self-declared biological sex. In Study 1, all participants were from the UK, in line with our additional project aims and the study’s context. In Study 2, additional selection criteria applied in line with the study’s additional aims. We recruited balanced numbers of participants from the UK and the USA, and we recruited participants who had self-declared via Prolific pre-screening to be heterosexual and to be in a relationship, engaged, or married.
There were 794 UK participants and 396 US participants in total. The overall sample had a mean age of 39.6 years (SD = 13.5, Min. = 18, Max. = 86; 3 missing age data points). Overall, 578 participants were left-handed and 612 right-handed (by initial self-report, verified via the data). There were 600 women (288 left-handed, 312 right-handed) and 590 men (290 left-handed, 300 right-handed) in the sample. We excluded data from a further ten participants from Study 2 who had also taken part in Study 1, and we removed two further participants from Study 2 who had declared as left-handed but whose data showed exclusively right-handed responses, on the assumption that there may have been an error in the overall handedness declaration for these participants.
2.2. Ethics
Ethical approval was granted by the University of Chester School of Psychology Research Ethics Committee and complied with British Psychological Society ethical guidelines. The approval code for Study 1 was PRAS180221, and for Study 2 it was PRASCH300523. All participants gave their informed consent for inclusion before they participated in the study. The study was conducted in accordance with the Declaration of Helsinki.
2.3. Materials and Procedure
Following informed consent, participants completed a modified version of the short (10-item) Edinburgh Handedness Inventory (EHI) [68], with questions about which hand was used for specific activities: writing, drawing, throwing, scissors, toothbrush, knife (without a fork), spoon, broom (upper hand), striking a match (match), and opening a box (lid). Response options here and throughout (substituting feet and eyes as appropriate) were: Always left (subsequently scored 1), Usually left (2), Both hands equally (3), Usually right (4), and Always right (5). Then, footedness was measured using three questions from McManus [69]. These asked participants which foot they used to: kick a ball (accurately, e.g., at a goal), kick a ball if accuracy were not important, and stand on one leg. Next, in three eyedness questions [69], participants were asked which eye they would use to: look down a microscope, look through a telescope, and look through a keyhole. In both studies, participants then went on to answer additional questions about lateralized manual motor behaviour (Study 1, Rodway et al. [67]) and spatial behaviour (Study 2, new study). Because those questions were asked after the collection of the data listed above, other than through the brief participant information, those subsequent questions could not have influenced the responses to the target questions relevant to the current dataset, because participants could not navigate backwards on Qualtrics. Thus, data collection for both studies was identical as far as the relevant questions were concerned. Participants were paid a small financial reward, anonymously via the Prolific system, in line with the standard Prolific tariff.
2.4. Analysis Plan
There are different ways of processing laterality data for analysis, including laterality quotients, retaining ordinal responses, or dichotomization. For this study, we retained the ordinal values (1–5, where 1 = extreme left-lateralized behaviour, 5 = extreme right-lateralized, and 3 = both sides equally). To ready our data for analysis, we computed composite measures to form variables whose values could range from 1 to 5. The outcome measure (criterion variable/dependent variable) “Eyedness” was formed by calculating the mean of the three eyedness questions. The remaining variables were predictor variables (independent variables). “Handedness without throwing” (to be referred to as “Handedness” hereafter) was computed by taking each participant’s mean across all items from the Edinburgh Handedness Inventory, but without throwing included. “Throwing” constituted a variable on its own. For “Footedness-kicking only” (to be referred to as “Footedness” hereafter), we took the mean of the two kicking responses which captured ballistic footedness.
We assessed the impact on key psychometrics of removing “Throwing” as an EHI item. The full ten-item EHI had a Cronbach alpha of 0.963, 95% CI [0.960, 0.966] and an average inter-item correlation of 0.722, 95% CI [0.703, 0.739]. We also ran a Confirmatory Factor Analysis (CFA) with the Maximum Likelihood estimator on a one-factor solution. This yielded a Tucker–Lewis Index (TLI) of 0.849 and a Comparative Fit Index (CFI) of 0.882.
The nine-item scale had a minimally different set of psychometric values: Cronbach α = 0.960, 95% CI [0.956, 0.963], average inter-item correlation = 0.703, 95% CI [0.704, 0.741], TLI = 0.867, CFI = 0.900. Thus, removing “Throwing” from the EHI did not have a meaningful impact on the summary psychometric values of the EHI, protecting the “Handedness” score from reduced psychometric validity when compared to the full EHI.
We established, using a standard Ordinary Least Squares (OLS) Multiple Linear Regression whether age, sex, country, or study had an impact on the outcome variable eyedness, which was not the case. The overall model with these variables was not significant, F (4, 1182) = 0.49, p = 0.743, R2 = 0.002, and none of the coefficients were significant (all p > 0.269). For this reason, these variables were not included in further analysis models.
We separately assessed whether country had an impact on any of the measures, in light of the fact that UK and US participants drive on opposite sides of the road and, when driving, use gear sticks with opposite hands, which may conceivably affect some measures. Mann–Whitney U tests were conducted, chosen due to the non-normality of the distributions. We reported rank biserial correlations (rrb) for effect size. Three comparisons showed no significant effects of country. There was no effect on handedness, MUK = 3.25, MUSA = 3.25, SDUK = 1.52, SDUSA = 1.51, p = 0.83, rrb = 0.008; nor on footedness, MUK = 3.48, MUSA = 3.59, SDUK = 1.31, SDUSA = 1.38, p = 0.17, rrb = 0.049; nor on eyedness, MUK = 3.14, MUSA = 3.17, SDUK = 1.36, SDUSA = 1.36, p = 0.70, rrb = 0.014. However, there was a significant effect of country on throwing, MUK = 3.42, MUSA = 3.54, SDUK = 1.60, SDUSA = 1.69, p = 0.049, rrb = 0.067, with slightly higher right-handedness among US participants, though with a very small effect size. It is not obvious how this may be associated with driving. In all, there was no strong evidence of country (or driving side) creating confounds in our results. Thus, we did not find any compelling reasons not to combine data from the UK and the USA.
For our primary analyses, we used machine learning techniques. These are powerful, statistically based techniques that allow users to find patterns in complex data. They have advantages over OLS Multiple Linear Regression in their ability to capture non-linear relationships in the data. They are also more flexible with respect to data types and model types, and they are able to find hidden patterns in the data more easily than OLS Multiple Linear Regression.
First, using the machine learning technique “K-means cluster analysis”, we found clusters in the data. In essence, this technique allows the user to group data together based on their belonging to categories. We used this technique to identify different types of left- and right-handers from the patterns in the data.
Previous research [70,71] has used c-means clustering techniques to model human behaviour. In this technique, fuzzy logic is used in that an entity can be grouped in different degrees of belonging to multiple overlapping categories or clusters. The c-means clustering technique has been helpful for simulating human behaviours in airport emergency situations [70], and can be used for other human behaviours, e.g., modelling pedestrian traffic in tourist areas [71]. It tends to be useful when the user is modelling or simulating situations where overlaps between classes need to be captured, such as routing, scheduling, or imaging. The overlap needs to be captured by the mathematical model for the model to function. In our case, it was not our aim to model or simulate these types of situations, but to explore class membership, for which K-means clustering is a more suitable technique. The additional advantage of K-means over c-means in our use case was that of “hard assignments” to clusters, which makes the results of K-means clearer and more interpretable than c-means.
K-means, like all clustering algorithms, groups observations in a dataset according to how similar they are to one another. The aim is for observations in the same group/cluster to be more similar than those in different clusters. The algorithm assigns observations to clusters and determines co-ordinates for the cluster centres so that the inertia, i.e., the sum of squared distances from each data point to its cluster centre, is minimized. That is, the function
where
- k = number of clusters;
- n = number of observations in dataset;
- cj = co-ordinates of centre j;
- xi = observation i,
- is minimized by controlling the assignment of observations to clusters and the cluster centre co-ordinates. In practice, this works as follows: Firstly, a pre-specified number (k) of cluster centres are initialized. Then, a two-step procedure consisting of (i) assigning each observation to the cluster centre to which it is closest and (ii) re-calculating the location of each cluster centre by taking the average of its assigned observations, is repeated until a stopping condition is met. More specific implementation details are reported in the Results.
Subsequently, we conducted analyses in which we predicted eyedness from the predictor variables using the supervised machine learning technique “Random Forest”. We used this technique to examine which sidedness measures were most closely associated in different groups and which sidedness measures were the most important predictors of eyedness. The importance of each variable in predicting eyedness was obtained using two techniques: (1) information-gain-based predictor importance, a method in which the information gain generated by each predictor is extracted from a trained Random Forest model; and (2) permutation feature importance, a measure of the drop in prediction accuracy incurred through the random shuffling of predictor variables. Independent samples t-tests were conducted to identify whether the differences between the prediction accuracies obtained by the original models and the shuffled models were statistically significant. Fuller details of the implementation of these techniques are provided in the Results.
3. Results
3.1. Clustering
To avoid the detection of the simple pre-defined left- and right-hander clusters only, the dataset was split into left-handers and right-handers. Cluster analysis and supervised machine learning were then performed separately on each dataset, using Python v3.9 and the scikit–learn library v1.3.2 [72].
Clustering was performed via the K-means algorithm [73], which is provided as part of scikit–learn’s clustering module. This algorithm has the advantage of providing high quality clusters (e.g., [74,75]), while also being straightforward and interpretable [76,77]. Furthermore, many of the drawbacks of K-means, such as its sensitivity to outliers and computational inefficiency [78,79], were not applicable to our use case, because all of the laterality measures were on a scale from 1 to 5, and the relatively small size of the dataset renders any runtime inefficiencies extremely minimal.
As noted, the algorithm operates by initializing a pre-specified number (k) of cluster centres, followed by a two-step procedure that assigns each observation to its closest cluster centre and re-calculates the location of each cluster centre by taking the average of its assigned observations. This is repeated until a stopping condition is met which, in our case, was the software’s default iteration limit of 300.
The dataset was reduced to the four laterality measures: throwing, handedness, footedness, and eyedness (with measures as defined in the Section 2). The K-means algorithm was then run with k = 2 to k = 10. The “init” parameter was set to random, specifying that the cluster centres be randomly initialized. To handle K-means’ sensitivity to cluster centre initialization, the “n_init” parameter was set to 50, meaning that the algorithm was run with fifty different cluster centre initializations, and the initialization that yielded the lowest (best) inertia was selected. All other parameters were left at default values.
Cluster quality was assessed using the silhouette coefficient [80], a metric that combines the mean intra-cluster distance and the mean nearest-cluster distance to give a score in the range [−1, 1], with higher scores indicating that observations have been well-assigned to their respective clusters.
For both left- and right-handers, the highest silhouette coefficient occurred at k = 2, giving two clusters for each handedness group and four clusters overall. The two left-hander clusters were (1) consistent left-handers, i.e., left-handers who were strongly left-lateralized across all measures; and (2) inconsistent left-handers, i.e., left-handers who were left-handed and were right-lateralized for throwing, footedness, and eyedness. The two right-hander clusters were (1) consistent right-handers, i.e., right-handers who were strongly right-lateralized across all measures, and (2) left-eyed right-handers: right-handers who were strongly right-lateralized for throwing, handedness, and footedness, but were left-eyed. The cluster centres are shown graphically in Figure 1 and Figure 2, for left-handers and right-handers, respectively.
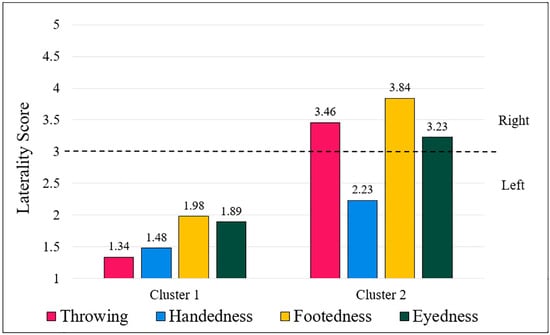
Figure 1.
Cluster centres for left-handers. Note: A grouped bar chart displaying the cluster centres for left-handers. The y-axis shows the laterality scores of the cluster centres, and the x-axis separates the two clusters, with separate bars indicating the four measures. Numbers above each bar constitute the co-ordinates of the respective clusters. 1 = extreme left; 3 = both equally; 5 = extreme right. The dotted line indicates the “both equally” neutral point of the scale. Cluster 1 contains consistent left-handers, and cluster 2 contains inconsistent left-handers. The number of observations in cluster 1 was 343, and the number of observations in cluster 2 was 235.
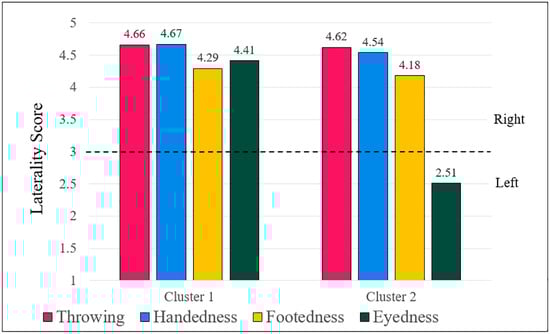
Figure 2.
Cluster centres for right-handers. Note: A grouped bar chart displaying the cluster centres for right-handers. The y-axis shows the laterality scores of the cluster centres, and the x-axis separates the two clusters, with separate bars indicating the four measures. Numbers above each bar constitute the co-ordinates of the respective clusters. 1 = extreme left; 3 = both equally; 5 = extreme right. The dotted line indicates the “both equally” neutral point of the scale. Cluster 1 contains consistent right-handers, and cluster 2 contains left-eyed right-handers. The number of observations in cluster 1 was 426, and the number of observations in cluster 2 was 186.
3.2. Supervised Machine Learning
A regression-based machine learning procedure was employed to determine the importance of the independent variables throwing, handedness, and footedness in predicting eyedness (the target variable). Predictions were made separately for left-handers, right-handers, and their respective clusters, resulting in six machine learning tasks in total. Random Forest models were chosen to perform the machine learning, due to their efficiency, robustness, and strong predictive performance [81,82].
For each machine learning task, the same procedure was followed. The relevant dataset was shuffled and then divided so that 80% of the observations were used for training and 20% for testing. Model hyperparameters were tuned on the training data via a randomized search cross-validation procedure [83], facilitated by the “RandomizedSearchCV” method, which belongs to scikit–learn’s model selection module. Although this approach misses out on potentially optimal hyperparameter configurations by not exploring the entire hyperparameter search space, it is vastly more efficient than grid search, which incurs an exponential rise in runtime as the size of the search space increases. Additionally, random search has a 95% probability of finding at least one hyperparameter configuration within the top 5% after only 60 iterations [83], meaning that the algorithm has a very strong likelihood of producing high-quality results.
In scikit–learn’s random search framework, hyperparameter configurations are generated by randomly sampling from pre-specified lists of allowable values. The effectiveness of a hyperparameter configuration is assessed through cross-validation, a method in which data are partitioned into non-overlapping train and test folds (used to train and test the candidate models), which are rotated until every possible fold combination has been utilized. The random search terminates when the number of cross-validated models reaches a pre-determined limit. For our use case, this limit, specified by the “n_iter” parameter, was 60, meaning sixty hyperparameter configurations were evaluated. The “cv” parameter was set to five, which meant that the cross-validation procedure used five folds. The Random Forest hyperparameters and their allowable values were: “n_estimators”, 1 to 400; “max_features”, 1 to total number of predictors; “min_samples_split”, 2 to total number of observations in the test set; “min_samples_leaf”, 1 to total number of observations in the test set; and “criterion”, squared_error, absolute_error, friedman_mse, poisson. All other hyperparameter values were left at default settings. The model whose hyperparameter configuration yielded the best average score across test folds (determined by the mean absolute error) was then re-trained on the entire training set, before being evaluated on the 20% of data reserved for testing. Mean absolute error measures the accuracy of the predictions produced by the final model. It is measured as the absolute difference between the predicted value and the true value, averaged across all predictions made, e.g., predictions of 3, 5, 4 and respective true values of 2, 7, 1 give a mean absolute error of 2. Lower values mean more accurate predictions. Prediction accuracies for predictions performed across different datasets cannot be directly compared, because the mean absolute error depends on the amount of variance in the dataset.
The importance of each variable in predicting eyedness was obtained using two measures. The first importance measure was the Random Forest regressor’s “feature_importances_” attribute, which stores the information gain generated by each predictor. All information gain values are normalized between 0 and 1, with higher values representing a larger total information gain, and therefore greater predictive importance. The second measure was the permutation feature importance [82,84], which represents the drop in prediction accuracy that occurs when the values of an individual predictor variable are randomly permuted (shuffled), so that the relationship between that predictor and the target variable is broken. Predictors which lead to a greater decrease in model performance when shuffled are thus identified as more important predictors. This was implemented using the “permutation_importance” method, which belongs to scikit–learn’s “inspection” module.
Due to the stochastic properties of scikit–learn’s train–test split mechanism, the Random Forest algorithm, the permutation feature importance technique, and the RandomizedSearchCV algorithm, each machine learning task was run for twenty trials, with random seeds from 0 to 19. The average prediction accuracy and the average information-gain-based predictor importance values resulting from these trials are recorded in Table 1. The average permutation-based predictor importance values for each task, measured by the drop in prediction accuracy, are shown in Table 2. Also shown is whether each drop in accuracy was statistically significant according to independent samples t-tests at the 5% significance level, which compared the accuracies obtained when each respective predictor was randomly permuted to the original prediction accuracy for each task.

Table 1.
Average prediction accuracy and information gain.
Table 2.
Average random permutation-based predictor importance values.
In summary, based on the average information gain (Table 1), right-handers’ eyedness was best predicted from their handedness (without throwing), regardless of whether they were consistent right-handers or left-eyed right-handers, and this also applied to all right-handers combined. Based on the significant difference from randomly permuted values (Table 2), consistent right-handers’ eyedness was significantly better predicted from handedness and footedness than from randomly shuffled values.
For left-handers, average information gain values (Table 1) showed that footedness was the best predictor of eyedness for all left-handers combined, as well as for consistent left-handers, with throwing being the best predictor for inconsistent left-handers. Significant predictor importance (Table 2) of handedness (without throwing) and footedness was observed for all left-handers combined, and of footedness only for consistent left-handers.
For inconsistent left-handers and for left-eyed right-handers, random permutations did not lead to a significant drop in any of the three predictors.
4. Discussion
As expected, it was found that footedness and handedness were the best predictors of eyedness. Somewhat surprisingly, however, throwing arm was not found to be a strong predictor of eyedness. The four handedness groups identified by cluster analysis were also largely in line with expectations. We discuss these findings in turn.
K-means cluster analysis was used to group participants based on shared characteristics of behavioural asymmetries. This resulted in four handedness groups: consistent right-handers (CRH) who were right-lateralized for each measure; left-eyed right-handers (LE-RH) who were right-lateralized for handedness, throwing arm, and footedness, but left-eyed; consistent left-handers (CLH) who were left-lateralized for each measure; inconsistent left-handers (ILH) who were right-lateralized for throwing, footedness, and eyedness, but left-lateralized for handedness.
Peters and Murphy’s [42] cluster analysis differed from this study in several ways. They used a different questionnaire to measure handedness, had a smaller sample of left-handers (115), a higher proportion of females than males (70:30), and did not measure footedness and eyedness. Despite these differences, the groups identified from our analysis are very similar to those identified by Peters and Murphy. One important difference, discussed below, is that we identified a group of left-eyed right-handers (LE-RH), which Peters and Murphy did not. However, as expected, consistent right-handers formed a handedness group and the left-handers formed two groups: consistent left-handers and inconsistent left-handers. The consistent left-handers have been described previously and comprise left-handers who have a consistent preference to be left-lateralized for each behavioural asymmetry.
The inconsistent left-handers group also corresponded to the group identified by Peters and Murphy [42], showing left-lateralization for writing but right-lateralization for other ballistic measures such as throwing. However, in this study, we also measured footedness and eyedness and so, for the first time, the inconsistency between hand preference and the behavioural asymmetries of eyedness and footedness could be observed. It is clear that, for inconsistent left-handers, the rightward preference is not only for throwing, but also for footedness and eyedness. It can be noted that, while the left-hand preference for the inconsistent left-handers is slightly weaker than for the consistent left-handers, the most notable aspect of the inconsistent left-handed group is the rightward preference for each of the other behavioural asymmetries, compared to the leftward preference for handedness. In our sample, 40.5% of left-handers were classified as inconsistent and, in Peters and Murphy’s sample, 47% of the left-handed participants were inconsistent (threw with their right hand). The similar proportions across these studies gives confidence in the reliability of the data and classification analysis.
One handedness group that was not described by Peters and Murphy [42] is the left-eyed right-handed group (LE-RH), which they could not have identified because they did not measure eyedness. However, the possible existence of such a group can be inferred from other lateral asymmetry data because eyedness correlates less strongly with handedness and other laterality measures [6,7,28], but right-handed individuals are typically consistently right-lateralized for footedness and throwing arm. Our study is the first to evidence their pattern of shared behavioural asymmetries directly. These results show that the left-eyed right-handers are similarly right-lateralized as consistent right-handers for each of the other behavioural asymmetries, apart from eyedness. LE-RHs do not seem to be more weakly right-lateralized overall. In our sample, 31.5% of right-handed participants were LE-RHs, which is similar to the proportion of 34.43% reported by Bourassa [7] from a large meta-analysis.
Our findings replicate and extend those of Peters and Murphy [42] and show that systematic and informative patterns of behavioural asymmetries are present in right- and left-handers. It is possible that the different patterns of behavioural asymmetry have different fitness benefits [17,18]. Whether the left-eyed right-handers differ in any other meaningful way from consistent right-handers is something to be explored in future research. Possibilities include examining the effects of cross- and ipsilateral eye preferences on motor behaviour and performance in these two groups [23].
Supervised machine learning models were used to identify the best predictor of eyedness from measures of handedness, footedness, and throwing arm. Two measures of predictor accuracy were used. The first was average information-gain-based predictor importance, and the second was average permutation-based predictor importance, which was measured by a drop in overall model prediction accuracy when data were shuffled on a predictor-by-predictor basis.
The information gain measure showed that, for left-handers overall (i.e., both clusters combined), footedness was the best predictor of eyedness, whereas for right-handers overall, it was handedness that best predicted eyedness. These findings corroborate other research pointing to the importance of footedness, in addition to handedness, in determining other behavioural asymmetries [32,44,52,54,60].
The categorization of handedness groups via cluster analysis enabled us to examine the best predictor of eyedness in each of the four handedness groups. This showed that, in consistent left-handers, the best predictor was footedness and, in inconsistent left-handers, the best predictor was throwing arm. Therefore, for both left-handed groups, the best predictor was lateralized limb preference for ballistic movements rather than handedness. However, for consistent right-handers and left-eyed right-handers, the best predictor of eyedness was handedness, followed closely by footedness.
Not all measures that were identified as the most important predictor based on the information gain measure were significant when compared to randomly shuffled data. This may in part be explained by a relatively low level of individual variation in some measures (e.g., handedness for right-handers), which means that when the data were shuffled, they retained a similar level of predictiveness as when they were not shuffled. In addition, the predictors were not always strongly predictive of eyedness in inconsistent handedness groups, which led to the drops in prediction accuracy not being significant. That said, the permutation-based measure agreed with the information-gain-based measure on the most important predictor for each handedness group, except for the left-eyed right-handers, where information gain showed handedness, and permutation-based importance identified footedness, though notably the latter did not differ significantly from randomly shuffled values.
Overall, the machine learning models showed that the best predictors of eyedness were footedness and handedness. Footedness was the best predictor in left-handers, and handedness the best predictor in right-handers. In addition, the models showed that eyedness could be predicted more reliably in individuals who had consistent preferences (CRH, CLH) than in individuals with less-consistent preferences (LE-RH, ILH). In contrast to previous research, which found throwing to be the strongest predictor of eyedness [28,43], this study did not find this. For inconsistent left-handers, throwing was the best predictor, but not significantly so, and handedness and footedness were the best predictors in each of the other handedness groups. A possible cause of this discrepancy is that McManus et al. [28] did not measure footedness, and Searleman and Porac [43] do not appear to have analysed the effect of footedness, so the fact that footedness might have predicted eyedness better than throwing could not be detected in their data. Our findings are compatible with the view that footedness has a greater role than throwing in determining other lateral asymmetries [32]. However, the fact that throwing was the strongest predictor of eyedness in the inconsistent left-handers may be of some interest. The ILH group is the only handedness group that is cross-lateralized for dextrous hand skill versus ballistic movements of the arm and foot. It appears possible that this cross-lateralization is in some way responsible for throwing arm being the strongest predictor of eyedness. Perhaps, when ILHs use their non-dominant hand/arm for accurate throwing, there is more of a conscious effort to align their throwing arm with their dominant eye, which causes the throwing arm to have a stronger role in determining eye dominance. Future research may be able to assess whether evidence supports this interpretation.
The reason why footedness is a strong predictor of other behavioural asymmetries [32], and of eyedness in left-handed individuals (this study), is currently unknown. One suggestion might be that it is because footedness is a purer measure of lateral asymmetries than handedness, because it is less contaminated by cultural biases [1,53], though it appears unlikely that cultural pressure had much impact on left-hand preference in our sample. A further possibility is that it may be due to the evolutionary origins of hand skill and bipedalism and the functional relationships between the behavioural asymmetries. Research suggests that bipedalism evolved independently and after the evolution of dextrous hand skill [85], with hand skill evolving before humans evolved [86] (see also [87]). Hashimoto et al. [85] found that, in chimpanzees (Pan troglodytes) and humans, the somatotopic organization of the primary sensorimotor cortex shows similar distinct regions for the fingers, whereas the neural representation of the toes differs, being fused in monkeys but with the big toe independent in humans. They concluded that a common ancestor of monkeys and humans developed dextrous hand movements prior to their separation, whereas the development of bipedalism in humans developed after their evolutionary separation from a common ancestor.
If bipedalism evolved independently from hand dexterity, it is possible that, in early humans, the development of footedness (rather than handedness) largely determined the choice of throwing arm and eyedness. That is, the ballistic movement of throwing may be relatively independent from dextrous hand skill (as indicated by the results of McManus et al. [28]) and more closely coupled functionally with ballistic foot movements [2]. If footedness influenced the throwing arm more than handedness, and if an ipsilateral throwing hand and eye arrangement is beneficial for accurate throwing [6], then it could cause footedness to be a stronger predictor of eyedness. In addition, if the evolutionary bifurcation of chimpanzees (Pan troglodytes) and human ancestors occurred after the development of hand dexterity and before bipedalism [85], it may have increased the likelihood that a proportion of humans would have co-ordinated lateral asymmetries involving ballistic movements of the foot and arm, but which were not lateralized in the same direction for skilled movements of the hand (e.g., inconsistent left-handers). Notably, ILHs are as good at throwing as CLHs and CRHs [88], showing that there is no disadvantage for this laterality phenotype for this important behaviour.
A further consideration is that throwing is one of the few motor skills that humans excel at compared to other species, being much better at throwing than chimpanzees (Pan troglodytes) [63,64,65]. Humans produced and used wooden spears at least 400,000 years ago [89,90,91], and the skilled throwing of spears is believed to have been an important development in the evolution of early humans [64,66] (see also [92]). Consequently, footedness, by determining the lateralization of skilled throwing, may have been selected for during the evolution of throwing behaviours, possibly more so than handedness.
The current findings have implications for the genetics of handedness and other behavioural asymmetries. The majority of studies which have examined the genetics of lateral asymmetries have used hand skill (the writing hand) as the measure, and individual difference of primary interest (e.g., [93,94], but see [95]). Despite this, evidence suggests that footedness may have an important role in influencing other behavioural asymmetries [32], and may have greater heritability than handedness [56,61]. In addition, a substantial number of left-handed individuals (ILHs) are right-lateralized for the foot, throwing arm, and eye. For these important actions, ILHs are lateralized in the same direction as right-handers and are more similar to right-handed individuals than they are to consistently lateralized left-handed individuals. If there are genetic influences on behavioural asymmetries, then inconsistent left-handers may share those genetic influences with consistent right-handers more than they do with consistent left-handers. Therefore, it is possible that the clearest evidence of a genetic influence on lateral asymmetries will come from comparing consistent left-handers with all other handedness groups.
Our findings also have implications for theories of the origins of handedness. First, as has been noted [28,47], the behavioural asymmetries displayed by inconsistent left-handers appear problematic for several genetic theories of handedness (e.g., [3,96,97,98]). ILHs also appear troublesome for theories which suggest an important cultural or parental role in determining handedness (e.g., [99]). This is because a substantial proportion of left-handed individuals are ILHs who are right-lateralized for ballistic movements but prefer, against cultural norms, to use their left hand for writing and other skilled tasks. Second, the role of footedness in predicting other lateral asymmetries is problematic for other key theories of handedness (e.g., [100,101,102]) because it is unclear how they explain the importance of footedness in predicting other asymmetries, such as sidedness [32], eyedness, and even the lateralization of language and emotion [57,60].
The role of footedness in predicting lateral asymmetries is, however, compatible with MacNeilage’s [14] postural origins theory, which proposed that bipedalism, via postural control, preceded and determined cerebral lateralization. In addition, Previc’s [5] left-otolithic dominance theory of human motor lateralization also argues for the critical role of bipedalism, suggesting that lateralization is due to a combination of the asymmetric position of the foetus in utero, and asymmetric bipedal walking patterns of the mother influencing the vestibular system. However, tests of Previc’s theory have been difficult to implement, and those that have been completed have not supported the theory [103]. Moreover, the influence of footedness on other asymmetries has not been in the direction predicted by MacNeilage’s postural control theory [52]. Our findings do not provide specific evidence to support either theory, but they are consistent with their emphasis on the relevance of bipedalism and footedness in determining behavioural asymmetries.
Other theories of handedness which are compatible with footedness having a central role in influencing other lateral asymmetries are the fighting hypothesis [46,104] and the modified fighting hypothesis [9]. This is because effective fighting involves the co-ordination of several motor asymmetries, not just handedness [9,11,44]. In this case, selection would exert an influence on co-ordinated behavioural asymmetries involved in fighting behaviours, which would include foot stance, punching, blocking manoeuvres, and possibly attentional processes. Moreover, if footedness determines the throwing/punching arm [4] and fighting stance [11,12], then the selection of fighting aptitude might have involved the selection of footedness to a greater extent than handedness. Hence, other behavioural asymmetries may be more likely to be influenced by footedness because it has a more critical role in determining the co-ordination of these other asymmetries.
Our findings also have implications for sports training and research into the left-handed fighting advantage. Inconsistent handedness is prevalent in left-handers and, in sports performance, it has also been found that handedness is not consistently related to lateral motor preferences [105]. In addition, being left-handed conveys an advantage in some sports, and sports training that incorporates different lateral preferences, such as adopting a left-handed technique or becoming familiar with the left fighting stance, may enhance sporting success [106]. It appears possible that individuals with inconsistent handedness may respond more to such training, so that measuring inconsistent handedness may be useful for identifying sporting talent. Moreover, as sport-specific lateral preferences are highly variable [105], it makes it difficult to estimate whether left-handers are overrepresented in specific sports. Some of the strongest evidence for left-handed fighters having a fighting advantage comes from data that used fighting stance as a proxy measure of handedness (e.g., [107]). A substantial minority of left-handers (ILH) have a preference for ballistic movements with their right limbs, and may therefore adopt a “right-handed” fighting stance. Consequently, the use of fighting stance as the measure of handedness could miscategorize ILHs and underestimate the total number of left-handed fighters. It is also apparent from other sports that a left stance can be adopted by right-handers for a strategic advantage [108], further complicating the issue. Perhaps the clearest conclusion that can be drawn from research that has used stance as a measure of handedness (e.g., [107]) is that a left stance conveys a fighting advantage in hand-to-hand combat, but that the relationship to handedness requires further verification (see also [44]).
Limitations of the current research need to be acknowledged. Self-report measures of behavioural asymmetries may not be as accurate as behavioural measures [29,32,47], raising the possibility of inaccuracies in the data. In particular, participants may have been less accurate at reporting their sighting eye due to a lack of frequency and familiarity with this behaviour compared to throwing and kicking. Despite this possibility, our data corresponded to the proportions reported in other research (e.g., [7]), lending confidence to their overall accuracy. Moreover, the prevalence of left-handedness does not appear to be influenced by whether handedness is self-reported or not [109], indicating that self-report is often a reliable measure. Our study also did not measure as many behavioural asymmetries as some other studies (e.g., [32]). This was due to our primary aim, which was to specifically examine the relationship between lateralized limb movements, handedness, and eyedness, because of its potential evolutionary significance. Other measures of asymmetries, such as earedness, may be less relevant to this question. However, it is possible that further measures would have resulted in more accurate machine learning models for predicting eyedness. In spite of this, the research also has considerable strengths. The sample was large and well-balanced for handedness and sex. We used robust machine learning techniques, employing high-quality validation and selection methods and robust significance-testing techniques. Where data replicated previous patterns, there was strong alignment with prior findings. Our analysis techniques also helped us identify novel patterns. We believe that the use of machine learning for identifying patterns of behavioural asymmetries in large data sets is a promising avenue for future research (see also [110]). Thus, the research drew on methodological advancements to provide novel insights.
5. Conclusions
Cluster analysis showed systematic patterns of behavioural asymmetries in left-handed and right-handed individuals. The orderly nature of these asymmetries suggests that they have a biological cause and may have fitness benefits. We also measured, for the first time, the pattern of behavioural asymmetries displayed by left-eyed right-handers and found that they form a coherent handedness group. Machine learning models showed the importance of footedness, in addition to handedness, at predicting eyedness. This was strongest for left-handed individuals, but footedness was also an important predictor of eyedness in right-handed individuals. This indicates that footedness may have a key role in determining other lateral asymmetries, and greater focus on measuring footedness may be beneficial for understanding the origins of lateral asymmetries and their genetics [33,52,95]. Finally, understanding the co-ordination of multiple behavioural asymmetries may lead to theories which capture the functional relationships, fitness benefits, and evolutionary origins of lateralized behaviours.
Supplementary Materials
The data used in the analyses can be downloaded at: https://www.mdpi.com/article/10.3390/sym16020177/s1.
Author Contributions
Conceptualization, P.R. and A.S.; Methodology, P.R. and A.S.; Formal Analysis, C.R. and A.S.; Investigation, A.S. and P.R.; Data Curation, A.S. and C.R.; Writing—Original Draft Preparation, P.R., C.R., and A.S.; Writing—Review and Editing, P.R., C.R., and A.S.; Visualization, C.R. and A.S.; Project Administration, P.R. and A.S.; Funding Acquisition, P.R. and A.S. All authors have read and agreed to the published version of the manuscript.
Funding
We gratefully acknowledge the funding for Study 2, which was provided by an internal University of Chester grant with the grant code QR737.
Data Availability Statement
The data used in the analyses are available via the Supplementary Materials.
Conflicts of Interest
The authors declare no conflicts of interest.
References
- Bryden, M. Laterality Functional Asymmetry in the Intact Brain; Elsevier: Amsterdam, The Netherlands, 1982. [Google Scholar]
- Peters, M. Subclassification of non-pathological left-handers poses problems for theories of handedness. Neuropsychologia 1990, 28, 279–289. [Google Scholar] [CrossRef]
- Annett, M. Predicting combinations of left and right asymmetries. Cortex 2000, 36, 485–505. [Google Scholar] [CrossRef]
- Peters, M. Footedness: Asymmetries in foot preference and skill and neuropsychological assessment of foot movement. Psychol. Bull. 1988, 103, 179. [Google Scholar] [CrossRef]
- Previc, F.H. A general theory concerning the prenatal origins of cerebral lateralization in humans. Psychol. Rev. 1991, 98, 299. [Google Scholar] [CrossRef]
- Porac, C.; Coren, S. The dominant eye. Psychol. Bull. 1976, 83, 880. [Google Scholar] [CrossRef]
- Bourassa, D. Handedness and eye-dominance: A meta-analysis of their relationship. Laterality 1996, 1, 5–34. [Google Scholar] [CrossRef]
- Porac, C. Eye preference patterns among left-handed adults. Laterality Asymmetries Body Brain Cogn. 1997, 2, 305–316. [Google Scholar] [CrossRef]
- Larsson, M.; Schepman, A.; Rodway, P. Why Are Most Humans Right-Handed?The Modified Fighting Hypothesis. Symmetry 2023, 15, 940. [Google Scholar] [CrossRef]
- Larsson, M. Did heart asymmetry play a role in the evolution of human handedness? J. Cult. Cogn. Sci. 2017, 1, 65–76. [Google Scholar] [CrossRef][Green Version]
- Okubo, M. Standing right: Laterality of combat stance in Brazilian jiu-jitsu. Arch. Budo 2022, 18, 71–76. [Google Scholar]
- Tirp, J.; Baker, J.; Weigelt, M.; Schorer, J. Combat stance in judo–Laterality differences between and within competition levels. Int. J. Perform. Anal. Sport 2014, 14, 217–224. [Google Scholar] [CrossRef]
- Corballis, M.C. The evolution and genetics of cerebral asymmetry. Philos. Trans. R. Soc. B Biol. Sci. 2009, 364, 867–879. [Google Scholar] [CrossRef] [PubMed]
- MacNeilage, P.F. Present status of the postural origins theory. Spec. Top. Primatol. 2007, 5, 58–91. [Google Scholar] [CrossRef]
- Giljov, A.; Karenina, K.; Malashichev, Y. Does bipedality predict the group-level manual laterality in mammals? PLoS ONE 2012, 7, e51583. [Google Scholar] [CrossRef] [PubMed]
- Versace, E.; Vallortigara, G. Forelimb preferences in human beings and other species: Multiple models for testing hypotheses on lateralization. Front. Psychol. 2015, 6, 233. [Google Scholar] [CrossRef]
- Marcori, A.J.; Monteiro, P.H.M.; Brussolo, A.D.; Okazaki, V.H.A. The development of hand, foot, trunk, hearing, and visual lateral preference throughout the lifespan. Neuropsychologia 2023, 178, 108444. [Google Scholar] [CrossRef] [PubMed]
- Mcbeath, M.K.; Sugar, T.G. Natural selection of asymmetric traits operates at multiple levels. Behav. Brain Sci. 2005, 28, 605–606. [Google Scholar] [CrossRef][Green Version]
- Adams, G.L. Effect of eye dominance on baseball batting. Res. Q. Am. Assoc. Health Phys. Educ. Recreat. 1965, 36, 3–9. [Google Scholar] [CrossRef]
- Loria, T.; Manzone, D.; Crainic, V.; Tremblay, L. Ipsilateral eye contributions to online visuomotor control of right upper-limb movements. Hum. Mov. Sci. 2019, 66, 407–415. [Google Scholar] [CrossRef]
- Chaumillon, R.; Alahyane, N.; Senot, P.; Vergne, J.; Lemoine-Lardennois, C.; Blouin, J.; Doré-Mazars, K.; Guillaume, A.; Vergilino-Perez, D. Asymmetry in visual information processing depends on the strength of eye dominance. Neuropsychologia 2017, 96, 129–136. [Google Scholar] [CrossRef]
- Laborde, S.; Dosseville, F.E.; Leconte, P.; Margas, N. Interaction of hand preference with eye dominance on accuracy in archery. Percept. Mot. Ski. 2009, 108, 558–564. [Google Scholar] [CrossRef]
- Moreno, M.; Capdevila, L.; Losilla, J.-M. Could hand-eye laterality profiles affect sport performance?A systematic review. PeerJ 2022, 10, e14385. [Google Scholar] [CrossRef]
- Petit, L.; Zago, L.; Mellet, E.; Jobard, G.; Crivello, F.; Joliot, M.; Mazoyer, B.; Tzourio-Mazoyer, N. Strong rightward lateralization of the dorsal attentional network in left-handers with right sighting-eye: An evolutionary advantage. Hum. Brain Mapp. 2015, 36, 1151–1164. [Google Scholar] [CrossRef]
- Porac, C.; Coren, S.; Duncan, P. Lateral preference in retardates: Relationships between hand, eye, foot, and ear preference. J. Clin. Exp. Neuropsychol. 1980, 2, 173–188. [Google Scholar] [CrossRef]
- Suar, D.; Mandal, M.K.; Misra, I.; Suman, S. Lifespan trends of side bias in India. Laterality 2007, 12, 302–320. [Google Scholar] [CrossRef]
- Saudino, K.; McManus, I.C. Handedness, footedness, eyedness and earedness in the Colorado Adoption Project. Br. J. Dev. Psychol. 1998, 16, 167–174. [Google Scholar] [CrossRef]
- McManus, I.C. Eye-dominance, writing hand, and throwing hand. Laterality Asymmetries Body Brain Cogn. 1999, 4, 173–192. [Google Scholar] [CrossRef] [PubMed]
- Beaton, A.A. The nature and determinants of handedness. In The Asymmetrical Brain; The MIT Press: Cambridge, MA, USA, 2003; pp. 105–158. [Google Scholar]
- Suzuki, K.; Ando, J. Genetic and environmental structure of individual differences in hand, foot, and ear preferences: A twin study. Laterality Asymmetries Body Brain Cogn. 2014, 19, 113–128. [Google Scholar] [CrossRef] [PubMed]
- Warren, D.M.; Stern, M.; Duggirala, R.; Dyer, T.D.; Almasy, L. Heritability and linkage analysis of hand, foot, and eye preference in Mexican Americans. Laterality 2006, 11, 508–524. [Google Scholar] [CrossRef] [PubMed]
- Tran, U.S.; Stieger, S.; Voracek, M. Evidence for general right-, mixed-, and left-sidedness in self-reported handedness, footedness, eyedness, and earedness, and a primacy of footedness in a large-sample latent variable analysis. Neuropsychologia 2014, 62, 220–232. [Google Scholar] [CrossRef] [PubMed]
- Tran, U.S.; Voracek, M. Evidence of sex-linked familial transmission of lateral preferences for hand, foot, eye, ear, and overall sidedness in a latent variable analysis. Behav. Genet. 2015, 45, 537–546. [Google Scholar] [CrossRef]
- Grabowska, A.; Gut, M.; Binder, M.; Forsberg, L.; Rymarczyk, K.; Urbanik, A. Switching handedness: fMRI study of hand motor control in right-handers, left-handers and converted left-handers. Acta Neurobiol. Exp. 2012, 72, 439–451. [Google Scholar] [CrossRef]
- Ocklenburg, S.; Beste, C.; Güntürkün, O. Handedness: A neurogenetic shift of perspective. Neurosci. Biobehav. Rev. 2013, 37, 2788–2793. [Google Scholar] [CrossRef]
- Tzourio-Mazoyer, N.; Petit, L.; Zago, L.; Crivello, F.; Vinuesa, N.; Joliot, M.; Jobard, G.; Mellet, E.; Mazoyer, B. Between-hand difference in ipsilateral deactivation is associated with hand lateralization: fMRI mapping of 284 volunteers balanced for handedness. Front. Hum. Neurosci. 2015, 9, 5. [Google Scholar] [CrossRef] [PubMed]
- Huda, S.; Rodriguez, R.; Lastra, L.; Warren, M.; Lacourse, M.G.; Cohen, M.J.; Cramer, S.C. Cortical activation during foot movements: II effect of movement rate and side. Neuroreport 2008, 19, 1573–1577. [Google Scholar] [CrossRef]
- Naito, E.; Morita, T.; Kimura, N.; Asada, M. Existence of interhemispheric inhibition between foot sections of human primary motor cortices: Evidence from negative blood oxygenation-level dependent signal. Brain Sci. 2021, 11, 1099. [Google Scholar] [CrossRef] [PubMed]
- Erdogan, A.R.; ÖZDIKICI, M.; Aydin, M.D.; AKTAS, Ö.; Dane, S. Right and left visual cortex areas in healthy subjects with right-and left-eye dominance. Int. J. Neurosci. 2002, 112, 517–523. [Google Scholar] [CrossRef] [PubMed]
- Chaumillon, R.; Blouin, J.; Guillaume, A. Eye dominance influences triggering action: The Poffenberger paradigm revisited. Cortex 2014, 58, 86–98. [Google Scholar] [CrossRef]
- Rocca, M.A.; Filippi, M. FMRI correlates of execution and observation of foot movements in left-handers. J. Neurol. Sci. 2010, 288, 34–41. [Google Scholar] [CrossRef] [PubMed]
- Peters, M.; Murphy, K. Cluster analysis reveals at least three, and possibly five distinct handedness groups. Neuropsychologia 1992, 30, 373–380. [Google Scholar] [CrossRef] [PubMed]
- Searleman, A.; Porac, C. Lateral preference profiles and right shift attempt histories of consistent and inconsistent left-handers. Brain Cogn. 2003, 52, 175–180. [Google Scholar] [CrossRef] [PubMed]
- Loffing, F.; Deeken, O.; Schorer, J. Lateral preference in complex combat situations: Prevalence and relationship with general measures of hand and foot preference. Laterality 2023, 29, 37–62. [Google Scholar] [CrossRef]
- Loffing, F. Left-handedness and time pressure in elite interactive ball games. Biol. Lett. 2017, 13, 20170446. [Google Scholar] [CrossRef] [PubMed]
- Raymond, M.; Pontier, D.; Dufour, A.-B.; Møller, A.P. Frequency-dependent maintenance of left handedness in humans. Proc. R. Soc. Lond. Ser. B Biol. Sci. 1996, 263, 1627–1633. [Google Scholar] [CrossRef]
- Peters, M. Phenotype in normal left-handers: An understanding of phenotype is the basis for understanding mechanism and inheritance of handedness. In Advances in Psychology; Elsevier: Amsterdam, The Netherlands, 1990; Volume 67, pp. 167–192. [Google Scholar]
- Calvert, G. Quantifying hand preference using a behavioural continuum. Laterality Asymmetries Body Brain Cogn. 1998, 3, 255–268. [Google Scholar] [CrossRef]
- Nicholls, M.E.; Thomas, N.A.; Loetscher, T.; Grimshaw, G.M. The Flinders Handedness survey (FLANDERS): A brief measure of skilled hand preference. Cortex 2013, 49, 2914–2926. [Google Scholar] [CrossRef]
- Prichard, E.; Propper, R.E.; Christman, S.D. Degree of handedness, but not direction, is a systematic predictor of cognitive performance. Front. Psychol. 2013, 4, 9. [Google Scholar] [CrossRef] [PubMed]
- Prichard, E.C.; Christman, S.D. Need for cognition moderates paranormal beliefs and magical ideation in inconsistent-handers. Laterality Asymmetries Body Brain Cogn. 2016, 21, 228–242. [Google Scholar] [CrossRef]
- Bryden, M.; Roy, E.; McManus, I.; Bulman-Fleming, M. On the genetics and measurement of human handedness. Laterality 1997, 2, 317–336. [Google Scholar] [CrossRef]
- Chapman, J.P.; Chapman, L.J.; Allen, J.J. The measurement of foot preference. Neuropsychologia 1987, 25, 579–584. [Google Scholar] [CrossRef]
- Searleman, A. Subject variables and cerebral organization for language. Cortex 1980, 16, 239–254. [Google Scholar] [CrossRef]
- Zverev, Y.; Mipando, M. Cultural and environmental influences on footedness: Cross-sectional study in urban and semi-urban Malawi. Brain Cogn. 2007, 65, 177–183. [Google Scholar] [CrossRef]
- Packheiser, J.; Schmitz, J.; Berretz, G.; Carey, D.P.; Paracchini, S.; Papadatou-Pastou, M.; Ocklenburg, S. Four meta-analyses across 164 studies on atypical footedness prevalence and its relation to handedness. Sci. Rep. 2020, 10, 14501. [Google Scholar] [CrossRef]
- Elias, L.; Bryden, M.P. Footedness is a better predictor of language lateralisation than handedness. Laterality Asymmetries Body Brain Cogn. 1998, 3, 41–52. [Google Scholar] [CrossRef]
- Watson, G.S.; Pusakulich, R.L.; Ward, J.P.; Hermann, B. Handedness, footedness, and language laterality: Evidence from Wada testing. Laterality Asymmetries Body Brain Cogn. 1998, 3, 323–330. [Google Scholar] [CrossRef] [PubMed]
- Packheiser, J.; Schmitz, J.; Arning, L.; Beste, C.; Güntürkün, O.; Ocklenburg, S. A large-scale estimate on the relationship between language and motor lateralization. Sci. Rep. 2020, 10, 13027. [Google Scholar] [CrossRef] [PubMed]
- Elias, L.J.; Bryden, M.P.; Bulman-Fleming, M.B. Footedness is a better predictor than is handedness of emotional lateralization. Neuropsychologia 1998, 36, 37–43. [Google Scholar] [CrossRef] [PubMed]
- Paracchini, S. Recent advances in handedness genetics. Symmetry 2021, 13, 1792. [Google Scholar] [CrossRef]
- Carey, D.P. Vision research: Losing sight of eye dominance. Curr. Biol. 2001, 11, R828–R830. [Google Scholar] [CrossRef] [PubMed]
- Calvin, W.H. A stone’s throw and its launch window: Timing precision and its implications for language and hominid brains. J. Theor. Biol. 1983, 104, 121–135. [Google Scholar] [CrossRef] [PubMed]
- Lombardo, M.P.; Deaner, R.O. Born to throw: The ecological causes that shaped the evolution of throwing in humans. Q. Rev. Biol. 2018, 93, 1–16. [Google Scholar] [CrossRef]
- Lombardo, M.P.; Deaner, R.O. On the evolution of the sex differences in throwing: Throwing is a male adaptation in humans. Q. Rev. Biol. 2018, 93, 91–119. [Google Scholar] [CrossRef]
- Milks, A.; Parker, D.; Pope, M. External ballistics of Pleistocene hand-thrown spears: Experimental performance data and implications for human evolution. Sci. Rep. 2019, 9, 820. [Google Scholar] [CrossRef] [PubMed]
- Rodway, P.; Thoma, V.; Schepman, A. The effects of sex and handedness on masturbation laterality and other lateralized motor behaviours. Laterality 2022, 27, 324–352. [Google Scholar] [CrossRef] [PubMed]
- Oldfield, R.C. The assessment and analysis of handedness: The Edinburgh inventory. Neuropsychologia 1971, 9, 97–113. [Google Scholar] [CrossRef] [PubMed]
- McManus, I.C. Determinants of Laterality in Man; Cambridge University: Cambridge, UK, 1979. [Google Scholar]
- Beklaryan, A.; Akopov, A.S. Simulation of agent-rescuer behaviour in emergency based on modified fuzzy clustering. In AAMAS’16: Proceedings of the 2016 International Conference on Autonomous Agents & Multiagent Systems; ACM Digital Library: New Yok, NY, USA, 2016; pp. 1275–1276. [Google Scholar]
- D’Urso, P.; Massari, R. Fuzzy clustering of human activity patterns. Fuzzy Sets Syst. 2013, 215, 29–54. [Google Scholar] [CrossRef]
- Pedregosa, F.; Varoquaux, G.; Gramfort, A.; Michel, V.; Thirion, B.; Grisel, O.; Blondel, M.; Prettenhofer, P.; Weiss, R.; Dubourg, V. Scikit-learn: Machine learning in Python. J. Mach. Learn. Res. 2011, 12, 2825–2830. [Google Scholar]
- MacQueen, J. Some methods for classification and analysis of multivariate observations. In Proceedings of the Fifth Berkeley Symposium on Mathematical Statistics and Probability, Oakland, CA, USA, 21 June 1967. [Google Scholar]
- Rujasiri, P.; Chomtee, B. Comparison of clustering techniques for cluster analysis. Agric. Nat. Resour. 2009, 43, 378–388. [Google Scholar]
- Sonagara, D.; Badheka, S. Comparison of basic clustering algorithms. Int. J. Comput. Sci. Mob. Comput 2014, 3, 58–61. [Google Scholar]
- Ghosh, J.; Liu, A. K-means. In The Top Ten Algorithms in Data Mining; Routledge: Oxfordshire, UK, 2009; pp. 21–35. [Google Scholar]
- Kowalski, P.A.; Łukasik, S.; Charytanowicz, M.; Kulczycki, P. Nature inspired clustering–Use cases of krill herd algorithm and flower pollination algorithm. In Interactions Between Computational Intelligence and Mathematics Part 2; Springer: Berlin/Heidelberg, Germany, 2019; pp. 83–98. [Google Scholar]
- Aggarwal, C.C. An introduction to cluster analysis. In Data Clustering; Chapman and Hall/CRC: Boca Raton, FL, USA, 2018; pp. 1–28. [Google Scholar]
- Shiudkar, K.; Takmare, S. Review of existing methods in K-means clustering algorithm. Int. Res. J. Eng. Technol. 2017, 4, 1213–1216. [Google Scholar]
- Rousseeuw, P.J. Silhouettes: A graphical aid to the interpretation and validation of cluster analysis. J. Comput. Appl. Math. 1987, 20, 53–65. [Google Scholar] [CrossRef]
- Aria, M.; Cuccurullo, C.; Gnasso, A. A comparison among interpretative proposals for Random Forests. Mach. Learn. Appl. 2021, 6, 100094. [Google Scholar] [CrossRef]
- Breiman, L. Random forests. Mach. Learn. 2001, 45, 5–32. [Google Scholar] [CrossRef]
- Bergstra, J.; Bengio, Y. Random search for hyper-parameter optimization. J. Mach. Learn. Res. 2012, 13, 281–305. [Google Scholar]
- Fisher, A.; Rudin, C.; Dominici, F. All Models are Wrong, but Many are Useful: Learning a Variable’s Importance by Studying an Entire Class of Prediction Models Simultaneously. J. Mach. Learn. Res. 2019, 20, 177. [Google Scholar]
- Hashimoto, T.; Ueno, K.; Ogawa, A.; Asamizuya, T.; Suzuki, C.; Cheng, K.; Tanaka, M.; Taoka, M.; Iwamura, Y.; Suwa, G. Hand before foot? Cortical somatotopy suggests manual dexterity is primitive and evolved independently of bipedalism. Philos. Trans. R. Soc. B Biol. Sci. 2013, 368, 20120417. [Google Scholar] [CrossRef] [PubMed]
- Hook-Costigan, M.; Rogers, L. Hand preferences in New World primates. Int. J. Comp. Psychol. 1996, 9, 173–207. [Google Scholar] [CrossRef]
- Kaas, J.H. Plasticity of sensory and motor maps in adult mammals. Annu. Rev. Neurosci. 1991, 14, 137–167. [Google Scholar] [CrossRef]
- Peters, M.; Servos, P. Performance of subgroups of left-handers and right-handers. Can. J. Psychol./Rev. Can. Psychol. 1989, 43, 341. [Google Scholar] [CrossRef]
- Stringer, C. The changing landscapes of the earliest human occupation of Britain and Europe. In Developments in Quaternary Sciences; Elsevier: Amsterdam, The Netherlands, 2011; pp. 1–10. [Google Scholar]
- Schoch, W.H.; Bigga, G.; Böhner, U.; Richter, P.; Terberger, T. New insights on the wooden weapons from the Paleolithic site of Schöningen. J. Hum. Evol. 2015, 89, 214–225. [Google Scholar] [CrossRef]
- Thieme, H. Lower Palaeolithic hunting spears from Germany. Nature 1997, 385, 807–810. [Google Scholar] [CrossRef]
- Hopkins, W.D.; Russell, J.; Freeman, H.; Buehler, N.; Reynolds, E.; Schapiro, S.J. The distribution and development of handedness for manual gestures in captive chimpanzees (Pan troglodytes). Psychol. Sci. 2005, 16, 487–493. [Google Scholar] [CrossRef]
- Medland, S.E.; Duffy, D.L.; Wright, M.J.; Geffen, G.M.; Hay, D.A.; Levy, F.; Van-Beijsterveldt, C.E.; Willemsen, G.; Townsend, G.C.; White, V. Genetic influences on handedness: Data from 25,732 Australian and Dutch twin families. Neuropsychologia 2009, 47, 330–337. [Google Scholar] [CrossRef] [PubMed]
- Ocklenburg, S.; Metzen, D.; Schlüter, C.; Fraenz, C.; Arning, L.; Streit, F.; Güntürkün, O.; Kumsta, R.; Genç, E. Polygenic scores for handedness and their association with asymmetries in brain structure. Brain Struct. Funct. 2021, 227, 515–527. [Google Scholar] [CrossRef]
- Schmitz, J.; Zheng, M.; Lui, K.F.; McBride, C.; Ho, C.S.-H.; Paracchini, S. Quantitative multidimensional phenotypes improve genetic analysis of laterality traits. Transl. Psychiatry 2022, 12, 68. [Google Scholar] [CrossRef]
- Corballis, M.C. The genetics and evolution of handedness. Psychol. Rev. 1997, 104, 714. [Google Scholar] [CrossRef]
- McManus, I.C. Handedness, language dominance and aphasia: A genetic model. Psychol. Med. Monogr. Suppl. 1985, 8, 3–40. [Google Scholar] [CrossRef]
- McManus, C. Cerebral polymorphisms for lateralisation: Modelling the genetic and phenotypic architectures of multiple functional modules. Symmetry 2022, 14, 814. [Google Scholar] [CrossRef]
- Laland, K.N.; Kumm, J.; Van Horn, J.D.; Feldman, M.W. A gene-culture model of human handedness. Behav. Genet. 1995, 25, 433–445. [Google Scholar] [CrossRef] [PubMed]
- Corballis, M.C. From mouth to hand: Gesture, speech, and the evolution of right-handedness. Behav. Brain Sci. 2003, 26, 199–208. [Google Scholar] [CrossRef]
- Michel, G.F. Handedness development: A model for investigating the development of hemispheric specialization and interhemispheric coordination. Symmetry 2021, 13, 992. [Google Scholar] [CrossRef]
- Boles, D.B. Cognitive Evolution: From Single Cells to the Human Mind; Taylor & Francis: Abingdon, UK, 2022. [Google Scholar]
- Hamaoui, J.; Stefaniak, N.; Segond, H. The influence of vestibular system and fetal presentation on handedness, cognitive and motor development: A comparison between cephalic and breech presentation. Dev. Sci. 2023, 26, e13317. [Google Scholar] [CrossRef]
- Llaurens, V.; Raymond, M.; Faurie, C. Why are some people left-handed? An evolutionary perspective. Philos. Trans. R. Soc. B Biol. Sci. 2009, 364, 881–894. [Google Scholar] [CrossRef]
- Loffing, F.; Sölter, F.; Hagemann, N. Left preference for sport tasks does not necessarily indicate left-handedness: Sport-specific lateral preferences, relationship with handedness and implications for laterality research in behavioural sciences. PLoS ONE 2014, 9, e105800. [Google Scholar] [CrossRef]
- Schorer, J.; Tirp, J.; Steingröver, C.; Baker, J. Laterality and its role in talent identification and athlete development. In Laterality in Sports; Elsevier: Amsterdam, The Netherlands, 2016; pp. 87–105. [Google Scholar] [CrossRef]
- Richardson, T.; Gilman, R.T. Left-handedness is associated with greater fighting success in humans. Sci. Rep. 2019, 9, 15402. [Google Scholar] [CrossRef] [PubMed]
- Mann, D.L.; Runswick, O.R.; Allen, P.M. Hand and eye dominance in sport: Are cricket batters taught to bat back-to-front? Sports Med. 2016, 46, 1355–1363. [Google Scholar] [CrossRef] [PubMed]
- Papadatou-Pastou, M.; Ntolka, E.; Schmitz, J.; Martin, M.; Munafò, M.R.; Ocklenburg, S.; Paracchini, S. Human handedness: A meta-analysis. Psychol. Bull. 2020, 146, 481. [Google Scholar] [CrossRef] [PubMed]
- Ocklenburg, S.; Berretz, G.; Packheiser, J.; Friedrich, P. Laterality 2020: Entering the next decade. Laterality 2021, 26, 265–297. [Google Scholar] [CrossRef] [PubMed]
Disclaimer/Publisher’s Note: The statements, opinions and data contained in all publications are solely those of the individual author(s) and contributor(s) and not of MDPI and/or the editor(s). MDPI and/or the editor(s) disclaim responsibility for any injury to people or property resulting from any ideas, methods, instructions or products referred to in the content. |
© 2024 by the authors. Licensee MDPI, Basel, Switzerland. This article is an open access article distributed under the terms and conditions of the Creative Commons Attribution (CC BY) license (https://creativecommons.org/licenses/by/4.0/).