Abstract
This work investigates temperature’s effect on the critical energy release rate using damage mechanics material models and the element deletion method. The energy release rate describes the decrease in total potential energy per increase in crack surface area. The critical energy release rate is widely used as the failure criterion for various elastic and plastic materials. In real-life scenarios, fractures may occur at different temperatures. The temperature dependency of the critical energy release rate for aluminum 2024-T351 and titanium Ti-6Al-4V is studied in this work. We utilized test-data-based advanced material models of these two alloys, considering the strain rate, temperature, and state of stress for plasticity and failure. These material models are used to simulate a three-dimensional fracture specimen to find the critical energy release rate at different temperatures. A new method to calculate the critical energy release rate with the element deletion method is introduced and verified with the virtual crack opening method. This method enables the calculation of the energy release rate in a classical damage mechanics simulation for dynamic cack propagation. The simulation result indicates that the critical energy release rate increases with rising temperatures for these alloys.
1. Introduction
Fracture mechanics is an important topic in engineering sciences, especially for automotive and aerospace applications [1,2,3,4]. The history of fracture mechanics dates back 100 years. Inglis first proposed the analytical solution of a stress field around a crack tip [5]. However, his derivation was based on small-strain theory, which leads to an unrealistic stress singularity at the crack tip [6]. Irwin defines the stress intensity factor [7], but the concept is limited to small-strain, linear elastic material and brittle fractures. James Rice [8] cleverly avoids the crack tip singularity by defining a path-independent J-integral around the crack tip. However, this idea is not easily extended to three-dimensional fractures, mixed-mode fractures, or fractures with large-scale plasticity, which is a common case for metallic materials [9,10]. The energy release rate concept was first introduced by Griffith based on a glass experiment [11]. Griffith’s energy release rate states that the dissipated energy is converted to an increment in the crack surface energy; however, this statement is not totally supported by experiments. For example, the surface energy of glass measured from the contact angle is 0.0834 [12]. The critical energy release rate of glass is around 7 [13]. The modern energy release rate is defined as the amount of total potential energy decrease per increase in the fracture surface area [14]. In principle, the energy release rate concept can be extended to large-strain theory and treating materials with non-linearity in elastic and plastic deformation. The energy release rate is more general, as it hints at energy conservation. In practice, the energy release rate value can be calculated using either numerical or experimental methods. There are several ways to calculate energy release rates.
The critical energy release rate can be calculated from the force–displacement curve measured from a fracture specimen during a loading and unloading process [14,15,16]. This method is also applied in experiments for composite [17] and biological tissue material [18,19,20,21], etc. The energy release rate can also be measured with the virtual crack opening method and J-integral. Notice that these three methods can be applied in both experiments and simulations. The node release method can be used to calculate the energy release rate in finite element simulation, as demonstrated by Wang et al. [6,9]. In this method, the crack opening is represented by the separation of two previously connected nodes at the crack tip. The connection force proportionally drops to zero while the displacement is measured. The force–displacement data are used to calculate the energy release rate.
In this study, a method is developed to calculate the energy release rate with the element deletion method (element erosion method), and its verification is presented. Notice that the element deletion method has already been widely adopted to model failure in finite element simulation [22,23,24,25]. Examples include biological material [26], metal manufacturing processes [27,28], civil engineering applications [29], etc. However, the element deletion method has not been used to calculate the energy release rate. We first verify this method with the virtual crack opening method [14,15] to demonstrate its feasibility. Then, we use this method to simulate fracture tests of realistic materials and calculate the critical energy release rate. Based on this, we found the relation between critical energy release and temperature.
The primary motivation of this research is to bridge the gap between fracture mechanics and damage mechanics. Notice that element deletion is the default method for modeling failure in damage mechanics simulations with a finite element analysis. In principle, we should be able to use accurate damage mechanics material models to study fracture behavior. Damage mechanics describe material deformation and failure in terms of stress–strain relations and the strain at failure. Fracture mechanics describe material failure with material fracture toughness parameters. For example, the critical energy release rate, critical J-integral, critical stress intensity factor, critical Crack Tip Opening Displacement (CTOD), and critical Crack Tip Opening Angle (CTOA) are used as material model parameters in fracture mechanics. One material cannot have two independent failure criteria. Theoretically, fracture mechanics material parameters can be computed from the damage mechanics material model using finite element simulation.
Realistic damage mechanics material models were used in the simulation. Plasticity and failure material models of a 0.5-inch aluminum 2024-T351 plate and a 0.5-inch titanium-6Al-4V plate were previously developed by the Federal Aviation Administration to study aircraft engine containment [1,2,30,31]. In these material models, the plasticity depends on temperature and the strain rate; the failure depends on the strain rate, temperature, and state of the stress. These models are based on realistic test data, and they represent realistic material behavior under different temperatures, strain rates, and states of stress. We utilized these material models in the simulation for the calculation of the critical energy release rate.
2. Theory and Methods
2.1. Theroy of Energy Release Rate
The energy release rate is defined as the amount of energy dissipated during crack propagation to increase the crack length. The energy release rate in two dimensions is defined in Equation (1) [9,14],
where is the incremented crack length, represents the strain energy in Equation (2), and is the potential of the external force in Equation (3).
In Equation (2), stands for the strain energy per unit area, and is the area of a body. In Equation (3), describes the external traction force on boundary , and measures the displacement of the boundary . Classical fracture mechanics view the energy release rate as a variable that can be calculated under any loading condition. The crack starts to extend when the energy release rate exceeds the critical energy release rate described in Equation (4).
Classical fracture mechanics treat the critical energy release rate as a constant in material model parameters. In this study, we found that the critical energy release rate depends on temperature.
2.2. Simulation Material Model
The MAT 224 material subroutine in LS-DYNA is a fully tabulated elastic–thermal–visco-plastic deformation and failure model. The linear elasticity part uses Young’s modulus and Poisson’s ratio as material model parameters. The thermal–visco-plasticity part features a fully tabulated input. The strain rate sensitivity table, LCK1, contains the stress vs. plastic strain curves of different strain rates. The temperature sensitivity table, LCKT, contains the stress vs. plastic strain curves for different temperatures. Each curve in the table is defined by discrete data points, and they represent the stress–strain curve under certain constant strain rates and constant temperatures. During the simulation process, the material subroutine automatically interpolates between input data points to obtain the stress value under any strain, strain rate, and temperature at the timestep. The failure criterion is primarily based on plastic strain. A 3D tabulated failure surface, LCF, defines the plastic failure strain as a function of stress triaxiality and Lode parameters. Similar to the plasticity model, the failure subroutine interpolates between the input data points to obtain the failure strain at any strain rate, temperature, and state of the stress. The tabulated curve LCG scales the plastic failure strain with respect to different plastic strain rates. The tabulated curve LCH relates plastic failure strain to temperature. The tabulated curve LCI compensates for the element size effect, making coarser mesh and finer mesh fail under the same conditions. The MAT 224 material subroutine has semi-thermal–mechanical coupling built in. The heat generation is calculated inside the material subroutine and influences the material behavior, but the heat cannot be dissipated if only the mechanical solver is used. The parameter settings for the material model are based on fitting the test data of a 0.5-inch aluminum 2024-T351 plate and a 0.5-inch Ti-6Al-4V plate with an inverse analysis [1,31]. In a quasi-static test, the heat is completely dissipated into the environment, so the temperature is almost constant. To simulate such an isothermal condition, the Taylor-Quinney Coefficient BETA, or the ratio to convert the dissipated energy into heat, needs to be set to a very small number. The unit system for the material model is mm, second, ton, Newton, and Kelvin.
2.3. Critical Energy Release Rate Calculated from Element Deletion Method
We introduced a new method to calculate the critical energy release rate with the element deletion method. The method is later verified against the virtual crack opening method [14,15]. The material model of aluminum 2024-T3 is used in the verification simulation for both methods. In the simulation, the rectangular sample is 24 mm in height, in width, and in thickness and carries a line crack. The simulation model for the element deletion method is shown in Figure 1. The element size is uniformly . The velocity-controlled boundary condition is adopted. The strain rate of the simulation is roughly around .
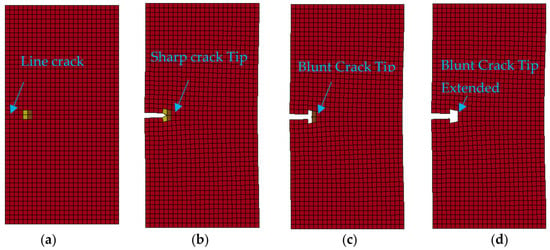
Figure 1.
The scheme of the element deletion method. (a) Initial configuration; (b) the configuration right before element deletion. (c) The configuration before the crack is incremented along the ideal propagation direction. The yellow element at the crack surface is first deleted. (d) The brown element ahead of the crack tip is deleted next.
2.3.1. Critical Energy Release Rate from Element Deletion Method
In the element deletion method, an element is deleted if it satisfies the failure criteria of the material model. The deleted element will be set to zero stiffness and will be excluded from the calculation in future time steps. The strain energy of the deleted element, ∆U, can be directly calculated by the finite element solver. For example, the crack tip element (brown) is the target element used to calculate the energy release in Figure 1b,c. In LS-DYNA, the strain energy of the deleted element can be output by assigning each element a separate part ID and outputting the internal energy of the deleted part. The critical energy release rate is calculated by Equation (5),
where is the maximum internal energy of the element right before the element fails, is the incremented crack length due to the element failing, and is the thickness of the specimen. This equation is another version that states the energy dissipated for an increasing crack area.
2.3.2. Element Deletion Method Result
In the simulation, an element is deleted if it meets the failure criteria, as shown in Figure 1. The first failed element, in theory, is behind the crack tip, which is the darker brown element shown in Figure 1c. Because we used the classical element deletion method without any special treatment of the crack tip element, the “sharp” crack tip will first become “blunt” by deleting the yellow element. At this stage, the sharp crack tip in Figure 1b becomes the blunt crack tip in Figure 1c. Further crack extensions will always have a blunt crack tip. This is the limitation of the element deletion method; the crack geometry cannot be precise. This will be less of a problem if an ultra-fine element size is chosen.
Here, the yellow element is to the left of the original crack tip, while the brown element is our target element used for the energy release rate calculation. The crack tip element (brown) has a maximum internal energy of in Figure 2. It is considered that the strain energy decreased with an increase in the crack surface area. The new crack surface area caused by the element deletion is 2 . The energy release rate is calculated as by Equation (5). Notice that the symmetry in the geometry and boundary condition makes the kinetic energy approximately zero, as shown in Figure 2.
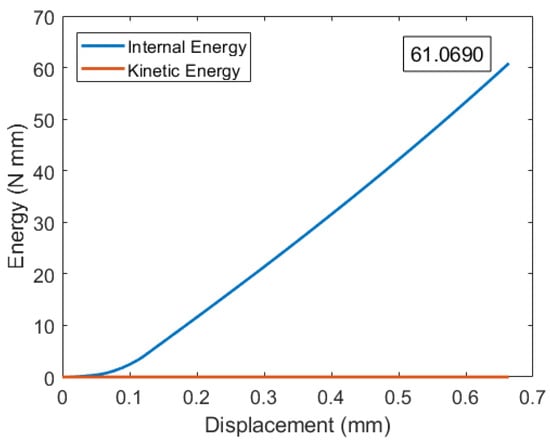
Figure 2.
Energy vs. displacement response by element deletion method.
2.3.3. Critical Energy Release Rate from Virtual Crack Opening Method
The virtual crack opening method is a conventional method for finding the critical energy release rate [14,15,16]. It includes displacement control and force control methods. The displacement control method is applied here as it is closer to the physical test condition. The simulation model for the virtual crack opening method is shown in Figure 3. Notice that the simulation model for the element deletion method is shown in Figure 1. An identical mesh is used for the simulation of both methods. The element size is a uniform . First, the specimen with an initial crack length a is pulled apart right before the crack starts to extend, as shown in Figure 3a. The simulation results of the cross-sectional force ) vs. the grip displacement are recorded. Second, the geometry of the finite element model is modified to have an initial crack size of . The modified specimen is pulled apart right before the crack starts to extend, as shown in Figure 3b. The simulation results of the cross-sectional force vs. the grip displacement are recorded. The critical energy release rate can be calculated with Equation (6).
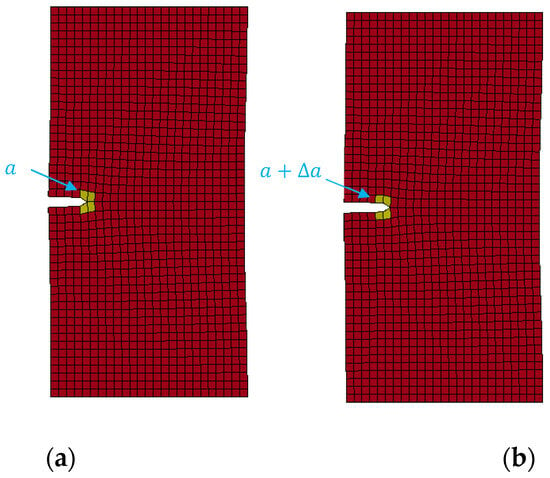
Figure 3.
Virtual crack opening method. (a) Initial crack; (b) incremented crack. The crack tip is at the center of the yellow region. This is a side view of a three-dimensional specimen. The crack tip front is perpendicular to the two-dimensional surface and goes inside the surface.
2.3.4. Virtual Crack Opening Method Result
The force vs. displacement curve for the model with the original and incremented crack length is shown in Figure 4. The integration of the force–displacement curve gives the potential energy. The decrease in the potential energy can thus be calculated. The numerical integration is carried out by using the trapezoidal rule in MATLAB, and the value is . Since the incremented area for the crack surface is , the critical energy release rate ends up being .
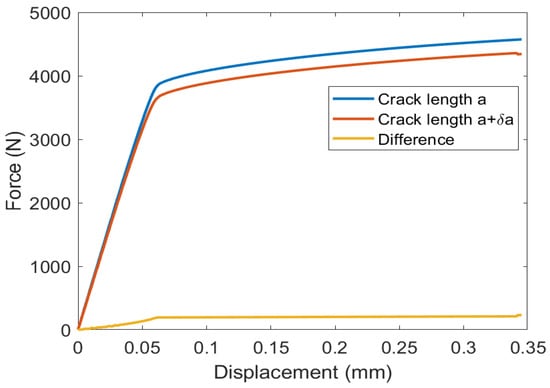
Figure 4.
Force vs. displacement response by virtual crack opening method.
2.3.5. Critical Energy Release Rate Comparison and Verification
The critical energy release rate values calculated by both methods are almost the same, as summarized in Table 1. This result verified that the element deletion method can be used to calculate the critical energy release rate.

Table 1.
Critical energy release rate by virtual crack opening and element deletion methods.
2.4. Critical Energy Release Rate Comparison of Verification
The previous section, Section 2.3, demonstrated the feasibility of using the element deletion method to calculate the critical energy release rate. In this section, we will implement this method for dynamic crack propagation. The 3D thin plate still has dimensions of in length, in width, and in thickness. This simulation model has a line crack of as shown in Figure 5. A line crack is modeled by not letting the adjacent elements share nodes.
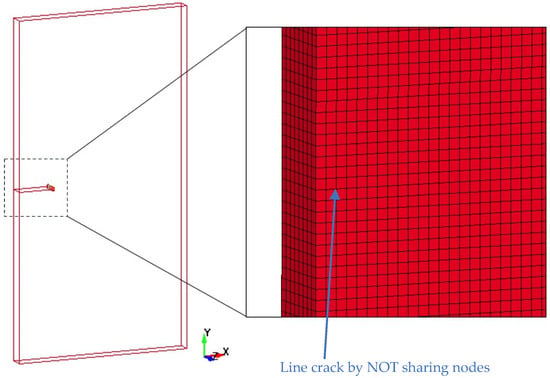
Figure 5.
The geometry and mesh of the finite element model with a perfect crack. (Left): Geometry. (Right): Zoomed-in mesh.
A fully integrated solid mesh with an element of is used in the simulation. A smaller element size is used for better accuracy. The aspect ratio of the elements is close to one, representing a perfect cube, as shown in Figure 5. The geometry is the same as for the mesh used in Section 2.3, Figure 1 and Figure 3, except for the crack length and mesh size.
The velocity-specified boundary condition is applied to the top and bottom nodes to pull the specimen apart. The velocity on each end has the same value but in opposite directions. The loading velocity is , which roughly represents a strain rate of . The Taylor-Quinney Coefficient used to convert the dissipated plastic energy into heat is set to to make the temperature constant in the simulation. We chose four constant temperature cases to study the temperature effect: , , and
At the crack extension moment, the maximum internal energy of the first deleted element is recorded and used as the dissipated energy, . The newly generated crack surface area is recorded as . The critical energy release rate is calculated as for all elements on the crack extension path. It is worthwhile to mention that the kinetic energy in the center is almost zero due to the symmetry in the geometry and boundary conditions.
The specimen is pulled apart until the center elements fail and are deleted one by one until the crack goes through the entire specimen. Each element on the crack extension path is assigned an individual part ID in LS-DYNA, so the part energy file MATSUM can be used to export the strain energy time history of the element, as shown in Figure 6. Since this is a symmetry problem, we chose to output the energy for the element to the bottom of the symmetry plane, as shown in the section view in Figure 6 The temperature case is chosen to study: 1. The critical energy release rate vs. the crack length of a dynamic crack. 2. The crack speed vs. the incremented crack length of a dynamic crack.
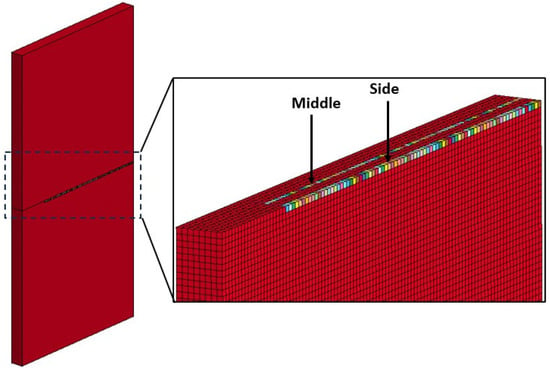
Figure 6.
Finite element model for crack speed study. (Left): Whole model. (Right): Zoomed- in mesh. The colored element on the crack path is used in the calculation of energy release rate.
3. Results
3.1. Temperature Dependency of Critical Energy Release Rate
Table 2 records the average critical energy release rate under different temperatures for aluminum 2024-T351 and titanium-6Al-4V. It is seen that the critical energy release rate increases with an increase in temperature. This observation is in accordance with the common understanding that metal is easier to fracture at low temperatures than at high temperatures. For aluminum 2024-T351, the critical energy release rate has no significant difference between and . The martial critical energy release rate increases dramatically from to . For titanium-6Al-4V, the critical energy release rate increases almost linearly with respect to temperature, as shown in Table 2.

Table 2.
Simulation critical energy release rate vs. temperature.
3.2. Dynamic Crack Size Dependency of Critical Energy Release Rate
In classical fracture mechanics theory, the critical energy release rate is treated as a constant of material model parameters, regardless of the fracture length in fracture propagation. To verify this theory, the critical energy release rate vs. incremented crack size is shown in Figure 7. Notice that the relationship between the crack size and critical energy release rate comes from one simulation of a dynamically extending crack, where the crack size naturally grows from small to large. For aluminum 2024-T351 and titanium-6Al-4V at a temperature of , the simulation result shows that the critical energy release rate is approximately constant regardless of the fracture extension length. The critical energy release rate calculated from the elements on the surface of the specimen is higher than the value calculated from the center elements. A comparison is shown in Table 2. A similar pattern is also seen for the critical energy release rate at other temperatures as well. This may be caused by the center element and the edge element failing in different states of stress (triaxiality and lode parameter). In the material model we used, different states of stress correspond to different failure strains, and thus, different strain energies are deleted at the moment of failure.
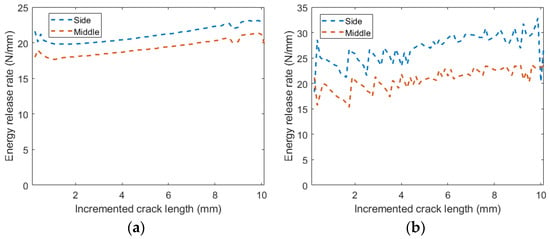
Figure 7.
Critical energy release rate vs. incremented crack size at a temperature of . (a) Aluminum 2024-T351. (b) titanium-6Al-4V.
3.3. Crack Speed in Dynamic Crack Popogation
The crack speed vs. incremental crack size is shown in Figure 8. The simulation is for aluminum 2024-T351 and titanium-6Al-4V at a temperature of . The crack speed of aluminum 2024-T351 increases from below to around . A large fluctuation is seen when the material is about to fail. This is similar to the prediction in classical fracture mechanics. The titanium-6Al-4V simulation shows an unstable crack speed.
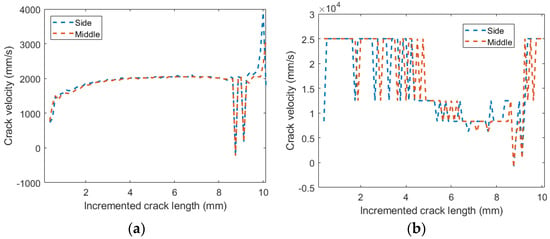
Figure 8.
Crack speed vs. incremented crack size at a temperature of 300 K. (a) Aluminum 2024-T351. (b) Titanium6Al-4V.
3.4. Crack Tip Profile at Critical Time
Figure 9 demonstrates the critical moment right before element deletion at as an example. The highlighted elements are the first deleted elements to extend the crack length. The high ductility of the metal alloy causes the excessive deformation of the crack tip element before failure. The elements ahead of the crack edge were damaged first before the crack propagated. This is caused by the limitations of the element deletion method. The cases of , , and have similar configurations.
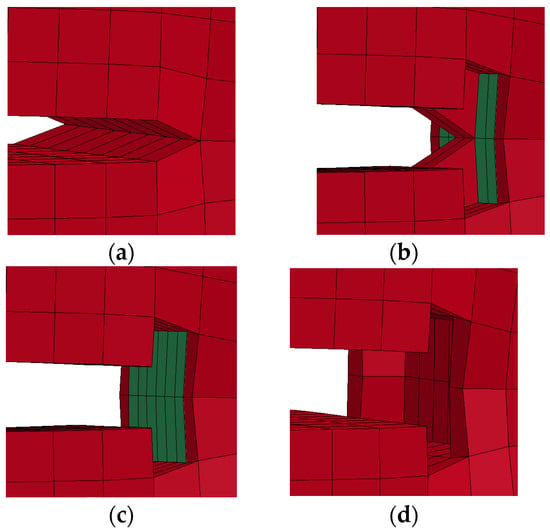
Figure 9.
Crack edge profile before the crack prorogation of aluminum 2024-T351 at . The green colored elements are the target elements. (a) The moment crack is about to extend. (b) The moment right after the deletion of the first element. (c) The moment crack become “blunt”. (d) The moment right after the target element is deleted.
3.5. Crack Front Profile during Propagation
Figure 10 shows the crack’s front profile during the propagation process. The crack grows along the positive X-axis, or to the right. The crack’s front profile is symmetrical along the Z-axis, or normal to the paper. This is because of the symmetry in the geometry. During the process, the crack’s front profile grows self-similarly, which is consistent with classic fracture mechanics theory [7,8,11]. For example, the crack’s front profiles in Figure 10b,h repeat at later stages in Figure 10d,j separately. We selected and recorded 12 stages in the same time interval.
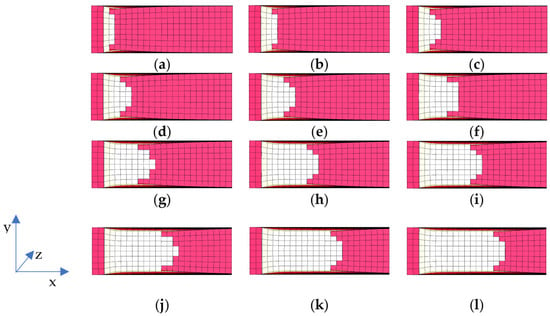
Figure 10.
Dynamic crack front profile of aluminum 2024-T351 at a temperature of . The time frame increases (a–l). The element with pink color is the internal element of the original specimen. The element with white color is the new crack surface.
3.6. Initial Crack Size Dependency of Critical Energy Release Rate
Temperature’s effect on the critical energy release rate of a specimen with different initial crack sizes is shown in Figure 11. Aluminum 2024-T351 and titanium-6Al-4V show that the initial crack length does not affect the critical energy release rate under a specific temperature. This is in agreement with classical fracture mechanics theory. This means that the critical energy release rate can be used as a constant material model parameter for predicting the extension of crack with different crack lengths.. Notice that these conclusions come from damage mechanics simulations with an advanced material model, not from fracture mechanics theory.
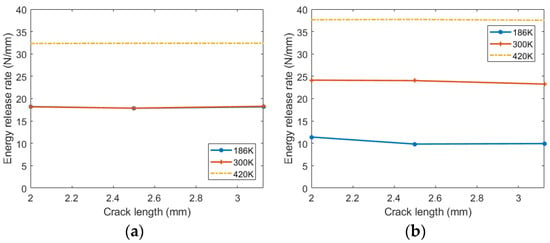
Figure 11.
Critical energy release rate vs. crack length at different temperatures. (a) Aluminum 2024-T351. (b) Titanium-6Al-4V.
4. Discussion
Test data for the critical energy release rate under high and low temperatures are not found in the literature for aluminum 2024-T351 and titanium-6Al-4V. The room-temperature fracture test data in the literature [32] only report the critical stress intensity factor. Although the critical energy release rate can be converted from a critical stress intensity factor, the conversation is based on a linear elastic material, which is not the case for aluminum and titanium. If we use the conversion equation regardless, the aluminum 2024-T3 alloy compact tension specimens at low strain rates give critical energy release rates ranging from to with a to crack extension [32]. This test for aluminum 2024-T3 is conducted in different environments (exfoliation corrosion solution, air, and sodium chloride) at low strain rates. A different result is found for aluminum 2024-T351, with critical energy release rates ranging from to using compact tension specimens with different geometries [33]. Our aluminum result is . The titanium-6Al-4V critical energy release rate is reported to be around in a test on compact tension specimens made by additive manufacturing [34]. Our result is . Besides the conversion error above, the material properties of the aluminum and titanium alloys may be quite different with respect to different heat treatments, plate thicknesses, manufacturing conditions, plate stocks, etc. [31]. So, a comparison with a similar alloy can only serve as a reference.
An experiment on a long glass specimen [35] and laminate composite [36] shows that the critical energy release rate increases with temperature. This agrees with our result. The crack speed for aluminum 2024-T351 agrees with classical dynamic fracture mechanics theory [37]. However, the crack velocity oscillations for titanium-6Al-4V need further investigation. Interestingly, a similar study reported that the crack speed oscillates when it reaches a critical value on a PMMA plate [38].
This work introduced a new method to calculate the critical energy release rate in finite element analysis. The simulation procedure is identical to a standard finite element analysis with the element deletion method. The simulation result can be converted into a critical energy release rate based on the suggested method. With this method, the damage mechanics simulation based on plasticity and failure material models can be used to calculate the critical energy release rate. The method is validated with the virtual crack opening method, and it can be used in dynamic fracture propagation. Unlike the virtual crack opening method, this method only needs a single simulation. It is worthwhile to mention that the key reason for using this method to calculate the critical energy release rate is to have an advanced material model which is correlated with experiment data on deformation and failure.
In summary, our simulation result demonstrates that the initial crack size does not affect the critical energy release rate. Therefore, the critical energy release rate fracture criterion is still valid in damage mechanics simulations with the use of plasticity and failure models as the material models. Ideally, the parameters used in fracture criteria should not be related to the specimen shape, crack length, crack mode, etc. For example, the stress intensity factor requires a manual distinction between crack modes, which limits its use in general three-dimensional problems. This work verified that the critical energy release rate can be used as a fracture criterion.
5. Conclusions and Future Work
The goal and major contribution of this work is to demonstrate that the critical energy release rate increases with rising temperatures for aluminum and titanium alloys. Our numerical results demonstrate this phenomenon by simulating a fracture test with a test-data-based material model. The specific contributions are summarized as follows. (1) We introduce a method to calculate the critical energy release rate with the element deletion method and verify its feasibility. (2) We demonstrate that the element deletion method is able to calculate the critical energy release rate in dynamic crack propagation. (3) We discussed the dependency of the critical energy release rate with respect to different temperatures, crack extension lengths, crack initial lengths, and crack speeds for the titanium and aluminum alloys. (4) We verified a self-similar crack profile in a dynamic crack propagation simulation.
Our method provides a feasible way to identify the temperature dependency of the critical energy release rate during dynamic crack propagation. Our calculated values are in general agreement with test values in the literature, given the fact that the material is not exactly the same and the numerical conversion is an approximation. Our result indicates that temperature dependency must be considered when using the critical energy release rate as a fracture criterion. Several aspects need to be considered in further work. First, studies may include the strain rate’s effect on the critical energy release rate and the case with heat elevation and dissipation on the crack tip [20,21,39,40,41,42,43]. Another idea is to decrease the mesh size to better capture the crack tip geometry. Refining the element size will decrease the effect of the deleted element on the crack profile. Finally, fracture mechanic testing needs to be conducted on the same material that these advanced models are based on.
Author Contributions
Conceptualization, T.L., L.W. and J.D.L.; methodology, T.L., L.W. and J.D.L.; software, T.L. and L.W.; validation T.L. and L.W.; formal analysis, T.L., L.W. and C.-D.K.; investigation, T.L., L.W. and J.D.L.; resources, J.D.L. and C.-D.K.; data curation, T.L., L.W. and C.-D.K.; writing—original draft preparation, T.L.; writing—review and editing, T.L., L.W. and J.D.L.; visualization, T.L. and L.W.; supervision, J.D.L. and C.-D.K.; project administration, L.W. and C.-D.K.; All authors have read and agreed to the published version of the manuscript.
Funding
This research received no external funding.
Data Availability Statement
The raw data supporting the conclusions of this article will be made available by the authors on request.
Acknowledgments
The material models for titanium Ti-6Al-4V and aluminum AA2024-T3 used in this study were developed by the Center for Collision Safety and Analysis at George Mason University under the Federal Aviation Administration’s (FAA) Aircraft Catastrophic Failure Prevention Program. The authors wish to thank the FAA for their support in developing these material models.
Conflicts of Interest
The authors declare no conflict of interest.
References
- Haight, S.; Wang, L.; Bois, P.D.; Carney, K.; Kan, C.-D. Development of a Titanium Alloy ti-6al-4v Material Model Used in ls-Dyna, DOT/FAA/TC-15/23. 2015. Available online: https://www.tc.faa.gov/its/worldpac/techrpt/tc15-23.pdf (accessed on 1 December 2023).
- Park, C.-K.; Carney, K.; Bois, P.D.; Cordasco, D.; Aluminum, C.-D.K. 2024-T351 Input Parameters for *MAT_224 in LS-DYNA, DOT/FAA/TC-19/41 2020. Available online: https://www.tc.faa.gov/its/worldpac/techrpt/tc19-41-p1.pdf (accessed on 1 December 2023).
- McDanels, S.; Mayeaux, B.; Russell, R.; Collins, T.; Jerman, G.; Shah, S.; Piascik, R. An overview of the space shuttle Columbia accident from recovery through reconstruction. J. Fail. Anal. Prev. 2006, 6, 82–91. [Google Scholar] [CrossRef]
- Cikanek, H., III. Characteristics of space shuttle main engine failures. In Proceedings of the 23rd Joint Propulsion Conference, San Diego, CA, USA, 29 June–2 July 1987; p. 1939. [Google Scholar] [CrossRef]
- Inglis, C.E. Stresses in a plate due to the presence of cracks and sharp corners. Trans. Inst. Naval. Archit. 1913, 55, 219–241. [Google Scholar]
- Wang, L. Energy Release Rate in Fracture Mechanics. Ph.D. Thesis, The George Washington University, Washington, DC, USA, 2015. [Google Scholar] [CrossRef]
- Irwin, G.R. Analysis of stresses and strains near the end of a crack traversing a plate. J. Appl. Mech. 1957, 24, 361–364. [Google Scholar] [CrossRef]
- Rice, J.R. A path independent integral and the approximate analysis of strain concentration by notches and cracks. J. Appl. Mech. 1968, 35, 379–386. [Google Scholar] [CrossRef]
- Long, T.; Wang, L.; Kan, C.-D.; Lee, J.D. Numerical verification of energy release rate and J-Integral in large strain formulation. Forces Mech. 2023, 11, 100202. [Google Scholar] [CrossRef]
- Hallquist, J.O. Ls-dyna keyword user’s manual. Livermore Softw. Technol. Corp. 2007, 970, 299–800. [Google Scholar]
- Griffith, A.A. VI. the phenomena of rupture and flow in solids, Philosophical transactions of the royal society of London. Ser. A Contain. Pap. A Math. Phys. Character 1921, 221, 163–198. [Google Scholar] [CrossRef]
- Rhee, S.K. Surface energies of silicate glasses calculated from their wettability data. J. Mater. Sci. 1977, 12, 823–824. [Google Scholar] [CrossRef]
- Available online: https://www.fracturemechanics.org/griffith.html (accessed on 1 December 2023).
- Sun, C.-T.; Jin, Z. Fracture Mechanics; Academic Press: New York, NY, USA, 2011. [Google Scholar]
- Anderson, T.L. Fracture Mechanics: Fundamentals and Applications; CRC Press: Boca Raton, FL, USA, 2017. [Google Scholar]
- Janssen, M.; Zuidema, J.; Wanhill, R. Fracture Mechanics: Fundamentals and Applications; CRC Press: Boca Raton, FL, USA, 2004. [Google Scholar]
- Zou, Z.; Reid, S.; Soden, P.; Li, S. Measurement of the critical energy release rate Giic for filament wound grp pipes. Compos. Part A Appl. Sci. Manuf. 2001, 32, 271–280. [Google Scholar] [CrossRef]
- Oyen-Tiesma, M.; Cook, R.F. Technique for estimating fracture resistance of cultured neocartilage. J. Mater. Sci. Mater. Med. 2001, 12, 327–332. [Google Scholar] [CrossRef]
- Giner, E.; Belda, R.; Arango, C.; Vercher-Martínez, A.; Taranc, J.E.; Fuenmayor, F.J. Calculation of the critical energy release rate Gc of the cement line in cortical bone combining experimental tests and finite element models. Eng. Fract. Mech. 2017, 184, 168–182. [Google Scholar] [CrossRef]
- Zhang, Z.; Wang, X.; Lee, J.D. An atomistic methodology of energy re- lease rate for graphene at nanoscale. J. Appl. Phys. 2014, 115, 114314. [Google Scholar] [CrossRef]
- D’Amico, F.; Carbone, G.; Foglia, M.; Galietti, U. Moving cracks in viscoelastic materials: Temperature and energy-release-rate measurements. Eng. Fract. Mech. 2013, 98, 315–325. [Google Scholar] [CrossRef]
- Zhang, H.; Ravi-Chandar, K. On the dynamics of localization and fragmentation-iv. expansion of al 6061-o tubes. Int. J. Fract. 2010, 163, 41–65. [Google Scholar] [CrossRef]
- Margerit, P.; Weisz-Patrault, D.; Ravi-Chandar, K.; Constantinescu, A. Tensile and ductile fracture properties of as-printed 316l stainless steel thin walls obtained by directed energy deposition. Addit. Manuf. 2021, 37, 101664. [Google Scholar] [CrossRef]
- Zhang, H.; Ravi-Chandar, K. Dynamic fragmentation of ductile materials. J. Phys. D Appl. Phys. 2009, 42, 214010. [Google Scholar] [CrossRef]
- Landis, C.M.; Ravi-Chandar, K.; Hughes, T.J. Texas Univ at Austin Austin United States. In An Integrated Experimental and Modeling Study of Ductile Fracture; Defense Technical Information Center: Ft. Belvoir, VA, USA, 2017. [Google Scholar]
- Cui, Y.; Xiang, D.; Shu, L.; Liao, Z.; Zhang, Z.; Liu, W. Effects of impact speeds, fall postures and cortical thicknesses on femur fracture by incremental element deletion based finite element analysis. Authorea 2021, preprints. [Google Scholar] [CrossRef]
- Li, Y.; Luo, M.; Gerlach, J.; Wierzbicki, T. Prediction of shear-induced fracture in sheet metal forming. J. Mater. Process. Technol. 2010, 210, 1858–1869. [Google Scholar] [CrossRef]
- Liu, J.; Bai, Y.; Xu, C. Evaluation of ductile fracture models in finite element simulation of metal cutting processes. J. Manuf. Sci. Eng. 2014, 136, 011010. [Google Scholar] [CrossRef]
- Adewole, K.K.; Bull, S.J. Prediction of the fracture performance of defect-free steel bars for civil engineering applications using finite element simulation. Constr. Build. Mater. 2013, 41, 9–14. [Google Scholar] [CrossRef]
- Wang, L.; Dicecca, F.; Haight, S.; Carney, K.; DuBois, P.; Emmerling, W.; Kan, C. Test and simulation comparison using titanium material models based on mat224. In Proceedings of the 14th International LS-DYNA Users Conference, Detroit, MI, USA, 12–14 June 2016; pp. 1–17. [Google Scholar]
- Seidt, J.D.; Park, C.-K.; Buyuk, M.; Lowe, R.L.; Wang, L.; Carney, K.S.; Bois, P.D.; Gilat, A.; Kan, C.-D. An experimental investigation of the influence of the state of stress on the ductile fracture of 2024-t351 aluminum. J. Eng. Mater. Technol. 2022, 144, 041006. [Google Scholar] [CrossRef]
- Pretorius, C.C.; Mostert, R.J.; Ramjee, S. The crack growth resistance behaviour of aluminium alloy 2024-T3 at slow strain rates after exposure to standard corrosive environments. J. S. Afr. Inst. Min. Metall. 2021, 121, 151–158. [Google Scholar] [CrossRef]
- Griffis, C.; Yoder, G. Initial crack extension in two intermediate-strength aluminum alloys. J. Eng. Mater. Technol. 1976, 98, 152–158. [Google Scholar] [CrossRef]
- Ojo, S.A. Use of Compact Specimens to Determine Fracture Tough-Ness and Fatigue Crack Growth Anisotropy of Ded Additive Manufactured ti-6al-4v. Ph.D. Thesis, University of Akron, Akron, OH, USA, 2020. [Google Scholar] [CrossRef]
- Menouillard, T.; Belytschko, T. Analysis and computations of oscillating crack propagation in a heated strip. Int. J. Fract. 2011, 167, 57–70. [Google Scholar] [CrossRef]
- Belhouari, M.; Benkheira, A.; Madani, K.; Campilho, R.; Gong, X. Effect of temperature on the energy release rate variation in repaired laminate composites. J. Fail. Anal. Prev. 2023, 23, 420–435. [Google Scholar] [CrossRef]
- Freund, L. Dynamic Fracture Mechanics; Cambridge University Press: New York, NY, USA, 1990. [Google Scholar]
- Zhang, Z.Y.; Duan, Z.; Zhou, F.H. Velocity-toughening and crack speed oscillations in the dynamic fracture of PMMA plates. Appl. Mech. Mater. 2014, 566, 298–304. [Google Scholar] [CrossRef]
- Mahanta, B.; Tripathy, A.; Vishal, V.; Singh, T.; Ranjith, P. Effects of strain rate on fracture toughness and energy re- lease rate of gas shales. Eng. Geol. 2017, 218, 39–49. [Google Scholar] [CrossRef]
- Kroon, M. Energy release rates in rubber during dynamic crack propagation. Int. J. Solids Struct. 2014, 51, 4419–4426. [Google Scholar] [CrossRef][Green Version]
- Ekhtiyari, A.; Alderliesten, R.; Shokrieh, M.M. Loading rate dependency of strain energy release rate in mode i delamination of composite laminates. Theor. Appl. Fract. Mech. 2021, 112, 102894. [Google Scholar] [CrossRef]
- Balden, V.; Nurick, G. Numerical simulation of the post-failure motion of steel plates subjected to blast loading. Int. J. Impact Eng. 2005, 32, 14–34. [Google Scholar] [CrossRef]
- Zhu, Y.; Liu, K.; Wen, Y.; Cui, G.; Niu, W.; Wang, Y.; Cao, Y.; Xu, C. Experimental and numerical study on the ballistic performance of ultrahigh molecular weight polyethylene laminate. Polym. Compos. 2021, 42, 5168–5198. [Google Scholar] [CrossRef]
Disclaimer/Publisher’s Note: The statements, opinions and data contained in all publications are solely those of the individual author(s) and contributor(s) and not of MDPI and/or the editor(s). MDPI and/or the editor(s) disclaim responsibility for any injury to people or property resulting from any ideas, methods, instructions or products referred to in the content. |
© 2024 by the authors. Licensee MDPI, Basel, Switzerland. This article is an open access article distributed under the terms and conditions of the Creative Commons Attribution (CC BY) license (https://creativecommons.org/licenses/by/4.0/).