Article

Identification of Structural Constituents in Advanced Multiphase High-Strength Steels Using Electron Back-Scattered Diffraction

by
Aleksandra Kozłowska
1,
Krzysztof Radwański
2 and
Adam Grajcar
1,*
1
Department of Engineering Materials and Biomaterials, Faculty of Mechanical Engineering, Silesian University of Technology, 18A Konarskiego Street, 44-100 Gliwice, Poland
2
Łukasiewicz Research Network-Upper Silesian Institute of Technology, 12-14 K. Miarki Street, 44-100 Gliwice, Poland
*
Author to whom correspondence should be addressed.
Symmetry 2024, 16(12), 1630; https://doi.org/10.3390/sym16121630
Submission received: 4 October 2024 / Revised: 24 November 2024 / Accepted: 6 December 2024 / Published: 9 December 2024
(This article belongs to the Special Issue Feature Papers in Section "Engineering and Materials" 2024)

Abstract

:
This study addresses the characterization of the particular microstructural constituents of multiphase transformation-induced plasticity (TRIP)-aided steels belonging to the first and third generations of Advanced High Strength Steels (AHSS) to explore the possibilities of the EBSD method. Complex microstructures composed of ferrite, bainite, retained austenite and martensite were qualitatively and quantitatively assessed. Microstructural constituents with the same crystal structure were distinguished using characteristic EBSD parameters like confidence index (CI), image quality (IQ), kernel average misorientation (KAM) and specific crystallographic orientation relationships. A detailed linear analysis of the IQ parameter and misorientation angles was also performed. These tools are very helpful in linking different symmetric or asymmetric features of metallic alloys with a type of their structure and morphology details. Two types of samples were investigated: thermomechanically processed and subjected to 10% tensile strain to study the microstructural changes caused by plastic deformation.

1. Introduction

Lightweighting is a major trend in the automotive industry due to constantly increasing demands related to the reduction of CO2 emissions, fuel consumption and environmental impact. The aim of lightweighting can be achieved through the optimized structural design and the use of materials with high strength properties [1,2]. AHSS which offer both high strength and high ductility are ideally suited for complex geometries of modern automotive lightweight structures. AHSS are classified into three generations. The first generation of AHSS includes TRIP steels (1.5–2.5 wt.% of Mn) with a microstructure composed of ferrite, bainite and retained austenite (RA) showing tensile strength above 600 MPa and total elongation up to 25% [3,4,5]. The second generation of AHSS includes high-Mn twinning-induced plasticity (TWIP) and TRIP steels (15–30 wt.% of Mn) with an austenitic microstructure that offers tensile strength above 700 MPa and extraordinary ductility exceeding 60% [6,7,8]. However, due to difficulties in mass production of high-Mn steels and their material cost, the newest medium-Mn steels (3–12 wt.% Mn) with a microstructure composed of ferritic, bainitic or martensitic matrix and about 20–40% of RA, belonging to the third generation of AHSS were developed. Medium-Mn steels are attractive for the automotive industry because they offer a good trade-off between material cost and mechanical properties [9,10,11].
RA is a key microstructural constituent in advanced high-strength multiphase steels due to strain-induced martensitic transformation (SIMT) of metastable RA during deformation, which effectively enhances the strength–ductility balance and provides a high work hardening rate. The retention of RA in the microstructure is possible due to the diffusion of C and Mn from ferrite, bainite or martensite into austenite during thermomechanical processing or heat treatment [12,13]. The identification and quantification of individual microstructural constituents is needed to optimize the microstructure and mechanical properties of multiphase steels. However, this can be challenging because ferrite, bainite and martensite have the same body-centered cubic (BCC) crystal structure. The distinction of these structural constituents is possible based on differences in their dislocation density; however, this approach is often difficult due to significant grain refinement or crystal lattice distortion caused by plastic deformation [14]. Phase identification can be provided using several research methods based on the diffraction analysis, which is particularly useful for identifying solid state materials with highly ordered atomic locations. The most widely used method for phase identification is X-ray diffraction (XRD). However, separating ferrite, bainite and martensite using XRD is challenging because the presence of martensite broadens ferrite diffraction peaks [15,16]. Also, the difficulties associated with the texture often cause problems with the phase identification. The XRD method is commonly used for the quantitative assessment of the volume fraction of RA in multiphase steels. For this purpose, Averbach-Cohen or Rietveld methods are used [17]. The identification of the individual phases can be also performed using a transmission electron microscope (TEM) technique based on the selected area electron diffraction (SAED) pattern, which utilizes very precise symmetry of atom locations [18,19,20].
The EBSD method is an advanced research technique used for crystalline materials that allows individual microstructural constituents to be quantified and qualitatively assessed [21]. There are different parameters based on crystal symmetry/asymmetry, which are helpful in structural identification. RA and ferrite/bainite/martensite can be usually distinguished based on phase distribution maps due to their different crystal symmetry. The distinction of structural constituents with the same crystal lattice requires more detailed EBSD analysis. Petrov et al. [22] used the IQ parameter and CI corresponding to the Kikuchi diffraction band contrast to distinguish ferrite and bainite in a multiphase TRIP steel. These two phases with the BBC crystal structure can be distinguished based on the amount of lattice defects, which is higher in bainite, leading to a lower IQ parameter [22]. Martensite is located in areas of the lowest pattern quality due to its high dislocation density or may not be indexed by the software [23,24]. The IQ distribution deconvolution method allows for the quantitative assessment of the fraction of microstructural constituents with the same crystal structure [25]. The individual microstructural constituents in multiphase steels can be also distinguished based on a KAM map [22,26,27]. KAM is typically used to characterize the local strain distribution within the microstructure [28]. The EBSD method also enables the determination of misorientation angles between individual phases. The Kurdjumov-Sachs (K-S) and Nishiyama-Wassermann (N-W) crystallographic orientation relationships are used to characterize the microstructure of multiphase steels containing RA. The location of bainite/martensite-retained austenite interfaces can be revealed by their characteristic regular orientation relationships. The occurrence of misorientation angles close to 45° indirectly confirms the presence of K-S and N-W orientation relationships [22,29,30].
The aim of this work was to explore different EBSD parameters based on the symmetric features of Kikuchi lines and other relationships that are essential for the complex characterization of different microstructural constituents in advanced hot-deformed and cold-deformed multiphase TRIP-aided steels. The significance of the study is to demonstrate how complex microstructures being present in advanced high strength steels can be assessed quantitatively based on symmetrical and morphological features of different structural constituents using various analytical techniques provided by the EBSD method.

2. Materials and Methods

2.1. Materials

The investigated materials were two advanced steels belonging to the 1st and 3rd generation of AHSS. Their chemical compositions are listed in Table 1.
Both investigated steels were produced in a vacuum induction melting process. Both ingots of low-Mn and medium-Mn steels were hot-forged in a temperature range of 1200–900 °C to a thickness of 22 mm. Then, they were semi-industrially hot-rolled in a temperature range 1200–900 °C to a thickness of 7 mm. The final thermomechanical rolling included austenitization at 1150 °C for 900 s; next, the sheets were deformed in 3 passes at deformation temperatures of 1050 °C, 950 °C and 850 °C, resulting in a final thickness of 3 mm. The low-Mn steel sheets were air-cooled to 700 °C after the final deformation and then cooled more slowly to 600 °C within 60 s using a furnace cooling. Afterwards, the sheets were cooled at a rate of ~50 °C/s to the isothermal holding temperature of 450 °C and they were isothermally held in this temperature within 600 s; then, they were finally cooled at a rate of 0.5 °C/s to room temperature. The aim of such a multi-step cooling process was to obtain ferrite-based steel with bainitic and austenitic islands, which is typical for conventional TRIP-aided steels (1st gen. AHSS) [3]. The time–temperature parameters of low-Mn steel were selected to ensure the optimal conditions for stabilizing the RA in the final microstructure. Results of our previous study [31] showed that the microstructure of low-Mn steel after isothermal holding at 400–450 °C was composed of large fraction of RA in a form of fine grains or interlath regions in bainitic islands. Since the medium-Mn steel is characterized by higher hardenability, the sheet was air-cooled to 280 °C and then immediately reheated to 400 °C and held at this temperature for 900 s. The quenching temperature of 280 °C was selected to obtain about 15–20 vol.% of austenite in the microstructure and the rest is martensite. The partitioning step was carried out at 400 °C for 900 s to stabilize austenite through the diffusion of carbon from supersaturated martensite into the austenite [32]. Afterwards, the sheet was air-cooled to room temperature. Such a heat treatment is typical for obtaining so-called QP (Quenching and Partitioning) steels, which belong to the 3rd gen. AHSS [9,13]. The processing schedules of the low-Mn and medium-Mn steel are presented in Figure 1. The schedules applied to the investigated steels were designed based on dilatometric results presented in works [31,32]. The thermomechnical processing of both steels was performed using the LPS/B semi-industrial line located at the Łukasiewicz Research Network-Upper Silesian Institute of Technology, Gliwice, Poland [33].

2.2. Description of Experimental Methods

The samples for EBSD and scanning electron microscopy (SEM) investigations were prepared from the thermomechanically processed sheets of both investigated steels. Moreover, the low-Mn steel was subjected to a static tensile test carried out up to 10% strain at room temperature to characterize microstructural features of strain-induced martensite. Specimens for tensile tests, with a thickness of 3 mm and a gauge width of 12.5 mm, were machined from the thermomechanically processed sheet parallel to the rolling direction. Samples for microstructural analysis were mechanically ground with SiC paper and then polished using diamond paste and finished with colloidal silica suspension. Then, the samples were etched in 5% nital for 10 s. SEM observations were carried out in a Zeiss Supra 25 microscope (Carl Zeiss AG, Jena, Germany) operating in secondary electron (SE) mode at a accelerating voltage of 14 kV and a working distance of 14 mm.
The surface of specimens for EBSD analysis was prepared through mechanical grinding followed by electrolytic etching using the TenuPol-5 device (Struers, Ballerup, Denmark) and electrolyte A8 produced by Struers® (Struers, Ballerup, Denmark) at the temperature ~10 °C using the voltage of 58 V and polishing time of about 40 s. The investigations were performed on samples tilted at 70° using a high-resolution INSPECT F SEM. EBSD maps were collected using an accelerating voltage 20 kV, a step size of 0.025 µm and a working distance of 15 mm.
The EBSD measurements included the analysis of different maps to characterize the complex multiphase microstructures in detail. Phase distribution maps were obtained based on the differences in the crystal structure of the microstructural constituents. The IQ maps, which correspond to the sharpness of the Kikuchi pattern were used to distinguish the microstructral constituents with the same BBC crystal structure. The strain distribution in the microstructure of investigated steels was characterized based on the KAM maps, which refer to the numerical misorientation average of an individual pixel with its neighbours [22]. KAM can be defined as follows:
K A M   ( j ) = 1 l   k = 1 θ j k
where l is the number of pixels in the vicinity of the pixel j for which θ j k < 5°, θ j k is a misorientation angle between pixels j and k. The crystallographic orientation relationships between FCC and BCC phases were analyzed, including the K-S and N-W relationships. The characteristic features of the K-S and N-W orientation relationships are presented in Table 2. The orientation data were postprocessed with OIM-TSL® data analysis software v. 5.3.1 (EDAX, Pleasanton, CA, USA). after using a one-step grain CI standardization clean-up procedure. The remaining pixels with a confidence index CI < 0.1 were excluded from the EBSD analysis as dubious.

3. Results and Discussion

3.1. SEM Observations

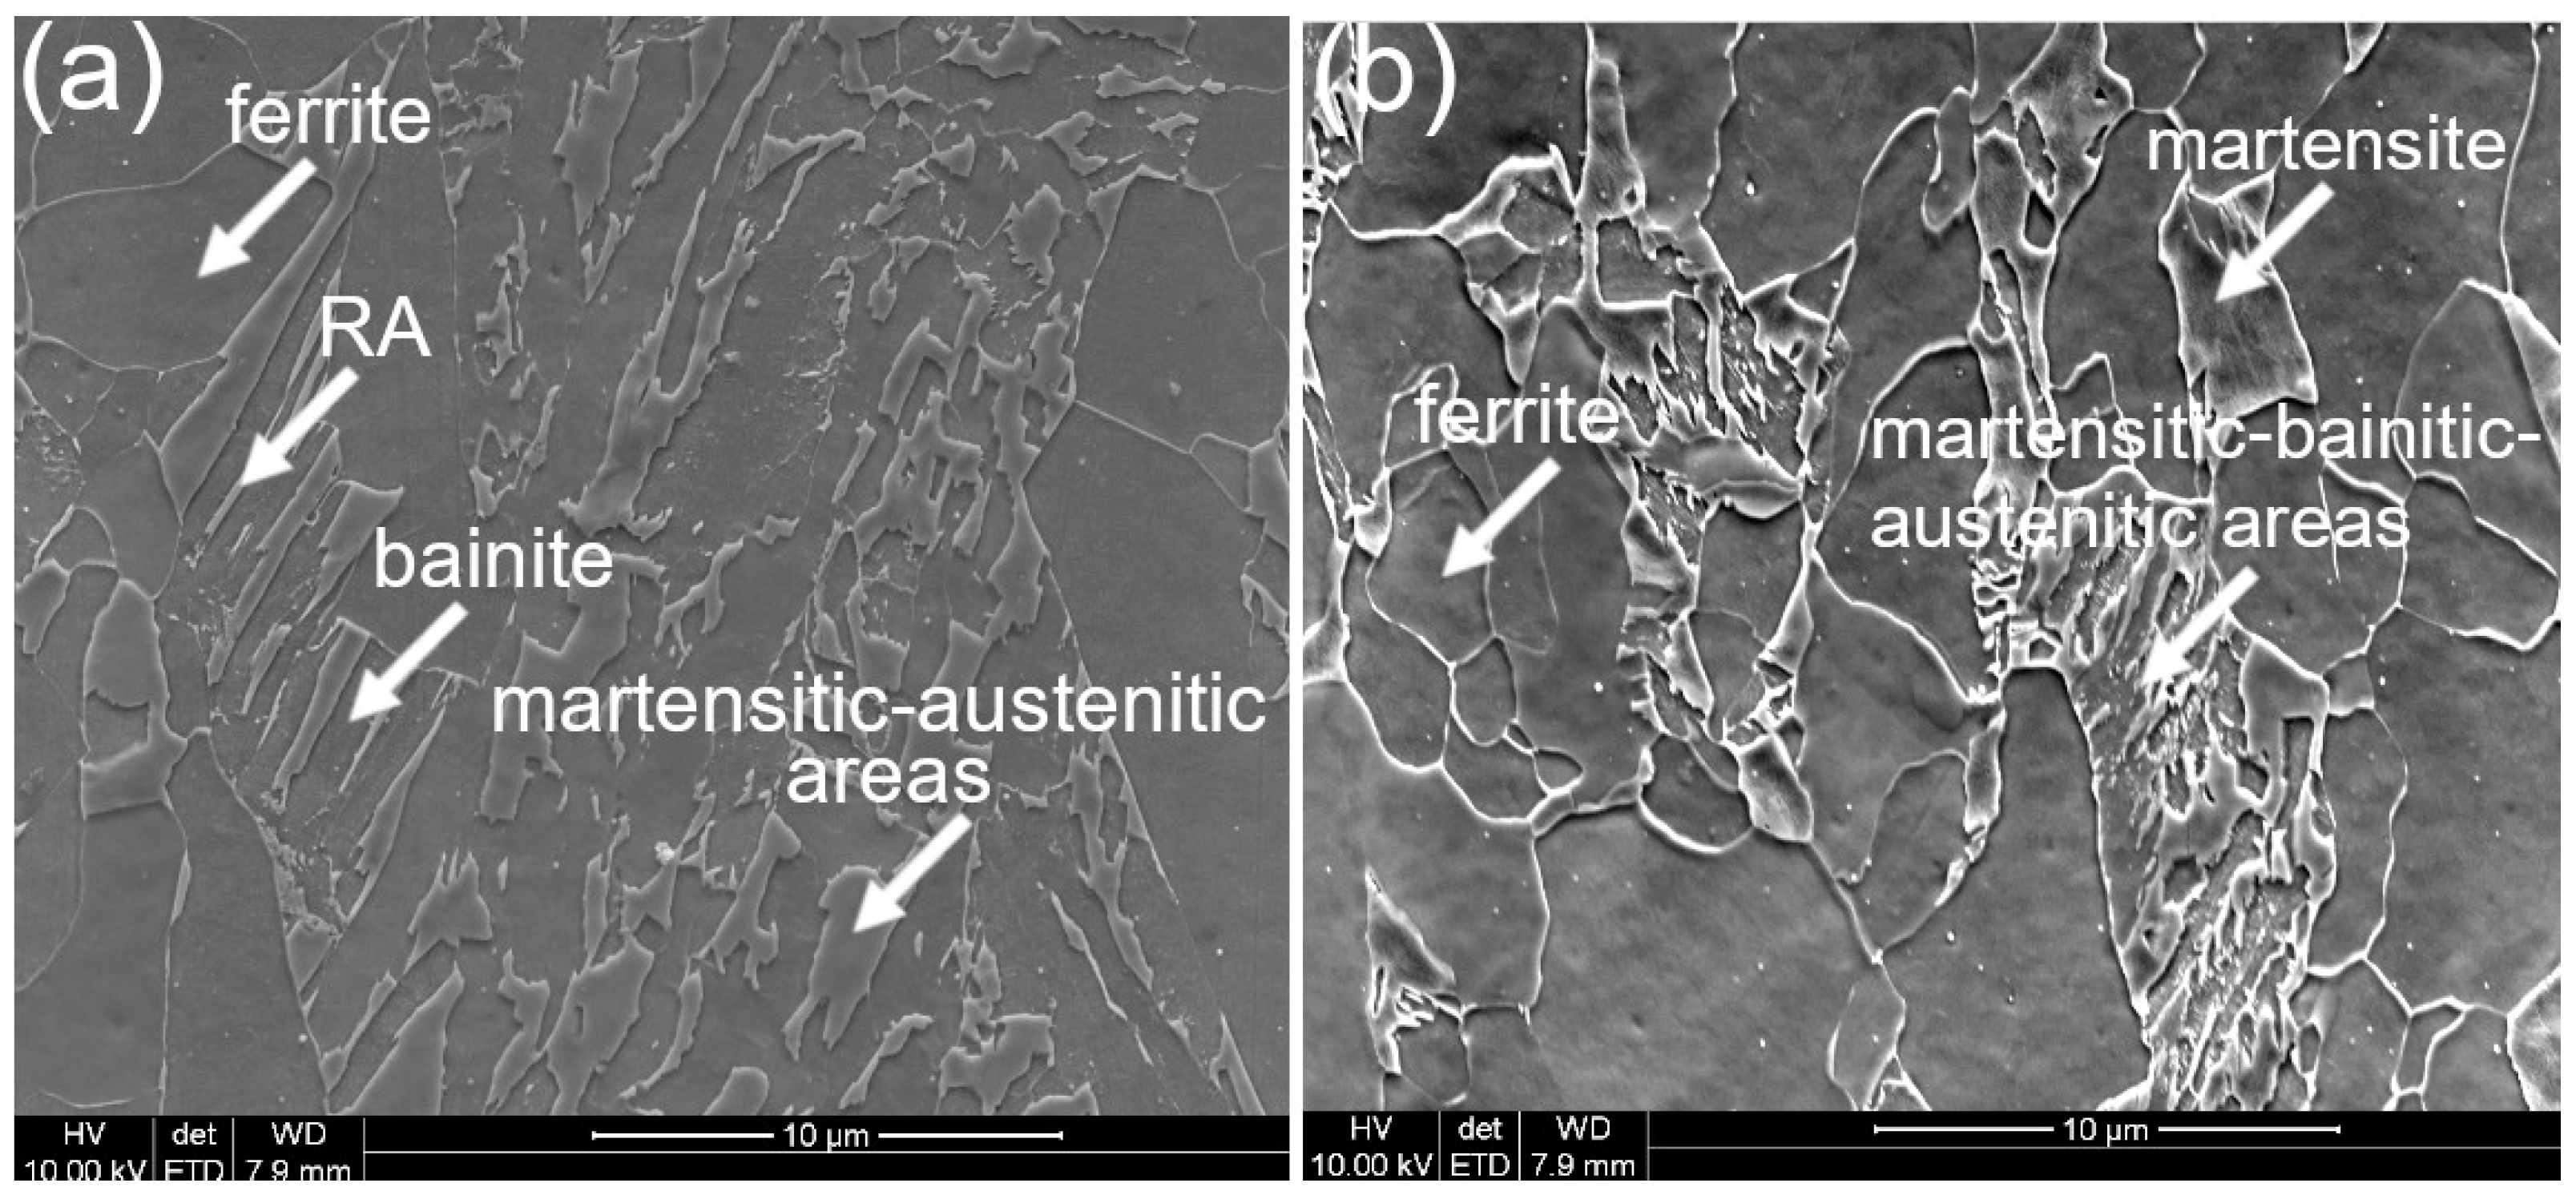
The microstructure of steel containing 1.5 wt.% of Mn after thermomechanical processing (initial state) and 10% cold-deformed in the tensile test is presented in Figure 2a and Figure 2b, respectively. The microstructure of steel in the initial state is composed of ferritic grains, bainite and RA in a form of thin layers which are additionally located at the outer areas of martensite blocks. Lath-type RA is located mainly in martensitic-bainitic areas. Some fraction of martensite is also observed in the microstructure. This phase formed during the final cooling to room temperature as a result of the martensitic transformation of thermally unstable blocky austenite. RA can be distinguished from ferrite and bainite based on its morphology and location in the multiphase microstructure. Ferrite is present in the microstructure as nearly granular grains, while bainite and RA exhibit rather lath-type morphology. Bainitic laths are darker than RA and they are located “lower” than RA due to their faster etching rate caused by the nital solution. RA laths are usually bright and have a sharp acicular shape. The SEM micrographs are often supported by the EBSD analysis. The microstructure of low-Mn steel after the cold deformation consists of ferritic grains slightly elongated according to the tensile direction, martensitic areas formed as a result of SIMT of blocky-type RA and large areas composed of martensite, bainite and RA in a form of very thin laths. Martensite shows a distinct substructure, which is caused by the higher etching rate of this phase in the nital solution.
The microstructure of steel containing 4 wt.% of Mn is presented in Figure 3. The matrix of steel consists of tempered martensite, which is darker and located “lower” than other microstructural constituents formed during the initial quenching at 280 °C, some fraction of RA (bright laths located above the tempered martensite) and a small fraction of martensite exhibiting some substructure formed as a result of the martensitic transformation of low-stable blocky RA during second (final) cooling or bainite formed during the partitioning step.

3.2. Kikuchi Diffraction Bands

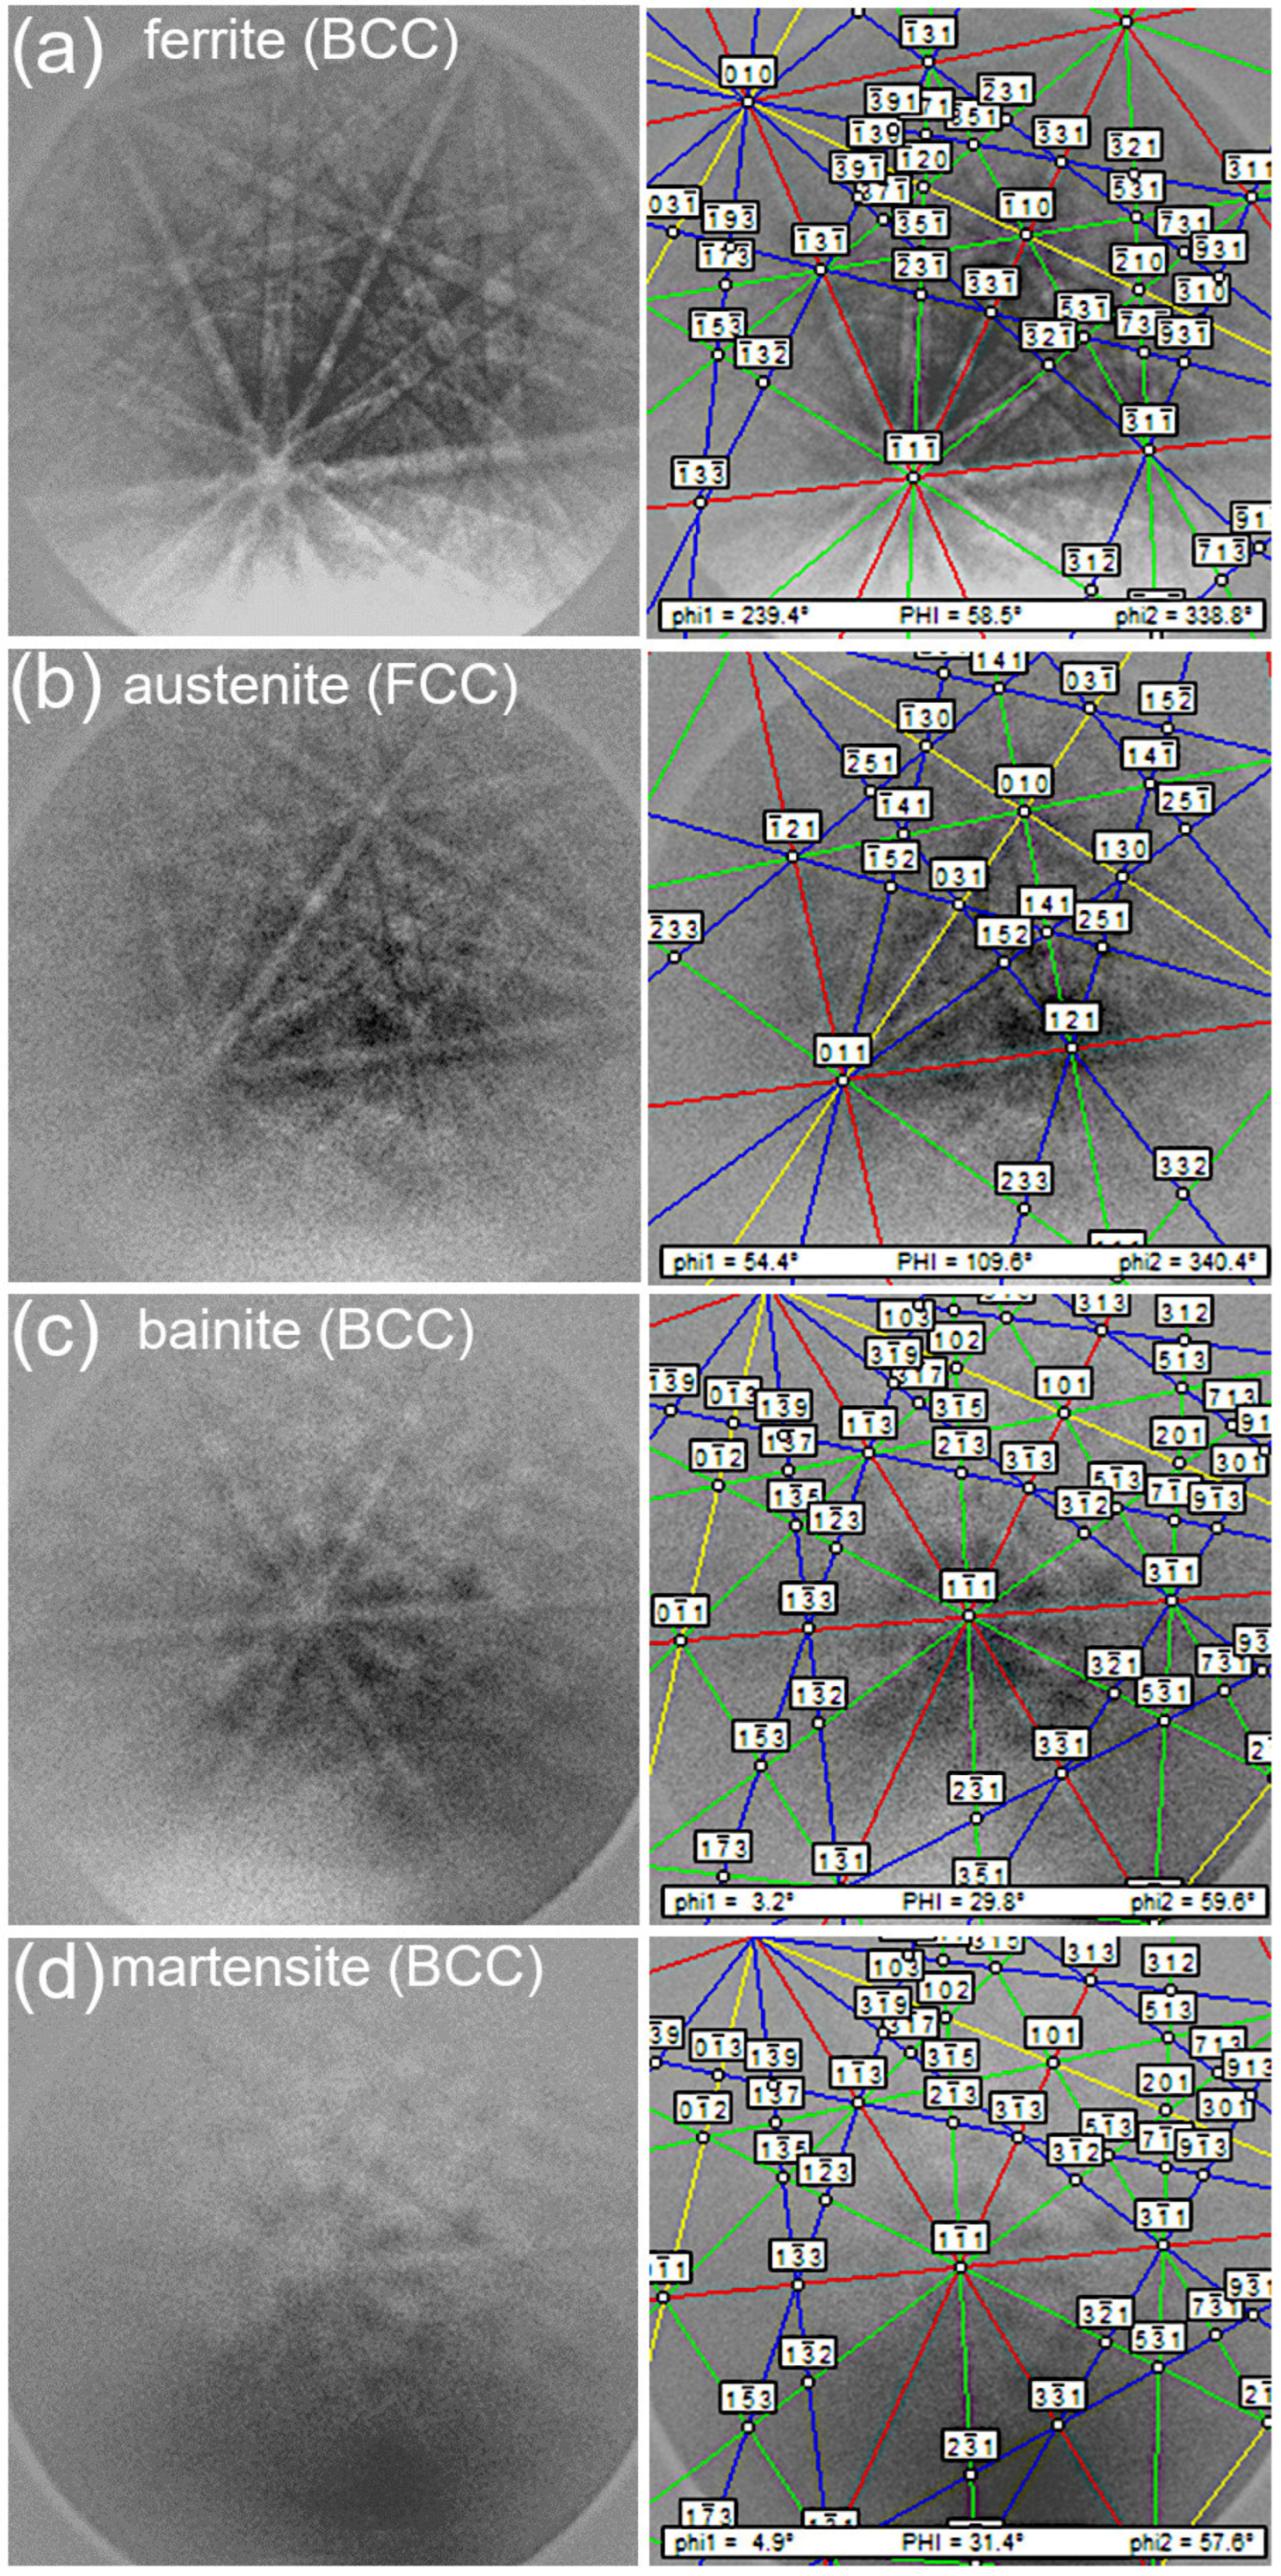
The Kikuchi diffraction bands are directly related to the diffracting planes of crystal lattice. An EBSD pattern corresponds to where the diffracting planes cross with the phosphorus screen and then they are detected by a high-resolution camera. The width of the Kikuchi band is approximately proportional to the Bragg angle of electron diffraction on the related lattice plane. The quality of the bands refers to the electron diffraction intensity observed across the related crystal lattice plane. Based on the geometry of the Kikuchi bands, the phase and its crystallographic orientation can be determined. The indexing process is carried out automatically by comparing the obtained characteristics of Kikuchi bands with crystallographic information available in databases [34,35].
The differences in the intensity of Kikuchi bands for particular microstructural constituents are related to various dislocation density and crystal defects. The identification of phases based on the Kikuchi band patterns is possible using the CI parameter. This parameter is used for quantitative assessment of the accuracy of an indexing procedure. It allows to be distinguished the data indexed correctly and data whose accuracy may be worse due to the lower quality of diffraction patterns [36]. The CI parameter can be defined as follows [25,37]:
CI = (V1 − V2)/Vi
where V1 and V2 are numbers of possible solution no. 1 and no. 2, and Vi is a number of possible selections for particular diffraction. The CI parameter ranges from 0 to 1 and the higher CI value means the higher accuracy of indexing process. When the CI is above 0.1, it means that 95% of diffraction patterns were indexed properly. If the CI value is higher than 0.3, it means that about 99% of diffraction patterns were indexed correctly [25]. The CI parameter is associeted with an error related to the fact that the crystallographic orientation is determined based on the largest number of votes received by each particular solution [35]. Figure 4a–d shows the Kikuchi diffraction bands obtained for a low-Mn multiphase steel. The highest CI value was obtained for ferrite, because it contained the lowest density of dislocations and crystal defects. The lowest CI parameter was obtained for martensite due to its high density of lattice imperfections.

3.3. EBSD Analysis of the Multiphase Steel Belonging to the 1st Generation of AHSS

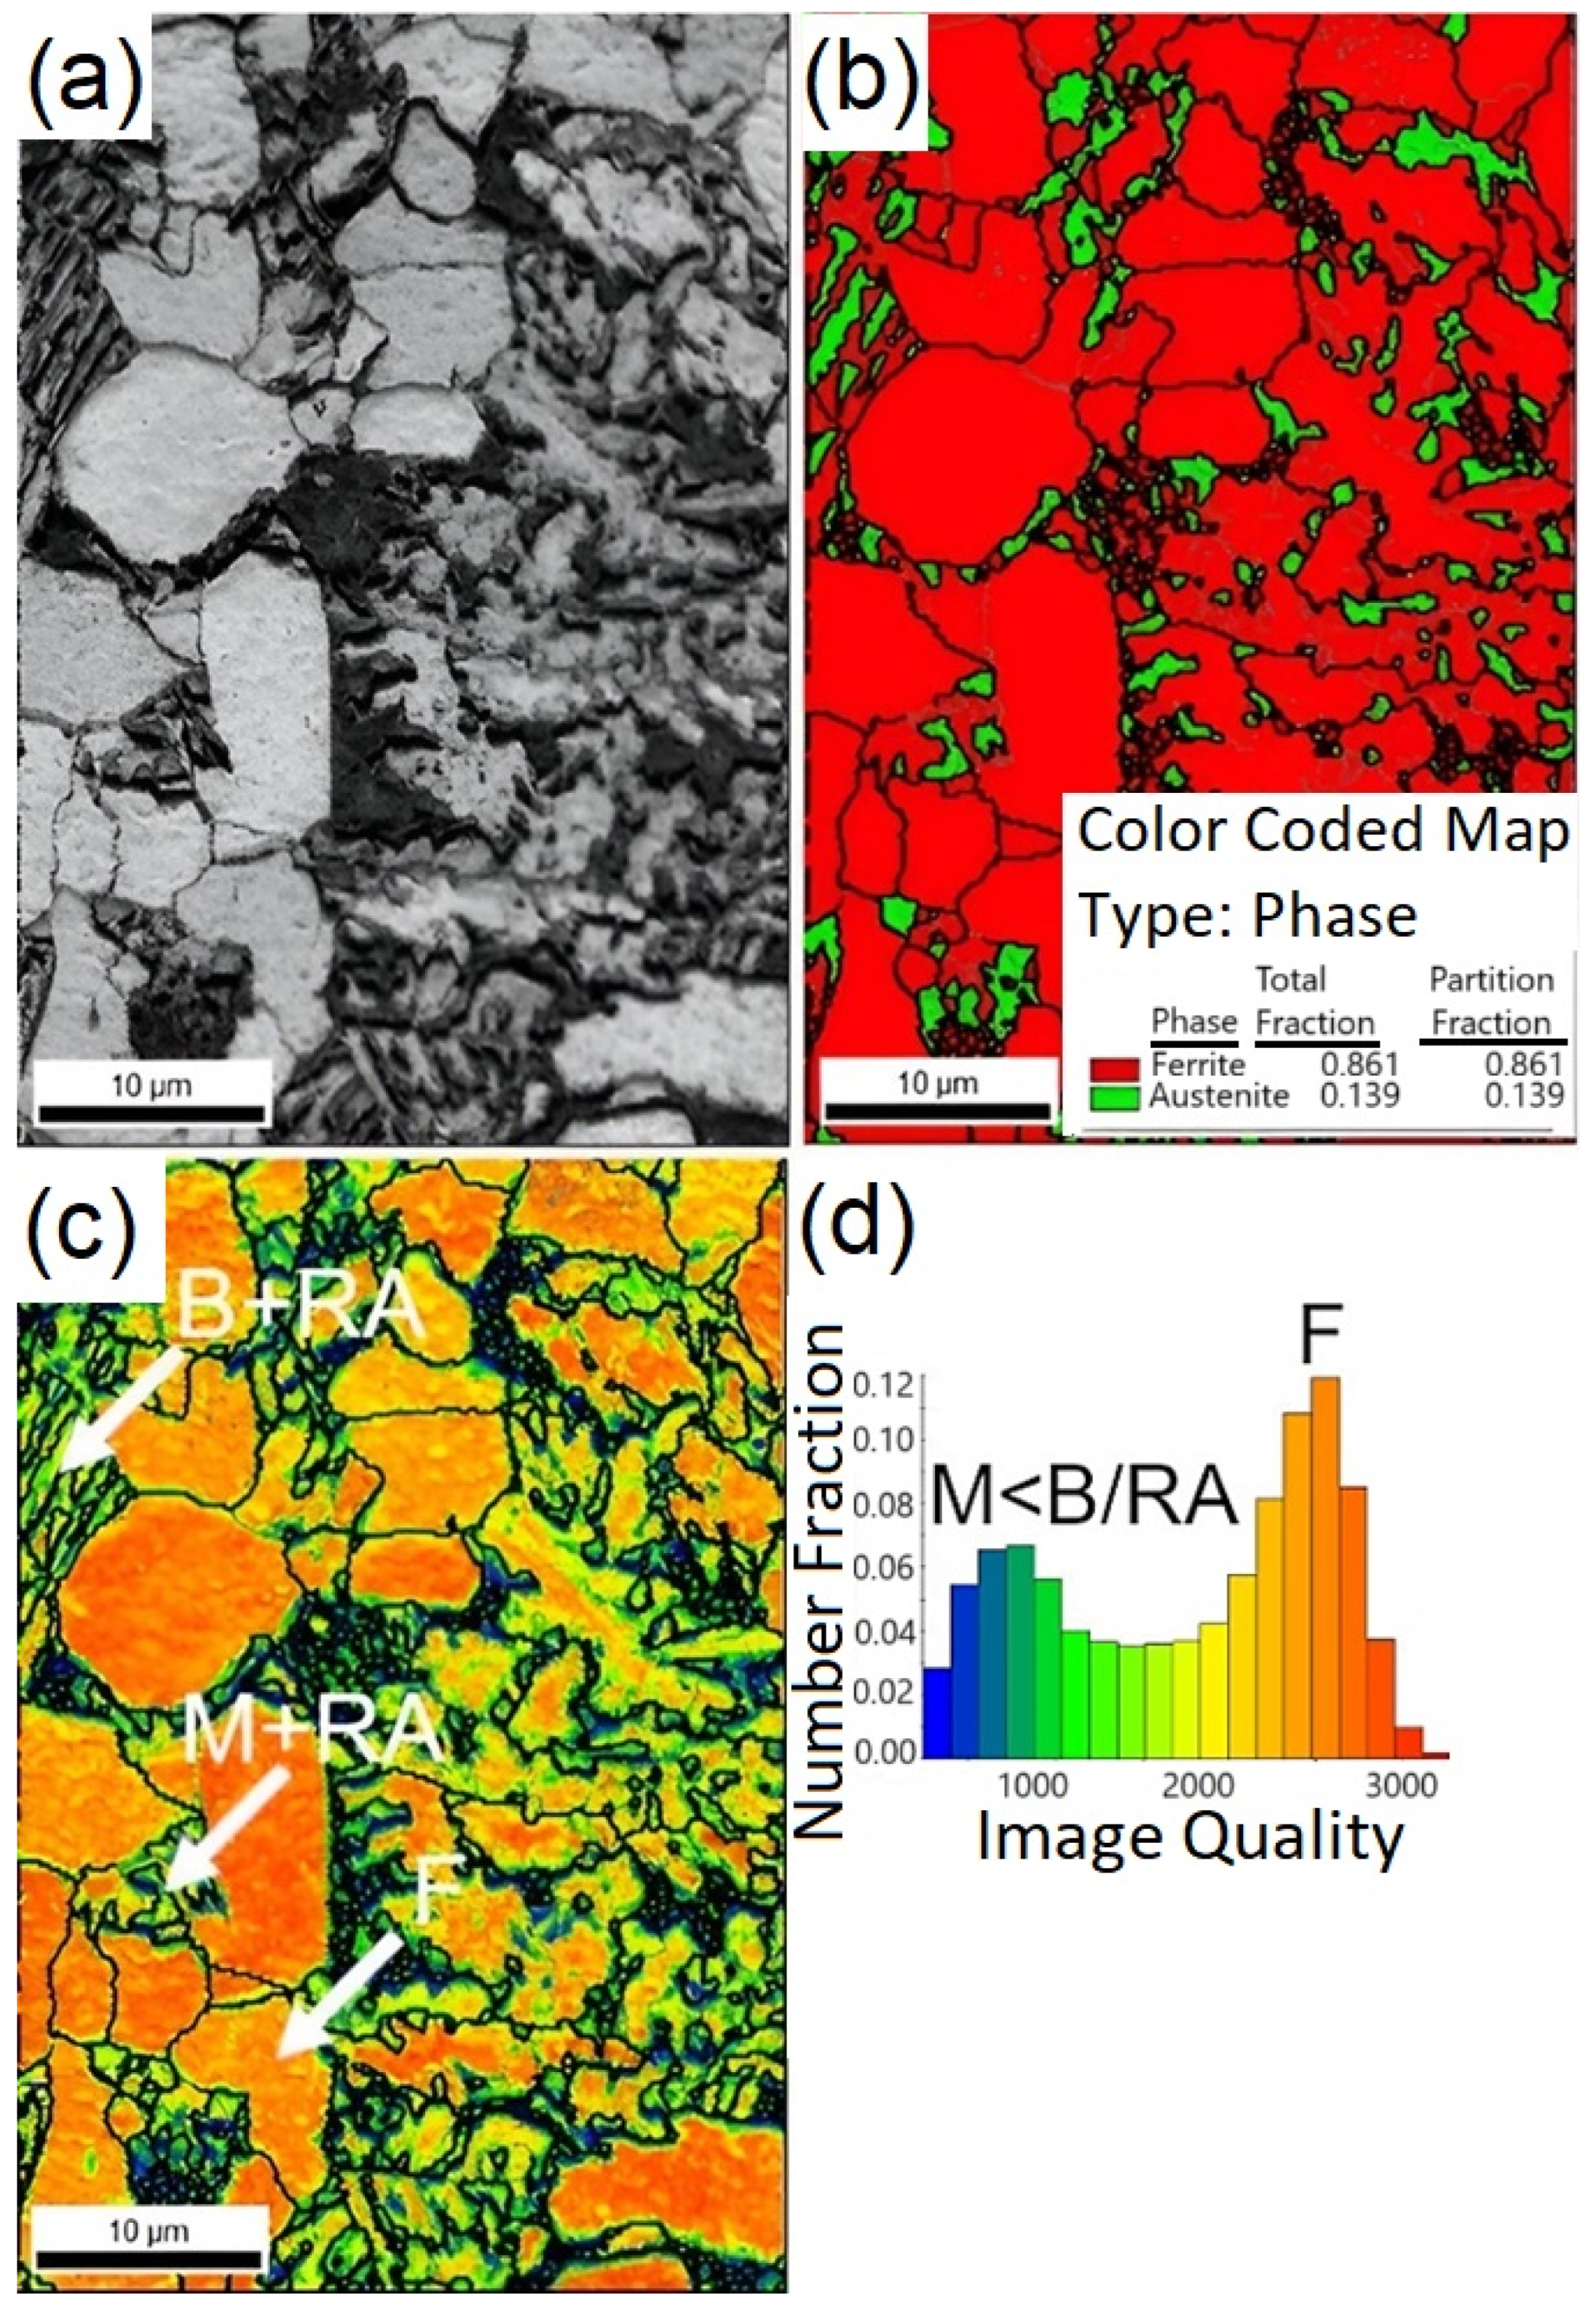
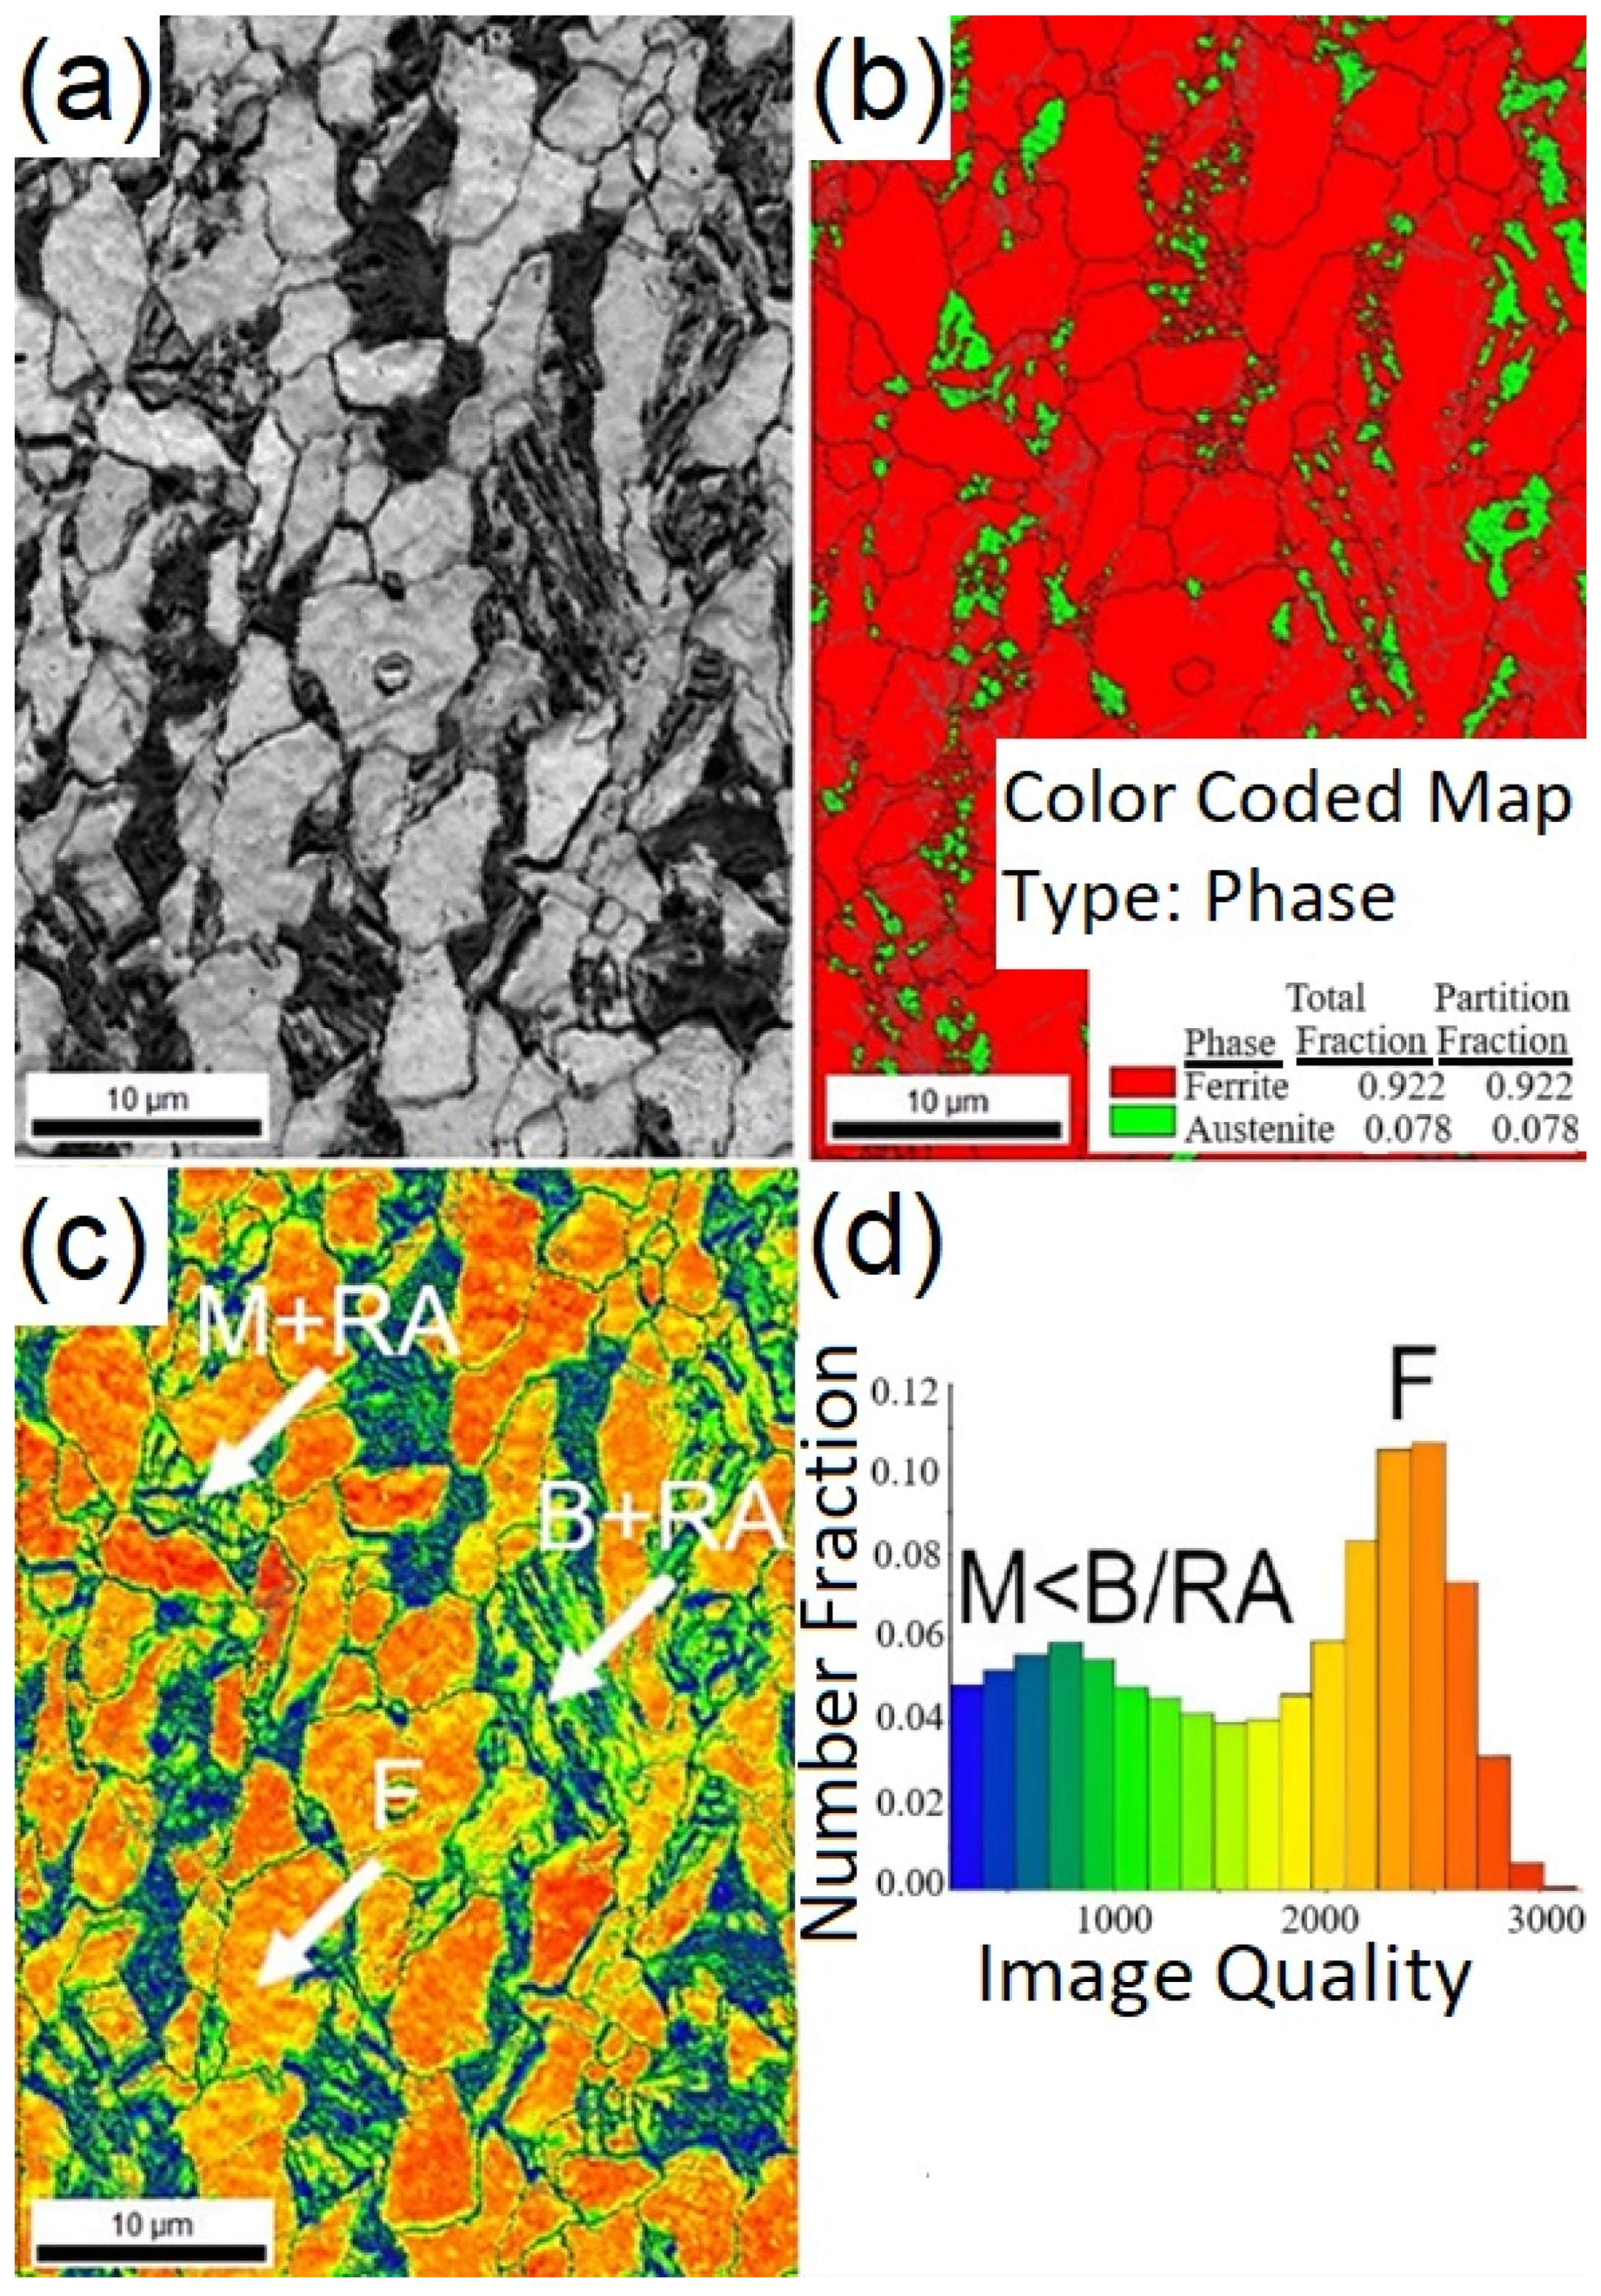
The microstructure of thermomechanically-processed steel containing 1.5 wt.% of Mn composed of ferrite, bainite, austenite and some martensitic-austenitic (MA) islands is presented in Figure 2a. The microstructural constituents observed in the IQ map (Figure 5a) show different shades of grey due to the different accuracy of Kikuchi’s bands [22,25]. The IQ parameter depends on the density of crystal defects such as dislocations or grain boundaries. Ferrite is observed in the brightest areas with the highest IQ values due to its low density of dislocations. Bainite and RA can be seen in the areas with an intermediate shade of gray. Martensite is observed in the darkest areas due to its high density of dislocations and internal stresses associated with the martensitic transformation. Figure 5b shows the phase distribution map, where the constituents with a BCC crystal lattice such as ferrite, bainite and martensite are marked in red, while the RA with an FCC crystal lattice is marked in green. The area fraction of RA has been estimated as ~13.9%. Figure 5c,d shows the distribution of IQ parameter on the surface areas of the specimen. Radwański [25] reported that, if the distribution of IQ parameter on a histogram does not reflect a Gaussian curve, it indicates that more than one microstructural constituent is present in the microstructure. The histogram in Figure 5d shows that the microstructural constituent with the highest IQ parameter (ferrite) is dominant in the microstructure, while the fractions of bainite, RA and martensite are similar.
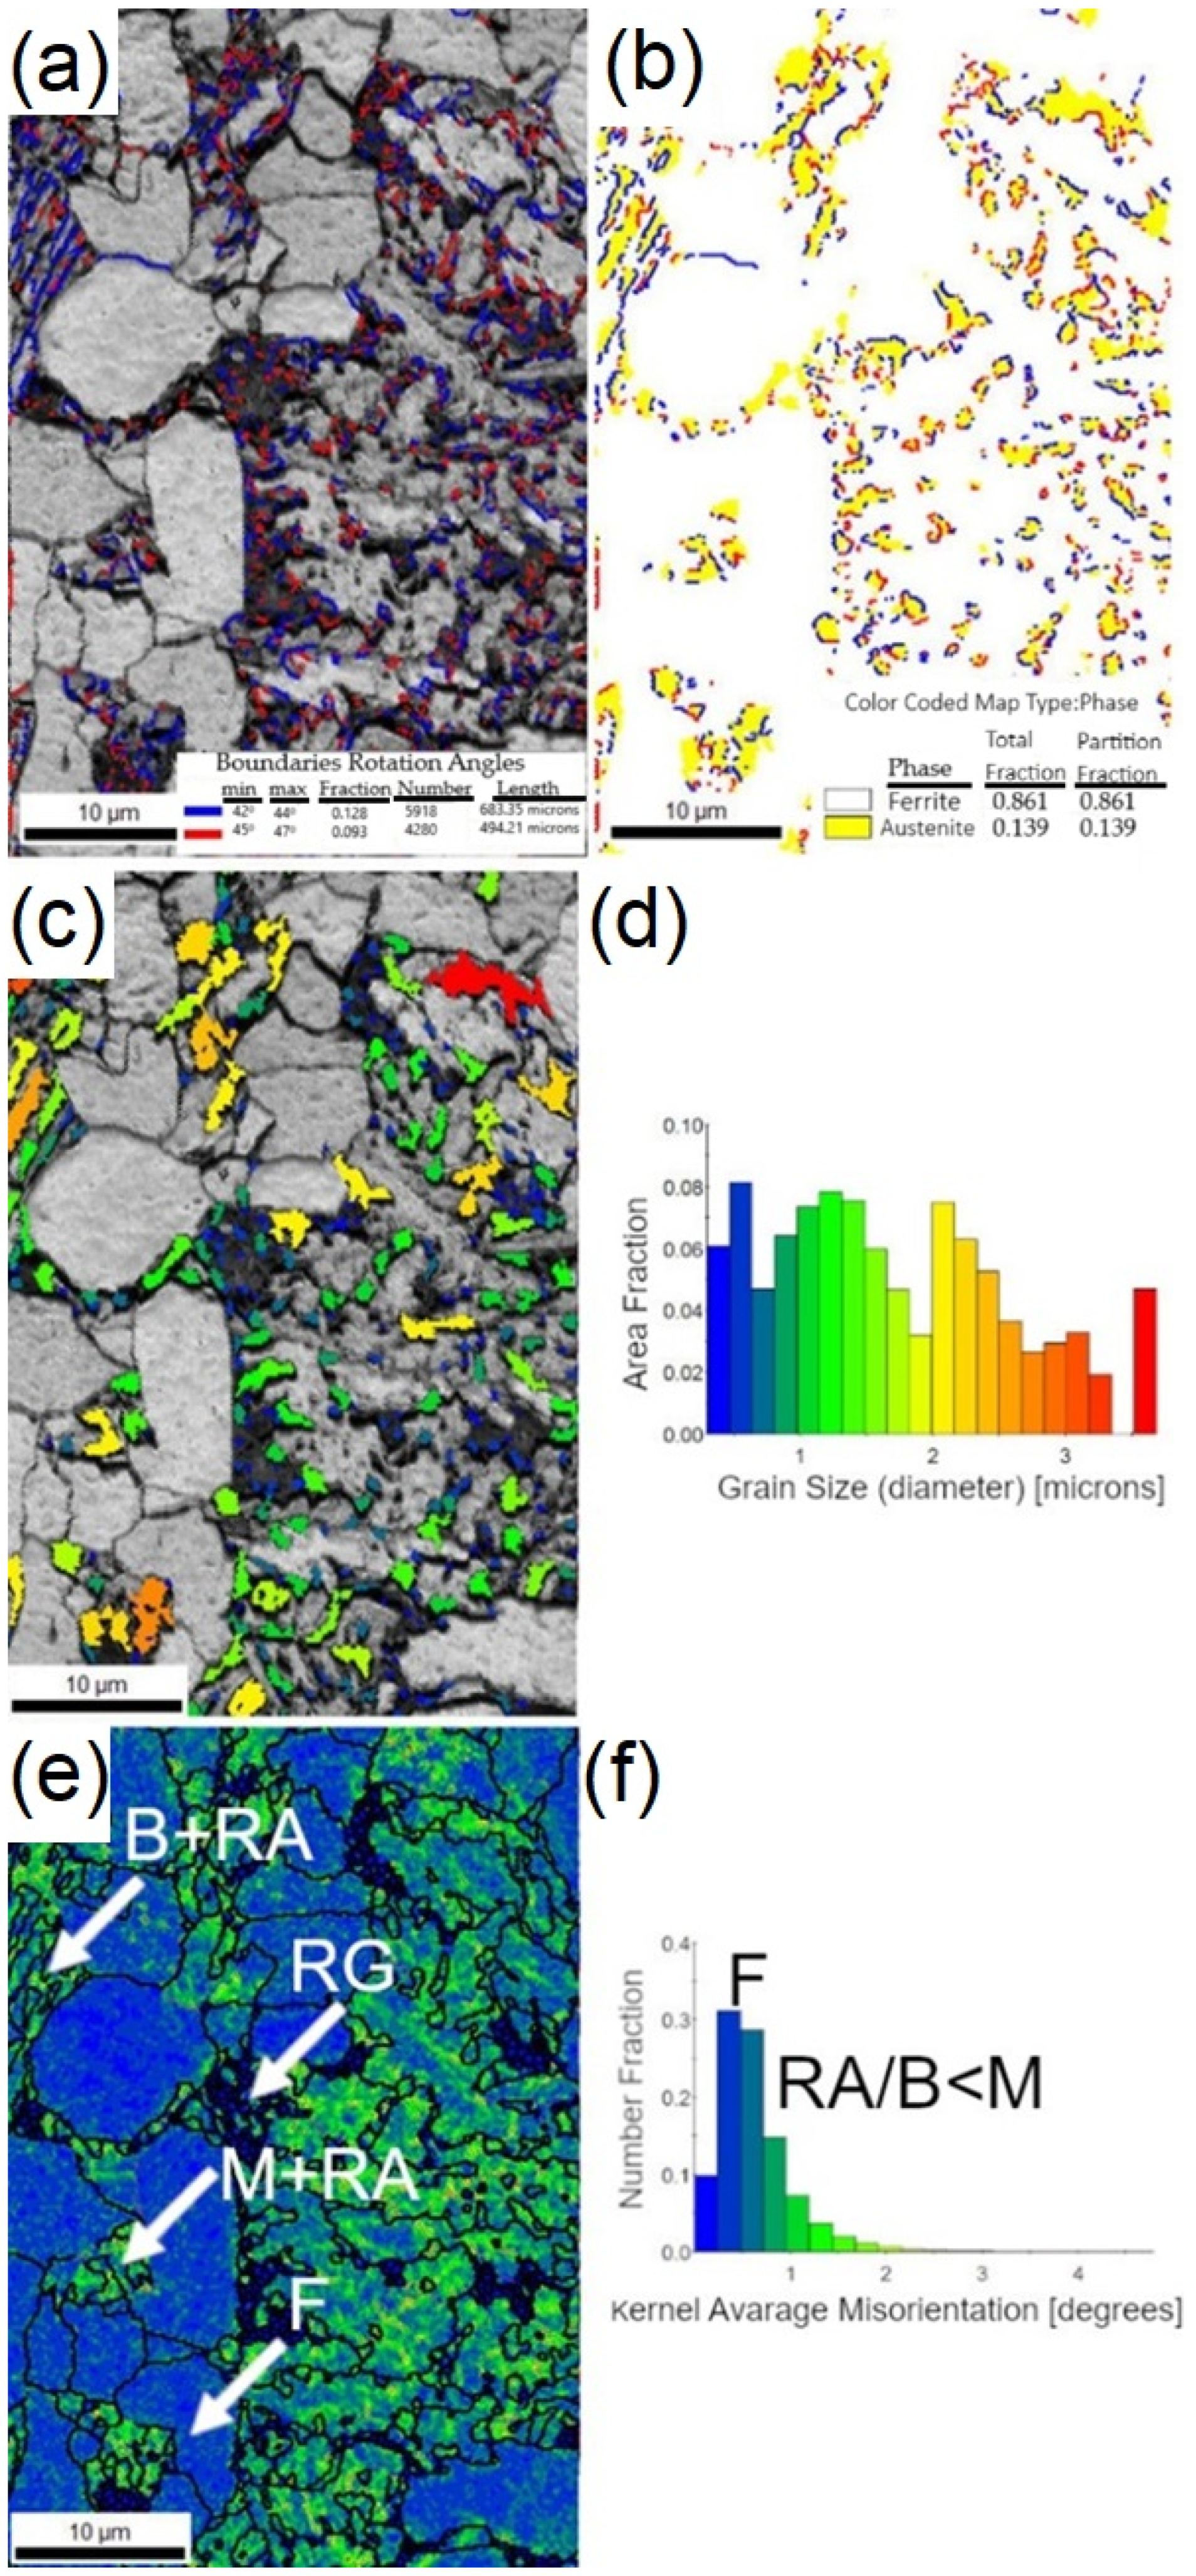
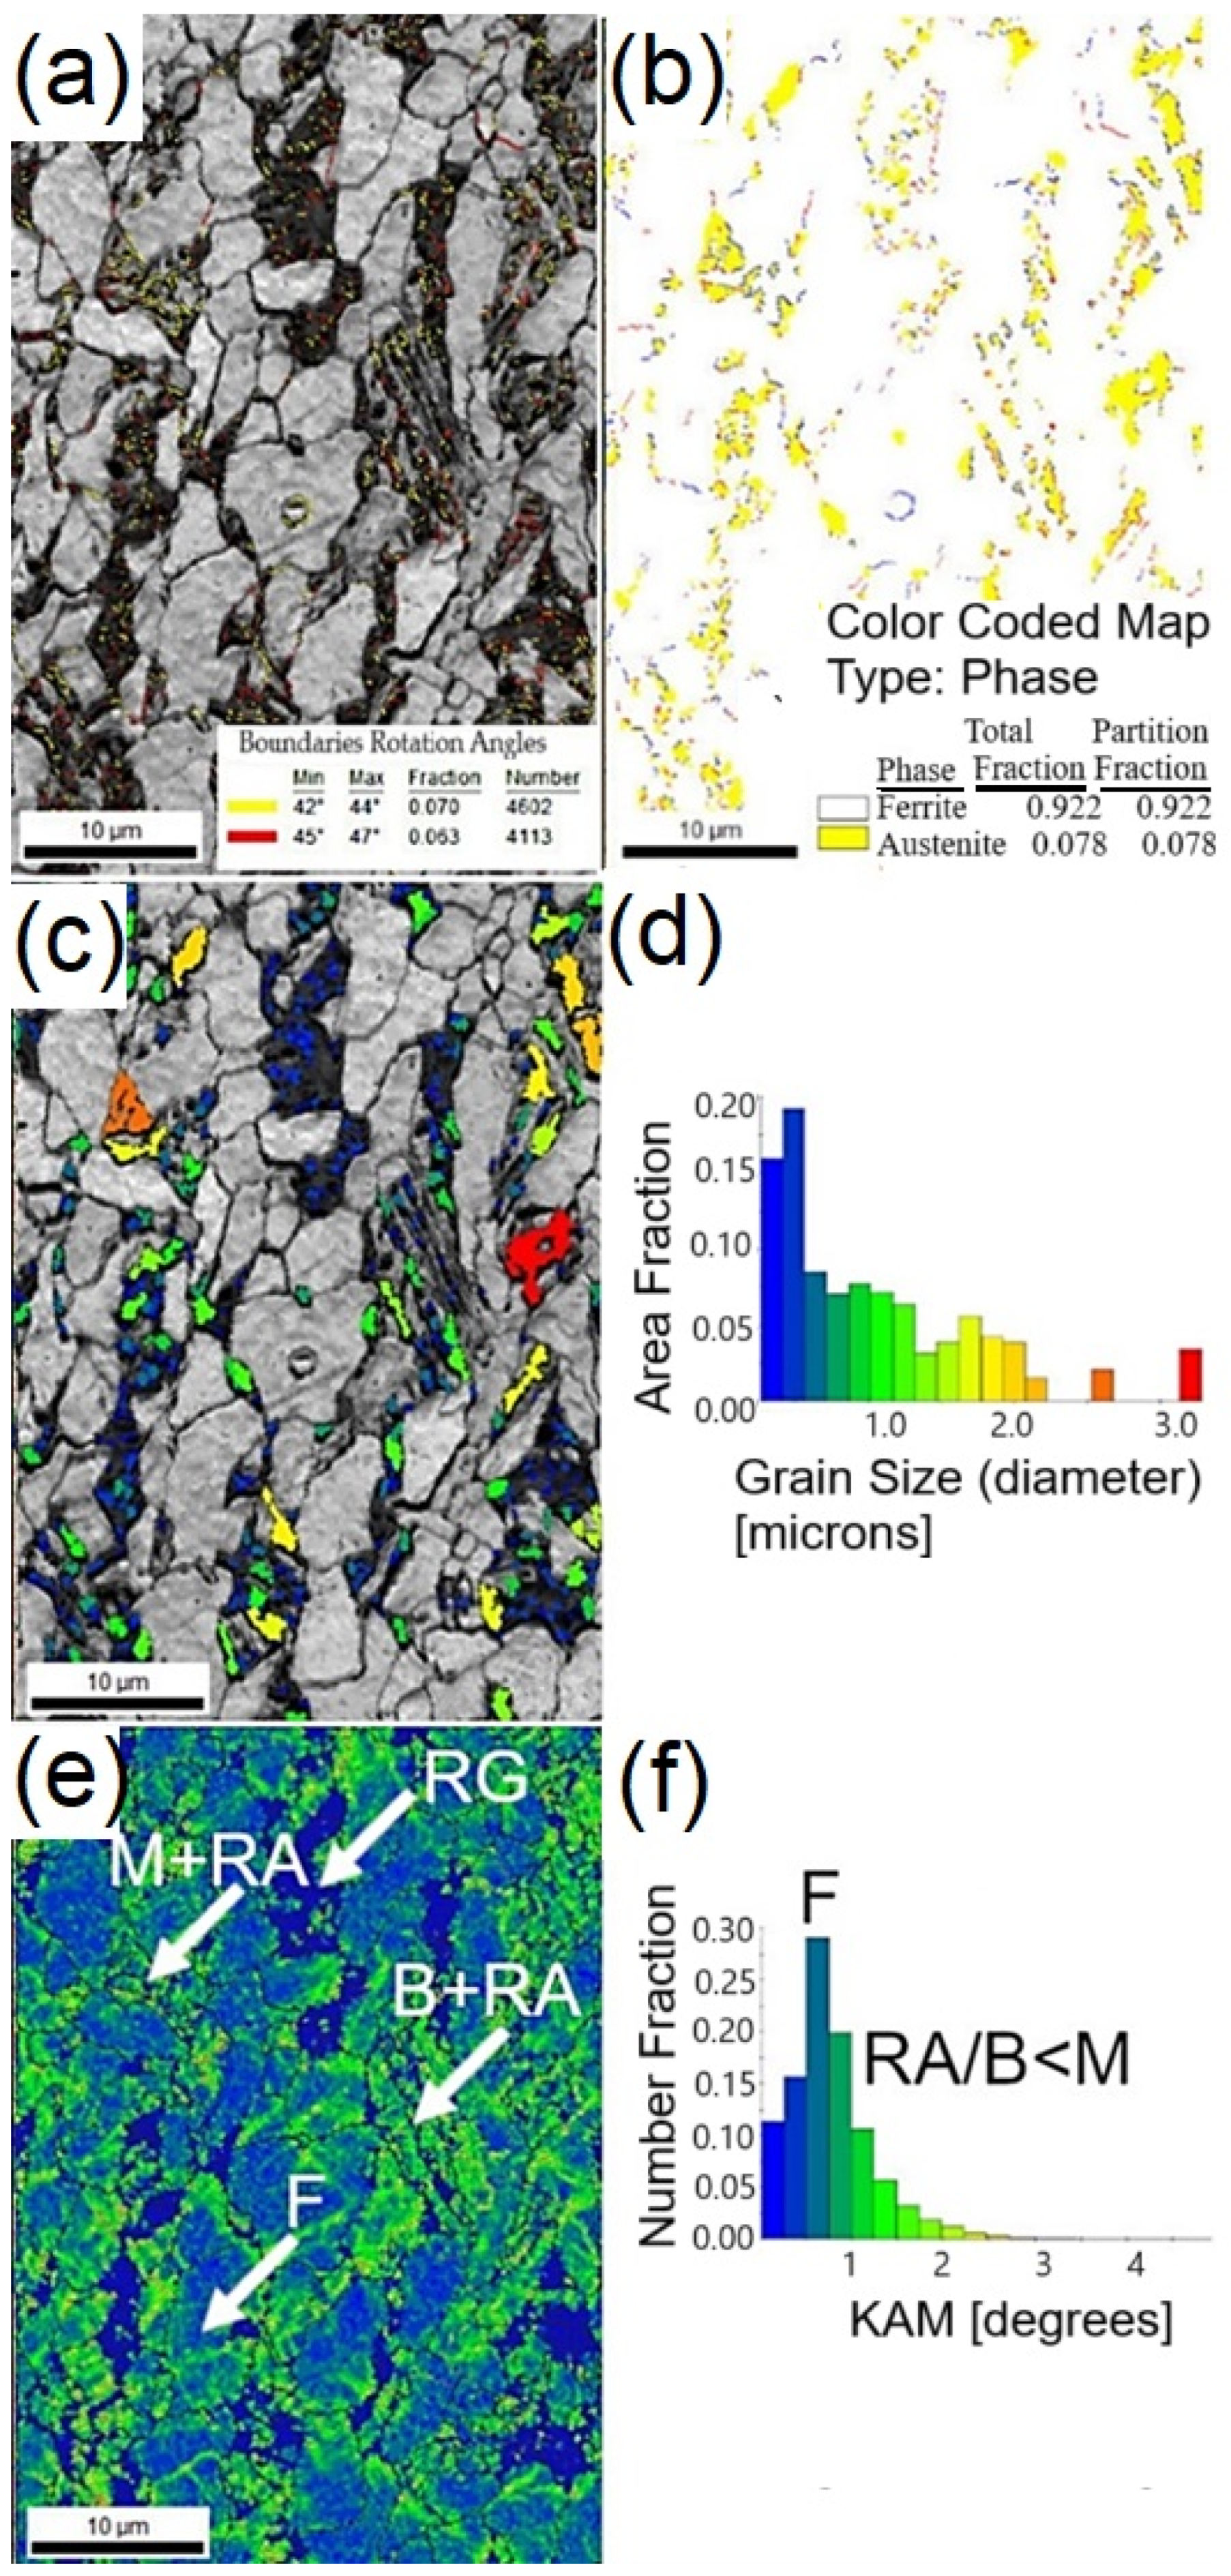
The presence of misorientation angles close to 45° on the EBSD map presented in Figure 6a indicates the occurrence of the K-S and N-W crystallographic orientation relationships between bainite or martensite and RA. The fraction of grain boundaries exhibiting the K-S and N-W relationships is about 12.8% and 9.3%, respectively. The presence of these crystallographic relationships indirectly confirms the presence of RA in the microstructure (Figure 6b). The average diameter of RA grains shows a bimodal distribution (Figure 6c,d). RA in a form of small grains up to about 2.5 µm is located in the bainitic-martensitic areas, while the larger RA grains are located at ferrite grain boundaries. Figure 6e shows the local strain distribution within the microstructure using color-coded KAM map. KAM parameters refer to the average misorientation of the individual pixel versus the neighbouring pixels [25,29,37]. KAM was calculated up to an upper limit of 5°. The blue regions in Figure 6e represent misorientations lower than 1°, while the green areas represent pixels disoriented with respect to the kernel higher than 1°. The KAM parameter allows for the identification of areas with different lattice distortions. Martensite is located in areas with higher KAM values, marked in green due to the highest dislocation density (Figure 6e,f). Intermediate KAM values are noted for bainite and RA, while the lowest KAM values have been identified for ferrite. The presence of small grains with low KAM values (below 0.5) has been identified inside bainitic-austenitic-martensitic areas (Figure 6e,f). The morphology, size, low strain and KAM values observed in these areas suggest that they could be partially recrystallized grains formed during final hot rolling at 850 °C. The occurrence of KAM values below 0.5 is associated with the formation of subgrains or recrystallized grains [28]. The characteristics of parameters obtained using the EBSD method for individual microstructural constituents are summarized in Table 3.
The EBSD technique is also valuable for analyzing changes in the microstructure caused by plastic deformation. An increased number of lattice defects has been identified in the IQ map of the specimen deformed in the static tensile test up to 10% (Figure 7a). The darkest region in the IQ map corresponds to the martensite formed as a result of SIMT of RA during tensile deformation. The martensite formed during plastic deformation from blocky grains of RA divides the remaining RA into smaller grains. RA in a form of thin laths and very small grains remains stable due to its increased stability [38]. The area fraction of RA in the deformed microstructure is 7.8% lower (Figure 7b) compared to the area fraction of RA in the sample before the tensile test (Figure 5b). It is related to the SIMT of the larger grains of RA during cold straining. The fraction of areas with lower IQ parameter is significantly higher in cold-strained sample (Figure 7c,d), compared to the sample in the initial state (Figure 5c,d).
The fraction of grains showing K-S and N-W crystallographic relationships is significantly lower in the cold-deformed sample (Figure 8a) compared to the sample prior to the tensile test (Figure 6a). This is attributed to the reduced fraction of RA being present in the deformed sample (Figure 7b). The fractions of grain boundaries showing the K-S and N-W crystallographic relationships in the deformed sample are about 7.0% and 6.3%, respectively. The average diameter of RA grains (Figure 8c,d) shows a different distribution compared to the sample before the tensile test (Figure 6c,d). The differences in the distribution of average RA grain diameter in the initial low-Mn samples and the ones subjected to 10% strain are related to the kinetics of SIMT during cold deformation. The SIMT occurs first in large blocky RA grains of lower mechanical stability than in smaller RA grains. Consequently, the smaller grains of RA remain stable at higher deformation levels. Moreover, the fraction of small RA grains increases with the deformation level due to the fragmentation of larger RA grains by newly formed strain-induced martensite, which divides the grains. RA grains smaller than 1 µm dominate the microstructure after cold deformation. The RA located in the bainitic-martensitic areas remains stable, while RA grains located at ferrite grain boundaries transform into martensite. The internal pressure caused by hard bainite and martensite inhibits the occurrence of martensitic transformation [3]. The effect of plastic deformation and the occurrence of SIMT during the tensile test can be also identified in the KAM maps (Figure 8e,f). The fraction of areas marked in green with misorientation above 1° is higher in the non-deformed sample compared to the non-deformed sample (Figure 6e,f). It is related to the increased density of lattice defects introduced by plastic deformation and an increase in the martensite fraction with high dislocation density. The increased strain is observed mostly in bainitic-martensitic areas although some strain is also accommodated by ferrite.

3.4. EBSD Analysis of the Multiphase Steel Belonging to the 3rd Generation of AHSS

The microstructure of thermomechanically-processed medium-Mn steel, composed of tempered martensite, RA and some fraction of bainite formed during a partitioning step is shown in Figure 3. A detailed linear analysis of the IQ parameter (Figure 9b) in the areas presented in Figure 9a indicates that the areas with the lowest IQ parameter can be represented by bainite formed during the partitioning step or martensite formed due to martensitic transformation of less stable RA during final cooling. The further analysis of the misorientation angles performed in the same areas shows that the misorientation angles close to 55° are dominant (Figure 9c). It was reported in the literature [39] that the presence of misorientation angles in a range of 50–55° corresponds to upper bainite, while the misorientation angles in a range of 55–60 °C are characteristic for martensite (Table 3). The RA and tempered martensite which exhibit low dislocation density were observed in the areas with higher IQ values compared to those of bainite (Figure 9b). The presence of misorientation angles close to 45° is typical for RA [22,25], while the lowest misorientation angles were observed for the tempered martensite.

4. Conclusions

A detailed study of the microstructural identification in multiphase TRIP-aided steels belonging to the 1st and 3rd generations of AHSS after thermomechanically processing and cold straining was performed using the EBSD method to characterize features of individual microstructural constituents through the analysis of CI index, IQ and KAM values, which are needed to distinguish microstructural constituents such as ferrite, bainite and martensite, which have the same BBC lattice. Successful linking between morphological details and the measurable EBSD response of different structural constituents in such complex microstructures is a major significance of the study. According to the results, the following conclusions can be drawn:
  • Ferrite in a low-Mn steel and tempered martensite in a medium-Mn steel have the highest IQ, CI and KAM values due to their lowest dislocation density. The areas containing martensite formed as a result of SIMT or the transformation of unstable austenite upon cooling show the opposite tendency due to its high dislocation density and significant lattice distortion. Bainite and RA have intermediate CI, IQ and KAM values and particular values are dependent on their morphology, size and dislocation density;
  • RA with the FCC crystallographic lattice is distinguished within the microstructure using phase distribution maps. The location of RA is easier to identify by analyzing K-S and N-W orientation relationships with misorientation angles close to 45°;
  • Changes in the microstructure caused by the plastic deformation applied during tensile straining are reflected in an increase in dislocation density and corresponding increased fractions of martensite formed due to the SIMT. Some areas of low CI index and IQ parameter values, as well as an increased fraction of regions showing high KAM values are observed after tensile straining.

Author Contributions

Conceptualization, A.G., K.R. and A.K.; methodology, A.K. and K.R.; software, K.R.; validation, K.R. and A.G.; formal analysis, A.G.; investigation, K.R. and A.K.; resources, A.K.; data curation, K.R. and A.K.; writing—original draft preparation, A.K.; writing—review and editing, A.G.; visualization, A.K.; supervision, A.G.; project administration, A.K.; funding acquisition, A.K. All authors have read and agreed to the published version of the manuscript.

Funding

This research was funded by Faculty of Mechanical Engineering, Silesian University of Technology, Gliwice, Poland (10/010/BKM24/1213 project).

Data Availability Statement

The original contribution of this research is included in the paper. For further inquiries, please contact the corresponding author.

Acknowledgments

A. Kozłowska acknowledges the financial support through the 10/010/BKM24/1213 project, Faculty of Mechanical Engineering, Silesian University of Technology, Gliwice, Poland.

Conflicts of Interest

The authors declare no conflicts of interest.

References

  1. Czerwinski, F. Current Trends in Automotive Lightweighting Strategies and Materials. Materials 2021, 14, 6631. [Google Scholar] [CrossRef] [PubMed]
  2. Raabe, D.; Sun, B.; Kwiatkowski Da Silva, A.; Gault, B.; Yen, H.W.; Sedighiani, K.; Sukumar, P.H.; Souza Filho, I.R.; Katnagallu, S.; Jagle, E.; et al. Current Challenges and Opportunities in Microstructure-related Properties of Advanced High-strength Steels. Metall. Mater. Trans. A 2020, 51, 5517–5586. [Google Scholar] [CrossRef]
  3. Kučerová, L.; Opatová, K.; Káňa, J.; Jirková, H. High versatility of niobium alloyed AHSS. Arch. Metall. Mater. 2017, 62, 1485–1491. [Google Scholar] [CrossRef]
  4. Vercruysse, F.; Celada-Casero, C.; Linke, B.M.; Verleysen, P.; Petrov, R.H. Temperature Dependence of the Static and Dynamic Behaviour in a Quenching and Partitioning Processed Low-Si Steel. Metals 2020, 10, 509. [Google Scholar] [CrossRef]
  5. Wiewiorowska, S.; Muskalski, Z.; Ciepiela, W. Intensification of the Transition of Retained Austenite to Martensite Effected by Changing the Stress State in Trip Steel Wires. Arch. Metall. Mater. 2015, 60, 2730–2731. [Google Scholar] [CrossRef]
  6. Kowalska, J.; Ryś, J.; Cios, G.; Bednarczyk, W. The effect of reduced temperatures on microstructure development in tensile tested high-manganese steel. Mater. Sci. Eng. A 2019, 767, 138406. [Google Scholar] [CrossRef]
  7. Jabłonska, M.B.; Jasiak, K.; Kowalczyk, K.; Bednarczyk, I.; Skwarski, S.; Tkocz, M.; Gronostajski, Z. Deformation Behaviour of High-Manganese Steel with Addition of Niobium Under Quasi-static Tensile Loading. Mater. Sci. Pol. 2022, 40, 1–11. [Google Scholar] [CrossRef]
  8. Śmiglewicz, A.; Jabłońska, M.; Moćko, W.; Kowalczyk, K.; Hadasik, E. Properties and structure of X30MnAlSi26-4-3 high strength steel subjected to dynamic compression processes. Arch. Metall. Mater. 2017, 62, 2255–2260. [Google Scholar] [CrossRef]
  9. Kaar, S.; Krizan, D.; Schneider, R.; Sommitsch, C. Impact of Si and Al on Microstructural Evolution and Mechanical Properties of Lean Medium Manganese Quenching and Partitioning Steels. Steel Res. Int. 2020, 91, 2000181. [Google Scholar] [CrossRef]
  10. Leták, R.; Jirková, H.; Kucerová, L.; Jenícek, S.; Volák, J. Effect of Forming and Heat Treatment Parameters on the Mechanical Properties of Medium Manganese Steel with 5% Mn. Materials 2023, 16, 4340. [Google Scholar] [CrossRef]
  11. Gramlich, A.; Middleton, A.; Schmidt, R.; Krupp, U. On the Influence of Vanadium on Air-Hardening Medium Manganese Steels for Sustainable Forging Products. Steel Res. Int. 2021, 92, 2000592. [Google Scholar] [CrossRef]
  12. Kučerová, L.; Jandova, A.; Rubešová, K. Microstructure Analysis and Mechanical Properties of Low Alloyed Steel with Retained Austenite Obtained by Heat Treatment. Manuf. Technol. 2019, 19, 243–247. [Google Scholar] [CrossRef]
  13. Hidalgo, J.; Celada-Casero, C.; Santofimia, M.J. Fracture Mechanisms and Microstructure in a Medium Mn Quenching and Partitioning Steel Exhibiting Macrosegregation. Mater. Sci. Eng. A 2019, 754, 766–777. [Google Scholar] [CrossRef]
  14. Hojo, T.; Koyama, M.; Kumai, B.; Shibayama, T.; Shiro, A.; Shobu, T.; Saitoh, H.; Ajito, S.; Akiyama, E. Comparative Study of Stress and Strain Partitioning Behaviors in Medium Manganese and Transformation-Induced Plasticity-Aided Bainitic Ferrite Steels. Scr. Mater. 2022, 210, 114463. [Google Scholar] [CrossRef]
  15. Filippone, R.; Root, J.; Jacques, P.; Yue, S. The Influence of Martensite on Line Broadening in Neutron Diffraction Spectra of a DP steel. ISIJ Int. 2002, 42, 304–309. [Google Scholar] [CrossRef]
  16. Baghdadchi, A.; Hosseini, V.A.; Karlsson, L. Identification and Quantification of Martensite in Ferritic-Austenitic Stainless Steels and Welds. J. Mater. Res. 2021, 15, 3610–3621. [Google Scholar] [CrossRef]
  17. Gnäupel-Herolda, T.; Creuziger, A. Diffraction Study of the Retained Austenite Content in TRIP Steels. Mater. Sci. Eng. A 2011, 528, 3594–3600. [Google Scholar] [CrossRef]
  18. Mythili, R.; Kirana, R.; Singh, L.H.; Govindaraj, R.; Sinha, A.K.; Singh, M.N.; Saroja, S.; Vijayalakshmi, M.; Deb, S.K. Identification of Retained Austenite in 9Cr-1.4W-0.06Ta-0.12C Reduced Activation Ferritic Martensitic Steel. Symmetry 2022, 14, 196. [Google Scholar] [CrossRef]
  19. Das, P.P.; Plana-Ruiz, S.; Galanis, A.S.; Stewart, A.; Karavasili, F.; Nicolopoulos, S.; Putz, H.; Margiolaki, I.; Calamiotou, M.; Iezzi, G. Structure Determination Feasibility of Three-Dimensional Electron Diffraction in Case of Limited Data. Symmetry 2022, 14, 2355. [Google Scholar] [CrossRef]
  20. Wang, X.; Xu, Y.; Gao, Y.; Wang, Y.; Misra, R.D.K. Enhancing Strength-ductility Combination in a Novel Cu-Ni Bearing Q&P Steel by Tailoring the Characteristics of Fresh Martensite. J. Mater. Res. Technol. 2023, 24, 9015–9029. [Google Scholar] [CrossRef]
  21. Singh, V.; Mondal, C.; Sarkar, R.; Roy, S.; Omprakash, C.M.; Ghosal, P. Characterization of Microstructure of Crept Nb and Ta-Rich γ-TiAl Alloys by Automated Crystal Orientation Mapping and Electron Back Scatter Diffraction. Symmetry 2022, 14, 399. [Google Scholar] [CrossRef]
  22. Petrov, R.; Kestens, L.; Wasilkowska, A.; Houbaert, T. Microstructure and Texture of a Lightly Deformed TRIP-assisted Steel Characterized by Means of the EBSD Technique. Mater. Sci. Eng. A 2008, 447, 285–297. [Google Scholar] [CrossRef]
  23. Zaefferer, S.; Romano, F.; Friedel, F. EBSD as a Tool to Identify and Quantify Bainite and Ferrite in Low-alloyed Al-TRIP Steels. J. Microsc. 2008, 230, 499–508. [Google Scholar] [CrossRef] [PubMed]
  24. Ryde, L. Application of EBSD to Analysis of Microstructures in Commercial Steels. Mater. Sci. Technol. 2006, 22, 1297–1306. [Google Scholar] [CrossRef]
  25. Radwański, K. Structural Characterization of Low-carbon Multiphase Steels Merging Advanced Research Methods with Light Optical Microscopy. Arch. Civ. Mech. Eng. 2016, 16, 282–293. [Google Scholar] [CrossRef]
  26. De Knijf, D.; Petrov, R.; Föjer, C.; Kestens, L.A.I. Effect of Fresh Martensite on the Stability of Retained Austenite in Quenching and Partitioning Steel. Mater. Sci. Eng. A 2014, 615, 105–115. [Google Scholar] [CrossRef]
  27. Kozłowska, A.; Kokot, G.; Matus, K.; Grajcar, A. Monitoring the Phase Evolution and Fracture Behavior of Advanced Multiphase QP Steel Using EBSD Technique and Digital Image Correlation. Theor. Appl. Fract. Mech. 2024, 113, 104520. [Google Scholar] [CrossRef]
  28. Radwański, K. Application of FEG-SEM and EBSD Methods for the Analysis of the Restoration Processes Occurring During Continuous Annealing of Dual-Phase Steel Strips. Steel Res. Int. 2015, 85, 9999. [Google Scholar] [CrossRef]
  29. Zaefferer, S.; Ohlert, J.; Bleck, W. A Study of Microstructure, Transformation Mechanisms and Correlation Between Microstructure and Mechanical Properties of a Low Alloyed TRIP Steel. Acta Mater. 2004, 52, 2765–2778. [Google Scholar] [CrossRef]
  30. Chen, J.; Lv, M.; Tang, S.; Liu, Z.; Wang, G. Coupled Toughening of a Low Carbon Medium Manganese Heavy Steel Plate Investigated by Electron Baccattered Diffraction (EBSD). Mater. Lett. 2016, 175, 203–206. [Google Scholar] [CrossRef]
  31. Grajcar, A.; Zalecki, W.; Kuziak, R. Designing of Cooling Conditions for Si-Al Micro Alloyed TRIP Steel on the Basis of DCCT Diagrams. J. Achiev. Mater. Manuf. Eng. 2011, 45, 115–124. [Google Scholar]
  32. Kozłowska, A.; Skowronek, A.; Grzegorczyk, B.; Grajcar, A. Thermodynamic Approach for Designing Processing Routes of 4Mn Quenching and Partitioning Steel. J. Therm. Anal. Calorim. 2024. [Google Scholar] [CrossRef]
  33. Woźniak, D.; Zak, A. Influence of vertical straightener roller shape on residual stress level in railway rails. Arch. Metall. Mater. 2024, 69, 245–255. [Google Scholar] [CrossRef]
  34. de Assumpção Pereira-da-Silva, M.; Ferri, F.A. Scanning Electron Microscopy. In Nanocharacterization Techniques; William Andrew Publishing: Norwich, NY, USA, 2017; pp. 1–35. [Google Scholar] [CrossRef]
  35. De Vincentis, N.S.; Field, D.P. Factors Affecting Confidence Index in EBSD Analysis. Ultramicroscopy 2021, 225, 113269. [Google Scholar] [CrossRef]
  36. Field, D.P. Recent Advances in the Application of Orientation Imaging. Ultramicroscopy 1997, 67, 1–9. [Google Scholar] [CrossRef]
  37. Allain-Bonasso, N.; Wagner, F.; Berbenni, S.; Field, D.P. A Study of the Heterogeneity of Plastic Deformation in IF Steel by EBSD. Mater. Sci. Eng. A 2012, 548, 56–63. [Google Scholar] [CrossRef]
  38. Podder, A.S.; Bhadeshia, H.K.D.H. Thermal Stability of Austenite Retained in Bainitic Steels. Mater. Sci. Eng. A 2010, 527, 2121–2128. [Google Scholar] [CrossRef]
  39. Zajac, S.; Schwinn, V.; Tacke, K.H. Characterisation and Quantification of Complex Bainitic Microstructure in High and Ultra-high Strength Linepipe Steels. Mater. Sci. Forum. 2005, 500–501, 387–394. [Google Scholar] [CrossRef]
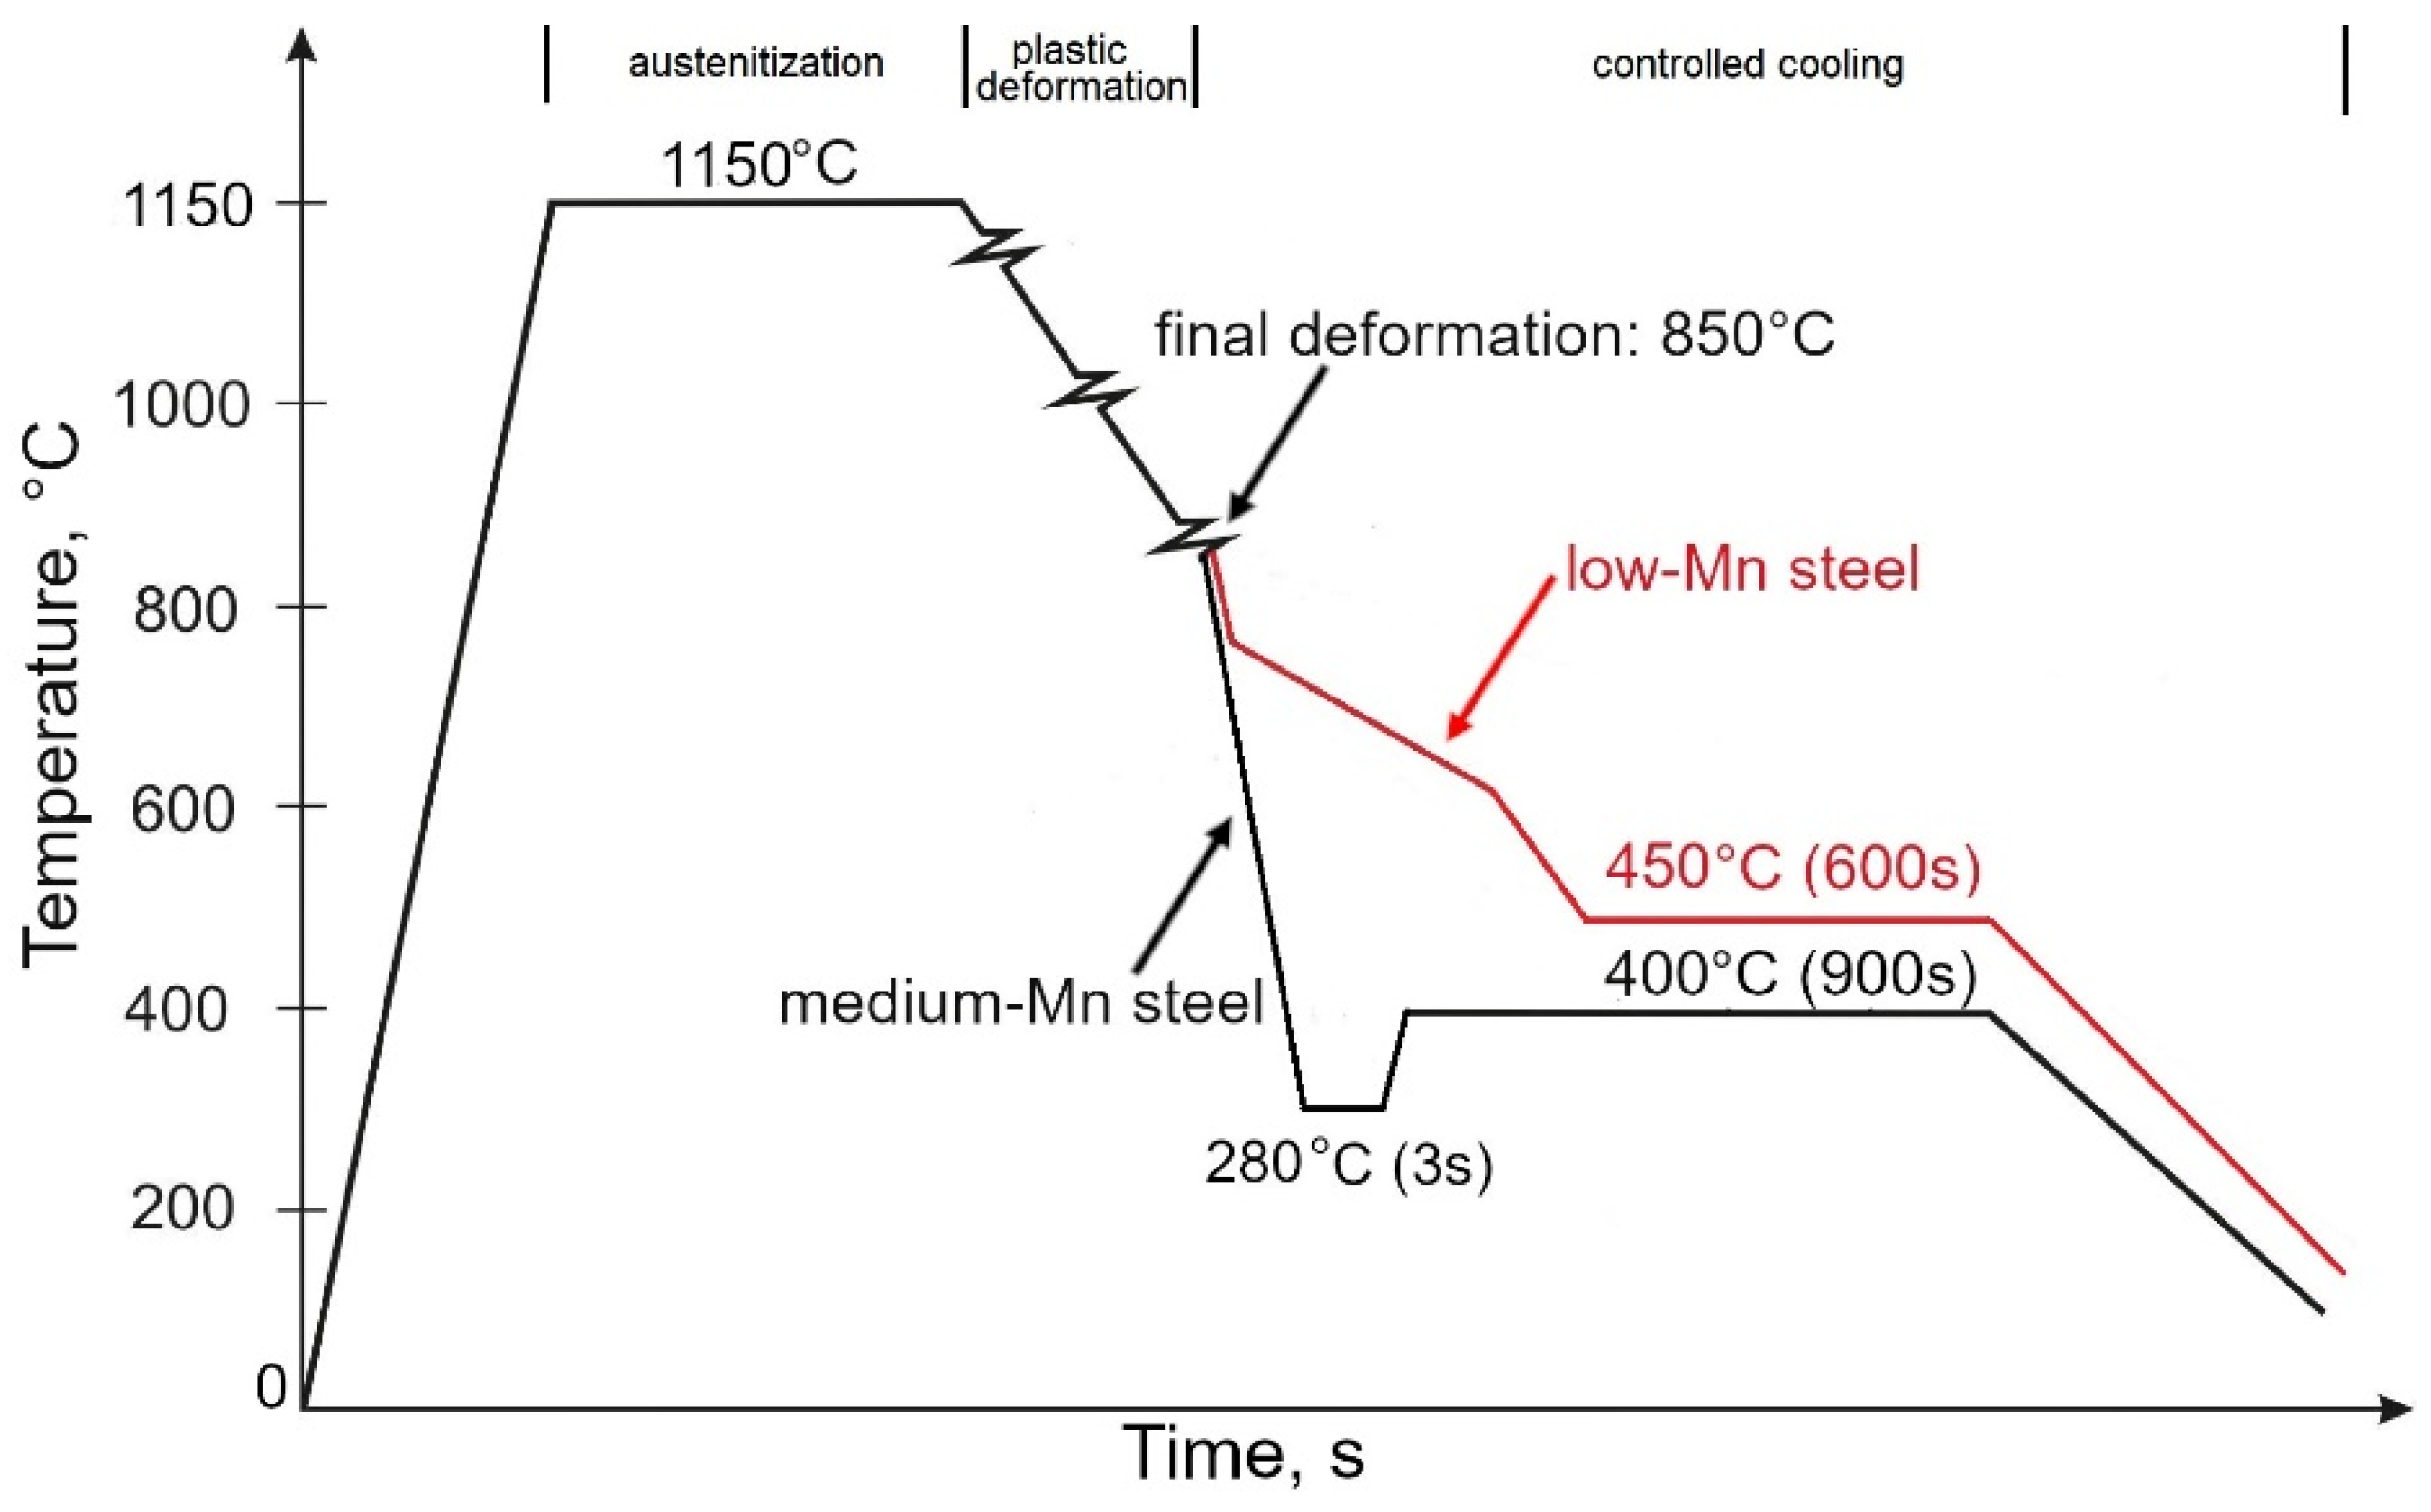
Figure 1. Processing schedules of investigated low-Mn and medium-Mn steels.
Symmetry 16 01630 g001
Figure 2. SEM images of low-Mn steel: after thermomechanical processing (a), deformed in a static tensile test up to 10% (b).
Symmetry 16 01630 g002
Figure 3. SEM image of medium-Mn steel.
Symmetry 16 01630 g003
Figure 4. Kikuchi diffraction bands in a low-Mn steel: ferrite (a), austenite (b), bainite (c) and martensite (d).
Symmetry 16 01630 g004
Figure 5. EBSD maps of the thermomechanically processed low-Mn steel: IQ map (a); phase distribution map, where BBC phases are marked in red and FCC phase is marked in green (b); IQ map in reference to the distribution presented in Figure (d) (c); a histogram showing the distribution of IQ parameter (d). F—ferrite, B+RA—bainitic-austenitic areas, M+RA—martensitic-austenitic areas.
Symmetry 16 01630 g005
Figure 6. EBSD maps of the thermomechanically processed low-Mn steel: a map displaying the K-S (blue) and N-W (red) orientation relationships between the bainite or martensite and RA (a); phase distribution map with marked misorientation angles corresponding to K-S (blue) and N-W (red) (b); a map showing an average equivalent diameter of RA grains (c) and a corresponding histogram of average equivalent RA diameter distribution (d) a KAM map (e) and a histogram showing the distribution of KAM parameters (f). F—ferrite, B+RA—bainitic-austenitic areas, M+RA—martensitic-austenitic areas, RG—partially recrystallized grains.
Symmetry 16 01630 g006
Figure 7. EBSD maps of the low-Mn steel deformed in the tensile test up to 10%: IQ map (a); phase distribution map, where BBC phases are marked in red and FCC phase is marked in green (b); IQ map in reference to the distribution presented in Figure (d) (c); a histogram showing the distribution of IQ parameters (d).
Symmetry 16 01630 g007
Figure 8. EBSD maps of the low-Mn steel deformed in the tensile test up to 10%: a map displaying the K-S (blue) and N-W (red) relationships between bainite or martensite and RA (a); a phase distribution map with marked misorientation angles corresponding to K-S (blue) and N-W (red) (b); a map showing an average equivalent diameter of RA grains (c) and a corresponding histogram of average equivalent RA diameter distribution (d), a KAM map (e) and a histogram showing the distribution of KAM parameter (f).
Symmetry 16 01630 g008
Figure 9. The IQ map of medium-Mn steel combined with the phase distribution map (RA marked in green) (a) and a linear analysis of IQ parameter (b) and a linear analysis of misorientation angles (c) along the line in Figure (a). TM—tempered martensite, RA—retained austenite, B—bainite formed during the partitioning step.
Symmetry 16 01630 g009
Table 1. Chemical compositions of analyzed materials in wt.%.
Steel DesignationCMnAlSiNbTiFe
Low-Mn0.241.550.400.870.0340.023Bal.
Medium-Mn0.174.200.980.870.054-Bal.
Table 2. Characteristic features of K-S and N-W orientation relationships between austenite (γ) and bainite/martensite (α) based on [29].
Type of Orientation RelatnioshipParallel PlanesParallel DirectionMisorientation Angle, °
Kurdjumov-Sachs(111)γ//(011)α[101]γ//[111]α42–44
Nishiyama-Wassermann(111)γ//(011)α[112]γ//[011]α45–47
Table 3. The characteristics of parameters obtained using the EBSD method for individual microstructural constituents based on [25].
Microstructural ConstituentCIIQKAMCharacteristic Misorientation Angles, °
Ferrite (F)F > RA, B, MF > RA, B, MF < RA, B, M-
Retained austenite (RA)
F > RA/B > M

F > RA/B > M

F < RA/B < M
K-S (42–44)
N-W (45–47)
Bainite (B)M > B/RA > FF > B/RA > MF < B/RA < M50–55
Martensite (M)M < B, RA, FM < B, RA, FM > B, RA, F55–60
Disclaimer/Publisher’s Note: The statements, opinions and data contained in all publications are solely those of the individual author(s) and contributor(s) and not of MDPI and/or the editor(s). MDPI and/or the editor(s) disclaim responsibility for any injury to people or property resulting from any ideas, methods, instructions or products referred to in the content.