Abstract
Analyzing the reliability of the aging class of life distribution provides important information about how long a product lasts and sustainability measures that are essential for determining the environmental impact and formulating resource-saving plans. The study emphasizes the goodness-of-fit technique of the nonparametric test for the NBRUmgf class because age data are crucial for applications. Evaluations were conducted using the test’s asymptotic properties and Pitman efficiency methodology for some selected asymmetric probability models, and the outcomes were compared with those of alternative methods. We assessed the test’s power against widely used reliability distributions for some well-known alternative asymmetric distributions, including the Weibull, Gamma, and linear failure rate (LFR) distributions, and provided percentiles for both censored and uncensored data. This study shows the efficacy of the test in various sectors using real-world datasets and comprehensive tables of test statistics.
Keywords:
order stochastic; reliability theory; hypothesis testing; censored data; classes of real-life distributions MSC:
60K10; 62E10
1. Introduction
Key concepts in statistics, probability, and related fields such as economics, survival analysis, and reliability theory include symmetry, asymmetry, and the stochastic comparison of probability distributions. Reliability analysis is a discipline dedicated to evaluating and enhancing the dependability of systems, components, or processes. Its primary objective is to assess the likelihood that a system will function as intended without failure over a specified duration. This process involves identifying potential failure modes, estimating failure probabilities, and analyzing the impact of these failures on overall system performance. Reliability analysis is applicable across various industries, including engineering, manufacturing, aerospace, and software development. Prominent techniques in this field encompass Failure Mode and Effects Analysis (FMEA), Fault Tree Analysis (FTA), and Reliability Block Diagrams (RBD). The insights derived from reliability analysis contribute to the design of more resilient systems, the optimization of maintenance schedules, and the reduction in risks associated with failures.
The theory of reliability focuses on the probability that a system composed of multiple components will perform its intended function over a specified timeframe. A crucial aspect of this evaluation is identifying the time-to-failure distribution of the system, typically achieved by fitting a life distribution function to empirical data. In real-world scenarios, system components experience aging effects, which can either degrade or enhance their performance over time, and this must be considered when determining lifespan distributions. While many statistical methods employ constrained parametric models that rely on specific assumptions, these constraints can be too inflexible for the complexities of real-world data. Consequently, researchers and statisticians have extensively explored various aging classes, including NBU, IFR, IFRA, NBUC, NBUE, HNBUE, NBUL, and NBRU.
The literature has identified a variety of aging classes, most of which have been introduced and developed over the last three decades but still require development in the area of statistical inference. This is particularly true for non-parametric methods, which are most useful to practitioners. The aim of this study is to apply a state-of-the-art non-parametric method (to be discussed in detail in the third section) to several life distributions that represent a number of different, widely used, and very important forms of the “new better than renewal used in moment generating function ordering” (NBRUmgf). These forms of life distributions fit a variety of aging processes and provide a foundation for interpreting and applying the various “aging classes” used in reliability theory and practice. Although NBRUmgf is not the only ordering used to model lifetime distributions, it is one of the most important and widely used orderings in practice. Further details can be found in Klefsjo [1], Deshpande et al. [2], Barlow and Proschan [3], Ahmed [4], Mahmoud et al. [5,6], Ghosh and Mitra [7], Gadallah et al. [8], Navarro and Pellerey [9], Bakr [10], Alqifari et al. [11], and EL-Sagheer et al. [12], and other sources.
Reliability analysis has been enhanced by recent developments in machine learning and data-driven techniques, especially for huge datasets (see, e.g., Lu-Kai Song et al. [13], and Caroline Morais et al. [14]). Our strategy fills a demand for practitioners who seek flexible, non-parametric tools without requiring large amounts of data by providing interpretability benefits and being appropriate for smaller datasets where ML techniques might be less successful.
In this study, we focus on the “new better than renewal used in moment generating function ordering” (NBRUmgf) class of life distributions, introduced by Hassan and Said [15]. This class represents an important extension of the renewal theory in reliability analysis, offering a more generalized approach for modeling complex aging processes. Despite its significance, there has been limited research testing whether real data fit the NBRUmgf class using non-parametric approaches. Existing methods typically rely on parametric assumptions, which may not hold in real-world scenarios where the data are incomplete or censored. This gap highlights the need for a non-parametric goodness-of-fit test that can assess the suitability of the NBRUmgf class without making restrictive assumptions regarding the underlying population distribution.
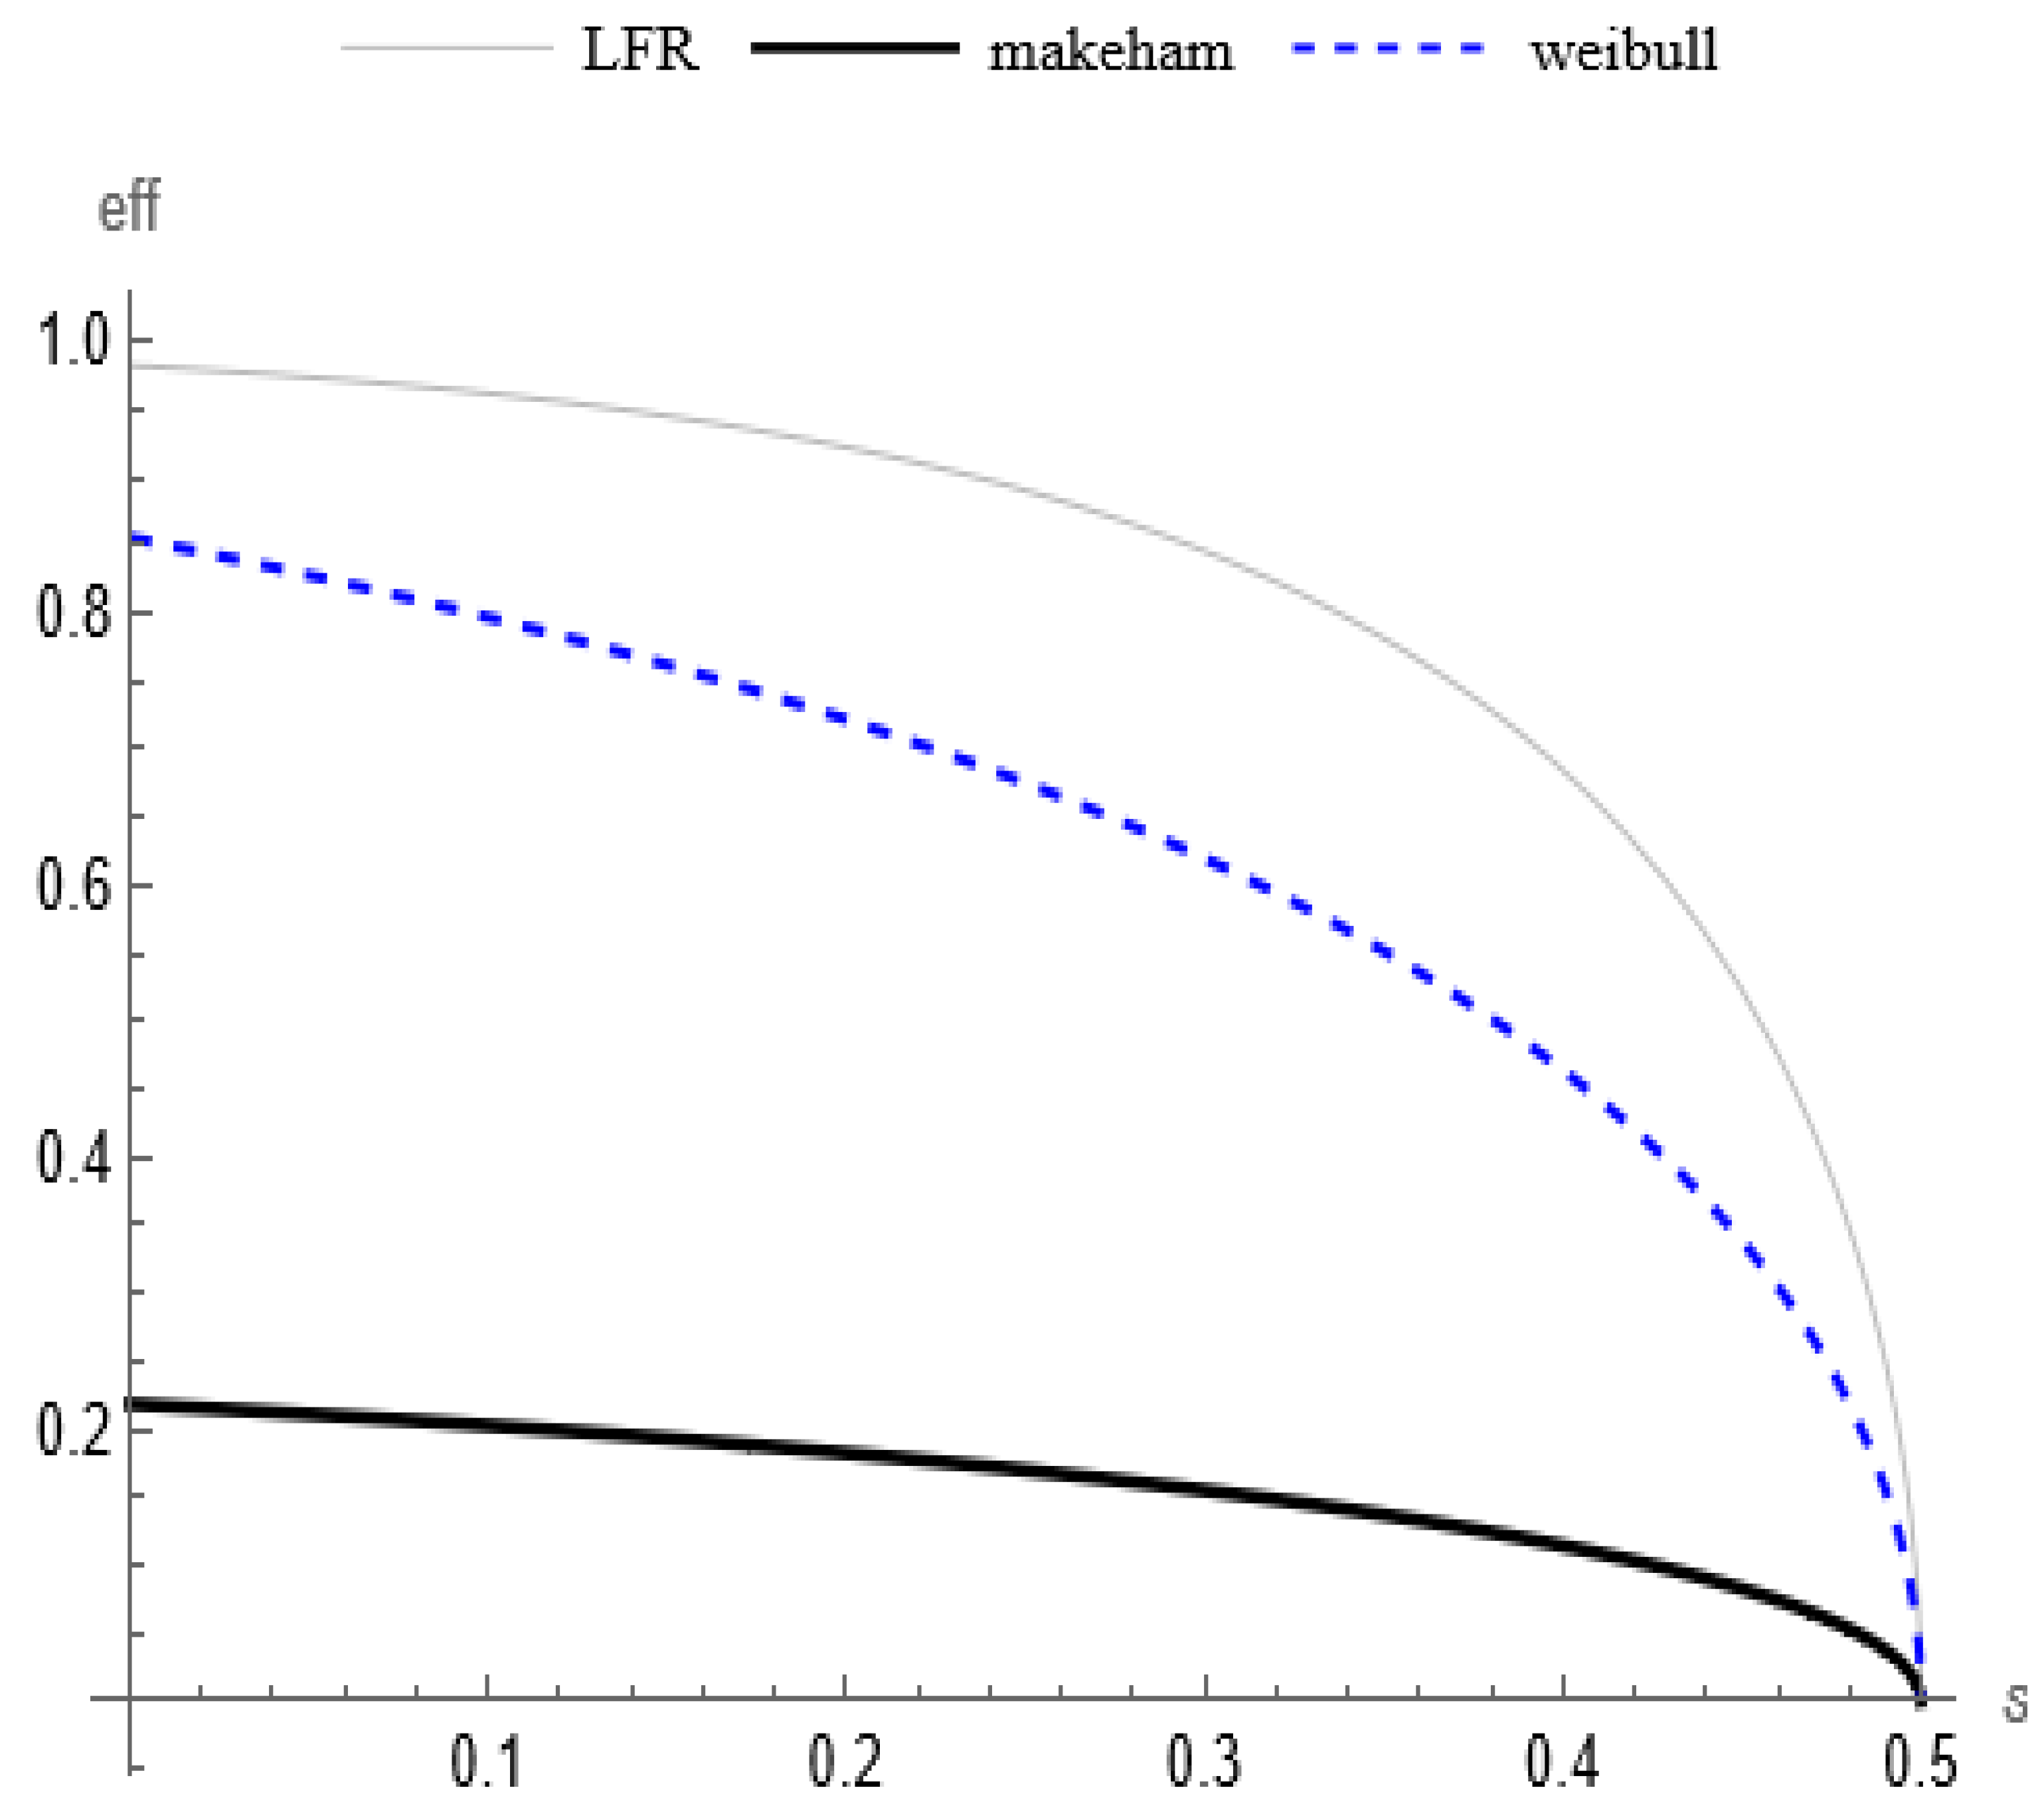
Our research addresses this gap by proposing a nonparametric goodness-of-fit technique tailored to the NBRUmgf f class. This technique differs from traditional non-parametric tests, which primarily focus on drawing inferences about the population parameters. Instead, our goodness-of-fit approach evaluates how well a specific model (in this case, the NBRUmgf class) fits observed data. We use Monte Carlo simulations to derive critical values and assess the power of our test against alternative reliability distributions, such as Weibull, Gamma, and linear failure rate (LFR) distributions.
Through real-world applications, including medical and pandemic datasets, we demonstrated the practical utility of our test. The results show that the test can effectively identify when the data follow the NBRUmgf class, providing a flexible and robust tool for reliability analysis in various fields.
Another widely employed ordering method in life and reliability testing is as follows:
, moment generating function ordering, if
which can be written as follows:
Thankfully, certain arrangements previously discussed have been utilized to examine lifespan distributions, providing new definitions and explanations for aging categories. When we talk about aging, we mean the statistical pattern that an older system usually has a shorter remaining lifetime than a younger one.
This study focuses on a new aging concept referred to as “New Better than Renewal used in Moment Generating Function Ordering” (NBRUmgf), which originates from moment-generating function ordering. Section 2 provides an in-depth explanation of this definition and outlines the various relationships associated with this concept. In 
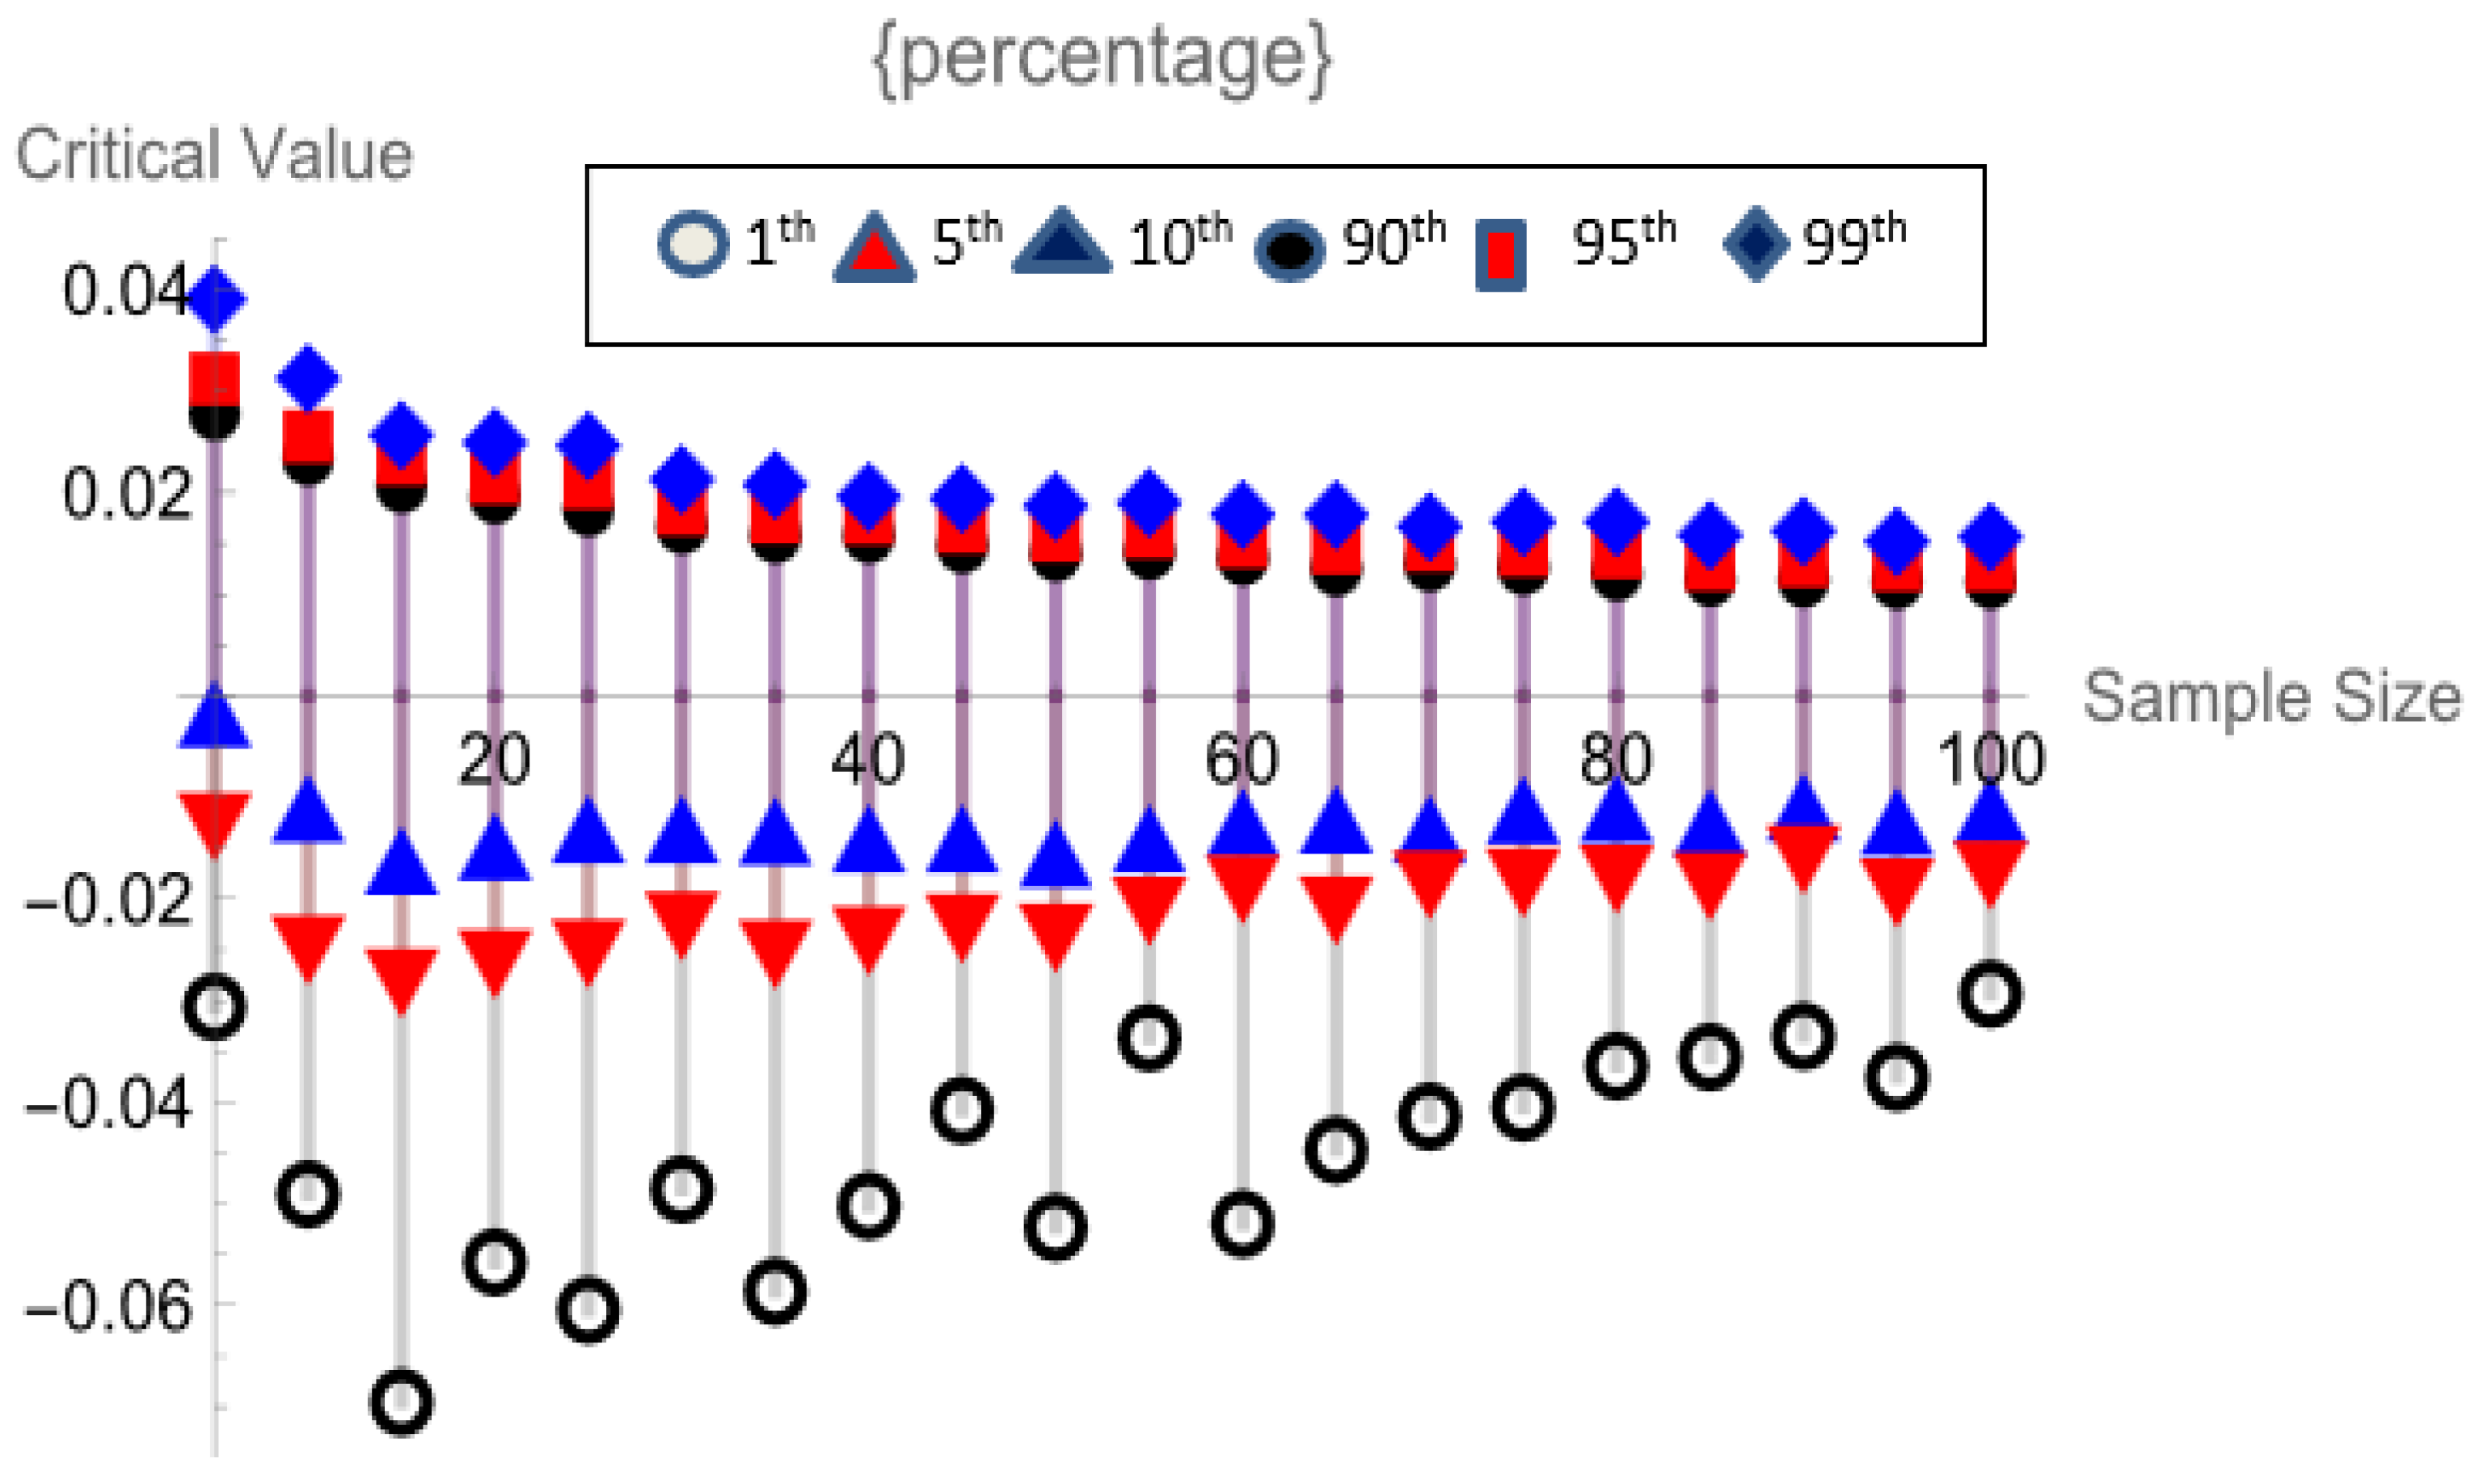
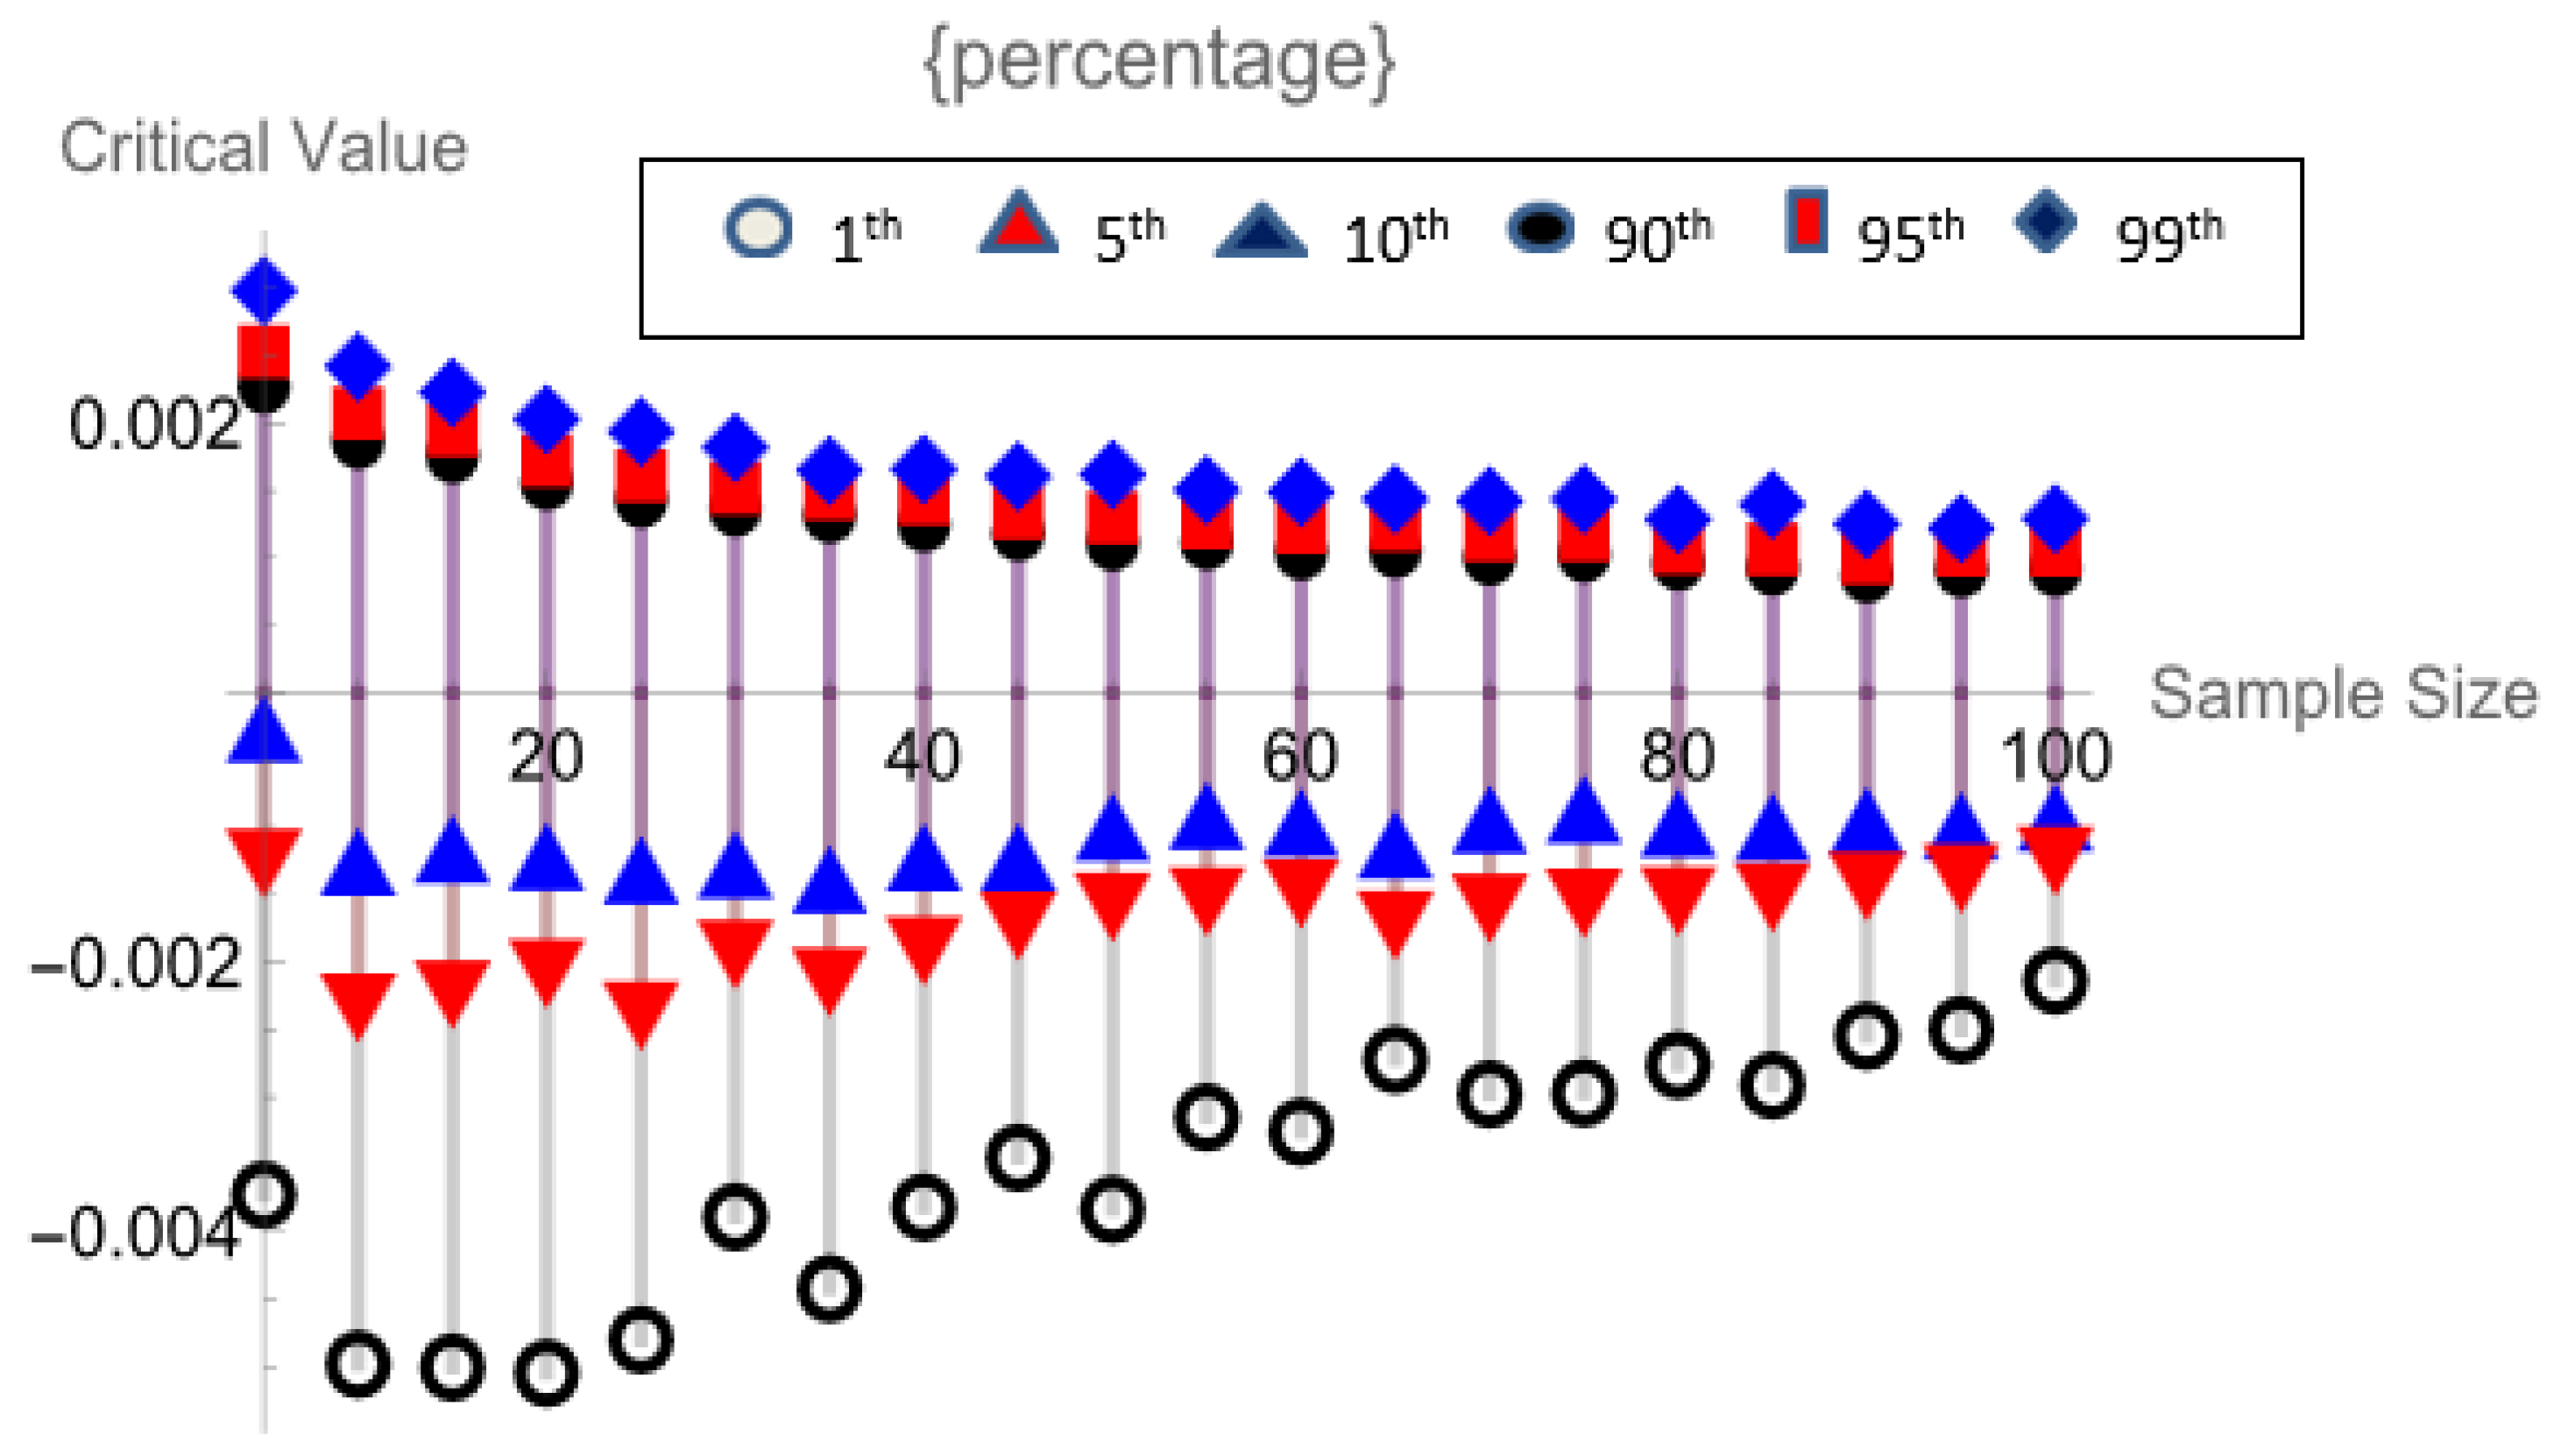
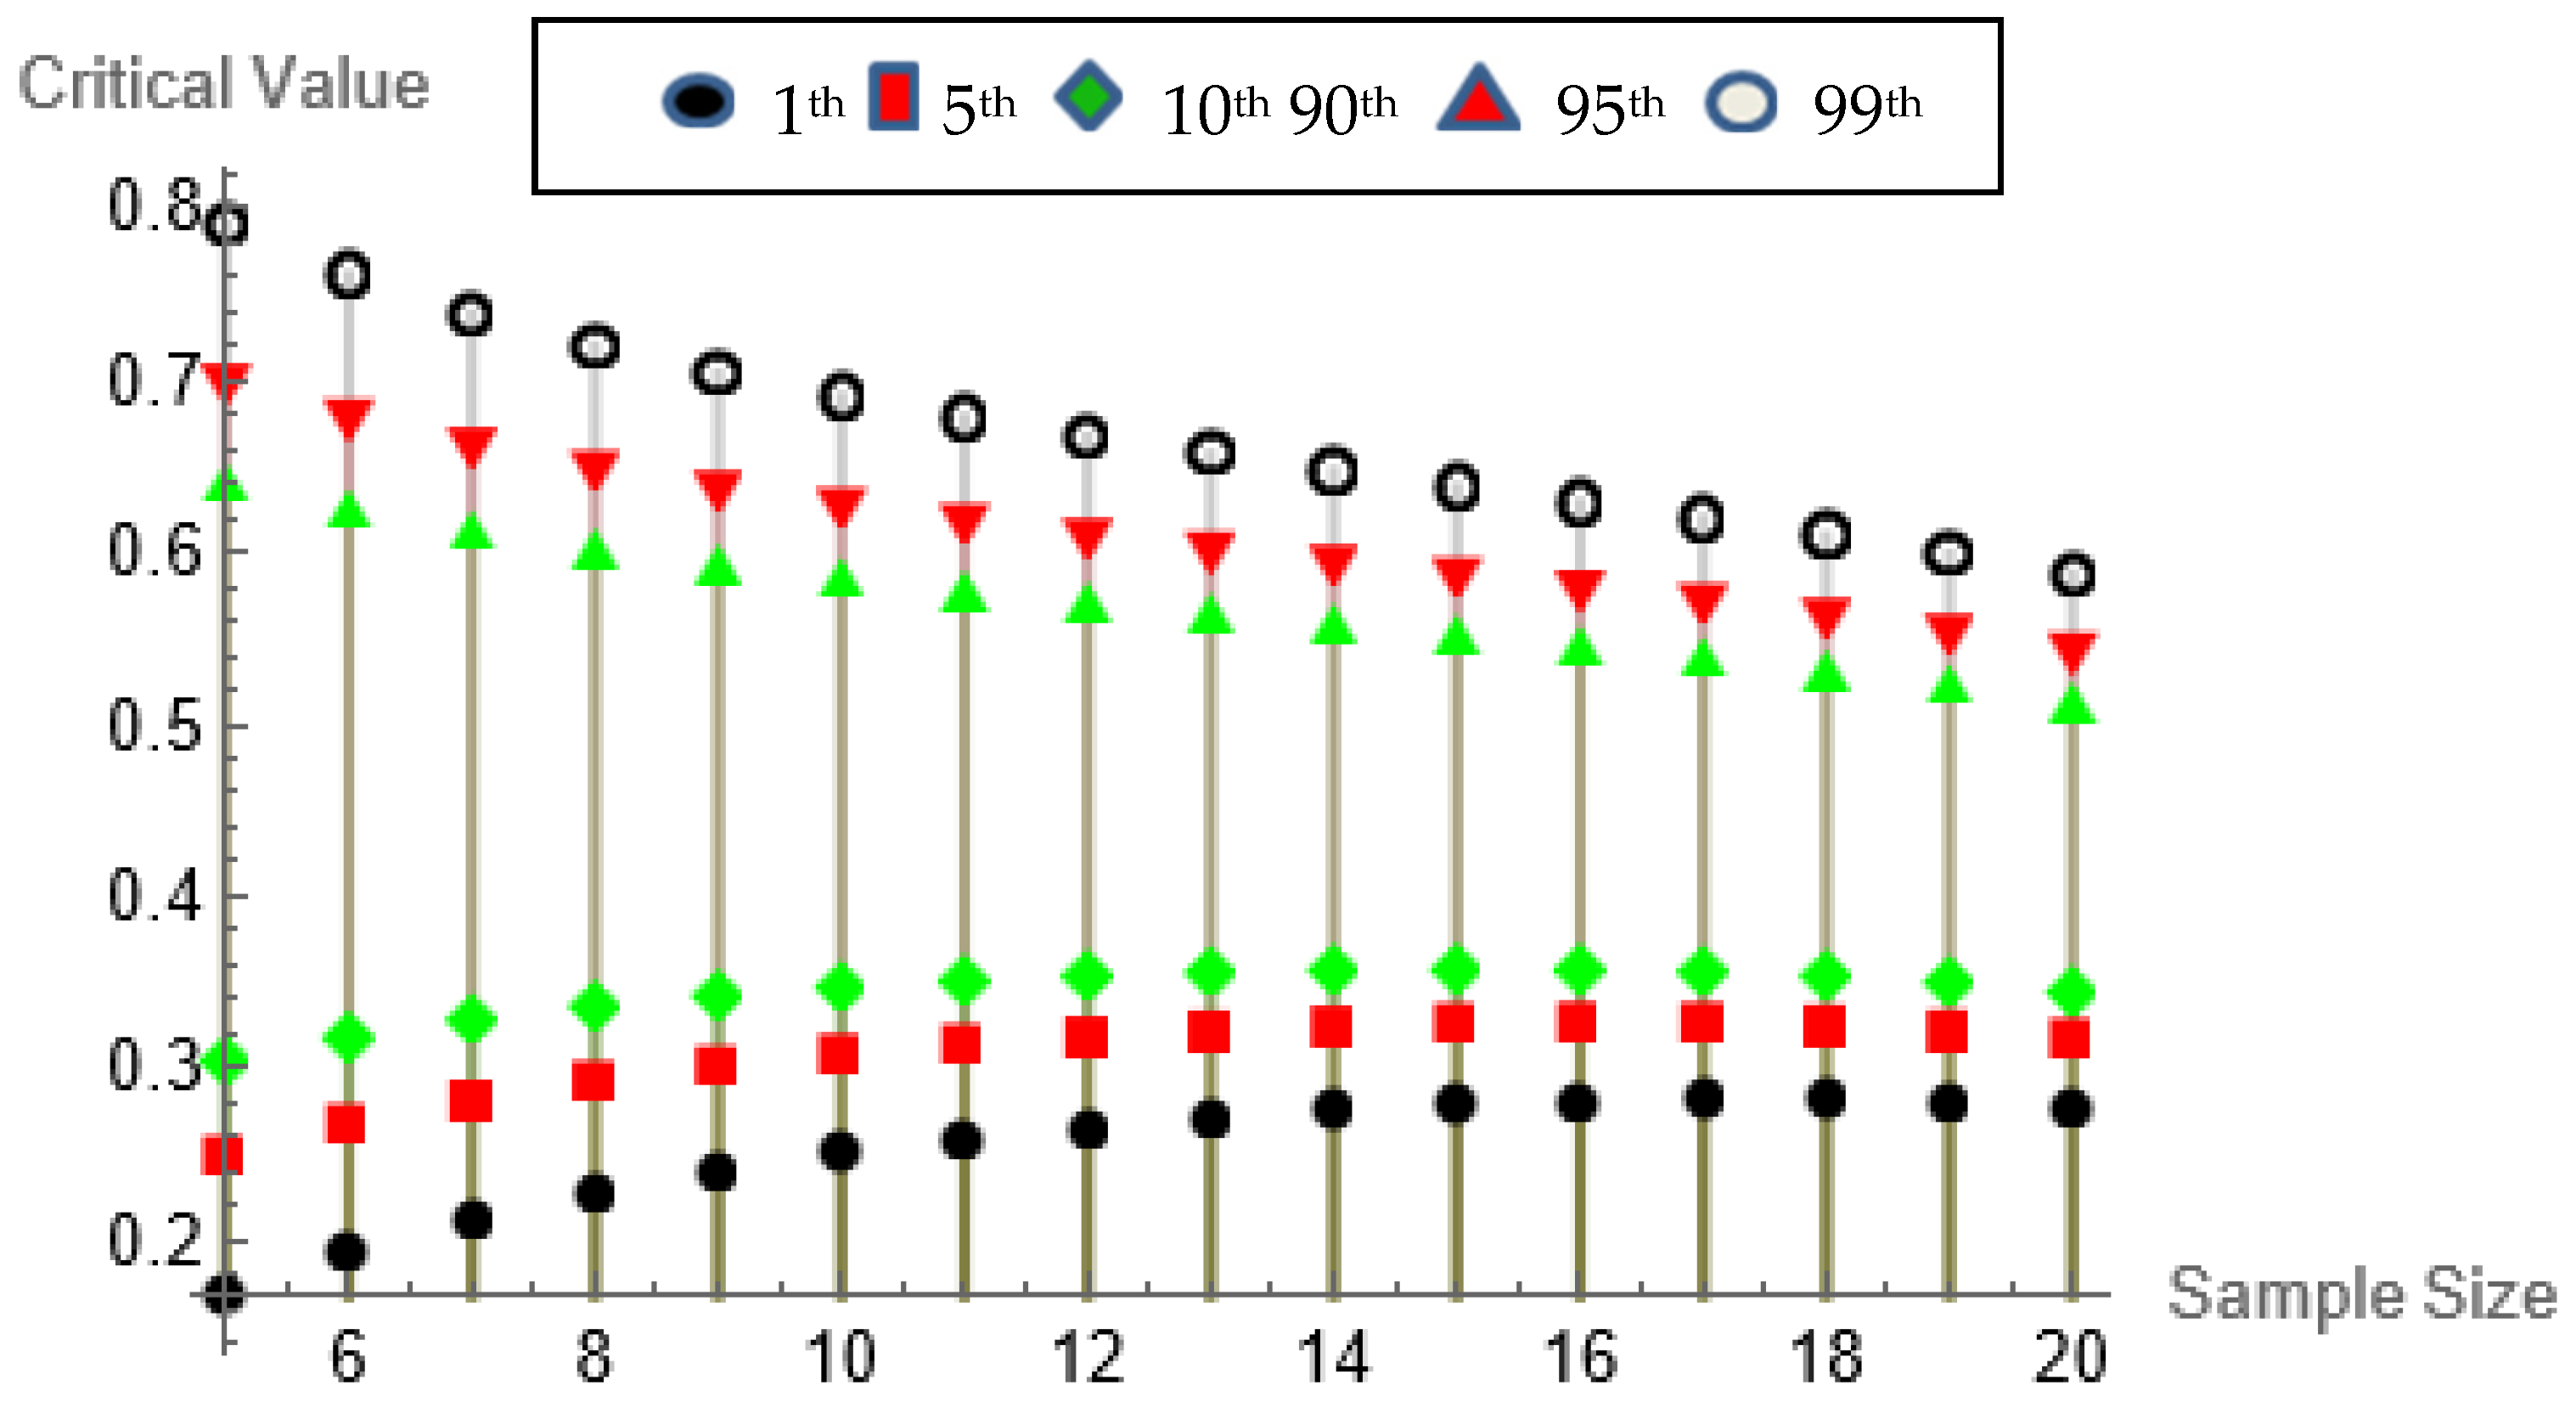
Section 3, we elaborate on the development of our testing methodology, employing goodness-of-fit along with PARE for commonly used alternative classes. Monte Carlo simulations are conducted in order to derive critical values for the null distribution in the Mathematica 13.3 program. Section 4 introduces the suggested test specifically designed for right-censored materials. Finally, in Section 5, we examine additional cases to illustrate how the recommended statistical test can be applied in real-world situations and to emphasize the significance of the study’s results.
2. Definitions
Embark with us on an expedition through the domain of renewal classes, unveiling their impact on shaping the reliability landscape. From defining fundamental principles to examining their diverse applications, this article acts as your guide through this captivating journey.
The renewal survival function, denoted by is expressed in terms of , which represents the lifetime of a device with a finite mean .
Definition 1.
X exhibits the “new netter than renewal used” (NBRU) property if
Definition 2.
X exhibits the “renewal new is better than used (RNBU) property if
Definition 3.
X exhibits the “new better than renewal used in expectation (NBRUE) property if
Bakr et al. [16] followed Hassan and Said [15] in exploring a novel interpretation of “new better than renewal used” within the context of moment generating function order, based on the concepts previously established.
Definition 4.
The survival function has the new better than renewal used in moment generating function order (NBRUmgf) property, if
It is evident that Equation (6) is equivalent to
Now, the following implication arises:
3. Non-Parametric Hypothesis Testing
The goodness of fit technique test is more effective and easier to manage. It was initially studied by Ahmed et al. [17], Mahmoud et al. [18], Walid et al. [19], Jiachang Tang et al. [20], Perez-Guagnelliet al. [21], Liu et al. [22], Luo et al. [23], Li et al. [24], Liu et al. [25], among others.
We construct an exponential departure measure for the NBRUmgf class.
3.1. Conducting Tests for Exponentiality
To develop our test for exponentiality, we will perform integration on both sides of Equation (6), as specified in Definition 4, with respect to t over the interval
After performing several computations, we acquire
The subsequent test is based on a sample drawn from a population with survival , and we procedure the following:
the data have the exponential property, and the data have the property.
Moreover, it is worth noting that the statistics used in the test differ from zero under the alternative hypothesis and do not differ from zero under the null hypothesis.
It is important to highlight that while under and under , we employ the following to ensure the test’s scale invariance
Now, the empirical estimation of is as follows:
Let
Then, the symmetric kernel is defined as where the total encompasses all arrangements of and . This illustrates that the U statistic provided by is equivalent to
The following theorem summarizes the asymptotic normality of .
Theorem 1.
is asymptotically normal, as with mean 0 and variance . Under , the variance reduces to Equation (15).
Proof.
Using Equations (11) and (12), let
and,
So
Upon computation, we find that under , and variance is
And this completes the proof for the theory. □
3.2. The Asymptotic of Pitman’s Efficiencies (PAE’s)
Pitman’s asymptotic efficiencies are the widely used technique for comparing the asymptotic performance of several tests. Based on sample sizes, Pitman’s asymptotic efficiencies compare two statistical tests. In order to achieve the same precision as tests with lower efficiency, tests with higher Pitman’s efficiency require fewer observations. Comparing several tests for different statistical problems and choosing the best one is one possible use case for asymptotic Pitman’s efficiency. Pitman’s asymptotic efficiency helps choose the best test for a given problem by pointing out the test that requires the least amount of sample size.
The PAE is define by
Since,
Then,
For the Weibull, Makeham, and linear failure rate (LFR) distributions (since they are in the NBRUmgf), Pitman’s asymptotic efficiencies (PAEs) of our test are calculated. Next, we contrast our test with class tests from other authors, including Hassan and Said [15] and Bakr et al. [16] (See Table 1).
Table 1.
The asymptotic efficiencies of at various s values.
As seen in Table 1 and Figure 1, the PAE’s of decrease with increases, with the LFR distribution showing larger PAEs than the families of the other distributions.
Figure 1.
The relation between s and PAE’s of
The suggested test performs better than the other two nonparametric hypothesis tests for the same class, according to Table 1. This greatly raises the recommended test’s legitimacy for this specific class.
Weibull, Gamma, and LFR distributions were chosen for this study because they are frequently employed in reliability analysis and depict a range of failure rate behaviors that are crucial for comprehending system performance. Our non-parametric goodness-of-fit test is evaluated using these distributions as a basis. In order to increase the test’s application in reliability contexts, future research may expand this comparison to include log-symmetric distributions, such as the log-normal and log-t, which take positive support and symmetry into consideration. (See Vanegas and Paula [26] and Morán-Vásquez and Ferrari [27] for more details).
3.3. Critical Points of the Null Distribution by Monte Carlo
As depicted in Table 2 and Table 3, we calculate the lower and upper percentiles of provided in Equation (8) utilizing 10,000 simulated samples of size.
Table 2.
Critical points of the null distribution by Monte Carlo at .
Table 3.
Critical points of the null distribution by Monte Carlo at .
The investigation of Table 2 and Table 3 reveals that the calculated critical values converge toward a normal distribution as the sample size grows. This evidence indicates that the goodness-of-fit test for the class of life distributions is more reliable and robust for larger sample sizes. The stability in the critical values as the sample size increases supports the adequacy of the test to identify the underlying distribution as the sample size increases, which is important for the proper classification of life distributions in practice.
Critical values and sample size relationships for uncensored data at various significance levels are shown in Figure 2 and Figure 3. Calculated values are shown by points, while significant levels are indicated by colors. The dependability of the test for bigger samples is supported by this visual study, which shows trends in distribution behavior as sample size grows.
Figure 2.
The relation between sample size and critical points at s = 0.1.
Figure 3.
The relation between sample size and critical points at s = 0.01.
3.4. Power Estimates
The power of the test statistics is considered for 95% percentiles in Table 4 for three of the most commonly used alternatives, which are as follows:
- (i).
- ;
- (ii).
- ;
- (iii).
- .
For specific values of , these distributions can be simplified or reduced to an exponential distribution.
Table 4.
Power estimates at .
Table 4.
Power estimates at .
| Distribution | N | |||
|---|---|---|---|---|
| LFR | 20 | 0.9857 | 0.9885 | 0.9910 |
| 30 | 0.9957 | 0.9979 | 0.9988 | |
| 40 | 0.9986 | 0.999 | 0.9994 | |
| Gamma | 20 | 0.9837 | 0.9986 | 1 |
| 30 | 0.9892 | 0.9994 | 1 | |
| 40 | 0.9917 | 1 | 1 | |
| Weibull | 20 | 1 | 1 | 1 |
| 30 | 1 | 1 | 1 | |
| 40 | 1 | 1 | 1 |
Table 4 demonstrates that for the LFR, Gamma, and Weibull distributions, the power estimates of our test exhibit robustness and demonstrate improvement as both the parameter value and sample size n increase. It is noteworthy that the critical values in Table 2 and Table 3 exhibited an inverse relationship with sample size, increasing as the sample size decreased. This trend suggests that as parameter decreases, the critical values increase. Consequently, as the approaches the exponential distribution, the power shown in Table 4 diminishes.
4. Censored Data Hypothesis Testing
The following is the measure of departure using the Kaplan and Meier estimator:
where
and
Table 5 shows the critical value percentiles of for sample size n = .
Table 5.
Critical points of at .
An examination of Table 5 and Table 6 reveals a distinct pattern in the critical values of the test statistic as the sample size increases. For smaller sample sizes, the critical values display variability, diverging from a normal distribution. However, as the sample size increases, the critical values begin to approximate a normal distribution, which is consistent with large-sample behavior for goodness of fit tests in the class of life distributions. When considering complete data, a similar trend can be observed. The critical values for censored samples are generally larger due to the reduced information content from complete data. However, as the sample size grows, even in the presence of censoring, the critical values tend to stabilize and move closer, as explained in complete data. This behavior suggests that, while censoring introduces additional variability, larger sample sizes mitigate this effect, allowing for a more accurate application of the test. Therefore, the analysis of both complete and censored data confirms that larger sample sizes provide more reliable critical values, enhancing the robustness of the goodness-of-fit testing for life distributions.
Table 6.
Critical points of at .
Critical values and sample size relationships for censored data at various significance levels are shown in Figure 4 and Figure 5. The dependability of the test for bigger samples is supported by this visual study, which shows trends in distribution behavior as sample size grows.
Figure 4.
The relation between sample size and critical points at s = 0.1.
Figure 5.
The relation between sample size and critical points at s = 0.2.
5. Real-World Applications
We apply the proposed goodness-of-fit test to several real-world datasets at a 95% confidence level to demonstrate the practical relevance of our findings. The analysis of these datasets illustrates the effectiveness of the test in identifying the property across different types of real data.
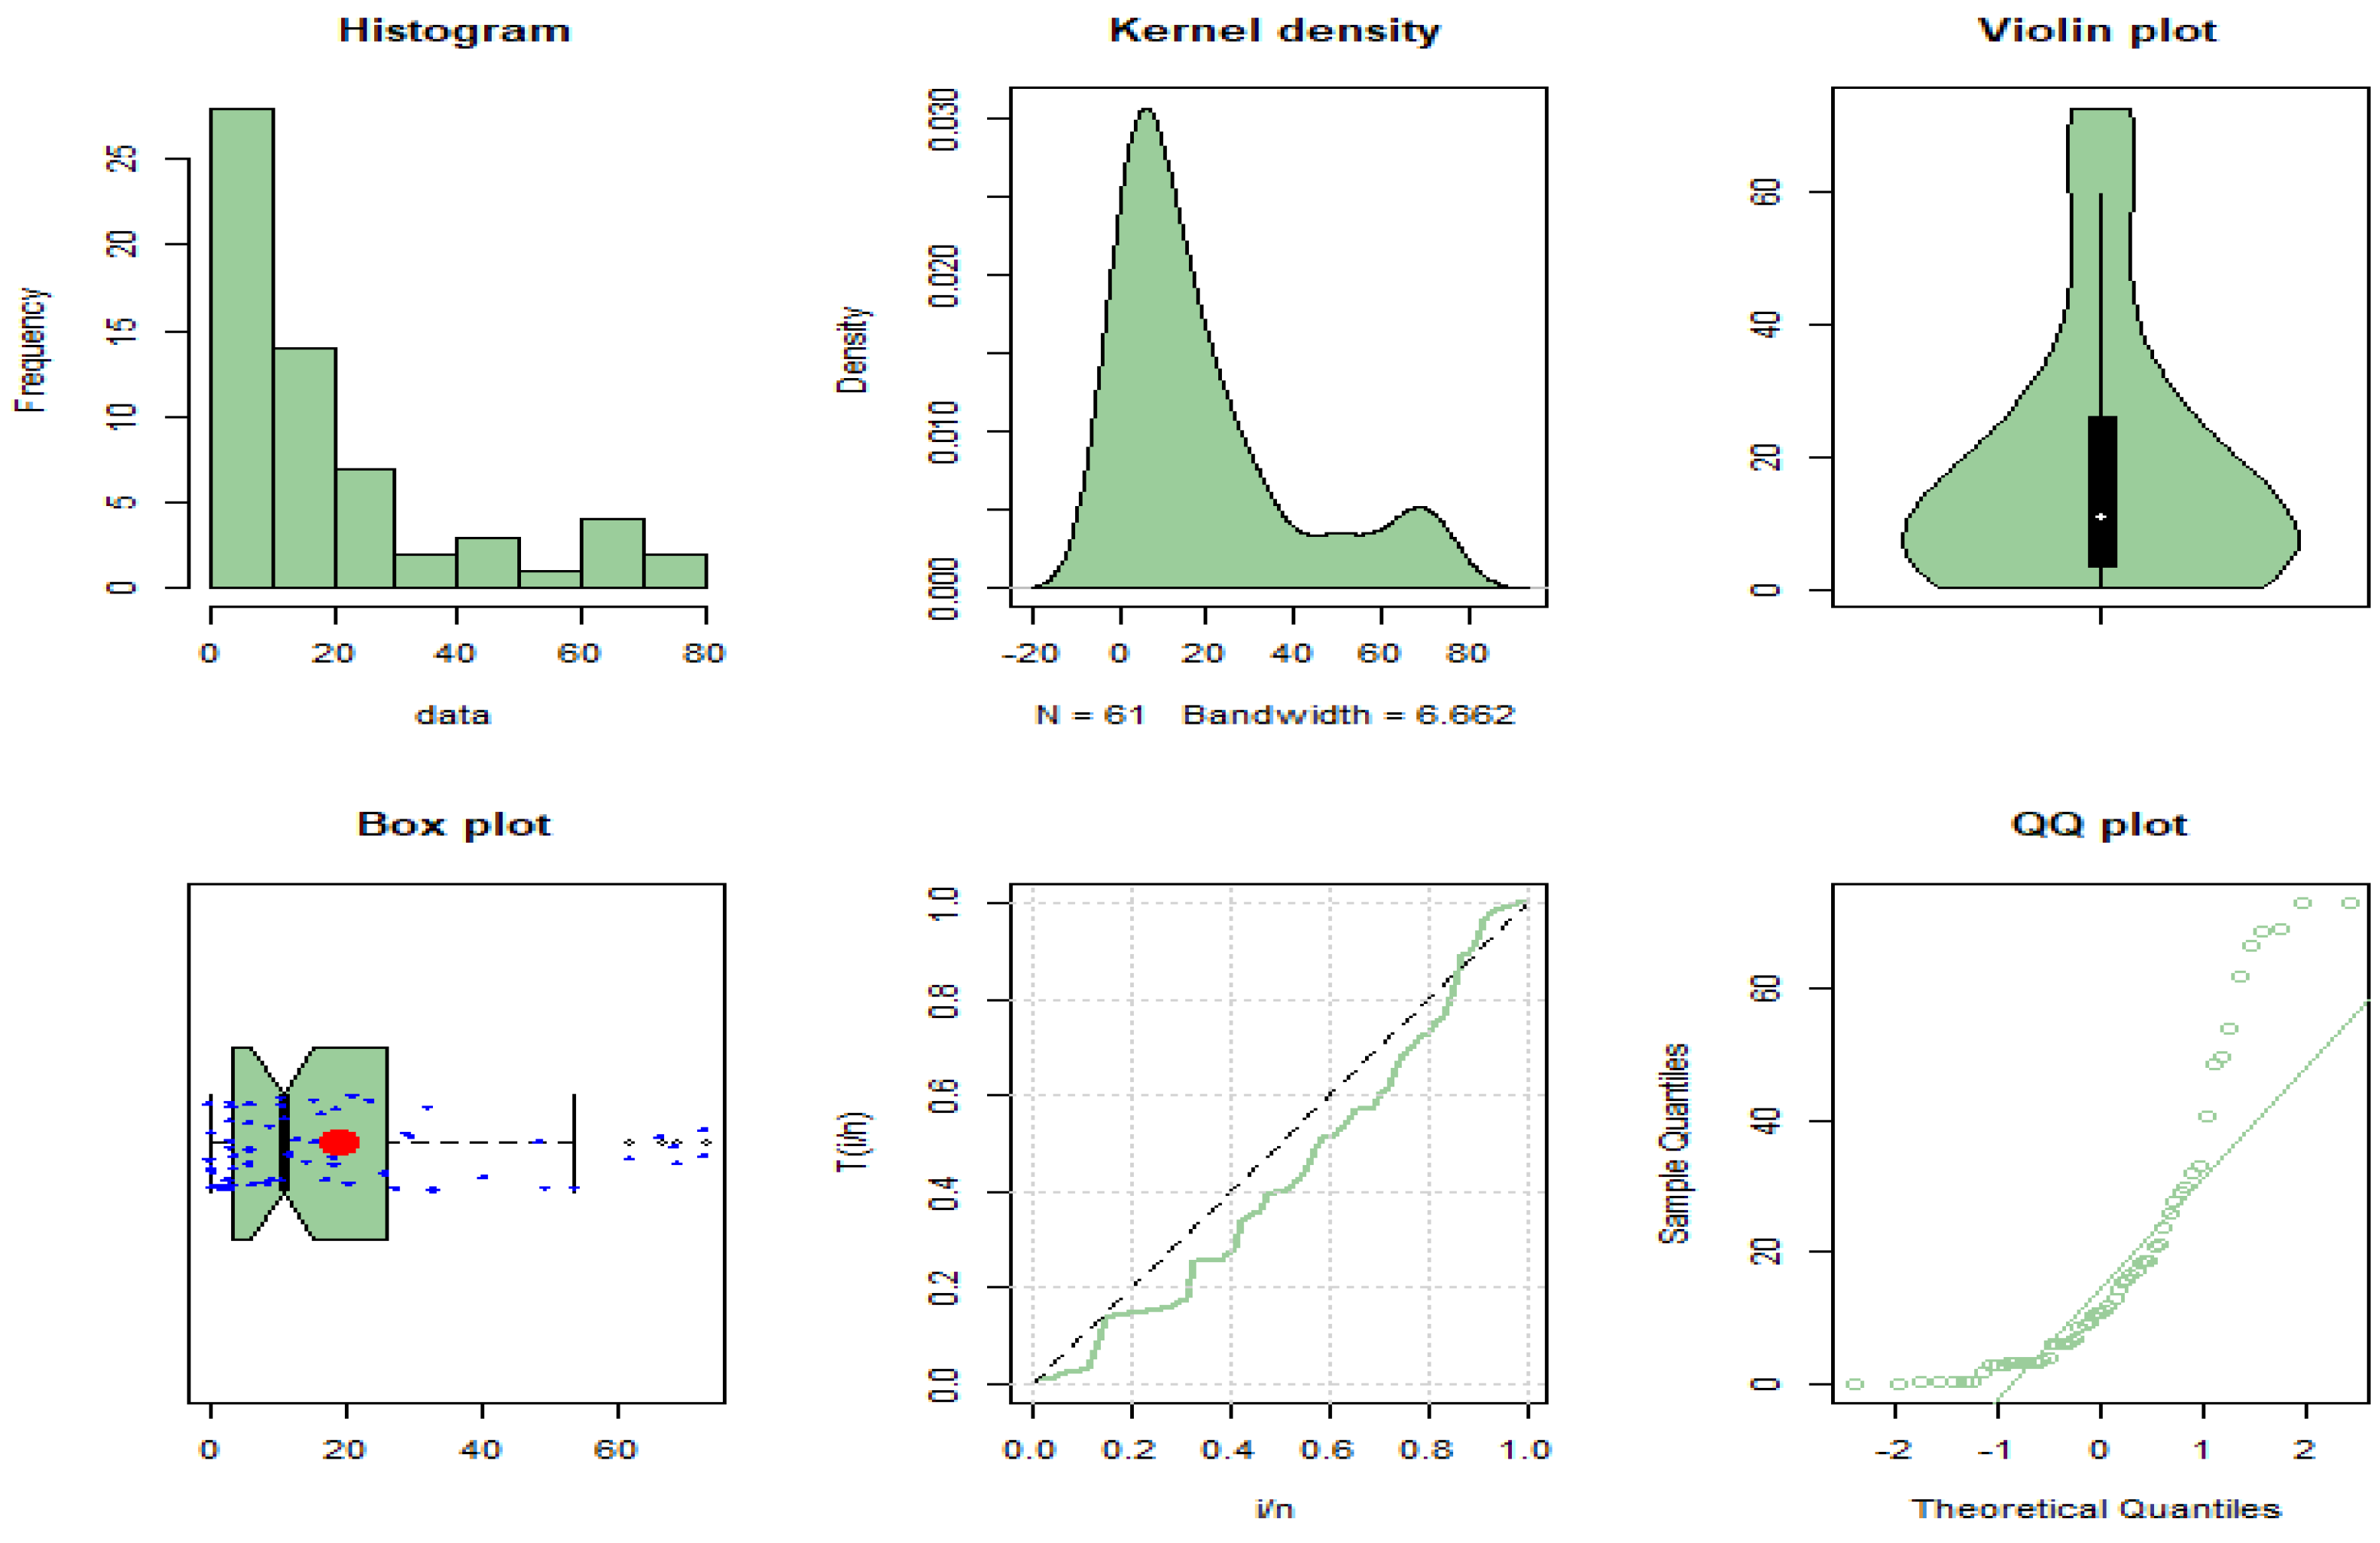
Dataset #1. This study commences with the data from Abouammoh et al. [28], which encompass information on 40 patients diagnosed with leukemia from the Ministry of Health Hospital in Saudi Arabia (see Figure 6). To implement our test, we computed the test statistic for significance level at . The calculated values are and . Both values fall within the rejection region of the null hypothesis , based on the critical values in Table 2 and Table 3. Consequently, we reject the exponential distribution hypothesis for this dataset, indicating that the data does not follow an exponential life distribution. This rejection suggests that the property provides a better fit for the data, implying more complexity in the survival times of patients than would be expected under an exponential model.
Figure 6.
Plots for dataset #1.
Dataset #2. Next, we examine the COVID-19 dataset from Almetwally et al. [29], which consists of daily death rates over a 36-day period in Canada from 10 April to 15 May 2020 (see Figure 7). For this dataset, the test statistics are and , both of which exceed the critical values from Table 2 and Table 3. This leads us to reject the exponential property for this dataset as well, concluding that the data better fit the model. The departure from the exponential distribution in this case suggests that the daily death rates during this period exhibit more variability and structure than would be expected under an exponential assumption, which is common in life data analysis.
Figure 7.
Plots for dataset #2.
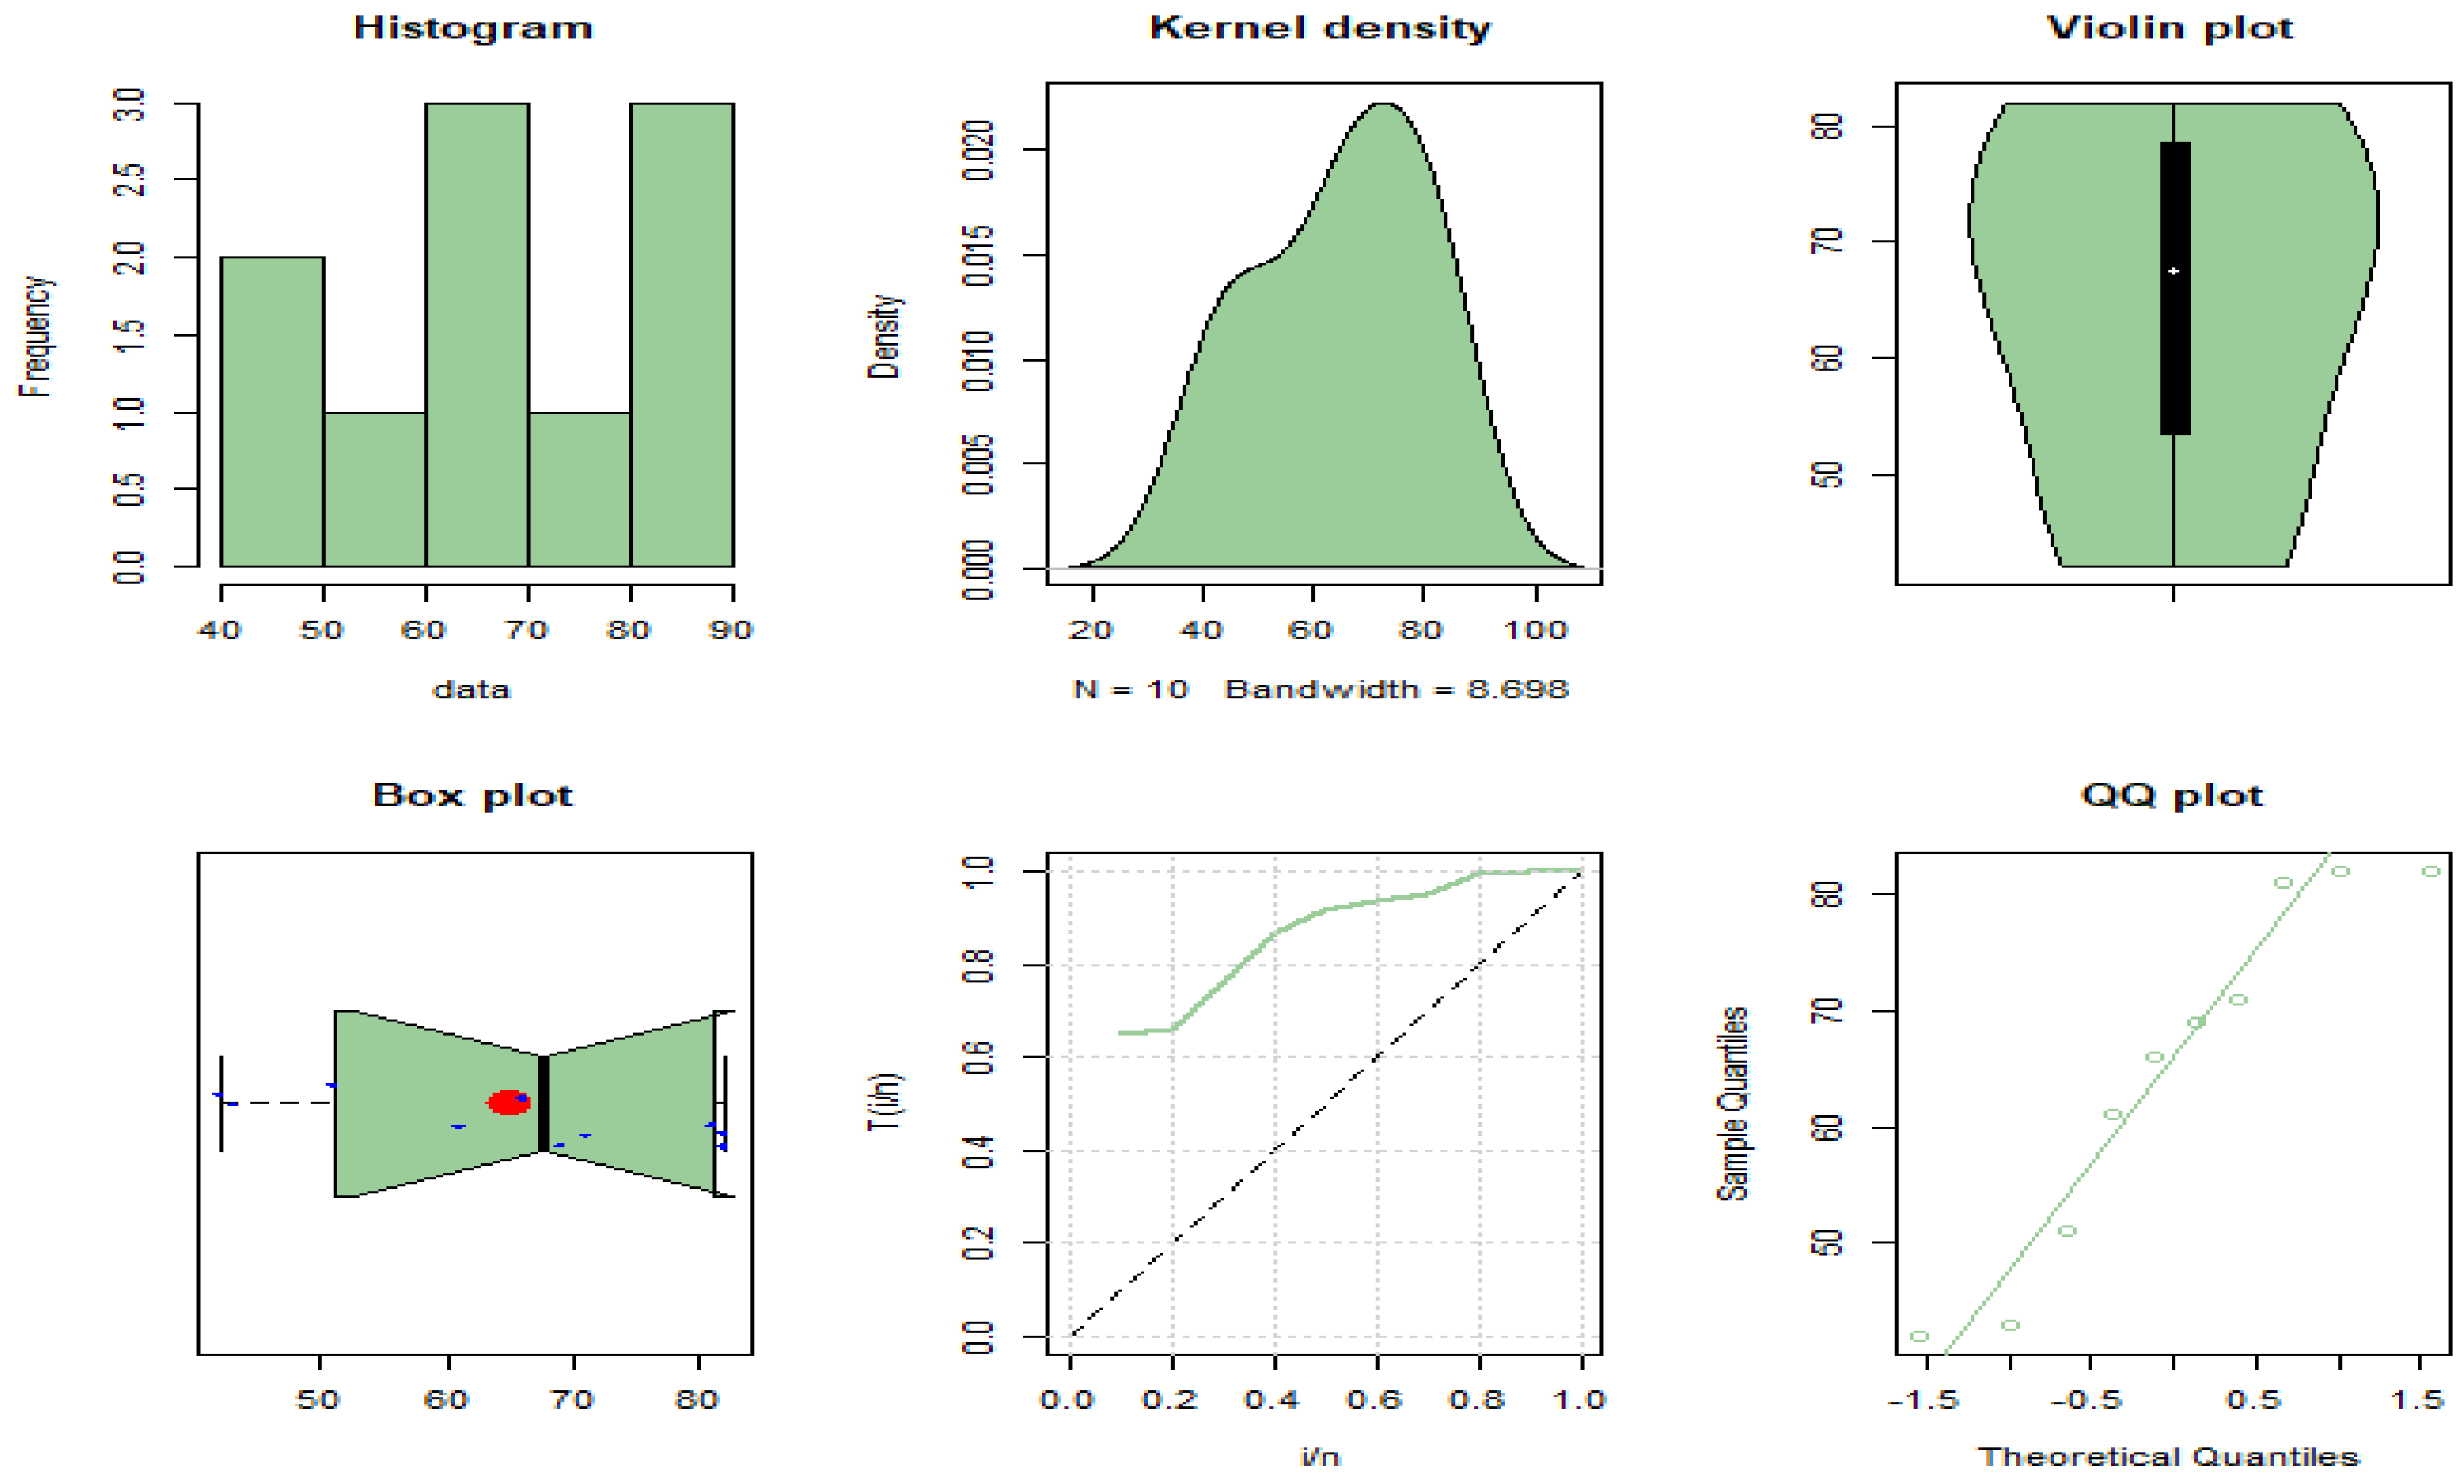
Dataset #3. Here, we analyze the data from Kochar [30], which includes the times to death of goldfish subjected to different doses of methyl mercury, collected in an experiment at Florida State University (see Figure 8). For this dataset, the test statistics are and . Both values exceed the critical values in Table 2 and Table 3, indicating that we can reject the exponential distribution hypothesis for these data. This finding suggests that the effects of methyl mercury poisoning on the fish’s lifespans follow the class, reflecting a non-exponential decay pattern in the time to death data.
Figure 8.
Plots for dataset #3.
Dataset #4. Censored data: The cyclophosphamide-treated lung cancer patients’ survival data.
By looking at the dataset from Kamran Abbas et al. [31], which included information on the survival periods of some patients receiving cyclophosphamide treatment for terminal lung cancer. Each of the thirty-three unedited and twenty-eight edited observations shows a patient whose therapy was discontinued due to a worsening condition. (see Figure 9).
Figure 9.
Plots for dataset #4.
It is easy to show that 0.0254953 is smaller than the critical value of Table 5. Then we cannot reject so the data are inconsistent with the property.
In summary, across all four datasets, our test successfully identifies the NBRUmgf property, demonstrating its applicability and effectiveness in real-world scenarios where the assumption of exponential life distributions does not hold.
6. Discussion and Conclusions
In this study, we applied a non-parametric goodness-of-fit technique to test the “new better than renewal used in moment generating function ordering” (NBRUmgf) class of life distributions, as defined by Hassan and Said [15] or Bakr et al. [16]. Our goal was to fill the existing gap in the literature by developing a non-parametric test that avoids the rigid assumptions of parametric models, thereby making it more flexible for real-world applications. The NBRUmgf class offers a more generalized approach to reliability analysis, and the proposed test was designed to assess how well the data conform to this class without relying on specific distributional assumptions.
Using Monte Carlo simulations, we derived critical values for both censored and uncensored data, which allowed us to evaluate the performance of the test across a range of sample sizes. The test power was assessed against well-known reliability distributions such as Weibull, Gamma, and linear failure rate (LFR) distributions. Our results demonstrate that the proposed test is effective at detecting deviations from the exponential distribution, which is a common assumption in reliability studies but often does not hold in complex systems.
The practical utility of the test was demonstrated by its application to real-world datasets, including medical data on leukemia patients, COVID-19 death rates, and experimental data on fish lifespans. These examples highlight the robustness and ability of the test to identify NBRUmgf in diverse scenarios. This addresses the need for more flexible tools in life data analysis, particularly when dealing with incomplete or censored data where parametric assumptions may not be appropriate.
However, our study has some limitations. Although the Monte Carlo-based critical values are reliable for large sample sizes, the test may perform less optimally in smaller samples or heavily censored datasets. Additionally, although the NBRUmgf class has proven to be a useful tool for modeling complex aging processes, further research is required to expand the applicability of the test to multivariate data or more specialized life distributions.
Future work could focus on improving the accuracy of the test for smaller sample sizes, potentially using bootstrap techniques or other resampling methods. Future studies may also explore comparisons with log-symmetric distributions, such as the log-normal and log-t, which can better accommodate data with positive support and symmetry.
Overall, this study provides a novel and versatile tool for life data analysis, addressing the gap in nonparametric goodness-of-fit testing for the NBRUmgf class. The proposed test offers a more flexible and reliable approach for identifying complex aging patterns in real-world data, where traditional parametric methods may fall short.
Author Contributions
Conceptualization, A.M.G. and M.E.B.; methodology, A.M.G., M.E.B. and A.A.E.-T.; software, A.A.E.-T.; validation, A.M.G., O.S.B. and A.A.E.-T.; formal analysis, A.A.E.-T.; investigation, A.M.G.; resources, M.E.B., and O.S.B.; data curation, A.A.E.-T.; writing—original draft preparation, A.A.E.-T.; writing—review and editing, A.M.G., and M.E.B.; visualization, M.E.B.; supervision, A.M.G. and M.E.B.; project administration, A.M.G. All authors have read and agreed to the published version of the manuscript.
Funding
This study was funded by Researchers Supporting Project number (RSPD2024R1004), King Saud University, Riyadh, Saudi Arabia.
Data Availability Statement
The data were mentioned along the paper.
Conflicts of Interest
The authors declare there is no conflict of interest.
Abbreviations
| IFR | Increasing failure rate. |
| IFR | Increasing failure rate average. |
| NBU | New is better than used. |
| NBUE | New is better than used in expectation. |
| HNBUE | Harmonic new is better than used in expectation. |
| NBUL | New is better than used in Laplace transform. |
| NBRU | New is better than renewal used. |
| NBRUmgf | New is better than renewal used in moment-generating functions. |
| RNBU | Renewal new is better than used. |
| NRBUE | New renewal is better than used in expectation. |
References
- Klefsjo, B. The HNBUE and HNWUE classes of life distribution. Naval Res. Logist. 1982, 29, 331–344. [Google Scholar] [CrossRef]
- Deshpande, J.V.; Kochar, S.C.; Singh, H. Aspects of positive aging. J. Appl. Probab. 1986, 23, 748–758. [Google Scholar] [CrossRef]
- Barlow, R.E.; Proschan, F. Statistical theory of reliability and life testing. In Probability Models; To Begin With: Silver Spring, MD, USA, 1981. [Google Scholar]
- Ahmad, I.A. Moments inequalities of aging families with hypotheses testing applications. J. Stat. Plan. Inference 2001, 92, 121–132. [Google Scholar] [CrossRef]
- Mahmoud, M.A.W.; Moshref, M.E.; Gadallah, A.M. On HNBUE class after specific age. J. Egypt. Math. Soc. 2013, 21, 82–87. [Google Scholar] [CrossRef]
- Mahmoud, M.A.W.; Hassan, E.M.A.; Gadallah, A.M. On NRBUL Class of Life Distributions. J. Egypt. Math. Soc. 2018, 26, 489–496. [Google Scholar] [CrossRef]
- Ghosh, S.; Mitra, M. A new test for exponentiality against HNBUE alternatives. Commun. Stat. Theor. Meth. 2020, 49, 27–43. [Google Scholar] [CrossRef]
- Bakr, M.E.; Golam Kibria, B.M.; Gadallah, A.M. A new non-parametric hypothesis testing with reliability analysis applications to model some real data. J. Radiat. Res. Appl. Sci. 2023, 16, 100724. [Google Scholar] [CrossRef]
- Navarro, J.; Pellerey, F. Preservation of ILR and IFR aging classes in sums of dependent random variables. Appl. Stoch. Models Bus. Ind. 2022, 38, 240–261. [Google Scholar] [CrossRef]
- Bakr, M.E. On basic life testing issues in medical research using non-parametric hypothesis testing. Qual. Reliab. Eng. Int. 2024, 40, 1002–1013. [Google Scholar] [CrossRef]
- Alqifari, H.; Eliwa, M.S.; Etman, W.B.H.; El-Morshedy, M.; Al-Essa, L.A.; EL-Sagheer, R.M. Reliability Class Testing and Hypothesis Specification: NBRULC–t° Characterizations with Applications for Medical and Engineering Data Modeling. Axioms 2023, 12, 414. [Google Scholar] [CrossRef]
- EL-Sagheer, R.M.; Abu-Youssef, S.E.; Sadek, A.; Omar, K.M.; Etman, W.B.H. Characterizations and testing NBRUL class of life distributions based on Laplace transform technique. J. Stat. Appl. Probab. 2022, 11, 1–14. [Google Scholar]
- Song, L.-K.; Li, X.-Q.; Zhu, S.-P.; Choy, Y.-S. Cascade ensemble learning for multi-level reliability evaluation. Aerosp. Sci. Technol. 2024, 148, 109101. [Google Scholar] [CrossRef]
- Morais, C.; Estrada-Lugo, H.D.; Tolo, S.; Jacques, T.; Moura, R.; Beer, M.; Patelli, E. Robust data-driven human reliability analysis using credal networks. Reliab. Eng. Syst. Saf. 2022, 218, 107990. [Google Scholar] [CrossRef]
- Hassan, E.M.A.; Said, M.M. A New Class of Life Distributions Based on Moment Inequalities. Asian J. Probab. Stat. 2021, 13, 47–57. [Google Scholar] [CrossRef]
- Bakr, M.E.; El-Atfy, E.S.; Oluwafemi Samson Balogun Tashkandy, Y.A.; Gadallah, A.M. Statistical Insights: Analyzing Shock Models, Reliability Operations and Testing Exponentiality for NBRUmgf Class of Life Distributions. Eksploat. Niezawodn. Maint. Reliab. 2024, 26. [Google Scholar] [CrossRef]
- Ahmad, I.A.; Alwasel, I.A.; Mugdadi, A.R. A goodness of fit approach to major life testing problems. Int. Reliab. Appl. 2001, 2, 81–97. [Google Scholar]
- Mahmoud, M.A.W.; Diab, L.S.; Radi, D.M. Testing Exponentiality Against RNBUL Class of Life Distribution Based on Goodness of Fit. J. Stat. Appl. Probab 2019, 8, 57–66. [Google Scholar] [CrossRef]
- Etman, W.B.; El-Morshedy, M.; Eliwa, M.S.; Almohaimeed, A.; EL-Sagheer, R.M. A New Reliability Class-Test Statistic for Life Distributions under Convolution, Mixture and Homogeneous Shock Model: Characterizations and Applications in Engineering and Medical Fields. Axioms 2023, 12, 331. [Google Scholar] [CrossRef]
- Tang, J.; Li, X.; Fu, C.; Liu, H.; Cao, L.; Mi, C.; Yu, J.; Yao, Q. A possibility-based solution framework for interval uncertainty-based design optimization. Appl. Math. Model. 2024, 125, 649–667. [Google Scholar] [CrossRef]
- Perez-Guagnelli, E.; Jones, J.; Damian, D.D. Hyperelastic Membrane Actuators: Analysis of Toroidal and Helical Multifunctional Configurations. Cyborg Bionic Syst. 2022, 2022, 9786864. [Google Scholar] [CrossRef]
- Liu, D.; Liu, X.; Chen, Z.; Zuo, Z.; Tang, X.; Huang, Q.; Arai, T. Magnetically Driven Soft Continuum Microrobot for Intravascular Operations in Microscale. Cyborg Bionic Syst. 2022, 2022, 9850832. [Google Scholar] [CrossRef] [PubMed]
- Luo, J.; Ahmad, S.F.; Alyaemeni, A.; Ou, Y.; Irshad, M.; Alyafi-Alzahri, R.; Unnisa, S.T. Role of perceived ease of use, usefulness, and financial strength on the adoption of health information systems: The moderating role of hospital size. Humanit. Soc. Sci. Commun. 2024, 11, 516. [Google Scholar] [CrossRef]
- Li, J.; Li, J.; Wang, C.; Verbeek, F.J.; Schultz, T.; Liu, H. Outlier detection using iterative adaptive mini-minimum spanning tree generation with applications on medical data. Front. Physiol. 2023, 14, 1–12. [Google Scholar] [CrossRef]
- Liu, S.; Han, W.; Zhang, Z.; Chan, F.T.S. An analysis of performance, pricing, and coordination in a supply chain with cloud services: The impact of data security. Comput. Ind. Eng. 2024, 192, 110237. [Google Scholar] [CrossRef]
- Vanegas, L.H.; Paula, G.A. Log-symmetric distributions: Statistical properties and parameter estimation. Braz. J. Probab. Stat. 2016, 30, 196–220. [Google Scholar] [CrossRef]
- Morán-Vásquez, R.A.; Ferrari, S.L.P. Box-Cox elliptical distributions with application. Metrika 2018, 82, 547–571. [Google Scholar] [CrossRef]
- Abouammoh, A.M.; Abdulghani, S.A.; Qamber, I.S. On partial rderings and testing of new better than used classes. Reliab. Eng. Syst. Saf. 1994, 43, 37–41. [Google Scholar] [CrossRef]
- Almetwally, E.M.; Alharbi, R.; Alnagar, D.; Hafez, E.H. A new inverted topp-leone distribution: Applications to the COVID-19 mortality rate in two different countries. Axioms 2021, 10, 25. [Google Scholar] [CrossRef]
- Kocher, S.C. Testing exponentiality against monotone failure rate average. Comm. Stat. Theor. Meth. 1985, 14, 381–392. [Google Scholar] [CrossRef]
- Abbas, K.; Hussain, Z.; Rashid, N.; Ali, A.; Taj, M.; Khan, S.A.; Manzoor, S.; Khalil, U.; Khan, D.M. Bayesian Estimation of Gumbel Type-II Distribution under Type-II Censoring with Medical Applications. J. Comput. Math. Methods Med. 2020, 2020, 1876073. [Google Scholar] [CrossRef]
Disclaimer/Publisher’s Note: The statements, opinions and data contained in all publications are solely those of the individual author(s) and contributor(s) and not of MDPI and/or the editor(s). MDPI and/or the editor(s) disclaim responsibility for any injury to people or property resulting from any ideas, methods, instructions or products referred to in the content. |
© 2024 by the authors. Licensee MDPI, Basel, Switzerland. This article is an open access article distributed under the terms and conditions of the Creative Commons Attribution (CC BY) license (https://creativecommons.org/licenses/by/4.0/).