Abstract
This study investigates gender-based differences in the satisfaction ranking of riders on real-time crowdsourcing logistics platforms, using online reviews from the Ele.me platform. Quantitative methods, including the frequency ratio-based Analytic Hierarchy Process (AHP), probabilistic linguistic term sets (PLTS), and fuzzy comprehensive evaluation (FCE), were applied to analyze satisfaction differences between men and women riders. The findings reveal an asymmetric pattern in satisfaction preferences: women riders place more emphasis on perceived value, while men riders prioritize service perceived quality. Although both groups rank platform image, product perceived quality, and rider expectations similarly, the importance of these factors varies significantly, indicating an underlying asymmetry in their expectations and values. Women riders express higher satisfaction with platform image, rider expectations, service perceived quality, and product perceived quality, with rider expectations showing the largest difference. Additionally, the multi-criteria decision-making methods used in this study offer insights for optimizing service performance in real-time crowdsourcing logistics platforms, particularly in handling uncertainty and enhancing system adaptability through fuzzy sets. These findings provide a basis for developing gender-specific strategies aimed at enhancing rider satisfaction, minimizing turnover, and improving platform adaptability—contributing to a more inclusive and sustainable logistics supply chain.
1. Introduction
The real-time crowdsourcing logistics platform (RTCLP) has become the dominant operational model of last mile delivery in the real-time logistics (RTL) industry [1]. According to the Research Report on China’s Real-time Logistics Industry in 2024 (“Shanghai IResearch Market Consulting Co., LTD. 2024. China real-time logistics industry research report”. https://www.iresearch.com.cn (accessed on 21 October 2024).), the RTL industry reached a market size of over 3.4 trillion yuan, serving 530 million users with the compound annual growth rate reached 23.9% over five years. The COVID-19 pandemic further underscored the importance of RTL services in urban deliveries, providing essential goods to residents. However, the surge in orders exposed challenges within RTCLPs, such as low rider engagement and insufficient platform management adaptability [2,3,4]. Roland Berger: Report on the Impact of the Epidemic on China’s Transportation and Logistics Industry (“Roland Berger: Report on the Impact of the Epidemic on China’s Transportation and Logistics Industry” https://www.sohu.com/a/416555646_757817 (accessed on 5 September 2020).) pointed out that the explosion of order volume revealed a lack of rider engagement and platform management adaptability.
As one of the main application scenarios of RTCLP, the online-to-offline (O2O) takeaway industry provides abundant employment opportunities for freelancers, and real-time crowdsourcing logistics (RTCL) riders have gradually become the career choice for many freelancers. Flexible working hours are the most compelling motivation for attracting freelancers to become RTCL riders [5,6], and the most distinctive feature of the gig economy. According to the 2023 Ele.me Rider Rights Protection Report, there were over 4 million active riders on the Ele.me platform whose name means “Are you hungry?” (one of the largest online food ordering apps in China), with women accounting for 7.5% of the total (“2023 Report on the Assurance of Rights and Interests for Ele.me Riders” https://mp.weixin.qq.com/s/zHvYOhTa19ogm3ZO0RGwGA (accessed on 21 October 2024).). While women riders represent a smaller portion of the overall workforce, Ele.me has taken steps to support their needs by establishing organizations such as the “Ele.me Blue Rose Women’s Federation”. This initiative provides women riders with health support and educational benefits for their children, reflecting the platform’s commitment to improving working conditions for women riders (“Ele.me Establishes the ‘Blue Rose Women’s Federation” https://news.sohu.com/a/808459157_362225 (accessed on 21 October 2024).).
However, behind the 4 million riders, there lies a profound career crisis. As a giant in the takeaway industry, the “Ele.me” platform has many problems in employment. In September 2020, the article Takeaway Riders, Trapped in the System (“Takeaway Riders, Trapped in the System” https://epaper.gmw.cn/wzb/html/2020-09/12/nw.D110000wzb_20200912_1-01.htm (accessed on 21 September 2020).) showed that the algorithm and data of the “Ele.me” platform have turned riders into a high-risk occupation. Women riders face distinct challenges compared to their male counterparts, especially under algorithm-driven management systems, where issues such as time management, work pressure, and operational procedures differ significantly [7,8]. While Ele.me has set up women’s associations to address some of these issues, the specific needs of women riders may still be overlooked in the broader system design.
RTCL riders play a crucial role as the link between the “Ele.me” platform, merchants, and consumers, bearing the responsibility of delivering goods to consumers. Despite this critical role, they are often overlooked and face greater challenges compared to better-supported dedicated riders. However, RTCL riders are a disadvantaged group easily overlooked, different from the relatively well-treated special riders. Conflicts between the “Ele.me” platform’s excessive pursuit of efficiency and profit maximization and consideration of social responsibility and ethical boundaries [9] have resulted in RTCL riders being “trapped in the system”. Problems in time control, capacity allocation, and in-transit order matching [5] reduce the RTCL rider’s perception of freedom. In July 2021, the Guiding Opinions on Implementing the Responsibilities of the Online Food Ordering Platform and Effectively Safeguarding the Rights and Interests of Takeout Riders (“Guiding Opinions on Implementing the Responsibilities of Online food ordering platform and Effectively Safeguarding the Rights and Interests of takeout riders” http://www.yudu.gov.cn/ydxxxgk/c100264enh/202107/7bf568f9c16b4d56be2541816588d95a.shtml (accessed on 28 July 2021).) unequivocally stated that it is necessary to establish and improve the coordination mechanism for the protection of riders’ rights and interests, effectively resolve the contradictions of various subjects, implement the social responsibility of the O2O takeout platform, and protect the legitimate rights and interests of riders.
As gig workers, RTCL riders have diverse needs. To meet their diverse needs and improve their job satisfaction [10], so that they can continue to participate in the RTCL industry, is an urgent problem which needs to be solved [11]. However, the existing literature only studies the RTCL rider’s satisfaction with takeaway stakeholders from the perspective of RTCL riders [12], and has not studied the satisfaction of RTCL riders from the perspective of gender differences. Such gender-based differences often exhibit significant asymmetries, as men and women riders may have different expectations, motivations, and value priorities in their work experiences. These asymmetric preferences can lead to divergent satisfaction levels even under similar working conditions, which highlights the need for a nuanced understanding of gender-specific needs. Although women riders make up only 7.5% of the total workforce, their job satisfaction priorities differ markedly from those of men riders. Addressing these gender-based disparities in work experiences is critical for platforms to tailor management strategies that reduce turnover rates and enhance overall rider satisfaction. “Gender equality and women empowerment” is at the heart of the UN’s 2030 Agenda for Sustainable Development (“l Gender equality and women’s empowerment”, https://sdgs.un.org/topics/gender-equality-and-womens-empowerment (accessed on 21 September 2020)). Women’s participation makes societies more resilient and economies more dynamic. Digital platforms have created favorable conditions for women’s equal employment, enabling women to acquire more opportunities to achieve spiritual independence and self-worth.
Therefore, this study aims to analyze the asymmetric differences in the need’s importance and satisfaction of men and women RTCL riders on the “Ele.me” platform, highlighting the significant role that gender plays in shaping these asymmetries. Specifically, the study seeks to understand how men and women riders prioritize different aspects of their work environment, reflecting broader social and psychological asymmetries in their job expectations and values. Understanding these asymmetric differences can enhance the work experience of riders, reduce turnover, and improve workforce stability on the platform. By acknowledging and addressing these asymmetries, platforms can develop targeted strategies that cater to the distinct needs of men and women riders, ultimately improving operational efficiency and contributing to a more sustainable and inclusive logistics supply chain. High turnover rates increase training costs, reduce delivery efficiency, and potentially lead to higher carbon emissions. Addressing gender-specific asymmetries can help mitigate these issues, leading to a more stable, sustainable, and adaptable workforce.
This study relies solely on data from Ele.me, one of China’s largest real-time crowdsourced logistics providers, due to data privacy limitations. Ele.me’s extensive reach, and operational similarities with other platforms make it a reliable case for examining rider satisfaction and gender-based satisfaction differences within the real-time logistics industry. The rest of this article is organized as follows: Section 2 reviews the related literature on RTL and RTCL riders. Section 3 introduces basic methods for evaluating RTCL riders’ satisfaction. Section 4 analyzes the satisfaction of woman and man RTCL riders on the “Ele.me” platform empirically. Section 5 discusses the differences in satisfaction and the ranking of satisfaction of woman and man RTCL riders. Finally, we describe the conclusions and prospects in Section 6.
2. Literature Review
As a critical organizational model in real-time crowdsourced logistics (RTCL), RTCL platforms (RTCLP) offer freelancers a wide range of income opportunities [12]. However, with its low-barrier access, RTCLP experiences several challenges. Zhang et al., (2022) and Govindan and Chaudhuri (2016) identified that the crowdsourcing model can lead to complications such as unclear responsibility allocation, delivery delays, and increased traffic risks, issues in which RTCL riders play a central role [2,13]. Research focusing specifically on RTCL rider management is scarce, with existing literature primarily examining the factors influencing riders’ platform participation, particularly monetary and non-monetary incentives. Studies have demonstrated that riders are highly sensitive to wage levels, often choosing platforms based on competitive pricing strategies [14,15,16,17]. For instance, Wang and Xie (2021) noted that dynamic pricing strategies not only attract more freelancers but also help balance supply and demand on these platforms [14]. This finding highlights the necessity for platform operators to establish competitive pricing mechanisms to maintain rider engagement and satisfaction, as riders tend to gravitate toward platforms offering superior financial incentives [17].
Beyond monetary incentives, non-monetary factors significantly impact riders’ satisfaction with logistics platforms. For instance, job flexibility and a supportive work environment have been shown to strongly influence rider satisfaction and loyalty [7,12,18]. Researchers emphasize the importance of psychological factors, such as the appeal of novelty and intrinsic enjoyment from performing tasks, which shape riders’ willingness to participate in crowdsourced logistics. This suggests that platforms should complement financial incentives with an engaging, supportive work environment that fulfills riders’ psychological needs [4,6,7].
Moreover, rider satisfaction is closely linked to platform service quality, availability of training, and security provisions. Zhang et al., (2022) studied RTCL rider satisfaction, identifying critical factors such as training access, insurance, and overall platform service quality [12]. Conversely, dissatisfaction is often rooted in delayed feedback and order mismatches, emphasizing the importance of timely communication and operational efficiency in enhancing rider satisfaction. Interactions among riders, platform representatives, and customers also significantly influence overall satisfaction, indicating that a comprehensive approach to rider engagement is vital for platform success [6,19].
The European Customer Satisfaction Index (ECSI) model has been extensively applied in various cultural and regional contexts, including Asia. Research indicates that ECSI’s multi-dimensional framework—which incorporates corporate image, customer expectations, product and service quality, and perceived value—effectively captures the core factors influencing satisfaction across diverse markets [20]. In China, for example, several studies have successfully applied ECSI to measure customer satisfaction in various service industries, confirming its adaptability and relevance in Asian cultural settings [21,22]. Given that real-time crowdsourcing logistics riders on the Ele.me platform occupy a unique position similar to consumers, applying the ECSI model allows us to systematically evaluate the multiple dimensions of rider satisfaction.
Quantitative methods such as the Analytic Hierarchy Process (AHP), Probabilistic Linguistic Term Sets (PLTS), and Fuzzy Comprehensive Evaluation (FCE) have become instrumental in gender-specific satisfaction studies, especially for handling subjective data and addressing ambiguity [23]. In fields like business, psychology, and social science, these approaches have been validated as effective for complex satisfaction and gender analyses [20,24,25,26,27]. AHP’s hierarchical weighting structure enables researchers to quantify factors that drive satisfaction and reveal gender-based priorities in satisfaction [25,28]. PLTS further enhances this analysis by addressing linguistic uncertainty, making it ideal for examining gender satisfaction across diverse cultural contexts [29,30,31,32]. FCE, which uses fuzzy logic, is particularly suited for high-uncertainty scenarios, enabling refined assessments of educational and behavioral differences [33]. Together, AHP, PLTS, and FCE provide a robust framework for multidimensional gender and satisfaction research [20]. This study utilizes these tools to analyze gendered satisfaction differences among riders, offering strategic insights to inform gender-specific platform improvements.
The above study provides an important reference for this paper, but no study has been found that focuses on woman rider satisfaction or riders’ gender differences. Existing literature primarily uses questionnaires, interviews, and machine learning to study RTCL riders’ satisfaction, but lacks quantitative analysis of the factors influencing their satisfaction. This paper applies the quantitative decision-making method proposed by Liang et al., (2020) to rank the needs of women and men riders on the ‘Ele.me’ platform and evaluate their satisfaction. This is the first application of this method in the field of RTL. Specifically, we first classify the rider reviews based on the gender prediction method of the gender classification dictionary for subsequent analysis of online reviews. Secondly, the European customer satisfaction index (ECSI) model is used to construct the impact index of rider satisfaction. Then, the research calculates the comprehensive weight of each satisfaction factor using the frequency ratio-based Analytic Hierarchy Process (Freq-AHP) and probabilistic linguistic term sets (PLTSs), providing a precise ranking of men’s and women’s needs on the platform. Finally, the Fuzzy Comprehensive Evaluation (FCE) method enables an in-depth analysis of rider satisfaction based on these weighted factors, offering insights into gender-based satisfaction differences. The research framework is shown in Figure 1.
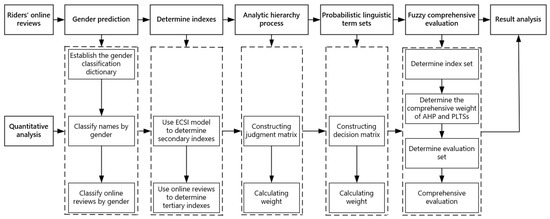
Figure 1.
Research framework.
3. Methodology
In this study, we first used the gender classification dictionary to identify the real-time crowdsourcing rider’s gender, and then applied Freq-AHP and PLTSs to analyze the real-time crowdsourcing rider’s satisfaction. Next, we briefly review the basic concepts of AHP and PLTSs.
3.1. Basic Methods for Analyzing RTCL Riders’ Satisfaction
The process of evaluating riders’ job satisfaction can be divided into three parts. First, the gender of riders is predicted based on their real names. Second, under the ECSI model framework, the Content Analysis Method is used to construct riders’ job satisfaction index system. Third, Fuzzy Comprehensive Evaluation (FCE) is used to evaluate riders’ job satisfaction.
3.1.1. Gender Prediction
In this study, we adopt the name-centered gender prediction method to predict the gender of RTCL riders for their usernames are real names on the “Ele.me” platform. First, according to the names of RTCL riders, we invite 15 professionals (including 5 “Ele.me” platform middle managers, 5 RTCL riders, and 5 scholars) to make a gender classification dictionary. For example, names containing “Hui” are woman names, and those containing “Gang” are man names. Second, to be more accurate, we only keep the names of women and men riders that were agreed upon by 15 professionals and discard ambiguous names.
This study utilized Gender API and NamSor for name-based gender prediction, tools known for their high accuracy rates, specifically within datasets dominated by Chinese-language names [34,35]. To ensure accuracy, we retained only names with 100% agreement and discarded ambiguous cases. To further enhance reliability, we employed Gender API and NamSor for validation. These tools are widely recognized for their robust accuracy rates in datasets with predominantly Chinese-language names. We performed repeated validations, confirming an accuracy range of approximately 90–95%, demonstrating reliable performance in this context. This dual-method approach-combining expert consensus with high-accuracy algorithmic tools-enabled a comprehensive and reliable gender prediction framework, mitigating potential bias inherent in name-based classification.
3.1.2. Analytic Hierarchy Process (AHP)
AHP is widely used in multi-criteria decision-making problems [25]. Its systematic characteristics are widely welcomed by researchers. In this study, AHP is used to calculate the weight of different indexes. According to the general goal and decision-making plan, the basic framework of AHP can divide the problem into three: the target layer, the criteria layer and the scheme layer [20]. The target layer refers to the decision-making problem to be solved. The criteria layer is the link between the target layer and the scheme layer. The scheme layer contains various alternatives which are selected to achieve the target.
Firstly, we establish the corresponding hierarchical structure. The target layer represents the RTCL riders’ satisfaction. The criteria layer and the scheme layer represent the secondary and tertiary indexes that affect RTCL riders’ satisfaction respectively. Secondly, according to the comparison results of the same level of importance, we construct the judgment matrix , where > 0, = 1, . In this study, in order to evaluate RTCL riders’ satisfaction, we used the frequency ratio proposed by Liang et al., (2020) to construct the judgment matrix [20]. The frequency ratio based on how often different indexes show up in online reviews, is very different from experts’ subjective assessments. This greatly improves the objectivity of the weights of different indexes. Thirdly, after constructing the judgment matrix, we calculate its maximum eigenvalue and its corresponding feature vector w. In order to guarantee the consistency of indexes’ importance, we did a consistency test and found the consistency index CI:
where n is the dimension of the judgment matrix A. In this paper, n means the number of the secondary indexes affecting the RTCL riders’ satisfaction. The closer the CI is to 0, the more consistent it is, and when CI = 0, there is complete consistency. Then, the CI value is measured based on the average random consistency index RI [25] (RI values are shown in Table 1).

Table 1.
The value of random consistency index RI.
Finally, we calculate the consistency ratio CR as follows:
It is generally believed that when CR < 0.1, the judgment matrix passes the consistency test, and when CR = 0, the judgment matrix has the strongest consistency.
To enhance the model’s robustness and reduce potential overfitting, we applied a k-fold cross-validation approach (k = 5) across the current dataset [36,37]. This method allowed us to evaluate the model’s performance on different data subsets, ensuring a more generalized fit. The cross-validation results were consistent, suggesting that the model performs reliably across various splits of the dataset.
3.1.3. Probabilistic Linguistic Term Sets (PLTSs)
In reality, the proportional information of linguistic terms may be incomplete [32], which makes the expression of linguistic information preferences uncertain [21]. As a new information description tool for uncertain decision-making, PLTSs contain linguistic information and probabilistic information about linguistic terms. They can handle the incomplete probabilistic information about linguistic terms by extending the linguistic distribution model [38,39] to more accurately reflect the degree of hesitation of decision makers. PLTSs are defined as follows:
Definition 1
[21]. Let be a linguistic term set, PLTSs are defined as follows:
where is the linguistic term of the decision maker, is the probability of the linguistic term , is the number of distinct linguistic terms in . In this paper, represents all evaluation levels of an index, is the probability corresponding to each evaluation level , and #L(p) represents the number of evaluation levels [20]. Let and be two PLTSs, if , we will add linguistic terms to so that the numbers of linguistic terms in and are identical. The added linguistic terms are the smallest ones in , and its probabilities are zero [21].
Definition 2.
If, then we normalize this PLTSs:
The linguistic terms are arranged in descending order. Then according to the maximum deviation method proposed by Pang et al. (2016), we define the deviation degree of a PLTS [21] as follows:
where, and are two PLTSs, and . In this paper, and are the subscripts of linguistic term sets and respectively, indicating the evaluation level from “Very unsatisfied” to “Very satisfied”. For the RTCL riders’ satisfaction, under the attribute , the deviation of all secondary indexes relative to other secondary indexes under the same primary index can be given as follows:
where represents the deviation degree between two PLTSs.
(6) indicates the sum of the deviations of all secondary indexes relative to other secondary indexes under the same primary index. The sum of the deviations between all attributes is expressed as follows:
In order to calculate the attribute weight vector, we construct the following single-objective optimization model to obtain a deviation degree as large as possible:
Then, we use the Lagrange function to solve (9):
where is the Lagrange parameter. By calculating the partial derivatives with respect to and , we can obtain the optimal weight vector:
obviously, j = 1, 2, ..., n. By normalizing , we get:
3.2. RTCL Riders’ Satisfaction Evaluation System
3.2.1. ECSI Model
The European customer satisfaction index (ECSI) [40], established by the European Quality Organization (EQO) and the European Foundation for Quality Management (EFQM) [41] is a structural equation model with unobservable latent variables. The ECSI model takes corporate image, customer expectation, product perceived quality, service perceived quality and perceived value as the dependent variables of customer satisfaction, and customer loyalty as the outcome variable of customer satisfaction [20]. The ECSI model is a relatively mature tool for evaluating customer satisfaction [42]. Its comprehensive and profound characteristics in evaluating customer satisfaction make it used in many countries to evaluate customer satisfaction to improve product and service quality. As Nan Cunhui, chairman of Chint Group, said: “We have two gods; one is the customer and the other is the employee. Both should be treated kindly”. As a special customer enjoying the products and services of the RTCLP, the RTCL riders have the same important position as the consumer. Therefore, this paper adopts the ECSI model to construct the RTCL riders’ satisfaction impact index for the “Ele.me” platform. The ECSI model is shown in Figure 2.
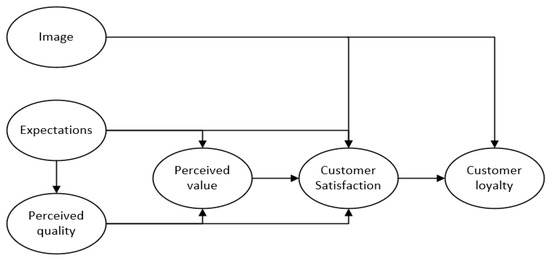
Figure 2.
ECSI model [43].
3.2.2. Freq-AHP
In order to avoid the subjectivity of expert evaluation in traditional AHP, this paper constructs a judgment matrix based on the frequency of each index in online reviews [20]. The calculation process is as follows:
Firstly, we calculate the frequency vector of all indexes.
Secondly, we construct the judgment matrix A:
where = 1, , and .
Thirdly, we use Equations (1) and (2) to measure the consistency of the judgment matrix A. If CR < 0.1, then we normalize the judgment matrix by column:
where .
Fourth, we evaluate the geometric mean of each row of matrix B:
Thus, we get the Freq-AHP weight vector.
Freq-AHP greatly improves the objectivity of weights by constructing the judgment matrix through index frequency ratio. But the disadvantage is also obvious, that is, it cannot show the relative importance between indexes. Therefore, we combine PLTSs with Freq-AHP to calculate the comprehensive weight of indexes to mend its defects in calculating the relative importance between indexes.
3.2.3. PLTSs
The incomplete probabilistic information of online reviews posted by RTCL riders makes it difficult to describe the relative importance between different indexes. As an emerging weight calculation method, PLTSs’ maximum deviation method can handle such cases well. To calculate the PLTSs’ weights, first, we construct the frequency matrix H of RTCL riders online reviews. The frequency matrix H is shown as follows [20]:
where n is the number of indexes, m is the number of review levels, and is the frequency of the jth review level for index i. Then we normalize the frequency matrix to get the matrix P, and P is shown as follows:
Then, we use Equation (5) to calculate the deviation degree between different secondary indexes relative to other secondary indexes under the same primary index under the attribute , and use Equations (6) and (7) to calculate the sum of the deviation’s degree between different secondary indexes, and the sum of the deviations between all attributes. Then, we use Equations (10) and (11) to calculate and normalize the weight vector of PLTSs.
Freq-AHP cannot show the relative importance between indexes, and the number of reviews of different indexes with similar weights calculated by PLTSs may also be different [20]. Therefore, this paper combines the two methods to calculate the indexes’ comprehensive weight vector [38]. The formula is as follows:
where is the weight calculated by PLTSs, is the proportion of the weight obtained by PLTSs, is the weight obtained by Freq-AHP, and is the proportion of the weight obtained by Freq-AHP. Without loss of generality, v takes the value 0.5 [44].
3.2.4. FCE
The Fuzzy Comprehensive Evaluation Method [45] is a comprehensive evaluation method based on fuzzy mathematics. According to the membership degree theory of fuzzy mathematics, it quantitatively evaluates things subject to many factors and is suitable for solving fuzzy problems. Four steps are required to use the fuzzy comprehensive evaluation method [14].
Firstly, we need to determine the evaluation index set , where , where n is the number of indexes. The evaluation index set, , is the secondary index that affects the RTCL riders’ satisfaction. Each secondary index contains a different number of tertiary indexes.
Secondly, we should establish an evaluation set , , where m is the number of evaluation levels. In this paper, the evaluation level contains “very unsatisfied, unsatisfied, general, satisfied, very satisfied”.
Thirdly, we ought to figure out the weight of each evaluation index in the evaluation index set . and use the comprehensive weight method of Equation (17) to figure out the index weight that affects the RTCL riders’ satisfaction.
Fourthly, we have to construct a comprehensive evaluation matrix. We first construct the evaluation vector of the evaluation set corresponding to each index , and then build the comprehensive evaluation matrix R of the RTCL riders. The comprehensive evaluation matrix is as follows:
where represents the membership degree of the evaluation index belonging to evaluation .
Finally, the results of the RTCL riders’ satisfaction evaluation are expressed as follows:
where w represents the weighted average operator, its choice depends on the specific situation.
The membership degrees of an evaluation index, Ui belonging to multiple evaluation levels are sometimes very close. In this case, it’s inaccurate to obtain the satisfaction evaluation conclusion by using the maximum membership degree principle. Therefore, based on the results of Ref. [20], we use the maximum membership principle in conjunction with the weighted average principle. The weighted average principle calculates the satisfaction score as,
where is the corresponding satisfaction score at different evaluation levels. u(vi) is equal to (20, 40, 60, 80, 100) in this study [33].
4. Empirical Study
In this section, this paper evaluats riders’ job satisfaction based on the methodological framework proposed in Section 3. First, introduce data collection and preprocessing. Second, construct riders’ job satisfaction evaluation system based on the ECSI model. Third, use Freq-AHP and PLTS proposed in Section 3 to calculate the index weights. Finally, use the comprehensive weight to evaluate the job satisfaction of women and men riders.
4.1. Data Collection and Preprocessing
Ele.me and Meituan are the two largest O2O takeaway platforms in China, and their market share exceeds 90% of China’s takeaway market. Relevant information (“Gender equality and women’s empowerment” https://baijiahao.baidu.com/s?id=1594344770944521799&wfr=spider&for=pc (accessed on 5 June 2021). “2017–2018 Research Report on China’s Online Food Delivery Market”. https://www.iimedia.cn/c400/60449.html (accessed on 3 November 2024). “Analysis of the Market Size and Competitive Landscape of China’s Food Delivery Industry in 2021: Two Major Advantages of Douyin Entering the Food Delivery Market”. https://bg.qianzhan.com/report/detail/300/211223-4098960b.html (accessed on 3 November 2024).) shows that the market share of “Ele.me” in the fourth quarter of 2017 accounted for 55.3%, and “Meituan” 41.3%. By the first quarter of 2021, the market share of “Meituan” reached 67.3%, while “Ele.me” fell to 26.9%, descennding to the second largest in the industry. The sharp decline in Eleme’s market share is closely related to the loss of riders. To explore the causes, this paper looks at RTCL riders’ satisfaction on the “Ele.me” platform by analyzing online reviews.
Different from the data sources of previous online review studies, the data for this study comes from the online review data of the “Rider community” on the “Ele.me” platform, rather than the user reviews on the Appstore. The data collection format is shown in Table 2. The RTCL riders’ online reviews provided by the official platform are not only standardized and objective, but also reflect the increasing attention paid to the needs of RTCL riders by the “Ele.me” platform.
Table 2.
Crowdsourcing riders’ format example of online reviews data.
The online reviews selected for this study include review content, review time, and review likes. After removing the duplicated data and irrelevant data in the original data, we use the gender prediction method proposed in Section 3 to classify online reviews by gender of RTCL riders. A total of 446 women rider reviews and 927 men rider reviews were obtained. The specific information is shown in Table 3. From Table 3, it can be seen that 1373 online reviews correspond to 8438 likes, and a high number of likes indicates that the online reviews are representative. Moreover, on the one hand, according to the 2023 Ele.me Rider Rights Protection Report, the proportion of women riders on the “Ele.me” platform is only 7.5% (“Ele.me Establishes the ‘Blue Rose Women’s Federation”, https://news.sohu.com/a/808459157_362225 (accessed on 21 October 2024)), but the data in Table 3 show that the number of reviews made by women riders has reached half of the reviews made by men riders. This reflects the improvement of women riders’ awareness of right safeguarding, which is progress on gender equality trends. On the other hand, the number of men riders are more than 12 times as many as that of women riders, which reflects those men riders, as the leading participants in the RTCL service of the “Ele.me” platform, have a deeper understanding of the RTCL service of the platform, and their needs are more likely to resonate with the rider group.
Table 3.
Online reviews data statistics.
This study collects in-depth interview data from riders, aimed at providing a more comprehensive understanding of satisfaction factors including platform image (), rider expectations (), service perceived quality (), product perceived quality (), and perceived value (). Open-ended responses in these interviews are expected to reveal detailed perceptions that complement the insights obtained from online reviews. By incorporating interview data, this study aims to enhance the understanding of insights gained from review data, allowing for a richer, more nuanced perspective on satisfaction factors. Preliminary analysis indicates that the results from interviews are largely consistent with those derived from review data, which strengthens the reliability of our findings on rider satisfaction.
To address potential biases in online review data, this study applied several data-cleaning techniques to ensure data reliability. First, removed outliers by filtering comments with extremely high or low ratings. Then used time-balanced sampling to distribute reviews evenly across the study period, minimizing the impact of temporary events. Finally, conducted sentiment analysis to identify and adjust for emotionally extreme reviews. These steps helped to reduce selective reporting bias and ensure a more representative dataset.
4.2. Determination of Indexes
In this study, the RTCL riders’ satisfaction evaluation index is established based on the ECSI model. Firstly, we identify the primary index as “RTCL Riders Satisfaction (U)”. Secondly, we set secondary indexes according to the structural variables of the ECSI model, including platform image (), rider expectations (), service perceived quality (), product perceived quality (), and perceived value (). Finally, we use the secondary indexes as the classification basis and set the tertiary indexes according to the likes of the online reviews of RTCL riders to form 12 evaluation indexes, including platform popularity (), platform reputation (), and humanistic care (), Merchant Attitude (), Consumer Attitude (), Rider Income () Platform reply feedback (), Rider Complaint (), Software Function (), System Optimization (), System Fluency (), Delivery unit price (), Dispatch quantity (). The index system is shown in Figure 3.
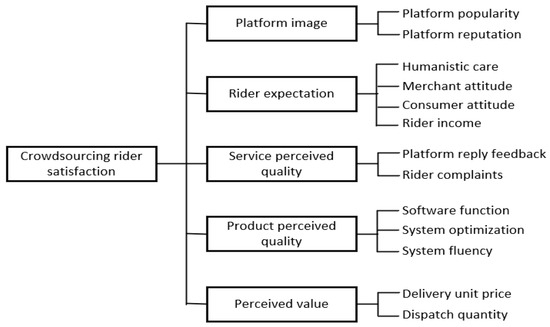
Figure 3.
RTCL riders’ satisfaction evaluation index system.
4.3. Calculation of Index Weights
Making convenience of calculation, we integrated the satisfaction data of riders’ online reviews on the “Ele.me” platform, and the results are shown in Table 4 and Table 5. Firstly, Freq-AHP is used to calculate the weight of the index. The maximum eigenvalue λmax of each index is calculated by the judgment matrix. Secondly, the consistency index CI is calculated by Equation (1), and then Equation (2) is used to test the consistency of the judgment matrix, and a CR value is obtained. The results are shown in Table 6, so the judgment matrix passed the consistency test. And the cross-validation results confirmed that the model’s accuracy remains stable across different data splits, which reduces the risk of overfitting and enhances the generalizability of our findings. Finally, MATLAB R2024b software is used to calculate the weights of each index, and the weights calculated by Freq-AHP are shown in Table 7 and Table 8.
Table 4.
Statistics of online reviews frequency of women riders.
Table 5.
Statistics of online reviews frequency of men riders.
Table 6.
Index consistency ratio.
Table 7.
Secondary index weights of Freq-AHP and PLTSs.
Table 8.
Tertiary index weights of Freq-AHP and PLTSs.
Next, we use the PLTSs to calculate the weight of the RTCL riders’ satisfaction index. Firstly, we list the RTCL rider’s PLTSs and normalize them by Equations (3) and (4), and then we use Equation (14) to calculate the normalized PLTSs weights, and the weight information is displayed in Table 7 and Table 8. Because the results of Zhang et al., (2016) show that Freq-AHP and PLTSs are important, we use Equation (19) to get the weights for both [38].
The comprehensive weight of the indexes objectively reflects the importance of the needs of the RTCL riders of “Ele.me”. By analyzing Table 9, we obtain the ranking of the need’s importance of women riders and men riders, which is shown in Table 10 and Table 11 respectively.
Table 9.
Comprehensive weight information of Freq-AHP and PLTSs.
Table 10.
Importance ranking of women riders’ needs.
Table 11.
Importance ranking of men riders’ needs.
From Table 10 and Table 11, it can be seen that there is a significant difference in the importance ranking of perceived value and service perceived quality. women riders pay more attention to perceived value, that is, more attention to delivery unit price and dispatch quantity than to platform’s reply feedback and rider complaints. On the contrary, men riders pay more attention to the platform reply feedback and rider complaints than the delivery unit price and dispatch quantity. Maslow’s of needs says that job security conditions like delivery unit price and dispatch quantity are security needs, belonging to low-level needs. Platform feedback and rider complaints are higher-level respect needs, and the satisfaction of respect needs can have an effect on the morale of the men riders.
In terms of perceived value, women riders pay more attention to the dispatch quantity than men riders. This is related to the speed and skills of taking orders. The high-frequency interaction between groups enables men riders to master more order-taking skills, while women riders’ lack of group interaction makes it more difficult to take orders, thus increasing the attention of women riders to the dispatch quantity. men riders pay more attention to the delivery unit price which is directly related to income. As for service perceived quality, women riders pay more attention to the platform’s reply feedback, indicating that women riders pay more attention to the platform’s service attitude, while men riders pay more attention to rider complaints, because they often need to appeal more in disputes with merchants and consumers. Therefore, they are more concerned with rider complaints.
In terms of platform image, product perceived quality, and rider expectations, the importance ranking of men and women riders is consistent, whereas vary significantly in importance degree. In terms of platform image, the attention of women riders is remarkably lower than that of men riders. As specifically reflected in the weight of the tertiary indexes, women riders pay more attention to the platform popularity while men riders pay more attention to the platform reputation such as timing rules, dispatch distance, reward and punishment standards, and other services closely related to their own interests, which indicates men riders’ pursuit of service practicability. In terms of product perceived quality, the attention of women riders is higher than that of men riders. In the weight of the tertiary indexes, women riders pay more attention to system fluency, while men riders pay more attention to system optimization. As the RTCL industry is a labor-intensive industry, the advantage of physical fitness should have played a key role, but the unreasonable rules for dispatching orders make it difficult for men riders to give full play to their physical advantages. In terms of rider expectations, the attention of women riders is higher than that of men riders. In the weight of the tertiary indexes, their high attention to humanistic care reflects that they pay more attention to spiritual pursuits. Their low attention to consumer attitudes reflects the differences in personality between women and men riders. women riders have a relatively mild attitude, which makes consumers more friendly. Therefore, they have fewer disputes in the communication process.
4.4. RTCL Riders’ Satisfaction Evaluation
According to the comprehensive weights shown in Table 9, this paper adopts FCE to calculate the RTCL riders’ satisfaction.
Firstly, we set the target layer as RTCL riders’ satisfaction and the criteria layer as the secondary index .
= {Platform image, Rider expectation, Product perceived quality, Service perceived quality, Perceived value}.
The scheme layer is set to the tertiary index .
= {Platform popularity, Platform reputation},
= {Humanistic care, Merchant attitude, Consumer attitude, Rider income},
= {Platform reply feedback, Rider complaints},
= {Software function, System optimization, System fluency},
= {Delivery unit price, Dispatch quantity}.
Secondly, we establish the evaluation set .
= {women rider expectation } = {Very unsatisfied, Unsatisfied, General, Satisfied, Very satisfied}.
Thirdly, we construct the fuzzy evaluation matrix, and the fuzzy evaluation matrix by taking the as an example.
According to Table 8, the weight of women rider expectation is w2, w2 = (0.337, 0.2077, 0.2058, 0.2496)
Therefore, the comprehensive evaluation result of the women rider expectation is obtained by calculation as .
Using the same method, the comprehensive evaluation results of other indexes can be obtained and shown in Table 12.
Table 12.
Comprehensive evaluation results of secondary indexes.
Then, we use the comprehensive evaluation results of the secondary indexes to construct the fuzzy relation matrix R and R’ of women riders and men riders respectively.
According to the comprehensive weights w = (0.2681, 0.1677, 0.1683, 0.2238, 0.1723) and w’ = (0.315, 0.1484, 0.1672, 0.2078, 0.1617) of the women and men riders’ secondary indexes, we can calculate the comprehensive evaluation results SC and SC’ of the women riders and men riders satisfaction respectively, and the results are shown as follows.
According to the maximum membership principle of FCE [46], the maximum membership degree of women riders and men riders’ satisfaction is 0.6074 and 0.7617, respectively, and the corresponding evaluation levels are both “very unsatisfied”. Therefore, this paper demonstrates that the overall satisfaction of women riders and men riders under the maximum membership principle is “very unsatisfied”. 0.6074 < 0.7617 shows that men riders are more dissatisfied. In addition, according to the weighted average principle, the satisfaction scores of women riders and men riders are 32.196 and 28.308 respectively, which are between “very unsatisfied” and “unsatisfied”. 28.308 < 32.196 also shows that the overall satisfaction of men riders is lower than that of women riders, which is consistent with the results of rider satisfaction calculated by the maximum membership degree principle. Also, we can get the satisfaction information with all of the different indexes based on the maximum membership principle and the weighted average principle, and the results are shown in Table 13.
Table 13.
Satisfaction information.
5. Results
In this section, the paper analyzes the satisfaction of women and men RTCL riders from two perspectives: Satisfaction and Satisfaction ranking. These analyses respectively examine rider satisfaction from emotional and concern-based perspectives, identifying the reasons for differences between genders.
5.1. Satisfaction Analysis of RTCL Riders
According to the analysis of Section 4, both women riders and men riders showed dissatisfaction on the whole under the principle of maximum membership and weighted average. Specifically, the satisfaction score of women riders is 32.196, and that of men riders is 28.308, which is about 4 percentage points higher than that of men riders. Next, we analyzed each need according to Table 11 to find out the differences and reasons for the satisfaction of women and men riders.
5.1.1. Platform Image
Under the maximum membership principle, both women and men riders are very dissatisfied with the platform image. Under the weighted average principle, the satisfaction score of women riders for platform image is 29.87, and that of men riders is 24.26, both close to the “very dissatisfied” range.
From an industry perspective, RTCL riders’ evaluation of the “Ele.me” platform is lower than that of “Meituan”, and the “Ele.me” platform’s investment in rider operations fails to meet riders’ requirements. September 2020 The article Takeaway Riders, Trapped in the System (Takeaway Riders, Trapped in the System” https://epaper.gmw.cn/wzb/html/2020-09/12/nw.D110000wzb_20200912_1-01.htm (accessed on 21 September 2020).) pointed out that the strict timing rules and overtime compensation rules of the “Ele.me” platform make the riders often drive illegally, and such actions pose a threat to safety of the riders. In contrast, the “Meituan” platform provides riders with relatively loose timing rules, and its ETA delivery model (as shown in Figure 4) can better solve the problem of short delivery times. The insufficient allowances and rewards provided by the “Ele.me” platform under special circumstances such as bad weather also led to the dissatisfaction of RTCL riders.
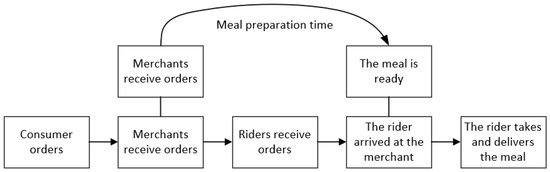
Figure 4.
Meituan estimated time of arrival model (“2018 development report of China’s Real-time distribution industry” https://max.book118.com/html/2018/1120/5142022342001331.shtm (accessed on 21 November 2018).).
From the gender perspective, the weighted average satisfaction score of women riders is 29.87, which is higher than that of men riders’ 24.26, indicating that women riders are more satisfied with the platform image than men riders. This difference may be linked to the timing rules implemented on the “Ele.me” platform. The delivery mode of the“Ele.me” platform in Figure 5, it can be seen that the “Ele.me” platform increases the waiting time for riders to pick up meals by adding the merchant’s preparation time in the delivery window, which can exacerbate dissatisfaction among riders. Once the merchants are slow in preparing meals, the riders will be overtime, and the fines caused by the overtime will be borne by the riders, which not only affects the riders’ income, but also exacerbates the conflicts between riders and merchants. This penalty not only reduces earnings but also compounds frustration with the platform’s rigid operational model [47]. Current research indicates that algorithm-driven timing rules can exacerbate dissatisfaction, especially among men who may rely on physical efficiency to handle more orders. Strict timing rules, similar to those in Ele.me, limit men’s ability to leverage physical advantages, which may contribute to lower satisfaction levels among male riders [48]. The men riders hesitate to take more orders because an overtime order is likely to have a chain reaction that will greatly reduce the men rider’s one-day income.
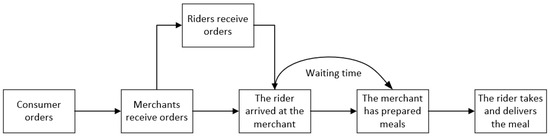
Figure 5.
“Ele.me” distribution mode.
Strict timing rules make it difficult for male riders to fully leverage their physical strengths, furthering their dissatisfaction with the platform image, the “platform image” (U1) encompasses factors such as platform popularity (U11) and platform reputation (U11), these findings suggest an asymmetric perception of platform image between women and men riders, highlighting gender-based differences in satisfaction driven by timing expectations.
5.1.2. Rider Expectation
Under the maximum membership principle, the men riders showed great dissatisfaction, while the women riders showed the opposite. Under the weighted average principle, the men rider’s satisfaction score is 38.394, which is about “unsatisfied”, and that of women rider’s is 56.704, which is about “general” The reasons for this phenomenon can be summarized into the following three points:
First, the status of women has improved substantially in the 21st century. The United Nations has made gender equality and women empowerment the core of the 2030 Agenda for Sustainable Development (“Several Opinions on Promoting the Standardized, Healthy and Sustainable Development of the Platform Economy” http://www.gov.cn/xinwen/2022-01/21/content_5669631.htm (accessed on 22 January 2022). “Turning promises into action: Gender equality in the 2030 Agenda for Sustainable Development” https://www.unwomen.org/en/digital-library/publications/2018/2/gender-equality-in-the-2030-agenda-for-sustainable-development-2018 (accessed on 20 March 2018).). And research supports that increased women participation in the digital economy has enhanced productivity and economic growth (“The power of parity: How advancing women’s equality can add $12 trillion to global growth” https://www.mckinsey.com/featured-insights/employment-and-growth/how-advancing-womens-equality-can-add-12-trillion-to-global-growth (accessed on 2 September 2020). “World Bank Group Advances Gender Strategy, Unveils Economic Opportunity Ambitions” https://www.worldbank.org/en/news/press-release/2024/10/24/world-bank-group-advances-gender-strategy-unveils-economic-opportunity-ambitions (accessed on 24 October 2024).). Responding to this shift, “Ele.me”, as a prominent player in China’s O2O takeaway industry, has shown increased support for its women riders by establishing initiatives such as the “Ele.me Blue Rose Women’s Federation”. This organization provides women riders with health support and educational benefits for their children, highlighting Ele.me’s commitment to improving working conditions for women (“Ele.me Establishes the ‘Blue Rose Women’s Federation”, https://news.sohu.com/a/808459157_362225 (accessed on 21 October 2024)). On International Women’s Day, it distributed heart-warming gifts to women riders, such kind of humanistic care (U21) reflected in gender differences has contributed to higher satisfaction levels among women riders [49].
Second, women riders often exhibit effective communication and a milder approach in customer interactions. According to a survey by “Peninsula.com”, women riders generally communicate more effectively, leading to positive responses from customers and merchants [19,50]. This positive reception contributes to higher satisfaction with both merchant (U22) and customer attitudes (U23), improving the meal pickup and delivery experience for women riders.
Third, the flexibility of the gig economy offers women a new income-generating avenue in real-time crowdsourcing logistics (RTCL), allowing them to balance autonomy and earnings [51]. Flexible work arrangements particularly benefit women by offering additional income opportunities and autonomy, which align with their work expectations and increase job satisfaction [52,53,54]. In contrast, men riders may have higher income expectations (U24), potentially leading to dissatisfaction if these expectations are unmet [12].
These three factors suggest that women riders have higher satisfaction with expectations compared to men riders. The observed gender disparity in satisfaction is a notable finding of this study and highlights the inherent uncertainties within the rider experience. These uncertainties arise from both individual expectations and the variability in treatment by the platform and customers, which differ significantly between men and women. Such findings have important implications for relevant authorities and the “Ele.me” platform in developing gender-sensitive policies.
In addition, it is important to note that, under the weighted average principle, neither women nor men riders have reached a level of “satisfactory” satisfaction. This highlights the continued presence of unmet expectations and indicates an inherent uncertainty in rider experiences, which requires ongoing platform support. Therefore, the platform should continue to increase its support for humanistic care, improve the food delivery experience, and enhance riders’ income to better address these uncertainties and improve overall satisfaction.
5.1.3. Service Perceived Quality
Under the maximum membership principle, both women and men riders are “very dissatisfied” with the service perceived quality. Under the weighted average principle, women riders’ satisfaction with the service perceived quality is 30.792 and that of men riders’ is 25.776, which is roughly consistent with the satisfaction under the maximum membership principle. The RTCL riders of the “Ele.me” platform reported that when they encountered problems, the platform often failed to provide timely feedback (Platform reply feedback, U31), a critical element of service perceived quality. Researches highlight that prompt and responsive feedback from platforms can significantly enhance rider satisfaction, as it reflects attentiveness and reliability on the part of the platform [12,55].
In addition, the complaint handling system (Rider Complaint, U32) plays a significant role in perceived service quality. Since the ultimate group served by the “Ele.me” platform was consumers, when there was a conflict between consumers and riders, the riders were often the victims. Studies indicate that inadequate or one-sided complaint handling can lead to frustration and feelings of injustice among service providers, further reducing satisfaction levels [56,57]. When riders face complaints from consumers, they often fail to appeal, which in turn leads to fines and dissatisfaction for riders. From the gender perspective, women riders’ satisfaction with the service perceived quality is 5 percentage points higher than that of men riders. This discrepancy may be attributed to women riders adopting a more moderate approach when in conflict with consumers, which often results in a more tempered response from consumers. Researchers suggest that women in the workplace often prioritize interpersonal relationships and tend to adopt a more moderate communication style, which may elicit more positive responses from consumers. Reports by McKinsey and other sources emphasize that interpersonal trust, effective communication, and managerial support are crucial determinants of job satisfaction among female employees. These dynamics likely influence interactions between women riders and customers, potentially reducing penalties and increasing their likelihood of successful appeals (“The power of parity: How advancing women’s equality can add $12 trillion to global growth”, https://www.mckinsey.com/featured-insights/employment-and-growth/how-advancing-womens-equality-can-add-12-trillion-to-global-growth (accessed on 2 September 2020). “World Bank Group Advances Gender Strategy, Unveils Economic Opportunity Ambitions”, https://www.worldbank.org/en/news/press-release/2024/10/24/world-bank-group-advances-gender-strategy-unveils-economic-opportunity-ambitions (accessed on 24 October 2024)).
As a part of the ecological chain of the “Ele.me” platform, RTCL riders play a key role in connecting the platform, merchants, and consumers. Their satisfaction plays an important role in the sustainable development of the platform. An unfair appeal system will encourage consumers to give negative reviews and make complaints. Studies indicate that fair complaint handling not only mitigates dissatisfaction but also builds trust, essential for long-term platform sustainability [56,58]. Riders who have nowhere to complain will become dissatisfied with the platform and even leave the platform, which may eventually lead to a shortage of riders on the “Ele.me” platform. In January 2022, the National Development and Reform Commission of the People’s Republic of China issued the Several Opinions on Promoting the Standardized, Healthy, and Sustainable Development of the Platform Economy (“Several Opinions on Promoting the Standardized, Healthy and Sustainable Development of the Platform Economy”, http://www.gov.cn/xinwen/2022-01/21/content_5669631.htm (accessed on 22 January 2022)), which clearly proposed “establishing an orderly and open platform ecology” and “strengthening the protection of workers’ rights and interests in new employment forms”.
The platform should, therefore, strengthen the protection of the rights and interests of RTCL riders to mitigate these uncertainties and promote a healthy and sustainable ecosystem encompassing platforms, merchants, riders, and consumers. Addressing the asymmetric experiences of men and women riders, particularly in terms of appeal success and perceived fairness, is vital for fostering a more inclusive and equitable work environment.
5.1.4. Product Perceived Quality
Under the maximum membership principle, both women and men riders are “very dissatisfied” with the product perceived quality. Under the weighted average principle, women riders’ satisfaction with product perceived quality is 29.27, while that of men riders is 25.096. Therefore, women riders are slightly more satisfied with product perceived quality compared to men riders.
According to the article Takeaway Riders, Trapped in the System (Takeaway Riders, Trapped in the System” https://epaper.gmw.cn/wzb/html/2020-09/12/nw.D110000wzb_20200912_1-01.htm (accessed on 21 September 2020).), there are problems with the software functions (U41) of the “Ele.me” platform. Specifically, the inaccurate navigation often causes riders to deliver orders incorrectly, which eventually results in fines for overtime. Literature indicates that accurate and user-friendly navigation systems are critical in reducing delivery times and improving the perceived quality of logistics platforms [59,60]. Additionally, as shown in Table 4 and Table 5, both women and men riders express significant dissatisfaction with system optimization(U42). Random order dispatching by the system negatively impacts the delivery experience, frequently leading to overtime orders. Research highlights that system optimization, especially in real-time order dispatching, is essential for improving service efficiency and reducing operational risks for riders [61].
From a gender perspective, although women riders also report dissatisfaction with the system’s dispatching function, the inefficient order dispatching model means that physical fitness is no longer an advantage for men riders. This provides a perceived sense of fairness in dispatch times for both genders, potentially contributing to the slight difference in satisfaction regarding product perceived quality. Studies suggest that perceptions of fairness in dispatching can enhance riders’ psychological well-being and satisfaction, as they perceive the system as less biased [62].
To achieve sustainable development of the “Ele.me” platform, it is crucial to improve these dimensions of product perceived quality. By optimizing the dispatching routes (U42), enhancing system fluency (U43), and implementing real-time scheduling to better match orders with riders, Ele.me can improve both system functionality and user experience. Studies show that optimizing these areas can directly enhance user satisfaction and platform loyalty, essential for sustainable platform growth [63,64].
5.1.5. Perceived Value
Under the maximum membership principle, both women and men riders were “very dissatisfied” with the perceived value. Under the weighted average principle, women riders’ satisfaction with the perceived value is 30.78 and that of men riders’ is 31.768, indicating that men riders are more satisfied with perceived value than women riders. This is a special discovery of this paper compared with several other phenomena, and we will explain it.
The takeaway industry is highly labor-intensive, making delivery unit price (U51), which directly impacts income, a critical factor for RTCL riders. Research shows that income-related incentives are primary motivators in gig economies, with fluctuations in delivery pricing significantly influencing worker satisfaction [65]. Ele.me’s gradual reduction in delivery unit prices has led to considerable dissatisfaction among riders. Many RTCL riders rely on takeaway delivery as a major income source, making the balance between workload and income distribution paramount. Riders prioritize achieving a fair return for labor input, especially in gig economies where income is often unstable [66,67].
From a gender perspective, men riders demonstrate slightly higher satisfaction with perceived value than women riders. This difference can be attributed to Ele.me’s dual order-taking model, which includes both systematic order dispatching and a “free order-taking” mode. Studies indicate that flexibility in task selection can enhance perceived value, as it allows riders to prioritize higher-paying orders [51]. Men riders generally entered the industry earlier and engaged in more group interactions, are better positioned to assess cost-effectiveness in terms of both delivery unit price and dispatch quantity (U52), thus selectively accepting more valuable orders. Conversely, women riders–who may lack the same level of group interaction and familiarity with order-taking strategies–often face reduced earnings due to lower unit prices and dispatch quantities.
To explore this discrepancy, we joined three Ele.me RTCL rider communication groups and observed minimal female presence and limited activity among women riders. Men riders actively exchanged order-taking strategies and insights on maximizing income, contributing to a clearer understanding of perceived value in terms of delivery unit price and dispatch efficiency. Researches on gig economy workers highlights that access to informal knowledge-sharing networks enhances income potential and task satisfaction, underscoring the value of peer support in navigating income variability [68].
To address these issues, Ele.me could consider implementing structured communication channels to encourage engagement among women riders. Expanding opportunities for interaction and knowledge sharing could help women riders improve their order-taking strategies, thereby increasing their perceived value and fostering a more inclusive and equitable platform environment.
5.2. Satisfaction Ranking of RTCL Riders
From the satisfaction ranking information in Table 14, it can be seen that rider expectation (U2) is the highest satisfaction need of women riders and men riders, indicating that among all the services provided by the platform, riders are most satisfied with the platform’s humanistic care (U21), merchant attitude (U22), consumer attitude (U23), and rider income (U24). Studies highlight that rider satisfaction often correlates strongly with the level of social support and income stability offered by platforms [12,16]. Specifically, the satisfaction score of women riders on rider expectations is significantly higher than that of men riders, which has been explained in Section 5.1. It’s caused by the differences in platform’s humanistic care, the attitudes of merchants and customers, and income levels. Which aligns with existing literature that underscores the impact of personalized support on rider satisfaction [49,51].
Table 14.
Ranking of satisfaction and importance of secondary indexes.
There is clear gender-based differences in satisfaction rankings for other needs. Women riders are more satisfied with service perceived quality than with perceived value, whereas men riders demonstrate the opposite preference. Similarly, women riders report greater satisfaction with platform image compared to product perceived quality, while men riders exhibit the inverse. Gender-specific satisfaction in platform work shows that women often prioritize aspects related to quality of support and interactions, while men may focus more on operational efficiencies and financial gains [69].
Furthermore, this research also found that for men riders, the importance of need is inversely related to satisfaction. Men riders pay the most attention to the platform image (U1) but are the least satisfied with it. Existing research found that societal expectations for gender roles significantly shape the differing priorities male and female riders assign to platform image [70]. Societal norms often impose expectations of higher efficiency and competitiveness on men, especially in physically demanding jobs, which aligns with the demands of food delivery services (“The power of parity: How advancing women’s equality can add $12 trillion to global growth”, https://www.mckinsey.com/featured-insights/employment-and-growth/how-advancing-womens-equality-can-add-12-trillion-to-global-growth (accessed on 2 September 2020). “World Bank Group Advances Gender Strategy, Unveils Economic Opportunity Ambitions”, https://www.worldbank.org/en/news/press-release/2024/10/24/world-bank-group-advances-gender-strategy-unveils-economic-opportunity-ambitions (accessed on 24 October 2024)). For male riders, these expectations contribute to heightened pressure to complete more orders within limited timeframes. Consequently, rigid scheduling and limited operational flexibility may disproportionately affect male riders’ work efficiency, fueling their dissatisfaction with platform image. In contrast, female riders may prioritize supportive elements within the work environment, which may lead to relatively higher satisfaction with aspects of the platform that address humanistic care and customer interaction [19].
According to the Kano model [71], platform image serves as a performance need for men riders, indicating that improvements in this area can significantly contribute to platform development. Studies corroborate this finding, noting that addressing performance needs is crucial in enhancing user loyalty and satisfaction [72,73]. Therefore, the Ele.me platform could use platform image as a focal area for improvement, refining its timing rules and enhancing service quality standards. Research indicates that establishing clear standards for rewards and penalties about time may also help transform performance needs into basic needs, leading to higher satisfaction among riders [74]. Although rider expectations (U2) rank as an attractive need with lower priority and higher satisfaction, men riders’ satisfaction here is notably lower than that of women riders. This indicates that the Ele.me platform may need to pay more attention to meeting the specific rider expectations of men riders. Studies emphasize that platforms need to address gender-specific expectations to reduce dissatisfaction and retain workers [19].
Women riders also show a inverse proportional relationship. That is, the needs satisfaction with high attention is relatively low while the needs satisfaction with low attention is relatively high. Concretely speaking, the platform image (U1) and the product perceived quality (U4) fall into the performance needs category, requiring improvement to meet the expectations of women riders, as indicated by the Kano model. Recent researches indicates that addressing performance-related concerns can enhance satisfaction and reduce turnover, which is crucial in competitive gig economies [75]. For women riders, platform image and product perceived quality require improvement to meet riders’ expectations.
And rider expectations (U2) belong to the attractive needs. This pattern could reflect broader societal expectations, where women are often more accustomed to prioritizing supportive elements in the work environment over operational aspects. Social research suggests that women may place greater value on supportive organizational relationships, including humanistic care and customer interactions in platform settings, which can lead to higher satisfaction with these aspects (“The power of parity: How advancing women’s equality can add $12 trillion to global growth”, https://www.mckinsey.com/featured-insights/employment-and-growth/how-advancing-womens-equality-can-add-12-trillion-to-global-growth (accessed on 2 September 2020). “World Bank Group Advances Gender Strategy, Unveils Economic Opportunity Ambitions”, https://www.worldbank.org/en/news/press-release/2024/10/24/world-bank-group-advances-gender-strategy-unveils-economic-opportunity-ambitions (accessed on 24 October 2024)). On the other hand, rider expectations fall under attractive needs for women, which may explain why these lower-priority areas receive higher satisfaction ratings. Researches in sociology indicates that women often emphasize relational qualities, such as customer and management support, which aligns with higher satisfaction in areas involving consumer and merchant interactions [4,6,51]. By integrating these social dimensions, it becomes clear that gender-based societal expectations may influence how needs are prioritized and perceived, underlining the importance of targeted improvements in platform image and product quality to balance performance needs for women in this gig economy setting.
Overall, a lack of policy focus on RTCL riders’ satisfaction may lead to the drain of RTCL riders [19]. It has been reported that user satisfaction and loyalty are positively correlated [75], and RTCL riders who have a positive experience with the service will share it with others; Conversely, RTCL riders who feel bad about the service will also share their negative experiences with others, including potential RTCL riders [12,58].
6. Conclusions
In contrast to the previous research on rider satisfaction with machine learning methods and qualitative methods, this study provides a comprehensive examination of gender-based asymmetries in satisfaction among real-time crowdsourcing logistics riders. By applying a quantitative decision-making framework, including AHP, PLTS, and FCE, the paper has explored how men and women riders prioritize different aspects of their work experience and how these differences can inform platform strategies.
First, the theoretical contribution of this research is as follows: The findings enrich the understanding of gender-based satisfaction differences in the gig economy, revealing the divergent expectations between men and women riders. This contributes to vocational interest theory by illustrating the complex interplay between gender and work-related preferences, particularly in a dynamic gig economy context. The application of multi-criteria decision-making tools also advances the field by demonstrating their suitability for analyzing subjective satisfaction data in uncertain environments.
Second, the practical contribution of this research is as follows: From a practical perspective, this study offers actionable insights for logistics platforms to develop gender—sensitive strategies that address the specific needs of men and women riders. Targeted interventions—such as differentiated incentives, tailored training, and improved dispatching systems—can help enhance rider satisfaction, reduce turnover, and create a more inclusive working environment. Moreover, our use of quantitative methodologies provides platform operators with systematic approaches to assessing rider satisfaction and managing platform operations more effectively.
In conclusion, this study makes both theoretical and practical contributions to understanding and improving the dynamics of real-time crowdsourcing logistics platforms. By focusing on gender-based asymmetries in satisfaction, we offer a framework for platforms to design more inclusive and effective strategies that ultimately contribute to platform stability, operational efficiency, and sustainability. Future research can expand on this work by integrating additional data sources, refining gender analysis methods, and applying these insights across different regions and types of gig economy platforms.
To address the generalizability of this study’s findings; future research will expand beyond Ele.me to include comparative analyses with similar platforms, such as Meituan, in order to examine how platform-specific features impact rider satisfaction and service perceptions. By analyzing multiple platforms within and beyond China, we can assess the applicability of our findings to different operational models, providing insights that are relevant to a wider array of gig-economy settings. Then, we aim to incorporate direct rider surveys as a more objective data source to verify the findings from linguistic analyses, addressing potential subjectivity in rider reviews. This approach will enhance the reliability of satisfaction evaluations. Additionally, future research will expand this framework to compare gender satisfaction across platforms in different regions and countries, allowing for a more comprehensive cross-cultural perspective on how gender norms influence rider experiences. Finally, in future research, we plan to include more diverse datasets to further evaluate the model’s generalizability. This will allow for a more comprehensive assessment of the model’s applicability across various contexts, addressing the overfitting concern by ensuring the model can handle diverse datasets beyond the current scope.
Author Contributions
Conceptualization, D.L. and Y.Z.; methodology, D.L.; software, D.L.; validation, D.L.; formal analysis, D.L.; investigation, D.L. and Y.Z.; resources, Y.Z.; data curation, D.L.; writing—original draft preparation, D.L.; writing—review and editing, Y.Z.; visualization, D.L. and Y.Z.; supervision, Y.Z.; project administration, Y.Z.; funding acquisition, Y.Z. All authors have read and agreed to the published version of the manuscript.
Funding
This study was funded by the National Social Science Fund of China (Grant number: 20&ZD128) the National Social Science Fund of China (Grant number: 22BGL124), the National Social Science Fund of China (Grant number: 24AGL025); the Jiangsu Provincial Philosophy and Social Science Planning Office Fund (Grant number: 24GLA006);Jiangsu Provincial Health Development Research Center (Grant number: JSHD2021058) and China Association of Higher Education (Grant number: 21ZJD15). Authors has received research support from Alibaba Group Holding Limited (Grant number: 202269).
Institutional Review Board Statement
All procedures performed in studies involving human participants were in accordance with the ethical standards of the institutional and/or national research committee and with the 1964 Helsinki declaration and its later amendments or comparable ethical standards.
Data Availability Statement
The datasets generated during the current study are available from the corresponding author on reasonable request.
Conflicts of Interest
The authors declare that they have no financial or non-financial interests that could have appeared to influence the work reported in this paper.
References
- Wang, Y.; Bi, M.; Lai, J.; Chen, Y. Locating Movable Parcel Lockers under Stochastic Demands. Symmetry 2020, 12, 2033. [Google Scholar] [CrossRef]
- Zhang, Y.; Xiang, C.; Li, L.; Jiang, H. Evolutionary game analysis and simulation with system dynamics for behavioral strategies of participants in crowd logistics. Transp. Lett. 2020, 13, 540–554. [Google Scholar] [CrossRef]
- Buldeo Rai, H.; Verlinde, S.; Macharis, C. Shipping outside the box. Environmental impact and stakeholder analysis of a crowd logistics platform in Belgium. J. Clean. Prod. 2018, 202, 806–816. [Google Scholar] [CrossRef]
- Karanović, J.; Berends, H.; Engel, Y. Regulated Dependence: Platform Workers’ Responses to New Forms of Organizing. J. Manag. Stud. 2020, 58, 1070–1106. [Google Scholar] [CrossRef]
- Alnaggar, A.; Gzara, F.; Bookbinder, J.H. Crowdsourced delivery: A review of platforms and academic literature. Omega 2021, 98, 102139. [Google Scholar] [CrossRef]
- Saydam, M.B.; Borzyszkowski, J.; Karatepe, O.M. An exploration of employees’ experiences of online food delivery: Evidence from employee reviews. Int. J. Contemp. Hosp. Manag. 2023, 36, 2909–2931. [Google Scholar] [CrossRef]
- Zhang, Y.; Li, D.; Liu, S. Research on the Impact of the Public Safety Emergencies on Women Riders’ Preference of Shanghai Real-Time Crowdsourcing Logistics Platform. Sage Open 2024, 14, 1–23. [Google Scholar] [CrossRef]
- Wang, Y.; Wang, H.; Xu, H. Understanding the experience and meaning of app-based food delivery from a mobility perspective. Int. J. Hosp. Manag. 2021, 99, 103070. [Google Scholar] [CrossRef]
- Mangiaracina, R.; Perego, A.; Seghezzi, A.; Tumino, A. Innovative solutions to increase last-mile delivery efficiency in B2C e-commerce: A literature review. Int. J. Phys. Distrib. Logist. Manag. 2019, 49, 901–920. [Google Scholar] [CrossRef]
- Ijadi Maghsoodi, A.; Azizi-ari, I.; Barzegar-Kasani, Z.; Azad, M.; Zavadskas, E.K.; Antucheviciene, J. Evaluation of the Influencing Factors on Job Satisfaction Based on Combination of PLS-SEM and F-MULTIMOORA Approach. Symmetry 2018, 11, 24. [Google Scholar] [CrossRef]
- Shahbaznezhad, H.; Dolan, R.; Rashidirad, M. The Role of Social Media Content Format and Platform in Users’ Engagement Behavior. J. Interact. Mark. 2022, 53, 47–65. [Google Scholar] [CrossRef]
- Zhang, Y.; Shi, X.; Abdul-Hamid, Z.; Li, D.; Zhang, X.; Shen, Z. Factors influencing crowdsourcing riders’ satisfaction based on online comments on real-time logistics platform. Transp. Lett. 2022, 15, 363–374. [Google Scholar] [CrossRef]
- Govindan, K.; Chaudhuri, A. Interrelationships of risks faced by third party logistics service providers: A DEMATEL based approach. Transp. Res. Part E Logist. Transp. Rev. 2016, 90, 177–195. [Google Scholar] [CrossRef]
- Wang, W.; Xie, L. Optimal pricing of crowdsourcing logistics services with social delivery capacity. J. Comb. Optim. 2021, 43, 1447–1469. [Google Scholar] [CrossRef]
- Alnaggar, A.; Gzara, F.; Bookbinder, J.H. Compensation guarantees in crowdsourced delivery: Impact on platform and driver welfare. Omega 2024, 122, 102965. [Google Scholar] [CrossRef]
- He, S.; Dai, Y.; Ma, Z.-J. To offer or not to offer? The optimal value-insured strategy for crowdsourced delivery platforms. Transp. Res. Part E Logist. Transp. Rev. 2023, 173, 103091. [Google Scholar] [CrossRef]
- Kim, J.; Kweon, S.J.; Hwang, S.W.; Lee, S. Crowdsourcing integration on the last mile delivery platform considering floating population data. Expert Syst. Appl. 2024, 248, 123312. [Google Scholar] [CrossRef]
- Zhu, G.; Huang, J.; Lu, J.; Luo, Y.; Zhu, T. Gig to the left, algorithms to the right: A case study of the dark sides in the gig economy. Technol. Forecast. Soc. Change 2024, 199, 123018. [Google Scholar] [CrossRef]
- Aman, J.J.C.; Smith-Colin, J.; Zhang, W. Listen to E-scooter riders: Mining rider satisfaction factors from app store reviews. Transp. Res. Part D Transp. Environ. 2021, 95, 102856. [Google Scholar] [CrossRef]
- Liang, D.; Dai, Z.; Wang, M. Assessing customer satisfaction of O2O takeaway based on online reviews by integrating fuzzy comprehensive evaluation with AHP and probabilistic linguistic term sets. Appl. Soft Comput. 2021, 98, 106847. [Google Scholar] [CrossRef]
- Pang, Q.; Wang, H.; Xu, Z. Probabilistic linguistic term sets in multi-attribute group decision making. Inf. Sci. 2016, 369, 128–143. [Google Scholar] [CrossRef]
- Zhang, G.; Dong, Y.; Xu, Y. Consistency and consensus measures for linguistic preference relations based on distribution assessments. Inf. Fusion 2014, 17, 46–55. [Google Scholar] [CrossRef]
- Shu, Z.; Carrasco, R.A.; Sánchez-Montañés, M.; García-Miguel, J.P. A Multi-Criteria Decision Support Model for Restaurant Selection Based on Users’ Demand Level: The Case of Dianping.com. Inf. Process. Manag. 2024, 61, 103650. [Google Scholar] [CrossRef]
- Liao, H.; Yu, J.; Wu, X.; Al-Barakati, A.; Altalhi, A.; Herrera, F. Life satisfaction evaluation in earthquake-hit area by the probabilistic linguistic GLDS method integrated with the logarithm-multiplicative analytic hierarchy process. Int. J. Disaster Risk Reduct. 2019, 38, 101190. [Google Scholar] [CrossRef]
- Awad, J.; Jung, C. Extracting the Planning Elements for Sustainable Urban Regeneration in Dubai with AHP (Analytic Hierarchy Process). Sustain. Cities Soc. 2022, 76, 103496. [Google Scholar] [CrossRef]
- Kafa, N.; Ruel, S.; Jaegler, A. Factors influencing career advancement in supply chain management with gender perspectives: French case study. Int. J. Logist. Manag. 2023, 35, 1549–1576. [Google Scholar] [CrossRef]
- Feng, Z.; Hou, H.; Lan, H. Understanding university students’ perceptions of classroom environment: A synergistic approach integrating grounded theory (GT) and analytic hierarchy process (AHP). J. Build. Eng. 2024, 83, 108446. [Google Scholar] [CrossRef]
- Medjoudj, R.; Laifa, A.; Aissani, D. Decision making on power customer satisfaction and enterprise profitability analysis using the Analytic Hierarchy Process. Int. J. Prod. Res. 2012, 50, 4793–4805. [Google Scholar] [CrossRef]
- Wu, X.; Liao, H. An approach to quality function deployment based on probabilistic linguistic term sets and ORESTE method for multi-expert multi-criteria decision making. Inf. Fusion 2018, 43, 13–26. [Google Scholar] [CrossRef]
- Wang, Y.; Tian, L.; Wu, Z. Trust modeling based on probabilistic linguistic term sets and the MULTIMOORA method. Expert Syst. Appl. 2021, 165, 113817. [Google Scholar] [CrossRef]
- Darko, A.P.; Liang, D. Modeling customer satisfaction through online reviews: A FlowSort group decision model under probabilistic linguistic settings. Expert Syst. Appl. 2022, 195, 116649. [Google Scholar] [CrossRef]
- Wu, Q.; Liu, X.; Qin, J.; Wang, W.; Zhou, L. A linguistic distribution behavioral multi-criteria group decision making model integrating extended generalized TODIM and quantum decision theory. Appl. Soft Comput. 2021, 98, 106757. [Google Scholar] [CrossRef]
- Chafai, Z.; Nacer, H.; Lekadir, O.; Gharbi, N.; Ouchaou, L. A performance evaluation model for users’ satisfaction in federated clouds. Clust. Comput. 2024, 27, 4983–5004. [Google Scholar] [CrossRef]
- Kwoyiga, L. Gender inequalities, water research and knowledge production in Ghana. Environ. Sci. Policy 2024, 160, 103853. [Google Scholar] [CrossRef]
- Kwiek, M.; Szymula, L. Quantifying attrition in science: A cohort-based, longitudinal study of scientists in 38 OECD countries. High. Educ. 2024, 1–29. [Google Scholar] [CrossRef]
- Mujahid, M.; Kına, E.; Rustam, F.; Villar, M.G.; Alvarado, E.S.; De La Torre Diez, I.; Ashraf, I. Data oversampling and imbalanced datasets: An investigation of performance for machine learning and feature engineering. J. Big Data 2024, 11, 87. [Google Scholar] [CrossRef]
- Alrizq, M.; Alghamdi, A. Customer satisfaction analysis with Saudi Arabia mobile banking apps: A hybrid approach using text mining and predictive learning techniques. Neural Comput. Appl. 2024, 36, 6005–6023. [Google Scholar] [CrossRef]
- Zhang, G.; Cai, Y.; Zheng, Z.; Zhen, J.; Liu, Y.; Huang, K. Integration of the Statistical Index Method and the Analytic Hierarchy Process technique for the assessment of landslide susceptibility in Huizhou, China. Catena 2016, 142, 233–244. [Google Scholar] [CrossRef]
- Dong, Y.; Wu, Y.; Zhang, H.; Zhang, G. Multi-granular unbalanced linguistic distribution assessments with interval symbolic proportions. Knowl.-Based Syst. 2015, 82, 139–151. [Google Scholar] [CrossRef]
- Ciavolino, E.; Dahlgaard, J.J. ECSI—Customer Satisfaction Modelling and Analysis: A Case Study. Total Qual. Manag. Bus. Excell. 2007, 18, 545–554. [Google Scholar] [CrossRef]
- Kristensen, K.; Martensen, A.; Gronholdt, L. Customer satisfaction measurement at Post Denmark: Results of application of the European Customer Satisfaction Index Methodology. Total Qual. Manag. 2010, 11, 1007–1015. [Google Scholar] [CrossRef]
- Cassel, C.; Eklöf, J.A. Modelling customer satisfaction and loyalty on aggregate levels: Experience from the ECSI pilot study. Total Qual. Manag. 2001, 12, 834–841. [Google Scholar] [CrossRef]
- Garbarino, E.; Johnson, M.S. The Different Roles of Satisfaction, Trust, and Commitment in Customer Relationships. J. Mark. 1999, 63, 70–87. [Google Scholar] [CrossRef]
- Yu, S.-m.; Wang, J.; Wang, J.-q.; Li, L. A multi-criteria decision-making model for hotel selection with linguistic distribution assessments. Appl. Soft Comput. 2018, 67, 741–755. [Google Scholar] [CrossRef]
- Park, J.; Han, S.H. A fuzzy rule-based approach to modeling affective user satisfaction towards office chair design. Int. J. Ind. Ergon. 2004, 34, 31–47. [Google Scholar] [CrossRef]
- Chen, S.M.; Hwang, J.R. Temperature prediction using fuzzy time series. IEEE Trans Syst Man Cybern B Cybern 2000, 30, 263–275. [Google Scholar] [CrossRef]
- Nguyen, M.H.; Nguyen-Phuoc, D.Q.; Nguyen, N.A.N.; Oviedo-Trespalacios, O. Distracted on duty: A theory-based exploration of influences leading to mobile phone distracted riding among food delivery workers. Accid. Anal. Prev. 2024, 202, 107538. [Google Scholar] [CrossRef]
- Mohri, S.S.; Nassir, N.; Thompson, R.G.; Lavieri, P.S. Public transportation-based crowd-shipping initiatives: Are users willing to participate? Why not? Transp. Res. Part A Policy Pract. 2024, 182, 104019. [Google Scholar] [CrossRef]
- Koon, V.-Y.; Fujimoto, Y. From corporate social responsibility (CSR) to corporate humanistic responsibility (CHR): The conceptualization and operationalization of perceived CHR. Pers. Rev. 2023, 53, 877–899. [Google Scholar] [CrossRef]
- Ross, L.W.; Fleming, R.S.; Fabes, K.J.; Frankl, R. Gender effects on customer satisfaction with employment services. Career Dev. Int. 1999, 4, 270–276. [Google Scholar] [CrossRef]
- Churchill, B.; Craig, L. Gender in the gig economy: Men and women using digital platforms to secure work in Australia. J. Sociol. 2019, 55, 741–761. [Google Scholar] [CrossRef]
- Lott, Y. Working-time flexibility and autonomy: A European perspective on time adequacy. Eur. J. Ind. Relat. 2014, 21, 259–274. [Google Scholar] [CrossRef]
- Scandura, T.A.; Lankau, M.J. Relationships of gender, family responsibility and flexible work hours to organizational commitment and job satisfaction. J. Organ. Behav. 1997, 18, 337–391. [Google Scholar] [CrossRef]
- Ruppanner, L.; Lee, R.; Huffman, M. Do Mothers Benefit from Flexible Work? Cross-National Evidence for Work Time, Job Quality, and Satisfaction. Int. J. Sociol. 2018, 48, 170–187. [Google Scholar] [CrossRef]
- Laghari, A.; He, H.; Khan, A.; Laghari, R.; Yin, S.; Wang, J. Crowdsourcing platform for QoE evaluation for cloud multimedia services. Comput. Sci. Inf. Syst. 2022, 19, 1305–1328. [Google Scholar] [CrossRef]
- Tax, S.S.; Brown, S.W.; Chandrashekaran, M. Customer Evaluations of Service Complaint Experiences: Implications for Relationship Marketing. J. Mark. 1998, 62, 30–67. [Google Scholar] [CrossRef]
- Wu, X.; Cao, X.; Ding, C. Exploring rider satisfaction with arterial BRT: An application of impact asymmetry analysis. Travel Behav. Soc. 2020, 19, 82–89. [Google Scholar] [CrossRef]
- Goles, T.; Rao, S.V.; Lee, S.; Warren, J. Trust Violation in Electronic Commerce: Customer Concerns and Reactions. J. Comput. Inf. Syst. 2015, 49, 1–9. [Google Scholar] [CrossRef]
- Karimi, H.A.; Asavasuthirakul, D. A Novel Optimal Routing for Navigation Systems/Services Based on Global Navigation Satellite System Quality of Service. J. Intell. Transp. Syst. 2014, 18, 286–298. [Google Scholar] [CrossRef]
- van Lopik, K.; Schnieder, M.; Sharpe, R.; Sinclair, M.; Hinde, C.; Conway, P.; West, A.; Maguire, M. Comparison of in-sight and handheld navigation devices toward supporting industry 4.0 supply chains: First and last mile deliveries at the human level. Appl. Erg. 2020, 82, 102928. [Google Scholar] [CrossRef]
- Sun, G.; Tian, Z.; Liu, R.; Jing, Y.; Ma, Y. Research on Coordination and Optimization of Order Allocation and Delivery Route Planning in Take-Out System. Math. Probl. Eng. 2020, 2020, 7248492. [Google Scholar] [CrossRef]
- McCoy, J.H.; Lee, H.L. Using Fairness Models to Improve Equity in Health Delivery Fleet Management. Prod. Oper. Manag. 2014, 23, 965–977. [Google Scholar] [CrossRef]
- Hong, T.-Y.; Chien, C.-F. A simulation-based dynamic scheduling and dispatching system with multi-criteria performance evaluation for Industry 3.5 and an empirical study for sustainable TFT-LCD array manufacturing. Int. J. Prod. Res. 2020, 58, 7531–7547. [Google Scholar] [CrossRef]
- Korytkowski, P.; Wiśniewski, T.; Rymaszewski, S. An evolutionary simulation-based optimization approach for dispatching scheduling. Simul. Model. Pract. Theory 2013, 35, 69–85. [Google Scholar] [CrossRef]
- Danda, S.R.; Levin, G.; Frey, C.B.; Berger, T. Uber happy? Work and well-being in the ‘Gig Economy’. Econ. Policy 2019, 34, 429–477. [Google Scholar] [CrossRef]
- Heeks, R.; Graham, M.; Mungai, P.; Van Belle, J.-P.; Woodcock, J. Systematic evaluation of gig work against decent work standards: The development and application of the Fairwork framework. Inf. Soc. 2021, 37, 267–286. [Google Scholar] [CrossRef]
- Gandini, A. Labour process theory and the gig economy. Hum. Relat. 2018, 72, 1039–1056. [Google Scholar] [CrossRef]
- Muhammed, S.; Zaim, H. Peer knowledge sharing and organizational performance: The role of leadership support and knowledge management success. J. Knowl. Manag. 2020, 24, 2455–2489. [Google Scholar] [CrossRef]
- Mason, E.S. Gender differences in job satisfaction. J. Soc. Psychol. 1995, 135, 143–151. [Google Scholar] [CrossRef]
- Ridgeway, C.L. Gender, Status, and Leadership. J. Soc. Issues 2002, 57, 637–655. [Google Scholar] [CrossRef]
- Chen, L.-F. A novel approach to regression analysis for the classification of quality attributes in the Kano model: An empirical test in the food and beverage industry. Omega 2012, 40, 651–659. [Google Scholar] [CrossRef]
- Liu, Y.; You, T.-H.; Zou, J.; Cao, B.-B. Modelling customer requirement for mobile games based on online reviews using BW-CNN and S-Kano models. Expert Syst. Appl. 2024, 258, 125142. [Google Scholar] [CrossRef]
- Wang, T.; Wang, W.; Feng, J.; Fan, X.; Guo, J.; Lei, J. A novel user-generated content-driven and Kano model focused framework to explore the impact mechanism of continuance intention to use mobile APPs. Comput. Hum. Behav. 2024, 157, 108252. [Google Scholar] [CrossRef]
- Murphy, K.J. Performance standards in incentive contracts. J. Account. Econ. 2000, 30, 245–278. [Google Scholar] [CrossRef]
- Chen, X.; Al Mamun, A.; Hussain, W.; Jingzu, G.; Yang, Q.; Shami, S. Envisaging the job satisfaction and turnover intention among the young workforce: Evidence from an emerging economy. PLoS ONE 2023, 18, e0287284. [Google Scholar] [CrossRef]
Disclaimer/Publisher’s Note: The statements, opinions and data contained in all publications are solely those of the individual author(s) and contributor(s) and not of MDPI and/or the editor(s). MDPI and/or the editor(s) disclaim responsibility for any injury to people or property resulting from any ideas, methods, instructions or products referred to in the content. |
© 2024 by the authors. Licensee MDPI, Basel, Switzerland. This article is an open access article distributed under the terms and conditions of the Creative Commons Attribution (CC BY) license (https://creativecommons.org/licenses/by/4.0/).