Abstract
Industrial Control Systems (ICSs) are vital components of industrial production, and their security posture significantly impacts operational safety. Given that ICSs frequently interact with external networks, cyberattacks can disrupt system symmetry, thereby affecting industrial processes. This paper aims to predict the network security posture of ICSs to ensure system symmetry. A prediction model for the network security posture of ICSs was established utilizing Evidence Reasoning (ER) and Explainable Belief Rule Base (BRB-e) technologies. Initially, an evaluation framework for the ICS architecture was constructed, integrating data from various layers using ER. The development of the BRB prediction model requires input from domain experts to set initial parameters; however, the subjective nature of these settings may reduce prediction accuracy. To address this issue, an ICS network security posture prediction model based on the Explainable Belief Rule Base (BRB-e) was proposed. The modeling criteria for explainability were defined based on the characteristics of the ICS network, followed by the design of the inference process for the BRB-e prediction model to enhance accuracy and precision. Additionally, a parameter optimization method for the explainable BRB-e prediction model is presented using a constrained Projection Equilibrium Optimization (P-EO) algorithm. Experiments utilizing industrial datasets were conducted to validate the reliability and effectiveness of the prediction model. Comparative analyses indicated that the BRB-e model demonstrates distinct advantages in both prediction accuracy and explainability when compared to other algorithms.
1. Introduction
Industrial Control Systems (ICSs) are computer systems used to regulate and control various industrial devices. They are primarily applied across industries such as industrial automation, energy, manufacturing, and transportation [1]. ICSs play a crucial role in the smooth operation of industrial enterprises. With the advancement of information networks, many industrial enterprises now need to connect to external networks for improved communication and data exchange. However, as interactions with external networks increase, so do the risks of external cyberattacks, which pose severe challenges to ICS network security and can impact the normal operations of businesses [2].
The Industrial Internet, as an emerging technology, requires further development in the areas of security assessment and prediction. In practice, many security issues related to Industrial Control Systems (ICSs) are only identified by administrators after incidents occur, revealing latent vulnerabilities in network security that need to be addressed [3]. Several notable ICS security incidents have already occurred globally [4]. For instance, in 2019, a hydroelectric power station in Venezuela was attacked, causing widespread nationwide power outages. In 2020, a Japanese automotive company suffered a ransomware attack that disrupted its servers and internal network functions. In 2022, a major US natural gas company was targeted by ransomware, resulting in significant financial losses and fuel shortages on the east coast of the United States. Therefore, ensuring the security of ICSs is of utmost importance to prevent further losses and enhance their security.
Predicting the network security of ICSs is crucial for preempting potential issues and avoiding substantial losses for enterprises. Given the diversity and heterogeneity of ICS structures, predicting their network security can be complex. Early ICS systems operated in closed environments, and their complex and varied industrial structures made data acquisition challenging. Additionally, the presence of numerous interference factors further complicates the task of predicting ICS network security. Thus, constructing accurate and efficient prediction models requires considering a wide range of factors to address the inherent complexities and ensure effective forecasting of ICS network security.
Currently, there are numerous security situation prediction methods across various fields, which can generally be categorized into three types. The first type is qualitative security situation prediction methods. These methods rely on the historical experience of experts combined with actual conditions to derive expert knowledge, which is then used to set parameters and other data for the model. This forms the basis for developing the prediction model. Examples of this approach include the following: Latorre-Biel et al. used machine learning and Petri nets to predict vehicle routing issues [5]; Bustos et al. employed expert systems to forecast stock market trends [6]; Liu et al. focused on the dynamic security assessment of ICSs. Social engineering methods are considered to solve the problem [7]; Semke et al. conducted exploratory research on enterprises through qualitative expert interviews [8]; and Kumar et al. used fuzzy set qualitative analysis to predict and interpret business phenomena in the real world [9]. This method demands high-quality expert knowledge, as the accuracy of predictions is directly influenced by the quality of this knowledge. Additionally, it does not make use of uncertain information.
The second type is quantitative security situation prediction methods. These methods primarily involve the use of artificial intelligence to analyze large volumes of historical data, identify patterns, and establish the variables and constants of the model to build a prediction model. Examples include the following: Chauhan et al. used convolutional neural network (CNN) technology for air quality monitoring [10]; Nagarajan et al. used hybrid deep learning based on the honeypot–World Cup algorithm to detect malicious intrusion detections in ICSs [11]; Wang et al. employed information granularity-based backpropagation (BP) neural network technology for long-term time series forecasting [12]; Gu et al. proposed a data-extended intrusion detection system to solve the new intrusion detection problem of ICSs [13]; and Liu et al. developed a seepage risk prediction model for tunnels using random forests (RFs) [14]. This method requires large amounts of historical data, and in fields with limited historical data, the prediction accuracy may suffer. Additionally, it operates as a black box, making it difficult to understand its underlying mechanisms.
The third type is semi-quantitative security situation prediction methods. These methods combine expert knowledge with historical data. Initially, expert knowledge is used to determine the parameters of the prediction model. Subsequently, historical data are used to train the model, resulting in a security situation prediction model. Examples of this approach include the following: Li et al. proposed an intrusion detection system based on improved learning to solve the intrusion detection problem of ICSs [15]; Obianyo et al. applied neural networks and neuro-fuzzy models to construction scheduling issues [16]; Luo et al. used Bayesian deep learning methods for climate prediction [17]; and Zhan et al. proposed a mixed MTSP model combining fuzzy C-means (FCM) clustering with feature selection for multi-variate time series prediction [18]. Although semi-quantitative methods integrate both qualitative and quantitative approaches, they can only handle a single type of uncertain information and are also affected by the uncertainty inherent in expert knowledge.
From the above three methods, it is evident that the first two methods rely on a single type of information. Although the third method combines the advantages of the first two approaches, it also has its own limitations. Recently, many scholars have proposed alternative solutions, among which the Belief Rule Base (BRB) method stands out. The BRB method effectively incorporates the advantages of the aforementioned methods while addressing their limitations related to reduced accuracy. It better integrates uncertain and fuzzy information and provides a degree of interpretability in the modeling process. Wang et al. introduced the Evidence Reasoning (ER) algorithm [19] and the BRB method [20], proposing a novel data processing approach with logical consistency. This approach has been widely applied in fault detection [21], security assessment [22], and industrial forecasting [23], leveraging expert knowledge and integrating small-sample business operations, thus achieving high modeling accuracy and interpretability. To further enhance prediction accuracy, various optimization methods have been employed, including the Projection Covariance Matrix Adaptation Evolution Strategy (P-CMA-ES) [24], the Whale Optimization Algorithm (WOA) [25], and Equilibrium Optimization (EO) [26]. However, focusing solely on accuracy has led to shortcomings in interpretability, such as conflicts between optimized belief distributions and actual conditions and unreasonable ranges of confidence values. To address these issues, this paper proposes an ICS network security situation prediction model based on interpretable BRB (BRB-e).
This paper employs BRB-e technology to tackle the problem of predicting the security status of Industrial Control System (ICS) networks. Given the complexity of industrial environments, the structure of ICS networks is inherently intricate. We establish an evaluation framework by analyzing the structure of ICS networks and integrating data using Entity-Relationship (ER) modeling. Based on the structural characteristics of ICSs, we set standards for interpretability and constructed the model using BRB-e. Additionally, we designed an Equilibrium Optimization (EO) algorithm with interpretability constraints to ensure that model optimization did not compromise interpretability, thereby enhancing both interpretability and accuracy.
The structure of this paper is arranged as follows: Section 2 describes the problem. Section 3 defines the interpretability of ICS networks and presents the construction, inference, and optimization processes of the BRB-e-based ICS network security situation prediction model. Section 4 evaluates the prediction model’s accuracy using specific industrial datasets and compares it with other methods for analysis. Section 5 concludes the paper and discusses future prospects.
2. Problem Description
This section describes the analysis of the ICS structure, the use of ER fusion technology for data integration and processing, and the challenges encountered in developing the BRB-e-based ICS network security situation prediction model.
2.1. ICS Network Structure
Due to the complex and heterogeneous nature of the ICS network structure, it is essential to classify and integrate its components to lay a solid foundation for prediction. Based on the characteristics of heterogeneous networks and the IEC 62264-1 standard, a structural diagram was constructed [27], as shown in Figure 1.
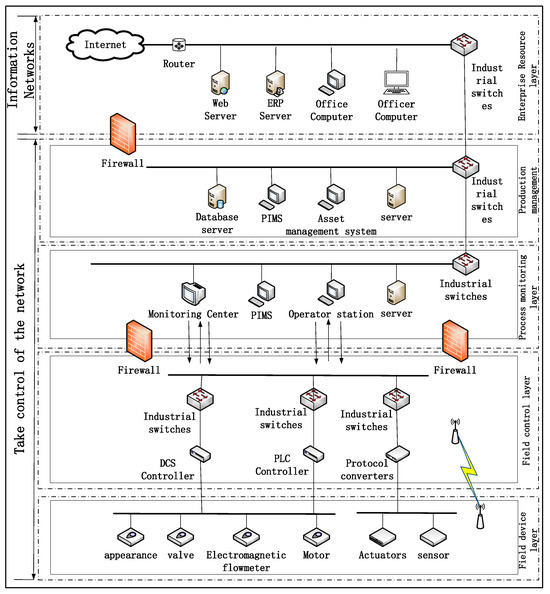
Figure 1.
ICS topology diagram.
The diagram shows that the ICS structure is divided into five layers, from bottom to top: the Field Device Layer, which focuses on the equipment at the factory’s endpoints; the Field Control Layer, responsible for controlling the endpoint production equipment; the Process Monitoring Layer, which monitors and transmits instructions from the upper layers; the Production Management Layer, which oversees various production processes as a whole; and the Enterprise Management Layer, the top layer with the highest priority that issues all instructions and serves as the ICS terminal.
Given that ICS networks were previously more isolated and generally experienced infrequent updates or iterations, many network security issues have been concealed. To improve prediction and enhance accuracy, this paper further classifies the ICS components. Components with extensive data and limited external interaction are categorized as Control Networks, which include the Production Management Layer, Process Monitoring Layer, Field Control Layer, and Field Device Layer. Components frequently interacting with external networks are categorized as information networks, which include the Enterprise Management Layer.
2.2. Integration Evaluation Metrics
Once the ICS network structure is divided, the data need to be fused to determine the network security situation at the current moment. Given the diverse types of data in ICS networks, this paper categorizes the evaluation metrics into four levels for integration and employs the Evidence Reasoning (ER) method for data fusion. The process begins by integrating the metrics at the fourth level. The result of this integration becomes the evaluation metrics for the third level. This process continues by integrating the metrics at the third level to derive the metrics for the second level, and so on, until the final evaluation result is obtained. This process is represented by Equation (1):
Here, a represents the evaluation metrics. R denotes the fusion result at the j-th level, which is also the fused metric from the j−1-th level. represents the ER fusion process.
2.3. Prediction Model Issues
After addressing the initial data issues, several problems needed to be resolved when developing the BRB-e prediction model:
Problem 1: How to ensure the interpretability of the ICS network security situation prediction model during its construction and inference. Interpretability enhances the reliability and rigor of the model, making it more transparent and reasonable, and thus more convincing. By analyzing the characteristics of the ICS network and ensuring that the inference process adheres to the required rules, this can be described by Equation (2). During the model construction, considerations of each step’s process, inputs, outputs, and parameters are taken into account to develop an interpretable inference process, described by Equation (3).
Here, represents the interpretability definition criteria, denotes the number of criteria, is the set of prediction metrics for the model, is the set of parameters for the inference process, and represents the inference function.
Problem 2: When establishing the prediction model, optimization algorithms are used for parameter tuning. This can potentially decrease the model’s interpretability. Therefore, constraints must be added to the optimization algorithms to ensure the optimization process does not compromise interpretability. This can be expressed by the following nonlinear mapping relationship, as shown in Equation (4).
Here, denotes the set of parameters for the optimization process, is the optimal parameter set, and is the optimization function.
3. BRB-e-Based ICS Network Security Situation Prediction Model
After the analysis of the network situation prediction problem of ICSs, the next step is to introduce the ICS network security situation prediction model.
3.1. Prediction Process
The prediction process for the ICS network security model consists of three steps:
- (1)
- Establish the evaluation framework: first, develop the evaluation framework for the ICS network and perform ER fusion of the collected information to obtain the network security assessment results.
- (2)
- Develop the BRB-e prediction model: construct the ICS network security situation prediction model based on the BRB-e methodology.
- (3)
- Update parameters with the EO algorithm: use the EO algorithm with interpretability constraints to update the model’s parameters, thereby enhancing both the interpretability and accuracy.
3.2. Establishment of the Evaluation Framework and ER Fusion
Before predicting ICS network security, it is necessary to delineate the structural framework of the ICS network to effectively utilize various types of information. This paper models the ICS network by considering its structure, the significance of different layers, the severity of attacks, and the frequency of attacks. The established four-level evaluation framework is illustrated in Figure 2.
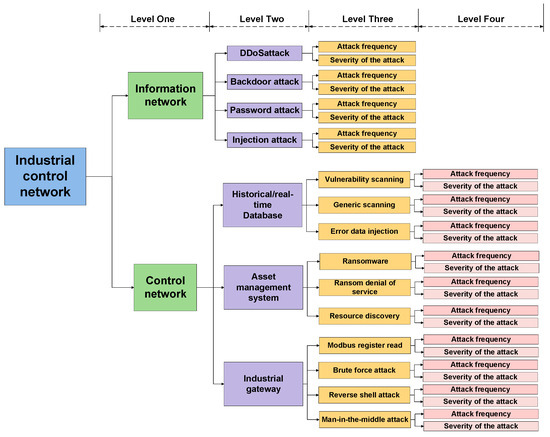
Figure 2.
Four-level assessment framework.
Based on Figure 2, this paper categorizes the ICS (Industrial Control System) network into four levels and selects the representative network attacks within the ICS framework to ensure accuracy and reliability. The first level of evaluation indicators includes both the information network and the control network. The information network extends to the third level, with the second-level indicators focusing on various types of network attacks it experiences. This is due to the heightened vulnerability of information networks to common threats, such as DDoS attacks, backdoor attacks, password attacks, and injection attacks. The third-level indicators assess the frequency and severity of these attacks. The control network extends to the fourth level. Typically, the control network comprises control and detection devices, making its second-level indicators’ specific systems and devices, including historical/real-time databases, asset management systems and industrial gateways. The third-level indicators evaluate the various network attacks faced by these systems or devices, which include vulnerability scanning, ransomware, and Modbus register reading attacks. Finally, the fourth-level indicators assess the frequency and severity of specific attacks, where attack frequency refers to the number of attacks within a given timeframe, and severity is determined based on expert assessments.
After setting up the structural framework, the next step is to analyze the data to assess the current network security situation. This paper uses the ER fusion method to integrate the data. The specific steps are as follows:
Step 1. Initialization
Assume there are basic attributes {} that constitute the evaluation system, with corresponding weights {}, where 0 ≤ ≤ 1. The recognition framework consists of d levels of evaluation grades J. The evaluation indicators for each level are described as follows:
where represents the l-th evaluation attribute. denotes the weight of the l-th evaluation attribute. represents the w-th evaluation grade. indicates the confidence level of the l-th attribute. represents the recognition framework. denotes the global ignorance.
Step 2. Basic Probability Mass
Calculate the basic probability mass corresponding to the confidence level . The calculation is as follows:
Here, represents the l-th evaluation indicator. denotes the basic probability mass of the indicator. indicates the basic probability mass that is not allocated within the indicator. represents the basic probability mass not allocated to any indicator other than the l-th evaluation indicator. signifies the incompleteness of the indicator in the power set of probability masses.
Step 3. ER Iteration
- (a)
- Combine Basic Probability Mass
Calculate the combined probability mass from the basic probability mass using the following equation:
where denotes the normalization coefficient, which ensures that the total probability mass sums to one.
- (b)
- Combine Confidence Levels
The equation for combining confidence levels is as follows:
The term represents the joint confidence of the fused indicators. The term represents the confidence assigned to the fused indicators that have not been allocated to any specific result.
- (c)
- Final Confidence Level
Combine the synthesized basic probability mass with subsequent evidence, iterating through steps (a) and (b), and ultimately calculate the final confidence level . The equation is as follows:
- (d)
- Fusion Result
Assume the utility of evaluation level is . The final fused utility is given by the following:
The final assessment is normalized to a range between 0 and 1, where values closer to 0 indicate higher security.
Once the data have been integrated, the interpretable definition needs to be set up for the ICS network and the predictive model.
3.3. Definition of Model Interpretability
To develop an efficient and interpretable model, it is crucial first to study the network security structure and operational mechanisms of ICSs. Historical data are utilized to train the model, and expert knowledge is employed to set the initial parameters. However, relying solely on these two methods to establish a BRB prediction model has its limitations in terms of accuracy. To enhance prediction accuracy, optimization algorithms have been introduced for iterative parameter updates. While this can improve prediction accuracy, it often leads to a decrease in interpretability and may sometimes result in unrealistic outcomes. For example, there might be minimal differences between the best- and worst-case scenarios. Therefore, this study aims to ensure and enhance the interpretability of the model.
Cao et al. established certain interpretability criteria for BRB models to ensure their transparency [28]. These criteria focus on three aspects: the knowledge base, inference mechanism, and model optimization. The ICS network security situation prediction model proposed in this paper was constructed based on these interpretability standards to prevent a lack of interpretability. The interpretability criteria are illustrated in Figure 3.
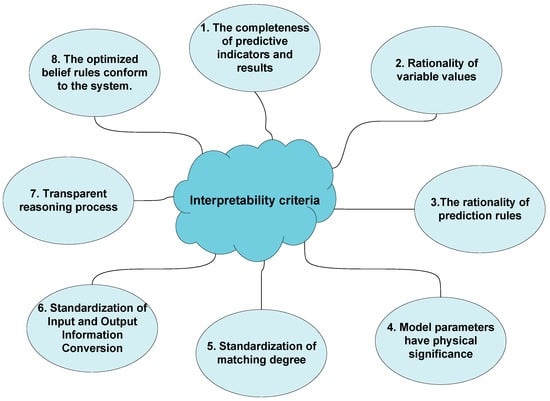
Figure 3.
Interpretability criteria.
The interpretability criteria stipulate that the optimized confidence distribution should generally align with the expert’s confidence distribution. Experts ensure this interpretability by constructing an initial confidence distribution and setting acceptable parameter error limits. In the context of ICS network security situation predictions, the results are categorized into five levels: A (0.2), B (0.4), C (0.6), D (0.8), and E (1). A higher value indicates lower safety. Under normal circumstances, the confidence distribution should exhibit a convex or monotonically increasing shape, rather than a concave one, thereby accurately reflecting the actual security conditions.
3.4. Construction and Inference of the BRB-e Prediction Model
Once the interpretability definition is set, the BEB-e prediction model needs to be built and inferred. The BRB-e model was constructed using IF–THEN rules and comprises a series of confidence rules. This model is both traceable and interpretable. The relationship described by the k-th rule with respect to the ICS network security situation prediction metrics and states can be outlined as follows:
Here, k represents the k-th confidence rule. and denote the antecedent attributes, reflecting the security states of the ICS network at two consecutive time points. and are the reference values associated with these antecedent attributes. represents the predicted outcome at time s + 1. The predicted results are denoted by with indicating the confidence levels for these predictions. represents the weight of the k-th rule, while and denote the weights of the respective antecedent attributes. The modeling process for the ICS network security situation prediction model is illustrated in Figure 4.
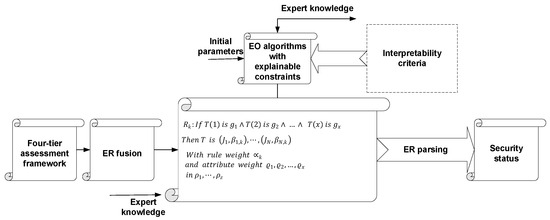
Figure 4.
The modeling process of the ICS cyber security situation prediction model.
In the BRB-e prediction model, ER parsing was employed to facilitate inference. The procedure is outlined in the following steps:
Step 1: Rule Matching Degree
After inputting the attribute data, the degree of rule matching is computed using the equation below. This step ensures that the data types are standardized:
Step 2: Activation Weight
When an attribute activates a belief rule, its activation weight is calculated using the equation provided:
Step 3: ER Parsing
Following the calculation of the activation weights, the rules are combined through ER parsing, as indicated by the equation below:
Step 4: Utility Calculation
Once the confidence levels for each assessment level have been determined, the prediction is derived through utility calculation, as described by the equation below:
3.5. Optimization Process of BRB-e
When constructing and inferring, the complexity of the ICS environment and the uncertainty of experts may affect the prediction accuracy. To enhance the precision of the prediction model, optimization algorithms are typically employed to adjust parameters, aiming to achieve a better predictive performance. However, focusing solely on improving prediction results without considering the reasonableness of the updated parameters can reduce the interpretability of the BRB model. To address this, this study employed an EO algorithm with interpretability constraints to update the parameters, thereby improving prediction accuracy while preserving interpretability. The flowchart of the EO algorithm with interpretability constraints is illustrated in Figure 5.
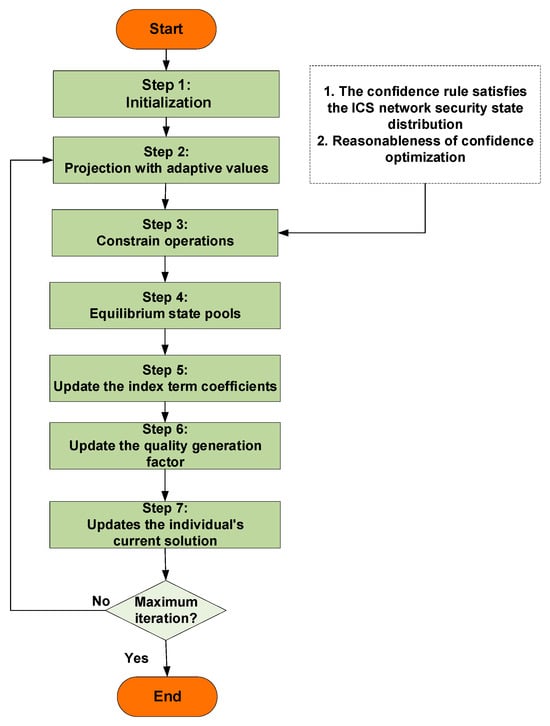
Figure 5.
Flow diagram of EO algorithm with explainable constraints.
The model aims to enhance prediction accuracy by updating coefficients, necessitating the definition of constraints and functions for optimization. These are outlined as follows:
Once the model’s properties, conditions, and functions are established, a standard for evaluating prediction accuracy must be defined. Optimization utilizes the mean squared error (MSE) to assess prediction accuracy. The MSE measures the accuracy of the predictions by comparing the predicted security values with the actual assessed security values. The equation is as follows:
In this study, represents the predicted security value generated by the model, while denotes the actual security value assessed for the ICS network. The equation is given by . Here, denotes the number of training samples used for the prediction model. This paper enhances the interpretability of the EO algorithm by introducing interpretability constraints to improve its optimization performance. The technical process of the EO optimization algorithm is illustrated in Figure 5 and is detailed as follows:
Step 1: Initialization
The fundamental EO algorithm generates parameters randomly. To improve interpretability, parameters are generated around the initial values provided by experts, which reflect long-term accumulated knowledge. This approach ensures that the parameters are more reasonable and interpretable.
represents the initial parameters set by the experts. denotes the (G + 1)-th solution in the G-th optimization iteration. is the random variable in the G-th optimization. denotes the covariance matrix. represents the normal distribution.
Step 2: Projection and Adaptation
The parameters are projected onto a hyperplane using the method described below. Subsequently, the adaptive values are calculated according to the following equation:
where refers to the number of constraint variables for the solution. denotes the parameter set. represents the equality parameter vector.
Step 3: Constraint Operations
To enhance the interpretability of the optimization algorithm, constraints are introduced. These constraints are as follows:
Constraint 1: The confidence rules reflect the interpretability of the BRB and serve as a bridge between the ICS network attributes and the predicted security state. Optimized rules from the original algorithm may often conflict with actual conditions. Therefore, the optimized rules must align with real-world scenarios. This constraint adheres to the interpretability standard outlined in Section 3.3, Item 8.
Here, signifies the interpretability constraint on the confidence distribution under the k-th rule. Since this constraint is derived based on the specific conditions of the actual system, it does not have a fixed form and is determined by the actual system and expert input.
Constraint 2: Another constraint pertains to the confidence level of the rules. Since the initial confidence levels are set by experts based on practical considerations, the updated rules must not deviate significantly from expert knowledge to maintain interpretability. Therefore, a constraint range is set for the rule confidence levels.
In this context, represents the confidence level of the j-th parameter in the i-th rule. denotes the minimum confidence level provided by experts, while indicates the maximum confidence level given by the experts.
Step 4: Balancing State Pool
In order to increase the global optimization ability and the local optimal solution, four optimal solutions are selected, and then the average optimal solution is obtained through the four optimal solutions. The balanced state pool for the candidate solutions is defined as follows:
Step 5: Update Exponential Coefficients
To improve both local and global search capabilities, an exponential coefficient F is set. The calculation is as follows:
Additionally, is the global search weight constant, and denotes the sign function. represents the random vector, with its dimension matching the dimensionality of the optimization space.
Step 6: Update Quality Generation Coefficients
To better identify local optimal solutions, the generation rate S is restricted. The calculation is as follows:
represents the generation rate control parameter vector. is a random vector, with its dimension also corresponding to the optimization space dimensionality.
Step 7: Update Individual Current Solutions
For the optimization problem, the update process for individual solutions is as follows:
Steps 2 through 7 are repeated until the iteration count criterion is met, at which point the loop terminates, resulting in the optimal parameters.
4. Case Study
This section utilizes the X-IIoTID Dataset [29] and the TON-IoT Dataset [30,31,32] for the experimental data. Initially, data from various layers are fused using the ER methodology to obtain the assessment results. These results are then used as the test data for model evaluation. The BRB-e model was constructed and tested, and its performance was compared with other methods. Due to the interpretability of BRB-e, it can provide more reasonable and understandable references for practitioners, thereby aiding in security management.
4.1. Problem Statement
Given the diverse aspects to consider for ICS network security, this paper divides ICSs into two components: control networks and information networks. The X-IIoTID Dataset [29] was selected for the control network data. This dataset is a device-independent network intrusion dataset focusing on attacks on historical/real-time databases, asset management systems, and industrial gateways. The TON-IoT Dataset [30,31,32] was chosen for the information network data, containing IoT service data and network traffic data, and is subject to various types of network attacks.
After partitioning the datasets, ER fusion was applied to the data to obtain security assessment values, which were used to determine the current security status. During ER fusion, the data were merged based on attack frequency and severity, considering specific attack types or device security conditions to derive the final security assessment value. For the experiments, a continuous period of 120 h of data was selected. The data were divided into 120 hourly segments. Using a sliding window method, these 120 segments were transformed into 118 experimental datasets for prediction. Of these, 108 segments were used as the training data, and 10 segments were used as the test data.
4.2. ER Iterative Algorithm Fusion
Before conducting the experiments, it was essential to fuse the experimental data to obtain specific security assessment values. The ER fusion process integrated information from both the control network and the information network to derive the security assessment value for the ICS network. This security assessment is illustrated in Figure 6. These security assessment values were then utilized as training and testing data for the BRB-e prediction model, thereby providing a reliable basis for subsequent predictions.
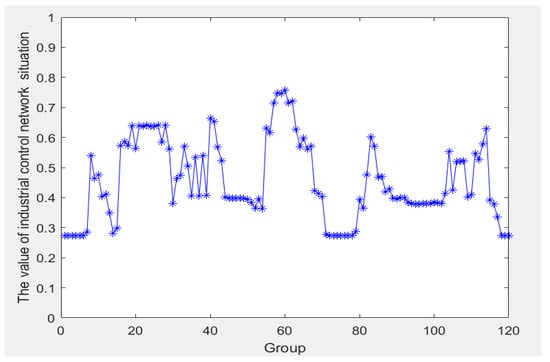
Figure 6.
ICS cyber security assessment values.
4.3. Development of ICS Security Situation Prediction Model Based on BRB-e
Once the security assessment values were obtained, the development of the prediction model could commence. The prediction model for network security situational awareness based on BRB uses confidence rules, described as follows:
The model’s initial parameters are set by experts. In this study, a sliding window approach is employed, where the assessment security values from adjacent time periods are used as two input attributes for the model to derive the final predicted security value. The prediction results are categorized into five levels: Excellent (A), Good (B), Fair (C), Poor (D), and Critical (E).
4.4. Experimental Results
According to the cybersecurity situational awareness index grading published by CNCERT/CC, each rule was assigned five reference values, resulting in a total of 25 rules. This approach clarifies the reference values. Initially, the rule weights and attributes are set to 1, and some initial confidence levels and interpretability constraints are shown in Table 1 to meet interpretability standards. The reference points and reference values for the final output are detailed in Table 2. Based on the cybersecurity situational awareness index grading from CNCERT/CC, higher values indicate lower security.

Table 1.
BRB-e model confidence with interpretability constraints.
Table 2.
Reference points and reference values.
Expert knowledge, which represents a long-term accumulated experience in ICSs, is a crucial source of interpretability for BRB-e. It is assumed that expert knowledge is rigorous and reliable, thus the trust in the initial BRB constructed using this knowledge is high. The initial parameters of the BRB-e model are set using expert knowledge, and the BRB-e model is used to make appropriate adjustments to the expert’s parameters, ensuring that these adjustments do not deviate significantly from the expert settings. Consequently, the adjusted confidence distribution should closely align with the expert’s trends, thereby reflecting the “interpretability” of the prediction model.
The BRB-e prediction model was compared with a basic BRB model incorporating expert knowledge. The comparison results are illustrated in Figure 7. The mean squared error (MSE) of the basic BRB model was 0.0172, while the MSE of the BRB-e model was 0.079. The BRB-e model not only maintained interpretability but also demonstrated improved prediction accuracy.
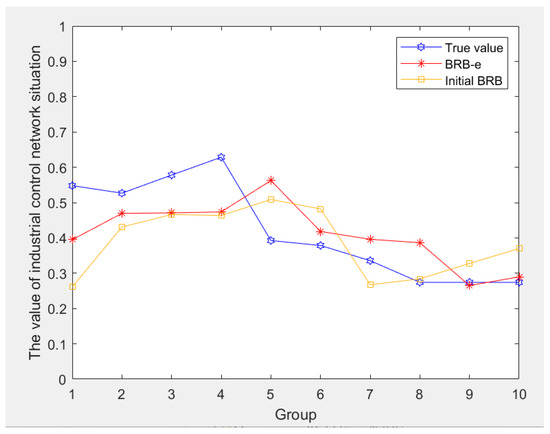
Figure 7.
Comparison of prediction results.
Figure 8 shows the confidence distributions of some rules set by BRB-e compared to those based on expert knowledge. It is evident that the confidence distributions of BRB-e aligned closely with the expert knowledge, with no unreasonable distributions observed. This indicates that BRB-e, through its interpretability constraints, effectively enhanced its overall interpretability.
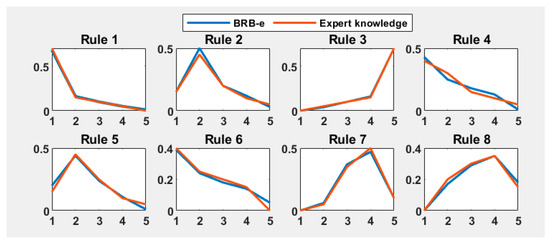
Figure 8.
Confidence distribution of BRB-e and expert knowledge.
4.5. Comparative Experiments
A comparative experiment was conducted between the P-CMA-ES-BRB, EO-BRB, WOA, backpropagation neural network (BP), Radial Basis Function (RBF) models, and the BRB-e model. Figure 9 and Figure 10 illustrate the confidence distributions for P-CMA-ES and EO, while Table 3 presents the prediction accuracy of each method.
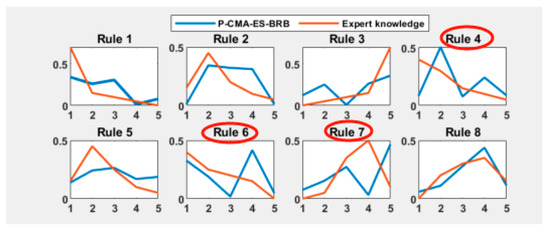
Figure 9.
Confidence distribution of P-CMA-ES-BRB.
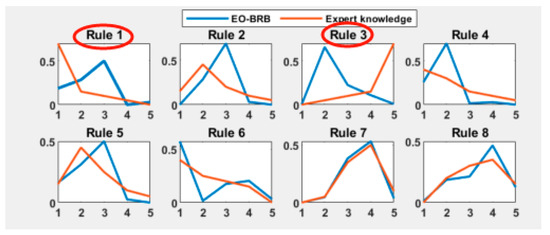
Figure 10.
Confidence distribution of EO-BRB.
Table 3.
Predicted MSE values for each model.
The prediction accuracy was compared using the mean squared error (MSE), Root Mean Squared Error (RMSE), and Mean Absolute Percentage Error (MAPE). As shown in Table 3, the BRB-e model demonstrated superior prediction accuracy compared to the other models. Although the P-CMA-ES-BRB and EO-BRB models also exhibited good prediction accuracies, Figure 8, Figure 9 and Figure 10 reveal that the optimization algorithms without interpretability constraints sometimes produced confidence distributions that were contrary to expert settings or exhibited unreasonable confidence levels, as indicated by the red circles. The BRB-e model avoided these issues by incorporating interpretability constraints and optimizing parameters around expert knowledge. As for the convergence degree of the EO algorithm, in the comparison of P-CMA-ES-BRB and WOA, the convergence degree was not much different, a total of 200 cycles were executed, and the convergence was between 50 and 100.
Compared to the BP and RBF models, the BRB-e model had the following advantages:
- It is a transparent inference system, while BP and RBF are black-box models that do not reveal their internal structures.
- It provides reasonable explanations for results.
- It utilizes both historical data and expert knowledge, making it easier to understand.
- It has a lower dependence on data, as it incorporates insights from both historical data and expert knowledge. In contrast, BP and RBF models rely heavily on quantitative analysis, making them more dependent on historical data. This dependence can significantly affect prediction accuracy when the data volume is low, and their black-box nature obscures the underlying mechanisms.
To demonstrate that BRB-e outperforms other optimization algorithms, we varied the training samples and assessed how changes in training data affected the prediction accuracy. A total of 118 datasets were used, with the last 10, 20, and 30 sets designated as test data, while the remainder served as training data. The prediction results were evaluated using the mean squared error (MSE). A comparison is presented in Table 4.
Table 4.
Predicted MSE values for optimization algorithms.
Table 4 shows that the BRB-e model maintains higher prediction accuracy than other optimization algorithms, even when the training data is reduced. Additionally, it demonstrates improved prediction accuracy in scenarios with limited historical data. Furthermore, its interpretability enhances its credibility.
Based on the above analysis, the BRB-e model is well-suited for predicting ICS network security and can enhance prediction accuracy.
5. Conclusions
This paper proposes a novel ICS network security situation prediction model. First, the structure of the ICS is analyzed and divided into a four-tier evaluation framework. ER is utilized to integrate this framework, allowing for the better utilization of various types of information. Based on the principles of interpretability, the BRB-e model’s initial parameters are set using expert knowledge, and the reasoning is conducted accordingly. Then, the EO algorithm is added with explainability constraints to enhance the interpretability of the model. Furthermore, it solves the problems of the insufficient use of expert knowledge, the inconsistency between the optimized rules and the actual ICS network, and the unreasonable confidence level. This in turn ensures that the prediction process is explainable, and the prediction results can be traced. Through the case study of ICS network security, it was proved that the BRB-e model had a good prediction effect in the prediction of an ICS network security situation. It provided a more effective auxiliary decision-making method for ICS network security situation prediction.
In future research, it will be essential to establish reasonable interpretability constraints for the BEB-e model specifically tailored to ICS network security. Additionally, the criteria for assessing the effectiveness of these constraints require further discussion. Regarding the EO algorithm, it is important to address issues related to being trapped in local optima and the need for random exploration. Given the significant impact of expert knowledge on prediction accuracy, it may be beneficial to establish criteria to evaluate the credibility of parameters set by experts. Furthermore, when the parameters of the BRB model become too numerous, a combinatorial explosion may occur, necessitating strategies to mitigate this issue. Enhancing interpretability while ensuring accuracy presents a significant challenge that warrants further investigation.
Author Contributions
G.L.: conceptualization, formal analysis, software, and writing—review and editing. Y.W.: funding acquisition, supervision, and writing—review and editing. J.Y.: data curation and validation. S.L.: data curation and validation. X.L.: investigation and visualization. H.M.: investigation and visualization. All authors have read and agreed to the published version of the manuscript.
Funding
This research was supported by the Provincial Universities Basic Business Expense Scientific Research Projects of Heilongjiang Province (2021-KYYWF-0179), the Social Science Foundation of Heilongjiang Province of China (21GLC189), the China University Industry-University-Research Innovation Fund (2022HS055), the Natural Science Foundation of Heilongjiang Province of China JJ2021LH1148, and the Postgraduate Innovation Project of Harbin Normal University (HSDSSCX2024-40).
Data Availability Statement
The raw data supporting the conclusions of this article will be made available by the authors on request.
Conflicts of Interest
The authors declare no conflicts of interest.
References
- Alladi, T.; Chamola, V.; Zeadally, S. Industrial control systems: Cyberattack trends and countermeasures. Comput. Commun. 2020, 155, 1–8. [Google Scholar] [CrossRef]
- Bhamare, D.; Zolanvari, M.; Erbad, A.; Jain, R.; Khan, K.; Meskin, N. Cybersecurity for industrial control systems: A survey. Comput. Secur. 2020, 89, 101677. [Google Scholar] [CrossRef]
- Knapp, E.D. Industrial Network Security: Securing Critical Infrastructure Networks for Smart Grid, SCADA, and Other Industrial Control Systems; Elsevier: Amsterdam, The Netherlands, 2024. [Google Scholar]
- Wang, B.; Liu, H.; Zhang, Y.; Lü, S.; Wang, Z.; Wang, Q. Review on Key Technologies of Industrial Control System Security Simulation. J. Syst. Simul. 2021, 33, 1466–1488. [Google Scholar]
- Latorre-Biel, J.I.; Ferone, D.; Juan, A.A.; Faulin, J. Combining simheuristics with Petri nets for solving the stochastic vehicle routing problem with correlated demands. Expert Syst. Appl. 2021, 168, 114240. [Google Scholar] [CrossRef]
- Bustos, O.; Pomares-Quimbaya, A. Stock market movement forecast: A systematic review. Expert Syst. Appl. 2020, 156, 113464. [Google Scholar] [CrossRef]
- Liu, K.; Xie, Y.; Xie, S.; Sun, L. SEAG: A novel dynamic security risk assessment method for industrial control systems with consideration of social engineering. J. Process Control 2023, 132, 103131. [Google Scholar] [CrossRef]
- Semke, L.M.; Tiberius, V. Corporate foresight and dynamic capabilities: An exploratory study. Forecasting 2020, 2, 180–193. [Google Scholar] [CrossRef]
- Kumar, S.; Sahoo, S.; Lim, W.M.; Kraus, S.; Bamel, U. Fuzzy-set qualitative comparative analysis (fsQCA) in business and management research: A contemporary overview. Technol. Forecast. Soc. Chang. 2022, 178, 121599. [Google Scholar] [CrossRef]
- Chauhan, R.; Kaur, H.; Alankar, B. Air quality forecast using convolutional neural network for sustainable development in urban environments. Sustain. Cities Soc. 2021, 75, 103239. [Google Scholar] [CrossRef]
- Nagarajan, S.; Kayalvizhi, S.; Subhashini, R.; Anitha, V. Hybrid honey badger-world cup algorithm-based deep learning for malicious intrusion detection in industrial control systems. Comput. Ind. Eng. 2023, 180, 109166. [Google Scholar] [CrossRef]
- Wang, W.; Liu, W.; Chen, H. Information granules-based BP neural network for long-term prediction of time series. IEEE Trans. Fuzzy Syst. 2020, 29, 2975–2987. [Google Scholar] [CrossRef]
- Gu, H.; Lai, Y.; Wang, Y.; Liu, J.; Sun, M.; Mao, B. DEIDS: A novel intrusion detection system for industrial control systems. Neural Comput. Appl. 2022, 34, 9793–9811. [Google Scholar] [CrossRef]
- Liu, Y.; Chen, H.; Zhang, L.; Wang, X. Risk prediction and diagnosis of water seepage in operational shield tunnels based on random forest. J. Civ. Eng. Manag. 2021, 27, 539–552. [Google Scholar] [CrossRef]
- Li, C.; Li, F.; Zhang, L.; Yang, A.; Hu, Z.; He, M. Intrusion Detection for Industrial Control Systems Based on Improved Contrastive Learning SimCLR. Appl. Sci. 2023, 13, 9227. [Google Scholar] [CrossRef]
- Obianyo, J.I.; Udeala, R.C.; Alaneme, G.U. Application of neural networks and neuro-fuzzy models in construction scheduling. Sci. Rep. 2023, 13, 8199. [Google Scholar] [CrossRef]
- Luo, X.; Nadiga, B.T.; Park, J.H.; Ren, Y.; Xu, W.; Yoo, S. A Bayesian Deep Learning Approach to Near-Term Climate Prediction. J. Adv. Model. Earth Syst. 2022, 14, e2022MS003058. [Google Scholar] [CrossRef]
- Zhan, J.; Huang, X.; Qian, Y.; Ding, W. A fuzzy C-means clustering-based hybrid multivariate time series prediction framework with feature selection. IEEE Trans. Fuzzy Syst. 2024, 32, 4270–4284. [Google Scholar] [CrossRef]
- Wang, Y.-M.; Yang, J.-B.; Xu, D.-L.; Chin, K.-S. The evidential reasoning approach for multiple attribute decision analysis using interval belief degrees. Eur. J. Oper. Res. 2006, 175, 35–66. [Google Scholar] [CrossRef]
- Yang, J.-B.; Liu, J.; Wang, J.; Sii, H.-S.; Wang, H.-W. Belief rule-base inference methodology using the evidential reasoning approach-RIMER. IEEE Trans. Syst. Man Cybern. Part A Syst. Hum. 2006, 36, 266–285. [Google Scholar] [CrossRef]
- Cheng, C.; Wang, J.; Zhou, Z.; Teng, W.; Sun, Z.; Zhang, B. A BRB-based effective fault diagnosis model for high-speed trains running gear systems. IEEE Trans. Intell. Transp. Syst. 2020, 23, 110–121. [Google Scholar] [CrossRef]
- Yang, Q.; Wang, Y.; Li, S.; Yang, C.; Li, G.; Yuan, Y. A Security Evaluation Model of the Industrial Internet Based on a Selection Covariance Matrix. IEEE Access 2024, 12, 133770–133783. [Google Scholar] [CrossRef]
- Wang, Y.; Yang, Y.; Gao, R.; Li, S.; Zhao, Y. A Security Situation Prediction Model for Industrial Control Network Based on EP-CMA-ES. IEEE Access 2023, 11, 135449–135462. [Google Scholar] [CrossRef]
- Cheng, M.; Li, S.; Wang, Y.; Zhou, G.; Han, P.; Zhao, Y. A New Model for Network Security Situation Assessment of the Industrial Internet. Comput. Mater. Contin. 2023, 75, 2527–2555. [Google Scholar] [CrossRef]
- Han, P.; Zhao, B.; He, W.; Kong, L.; Li, Y.; Zhou, G.; Feng, J. An interpretable BRB model with interval optimization strategy for lithium battery capacity prediction. Energy Sci. Eng. 2023, 11, 1945–1959. [Google Scholar] [CrossRef]
- Li, G.; Wang, Y.; Li, S.; Yang, C.; Yang, Q.; Yuan, Y. Network Security Prediction of Industrial Control Based on Projection Equalization Optimization Algorithm. Sensors 2024, 24, 4716. [Google Scholar] [CrossRef]
- Batchkova, I.A.; Tzakova, D.L.; Belev, Y.A. Standards for monitoring and control of cyber-physical systems. Industry 4.0 2019, 4, 3–6. [Google Scholar]
- Cao, Y.; Zhou, Z.; Hu, C.; He, W.; Tang, S. On the interpretability of belief rule-based expert systems. IEEE Trans. Fuzzy Syst. 2020, 29, 3489–3503. [Google Scholar] [CrossRef]
- Al-Hawawreh, M.; Sitnikova, E.; Aboutorab, N. X-IIoTID: A connectivity-agnostic and device-agnostic intrusion data set for industrial Internet of Things. IEEE Internet Things J. 2021, 9, 3962–3977. [Google Scholar] [CrossRef]
- Alsaedi, A.; Moustafa, N.; Tari, Z.; Mahmood, A.; Anwar, A. TON_IoT telemetry dataset: A new generation dataset of IoT and IIoT for data-driven intrusion detection systems. IEEE Access 2020, 8, 165130–165150. [Google Scholar] [CrossRef]
- Moustafa, N. A new distributed architecture for evaluating AI-based security systems at the edge: Network TON_IoT datasets. Sustain. Cities Soc. 2021, 72, 102994. [Google Scholar] [CrossRef]
- Booij, T.M.; Chiscop, I.; Meeuwissen, E.; Moustafa, N.; den Hartog, F.T.H. ToN_IoT: The role of heterogeneity and the need for standardization of features and attack types in IoT network intrusion data sets. IEEE Internet Things J. 2021, 9, 485–496. [Google Scholar] [CrossRef]
Disclaimer/Publisher’s Note: The statements, opinions and data contained in all publications are solely those of the individual author(s) and contributor(s) and not of MDPI and/or the editor(s). MDPI and/or the editor(s) disclaim responsibility for any injury to people or property resulting from any ideas, methods, instructions or products referred to in the content. |
© 2024 by the authors. Licensee MDPI, Basel, Switzerland. This article is an open access article distributed under the terms and conditions of the Creative Commons Attribution (CC BY) license (https://creativecommons.org/licenses/by/4.0/).