Abstract
Outliers are observations that are significantly different from the other observations in a dataset. These types of observations are asymmetric in nature due to a lack of symmetry. The estimation of the cumulative distribution function (CDF) is an important statistical measure commonly discussed for symmetric datasets. However, the estimation of the CDF in the case of the asymmetric nature of the dataset is not a much-explored topic. In this article, we use calibration methodology with auxiliary information for modifying the traditional stratification weight, and hence, we obtain efficient estimates of the CDF using robust measures, i.e., mid-range and tri-mean, under the different distance functions. A simulation study is carried out to see the performance of proposed and existing estimators using asymmetric real-life datasets.
1. Introduction
Finding the percentage of research variables that are less than or equal to a specific value is important, and this leads to the estimation method of the countable population CDF. In some cases, it is thought necessary to estimate the CDF. For instance, a soil scientist would be curious to discover how many people in a developing nation are living in poverty. We are usually concerned with the percentage of values in the population. In certain situations, the need for a CDF is more important. Users of sample survey data frequently need to calculate the population CDF or, alternatively, the percentage of population elements whose values are less than or equal to a certain value . For instance, we might be interested in the percentage of agricultural land where pesticide poisoning effects are less than zero or the percentage of filtration facilities where arsenic is present in portable water that is less than zero. Such a percentage is a specific value of the population’s CDF.
where for and for . In surveys, we can frequently only measure the research variable for those items in a sample; hence, the typical estimation methods of the CDF depend solely on the choice of the sampling design and the sampled percentage of the population. can be estimated by
Many researchers have calculated the CDF using data from one or more additional variables. First of all, Reference [1] proposed a method for estimating the countable population CDF. Reference [2] obtained ratio and difference estimation methods for a population CDF under a general sample design using supplementary population variables. They demonstrated the benefits of the design-based estimation method over the model-based estimation method in the case of model misspecifications, especially for large samples. Reference [3] developed a traditional as well as a prediction technique for estimating the CDF from survey data. Reference [4] proposes an estimator for the finite population CDF using the model-calibration pseudo-empirical likelihood technique. Reference [5] considers the issue of estimating the CDF and quantiles for a countable population using supplementary data. Reference [6] develops a generalized family of estimation methods for estimating the CDF using auxiliary variables. Reference [7] develops an efficient approach for the estimation of process variability by using the exponential technique. Reference [8] developed two new families for the estimation of the countable population CDF in the case of non-response under simple random sampling. They studied two different types of non-response situations: (i) non-response on both the research and supplementary data; and (ii) non-response just on the research data. The developed estimation methods are compared to existing estimation methods, both theoretically and numerically. Reference [9] developed a new family of estimation methods for the finite CDF using the stratified random sampling (StRS) method. Reference [10] also proposed a generalized class of exponential factor type estimation methods for estimating the countable population CDF with supplementary information in the form of the average and rank of the supplementary information.
In recent years, the calibration estimation method has become an important area of study in survey sampling. By using auxiliary data, the calibration estimation technique increases the accuracy of estimations by adjusting the original design weights. The calibration estimation method is a procedure for adjusting survey sampling weights in order to simulate population means, totals, etc. with the help of supplementary data. The pioneering article on calibration was written by Reference [11]. Reference [12] developed a calibration estimation method for mean estimation. Reference [13] proposed a calibration estimation method for estimating the population mean in StRS with various calibration conditions based on supplementary information. Reference [14] proposes a novel calibration estimation method for the population parameter of the study variable using newly calibrated weights for two supplementary variables under StRS. Reference [15] proposes a distance function. Using their developed distance function, a calibration estimation method of the population mean in StRS is obtained. References [16,17] extended the work by utilizing linear moments’ characteristics. Reference [18] developed two novel classes of ratio- and regression-type estimation methods of population variation under SRSWOR by integrating knowledge on nonconventional and robust dispersion measures of supplementary data. Reference [19] proposes a new robust calibration estimation method for estimating the population mean under StRS. Reference [12] methodology for CDF estimation, however, has not received much attention yet.
This article proposes a new calibration estimation method for the population CDF under StRS using new calibration conditions that include robust measures. The use of robust measures makes the calibration estimator of CDF more efficient. The rest of the article is organized as follows: In Section 2, an adapted estimator of CDF using robust measures is shown. In Section 3, the proposed CDF using robust measure estimators is developed. In Section 4, a numerical study is conducted. The article concludes in Section 5.
2. First Adapted Calibration Estimator of CDF Using Robust Measure
Outliers can be caused by a variety of factors, such as measurement errors, sampling bias, or extreme values. As they belong to an asymmetric nature. So, they can have a long tail on one side or the other, indicating that there are more extreme values in one direction than the other. Outliers can have a major impact on statistical analyses, as they can distort summary statistics and lead to misleading conclusions. So, in this article, we will use robust measures such as the mid-range and tri-mean to reduce the impact of outliers.
Let be a finite population of units, which is divided into homogeneous strata, where the size of stratum is , for in such a manner that . Assume that are the study and auxiliary variables, respectively. The stratum weights are defined as . The mid-range is defined as where is the minimum value in a population of size and is the maximum value in a population of size . The next measure included in this article is the tri-mean , which is the weighted average of the population median and two quartiles and is defined as: and They denote the population variance of the supplementary variable in stratum.
Under this StRS, the traditional unbiased estimator of the CDF is given by
where is the sample CDF estimate of in the stratum.
2.1. First Adapted Calibration Estimator of CDF
Taking motivation from Reference [15], the first adapted estimators are as follows:
where is the sample CDF of the study variable in stratum. Further, is the calibrated weight; we will use the sum of weighted squared deviation of calibrated weights function as given below:
and satisfy the calibration constraint
Note that denote the traditional stratum weight, are presenting the sample and population mid-range of the supplementary variable in the stratum, and is suitably chosen weights to decide different types of estimation methods. The Lagrange function is given by
where are multipliers of Lagrange and setting , we obtain
Substituting Equation (5) in Equation (3) and solving for lambda, we have
Substituting Equation (6) in Equation (5), we obtain the calibration weight as
Substituting Equation (7) in Equation (1), we obtain the calibrated estimator of CDF as given below:
2.2. Second Adapted Calibration Estimator of CDF
Taking motivation from Reference [15], the second adapted estimators are as follows:
where is the sample CDF of the study variable in the stratum. Further, is the calibrated weight; we will use the sum of weighted squared deviation of calibrated weights function as given below:
Subject to calibration constraints defined by
are presenting the sample and population mid-range and tri-mean of the supplementary variable in the stratum. The Lagrange function is given by
where and are the Lagrange’s multipliers, setting , we obtain
Thus, the calibration weight can be obtained as
Substituting Equation (14) in Equations (10) and (11), respectively, we obtain
Solving the system of equations for lambdas, we obtain
and
Substituting these values into Equation (14), we obtain the weights as given by
Writing these weights in Equation (8), we obtain the calibration estimator of CDF as
where betas are given by
and
3. Proposed Estimator
3.1. First Proposed Calibration Estimator of CDF
Taking inspiration from the first adapted estimator, we proposed the following CDF estimator:
where is the sample CDF of the study variable in stratum. Further, is the calibrated weight, we will use the chi-square distance function, as given below:
and satisfy the calibration constraint
Note that denote the traditional stratum weight, and are presenting the sample and population mid-range of the auxiliary variable in the stratum. The Lagrange function is given by
where are multipliers of Lagrange, setting , we obtain
Substituting Equation (19) in Equation (17), and solving for lambda, we have
Substituting Equation (20) in Equation (19), we obtain the calibration weight as
Substituting Equation (21) in Equation (15), we obtain the calibrated estimator of CDF, as given below
3.2. Second Proposed Calibration Estimator of CDF
Taking inspiration from the second adapted estimator, we proposed the following CDF estimator:
where is the sample CDF of the study variable in the stratum. Further, is the calibrated weight, we will use the chi-square distance function, as given below:
Subject to calibration constraints defined by
where are presenting the sample and population mid-range and tri-mean of the supplementary variable in the stratum. The Lagrange function is given by
where and are the Lagrange’s multipliers, setting , we obtain
Thus, the calibration weight can be obtained as
Substituting Equation (28) in Equations (24) and (25), respectively, we obtain
Solving the system of equations for lambdas, we obtain
and
Substituting these values into Equation (28), we obtain the weights as given by
Writing these weights in Equation (22), we obtain the calibration estimator of CDF as
where betas are given by
and
4. Numerical Study
To study the performance of the developed calibration estimation methods of CDF using robust measures, we generated four different real-life datasets. The Figure 1, Figure 2, Figure 3, Figure 4, Figure 5, Figure 6, Figure 7, Figure 8, Figure 9, Figure 10, Figure 11, Figure 12, Figure 13, Figure 14, Figure 15 and Figure 16 show that these populations have outliers and therefore belong to an asymmetric nature. We compared the mean square error (MSE) of the proposed estimators with the adapted estimators to evaluate which estimators performed more efficiently. For MSE estimation, we perform the steps of the simulation study as given below:
Figure 1.
Population 1 for h = 1.
Figure 2.
Population 1 for h = 2.
Figure 3.
Population 1 for h = 3.
Figure 4.
Population 1 for h = 4.
Figure 5.
Population 2 for h = 1.
Figure 6.
Population 2 for h = 2.
Figure 7.
Population 2 for h = 3.
Figure 8.
Population 2 for h = 4.
Figure 9.
Population 3 for h = 1.
Figure 10.
Population 3 for h = 2.
Figure 11.
Population 3 for h = 3.
Figure 12.
Population 3 for h = 4.
Figure 13.
Population 4 for h = 1.
Figure 14.
Population 4 for h = 2.
Figure 15.
Population 4 for h = 3.
Figure 16.
Population 4 for h = 4.
Step-1: Select a random sample with size through StRS from stratum ;
Step-2: Find the value of CDF estimates (say) ;
Step-3: Replicate the above steps times and attained ;
Step-4: Compute the MSE as
The bias MSEs and PREs are provided in Table 1, Table 2 and Table 3, respectively. It is interesting to notice that in the following part, we will compare the outcomes of all four populations using the quantile point.
Table 1.
Bias of proposed and adapted estimators.
Table 2.
MSE of proposed and adapted estimators.
Table 3.
PRE.
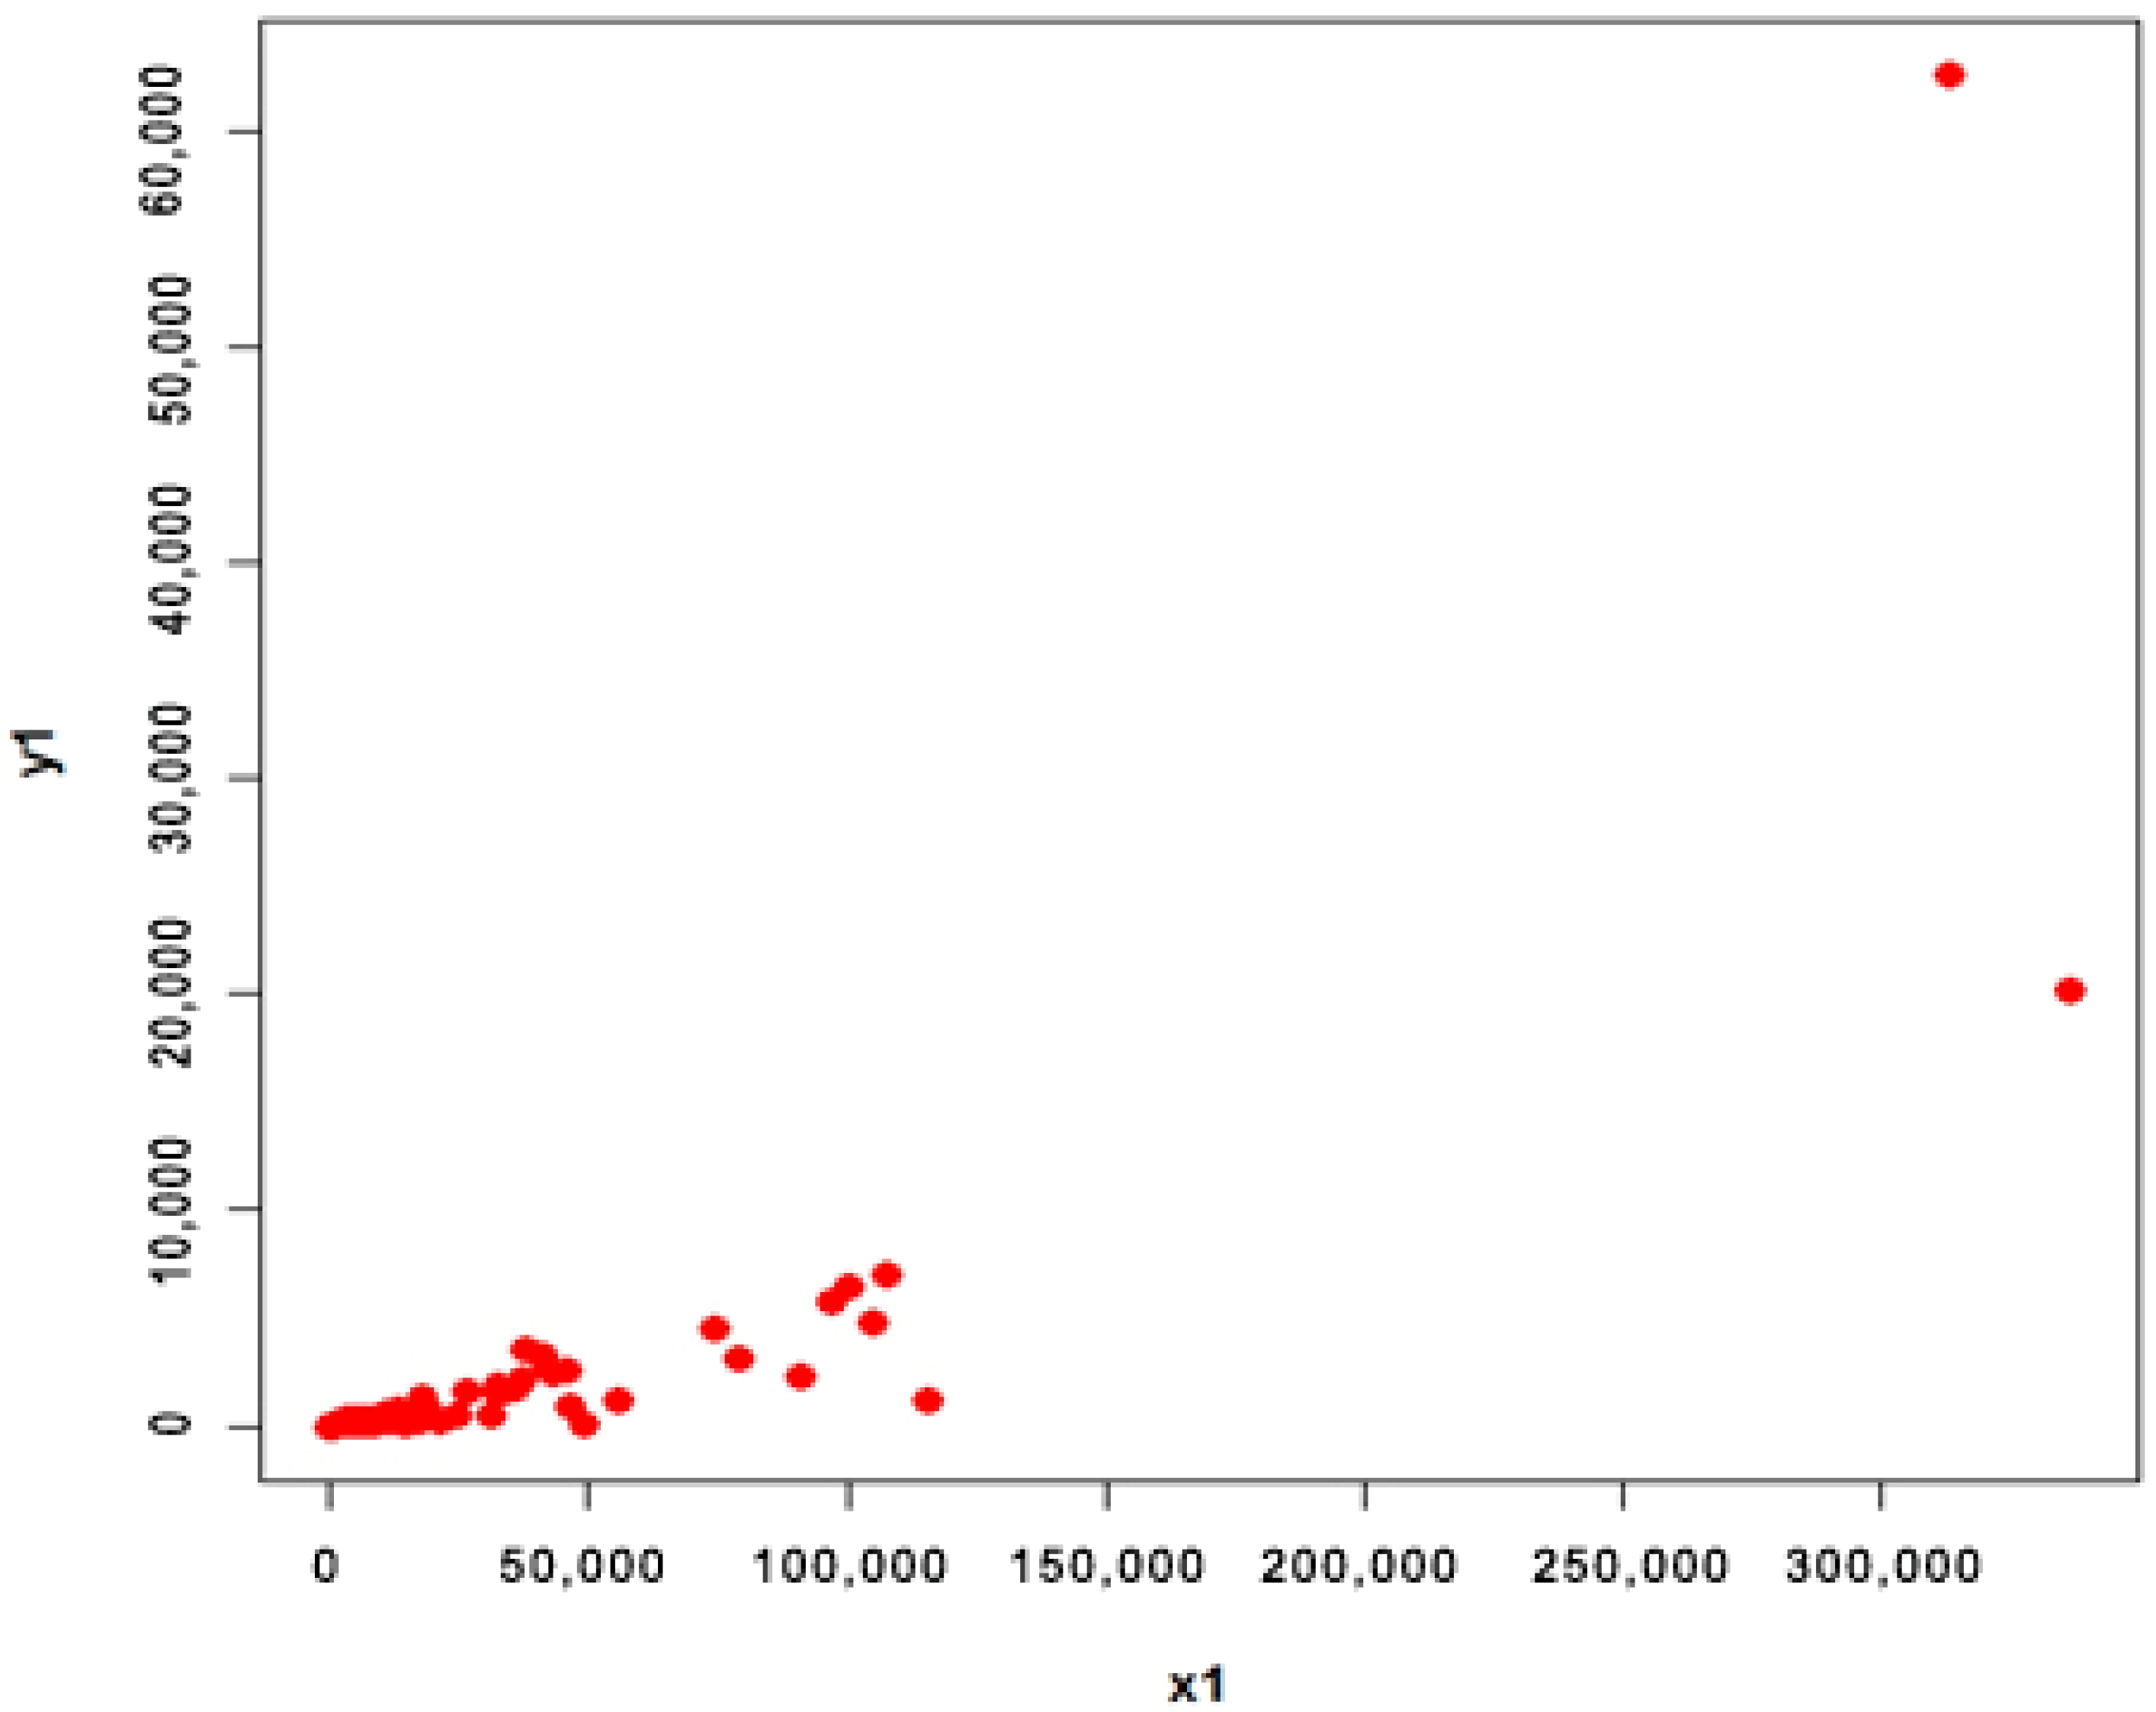
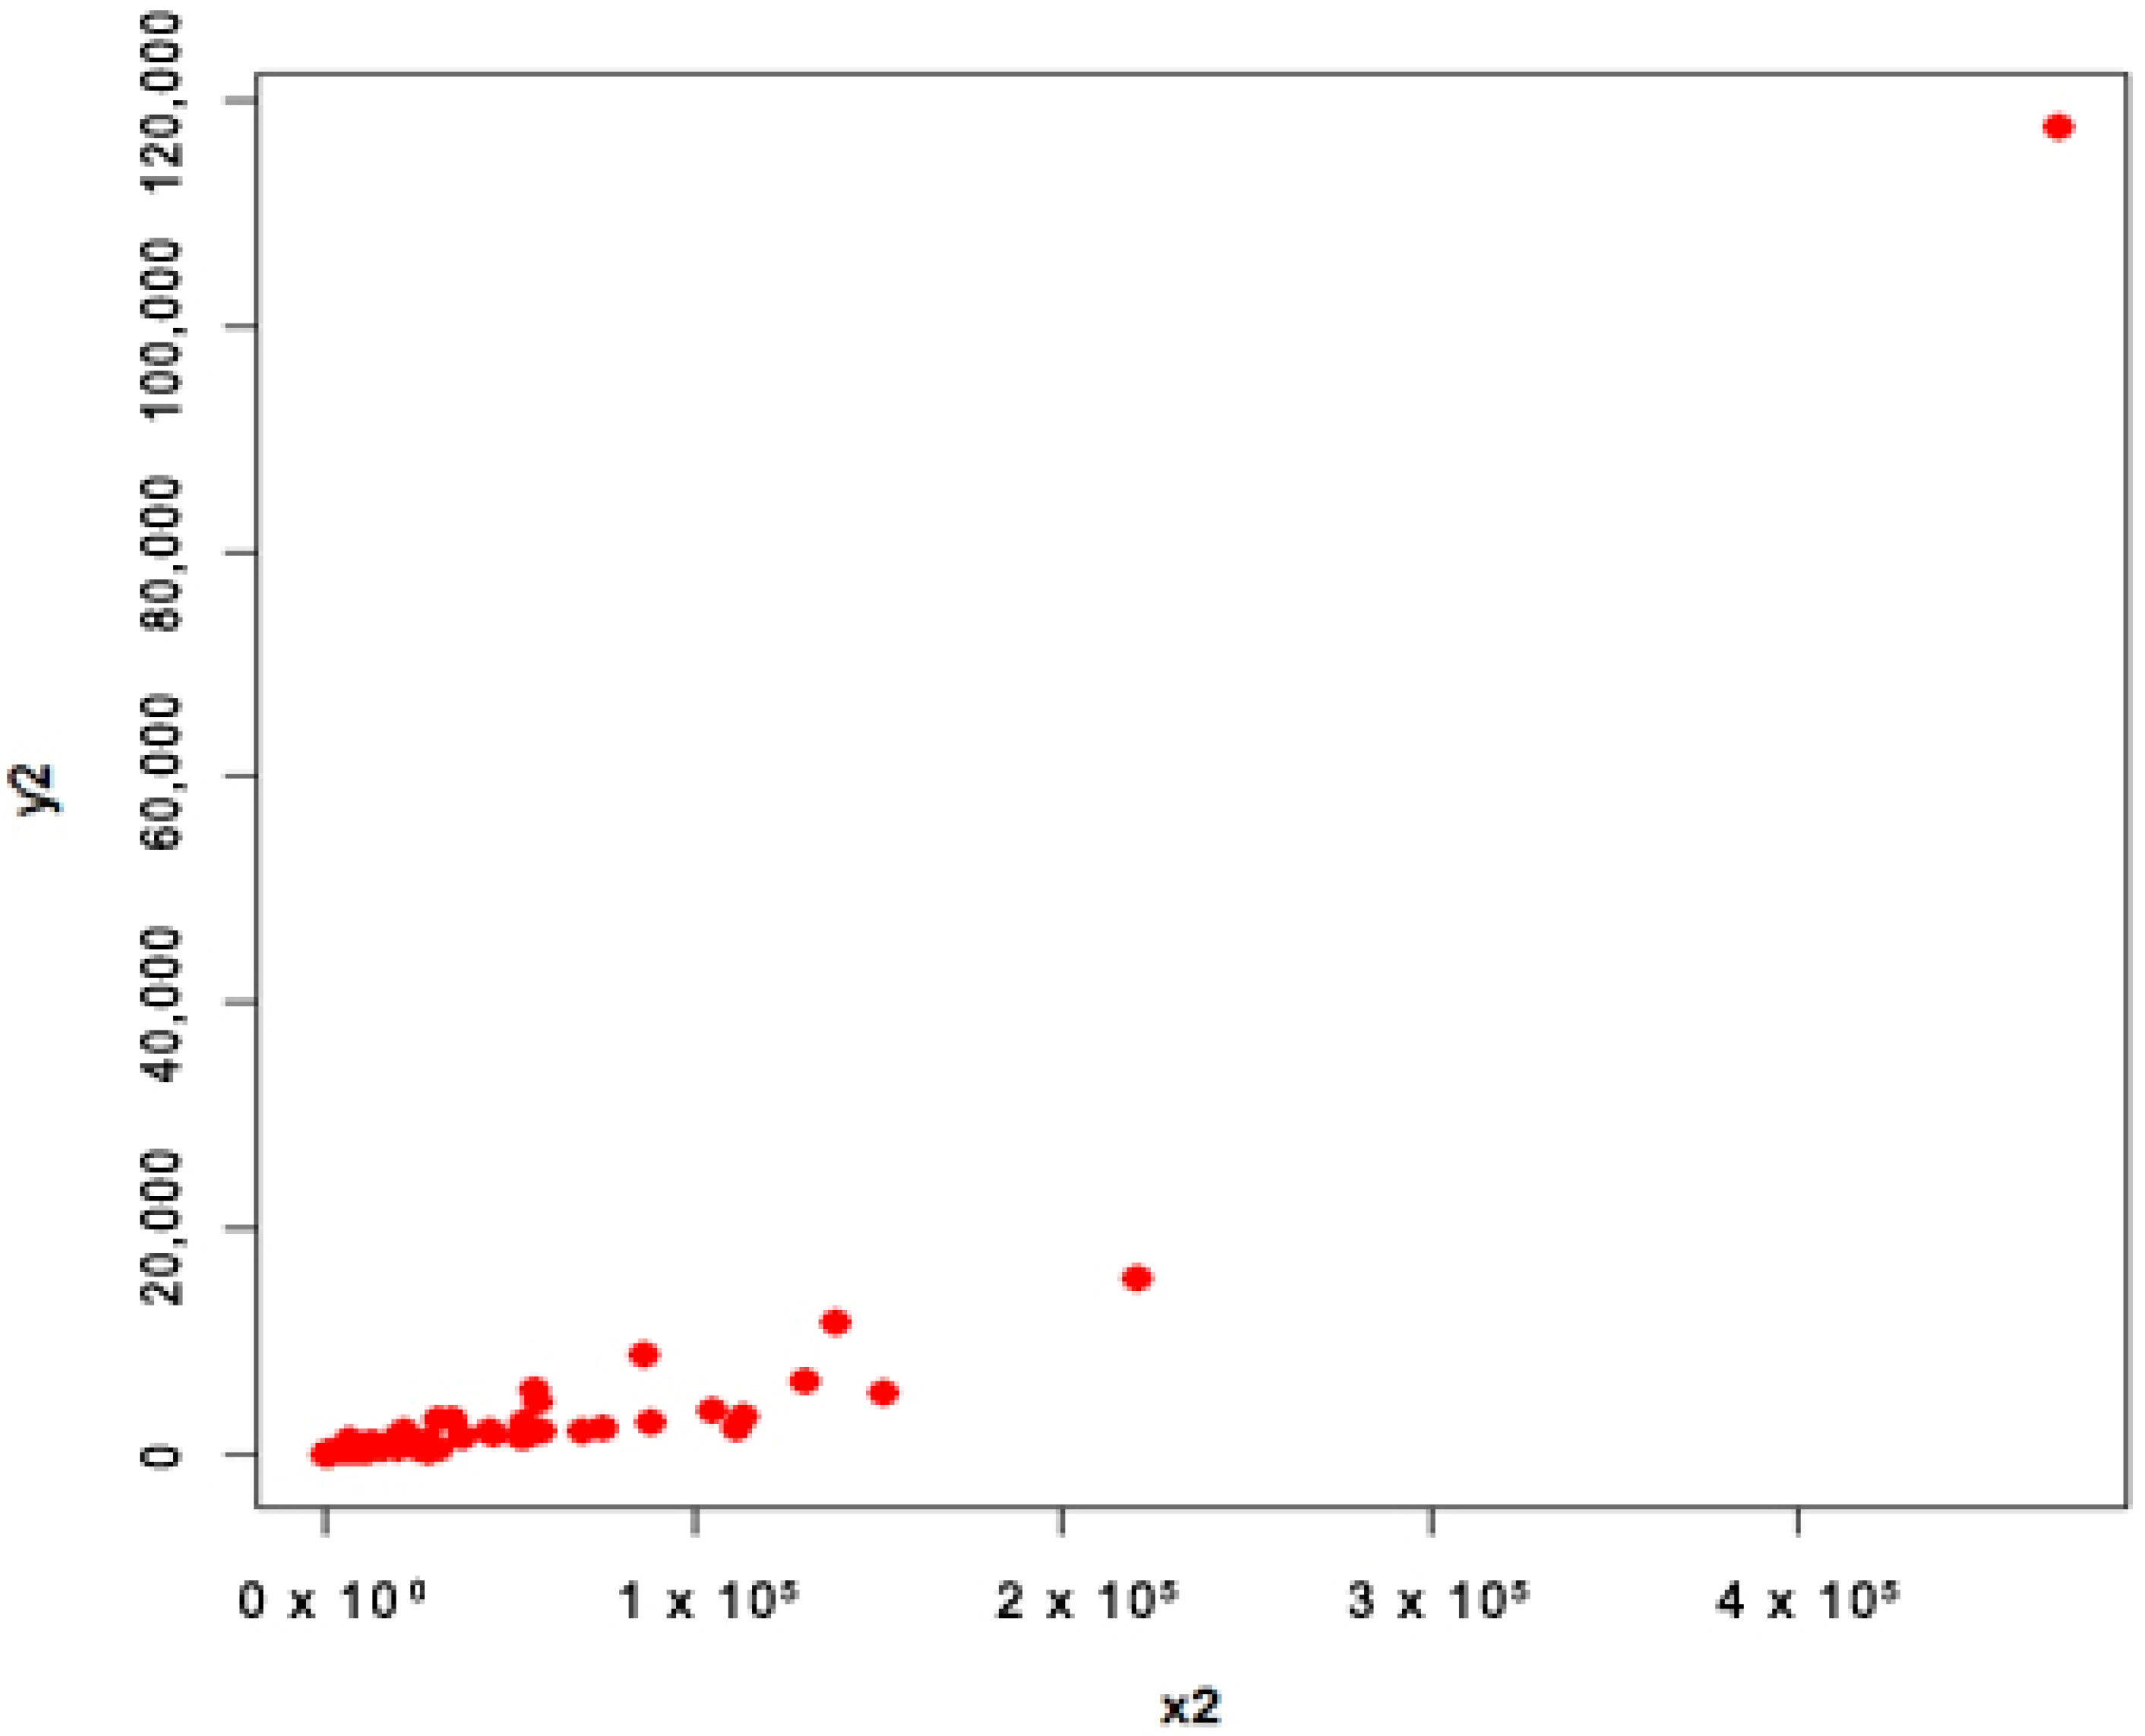
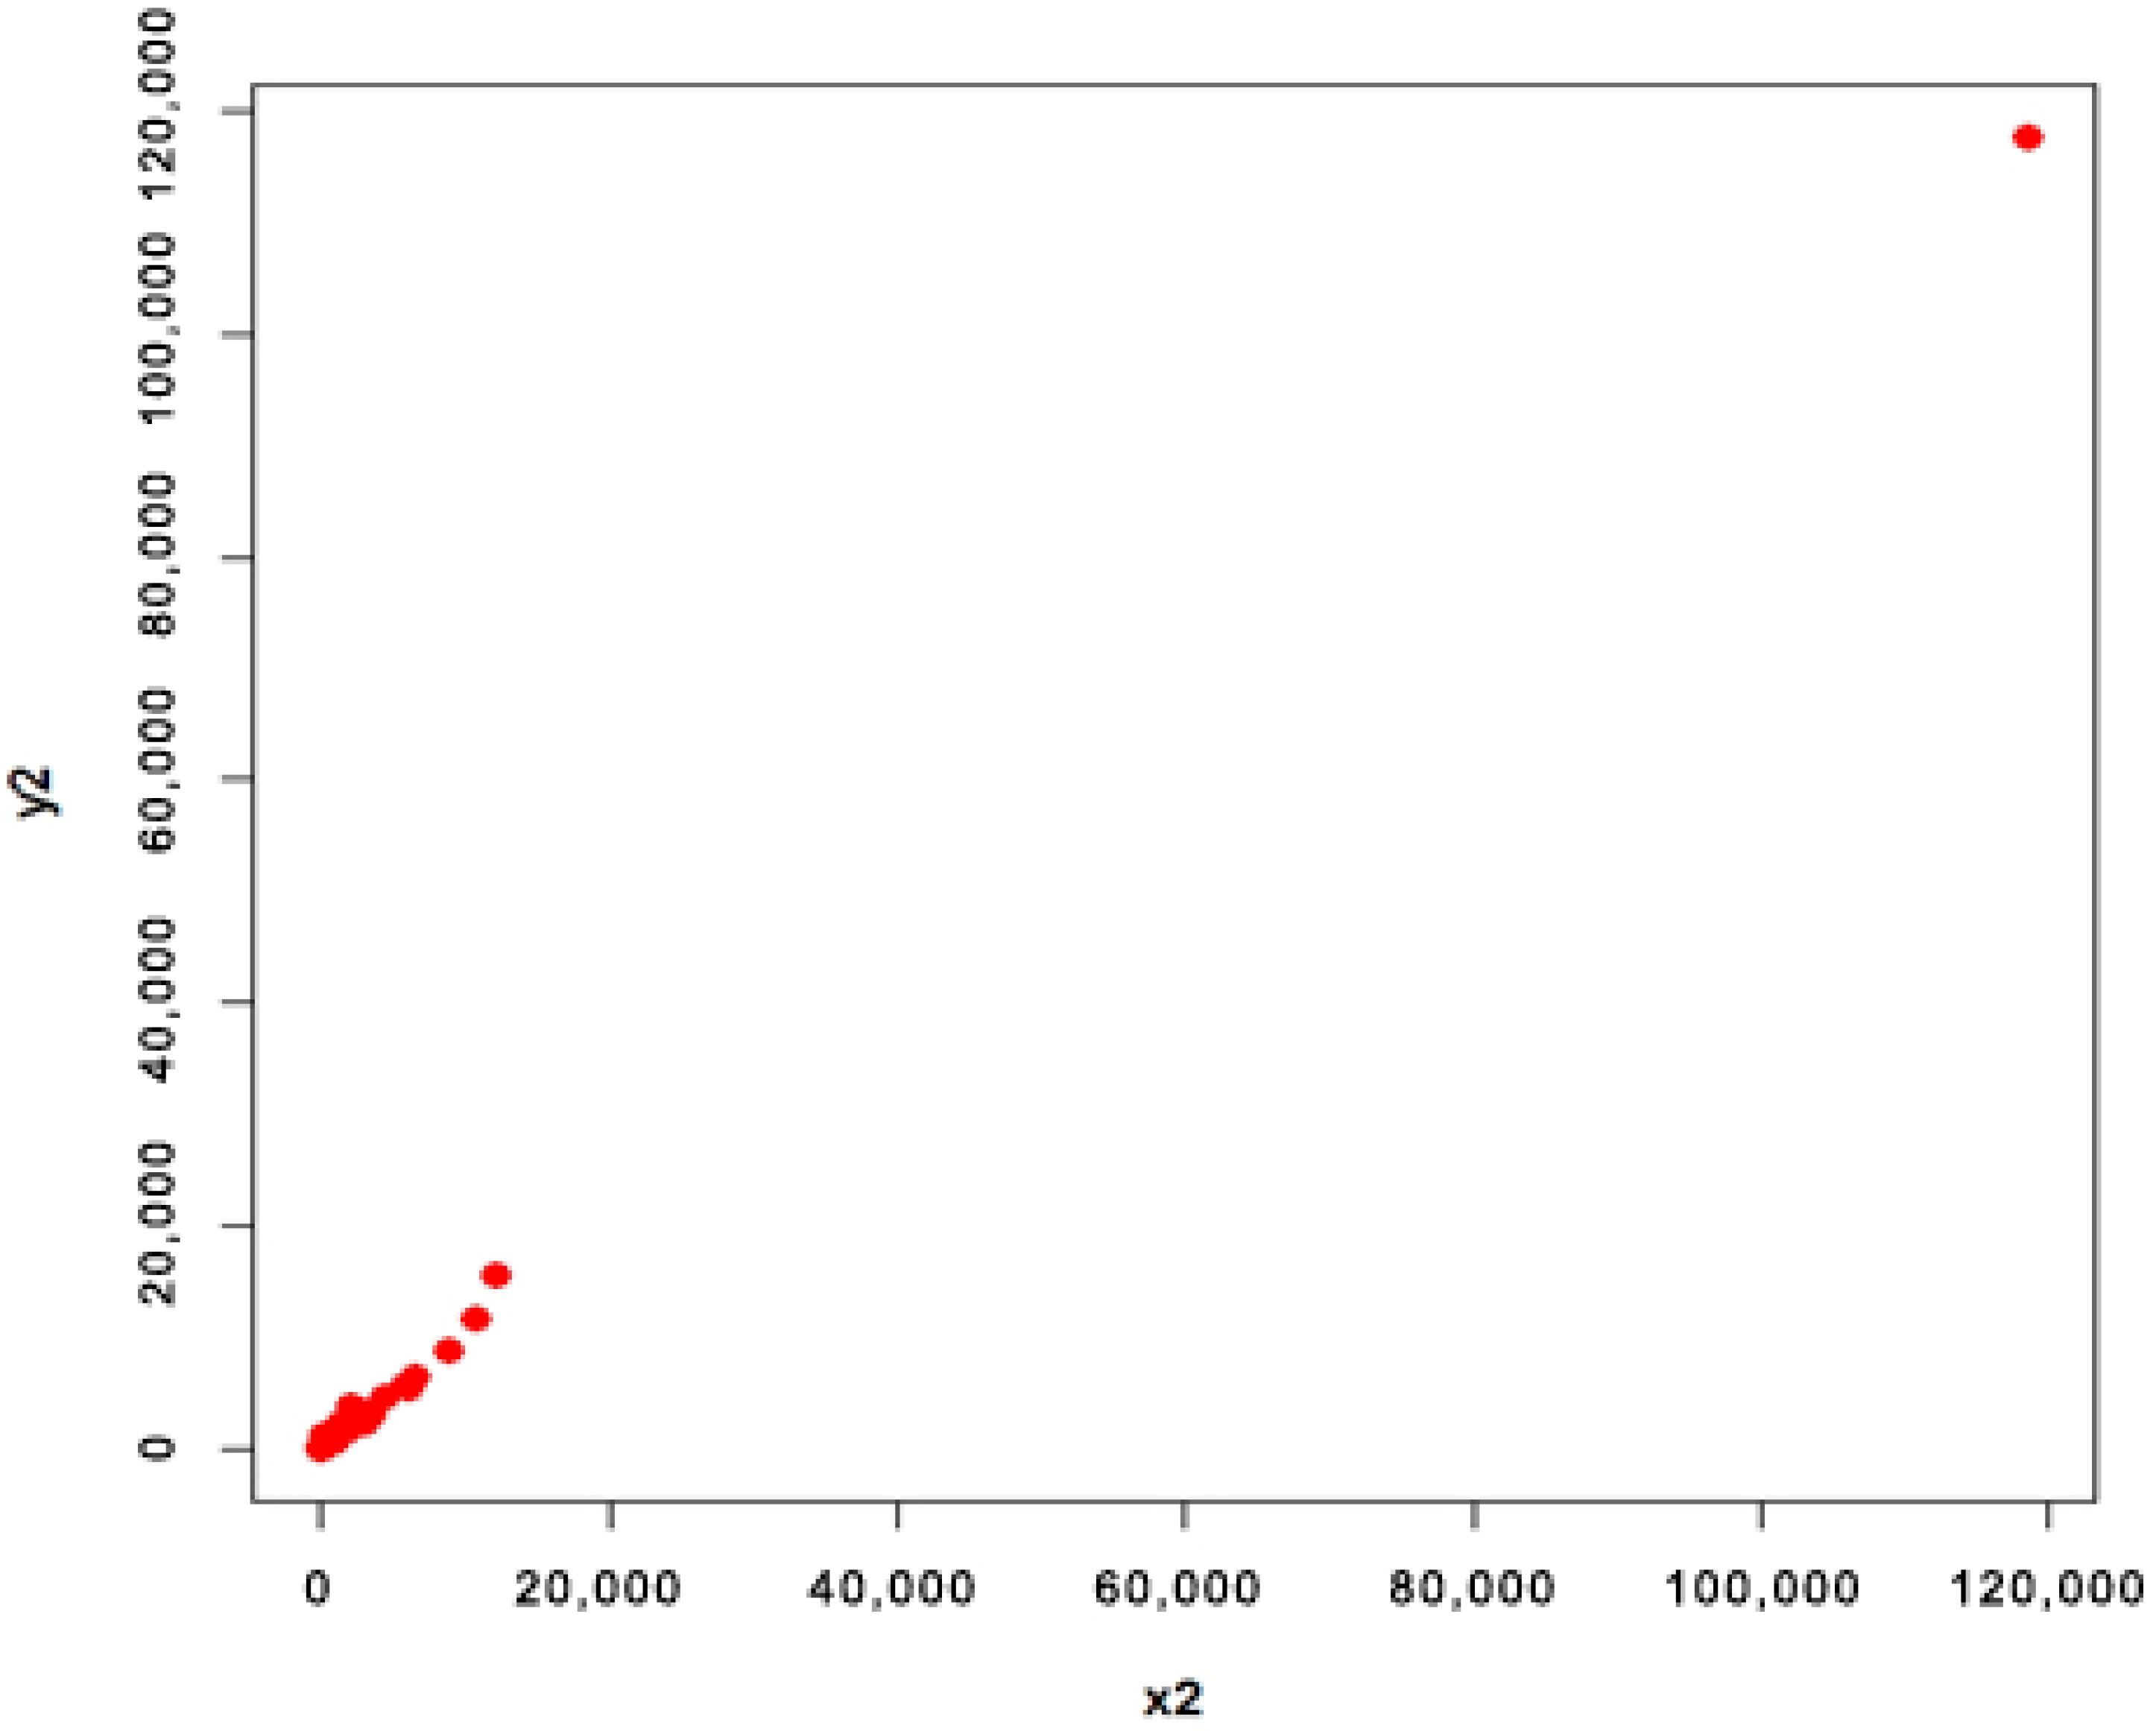
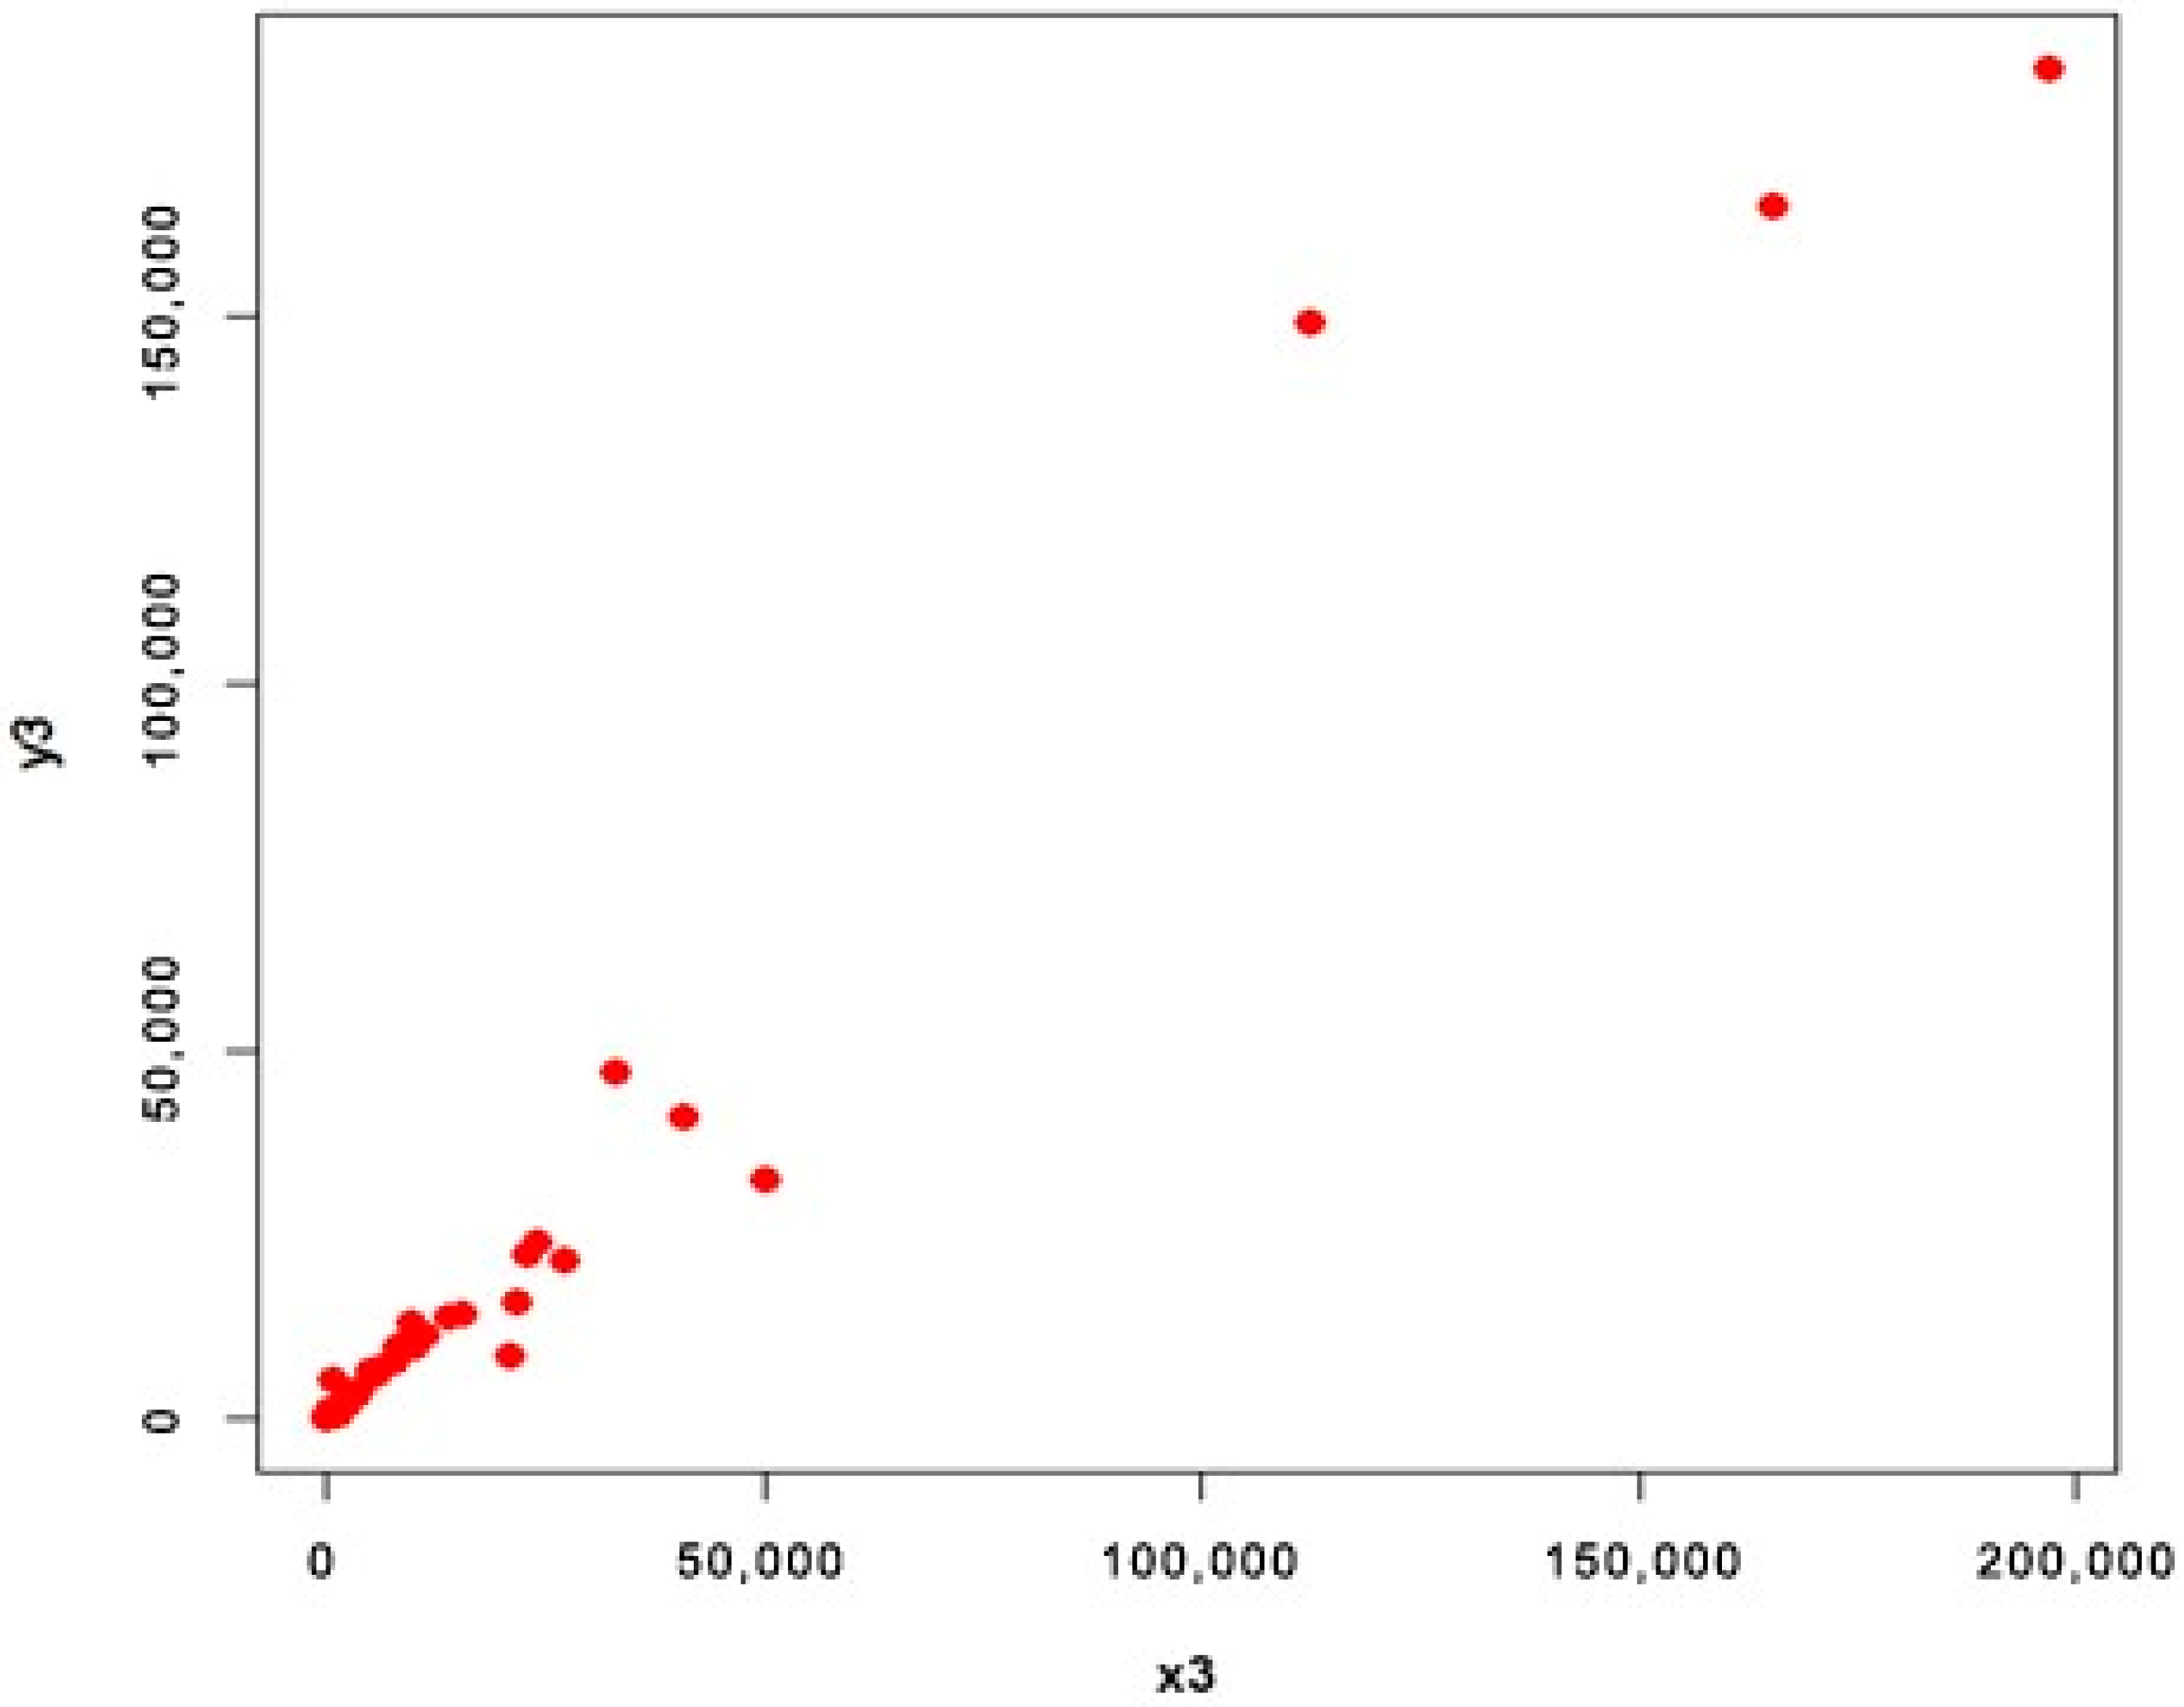
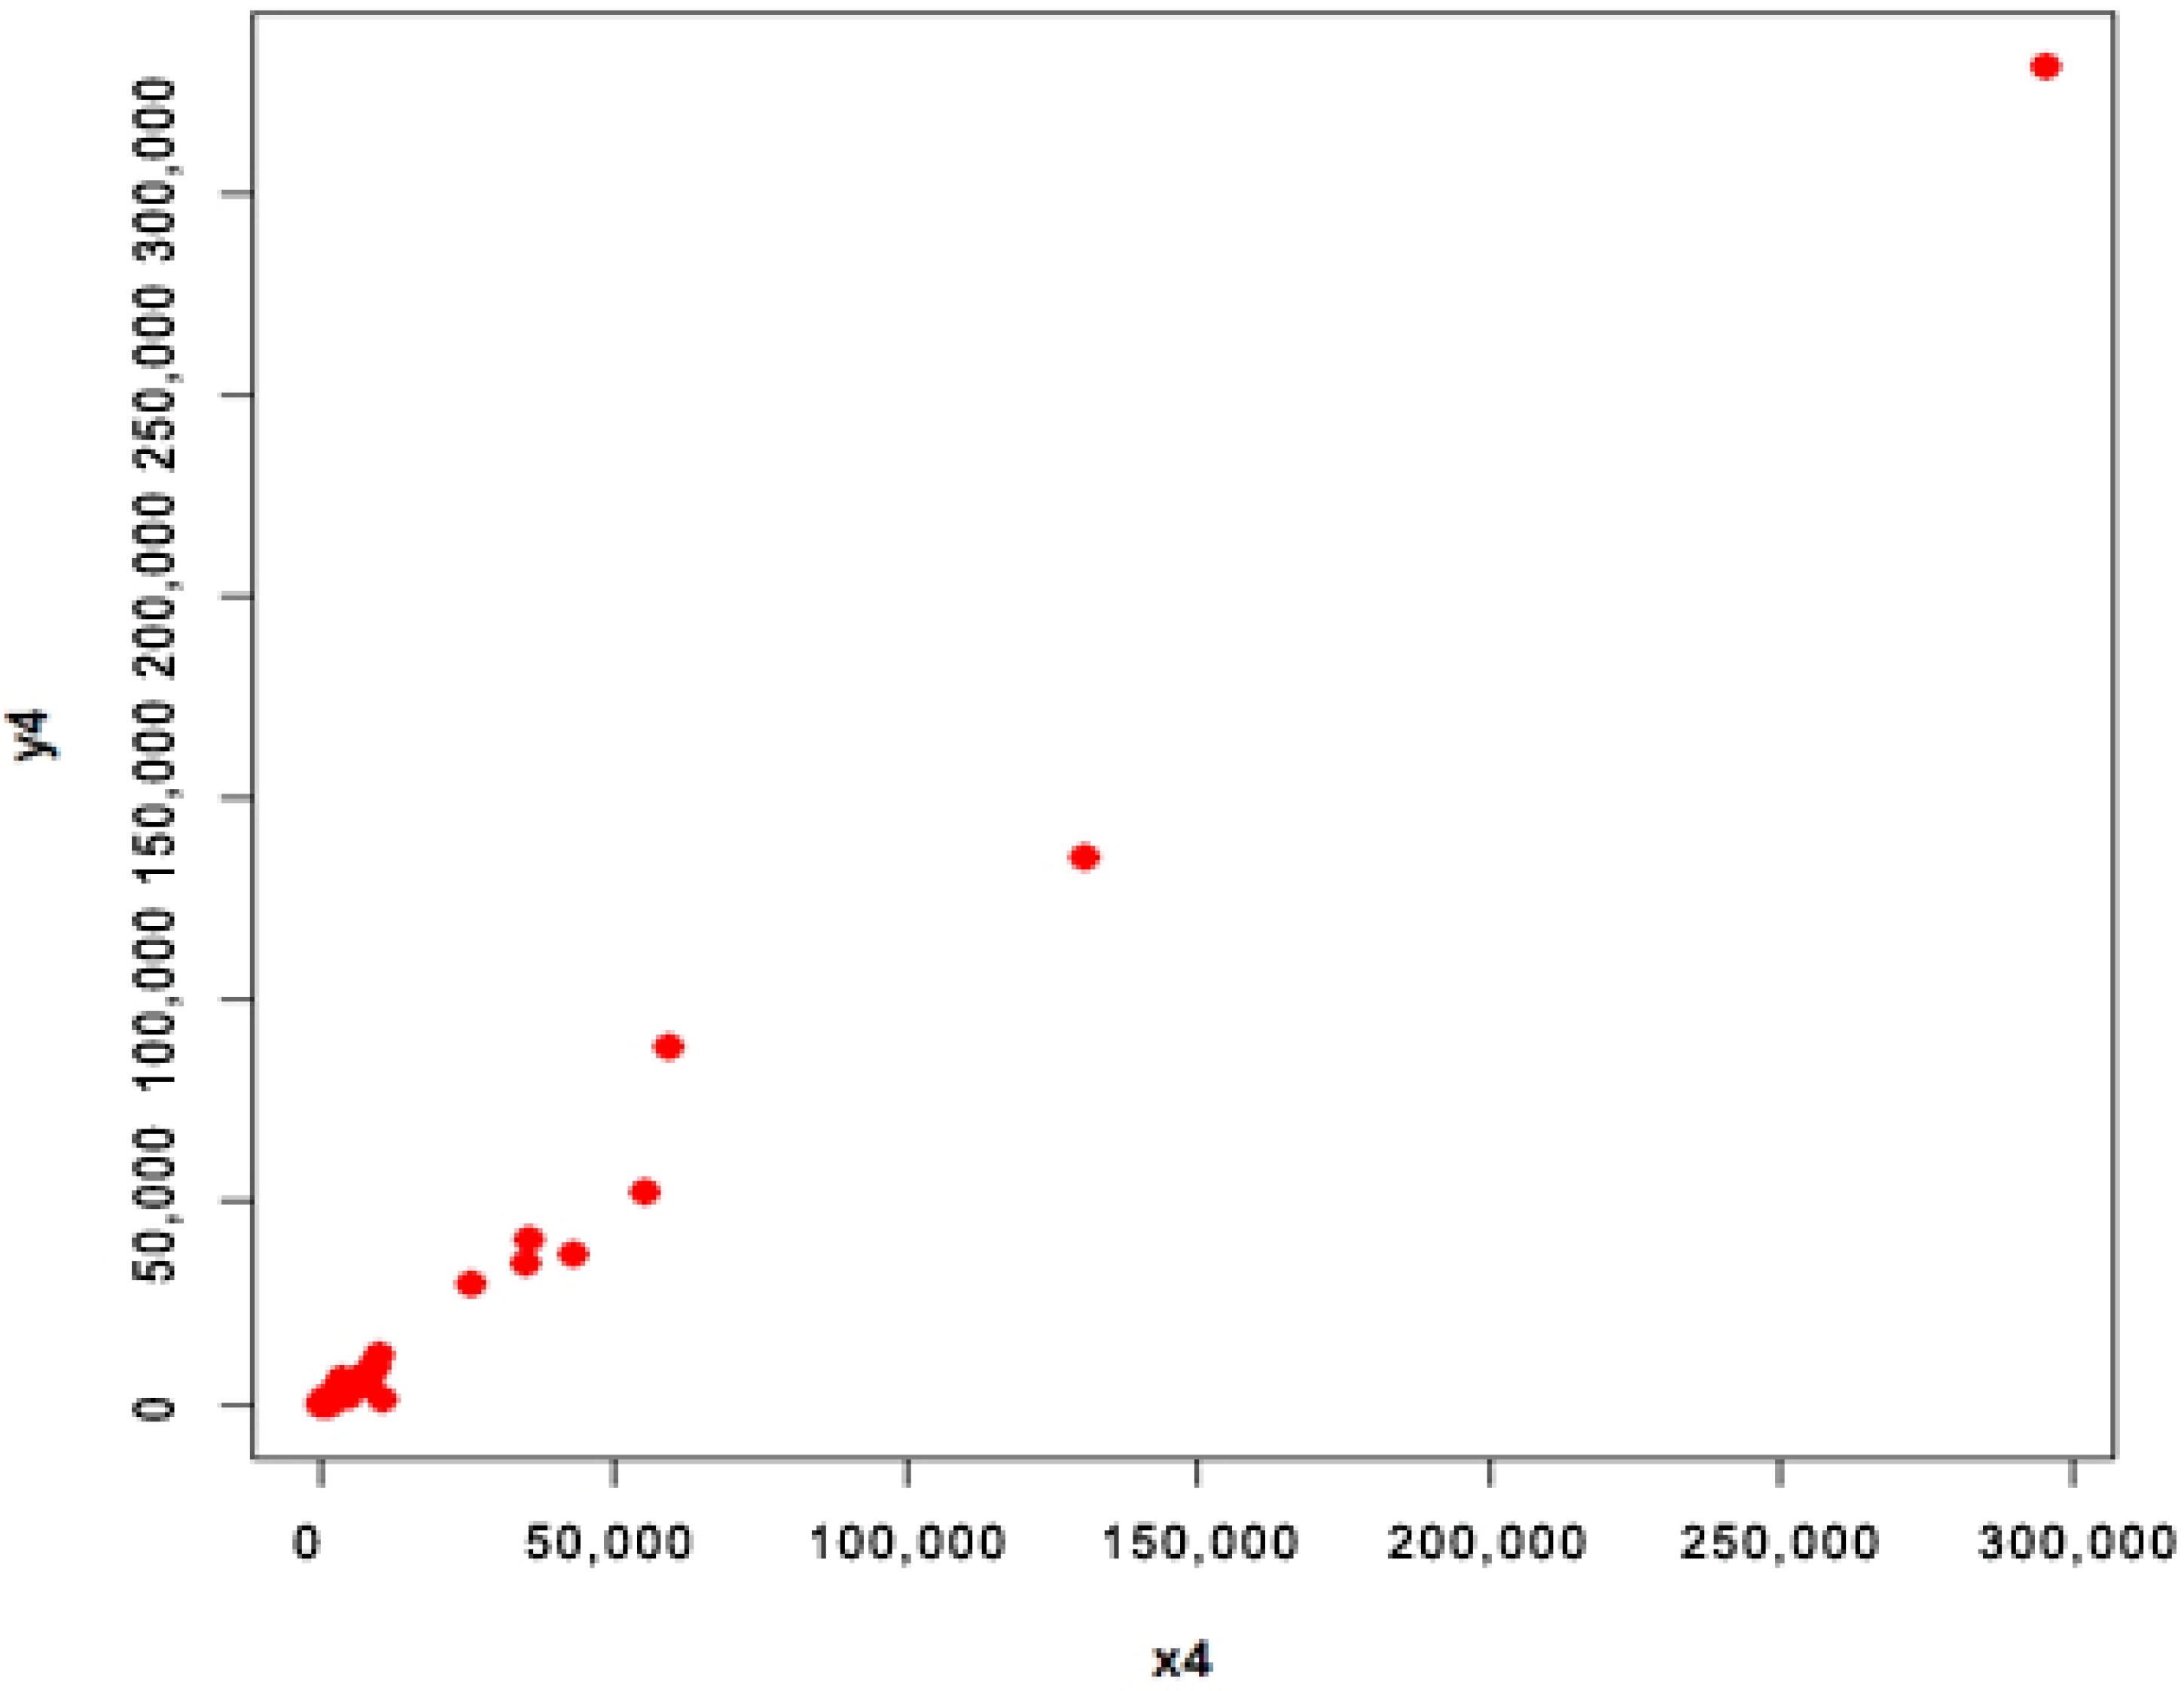
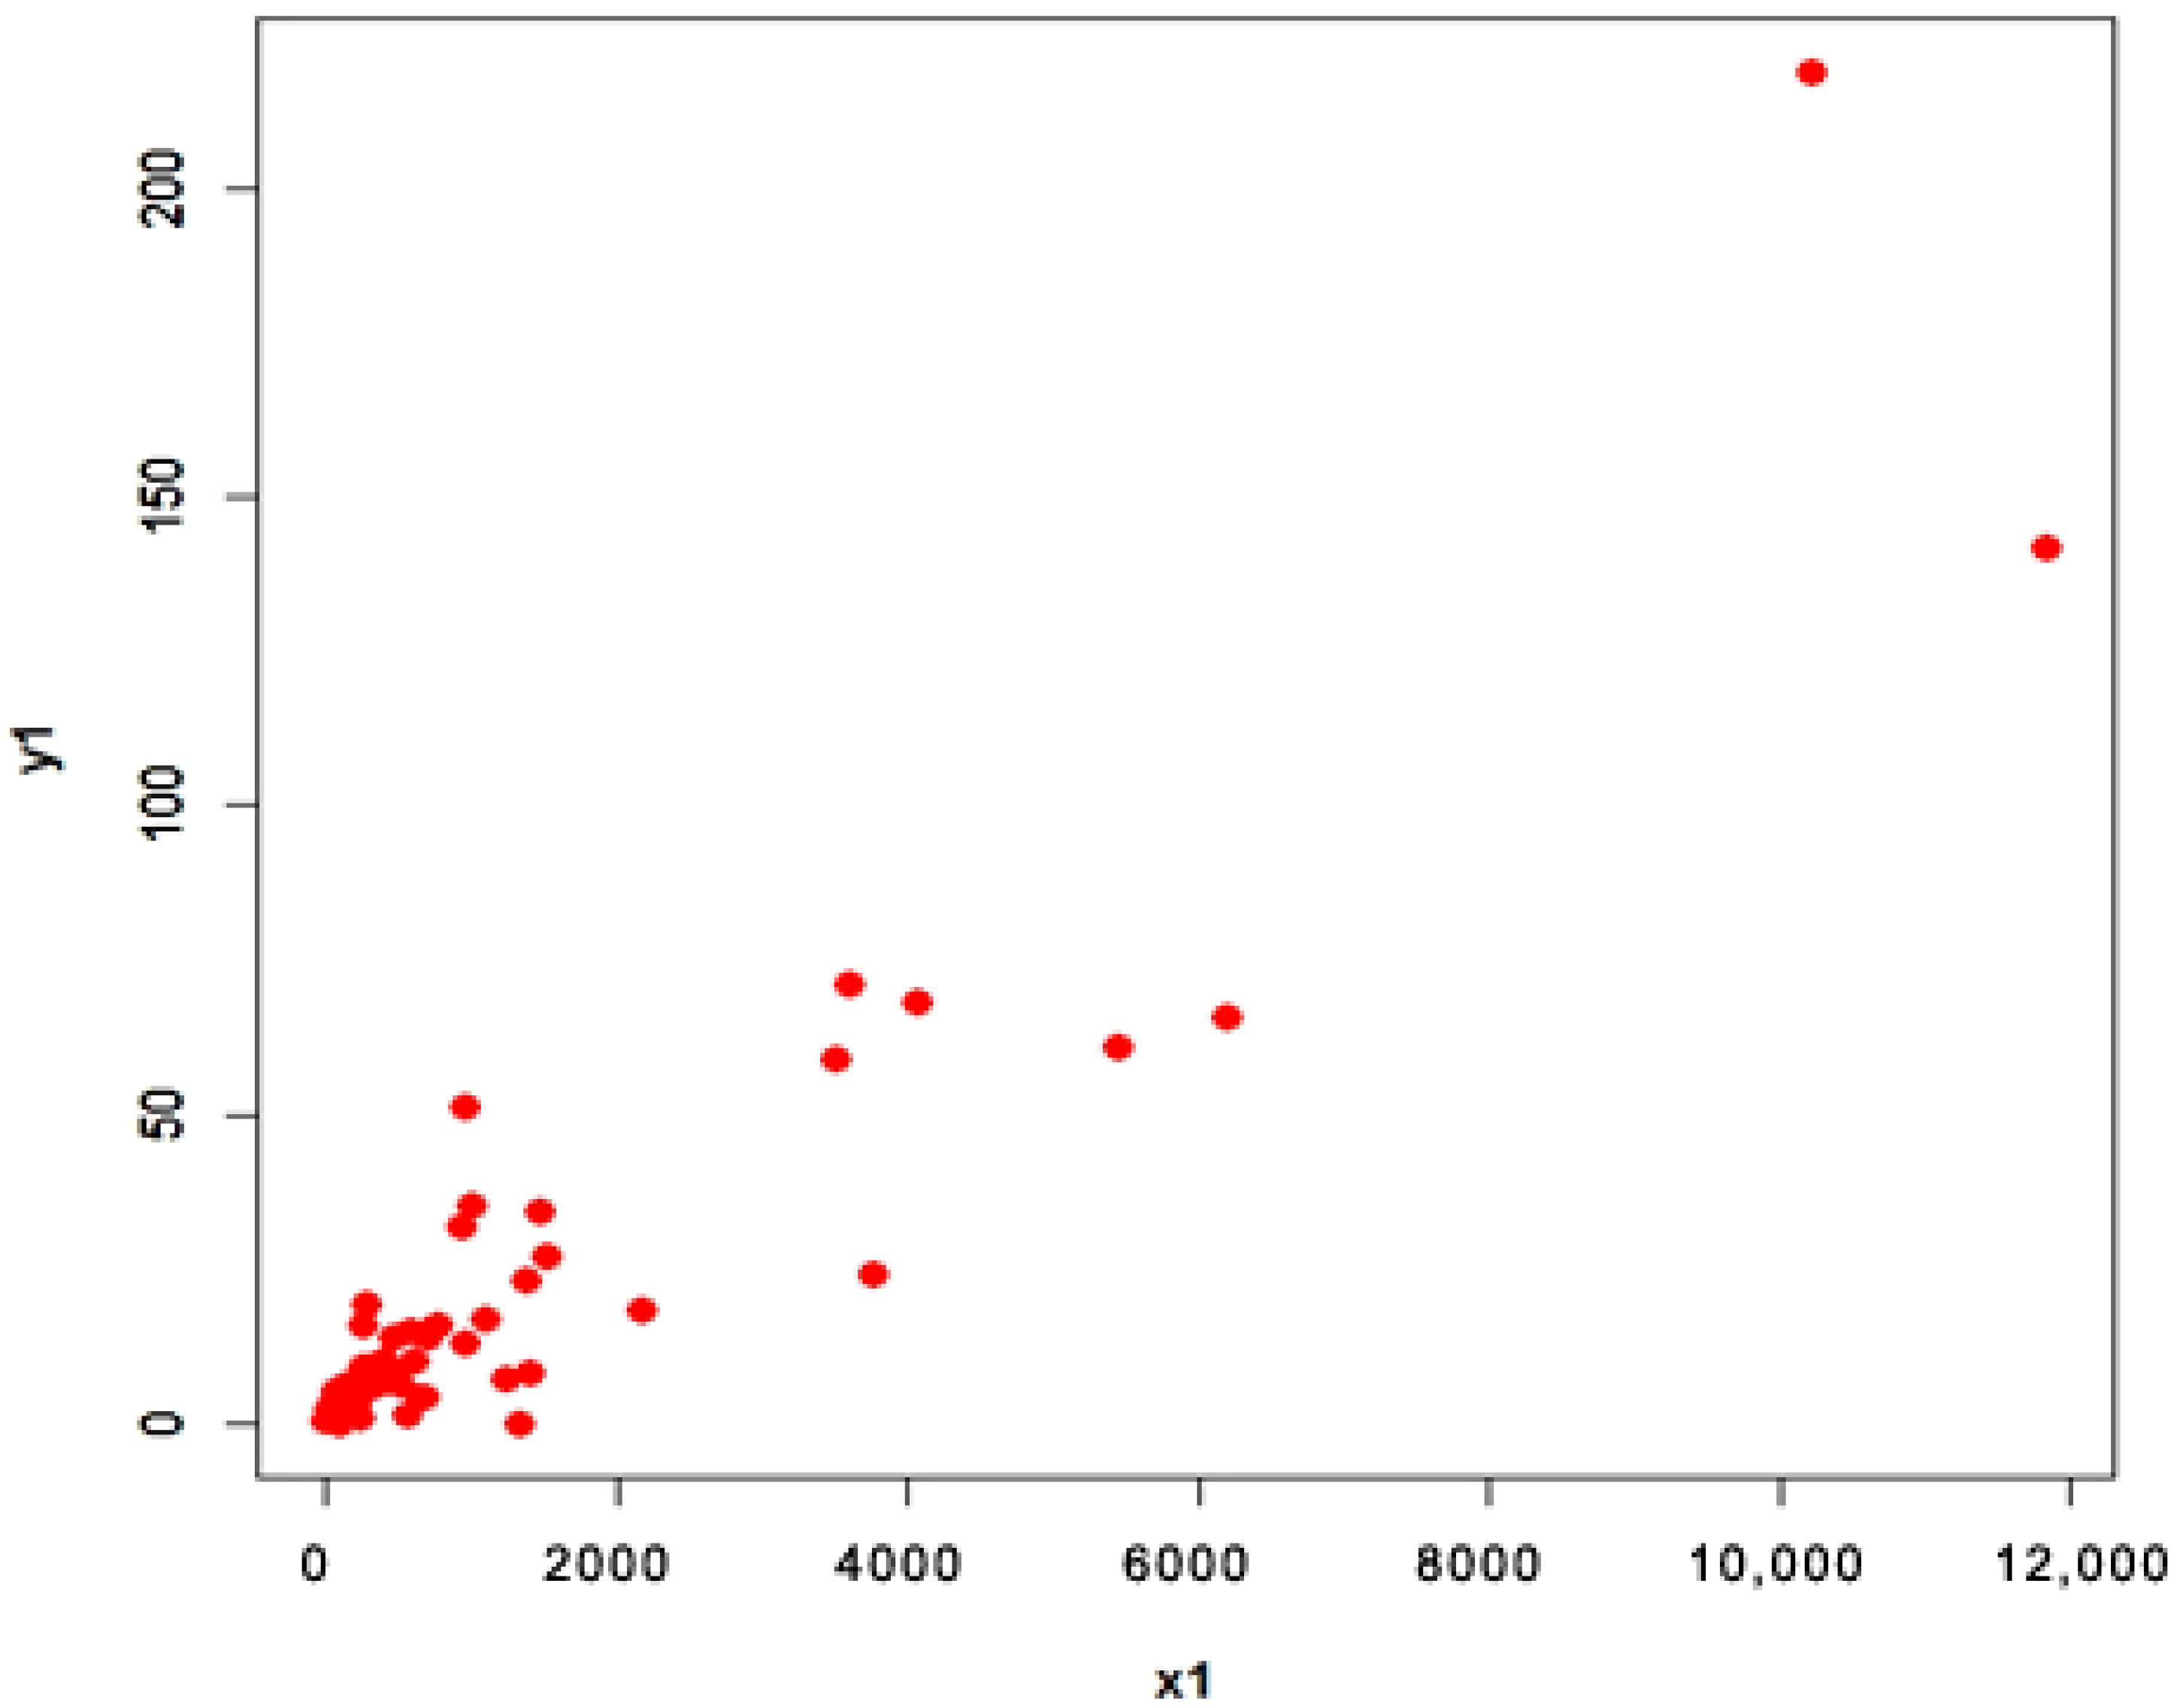
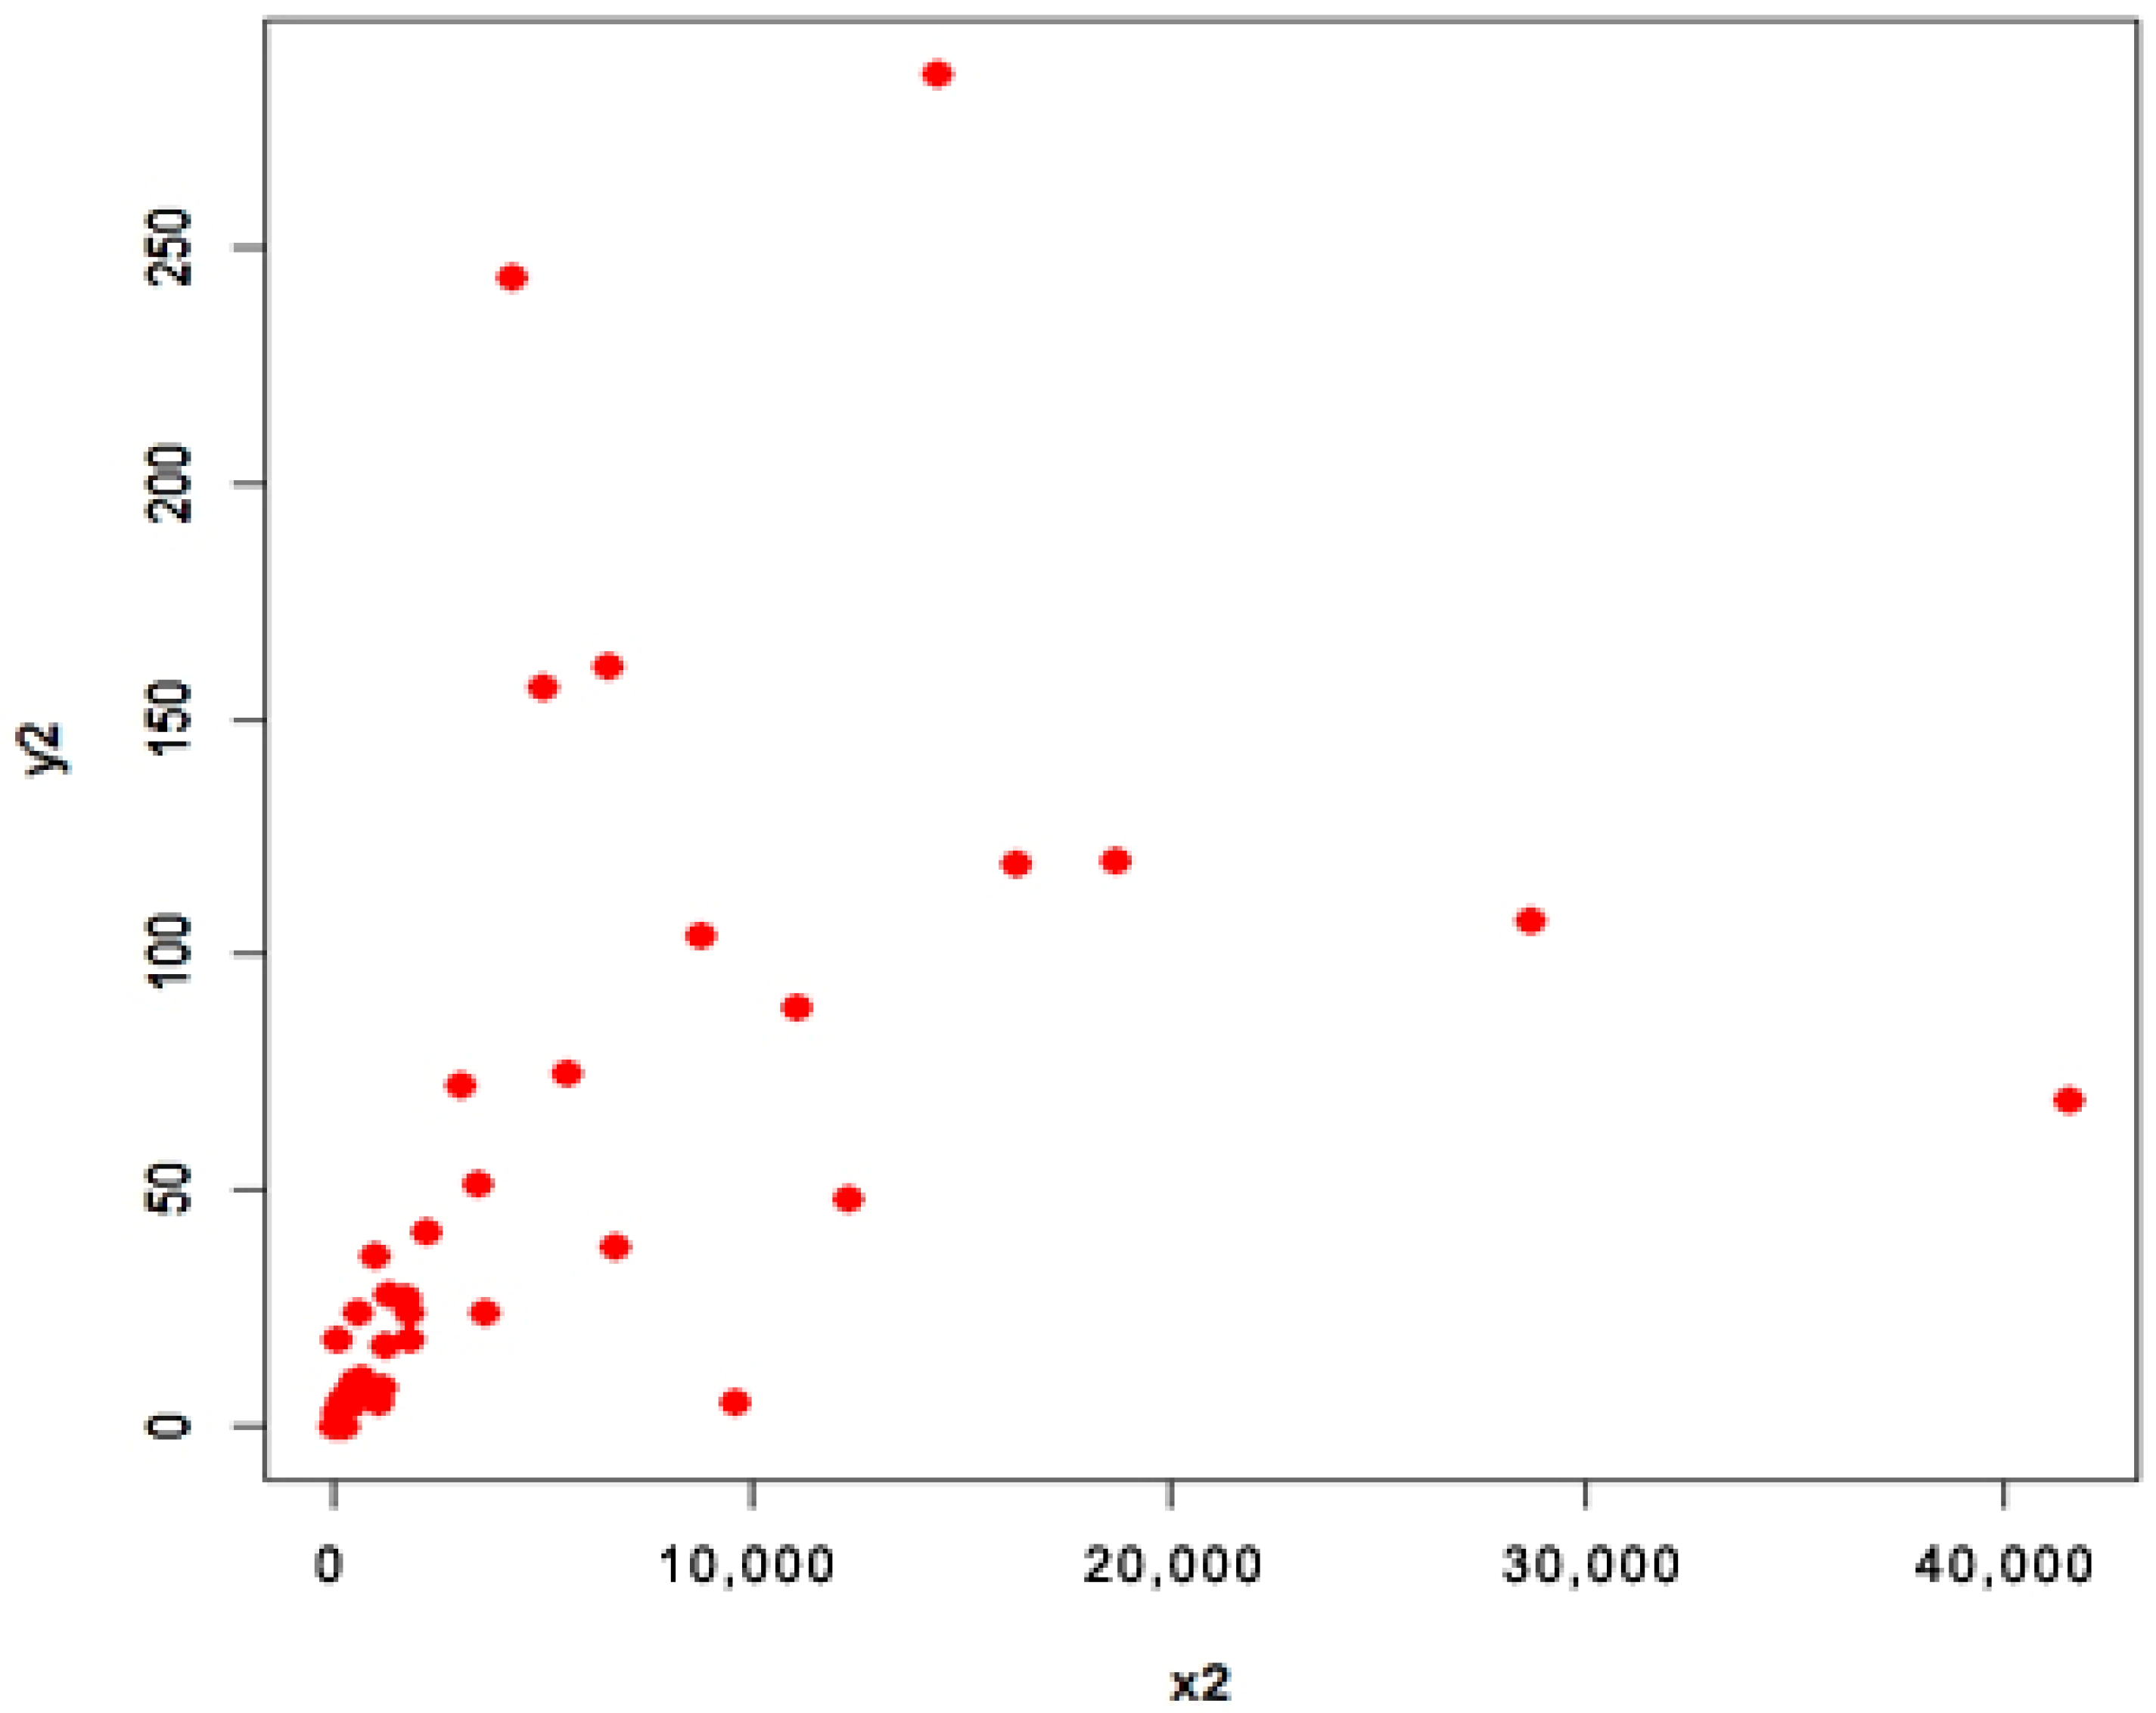
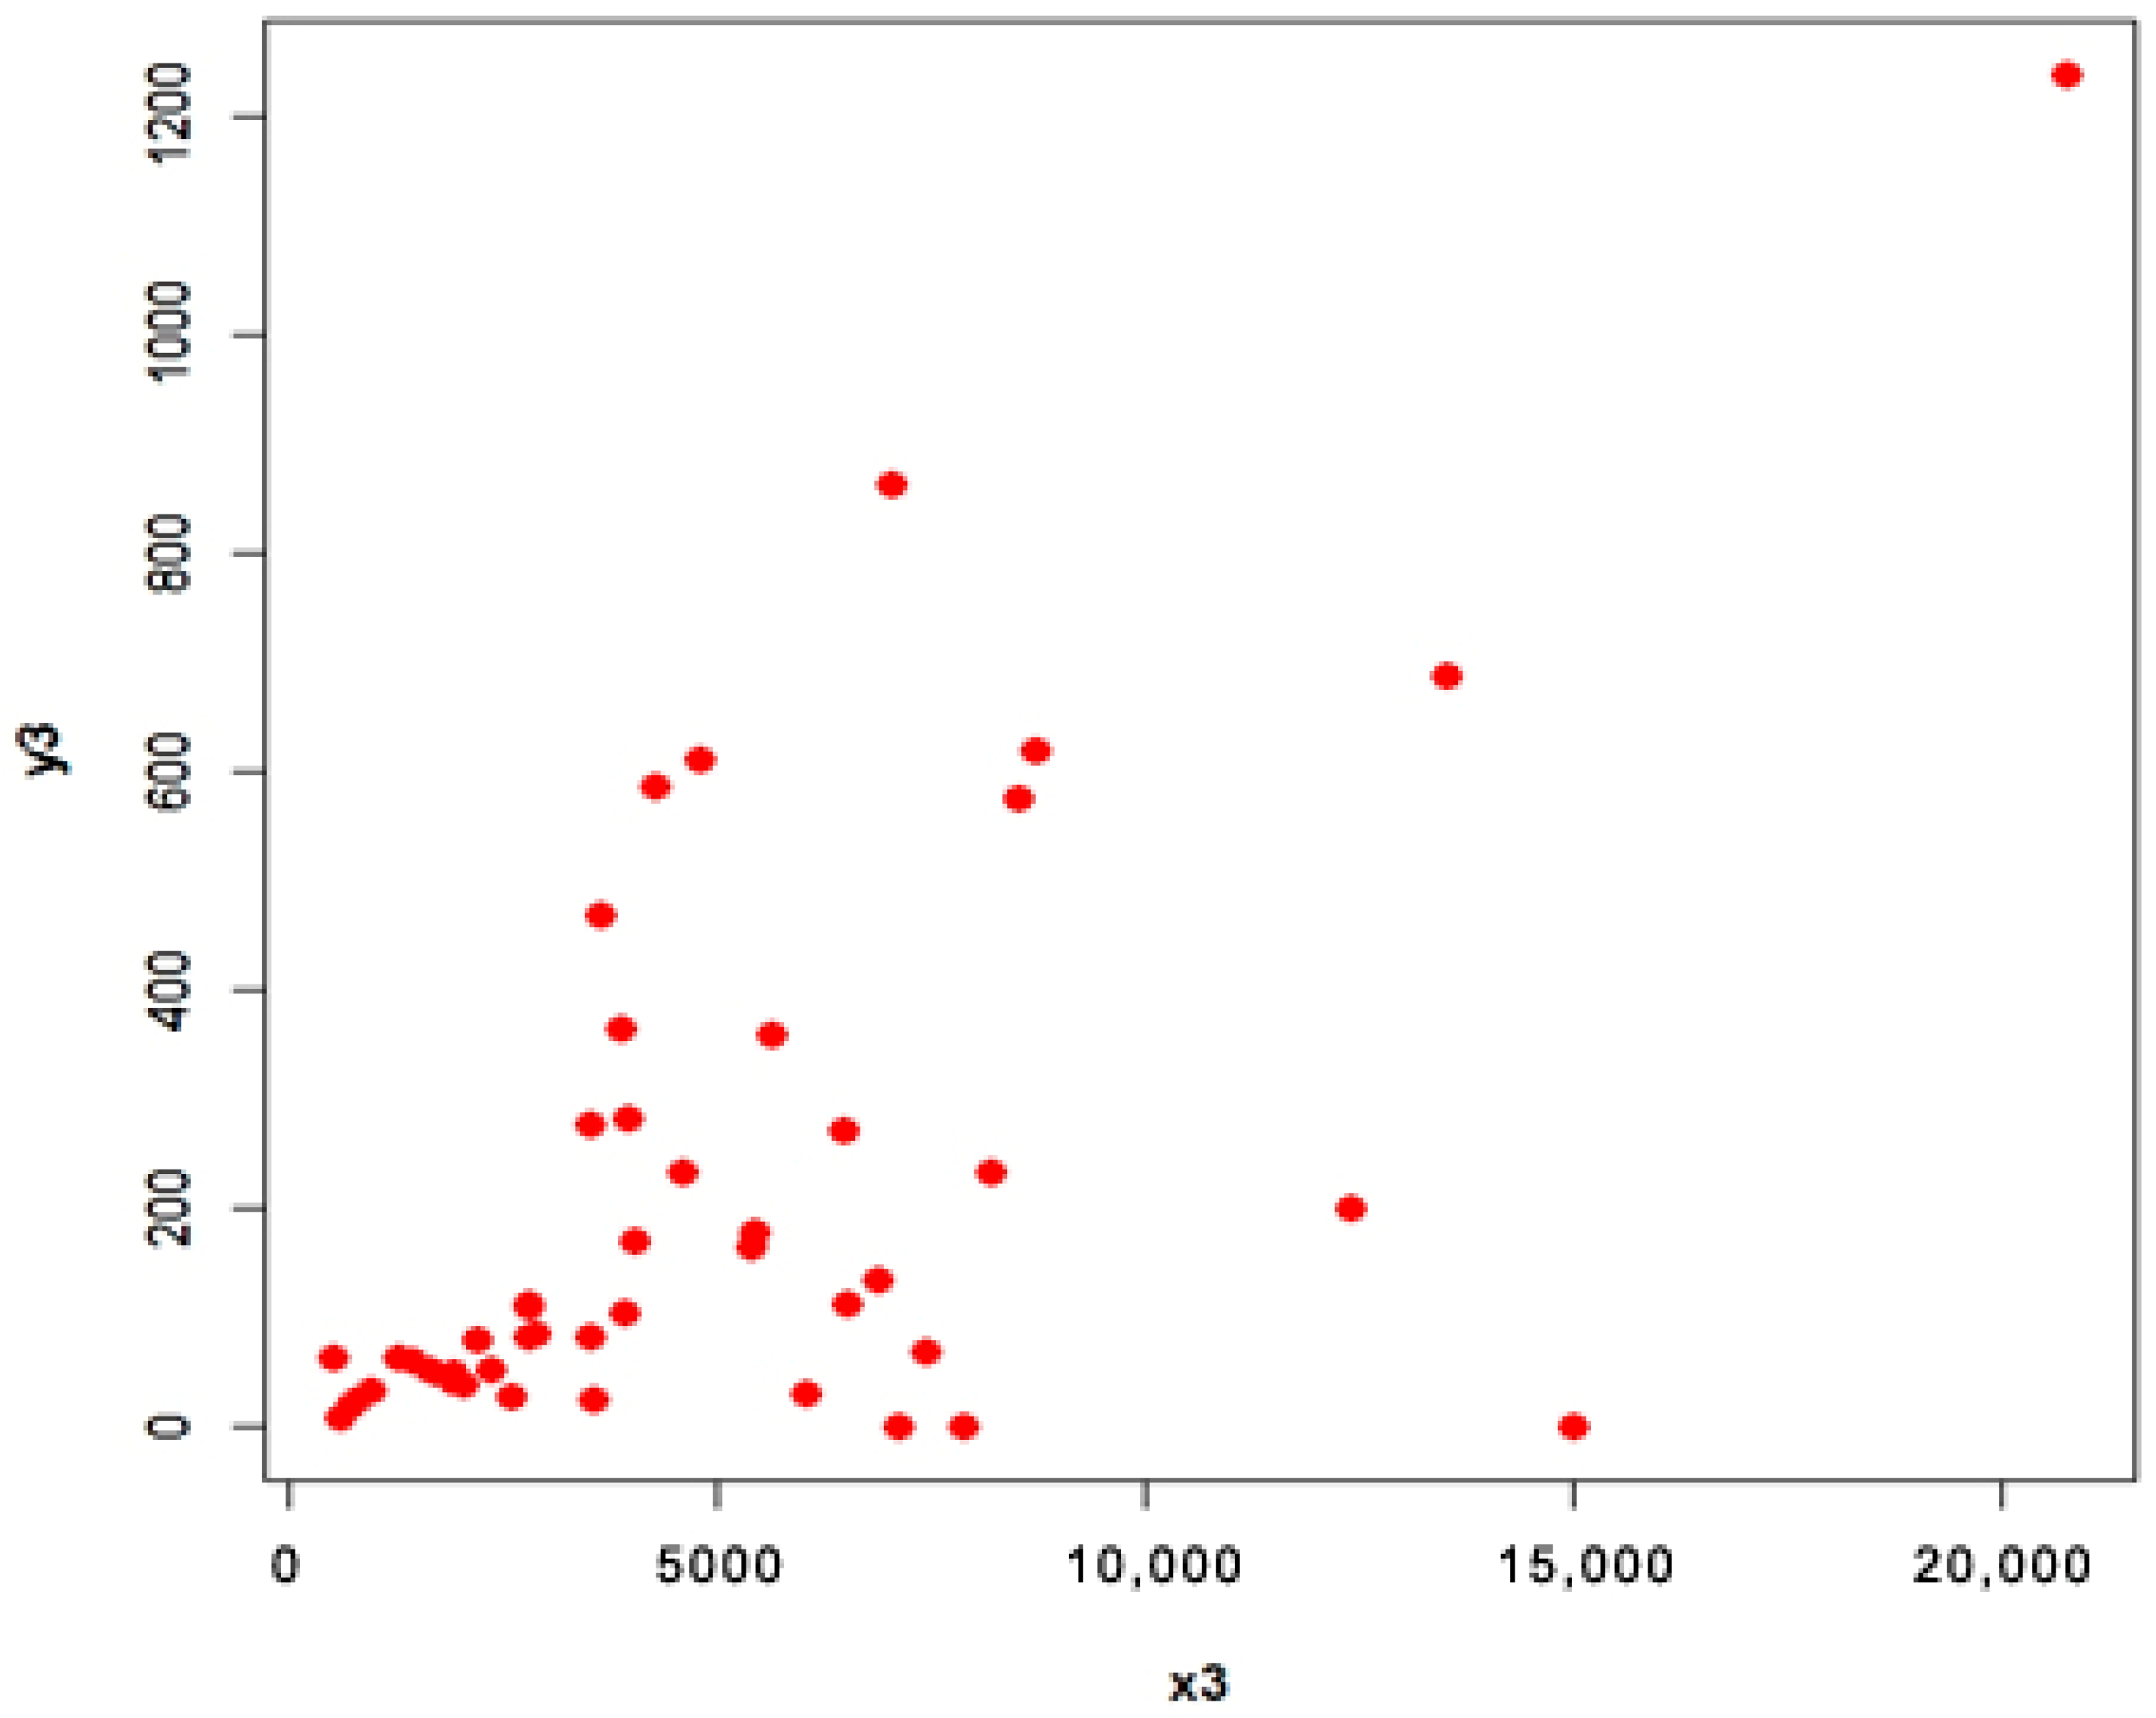
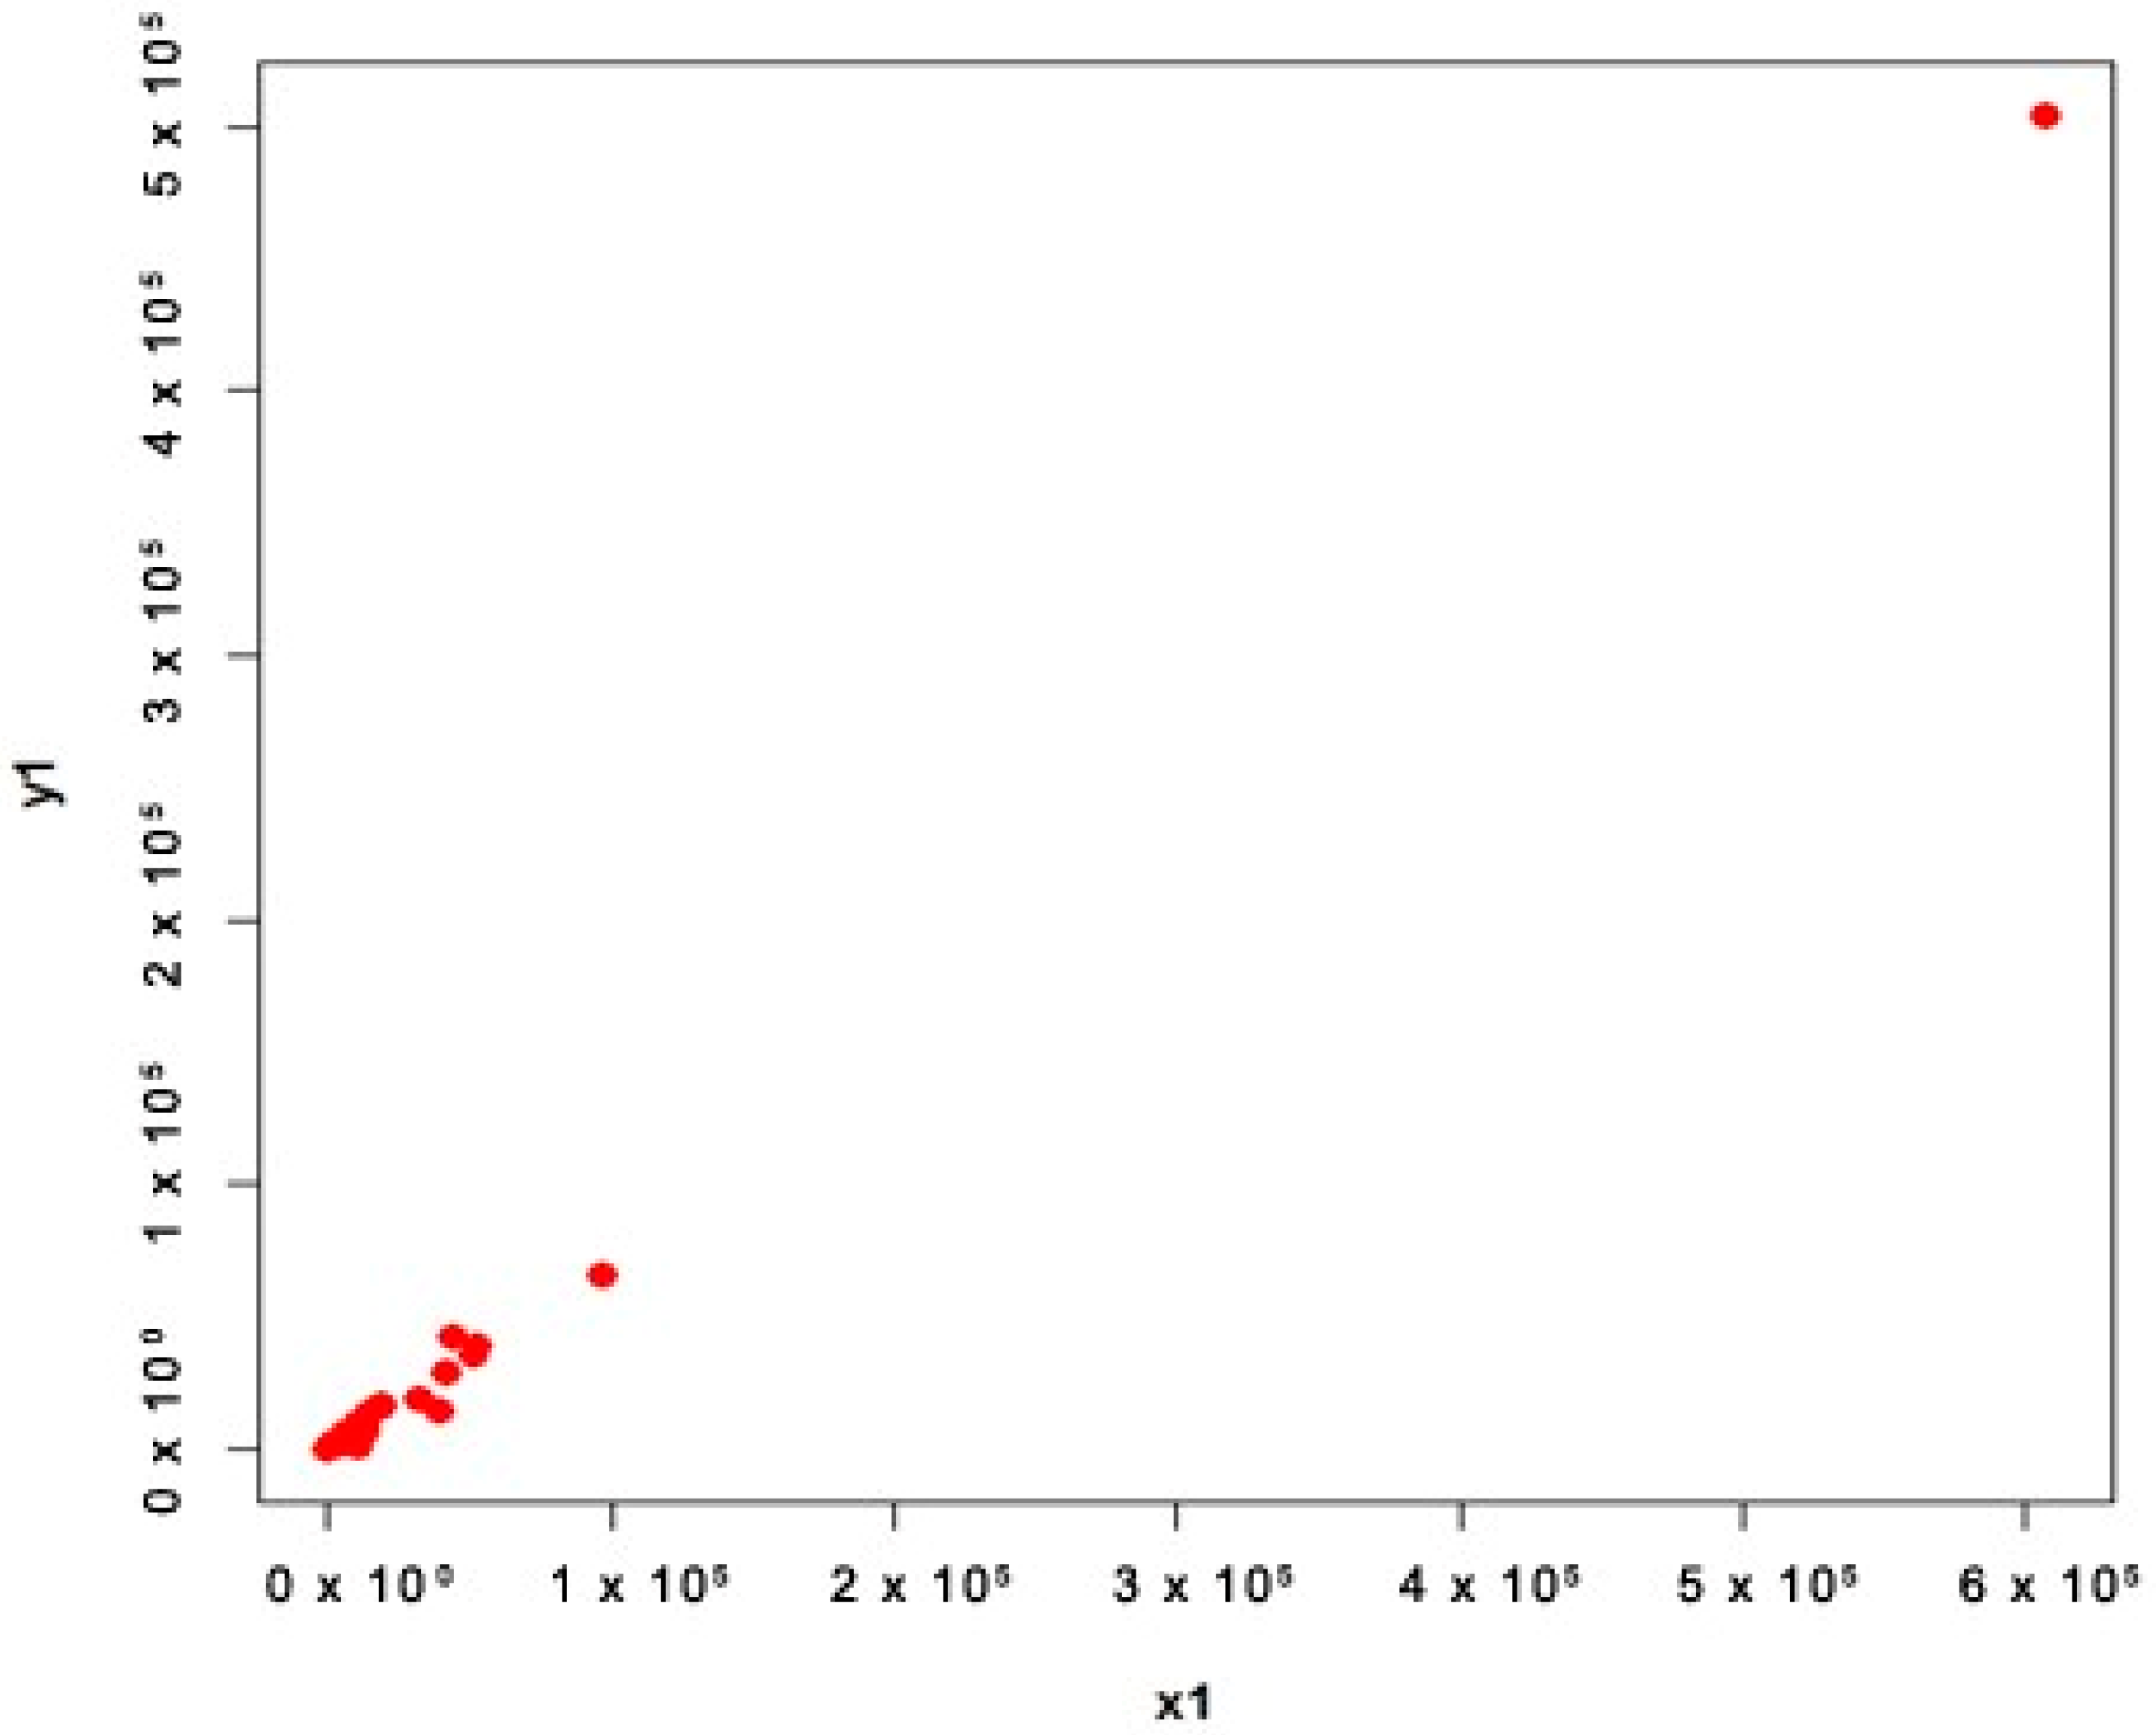
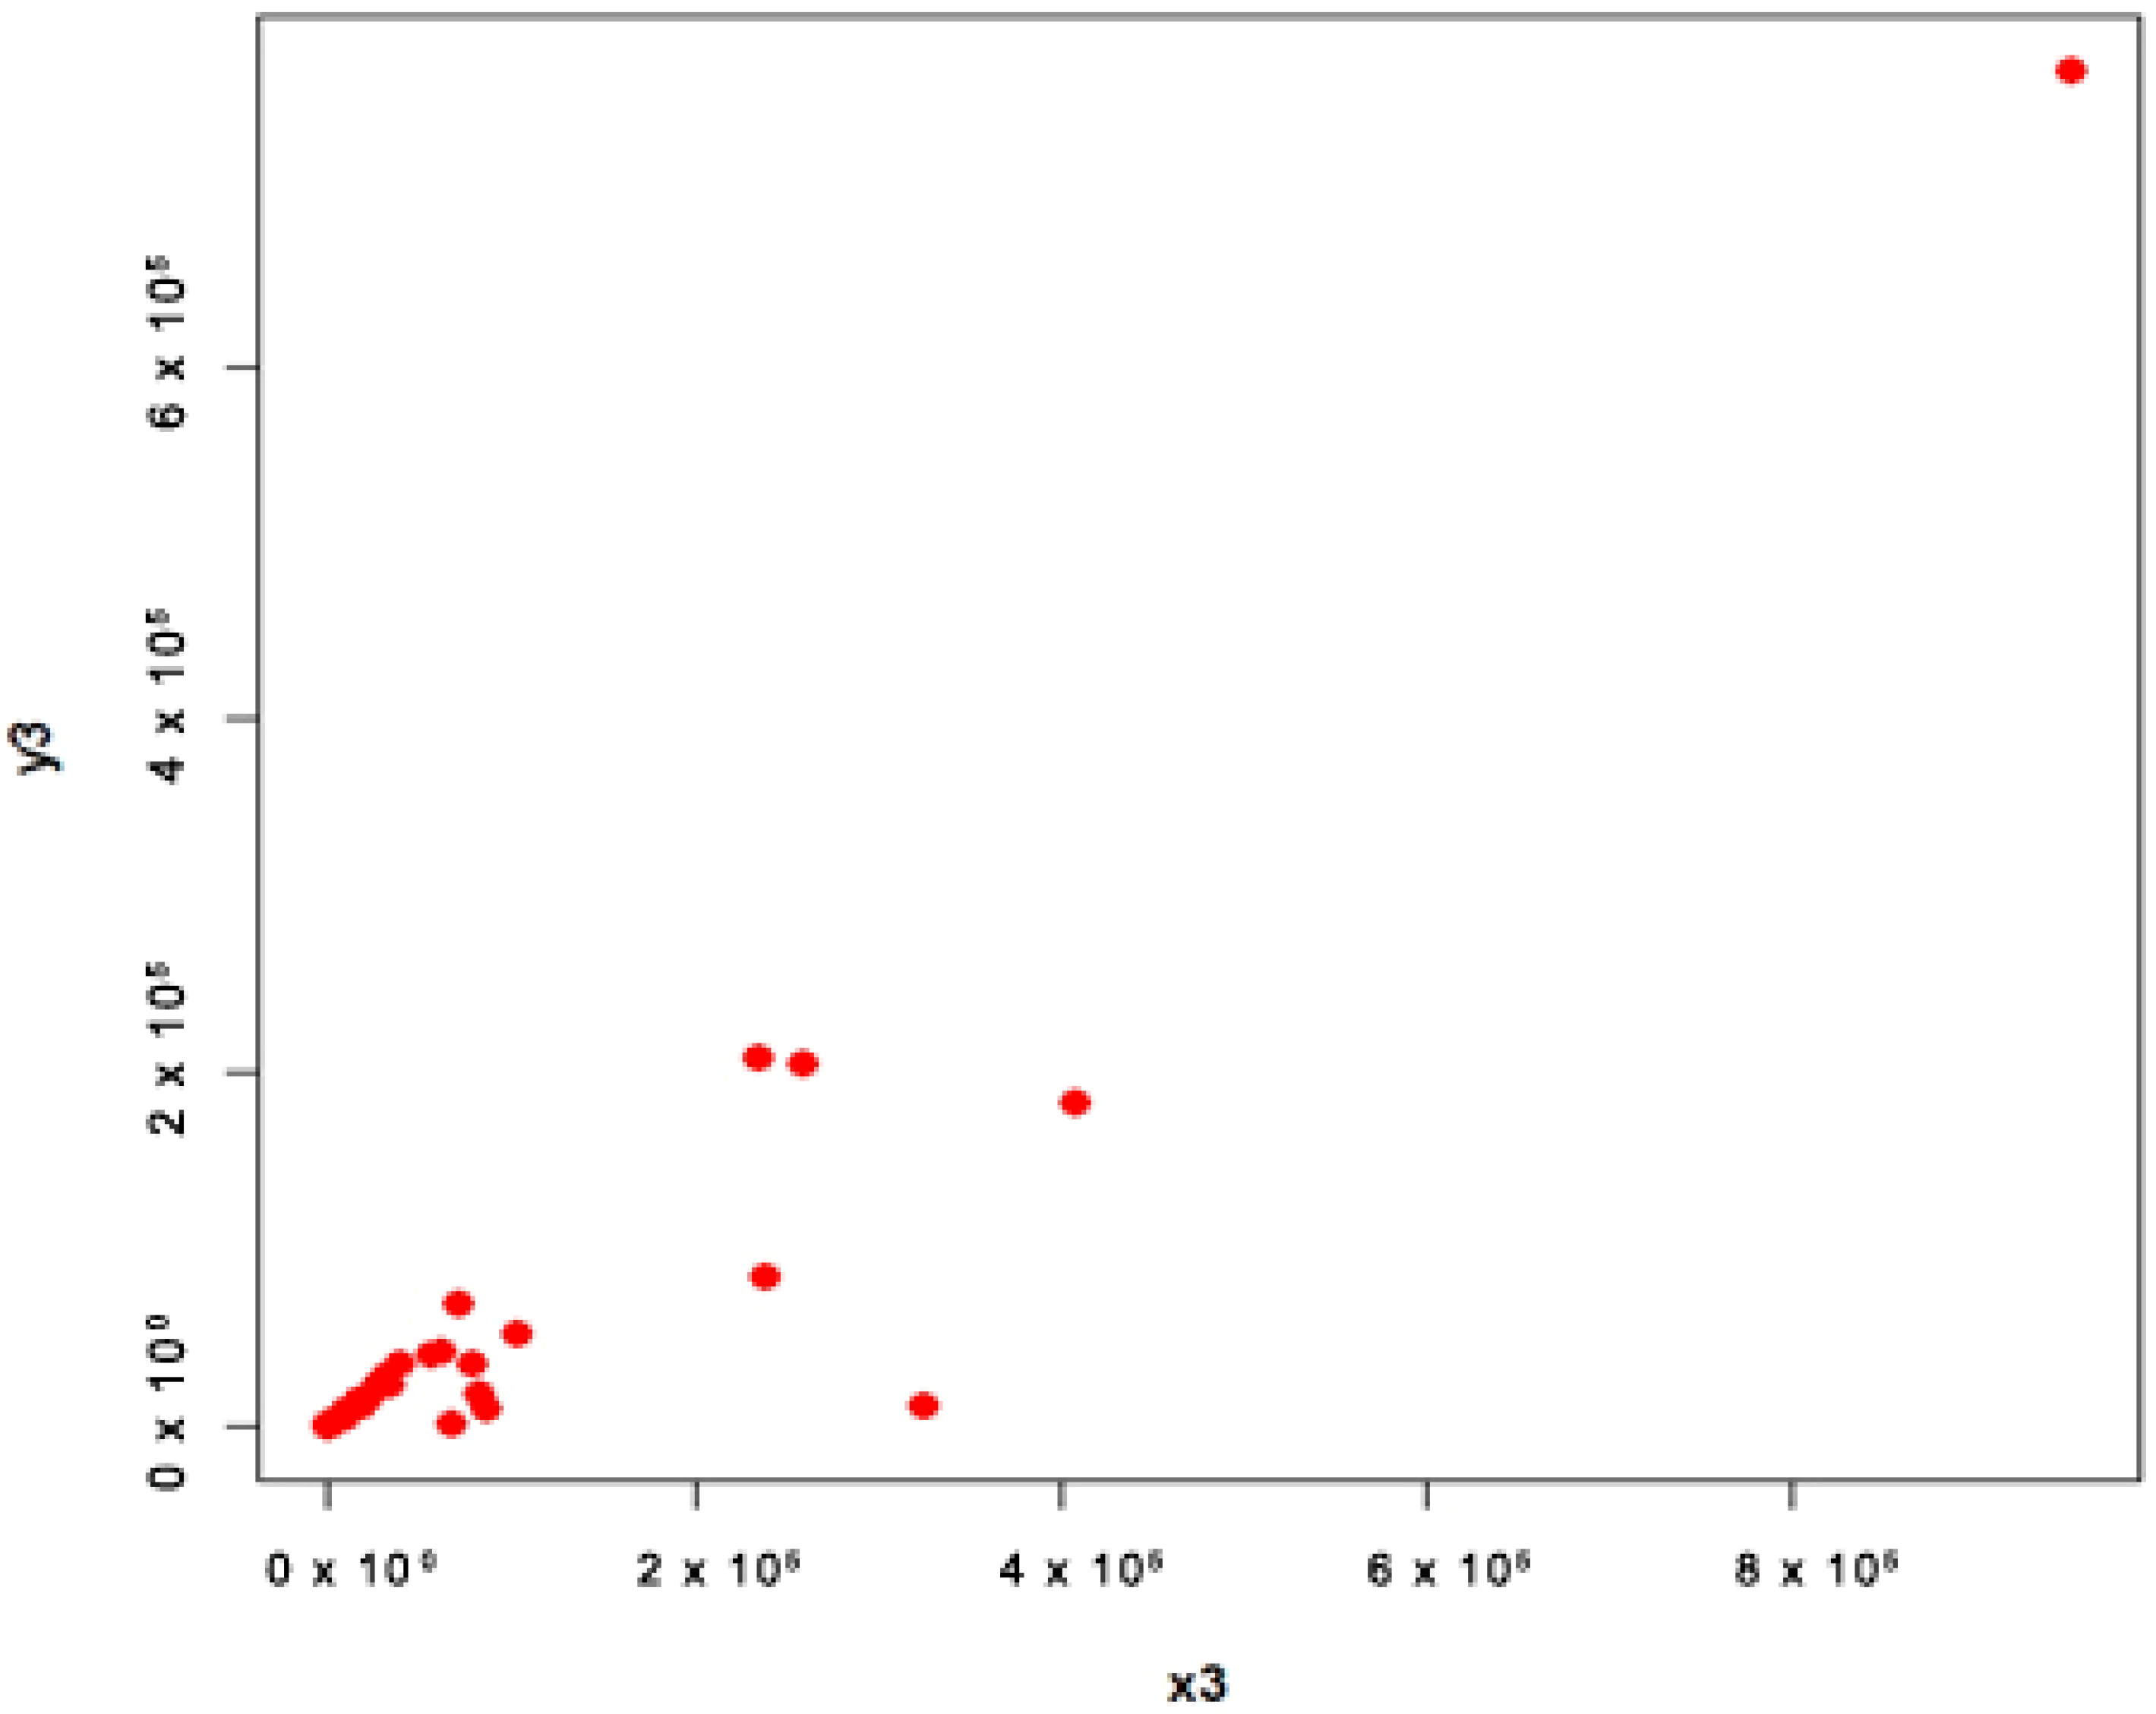
4.1. Apple Data (Population 1 and 2)
To demonstrate the performance of the proposed estimation method in this article, we examine a dataset of apples used in References [16,20].
- Population 1
We consider the following variables for population 1:
The list of apple trees in 1999;
The amount of apples produced in 1999.
The extreme values of each stratum are clearly shown in the scatter plots in Figure 1, Figure 2, Figure 3, Figure 4, Figure 5, Figure 6, Figure 7 and Figure 8, and as a result, the data are appropriate for our suggested estimators.
- Population 2
We consider the following variables for population 2:
The amount of apples produced in 1998;
The amount of apples produced in 1999.
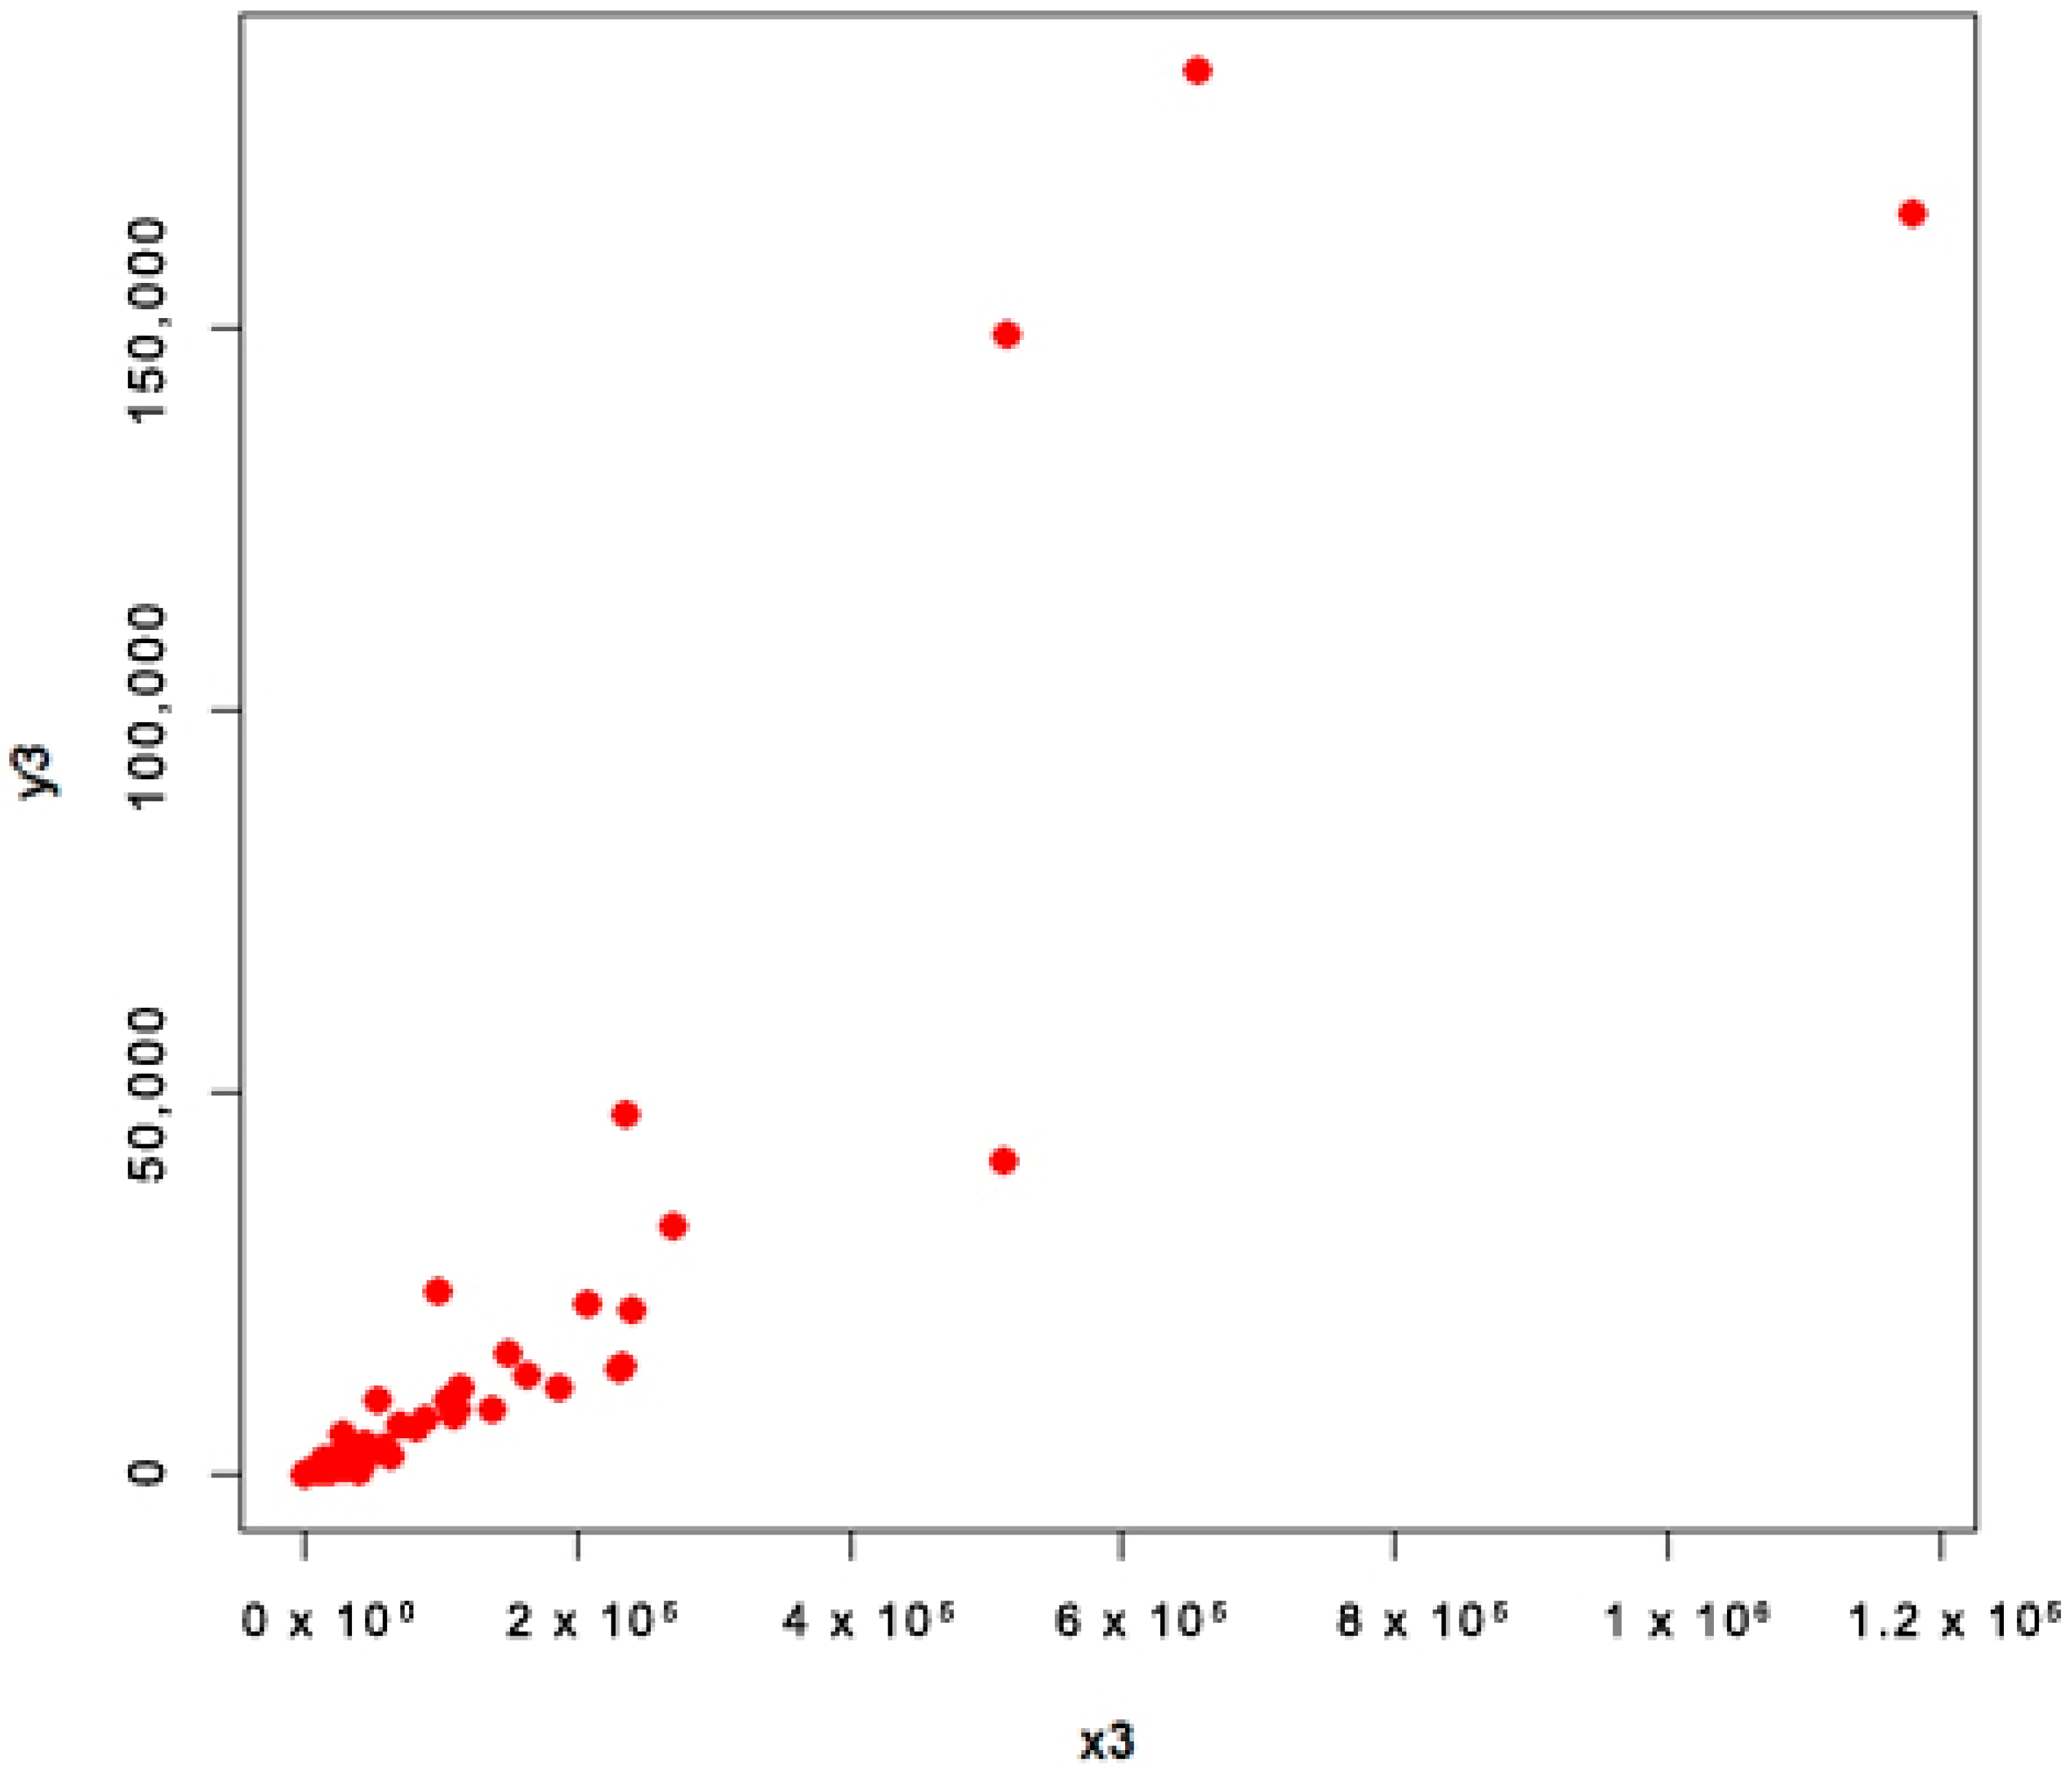
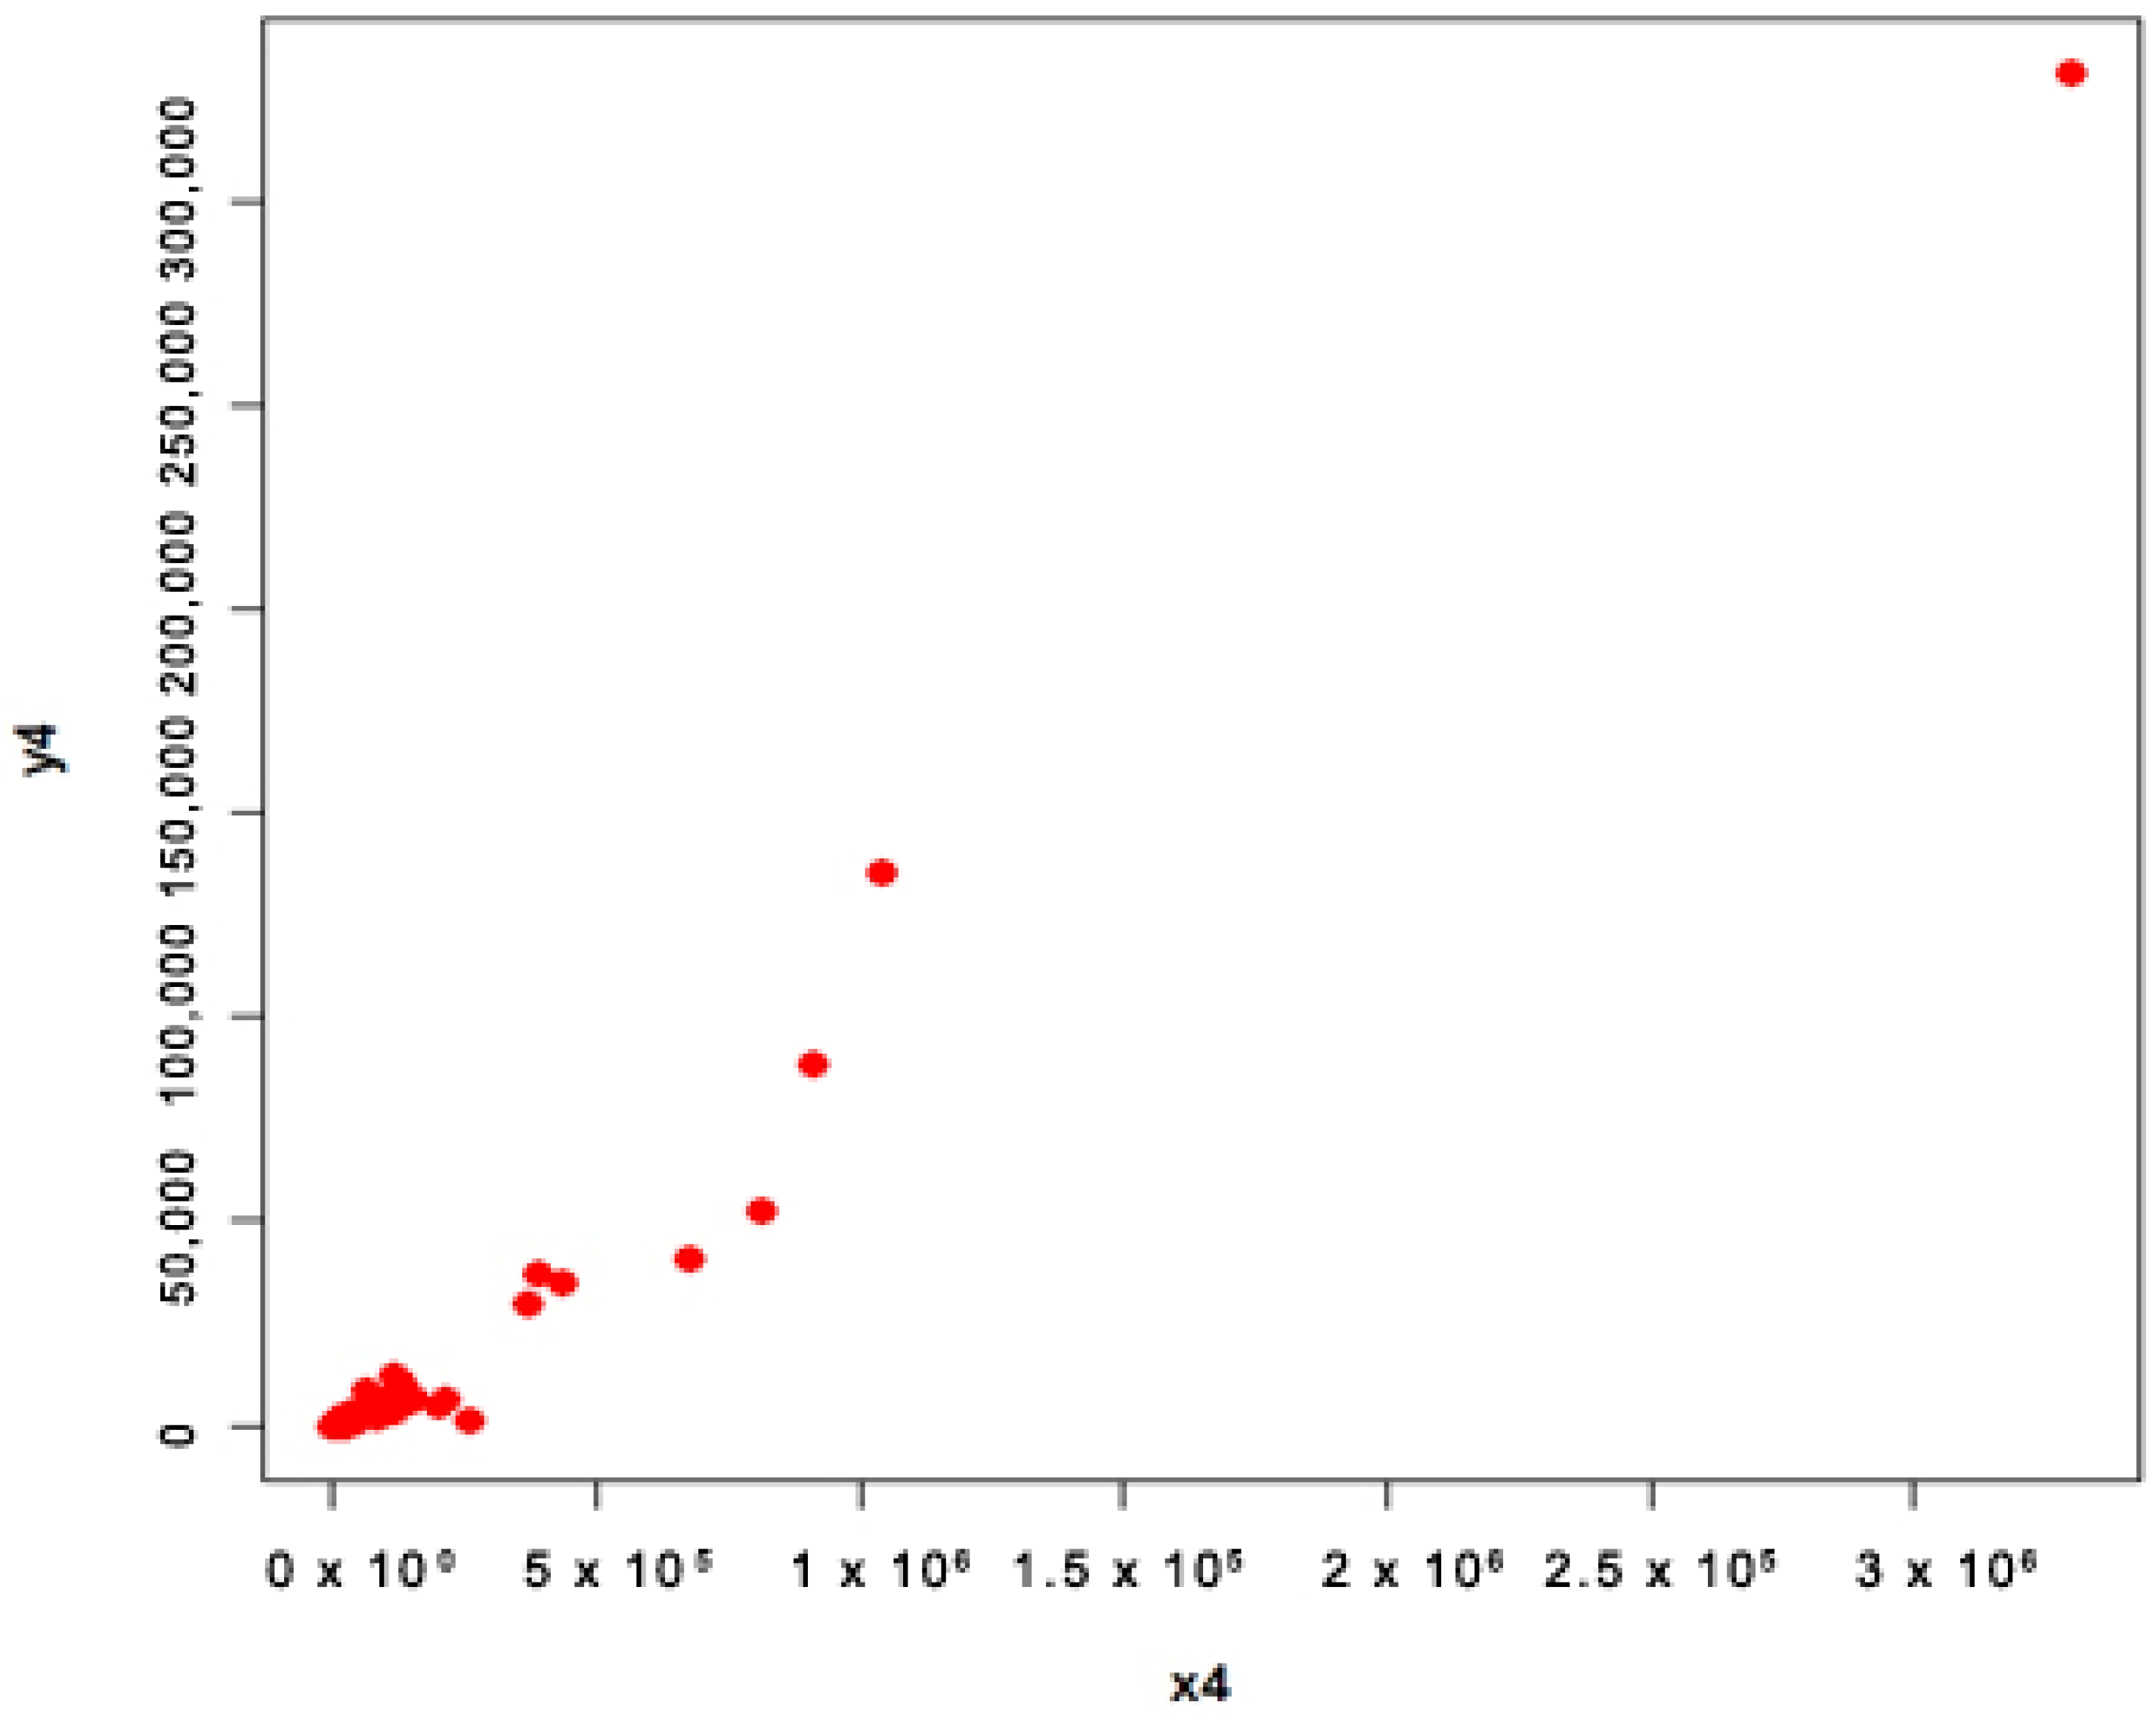
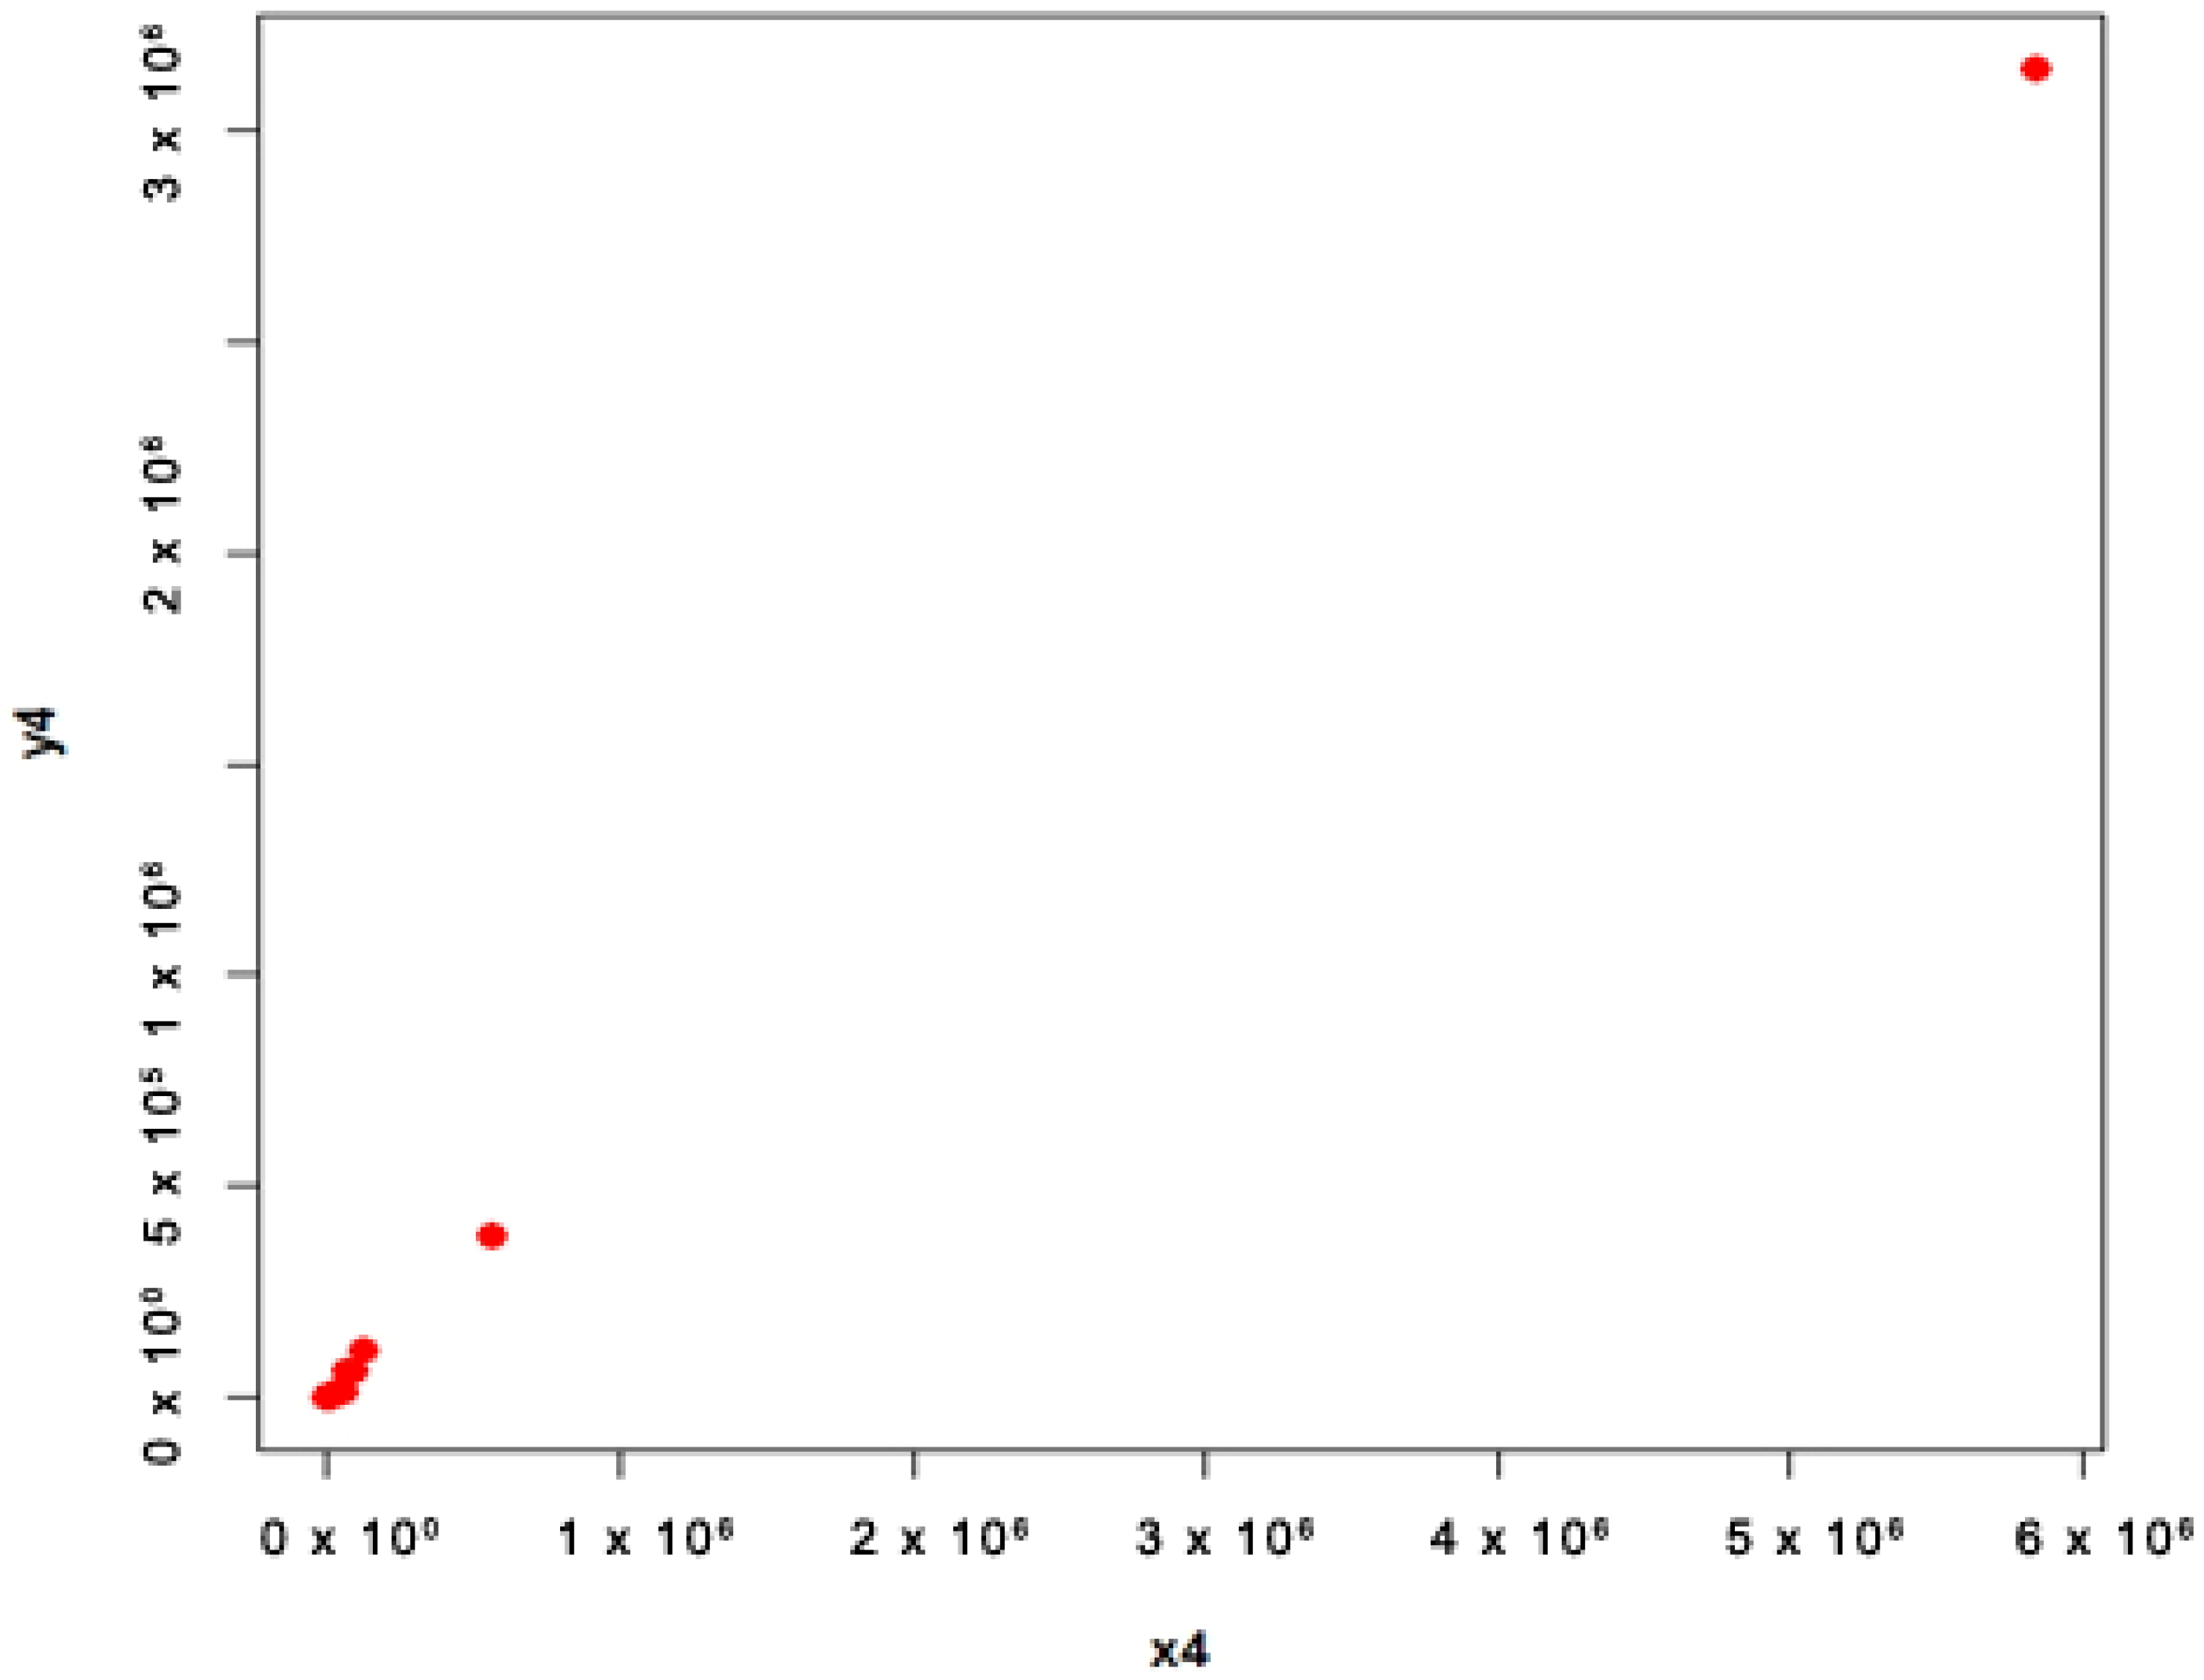
4.2. COVID-19 Data (Populations 3 and 4)
To demonstrate the performance of the proposed estimation method in this article, we examine a COVID-19 dataset, used in Reference [21].
- Population 3
We consider the following variables for population 3:
Total cases per million;
Total deaths per million.
The extreme values of each stratum are clearly shown in the scatter plots in Figure 9, Figure 10, Figure 11, Figure 12, Figure 13, Figure 14, Figure 15 and Figure 16, and as a result, the data are appropriate for our suggested estimators.
- Population 4
We consider the following variables for population 4:
Total number of cases per million;
Total number of recoveries per million.
4.3. Interpretation
Results of Table 2, indicate that:
- For population 1, the first proposed estimator is better than first adapted estimator and the second proposed estimator is better than second adapted estimator at quantile ;
- For population 2, the first proposed estimator is better than first adapted estimator and the second proposed estimator is better than second adapted estimator at quantile ;
- For population 3, the first proposed estimator is better than first adapted estimator and the second proposed estimator is better than second adapted estimator at quantile ;
- For population 4, the first proposed estimator is better than first adapted estimator and the second proposed estimator is better than second adapted estimator at quantile .
The similar pattern of performance for PREs of the suggested estimation methods can be observed in Table 3.
Based on these results for all the estimators, we conclude that the proposed estimators has minimum bias, MSE, and maximum PRE values for all four populations compared to the adapted estimators.
5. Conclusions
There are a variety of calibration estimation methods that use one or two calibration constraints based on supplementary data. In this article, a new, improved calibration estimator of CDF using robust measures is developed under StRS. To evaluate the effectiveness of the developed calibration estimators with the adapted calibration estimators, we conducted a simulation study using asymmetric real-life datasets. We calculate the bias, MSE, and PREs of calibration estimators. The results demonstrate that the proposed calibration estimators are more efficient than the adapted calibration estimators for asymmetric datasets. In future studies, the work can be expanded to incorporate different sampling schemes, and new proposals can be compared to existing approaches.
Author Contributions
Conceptualization, H.A., M.H., U.S., W.E., Y.T., S.I. and S.S.; methodology, H.A., M.H., U.S., W.E., Y.T., S.I. and S.S.; software, H.A. and U.S.; validation, H.A., M.H., U.S.; formal analysis, H.A., M.H., U.S., W.E., Y.T., S.I. and S.S.; investigation, H.A. and U.S.; resources, H.A. and U.S.; data curation, H.A. and U.S.; writing—original draft preparation, H.A., M.H., U.S., W.E., Y.T., S.I. and S.S.; writing—review and editing, H.A., M.H., U.S., W.E., Y.T., S.I. and S.S.; visualization, H.A. and U.S.; supervision, M.H.; project administration, H.A., M.H., U.S., W.E., Y.T., S.I. and S.S.; funding acquisition, W.E. and Y.T. All authors have read and agreed to the published version of the manuscript.
Funding
The study was funded by Researchers Supporting Project number (RSP2023R488), King Saud University, Riyadh, Saudi Arabia.
Institutional Review Board Statement
Not applicable.
Informed Consent Statement
Not applicable.
Data Availability Statement
All the dataset information is already available in References [16,20,21].
Acknowledgments
The study was funded by Researchers Supporting Project number (RSP2023R488), King Saud University, Riyadh, Saudi Arabia.
Conflicts of Interest
The authors declare no conflict of interest.
References
- Chambers, R.L.; Dunstan, R. Estimating distribution functions from survey data. Biometrika 1986, 73, 597–604. [Google Scholar] [CrossRef]
- Rao, J.N.K.; Kovar, J.G.; Mental, H.J. On estimating distribution functions and quantiles from survey data using auxiliary information. Biometrika 1990, 77, 365–375. [Google Scholar] [CrossRef]
- Kuk, A.Y. A kernel method for estimating finite population distribution functions using auxiliary information. Biometrika 1993, 80, 385–392. [Google Scholar] [CrossRef]
- Chen, J.; Wu, C. Estimation of distribution function and quantiles using the model-calibrated pseudo empirical likelihood method. Stat. Sin. 2002, 12, 1223–1239. [Google Scholar]
- Singh, H.P.; Singh, S.; Kozak, M. A family of estimators of finite-population distribution function using auxiliary information. Acta Appl. Math. 2008, 104, 115–130. [Google Scholar] [CrossRef]
- Yaqub, M.; Shabbir, J. Estimation of population distribution function in the presence of non-response. Hacet. J. Math. Stat. 2018, 47, 471–511. [Google Scholar] [CrossRef]
- Akhlaq, T.; Ismail, M.; Shahbaz, M.Q. On Efficient Estimation of Process Variability. Symmetry 2019, 11, 554. [Google Scholar] [CrossRef]
- Hussain, S.; Ahmad, S.; Akhtar, S.; Javed, A.; Yasmeen, U. Estimation of finite population distribution function with dual use of auxiliary information under non-response. PLoS ONE 2020, 15, e0243584. [Google Scholar] [CrossRef] [PubMed]
- Ahmad, S.; Hussain, S.; Zahid, E.; Iftikhar, A.; Hussain, S.; Shabbir, J.; Aamir, M. A Simulation Study: Population Distribution Function Estimation Using Dual Auxiliary Information under Stratified Sampling Scheme. Math. Probl. Eng. 2022, 2022, 3263022. [Google Scholar] [CrossRef]
- Ahmad, S.; Aamir, M.; Hussain, S.; Shabbir, J.; Zahid, E.; Subkrajang, K.; Jirawattanapanit, A. A new generalized class of exponential factor-type estimators for population distribution function using two auxiliary variables. Math. Probl. Eng. 2022, 2022, 2545517. [Google Scholar] [CrossRef]
- Deville, J.C.; Särndal, C.E. Calibration estimators in survey sampling. J. Am. Stat. Assoc. 1992, 87, 376–382. [Google Scholar] [CrossRef]
- Tracy, D.S.; Singh, S.; Arnab, R. Note on calibration in stratified and double sampling. Surv. Methodol. 2003, 29, 99–104. [Google Scholar]
- Koyuncu, N.; Kadilar, C. Calibration Weighting in Stratified Random Sampling. Commun. Stat. Simul. Comput. 2016, 45, 2267–2275. [Google Scholar] [CrossRef]
- Ozgul, N. New Calibration Estimator Based on Two Auxiliary Variables in Stratified Sampling. Commun. Stat.—Theory Methods 2019, 48, 1481–1492. [Google Scholar] [CrossRef]
- Lata, A.S.; Rao, D.; Khan, M.G. Calibration estimation using proposed distance function. In Proceedings of the 2017 4th Asia-Pacific World Congress on Computer Science and Engineering (APWC on CSE), Mana Island, Fiji, 11–13 December 2017; pp. 162–166. [Google Scholar]
- Shahzad, U.; Ahmad, I.; Almanjahie, I.; Al-Noor, N.H.; Hanif, M. A new class of L-Moments based calibration variance Estimators. Comput. Mater. Contin. 2021, 66, 3013–3028. [Google Scholar] [CrossRef]
- Shahzad, U.; Ahmad, I.; Almanjahie, I.; Hanif, M.; Al-Noor, N.H. L-Moments and calibration based variance estimators under double stratified random sampling scheme: An application of covid-19 pandemic. Sci. Iran. 2023, 30, 814–821. [Google Scholar] [CrossRef]
- Naz, F.; Nawaz, T.; Pang, T.; Abid, M. Use of nonconventional dispersion measures to improve the efficiency of ratio-type estimators of variance in the presence of outliers. Symmetry 2019, 12, 16. [Google Scholar] [CrossRef]
- Zaman, T.; Bulut, H. Robust calibration for estimating the population mean using stratified random sampling. Sci. Iran. 2023, in press. [CrossRef]
- Shahzad, U.; Ahmad, I.; Almanjahie, I.; Al-Noor, N.H. L-Moments based calibrated variance estimators using double stratified sampling. Comput. Mater. Contin. 2021, 68, 3411–3430. [Google Scholar] [CrossRef]
- Shahzad, U.; Ahmad, I.; Garcia Luengo, A.V.; Zaman, T.; Al-Noor, N.H.; Kumar, A. Estimation of coefficient of variation using calibrated estimators in double stratified random sampling. Mathematics 2023, 11, 252. [Google Scholar] [CrossRef]
Disclaimer/Publisher’s Note: The statements, opinions and data contained in all publications are solely those of the individual author(s) and contributor(s) and not of MDPI and/or the editor(s). MDPI and/or the editor(s) disclaim responsibility for any injury to people or property resulting from any ideas, methods, instructions or products referred to in the content. |
© 2023 by the authors. Licensee MDPI, Basel, Switzerland. This article is an open access article distributed under the terms and conditions of the Creative Commons Attribution (CC BY) license (https://creativecommons.org/licenses/by/4.0/).