Article

Asymmetry of Sagittal Otolith Shape Based on Inner Ear Side Tested on Mediterranean Red Mullet (Mullus barbatus Linnaeus, 1758): Comparative Analysis of 2D and 3D Otolith Shape Data

by
Nicolas Andrialovanirina
1,2,
Émilie Poisson Caillault
1,
Sébastien Couette
3,4,
Rémi Laffont
4,
Lauriane Poloni
3,4,
Camille Lutet-Toti
4,5 and
Kélig Mahé
2,*
1
UR 4491, LISIC, Laboratoire d’Informatique Signal et Image de la Côte d’Opale, University of the Littoral Côte d’Opale, 62100 Calais, France
2
IFREMER, Fisheries Laboratory, 150 quai Gambetta, 62321 Boulogne-sur-Mer, France
3
Ecole Pratique des Hautes Etudes, PSL Université, 75014 Paris, France
4
UMR CNRS 6282 Biogéosciences, Université de Bourgogne, 6 Bld Gabriel, 21000 Dijon, France
5
Alma Mater, Studiorum–Università di Bologna, 40126 Bologna, Italy
*
Author to whom correspondence should be addressed.
Symmetry 2023, 15(5), 1067; https://doi.org/10.3390/sym15051067
Submission received: 15 April 2023 / Revised: 29 April 2023 / Accepted: 4 May 2023 / Published: 11 May 2023
(This article belongs to the Section Life Sciences)

Abstract

:
Sagittal otolith shape analysis is one of the most widespread techniques worldwide to discriminate fish stock units, as this proxy integrates both environmental and genetic factors. All previous otolith shape studies have been carried out using two-dimensional (2D) images, a partial representation of the whole shape of the otolith. However, prior to the identification of stock unit boundaries, the influence of other potential drivers controlling the otolith shape must be analysed to limit their bias. In this study, the presence of asymmetry in otolith shape depending on the inner ear side (i.e., left versus right inner ears) was tested by comparing the approaches of 2D and three-dimensional (3D) sagittal otolith shape analyses. Eighty-two red mullet adults (Mullus barbatus) from three locations in the eastern part of the Mediterranean Sea were studied. Fourier harmonic descriptors computed from 2D outlines and spherical harmonic descriptors computed from 3D meshes were used to evaluate otolith shape variation. The results of a multivariate mixed-effects model from 2D images showed that there was no asymmetry effect of inner ear side on the otolith shape in any location. There was, however, a significant geographical effect for the 2D otolith shape between the Adriatic Sea and the Levantine Sea. In contrast, 3D information showed that both side effects and geographical differences were significant. This is the first study comparing 2D and 3D data showing different results on the same sample of red mullet. These results demonstrate the importance of 3D otolith shape analysis for stock discrimination.

1. Introduction

The level of fishery resource exploitation remains high, with stocks fished at biologically sustainable levels falling from 90% to 65.8% between 1974 to 2017 [1]. A fish stock unit (called “stocks” in this study) is defined by all individuals presenting similar phenotypic and genetic compositions [2,3,4]. Around 59.6% of fisheries stocks are at the maximum sustainable level of exploitation; however, the global catch trend has been relatively stable since 1980 [1]. In 2020, 52% of stocks caught by French vessels were healthy fish stock or sustainable (9% of stocks were healthy fish stock in 2000) [5]. Efforts to implement fishery management measures and research developments on fish stocks and resources have enabled these advances in sustainability. The effectiveness of fishery management depends on the correct delineation of the stocks, which is a prerequisite for the study of the dynamics and structure of fishery management units [3,4,6,7,8]. Each stock responds differently to fishing pressure and management measures. Misidentification of stock units can lead to poor management results, increasing overfishing risks [9,10]. In addition, these stocks are considered the basic unit for evaluation of fishery resources and their sustainable levels of exploitation [1,11,12,13].
There are several methods to define fish stocks [14], including genetic markers [15,16], natural markers such as parasites [17,18,19], growth rates and fatty acids in tissues [20], life history traits, external tags, or microchemistry [4,6]. Sagittal otolith shape and microchemistry are widely used proxies for stock identification in many fish species, employed either separately or in combination [4,6,14,21]. Otolith shape is a very efficient tool to identify the stock structure of fishes [14], as it results from a combination of environmental conditions [22,23,24,25,26,27], genetic heritage [8,26,27,28,29,30,31,32], and ontogenetic evolution [8,33,34]. Additionally, variations in the shape of otoliths between the inner ear can provide interspecific [35] and intraspecific [36] fish differentiating.
The otolith is a calcified structure located in the vestibular system of the inner ear. Otoliths are metabolically inert structures, i.e., they cannot be altered or generally resorbed [37]. The primary research use of the otolith is to provide the age data necessary for age-structured models. Since Reibisch (1899) [38], many studies have used otoliths as tools in fishery sciences. These structures are regarded as natural archives, meaning that past environmental and climatic information, together with the life history of the individual, are recorded permanently [26,39].
Recent advances in image analysis, processing, and free libraries [40] have reinforced the use of otoliths for fish research. Importantly, otolith shape analysis is much less costly than genetic analysis for stock identification purposes [6]. The main method used to describe the shape of an otolith is standardized elliptic Fourier analysis, which integrates the real external outline [14]. Otolith shape is generally extracted from the two-dimensional (2D) images [41], but a 2D image represents only one projection plane of a three-dimensional (3D) object. A potential bias could therefore exist due to the object position during 2D acquisition. Consequently, the comparison of 2D and 3D data needs to be performed in order to estimate this potential bias. Several previous studies have used otolith weight as an estimator of shape proxy [42,43,44,45,46,47], but otoliths can have different shapes for a given weight. However, stock discrimination using the 3D shape of the otolith has not yet been performed. Studies on the 3D otolith have been focused on scans and/or extraction of otolith shape in three dimensions [48,49,50,51,52], and on understanding the functional role and evolution of the inner ear and the otolith with sound effects [53,54,55,56].
In contrast to flatfish, roundfishes generally show no asymmetry between left and right otoliths, caused mainly by the developmental canalization process [8,57]. Some of those studied species do, however, have a significant difference between the left and right otolith shapes [8,58,59]. Such differences could lead to misidentification of stock, as shown in the Mediterranean Sea for bogue (Boops boops Linnaeus, 1758) [60]. For red mullet (Mullus barbatus Linnaeus, 1758), only one study has been carried out in the gulf of Lions (North-West of Mediterranean Sea), where 2D analysis showed that the left and right otoliths are symmetrical [57].
The aims of this paper are (1) to test the potential bias of inner ear side differences in comparing left and right inner ear sagittal otoliths of the specimens between 2D and 3D approaches, and (2) to compare morphological variation of otoliths according to the geographical effect (i.e., boundaries of the stock units) analysed in two and three dimensions. The case study species is the red mullet (Mullus barbatus), which is one of the main commercial fish species in the Mediterranean Sea [61].

2. Materials and Methods
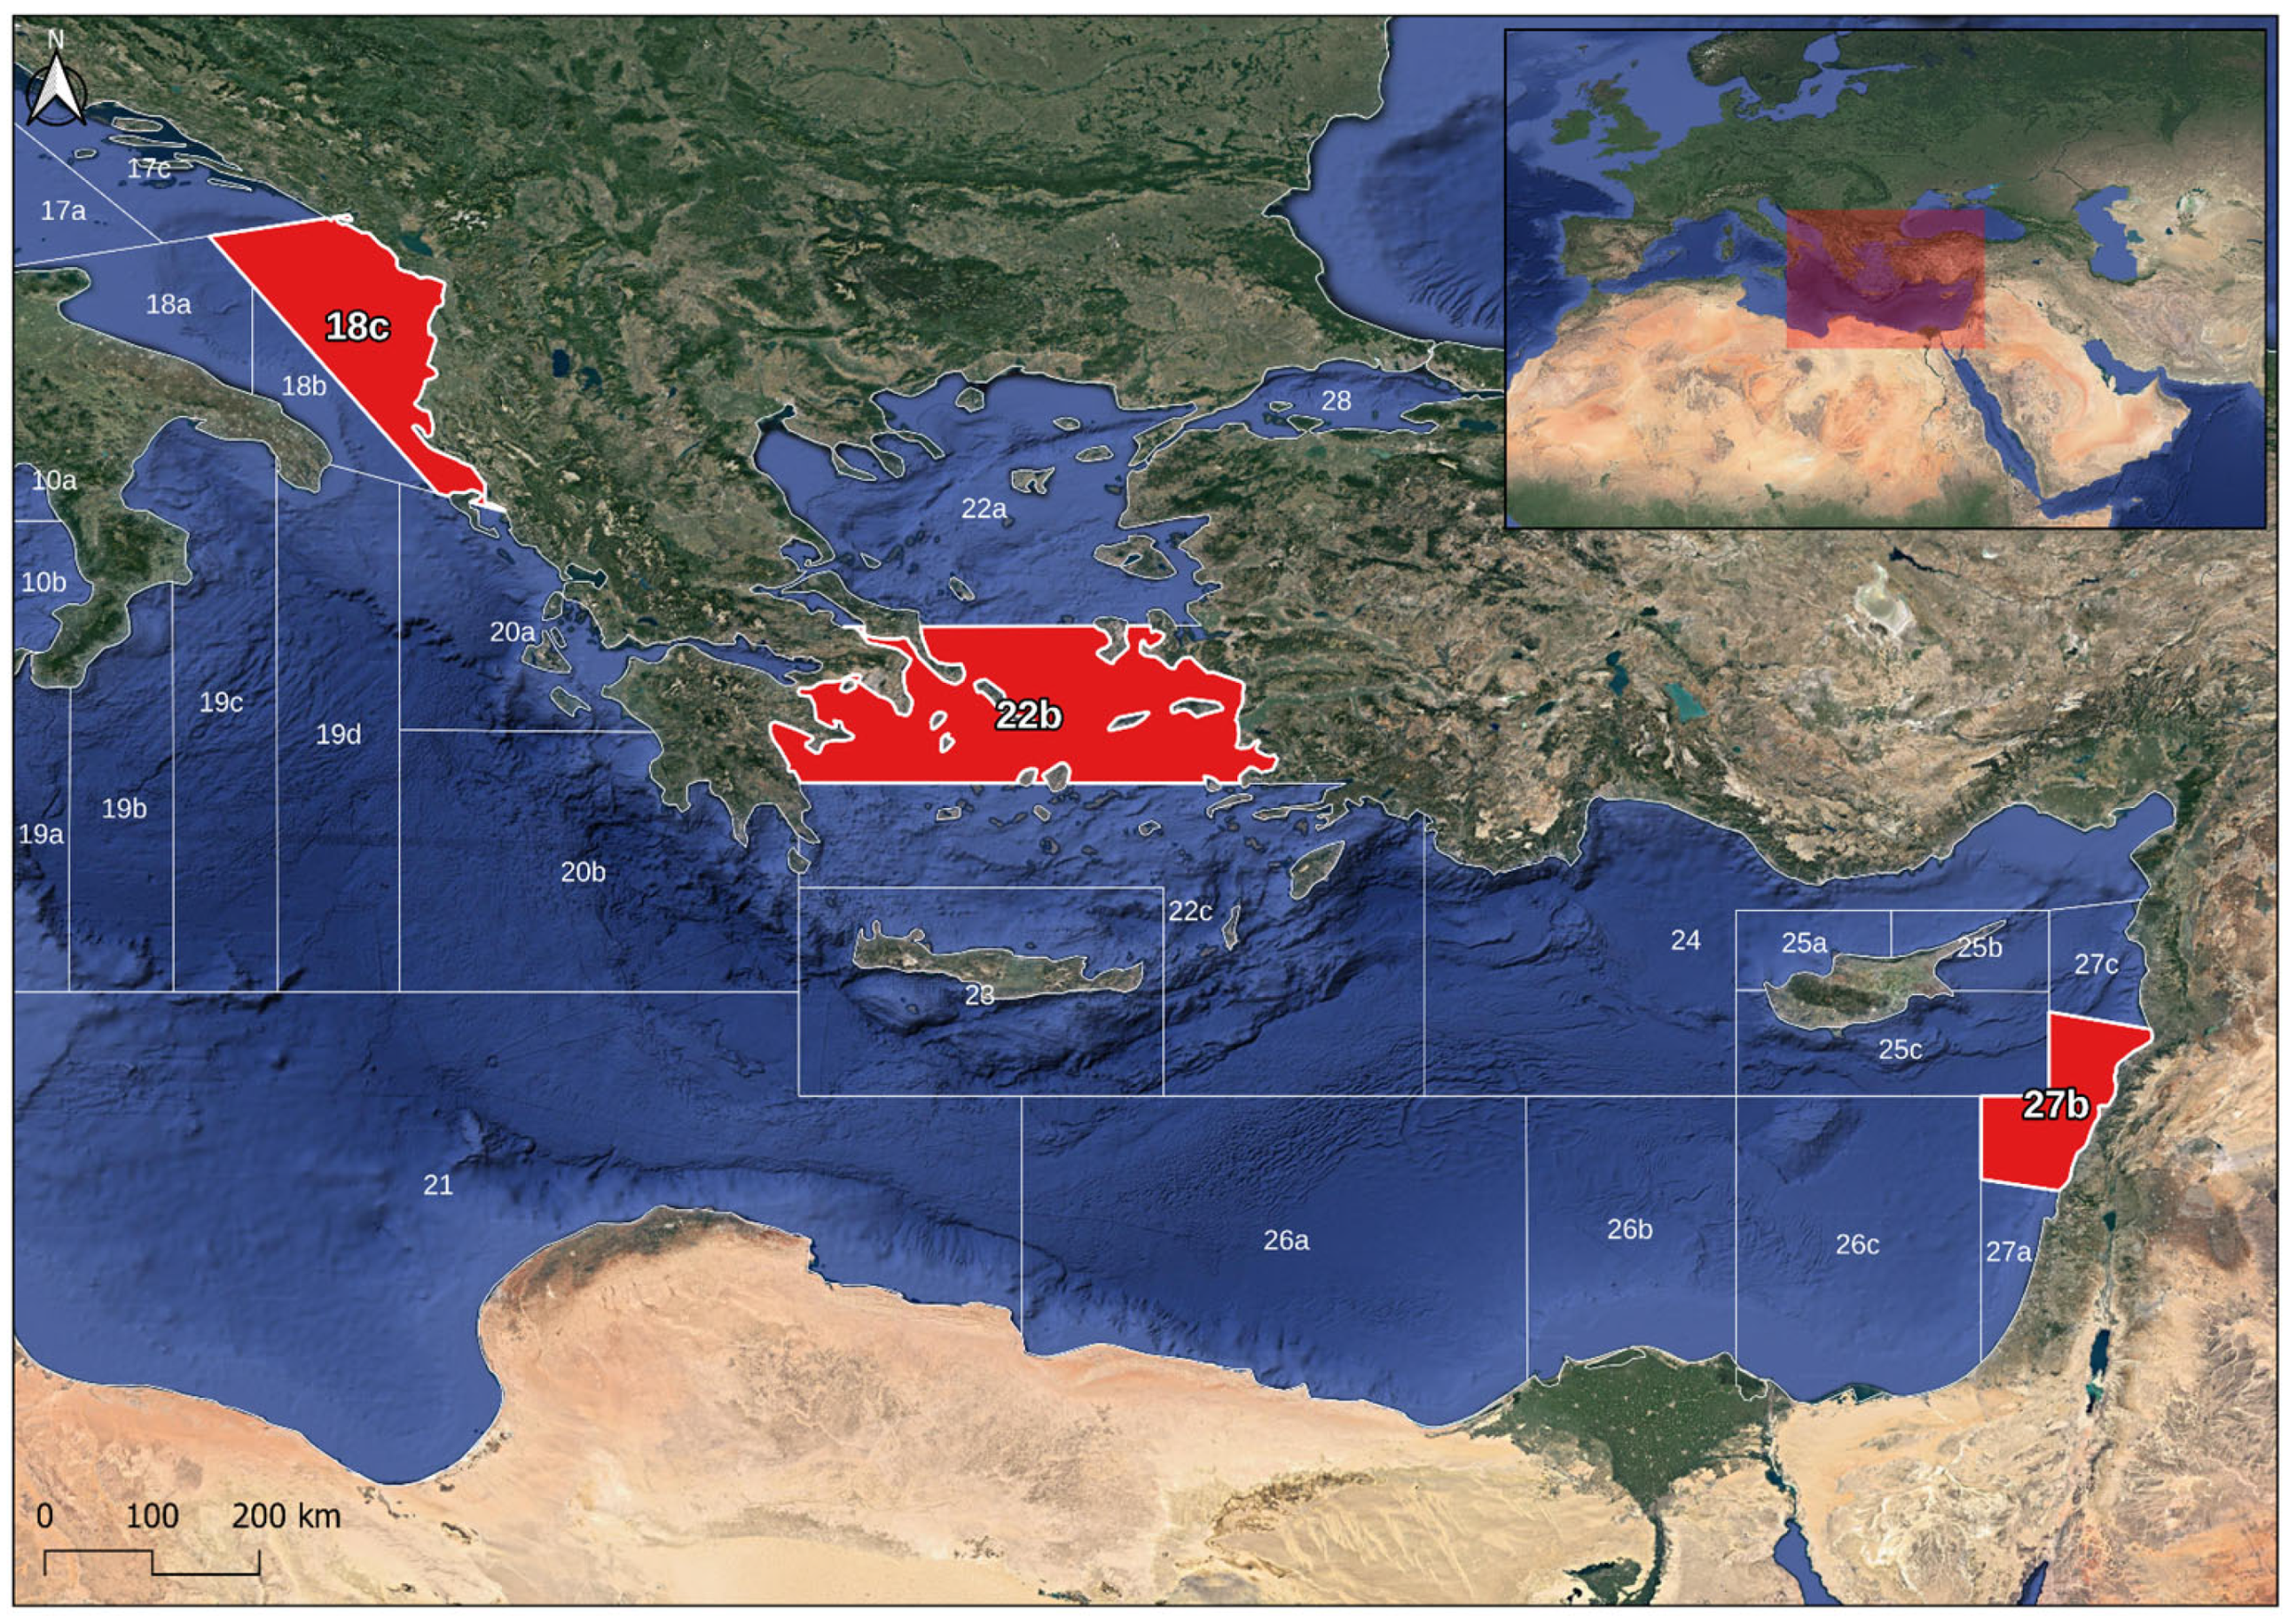
2.1. Sampling

Sampling was carried out during the Mediterranean International Trawl Survey (MEDITS survey) from 2019 [62]. Eighty-two fish were sampled, distributed over three geographical sub-areas (GSAs defined by the General Fisheries Commission for the Mediterranean, GFCM) in the eastern part of the Mediterranean Sea: 29 individuals in the Adriatic Sea (GSA-18c), 30 individuals in the Aegean Sea (GSA-22b), and 23 individuals in the Levantine basin (GSA-27b) (Figure 1). To minimize any ontogenetic effect on the otolith shape, all individuals were selected in the total length range between 141 and 212 mm (mean = 167 ± 16 mm), corresponding to young mature fishes. Both left and right whole sagittal otoliths were collected for each individual. The otolith extraction was performed by an experienced person to prevent breaking. The otoliths were carefully cleaned and transported to the laboratory using micro-tubes to avoid damage and/or dirt.

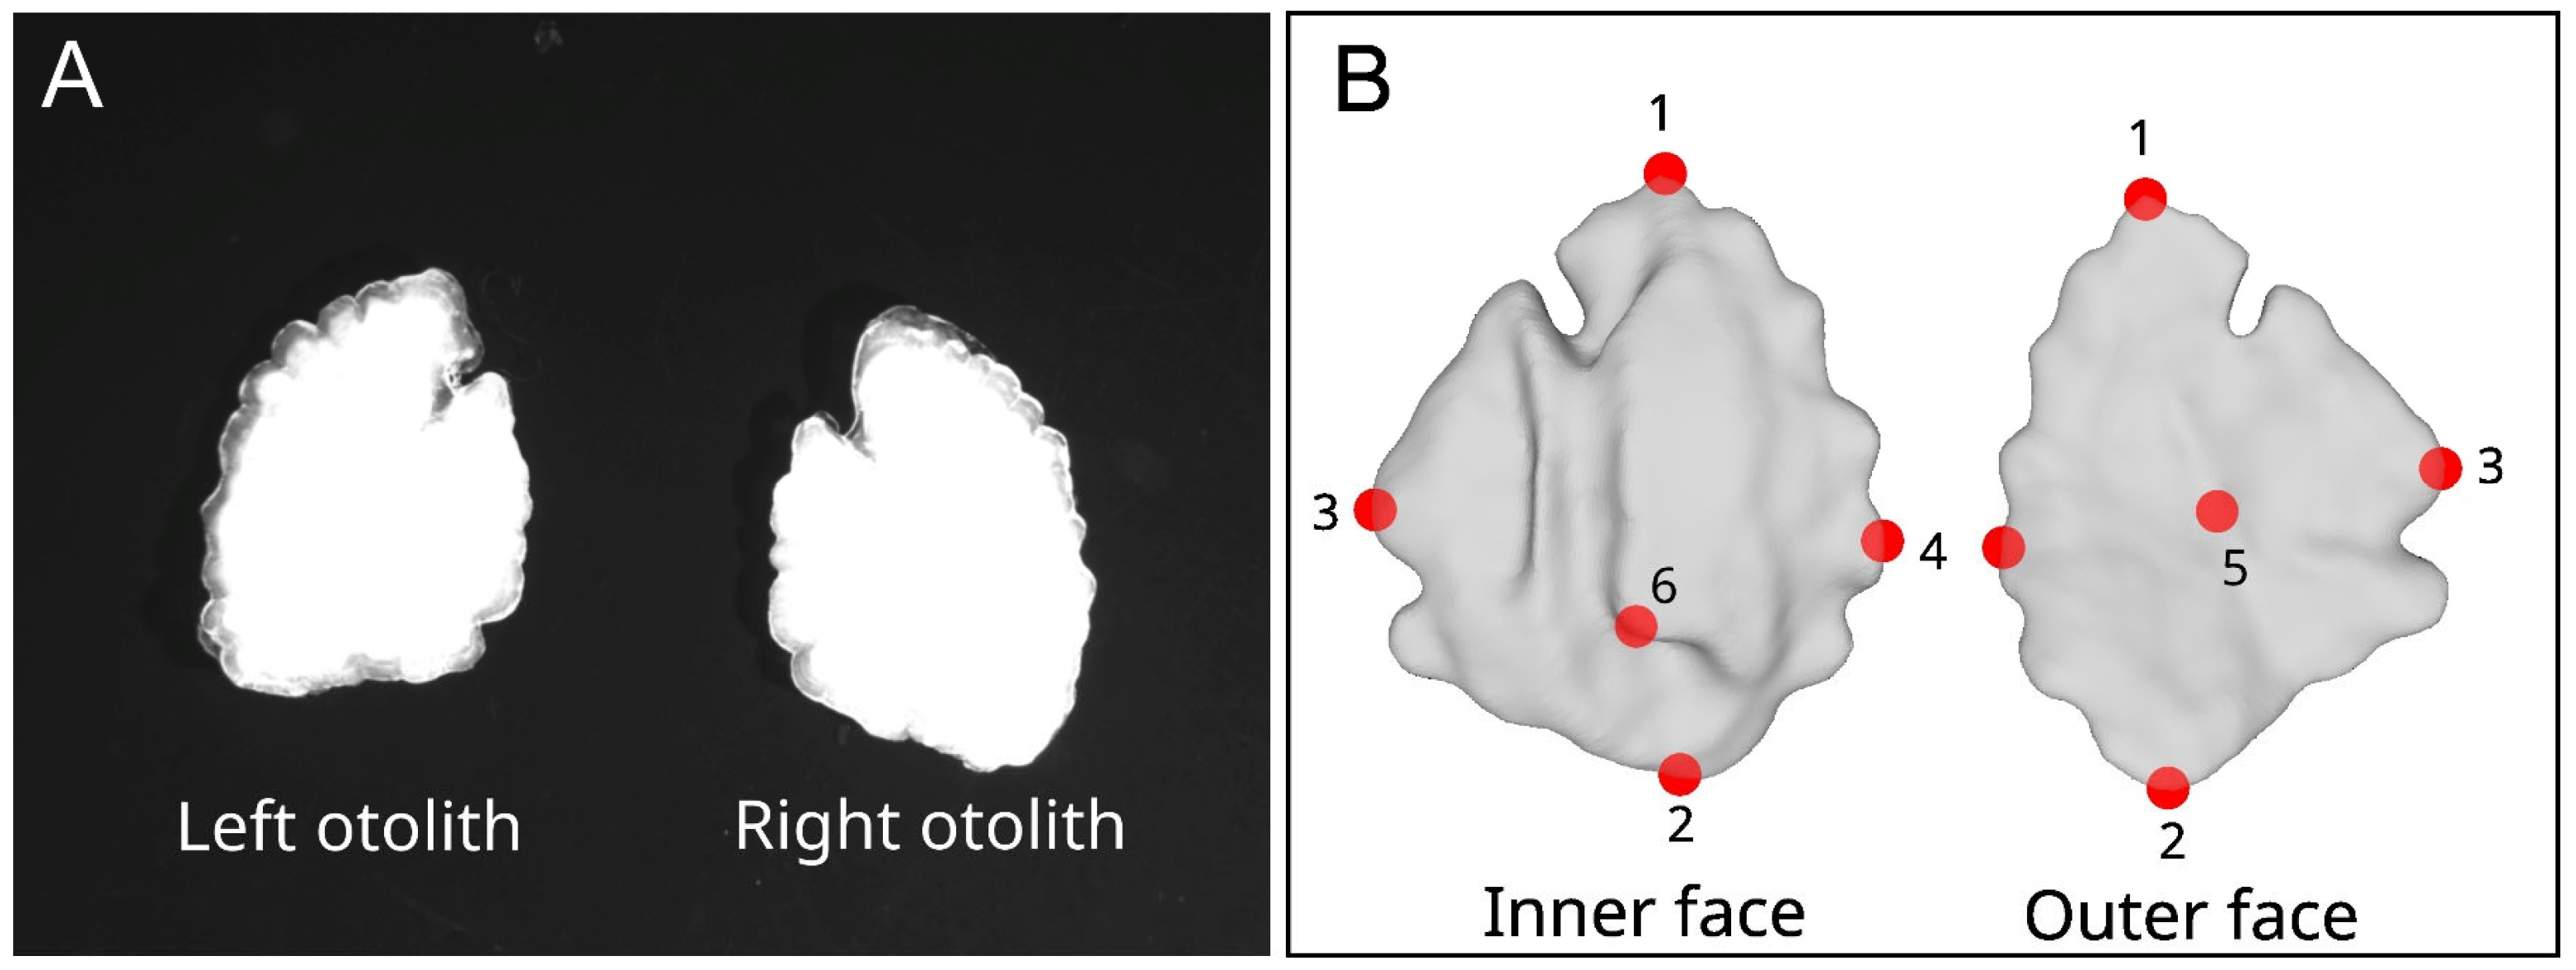
2.2. Two-Dimensional Outlines and Three-Dimensional Surfaces

Prior to image acquisition, sagittal otoliths were cleaned in water. A binocular microscope (Leica MZ6, Leica Microsystems, Wetzalar, Germany) was used to acquire the calibrated images with 1.6 magnification (SONY XCD-U100CR Camera, Sony, Tokyo, Japan) under reflected light. An R algorithm was developed to standardize all otolith images [63]. This algorithm consists of several steps: similar orientation and binarization, application of mirror effect to the right otolith images (Figure 2), and outline extraction of binarized images.
Acquisition of 3D sagittal otolith images was carried out with an X-ray microtomograph. Two-dimensional X-ray images of the otolith were acquired at different angles (with regular rotation step from 0° to 180°) expressing differences in density between the otoliths and the air. Supplementary Table S1 shows the scan parameters used in this study with µCT Skyscan 1174 (Bruker, Kontich, Belgium), with 800 µA intensity, 50 kV of tension, and 29.2 µm of voxel size.
Then, reconstruction was performed with Nrecon software (Bruker, Kontich, Belgium) to transform the X-ray images into virtual slices. Fiji software was used to compress and combine images into a single file (.nifti) while preserving the image properties. A segmentation was finally performed with 3D Slicer to extract the otolith isosurfaces as 3D meshes. A mirror transform was also applied to the right otoliths.
Six landmarks were digitized on the sagittal otolith meshes using digit3DLand [64] (Figure 2). Those landmarks will be used in the Spharm analyses [65] (Matlab functions using the Spharm analysis has been translated to R language) to pre-align the meshes.

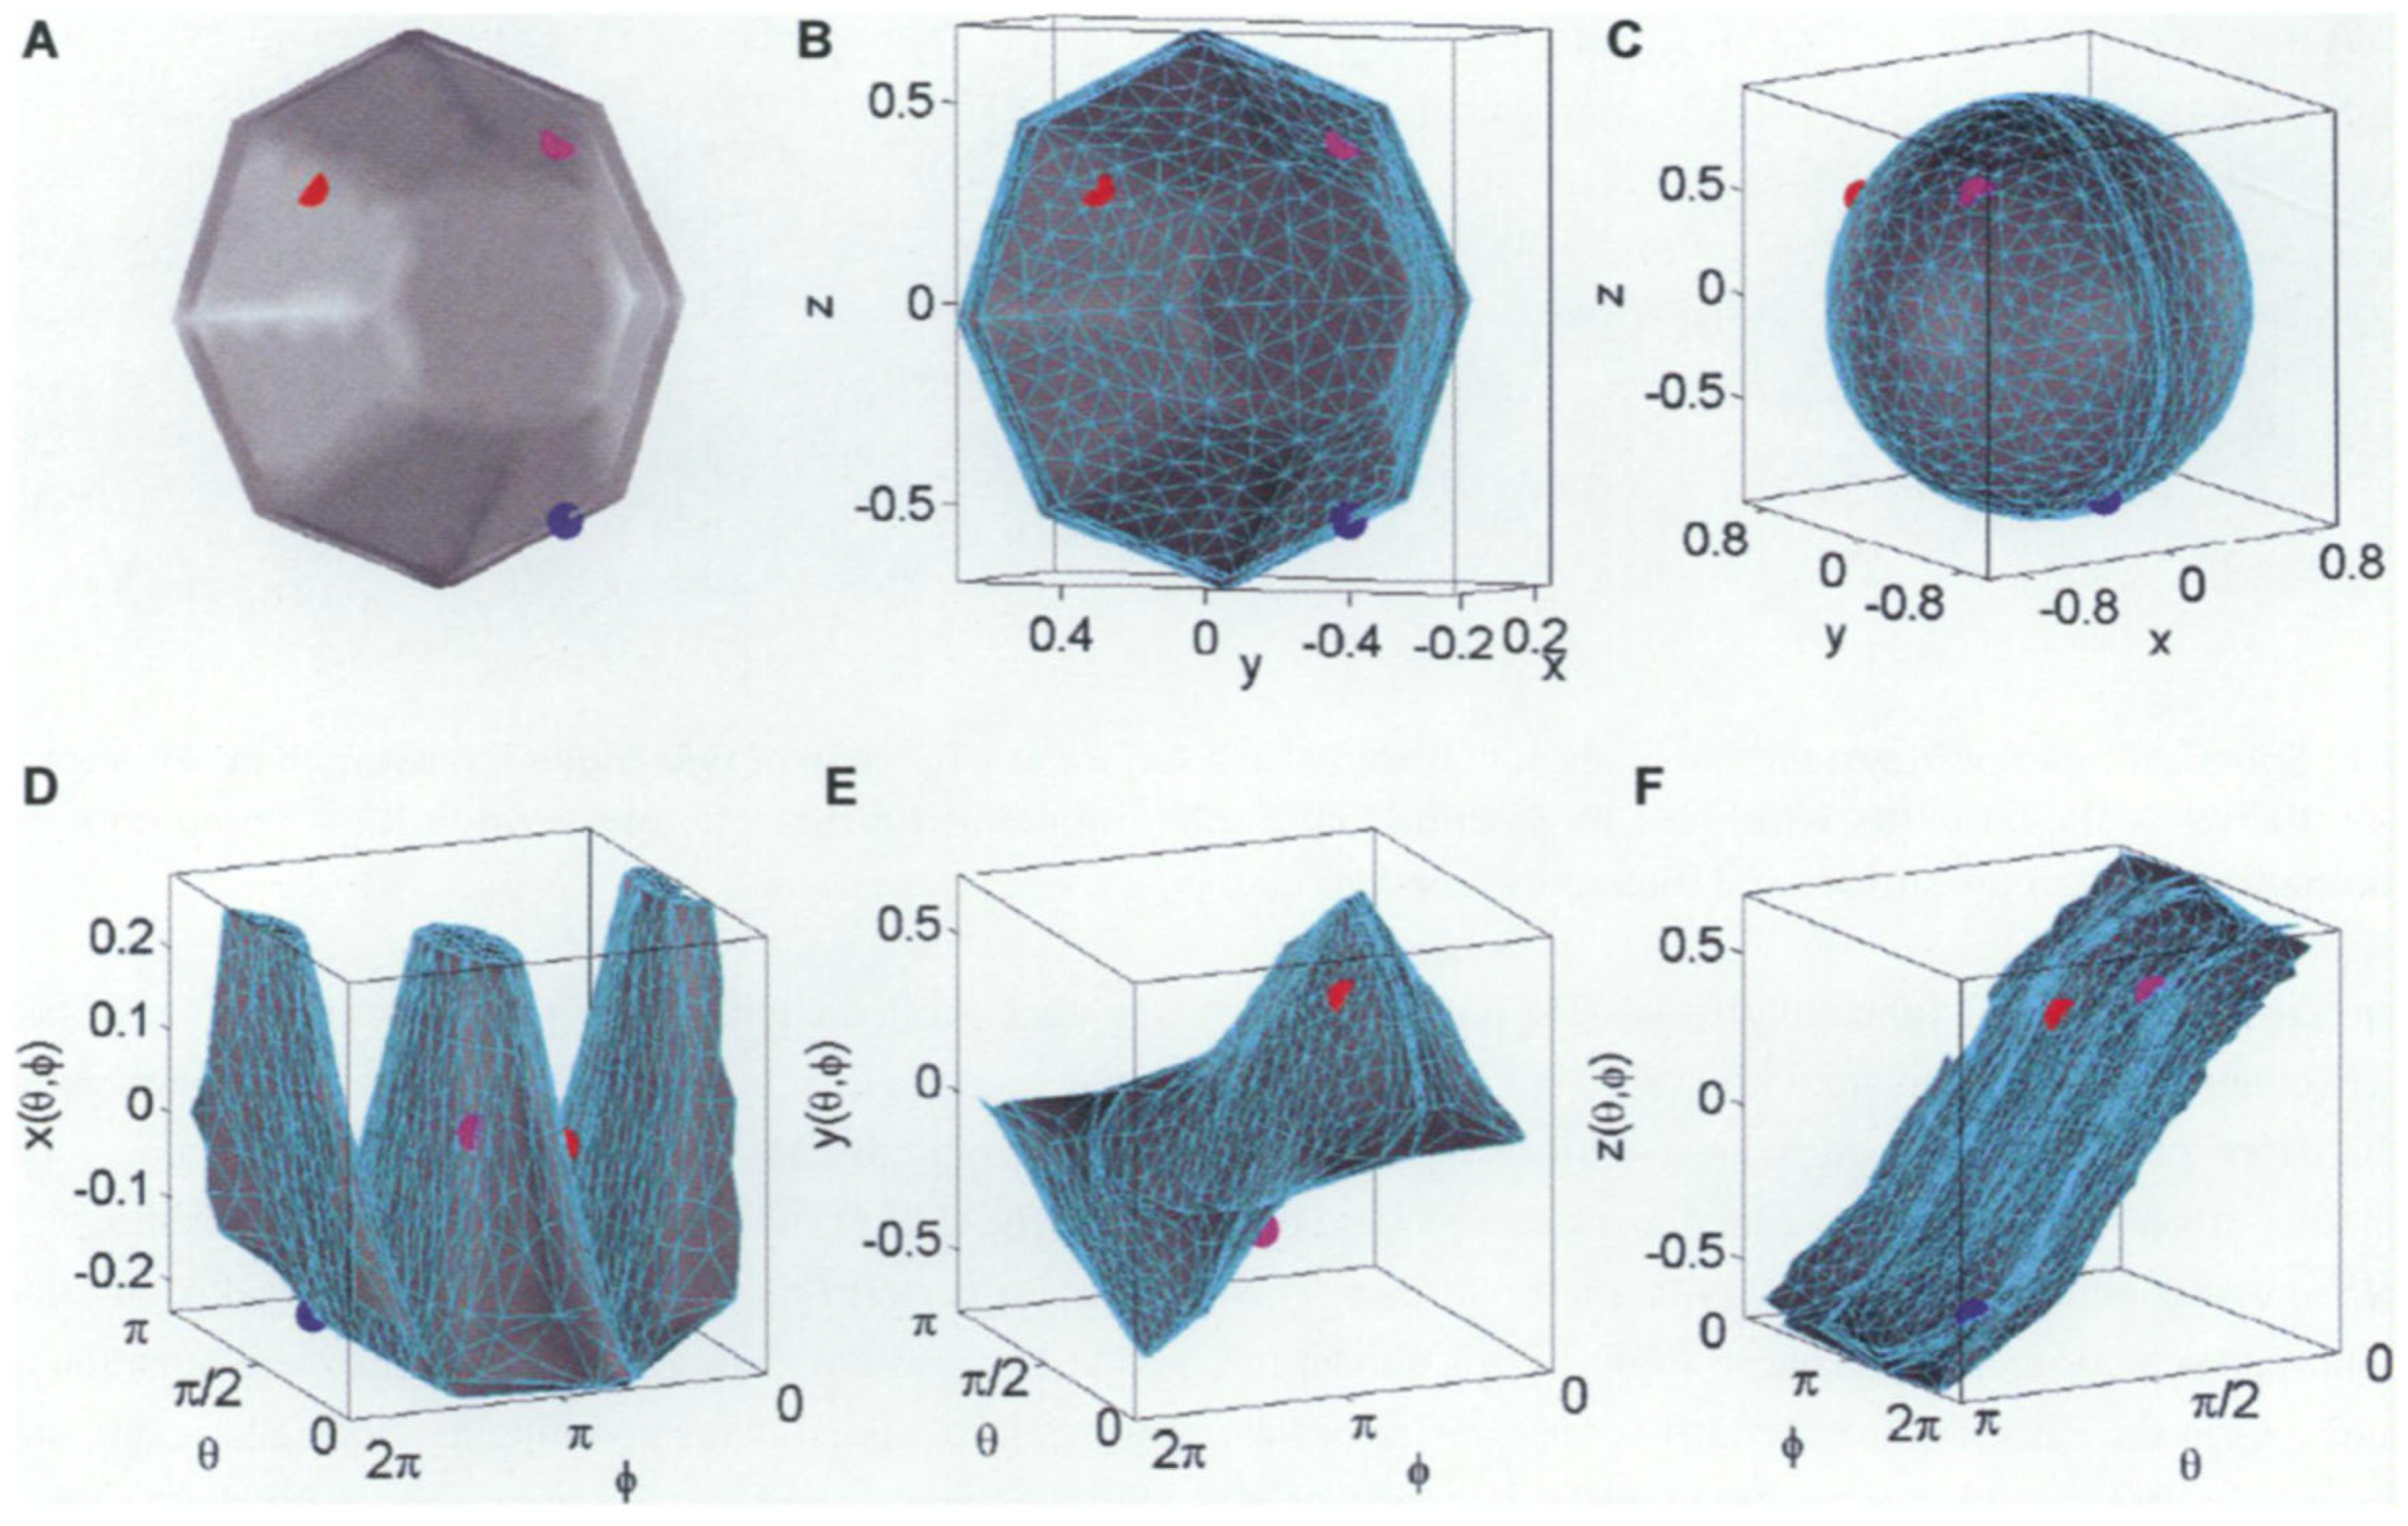
2.3. Two-Dimensional and Three-Dimensional Extraction of Shape Information

Elliptic Fourier analysis [66,67] was performed on the outlines of each otolith in order to analyse them in 2D. Momocs R-package version 1.3.2 [68] was used to compute all the elliptic Fourier descriptors (EFDs) from the otolith contours. To standardize the outlines, a constant number of points was taken with the same distance between the points (n = 200; coefficients may be biased if the number of points per contour is different). Each contour was described by the signals given by the parametric functions x(Ө) and y(Ө) [68], passing through all points from the same starting point of the otolith (on the rostrum). For each otolith, the first 99 elliptical Fourier harmonics (H) were extracted, normalized to the first harmonic, and made invariant to otolith size, rotation, and starting point of contour description [66]. The cumulated Fourier Power (F) for each individual otolith was calculated as a measure of the precision of contour reconstruction obtained with n harmonics (i.e., the proportion of variance in contour coordinates accounted for by the nk harmonics) to determine the number of harmonics required to reconstruct the otolith outline:
F ( n k ) = i = 1 n k A i 2 + B i 2 + C i 2 + D i 2 2
where Ai, Bi, Ci, and Di are the coefficients of the Hi harmonic. F(nk) and nk were calculated for each individual otolith k to ensure that the contours were reconstructed with a precision of 99.99% [67]. The maximum number of harmonics, n = max(nk) across all otoliths, was then used to reconstruct the contours of each individual otolith and all the 2D analysis.
To extract the 3D Fourier coefficients, the Spharm analysis with Matlab function was coded in the R language. First, the surface of each mesh was described using three parameterized variables, x(Ө, Փ), y(Ө, Փ), and z(Ө, Փ) [69] (as shown in Figure 3). Next, each mesh was mapped onto a reference unit sphere using the CALD spherical parameterization algorithm [70]. In order to make the surfaces homologous between otoliths, the meshes were registered using six landmarks. A global average shape for each side (left or right) was calculated iteratively, and all individuals were aligned to this reference shape. Finally, the spherical Fourier coefficients were calculated from the otoliths mapped onto a sphere and aligned using the six homogenous points. The standardization process for all of these methods involved using 502 vertices per otolith, with 1000 triangles with 325 decimations, 11 harmonics (or degree), and 4 icosahedral subdivisions.

2.4. Statistical Analysis
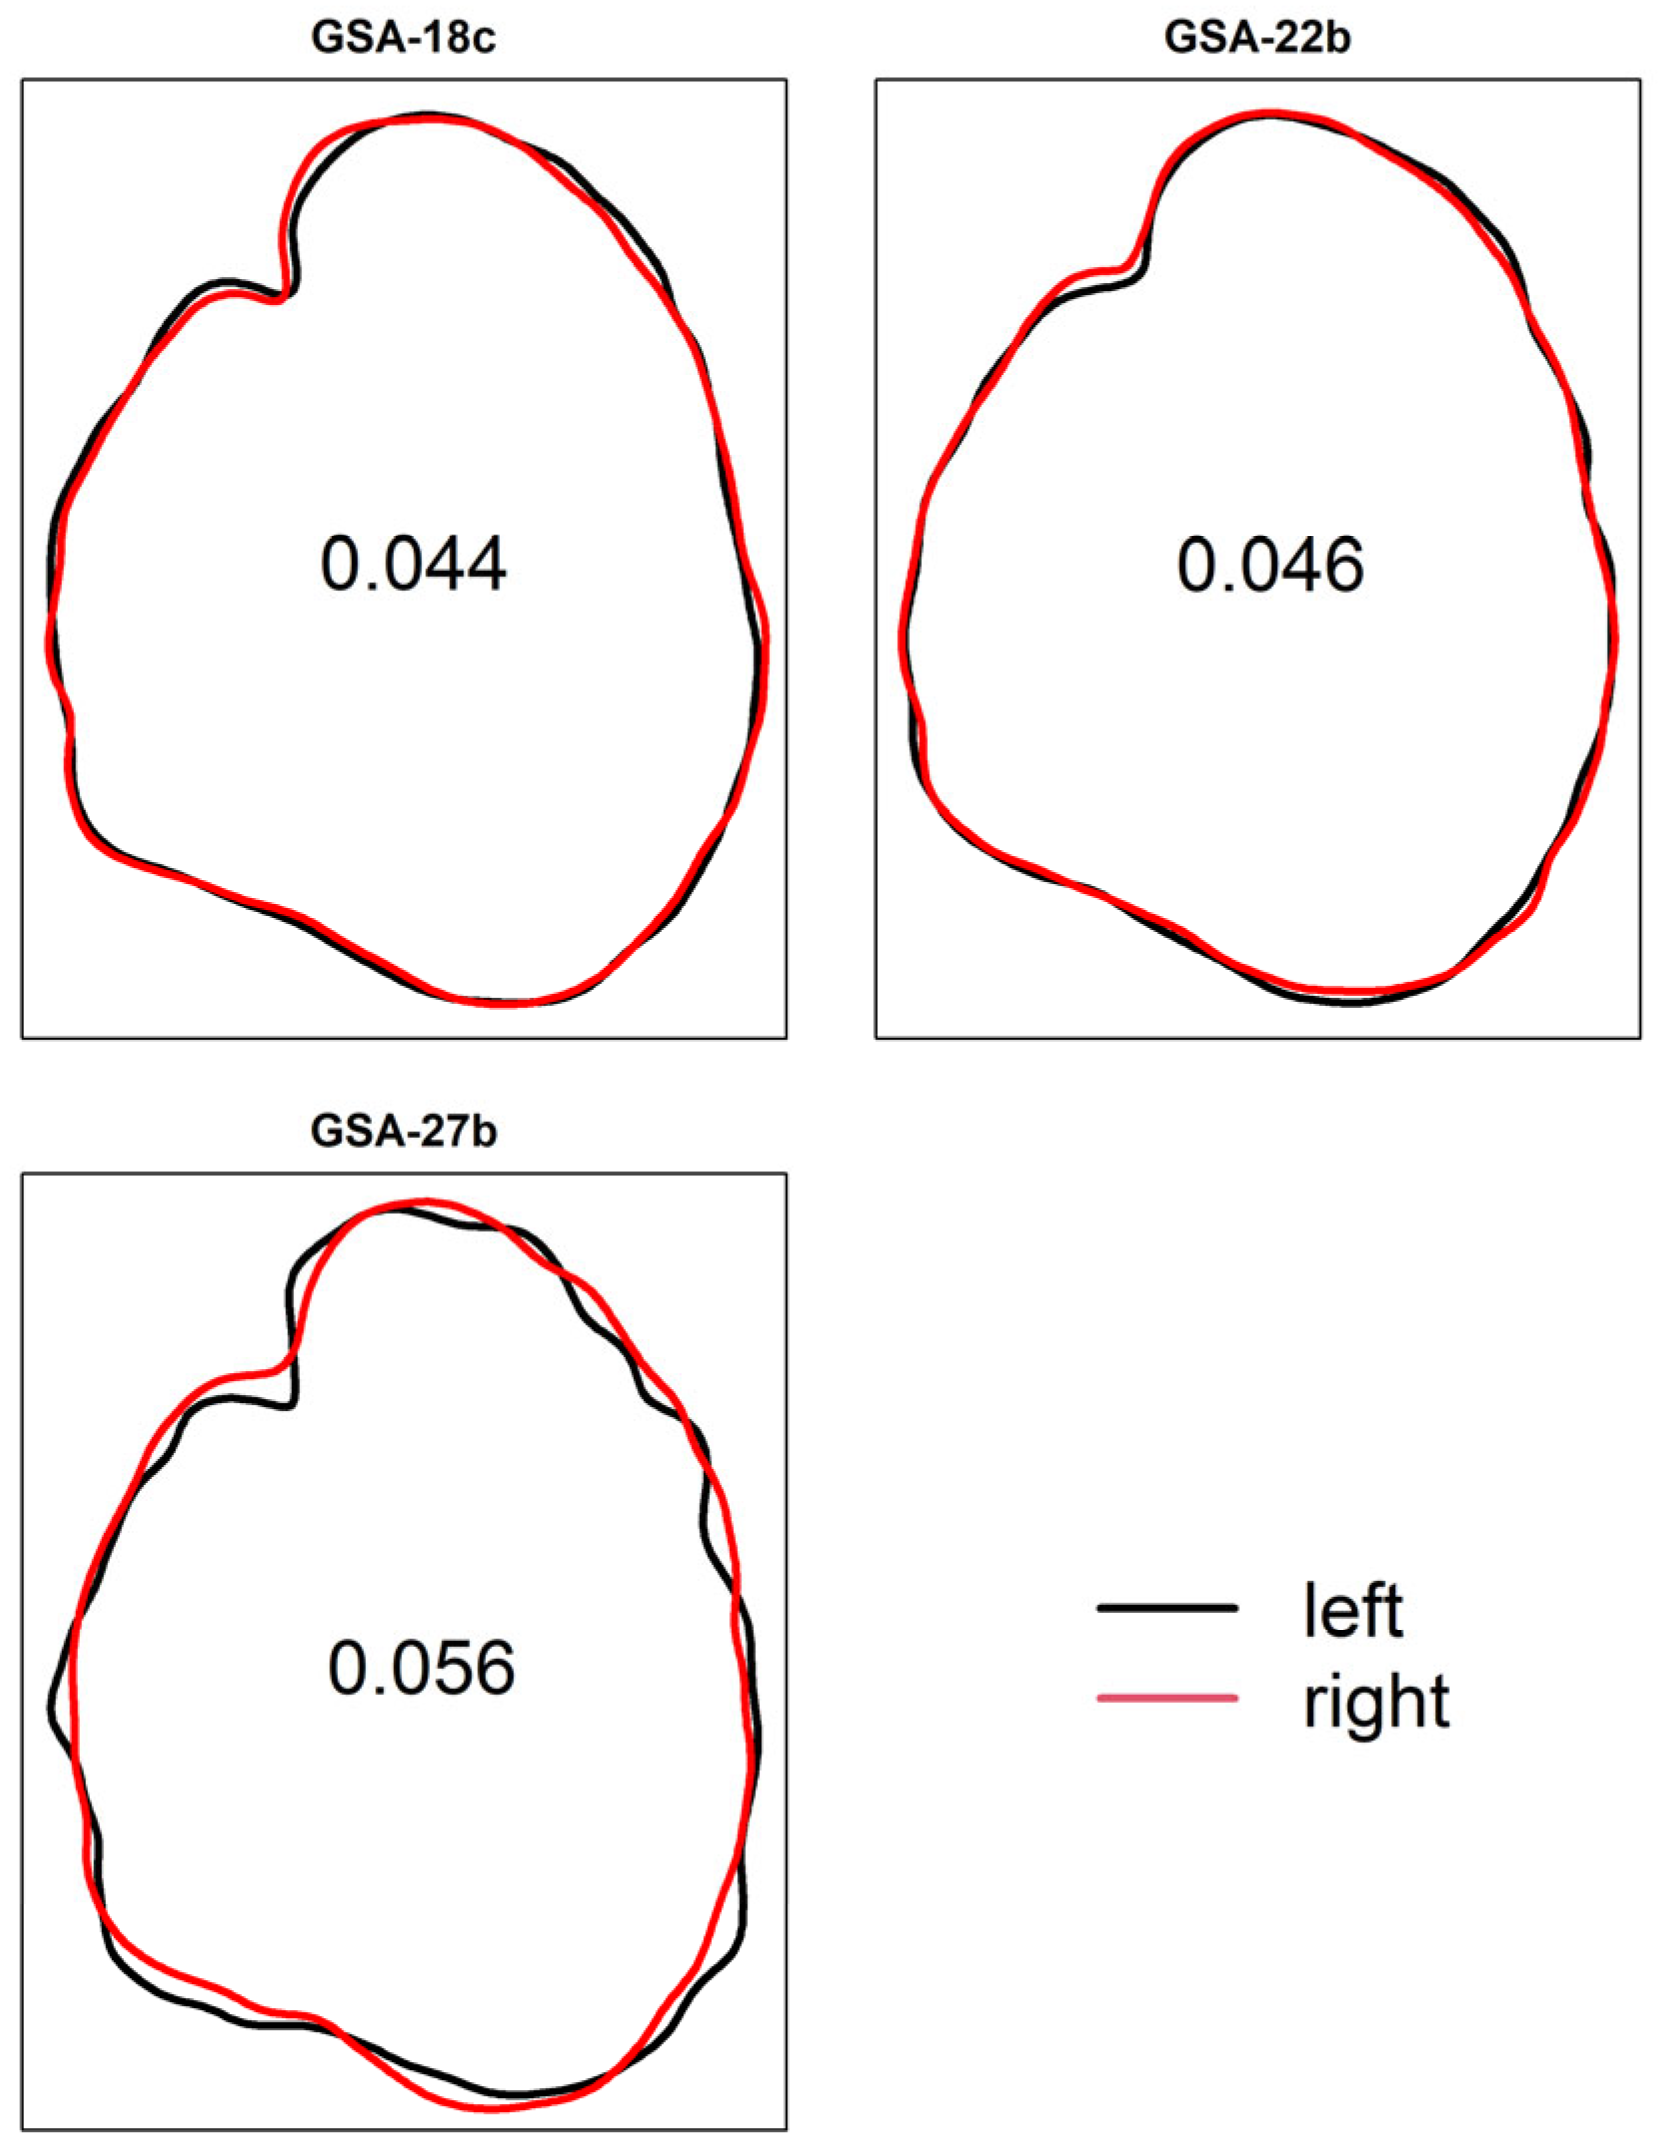
The Euclidean distance (Ed) [68] was calculated on both the 2D and 3D EFDs to measure the difference in otolith shape between the left and right inner ear of each individual:
E d = i = 1 n ( l e f t . s i g n a l i r i g h t . s i g n a l i ) 2
where n is the number of signals, the distance between each left and right otolith signal was calculated. An average of these distances was then calculated per geographical location (GSA).
Two steps were processed in order to analyse how 2D or 3D otolith shapes depend on inner ear side or fish location. Firstly, Principal Components Analysis (PCA) was applied to the EFDs matrix from 2D and 3D images of the otolith [71]. Significant principal components (PCs) were then selected as otolith shape descriptors according to the broken stick model [72]. The method was based on the assumption that the distribution of the variance is random, and the components were selected in order of their contribution to the total variance [72]. The significant PCs are those that exceed the expected value of the variance based on the random distribution. This procedure allowed decreasing of the number of variables used to describe otolith shape variability while ensuring that the main sources of shape variation were kept, and to avoid co-linearity between shape descriptors [71]. This technique allows the main sources of variation in shape to be retained.
Secondly, a multivariate mixed-effects model was used to test the inner ear side (SI) and geographical zone (GSA) effects on the shape of the otolith in 2D and 3D analysis (O, i.e., the matrix of selected PCs):
O ~ α 0 + α 1 S I + α 2 G S A + α 3 S I . G S A
where side effect (SI) and geographical effect (GSA) and their interactions were considered fixed effects (only the slope has been tested, not the origin), while individual was considered a random effect on the slope. The analysis of variance (ANOVA) was performed using the mixed-effects model and generates a statistical test known as “Chi-square” (or χ2). This statistic measures the difference between the estimated variance of the random effects of the model and the residual variance (or error). A pairwise test was performed on the geographical location to determine if there were any shape differences between each GSAs. Statistical analyses were performed using the following packages in the statistical environment R [40]: ‘abind’ [73], ‘car’ [74], ‘digit3DLand’ [64], ‘effects’ [75], ‘ggplot2’ [76], ‘lme4’ [77], ‘Matrix’ [78], ‘Momocs’ [68], ‘nlme’ [79,80], ‘pracma’ [81], ‘rgeos’ [82], ‘rgl’ [83], ‘Rvcg’ [84], ‘sp’ [85], ‘vegan’ [86].

3. Results

The acquisition of 2D images took about two minutes per otolith, while the acquisition time was about 11 min per otolith for 3D images. In addition, image analysis time was two minutes and four minutes per otolith for 2D and 3D images, respectively. However, it should be taken into account that these calculation times depend on the performance of the 3D scan device and computer used.
The first 33 harmonics were used in 2D images on EFDs analysis, and 11 harmonics in 3D images. After performing PCA on the EFDs mentioned earlier, the broken-stick model was used to select 24 and 15 PCs in 2D and 3D, respectively. This approach helped to retain the main sources of variation in shape by reducing the number of variables used. In 2D analysis, 24 PCs explained 72% of the total variance of the otolith shape, whereas in the 3D EFDs, 15 PCs explained 68% of the variance.
Table 1 showed the results of the multivariate mixed-effects models from 2D and 3D analysis.
The model showed that there was no significant effect of inner ear side (left/right, SI) on the otolith shape in 2D (χ2 = 27.216, p-value = 0.290 with Anova). Two-dimensional analysis showed a significant geographical effect (i.e., GSA) on the otolith shape. For 2D otolith shape, the side effect increased from the central area to the eastern part of the Mediterranean Sea (Figure 4). The difference in shape between the left and right inner ear otoliths was relatively consistent for the red mullets located in the west (18c) and centre (22b), while the specimens in the eastern GSA (27b) exhibited a greater difference than those in the other two sub-areas (Figure 4). The pairwise test showed that all geographical locations had a significant difference between them (p-value < 0.001 for all with Anova). However, there was no significant interaction of side (SI) with sub-areas (GSA) on the shape of the otolith in 2D analysis (χ2 = 66.359, p-value = 0.087 with Anova).
The model for the 3D analysis of the shape showed that the side effect (SI) had a significant effect on the shape (χ2 = 42.967, p-value < 0.001 with Anova). The results from the 3D analysis also indicated a notable influence of geographic location on the shape of the otolith (χ2 = 83.682, p-value < 0.001 with Anova). There was a significant interaction between the inner ear side (SI) and the geographical location (GSA) on otolith shape (χ2 = 67.176, p-value < 0.001 with Anova). This interaction was observed through both the Euclidean distance visualization (Figure 5) and the pairwise comparison tests. Specifically, the comparison between the left and right inner ear otolith shapes indicated a similar value for the western (18c) and central (22b) sub-areas, while the eastern geographical location (27b) exhibited a smaller difference compared to the other sub-areas (Figure 5). This trend was also confirmed by the pairwise test, as the western and central geographical locations showed no significant difference (χ2 = 24.457, p-value = 0.067 with Anova), while the eastern sub-area exhibited significant differences compared to the other two sub-areas (p-value < 0.001 for both with Anova).

4. Discussion

Various techniques have been developed to discriminate stocks, including genetic analysis, analysis of biological markers, and otolith shape analysis (e.g., [6,87,88,89,90,91]). Otolith shape is species-specific [35] and can indicate intra-specific [36] geographic differences, making it a commonly used tool for delimiting stocks. However, to date, otolith shape has only been extracted from 2D images, which do not take into account the whole shape. Multivariate approaches, such as Fourier, wavelet transform, and geometric morphometric analysis, are commonly used to investigate otolith outlines [14,92,93,94,95]. In this study, EFDs computed from 2D outlines and Spherical EFDs computed from 3D meshes were used to compare otolith shape, because this is an efficient method for describing the variation in the shape contours [96] without bias from the information extraction. For 3D shape analysis, other methods are often used with landmarks, but for the sagittal otolith, the Spherical EFDs were found to be relevant for extracting shape information from a closed 3D object.
Only nine otolith studies have been identified to date using 3D data, and these studies have only been conducted since 2014. Most of these studies have all focussed on otolith scanning methods [48,49,50,51,52]. The present study continues in this direction, analysing the signals from these 3D scans. Other 3D imaging studies have focused on the role of the otolith within the fish, including hearing [53,55,56] and the roles and evolution of the otolith throughout the life of the fish to better understand the ontogenetic effect [54]. To date, however, no 3D studies have investigated the influence of factors that control the shape of the otolith. In this paper, the EFD database from 2D and 3D otolith shapes was used to test the effect of inner ear side (left/right) and the stock structure within the red mullet in the Mediterranean Sea. This first approach, using only three geographical locations to discriminate the stock units, aimed to show whether EFDs from 3D images can be used as a tool to identify stock units in the same way as EFDs from 2D images. This study showed that these spherical EFDs from 3D data can be an efficient method to discriminate fish stocks. The geographical effect on the 2D and 3D approaches showed similar results, with significant differences among these three GSAs from the Adriatic Sea to the Levantine Sea. However, while the 2D analysis revealed significant differences between all sub-areas (GSAs), the 3D analysis indicated that GSAs 18c and 22b were similar to each other, but different from GSA 27b. This finding was also supported by visualizing the Euclidean distance between the left and right inner ear otolith shapes in both 2D and 3D analysis. Specifically, red mullets from GSAs 18c and 22b exhibited small differences in otolith shape between the left and right inner ears, while those from GSA 27b showed significant differences compared to the other two GSAs. This suggests that the 3D analysis retained more information than the 2D analysis. Visually and using simple Euclidean distance calculations in either 2D or 3D, GSA 27b stood out from the other two GSAs (18c and 22b). However, the 2D model failed to demonstrate this division through shape analysis of the otolith. The previous study on the EFDs corroborated this same division of red mullet in Mediterranean Sea, which identified several differences in otolith shape linked to the sampled geographical areas (Gulf of Lions, Aegean Sea and Black Sea [97]). Moreover, a recent study on the European hake (Merluccius merluccius Linnaeus, 1758) identified the same boundary of two stock units (i.e., Central Mediterranean Sea and Eastern Mediterranean Sea) that separated the Adriatic Sea (GSA 18c and 22b in this study) and the Eastern Mediterranean Sea (GSA 27b in this study) [21]. Analyses of the stock structure of red mullet could be expanded in the future by adding other geographical areas to these three GSAs.
The side effect (i.e., the difference in shape between the left and right otoliths of an individual fish) was tested, and the results of this study showed that this factor is significant for the 3D otolith shape, while it was not found to be significant for the 2D otolith shape. This result suggests that the accuracy of the 2D outline was not sufficient to detect the differences observed in the whole otolith shape (i.e., 3D otolith shape). The 2D image is just one projection plane of the 3D image (i.e., with a 3D image, multiple 2D images can be generated from different projections). While a difference in shape was noticed between the left and right inner ear otoliths in this projection, Figure 5 (in the results section) showed that differences can be found throughout the whole otolith, not just at the edge as seen in 2D projection plane (as shown in Figure 4 in the results section). In fact, the most significant differences were found in parts of the otolith that cannot be illustrated in 2D projections. This is the first study combining 2D and 3D otolith shapes, and so this result should be tested for other species for which the 2D data show no asymmetry. Additionally, the spherical EFDs analysis showed that the interaction between geographical and inner ear side effects was significant. Consequently, the difference between the shapes of the left and right otoliths observed in 3D space could significantly change the stock structure, as observed in the 2D analysis of bogue in the Mediterranean Sea [60]. Generally, for roundfish, left and right otolith shapes are symmetrical in 2D space (i.e., no significant side effect, [44,57,94,98,99,100]). In roundfish, it is therefore expected that no asymmetry is the norm and is maintained through homeostatic processes [101]. Asymmetry is often linked to stress and/or variations in the environment, and is viewed as a marker of developmental instability [102,103]. For red mullet, otoliths do not show asymmetry from 2D analysis [57] as corroborated by this work from 2D data. This same study of the otolith shape from 3D data showed a significant asymmetry between left and right otoliths in this species. Consequently, it is possible that this new 3D approach may show that many species are ultimately asymmetrical, and that this asymmetry has been underestimated by the 2D approach.
The significant effect of the inner ear side that was found using 3D analysis, but not 2D, could lead to inaccurate stock unit identification (i.e., significant interaction between geographical and side effect). As bogue in the Mediterranean Sea and common sole (Solea solea Linnaeus, 1758) in the eastern English Channel and the southern North Sea showed potential boundary separation according to the mean level of bilateral asymmetry in 2D analysis [104], this approach could be developed from 3D data with greater accuracy than previously obtained by 2D images. It is currently unclear whether the variation in directional asymmetry of otolith shape across geographical locations is due to adaptive or passive phenotypic plasticity, or adaptive or neutral genetic differentiation. This study has revealed that there is a greater difference between left and right otolith shapes in sub GSA 27b, which is located in the east of the Mediterranean in the Levantine basin. This difference in shape was also observed in the European hake in the same area [21]. This could indicate that the European hake and red mullet are particularly affected by environmental or other factors that are driving this difference in shape. Otolith shape asymmetry, whether it is fluctuating or directional, can lead to dysfunction of the vestibular sensing system [105]. It can also impact the fish’s ability to process sound and self-orient [106], and influence its swimming patterns [105,107,108]. Currently, however, there is currently no known advantage to otolith asymmetry, which suggests that it may be non-adaptive, regardless of its origin (plastic or genetic).
In addition to providing more detailed and accurate information about the shape and structure of otoliths, the use of 3D imaging and analysis can also have important implications for stock identification. Furthermore, 3D analysis can also be used to investigate the surface texture and microstructure of the otolith, which can provide additional information about the fish stock of origin. This extra information can be used to identify different stocks of fish that may have similar otolith shape but different surface texture and microstructure. The analysis of the shape of the otolith from a 2D image represents only the outline of the otolith on a single projection plane, while 3D images have several projection planes. The sulcus acusticus (cavity on the inner side of the otolith, which connects the otolith to the sensorial macula, [109]) cannot be described in a 2D image, whereas it can with 3D analysis. The projection described by Gonçalves et al. [110] was mainly used in 2D shape analysis to identify stocks, but it cannot be used to analyse the sulcus acusticus. Previous studies have attempted to examine the size and shape of this part of the otolith using 2D shape analysis [111,112,113]. However, these approaches have limitations, as they do not take into account the depth of this structure. In contrast, 3D analysis provides a more comprehensive view of the sulcus acusticus by enabling the extraction of both depth and volume measurements. This additional information can provide a more complete characterization of otolith shape, which can in turn aid in distinguishing between different fish species or populations. All other shape microstructures, either on the inner or outer side of the otolith, can be analysed with 3D images. Not all shape microstructures may be important for all cases, however, and the added complexity of 3D imaging and analysis may not be necessary depending on the research question.
It is important to note the difference in processing time between 2D and 3D imaging and analysis, with 3D taking longer than 2D, which may be a factor to consider in choosing the best method of shape analysis. This study has shown that 3D analysis provides more detail on the shape of the otolith because the results differ between the average shape for each analysis. It should also be noted that the method used (i.e., spherical EFDs) has errors in 3D, especially for unclosed meshes [69]. These images could not be processed because they cannot be mapped onto a sphere, hence why the number of samples for each GSA is different.
The 3D analysis of sagittal otoliths provides a new dimension to the shape analysis method, but still remains to be optimised (time-consuming, issues with otoliths with holes or non-manifolds). From this study, however, stock delimitation for the red mullet is possible by using the effect of 3D otolith asymmetry between inner ear sides, and could be further improved by adding more geographical locations to test the variability within and between stock units. To further improve the accuracy and precision of stock identification, multiple methods of analysis should be incorporated with 3D analysis, such as genetic analysis, otolith microchemistry, and stable isotope analysis. Several studies [14,21] have used 2D analysis and have reported successful results using this approach. Additionally, incorporating environmental data such as temperature, salinity, and dissolved oxygen levels can provide a better understanding of the environmental factors that may influence the distribution and migration patterns of fish stocks. It is also recommended to analyse otoliths from different life stages of fish, including larvae and juveniles, in addition to adults, to gain a more comprehensive understanding of stock structure and dynamics. Lastly, it is important to collect and analyse a large number of otolith samples from different locations and time periods to increase the statistical power of the analysis and reduce the potential for bias. By incorporating these suggestions, the accuracy and precision of stock identification can be improved, which can ultimately lead to better fisheries management and conservation efforts.

Supplementary Materials

The following supporting information can be downloaded at: https://www.mdpi.com/article/10.3390/sym15051067/s1, Table S1: Scan parameters on the µCT Skyscan 1174 (Bruker).

Author Contributions

N.A., É.P.C., S.C. and K.M. designed the research; N.A., L.P. and C.L.-T. realized the sampling; N.A., É.P.C., S.C., R.L. and K.M. organized the image analysis; N.A., É.P.C., S.C., R.L., C.L.-T. and K.M. performed the statistical analysis. N.A. wrote the paper, and all authors provided critical comments and were involved in the writing of the manuscript. All authors have read and agreed to the published version of the manuscript.

Funding

This work has benefited from the grant “ANR-21-EXES-00 11” as part of the IFSEA graduate school (which originates from National Research Agency under the Investments for the Future program), the French Federative Research Structure (SFR Campus de la mer, project No. 2022.7) and the Specific Contract No. 03_EASME/EMFF/2017/1.3.2.3/01/SI2.793201 (MED_UNITs) financed by the European Union. This work was also supported by the Institut Français de Recherche et d’Exploitation de la Mer and the ULCO University (doctoral support to N. ANDRIALOVANIRINA, 2021–2024). This work is a contribution to the e-Col+ project funded by the Programme d’Investissements d’Avenir (ANR 21 ESRE 0053).

Data Availability Statement

The data presented in this study are available upon request from the corresponding author.

Acknowledgments

The authors thank all scientists who carried out the samples. The authors would especially like to thank Kirsteen MacKenzie for valuable help in editing this manuscript. The authors warmly thank the GISMO platform and its staf (Biogéosciences, University Bourgogne Franche-Comté, UMR CNRS 6282, France), which manages and maintains the analytical equipment used in this study.

Conflicts of Interest

The authors declare no conflict of interest.

References

  1. FAO. The State of World Fisheries and Aquaculture 2020; Sustainability in Action; FAO: Rome, Italy, 2020; ISBN 978-92-5-132755-5. [Google Scholar]
  2. Wagner, G.P.; Booth, G.; Bagheri-Chaichian, H. A Population Genetic Theory of Canalization. Evolution 1997, 51, 329–347. [Google Scholar] [CrossRef] [PubMed]
  3. Cadrin, S.X. Defining Spatial Structure for Fishery Stock Assessment. Fish. Res. 2020, 221, 105397. [Google Scholar] [CrossRef]
  4. Cadrin, S.X.; Maunder, M.N.; Punt, A.E. Spatial Structure: Theory, Estimation and Application in Stock “Assessment Models”. Fish. Res. 2020, 229, 105608. [Google Scholar] [CrossRef]
  5. Biseau, A. Diagnostic 2021 sur les Ressources Halieutiques Débarquées par la Pêche Française (Métropolitaine); “Ifremer Ref. RBE/EDERU/RS/2022/1 2022”; Ifremer: Brest, France, 2022; 40p. [Google Scholar]
  6. Cadrin, S.; Kerr, L.; Mariani, S. Stock Identification Methods: Applications in Fishery Science, 2nd ed.; Elsevier Academic Press: Cambridge, MA, USA, 2014; ISBN 978-0-12-397258-3. [Google Scholar]
  7. Avigliano, E.; Maichak de Carvalho, B.; Leisen, M.; Romero, R.; Velasco, G.; Vianna, M.; Barra, F.; Volpedo, A.V. Otolith Edge Fingerprints as Approach for Stock Identification of Genidens barbus. Estuar. Coast. Shelf Sci. 2017, 194, 92–96. [Google Scholar] [CrossRef]
  8. Mahé, K. Sources de Variation de La Forme Des Otolithes: Implications Pour La Discrimination Des Stocks de Poissons. Ph.D. Thesis, Université du Littoral Côte d’Opale, Dunkirk, France, 2019. [Google Scholar]
  9. Begg, G.A.; Waldman, J.R. An Holistic Approach to Fish Stock Identification. Fish. Res. 1999, 43, 35–44. [Google Scholar] [CrossRef]
  10. Berg, F.; Østgaard, H.D.; Slotte, A.; Andersson, L.; Folkvord, A. A Combination of Genetic and Phenotypic Characterization of Spring- and Autumn-Spawning Herring Suggests Gene Flow between Populations. ICES J. Mar. Sci. 2021, 78, 694–703. [Google Scholar] [CrossRef]
  11. Sherman, K.; Sissenwine, M.; Christensen, V.; Duda, A.; Hempel, G.; Ibe, C.; Levin, S.; Lluch-Belda, D.; Matishov, G.; McGlade, J.; et al. A Global Movement toward an Ecosystem Approach to Management of Marine Resources. Mar. Ecol. Prog. Ser. 2005, 300, 275–279. [Google Scholar] [CrossRef]
  12. Spalding, M.D.; Fox, H.E.; Allen, G.R.; Davidson, N.; Ferdaña, Z.A.; Finlayson, M.; Halpern, B.S.; Jorge, M.A.; Lombana, A.; Lourie, S.A.; et al. Marine Ecoregions of the World: A Bioregionalization of Coastal and Shelf Areas. BioScience 2007, 57, 573–583. [Google Scholar] [CrossRef]
  13. Palomares, M.L.D.; Froese, R.; Derrick, B.; Meeuwig, J.J.; Nöel, S.-L.; Tsui, G.; Woroniak, J.; Zeller, D.; Pauly, D. Fishery Biomass Trends of Exploited Fish Populations in Marine Ecoregions, Climatic Zones and Ocean Basins. Estuar. Coast. Shelf Sci. 2020, 243, 106896. [Google Scholar] [CrossRef]
  14. ICES. Stock Identification Methods Working Group (SIMWG). ICES Sci. Rep. 2022, 4, 66. [Google Scholar] [CrossRef]
  15. Cruz, T.A.; Thorpe, J.P.; Pullin, R.S.V. Enzyme Electrophoresis in Tilapia zillii: A Pattern for Determining Biochemical Genetic Markers for Use in Tilapia Stock Identification. Aquaculture 1982, 29, 311–329. [Google Scholar] [CrossRef]
  16. Beacham, T.D. Parentage-Based Tagging Combined with Genetic Stock Identification Is a Cost-Effective and Viable Replacement for Coded-Wire Tagging in Large-Scale Assessments of Canadian Salmon Fisheries. Fish. Res. 2021, 239, 105920. [Google Scholar] [CrossRef]
  17. Lester, R.J.G.; MacKenzie, K. The Use and Abuse of Parasites as Stock Markers for Fish. Fish. Res. 2009, 97, 1–2. [Google Scholar] [CrossRef]
  18. Pascual, S.; Abollo, E.; González, A.F. Biobanking and Genetic Markers for Parasites in Fish Stock Studies. Fish. Res. 2016, 173, 214–220. [Google Scholar] [CrossRef]
  19. Vasconcelos, J.; Hermida, M.; Saraiva, A.; González, J.A.; Gordo, L.S. The Use of Parasites as Biological Tags for Stock Identification of Blue Jack Mackerel, Trachurus Picturatus, in the North-Eastern Atlantic. Fish. Res. 2017, 193, 1–6. [Google Scholar] [CrossRef]
  20. Grahl-Nielsen, O. Chapter Twelve—Fatty Acid Profiles as Natural Marks for Stock Identification. In Stock Identification Methods, 2nd ed.; Cadrin, S.X., Kerr, L.A., Mariani, S., Eds.; Academic Press: San Diego, CA, USA, 2014; pp. 235–256. ISBN 978-0-12-397003-9. [Google Scholar]
  21. Morales-Nin, B.; Pérez-Mayol, S.; MacKenzie, K.; Catalán, I.A.; Palmer, M.; Kersaudy, T.; Mahé, K. European Hake (Merluccius merluccius) Stock Structure in the Mediterranean as Assessed by Otolith Shape and Microchemistry. Fish. Res. 2022, 254, 106419. [Google Scholar] [CrossRef]
  22. Wilson, R.R. Depth-Related Changes in Sagitta Morphology in Six Macrourid Fishes of the Pacific and Atlantic Oceans. Copeia 1985, 1985, 1011–1017. [Google Scholar] [CrossRef]
  23. Morales-Nin, B.Y.O. The Influence of Environmental Factors on Microstructure of Otoliths of Three Demersal Fish Species Caught off Namibia. S. Afr. J. Mar. Sci. 1987, 5, 255–262. [Google Scholar] [CrossRef]
  24. Mosegaard, H.; Svedäng, H.; Taberman, K. Uncoupling of Somatic and Otolith Growth Rates in Arctic Char (Salvelinus alpinus) as an Effect of Differences in Temperature Response. Can. J. Fish. Aquat. Sci. 1988, 45, 1514–1524. [Google Scholar] [CrossRef]
  25. Secor, D.H.; Dean, J.M. Somatic Growth Effects on the Otolith–Fish Size Relationship in Young Pond-Reared Striped Bass, Morone saxatilis. Can. J. Fish. Aquat. Sci. 1989, 46, 113–121. [Google Scholar] [CrossRef]
  26. Campana, S.E.; Casselman, J.M. Stock Discrimination Using Otolith Shape Analysis. Can. J. Fish. Aquat. Sci. 1993, 50, 1062–1083. [Google Scholar] [CrossRef]
  27. Begg, G.; Overholtz, W.; Munroe, N. The Use of Internal Otolith Morphometrics for Identification of Haddock (Melanogrammus aeglefinus) Stocks on Georges Bank. Fish. Bull. 2001, 99, 1–14. [Google Scholar]
  28. Lombarte, A.; Lleonart, J. Otolith Size Changes Related with Body Growth, Habitat Depth and Temperature. Environ. Biol. Fishes 1993, 37, 297–306. [Google Scholar] [CrossRef]
  29. Lombarte, A.; Torres, G.J.; Morales-Nin, B. Specific Merluccius otolith growth patterns related to phylogenetics and environmental factors. J. Mar. Biol. Assoc. U.K. 2003, 83, 277–281. [Google Scholar] [CrossRef]
  30. Cardinale, M.; Doering-Arjes, P.; Kastowsky, M.; Mosegaard, H. Effects of Sex, Stock, and Environment on the Shape of Known-Age Atlantic Cod (Gadus morhua) Otoliths. Can. J. Fish. Aquat. Sci. 2004, 61, 158–167. [Google Scholar] [CrossRef]
  31. Vignon, M.; Morat, F. Environmental and Genetic Determinant of Otolith Shape Revealed by a Non-Indigenous Tropical Fish. Mar. Ecol. Prog. Ser. 2010, 411, 231–241. [Google Scholar] [CrossRef]
  32. Vignon, M. Disentangling and Quantifying Sources of Otolith Shape Variation across Multiple Scales Using a New Hierarchical Partitioning Approach. Mar. Ecol. Prog. Ser. 2015, 534, 163–177. [Google Scholar] [CrossRef]
  33. Simoneau, M.; Casselman, J.M.; Fortin, R. Determining the Effect of Negative Allometry (Length/Height Relationship) on Variation in Otolith Shape in Lake Trout (Salvelinus namaycush), Using Fourier-Series Analysis. Can. J. Zool. 2000, 78, 1597–1603. [Google Scholar] [CrossRef]
  34. Monteiro, L.R.; Beneditto, A.P.M.D.; Guillermo, L.H.; Rivera, L.A. Allometric Changes and Shape Differentiation of Sagitta Otoliths in Sciaenid Fishes. Fish. Res. 2005, 74, 288–299. [Google Scholar] [CrossRef]
  35. D’Iglio, C.; Natale, S.; Albano, M.; Savoca, S.; Famulari, S.; Gervasi, C.; Lanteri, G.; Panarello, G.; Spanò, N.; Capillo, G. Otolith Analyses Highlight Morpho-Functional Differences of Three Species of Mullet (Mugilidae) from Transitional Water. Sustainability 2021, 14, 398. [Google Scholar] [CrossRef]
  36. Trojette, M.; Abderraouf, B.F.; Fatnassi, M.; Marsaoui, B.; Mahouachi, N.E.H.; Chalh, D.A.; Jean-pierre, Q.; Trabelsi, M. Stock Discrimination of Two Insular Populations of Diplodus annularis (Actinopterygii: Perciformes: Sparidae) along the Coast of Tunisia by Analysis of Otolith Shape. Acta Ichthyol. Piscat. 2015, 45, 363–372. [Google Scholar] [CrossRef]
  37. Casselman, J.M. Determination of Age and Growth. In The Biology of Fish Growth; Weatherley, A.H., Gill, H.S., Eds.; Academic Press: New York, NY, USA, 1987; pp. 209–242. [Google Scholar]
  38. Reibisch, J. Ueber die Eizahl bei Pleuronectes Platessa und die Altersbestimmung Dieser Form Aus den Otolithen. Nebst Bemerkung zu Vorstehender Arbeit von Dr. V. Hensen; Wiss. Meeresunt: Kiel, Germany, 1899; pp. 233–248. [Google Scholar]
  39. Campana, S.E.; Neilson, J.D. Microstructure of Fish Otoliths. Can. J. Fish. Aquat. Sci. 1985, 42, 1014–1032. [Google Scholar] [CrossRef]
  40. R Foundation for Statistical Computing. R Core Team R: A Language and Environment for Statistical Computing; R Foundation for Statistical Computing: Vienna, Austria, 2022; Available online: https://www.R-project.org (accessed on 10 May 2022).
  41. Bird, J.L.; Eppler, D.T.; Checkley, D.M., Jr. Comparisons of Herring Otoliths Using Fourier Series Shape Analysis. Can. J. Fish. Aquat. Sci. 1986, 43, 1228–1234. [Google Scholar] [CrossRef]
  42. Pawson, M.G. Using Otolith Weight to Age Fish. J. Fish Biol. 1990, 36, 521–531. [Google Scholar] [CrossRef]
  43. Worthington, D.O.; Doherty, P.J.; Fowler, A.J. Variation in the Relationship between Otolith Weight and Age: Implications for the Estimation of Age of Two Tropical Damselfish (Pomacentrus moluccensis and P. wardi). Can. J. Fish. Aquat. Sci. 1995, 52, 233–242. [Google Scholar] [CrossRef]
  44. Cardinale, M.; Arrhenius, F. Using Otolith Weight to Estimate the Age of Haddock (Melanogrammus aeglefinus): A Tree Model Application. J. Appl. Ichthyol. 2004, 20, 470–475. [Google Scholar] [CrossRef]
  45. Francis, R.I.C.C.; Harley, S.J.; Campana, S.E.; Doering-Arjes, P.; Francis, R.I.C.C.; Harley, S.J.; Campana, S.E.; Doering-Arjes, P. Use of Otolith Weight in Length-Mediated Estimation of Proportions at Age. Mar. Freshw. Res. 2005, 56, 735–743. [Google Scholar] [CrossRef]
  46. Sadighzadeh, Z.; Valinassab, T.; Vosugi, G.; Motallebi, A.A.; Fatemi, M.R.; Lombarte, A.; Tuset, V.M. Use of Otolith Shape for Stock Identification of John’s Snapper, Lutjanus johnii (Pisces: Lutjanidae), from the Persian Gulf and the Oman Sea. Fish. Res. 2014, 155, 59–63. [Google Scholar] [CrossRef]
  47. Dos Santos, J.B.Q.; Chiessi, C.M.; Crivellari, S.; de Vasconcelos Filho, J.E.; Pereira, N.S.; Freitas, M.O.; Ferreira, B.P. Identification of Western South Atlantic Stocks of the Lane Snapper (Lutjanus synagris) from an Otolith Based Multi-Proxy Approach. Fish. Res. 2022, 253, 106356. [Google Scholar] [CrossRef]
  48. Zitek, A.; Mayrhofer, B.; Oehm, J.; Irrgeher, J.; Prohaska, T. Affordable 3D Scanning of Small Otoliths for Improved Shape Analysis by Photogrammetry Techniques. In Proceedings of the 5th International Otolith Symposium 2014, Mallorca, Spain, 22 October 2014. [Google Scholar]
  49. Mapp, J.J.I.; Fisher, M.H.; Atwood, R.C.; Bell, G.D.; Greco, M.K.; Songer, S.; Hunter, E. Three-Dimensional Rendering of Otolith Growth Using Phase Contrast Synchrotron Tomography. J. Fish Biol. 2016, 88, 2075–2080. [Google Scholar] [CrossRef]
  50. Marti-Puig, P.; Danés, J.; Manjabacas, A.; Lombarte, A. New Parameterisation Method for Three-Dimensional Otolith Surface Images. Mar. Freshw. Res. 2016, 67, 1059. [Google Scholar] [CrossRef]
  51. Vasconcelos-Filho, J.E.; Thomsen, F.S.L.; Stosic, B.; Antonino, A.C.D.; Duarte, D.A.; Heck, R.J.; Lessa, R.P.T.; Santana, F.M.; Ferreira, B.P.; Duarte-Neto, P.J. Peeling the Otolith of Fish: Optimal Parameterization for Micro-CT Scanning. Front. Mar. Sci. 2019, 6, 728. [Google Scholar] [CrossRef]
  52. Quindazzi, M.J.; Summers, A.P.; Juanes, F. Efficiency Is Doing Things Right: High-Throughput, Automated, 3D Methods in the Modern Era of Otolith Morphometrics. Can. J. Fish. Aquat. Sci. 2022, 79, 7. [Google Scholar] [CrossRef]
  53. Schulz-Mirbach, T.; Olbinado, M.; Rack, A.; Mittone, A.; Bravin, A.; Melzer, R.R.; Ladich, F.; Heß, M. In-Situ Visualization of Sound-Induced Otolith Motion Using Hard X-Ray Phase Contrast Imaging. Sci. Rep. 2018, 8, 3121. [Google Scholar] [CrossRef]
  54. Schulz-Mirbach, T.; Ladich, F.; Plath, M.; Heß, M. Enigmatic Ear Stones: What We Know about the Functional Role and Evolution of Fish Otoliths. Biol. Rev. 2019, 94, 457–482. [Google Scholar] [CrossRef]
  55. Schulz-Mirbach, T.; Ladich, F.; Mittone, A.; Olbinado, M.; Bravin, A.; Maiditsch, I.P.; Melzer, R.R.; Krysl, P.; Heß, M. Auditory Chain Reaction: Effects of Sound Pressure and Particle Motion on Auditory Structures in Fishes. PLoS ONE 2020, 15, e0230578. [Google Scholar] [CrossRef]
  56. Wei, C.; McCauley, R.D. Numerical Modeling of the Impacts of Acoustic Stimulus on Fish Otoliths from Two Directions. J. Acoust. Soc. Am. 2022, 152, 3226–3234. [Google Scholar] [CrossRef]
  57. Mille, T.; Mahe, K.; Villanueva, M.C.; De Pontual, H.; Ernande, B. Sagittal Otolith Morphogenesis Asymmetry in Marine Fishes. J. Fish Biol. 2015, 87, 646–663. [Google Scholar] [CrossRef]
  58. Mille, T. Sources de Variation Intra-Populationnelle de La Morphologie Des Otolithes: Asymétrie Directionnelle et Régime Alimentaire. Ph.D. Thesis, Université de Lille 1—Sciences et Technologies, Lille, France, 2015; p. 222. [Google Scholar]
  59. Palmer, A.R. What Determines Direction of Asymmetry: Genes, Environment or Chance? Philos. Trans. R. Soc. B Biol. Sci. 2016, 371, 20150417. [Google Scholar] [CrossRef]
  60. Mahé, K.; Ider, D.; Massaro, A.; Hamed, O.; Jurado-Ruzafa, A.; Gonçalves, P.; Anastasopoulou, A.; Jadaud, A.; Mytilineou, C.; Elleboode, R.; et al. Directional Bilateral Asymmetry in Otolith Morphology May Affect Fish Stock Discrimination Based on Otolith Shape Analysis. ICES J. Mar. Sci. 2018, 76, 232–243. [Google Scholar] [CrossRef]
  61. Conides, A.; Papaconstantinou, C. Commercial Fisheries in the Mediterranean, Focusing on the Environmental Status and the Corresponding Management Measures. Aquac. Fish. Stud. 2020, 2. [Google Scholar] [CrossRef]
  62. Spedicato, M.T.; Zupa, W.; Carbonara, P.; Fiorentino, F.; Follesa, M.; Galgani, F.; Garcia, C.; Jadaud, A.; Ioakeimidis, C.; Lazarakis, G.; et al. Spatial Distribution of Marine Macro-Litter on the Seafloor in the Northern Mediterranean Sea: The MEDITS Initiative. Sci. Mar. 2019, 83, 257–270. [Google Scholar] [CrossRef]
  63. Andrialovanirina, N.; Hache, A.; Mahé, K.; Couette, S.; Caillault, E.P. Automatic Method to Transform Routine Otolith Images for a Standardized Otolith Database Using R. Cybium 2023, 47, 31–42. [Google Scholar] [CrossRef]
  64. Laffont, R.; Navarro, N. Digit3DLand: Digitalization of 3D Landmarks on Mesh. R package version 0.2.3. 2019. Available online: https://github.com/morphOptics/digit3DLand (accessed on 13 June 2022).
  65. Vicory, J.; Pascal, L.; Hernandez, P.; Fishbaugh, J.; Prieto, J.; Mostapha, M.; Huang, C.; Shah, H.; Hong, J.; Liu, Z.; et al. SlicerSALT: Shape AnaLysis Toolbox. In Shape in Medical Imaging—ShapeMI 2018; Reuter, M., Wachinger, C., Lombaert, H., Paniagua, B., Lüthi, M., Egger, B., Eds.; Springer International Publishing: Cham, Switzerland, 2018; pp. 65–72. [Google Scholar]
  66. Kuhl, F.P.; Giardina, C.R. Elliptic Fourier Features of a Closed Contour. Comput. Graph. Image Process. 1982, 18, 236–258. [Google Scholar] [CrossRef]
  67. Lestrel, P.E. Fourier Descriptors and Their Applications in Biology. Cambridge University Press: Cambridge, UK, 2008; p. 482. ISBN 978-0-521-45201-4. [Google Scholar]
  68. Bonhomme, V.; Picq, S.; Gaucherel, C.; Claude, J. Momocs: Outline Analysis Using R. J. Stat. Softw. 2014, 56, 1–24. [Google Scholar] [CrossRef]
  69. Shen, L.; Farid, H.; McPeek, M.A. Modeling Three-Dimensional Morphological Structures Using Spherical Harmonics. Evolution 2009, 63, 1003–1016. [Google Scholar] [CrossRef]
  70. Shen, L.; Makedon, F. Spherical Mapping for Processing of 3D Closed Surfaces. Image Vis. Comput. 2006, 24, 743–761. [Google Scholar] [CrossRef]
  71. Rohlf, F.J.; Archie, J.W. A Comparison of Fourier Methods for the Description of Wing Shape in Mosquitoes (Diptera: Culicidae). Syst. Biol. 1984, 33, 302–317. [Google Scholar] [CrossRef]
  72. Legendre, P.; Legendre, L. Numerical Ecology; Elsevier: Amsterdam, The Netherlands, 2012; ISBN 978-0-444-53869-7. [Google Scholar]
  73. Plate, T.; Heiberger, R. abind: Combine Multidimensional Arrays. R package version 1.4-5. 2016. Available online: https://CRAN.R-project.org/package=abind (accessed on 18 July 2022).
  74. Fox, J.; Weisberg, S. An R Campanion to Applied Regression; Sage: Thousand Oaks, CA, USA, 2019; ISBN 978-1-412-97514-8. [Google Scholar]
  75. Fox, J.; Hong, J. Effect Displays in R for Multinomial and Proportional-Odds Logit Models: Extensions to the Effects Package. J. Stat. Softw. 2010, 32, 1–24. [Google Scholar] [CrossRef]
  76. Wickham, H. Ggplot2: Elegant Graphics for Data Analysis; Springer: New York, NY, USA, 2016. [Google Scholar]
  77. Bates, D.; Mächler, M.; Bolker, B.; Walker, S. Fitting Linear Mixed-Effects Models Using Lme4. J. Stat. Softw. 2015, 67, 1–48. [Google Scholar] [CrossRef]
  78. Bates, D.; Maechler, M.; Jagan, M. Matrix: Sparse and Dense Matrix Classes and Methods. R package version 1.5-1. 2022. Available online: https://CRAN.R-project.org/package=Matrix (accessed on 18 July 2022).
  79. Pinheiro, J.C.; Bates, D.M. Mixed-Effects Models in S and S-PLUS; Springer: New York, NY, USA, 2000. [Google Scholar] [CrossRef]
  80. Pinheiro, J.C.; Bates, D.M.; R Core Team. nlme: Linear and Nonlinear Mixed Effects Models. R package version 3.1-160. 2022. Available online: https://CRAN.R-project.org/package=nlme (accessed on 18 July 2022).
  81. Borchers, H. pracma: Practical Numerical Math Functions, R package version 2.4.2. Available online: https://CRAN.R-project.org/package=pracma (accessed on 18 July 2022).
  82. Bivand, R.; Rundel, C. rgeos: Interface to Geometry Engine—Open Source (’GEOS’). R package version 0.5-9. 2021. Available online: https://CRAN.R-project.org/package=rgeos (accessed on 18 July 2022).
  83. Murdoch, D.; Adler, D. rgl: 3D Visualization Using OpenGL. R package version 1.0.1. 2023. Available online: https://CRAN.R-project.org/package=rgl (accessed on 18 July 2022).
  84. Schlager, S. Chapter 9—Morpho and Rvcg—Shape Analysis in R: R-Packages for Geometric Morphometrics, Shape Analysis and Surface Manipulations. In Statistical Shape and Deformation Analysis; Zheng, G., Li, S., Székely, G., Eds.; Academic Press: Cambridge, MA, USA, 2017; pp. 217–256. ISBN 978-0-12-810493-4. [Google Scholar]
  85. Bivand, R.S.; Pebesma, E.; Gomez-Rubio, V. Applied Spatial Data Analysis with R., 2nd ed.; Springer: New York, NY, USA, 2013. [Google Scholar]
  86. Oksanen, J.; Simpson, G.; Blanchet, F.; Kindt, R.; Legendre, P.; Minchin, P.; O’Hara, R.; Solymos, P.; Stevens, M.; Szoecs, E.; et al. vegan: Community ecology package. R package version 2.2-0. 2013. Available online: https://CRAN.R-project.org/package=vegan (accessed on 18 July 2022).
  87. Pawson, M.G.; Jennings, S. A Critique of Methods for Stock Identification in Marine Capture Fisheries. Fish. Res. 1996, 25, 203–217. [Google Scholar] [CrossRef]
  88. Ponton, D. Is Geometric Morphometrics Efficient for Comparing Otolith Shape of Different Fish Species? J. Morphol. 2006, 267, 750–757. [Google Scholar] [CrossRef] [PubMed]
  89. Garcia, A.; Mattiucci, S.; Damiano, S.; Santos, M.N.; Nascetti, G. Metazoan Parasites of Swordfish, Xiphias gladius (Pisces: Xiphiidae) from the Atlantic Ocean: Implications for Host Stock Identification. ICES J. Mar. Sci. 2011, 68, 175–182. [Google Scholar] [CrossRef]
  90. ICES. Report of the Stock Identification Methods Working Group (SIMWG); “CES CM 2016/SSGEPI:16”; ICES: Toronto, ON, Canada, 2016; p. 47. [Google Scholar] [CrossRef]
  91. Pita, A.; Casey, J.; Hawkins, S.J.; Villarreal, M.R.; Gutiérrez, M.-J.; Cabral, H.; Carocci, F.; Abaunza, P.; Pascual, S.; Presa, P. Conceptual and Practical Advances in Fish Stock Delineation. Fish. Res. 2016, 173, 185–193. [Google Scholar] [CrossRef]
  92. Nasreddine, K.; Benzinou, A.; Fablet, R. Shape Geodesics for the Classification of Calcified Structures: Beyond Fourier Shape Descriptors. Fish. Res. 2009, 98, 8–15. [Google Scholar] [CrossRef]
  93. Benzinou, A.; Carbini, S.; Nasreddine, K.; Elleboode, R.; Mahé, K. Discriminating Stocks of Striped Red Mullet (Mullus surmuletus) in the Northwest European Seas Using Three Automatic Shape Classification Methods. Fish. Res. 2013, 143, 153–160. [Google Scholar] [CrossRef]
  94. Duarte-Neto, P.; Lessa, R.; Stosic, B.; Morize, E. The Use of Sagittal Otoliths in Discriminating Stocks of Common Dolphinfish (Coryphaena hippurus) off Northeastern Brazil Using Multishape Descriptors. ICES J. Mar. Sci. 2008, 65, 1144–1152. [Google Scholar] [CrossRef]
  95. Mapp, J.; Hunter, E.; van der Kooij, J.; Songer, S.; Fisher, M. Otolith Shape and Size: The Importance of Age When Determining Indices for Fish-Stock Separation. Fish. Res. 2017, 190, 43–52. [Google Scholar] [CrossRef]
  96. Cadrin, S.X.; Friedland, K.D. The Utility of Image Processing Techniques for Morphometric Analysis and Stock Identification. Fish. Res. 1999, 43, 129–139. [Google Scholar] [CrossRef]
  97. Morat, F.; Letourneur, Y.; Nérini, D.; Banaru, D.; Batjakas, I.E. Discrimination of Red Mullet Populations (Teleostean, Mullidae) along Multi-Spatial and Ontogenetic Scales within the Mediterranean Basin on the Basis of Otolith Shape Analysis. Aquat. Living Resour. 2012, 25, 27–39. [Google Scholar] [CrossRef]
  98. Castonguay, M.; Simard, P.; Gagnon, P. Usefulness of Fourier Analysis of Otolith Shape for Atlantic Mackerel (Scomber scombrus) Stock Discrimination. Can. J. Fish. Aquat. Sci. 1991, 48, 296–302. [Google Scholar] [CrossRef]
  99. Petursdottir, G.; Begg, G.A.; Marteinsdottir, G. Discrimination between Icelandic Cod (Gadus morhua L.) Populations from Adjacent Spawning Areas Based on Otolith Growth and Shape. Fish. Res. 2006, 80, 182–189. [Google Scholar] [CrossRef]
  100. Mahé, K.; Evano, H.; Mille, T.; Muths, D.; Bourjea, J. Otolith Shape as a Valuable Tool to Evaluate the Stock Structure of Swordfish Xiphias Gladius in the Indian Ocean. Afr. J. Mar. Sci. 2016, 38, 457–464. [Google Scholar] [CrossRef]
  101. Palmer, A.R. Animal Asymmetry. Curr. Biol. 2009, 19, R473–R477. [Google Scholar] [CrossRef]
  102. Lemberget, T.; McCormick, M.I. Replenishment Success Linked to Fluctuating Asymmetry in Larval Fish. Oecologia 2009, 159, 83–93. [Google Scholar] [CrossRef]
  103. Green, A.; Mosaliganti, K.; Swinburne, I.; Obholzer, N.; Megason, S. Recovery of Shape and Size in a Developing Organ Pair. Dev. Dyn. 2017, 246, 451–465. [Google Scholar] [CrossRef]
  104. Mahé, K.; MacKenzie, K.; Ider, D.; Massaro, A.; Hamed, O.; Jurado-Ruzafa, A.; Gonçalves, P.; Anastasopoulou, A.; Jadaud, A.; Mytilineou, C.; et al. Directional Bilateral Asymmetry in Fish Otolith: A Potential Tool to Evaluate Stock Boundaries? Symmetry 2021, 13, 987. [Google Scholar] [CrossRef]
  105. Hilbig, R.; Knie, M.; Shcherbakov, D.; Anken, R.H. Analysis of Behaviour and Habituation of Fish Exposed to Diminished Gravity in Correlation to Inner Ear Stone Formation-A Sounding Rocket Experiment (TEXUS 45). In Proceedings of the 20th ESA Symposium on Europe Rocket and Balloon Programmes and Related Research, Hyere, France, 22–26 May 2011. [Google Scholar]
  106. Lychakov, D.V.; Rebane, Y.T.; Lombarte, A.; Demestre, M.; Fuiman, L.A. Saccular Otolith Mass Asymmetry in Adult Flatfishes. J. Fish Biol. 2008, 72, 2579–2594. [Google Scholar] [CrossRef]
  107. Beier, M.; Anken, R.H.; Rahmann, H. Susceptibility to Abnormal (Kinetotic) Swimming Fish Correlates with Inner Ear Carbonic Anhydrase-Reactivity. Neurosci. Lett. 2002, 335, 17–20. [Google Scholar] [CrossRef]
  108. Hilbig, R.; Anken, R.H.; Rahmann, H. On the Origin of Susceptibility to Kinetotic Swimming Behaviour in Fish: A Parabolic Aircraft Flight Study. J. Vestib. Res. 2003, 12, 185–189. [Google Scholar] [CrossRef]
  109. Dunkelberger, D.G.; Dean, J.M.; Watabe, N. The Ultrastructure of the Otolithic Membrane and Otolith in the Juvenile Mummichog, Fundulus heteroclitus. J. Morphol. 1980, 163, 367–377. [Google Scholar] [CrossRef] [PubMed]
  110. Gonçalves, P.; Mahe, K.; Elleboode, R.; Chantre, C.; Murta, A.; Avila De Melo, A.; Cabral, H. Blue Whiting Otoliths Pair’s Symmetry Side Effect. Int. J. Fish. Aquat. Stud. 2017, 5, 06–09. [Google Scholar]
  111. Torres, G.J.; Lombarte, A.; Morales-Nin, B. Variability of the Sulcus Acusticus in the Sagittal Otolith of the Genus Merluccius (Merlucciidae). Fish. Res. 2000, 46, 5–13. [Google Scholar] [CrossRef]
  112. Chollet-Villalpando, J.G.; García-Rodríguez, F.J.; De Luna, E.; De La Cruz-Agüero, J. Geometric Morphometrics for the Analysis of Character Variation in Size and Shape of the Sulcus acusticus of Sagittae Otolith in Species of Gerreidae (Teleostei: Perciformes). Mar. Biodiv. 2019, 49, 2323–2332. [Google Scholar] [CrossRef]
  113. D’Iglio, C.; Famulari, S.; Albano, M.; Carnevale, A.; Fresco, D.D.; Costanzo, M.; Lanteri, G.; Spanò, N.; Savoca, S.; Capillo, G. Intraspecific Variability of the Saccular and Utricular Otoliths of the Hatchetfish Argyropelecus hemigymnus (Cocco, 1829) from the Strait of Messina (Central Mediterranean Sea). PLoS ONE 2023, 18, e0281621. [Google Scholar] [CrossRef] [PubMed]
Figure 1. Fish sampling distribution in Mediterranean Sea in red areas; numbers correspond to the General Fisheries Commission for the Mediterranean GSA and letters to the subdivision of GSA.
Symmetry 15 01067 g001
Figure 2. (A) 2D image with left and right inner ear side otoliths; (B) 3D volumes with left otolith in inner and outer face with six landmarks (red points, 1 on the rostrum, 2 on the postrostrum, 3 at the end of dorsal, 4 at the tip of ventral, 5 on the middle of outer face of the otolith, 6 on top of the sulcus acusticus).
Symmetry 15 01067 g002
Figure 3. 3D object shape described by three spherical functions x(Ө, Փ), y(Ө, Փ), and z(Ө, Փ) (made by [69]). (A) A sample object surface (i.e., a bowl), (B) its mesh representation, (C) its spherical parameterization, and (DF) three spherical functions that describe the bowl. Coloured dots show the mappings among the object surface, the parameterization, and the three spherical functions.
Symmetry 15 01067 g003
Figure 4. Average difference between the left and right otolith by geographical location of red mullet in a 2D image with Euclidean distance.
Symmetry 15 01067 g004
Figure 5. Average difference between the left and right otolith of red mullet by location in a 3D image. The right otolith is set here in the same orientation as the left one, and its colour shows its shape difference between both left and right otoliths (blue area = no difference, red area = very significant differences; Ed = Euclidean distance).
Symmetry 15 01067 g005
Table 1. Results of multivariate mixed-effects models on the otolith shape matrix O.
Type of DataResponse VariableExplanatory
Variable
χ2Dfp-Values
2DPCsPCs436,088.84924<0.001 ***
PCs:SI27.216240.290
PCs:GSA921.88248<0.001 ***
PCs:SI:GSA66.359480.087
3DPCsPCs0.289150.134
PCs:SI42.96715<0.001 ***
PCs:GSA83.68230<0.001 ***
PCs:SI:GSA67.17630<0.001 ***
*** highly significant effect.
Disclaimer/Publisher’s Note: The statements, opinions and data contained in all publications are solely those of the individual author(s) and contributor(s) and not of MDPI and/or the editor(s). MDPI and/or the editor(s) disclaim responsibility for any injury to people or property resulting from any ideas, methods, instructions or products referred to in the content.

