Article

Experimental Study on the Influence of Interfacial Energy Instability on the Flow Pattern Spatiotemporal Evolution of Thermal- Buoyant Capillary Convection

1
Key Laboratory of Electromagnetic Processing of Materials, Ministry of Education, Northeastern University, Shenyang 110819, China
2
School of Mechanical and Vehicle Engineering, Linyi University, Linyi 276005, China
3
Key Laboratory of Liaoning Province for Clean Combustion Power Generation and Heating Technology, Shenyang Institute of Engineering, Shenyang 110136, China
*
Authors to whom correspondence should be addressed.
Symmetry 2023, 15(2), 506; https://doi.org/10.3390/sym15020506
Submission received: 12 January 2023 / Revised: 5 February 2023 / Accepted: 9 February 2023 / Published: 14 February 2023
(This article belongs to the Special Issue Fluid Flow and Heat Transfer, Symmetry and Asymmetry)

Abstract

:
The effect of the instability of the interface morphology due to mechanical disturbances and acceleration changes (or gravity flutter) on Marangoni convective stability has been confirmed via space experiments. However, compared with the research on Marangoni convection with an axisymmetric liquid bridge, research on the transition and interface flow behavior of Marangoni convection with a non-axisymmetric liquid bridge is not sufficiently deep. Based on the thermal-buoyant capillary convection (TBCC) experiment of the conventional liquid bridge, in this study, the influence of the interfacial energy instability triggered by the gravitational tilt angle (GTA) on the spatiotemporal evolution of the flow pattern and velocity distribution of the thermal-buoyant capillary convection is examined by applying the GTA to form the non-axisymmetric liquid bridge model. The results show that the non-equilibrium change in the interface curvature due to GTA leads to a non-axisymmetric liquid bridge morphology. With increasing GTA, the cell-flow morphology during the development process is restricted, transverse/longitudinal velocity component is suppressed, and velocity peak value position gradually approaches the interface. In the oscillating TBCC stage, the deviation of cell flow vortex cores from the intermediate height intensifies with the increasing GTA, resulting in the expansion of the alternating flow zone in the center. Furthermore, the longitudinal velocity component distribution is transformed into the “two peaks and one valley” morphology (“M”-type) from the original multi-peak morphology. The interfacial energy instability due to the GTA can increase the critical temperature difference of the oscillating TBCC, maintain its stability, and delay the onset of the oscillating flow. Simultaneously, the oscillation frequency of the oscillating TBCC is reduced and the development of the oscillating TBCC is suppressed.

1. Introduction

Thermal-buoyant capillary convection (TBCC) widely exists in the production processes such as crystal growth, microfluidics, and thin film preparation. Thermocapillary convection results from a surface tension gradient due to an uneven interface temperature distribution. Simultaneously, the buoyancy effect cannot be eliminated in the constant gravity field. Under the effect of the temperature field, the fluid with a lower density at the bottom increases spontaneously and finally undergoes the buoyant-thermal capillary convection. In two previous European aerospace experimental missions (Spacelab-1 and Spacelab-Dl), the stability of a liquid bridge under mechanical disturbance was tested. However, the experimental results significantly differed from the expected values because of the non-concentration of the supporting disk and column of the liquid bridge. Additionally, the influence of gravitational acceleration (or gravitational vibration) on the interface shape and Marangoni convection stability cannot be ignored. Based on the aforementioned background, a non-axisymmetric liquid bridge model with a gravitational tilt angle (GTA) was established. The existing literature mainly focuses on the flow transition of TBCC in axisymmetric liquid bridges [1,2], interfacial deformation characteristics, and consequences of different volume ratios on the Marangoni convection instability of the liquid bridge. Moreover, a few studies have been conducted on TBCC due to interfacial energy instability in non-axisymmetric liquid bridges. In research on non-axisymmetric liquid bridges, scholars have successively investigated the interface dam break due to the ultimate tensile strength of the liquid bridge, interface force behavior and deformation of the eccentric liquid bridge, effect of the rotating disk on the oscillation of thermocapillary convection in the liquid bridge, and special shape of the liquid bridge in different engineering backgrounds. Chen et al. [3] examined the instability of the thermocapillary convection of a liquid bridge in the half-floating zone under a microgravity environment and determined that the volume and aspect ratios are significant for the critical Marangoni number. Chen et al. [4] researched the linear instability of the thermocapillary convection of fluids at small Prandtl numbers in a half-floating-zone liquid bridge and analyzed the critical Marangoni number and flow characteristics at different volume ratios. It has been shown that this instability is primarily due to volumetric backflow driven by non-uniform thermocapillary forces on the free surface. Kuhlmann et al. [5] examined the influence of the linear stability of thermal capillary flow and free surface deformation on the oscillation mechanism in a half-floating zone liquid bridge under different volume ratios. Fan et al. [6] designed a gas–liquid two-phase system with a three-dimensional flow structure via numerical calculations. They obtained the flow law and structural change in the cell generated by thermocapillary convection in a half-floating liquid bridge under microgravity environment by changing the different aspect ratios. Le et al. [7] conducted a succession of three-dimensional (3D) transient simulations to investigate the initiation and characteristics of the thermocapillary convection oscillation phenomenon of a low Prandtl number fluid (Pr = 0.01) with a certain volume ratio in a deformed half-floating zone liquid bridge. Furthermore, they defined the critical conditions for different volume ratios under the conditions of constant gravity and microgravity. Brulin et al. [8] experimentally investigated the tension of a viscous liquid bridge between two horizontal solid substrates and used a high-speed video system to observe the geometry of the liquid bridge. Moreover, the pinch-off time can be calculated using the Reynolds number and capillary time. Meseguer et al. [9] studied the stable state of an axisymmetric liquid bridge between circular support disks with different radii under the impact of longitudinal acceleration. Using an asymptotic method to analyze the dynamic characteristics of the liquid bridge under the stability limit of minimum volume, the fracture results of the liquid bridge were accurately predicted. Lapuerta et al. [10] investigated the influence of the offset (eccentricity) of the rotation axis and centerline of the upper and lower disks on the stability of a static liquid bridge via numerical calculations, and they obtained the stability limit of the liquid bridge under different eccentricities. Laverón et al. [11] solved the Young–Laplace equation, obtained the bifurcation diagram of an asymmetric liquid bridge under transverse and transverse-longitudinal gravity, and, finally, obtained the stability limit of the liquid bridge. Furthermore, they investigated the instability of a non-axisymmetric liquid bridge between non-concentric disks under transverse gravity [12]. The results showed that instability is always related to eccentricity when a transverse gravitational field is introduced. Lowry et al. [13] proposed a method for predicting the onset and stability characteristics of non-axisymmetric flow modes of the liquid bridge. This method can be utilized to stabilize any fixed contact line at an axisymmetric interface in the field. Ataei et al. [14] studied the overall motion of a liquid bridge between two nonparallel identical solid surfaces during multiple load cycles (compression and tension) via numerical simulations and experiments. Bian et al. [15] theoretically obtained a critical equation of a nonparallel plate liquid bridge. The theoretical calculation equation of the liquid bridge position was obtained via thorough study of the formation process of the liquid bridge. Rodriguez et al. [16] simulated the stability limitation of a liquid bridge rotating around an eccentric axis in a longitudinal gravity field. The results indicated that the longitudinal gravity field has a greater impact on a long liquid bridge, eccentricity has a greater impact on a short liquid bridge, and axial and lateral components of the gravity field also change the equilibrium shape. Le et al. [17] investigated the influence of circumferential rotation on the oscillating phase of thermocapillary convection and the time-varying distribution of dopants near the crystal growth interface. The results showed that circumferential rotation is beneficial for the uniformity of the azimuth and concentration gradient reduction at the crystal growth interface.
Wu et al. [18] selected to use the Surface Evolver software and cited the minimum energy method to establish a general explicit capillary force model that can forecast the capillary force between different particles with different diameters and contact angles (≤50°). Wang et al. [19] numerically examined the main instability of the thermal capillary flow of a silicon melt with a Prandtl number of 0.011 in the liquid bridge between two coaxial discs with different radii under microgravity using different heating strategies. The results showed that the stability of the thermal capillary flow is significantly improved with the decrease in the radius ratio Γ. Furthermore, when the liquid bridge is heated from the bottom disk, which differs from the typical cylindrical liquid bridge (Γ = 1), the instability under the condition of small radius ratio (Γ ≤ 0.672) shows oscillating bifurcation. Chen et al. [20] investigated the rupture distance and shape of the liquid bridge formed between two surfaces with different roughness. Furthermore, they investigated the redistribution of the liquid after rupture. Additionally, the effects of contact angle and roughness on the fracture distance, shape, and redistribution of the liquid bridge were obtained. Yang et al. [21] examined the effect of surface internal energy instability triggered by gravity tilt to a certain extent on the solutocapillary convection, and they determined that the spatiotemporal evolution of solutocapillary convection in a non-axisymmetric liquid bridge under different GTAs can be divided into many different stages, as well as the mechanism of the change in cell flow structure. To study fluid surface deformations in thermocapillary convection, Kang et al. [22] used PIV technology to observe the evolution of the flow field and discussed the instability of the surface wave in a ground experiment. Ciappi et al. [23] developed analytical and computational fluid dynamics models based on an oscillating water column system to develop reliable ocean wave resources. The two different models are applicable to different stages to evaluate the performance of the wing isolation well turbine. By using various methods and techniques, the results obtained and analyzed were compared with the experimental literature data. The model developed using this method exhibited good performance and provided a good analytical method and ideas.
In summary, it is more complicated to study the TBCC of a non-axisymmetric liquid bridge with free surface deformation than that of an axisymmetric liquid bridge. Unlike the previous thermocapillary convection model of an axisymmetric liquid bridge on a foundation, the gravitational tilt angle (GTA) condition proposed in this study refers to a certain angle between the direction of the gravity field and axis of the liquid bridge. On this basis, a liquid bridge model with a non-axisymmetric interface shape was established to study the effect of surface internal energy instability due to GTA on thermal-buoyant capillary convection. Therefore, an experiment was conducted on the spatiotemporal evolution of TBCC due to interfacial energy instability under GTA, and the effects of gravitational inclination on the oscillating flow pattern and longitudinal and transverse velocity fields were investigated.

2. Materials and Methods

The liquid bridge is an ideal geometric model built on the engineering background of single crystal preparation by the floating zone method. Figure 1 shows the geometric model of a non-axisymmetric liquid bridge in the half-floating zone under the influence of GTA. Selecting a smaller height of the liquid bridge under the constant gravity field is conducive to maintaining the stability of the liquid bridge interface. The liquid bridge with the gravitational tilt angle cannot easily break the dam, but too small of a height of the liquid bridge will cause the observation area of the high-speed camera to further narrow, which is not conducive to imaging. Therefore, the height of the liquid bridge is H = 2 mm, and the diameter of the liquid bridge is D = 5.12 mm when the upper and lower disks are coaxial. In order to prevent capillary climbing, the upper and lower disks are designed with a 45° chamfer (the effective diameter of the upper and lower disk is D = 4.88 mm), thus the effective volume of the liquid bridge is V = 20 mL, the volume ratio is Vr = V/Vs = 0.535 (Vs = 37.383 mL), the aspect ratio is Ar = H/R = 0.83, and the throat diameter of the liquid bridge is D′ = 2.38 mm. Because the Bond number is Bo = 1.823 (Bo = ρgL2/σ), the buoyancy effect cannot be ignored in this experimental process. In this model, the upper disk is set as the hot disk (Thot), and the lower disk is set as the cold disk (Tcold). The direction of the temperature gradient and gravitational field forms a certain angle φ (φ = 0°, 5°, 10°). Under the GTA, it was defined that the left interface of the liquid bridge refers to the far side of the ground, and the right interface of the liquid bridge refers to the near side of the ground (see Figure 1).
In the single-layer liquid film model, the interface–energy balance equation of immiscible double-layer fluid in the existing theory is:
[ [ q ] ] n 12 = m [ [ e + | u u | 2 2 ] ] + [ [ ( u u ) T n 12 ] ] + D s U s D t + ( u u ) div s ( U s σ ) + ( U s σ ) div s u
In Equation (1), q represents the heat flux vector. n12 represents the outward unit normal that points from liquid 1 to liquid 2 at the interface. m represents the mass flux across the interface. e represents the specific internal energy of the fluid. u represents the fluid velocity vector at the interface. u represents the interface velocity. T is the Cauchy stress tensor. Us represents the surface internal energy per unit area (i.e., surface specific internal energy). DS/Dt is the surface material derivative. σ represents the surface tension. divs represents the surface divergence operator. Because the internal energy is affected by the temperature change, Chen et al. [24] used the thermodynamic relationship [25] to replace the new interface energy equation as follows:
[ [ q ] ] n 12 = m [ [ e + | u u | 2 2 ] ] + [ [ ( u u ) T n 12 ] ] Θ d 2 σ d Θ 2 D S Θ D t Θ d σ d Θ d i v S u
While there is no mass transfer phenomenon at the interface, m = 0 and u = u are introduced into Equation (2). Therefore, the interfacial energy balance equation of the thermocapillary flow becomes:
[ [ q ] ] n 12 = Θ d 2 σ d Θ 2 D S Θ D t Θ d σ d Θ div S u
Equation (3) demonstrates that when the interface energy changes with temperature, the heat flux through the interface between the two fluids is discontinuous. The interface–energy balance equation of the thermocapillary flow monolayer model without condensation/evaporation is as follows:
q n = Θ d 2 σ d Θ 2 D S Θ D t Θ d σ d Θ div s u + h ( Θ Θ a i r ) + Q 0
In Equation (4), Θ is the absolute temperature of the free surface of the non-isothermal liquid bridge. Θair is the absolute temperature on the ambient side. h is the convective heat transfer coefficient. Q0 is the heat flux from non-isothermal liquid bridge fluid domain to the air domain. In Equation (4), the term Θ d 2 σ d Θ 2 D S Θ D t represents the variation in surface specific internal energy caused by the absolute temperature of free interface. Θ d σ d Θ div s u represents the surface internal energy change formed by the interface expansion. Thus, thermocapillary convection not only depends on the heat transfer caused by the temperature difference between the two-phase interfaces but also on the interface absolute temperature and the expansion deformation of the interface. In this paper, the term Θ d σ d Θ div s u in Equation (4) further is applied to characterize the contribution of free surface deformation to surface internal energy change. That is,
f ( φ , u ) = Θ d ( ρ g R 2 sin φ / Bo l ) d Θ div S u
In Equation (4), the extent of the static deformation of the interface relies on the static Bond number that is the ratio of hydrostatic pressure to capillary pressure, Bol = ρgR20, Boa = cosφρgR20, Bol = sinφρgR20 (the dynamic Bond number measures the relative strength of buoyancy force to thermocapillary force, Bodyn= ρgR2TΔT). Among them, the radial component of the dynamic Bond number is consistent with the direction of expansion deformation. In the experiment, therefore, the radial component of dynamic Bond number (Bo′dyn = ρgR2 cosφ/σTΔT) characterized the interfacial energy instability on the free surfaces of the liquid bridge, and the influence of changing surface internal energy due to interface distortion (Bo′dyn) on the flow pattern evolution (the relationship between Bo′dyn and Marangoni number Macr) and velocity fields of TBCC is elucidated in Section 3.
It is indicated in Figure 2 that this experimental platform primarily comprises the following systems: the liquid bridge system, the image acquisition and analysis system, and the temperature adjustment and feedback system. The image acquisition and analysis system includes a high-speed camera (shooting rate, 5200 fps), a macro close focus lens (MACRO PROBE® LAOWA), an adjustable laser transmitter, a mobile bracket of high-speed camera, and a rotating bracket of the liquid bridge. The mobile bracket of high-speed camera and the rotating bracket of the liquid bridge are able to realize synchronous rotation. The temperature regulation and feedback system includes the coil spring heater, multi-channel temperature collector and capillary thermocouple. The heating and temperature control of upper disk are realized by the coil spring heater, and the temperature data of the hot corner of the liquid bridge are collected by the capillary thermocouple (the diameter of the temperature sensing end is D = 0.1 mm). The KF96-10cSt dimethyl silicone oil is adopted as the liquid bridge medium to carry out the experiment, and its parameters are shown in Table 1 [21].
In order to prevent the tracer particles from separating under the gravitational field in the experiment, the refractive index and tracking capability ( St = ρ p D p 2 U max l 18 μ l H : in the formula, ρ is the particle density, g/cm3; DP is the particle size, μm; U lmax is the maximum flow velocity in the liquid bridge) of the polyamide resin particles PRP1 and PRP2 (d = 5μm, d = 50μm), the fluorescent particle PF (d = 8.5 μm), the aluminum particle P1 (d = 10μm), and the silver plated hollow bead P2 (d = 13μm) are comprehensively investigated in this experiment. The fluorescent particle (PF) is finally selected as the tracer particle (see Table 2).
The experimental steps of this design are as follows:
  • Select the upper and lower disks of the liquid bridge with the determined diameter (5.12 mm), fix the capillary thermocouple on the lower disk and connect it to the multi-channel temperature collector.
  • Connect the macro close focus lens to the front of the high-speed camera window through the adapter ring.
  • Mix the appropriate amount of PF tracer particles with 10cSt silicone oil. Long-time physical oscillation is carried out through a vortex mixer to ensure that the particles are uniformly distributed in the silicone oil.
  • Adjust the relative height of the upper and lower disks of the liquid bridge to 2.0 mm and inject silicone oil mixed with tracer particles through the micro syringe pump.
  • Turn on the laser generator, fix the laser transmitter at a certain incident angle (the laser plane is in a fan shape, the thickness of the laser plane is 0.5 mm, and the included angle is 60°) and record the volume of the liquid bridge formed, V.
  • Set the coil spring heater to a certain overheat temperature to heat the upper disk of the liquid bridge and record the temperature changes in the hot corner area and the middle high position in the experiment online.
  • Adjust the GTA to 0°, 5° and 10°, and repeat steps a–f for the experiment.
  • Import the experimental video into PIV post-processing software. Extract the distance, displacement and velocity information of the flow field based on the scale of the digital image and the actual distance.
In this paper, the TBCC in the micron scale liquid bridge is experimentally observed. The difference of initial conditions in each experiment will affect the experimental results of oscillatory flow. Therefore, as shown in Table 3, the repeatability and error of the experiment are characterized by the comparison results of five groups of parallel experiments. In previous articles, we used the same experimental system to study the effect of gravity inclination on solutocapillary convection. The article provided sufficient information about the accuracy of experimental measurements, data processing, and conclusions. Therefore, the differences regarding the use of experimental methodologies and their implications in detail can be referred to in the literature [21].

3. Results and Discussion

3.1. Influence of Interfacial Energy Instability under Different GTAs on the Flow Pattern Spatiotemporal Evolution of TBCC

3.1.1. Steady Stage of Thermal-Buoyancy Capillary Convection

In Figure 3, two symmetrical cell flows in the flow field at the GTA are still observed when comparing the flow patterns in the stable thermocapillary convection under the conditions of φ = 0°, φ = 5°, and φ = 10°. When the GTA increases gradually, the radial component of the Bond number also increases gradually (Bo = 0.25787 < Bo10° = 0.60481), and the curvature radius of the left interface is always smaller than that of the right interface. Under the condition of φ = 5°, the curvature radius of left interface (on the far side of the ground) of the liquid bridge decreases, the concave degree of meniscus interface towards the liquid side increases, and the shape of cell flow vortex core on the far ground side is significantly distorted and elongated. The radial influence range of the left-cell flow is significantly smaller than that of the right-cell flow (near the ground), but the axial influence range of the left-cell flow is significantly larger than that of the right-cell flow. Conversely, the curvature radius of the right interface increases, and the meniscal interface tends to be flat under the action of gravitational inclination. Under the condition of φ = 10°, the radial influence range of left cell flow is restored, and the axial influence range of the left cell flow is still larger than that of right cell flow.

3.1.2. Oscillation Stage of Thermal-Buoyancy Capillary Convection

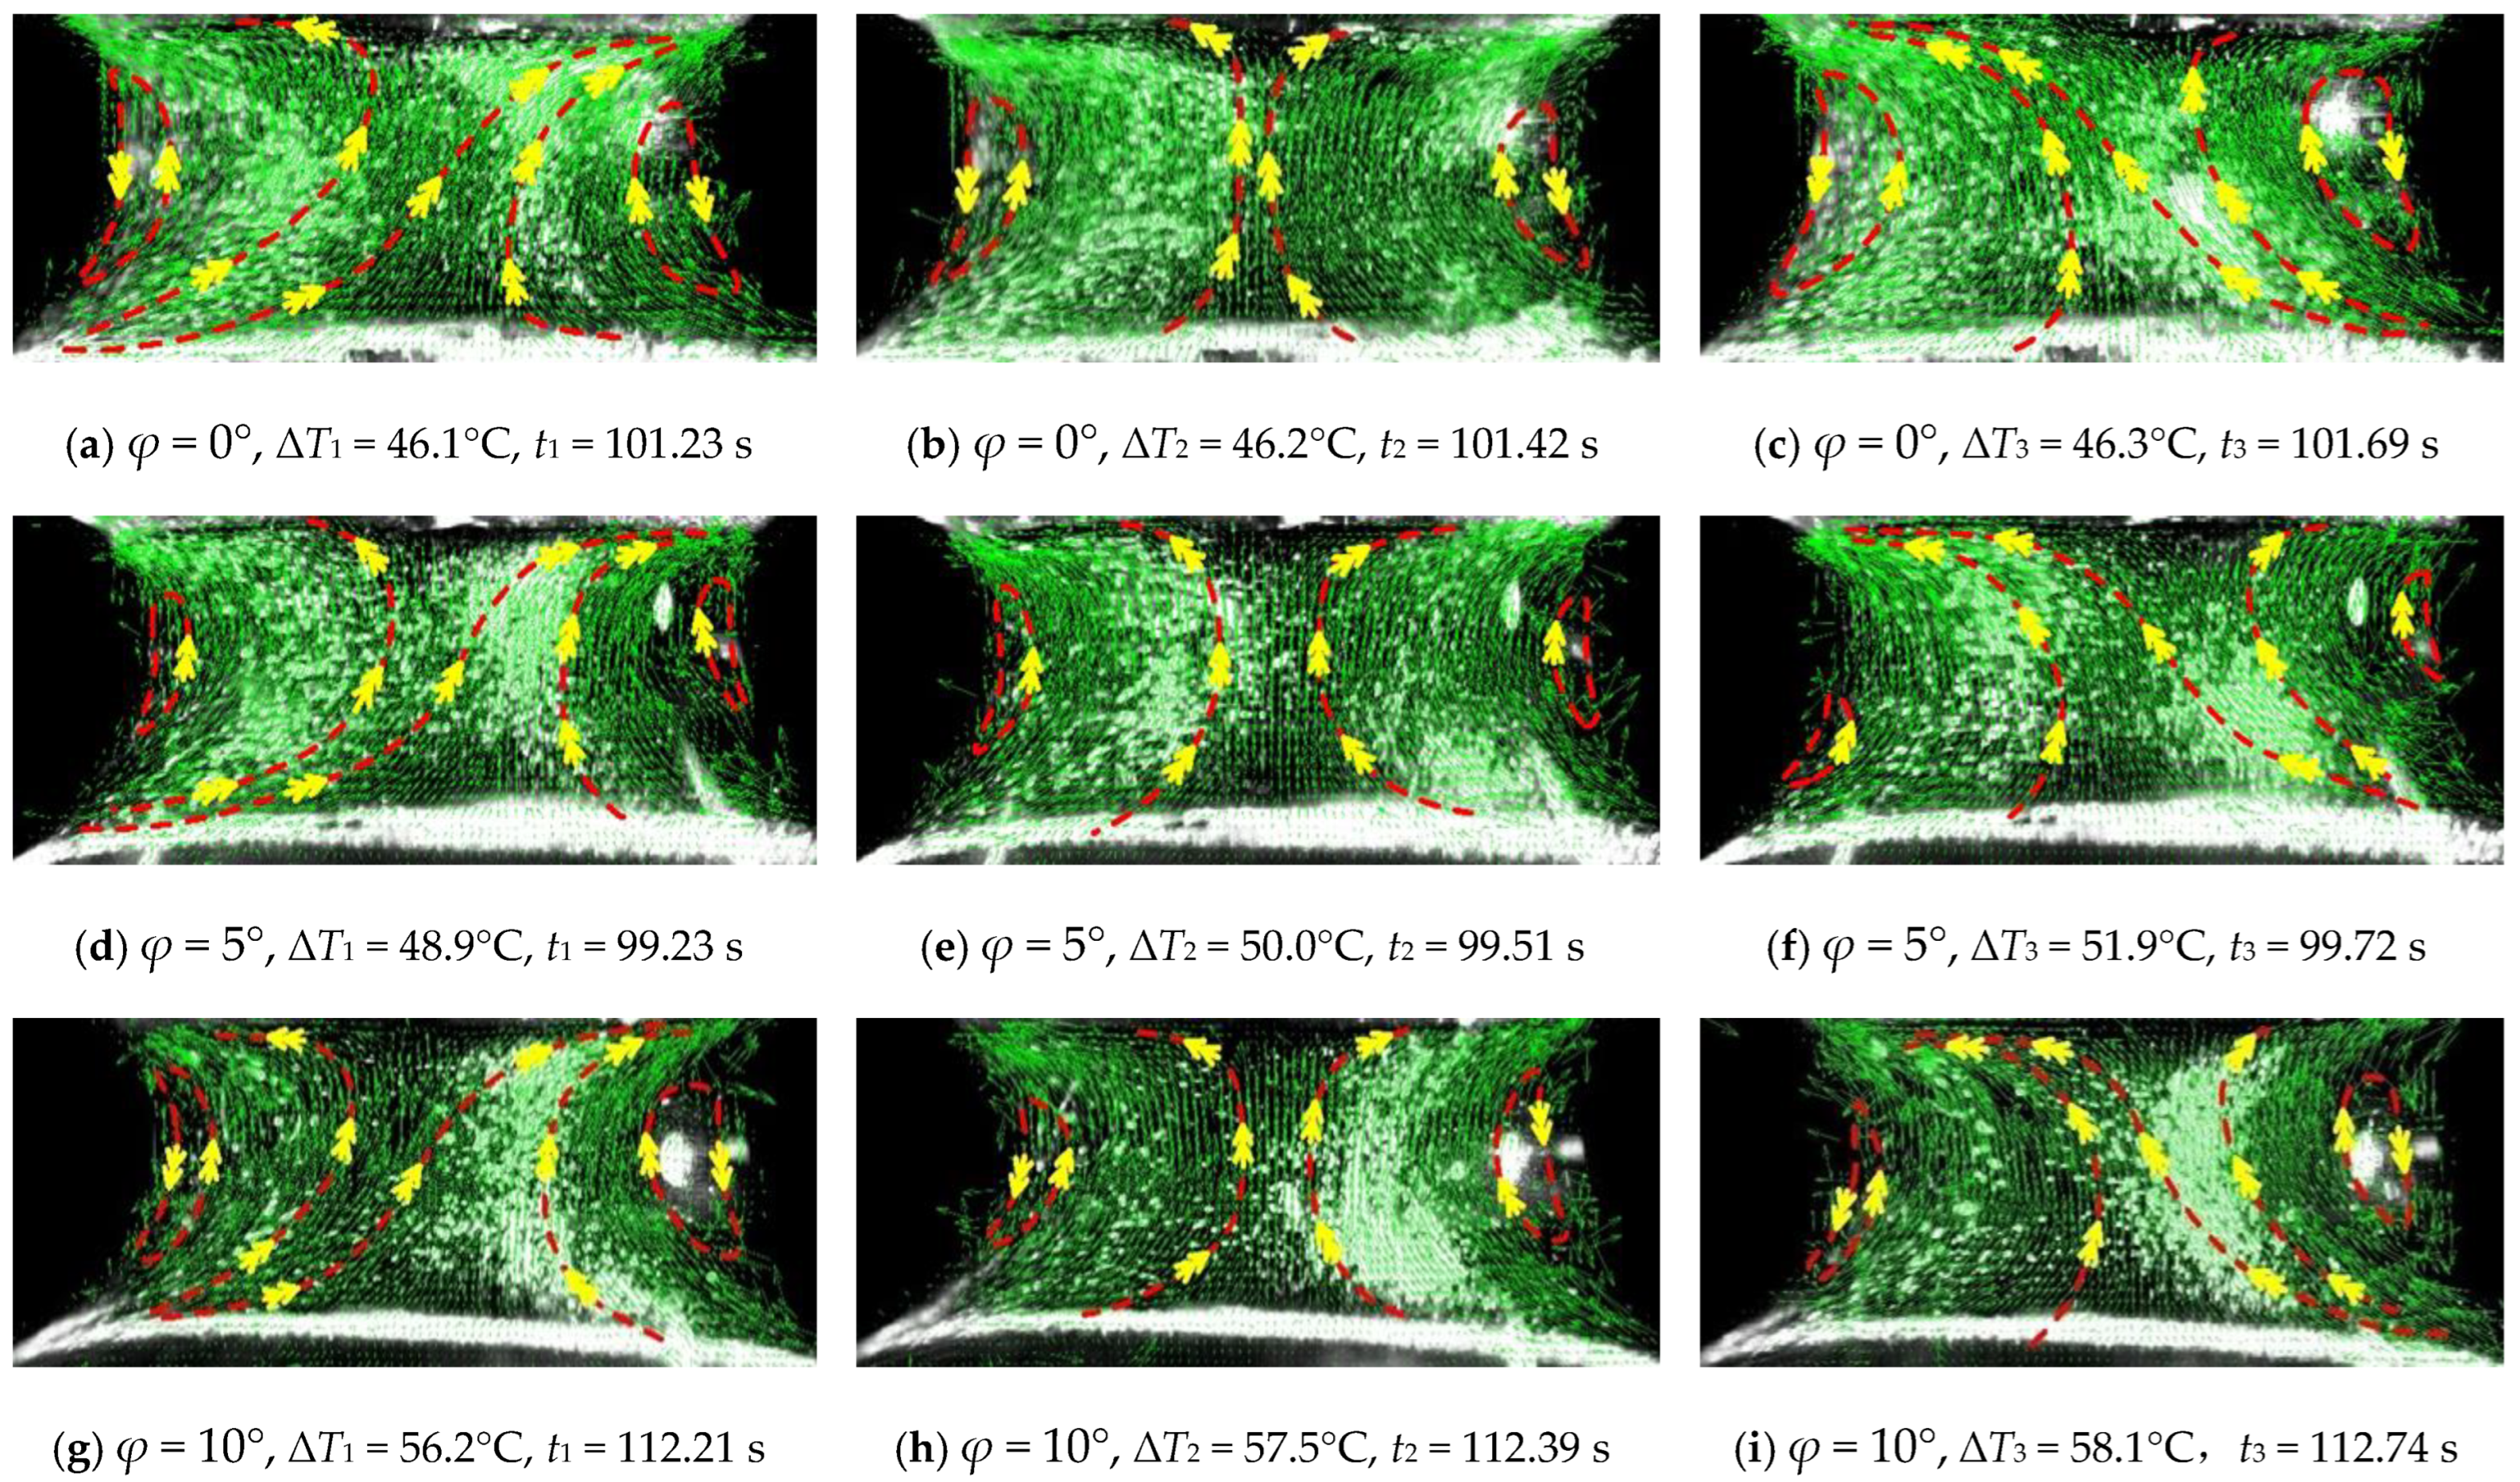
Figure 4 demonstrates the spatiotemporal development of the flow pattern in the oscillatory TBCC under different GTAs. The alternating encroachment oscillating mode of the left and right cell flows in the oscillating TBCC is not changed by the application of gravitational inclination. However, the free surface shape and vortex core morphology of the cell flow change significantly. With increasing GTA content, the evolution of the interface morphology approaches that of TBCC in the stable stage. The curvature radius of the left interface (on the far side of the ground) of the liquid bridge continues to decrease, whereas that of the right interface (on the near side of the ground) of the liquid bridge continues to increase. Furthermore, given that the progress space of the left cell flow (on the far side of the ground) is inhibited, the shape of the vortex core on this side gradually narrows and flattens, and the radial influence range of the cell flow on this side continues to weaken and is significantly smaller than that of the right cell flow (on the near side of the ground). The influence scope of the vortex center of the right cell flow (near the ground) shows overall atrophy.
Additionally, the application of the GTA forces to the positions of this pair of cell flows changes significantly in the oscillating TBCC. In the full development stage of a stable TBCC, the vortex centers of the coupled cell flows are maintained at an intermediate height (y = 1.2 mm). The gravitational inclination intensifies when the vortex centers of the couple-cell flows are far from the intermediate height. The vortex center of the left-cell flow (on the far ground side) is shifted to the cold corner on the left side of the liquid bridge, and the vortex center of the right-cell flow (near the ground side) is shifted to the hot corner on the right side of the liquid bridge. Finally, the increased GTA intensifies the offset degree with the development of oscillating TBCC.
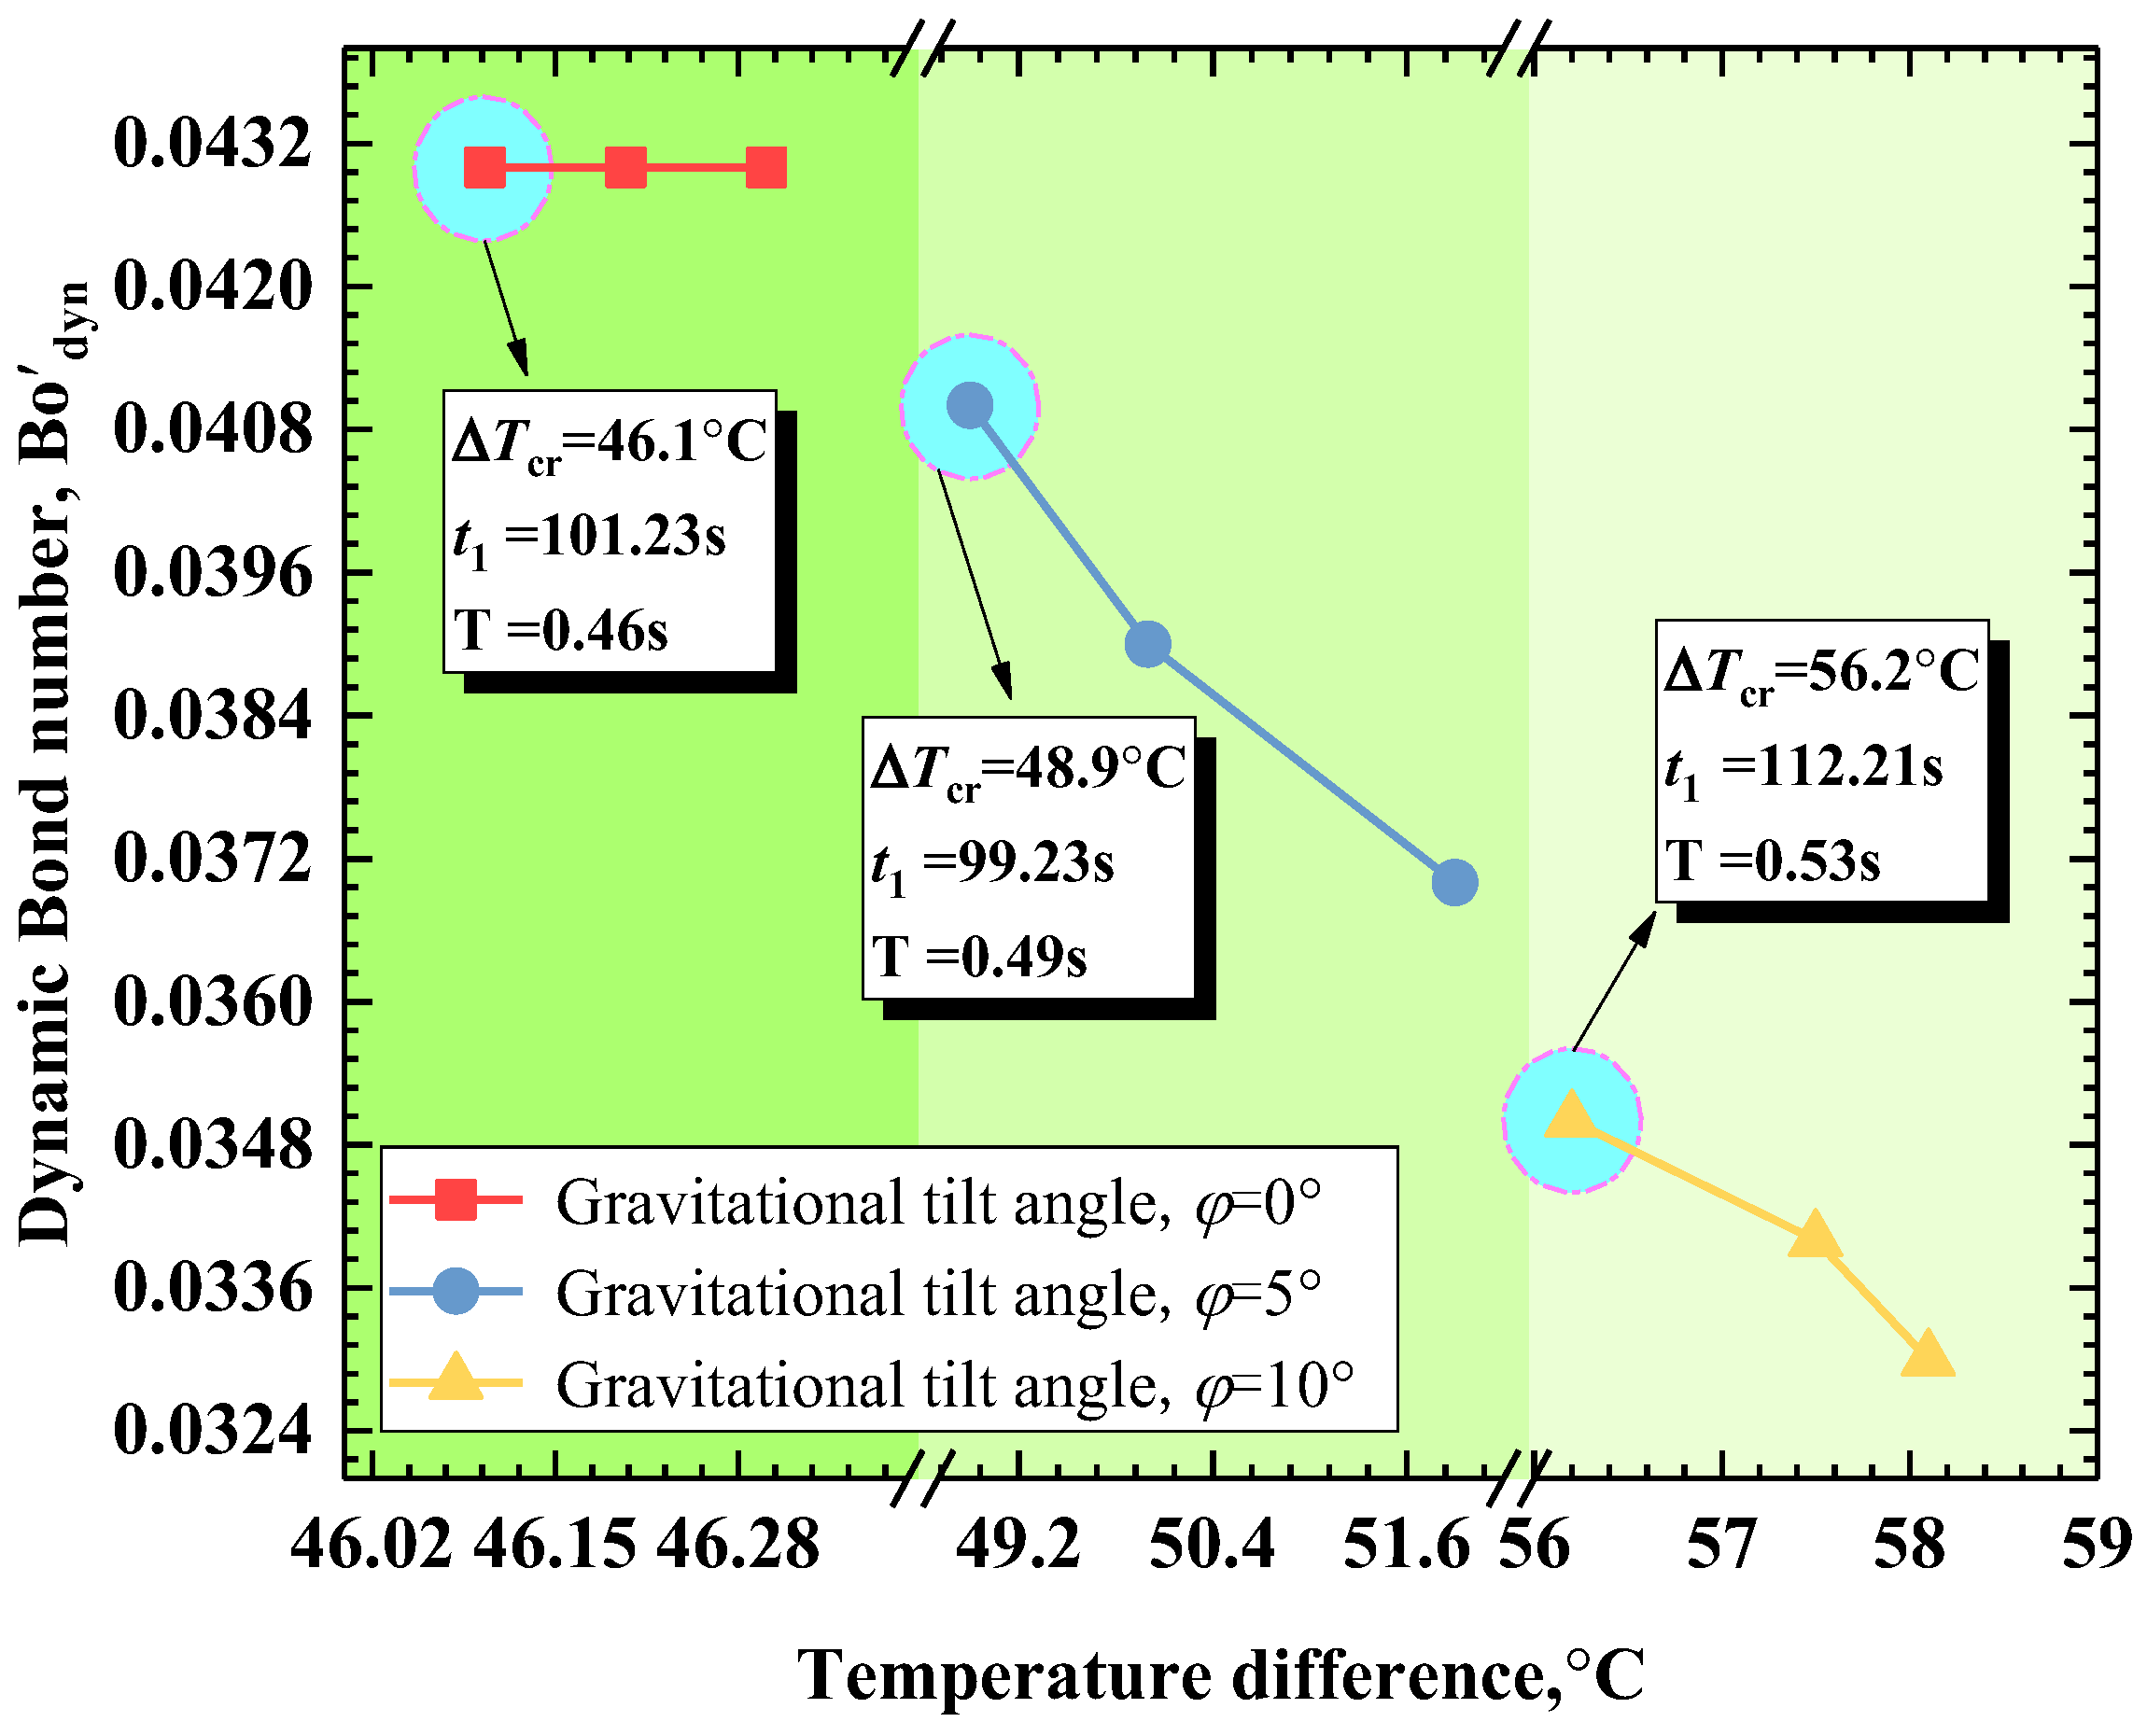
The Bond number remains almost unchanged with the development of oscillating TBCC under the condition of φ = 0°. Conversely, when the GTA is φ = 5° or φ = 10°, the Bond number gradually decreases with the development of oscillating TBCC, but in the same oscillating flow state (at the same time), as the GTA increases, the Bond number decreases (see Figure 5). Meanwhile, the oscillation period (T = t3t1) and critical temperature difference ΔT1 (the temperature difference at time t1) of the TBCC oscillation increase as GTA increases, as shown in Figure 5. This shows that the interfacial energy instability due to the application of the GTA can increase the critical temperature difference of the oscillating TBCC, thereby delaying the onset of the oscillating TBCC and maintaining a stable TBCC. Simultaneously, the oscillation frequency f (f = 1/T) of oscillating TBCC is reduced, and the development of oscillating TBCC is suppressed.

3.2. Influence of Interfacial Energy Instability on the Distribution of Velocity Field in TBCC under Different GTAs

3.2.1. Influence of Different GTAs on the Distribution of Transverse Velocity Components

(1)
Steady stage of thermal-buoyancy capillary convection
Figure 6 shows the distribution of the transverse velocity components at five heights of the liquid bridge in the steady state of the TBCC at t0 (corresponding to the flow state in Figure 3). Under three GTAs, the manifolds at t0 = 47.0 s, t0′ = 47.1 s, and t0″ = 47.3 s are, respectively, selected to characterize the steady thermocapillary convection flow field. Therefore, the average value of the three moments is selected as the transverse velocity component under a certain GTA in Figure 3. Overall, the transverse velocity component at the intermediate height of the liquid bridge (y = 1.2 mm) undulates at approximately u = 0 m/s, and the distribution of the transverse velocity component at the other four height positions exhibit a central symmetry distribution at the geometric center of the liquid bridge. The distributive law of center symmetry does not change with the application of gravitational inclination. Meanwhile, the absolute transverse velocity component at y = 1.5 mm is the same as the absolute transverse velocity component at y = 0.9 mm, and the absolute transverse velocity component at y = 1.7 mm is the same as the absolute transverse velocity component at y = 0.6 mm. Thus, they exhibit mirror-symmetric distribution characteristics based on u= 0 m/s. The maximum absolute value of the transverse velocity component appears around the hot disk and cold disk (i.e., y = 1.7 mm and y = 0.6 mm, respectively).
According to Table 4 and Table 5, the influence range of the cell flow is suppressed with increasing GTA, the velocity gradient of the transverse velocity component is significantly reduced at contiguous heights, the distribution of positive or negative wave peaks is flatter, and the absolute peak value of the transverse velocity component on the right side of the liquid bridge (on the near-ground side) is greater than that on the left side of the liquid bridge (on the far-ground side). In Figure 6, the peak values of the positive and negative transverse velocity components at each height shift towards the right free surface, and the peak values of the transverse velocity on the left side of the liquid bridge shift more distinctly. The turning point (u = 0 m/s) of the positive and negative transverse velocity components at each height gradually moves to the right side of the liquid bridge (near the ground). The distribution law of the aforementioned transverse velocity component is related to the radial shrinkage of the range of influence of the cell flow toward the interface, as shown in Figure 3. This is further explained by the fact that the variation in the interfacial energy due to GTA can inhibit the transverse velocity component of the stable TBCC.
(2)
Oscillation stage of thermal-buoyancy capillary convection
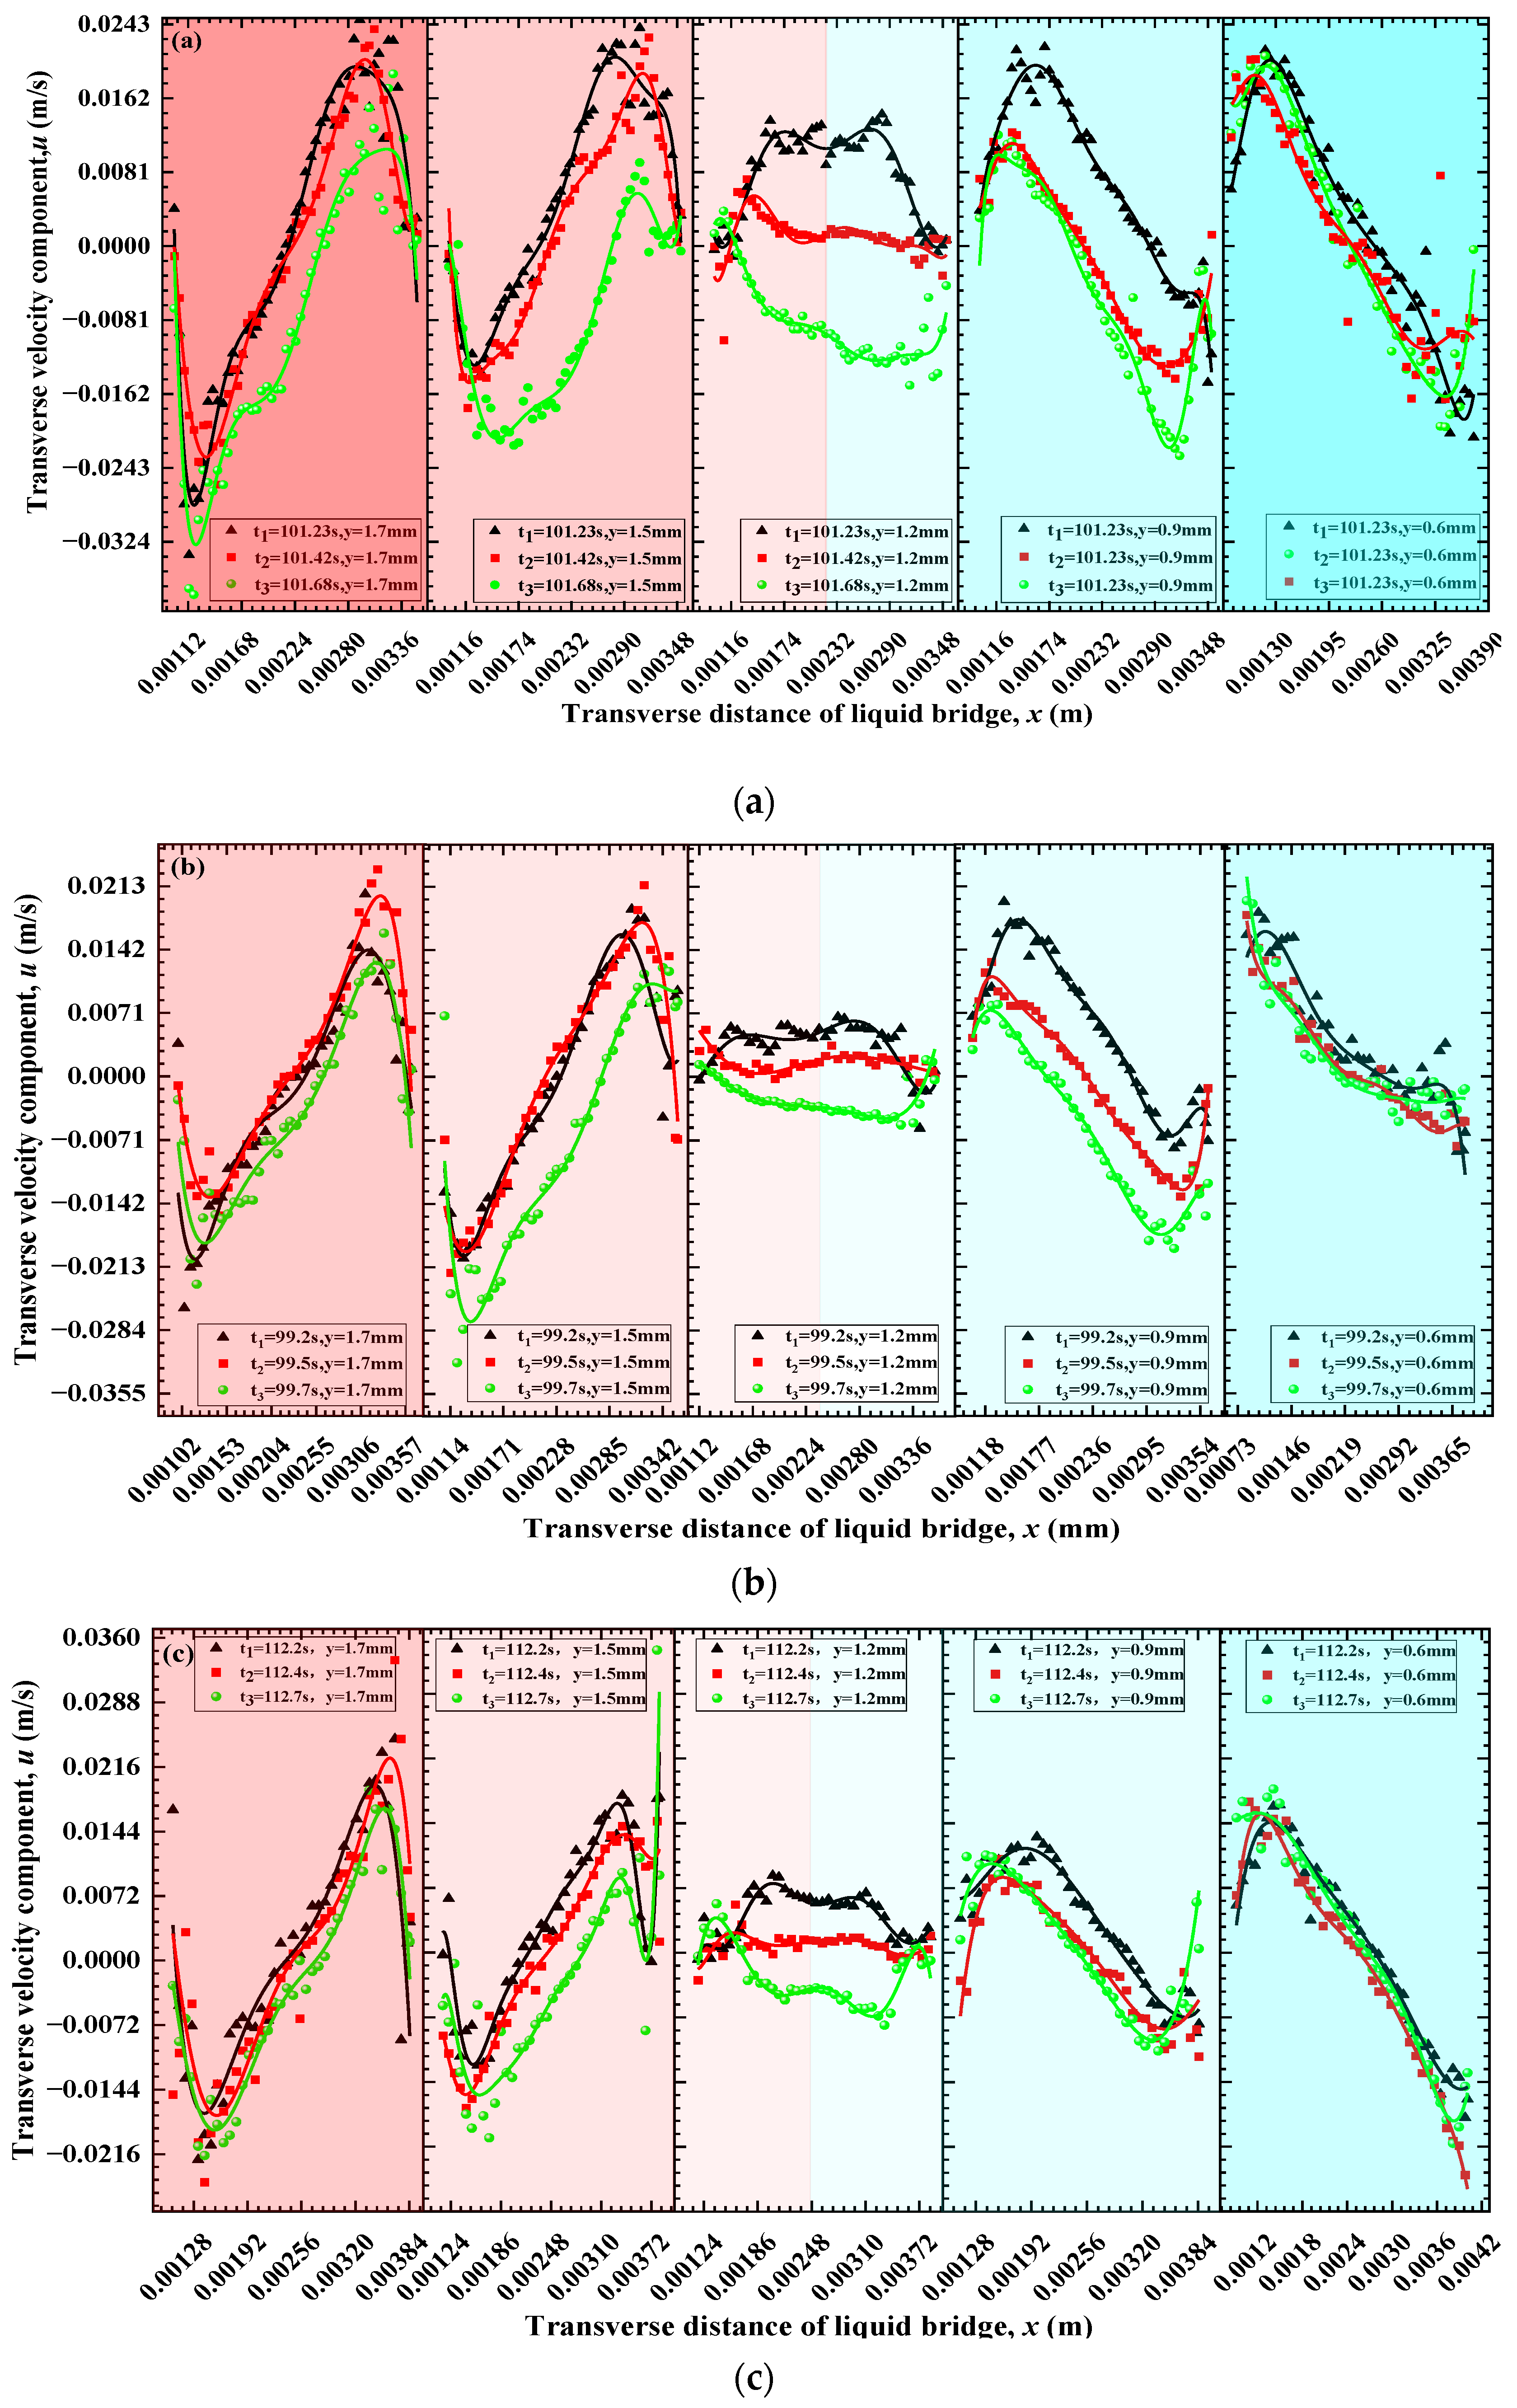
Figure 7 shows the distribution of the transverse velocity components at five heights in one oscillation period (t1, t2, t3) for the oscillating TBCC. The transverse velocity components at y = 1.7 mm and y = 1.5 mm are similar to that at y = 0.6 mm and y = 0.9 mm, respectively. They exhibit a mirror-symmetric distribution.
The transverse velocity component at each height presents a certain fluctuation law with the development of oscillating TBCC (t1t2t3). In the oscillating TBCC, the left cell flow occupies the right cell flow at time t1 (as shown in Figure 4a,d and g). At t3, the right cell flow occupies the left cell flow (as shown in Figure 4c,f and i). The pair of cell flows deviate significantly from the intermediate height at t3 under the action of gravitational inclination. At this time, the negative value of the transverse velocity component at y = 1.7 mm accounts for a larger proportion of the radial space. At a height of y = 0.6 mm, the positive value of the transverse velocity component accounts for a larger proportion of the radial space, as shown in Figure 7b,c. Meanwhile, at an intermediate height (y = 1.2 mm) of the liquid bridge, the peaks of the transverse velocity component appear at t1 and t3. However, each transverse velocity component is almost zero at t2 (u= 0 m/s). When the left and right cell flows move away from the intermediate height of the liquid bridge due to the GTA, the distribution of the transverse velocity component changes from a unimodal “U”-type to a multimodal “M”-type at time t3.
With the application of GTA, the interface morphology of the liquid bridge changes from axisymmetric to non-axisymmetric eccentric, and the positive/negative peak position of the transverse velocity component at each height shifts to the free surface. Therefore, the interfacial energy instability due to the GTA promotes the gradient attenuation of the transverse velocity component at the same height at different moments. Specifically, the difference in the transverse velocity component at the intermediate height upon adjacent moments significantly decreases as GTA increases. Consequently, the disturbance of the transverse velocity component decreases and the development of the oscillating TBCC is suppressed.

3.2.2. Influence of Different GTAs on the Distribution of Longitudinal Velocity Components

(1)
Steady stage of thermal-buoyancy capillary convection
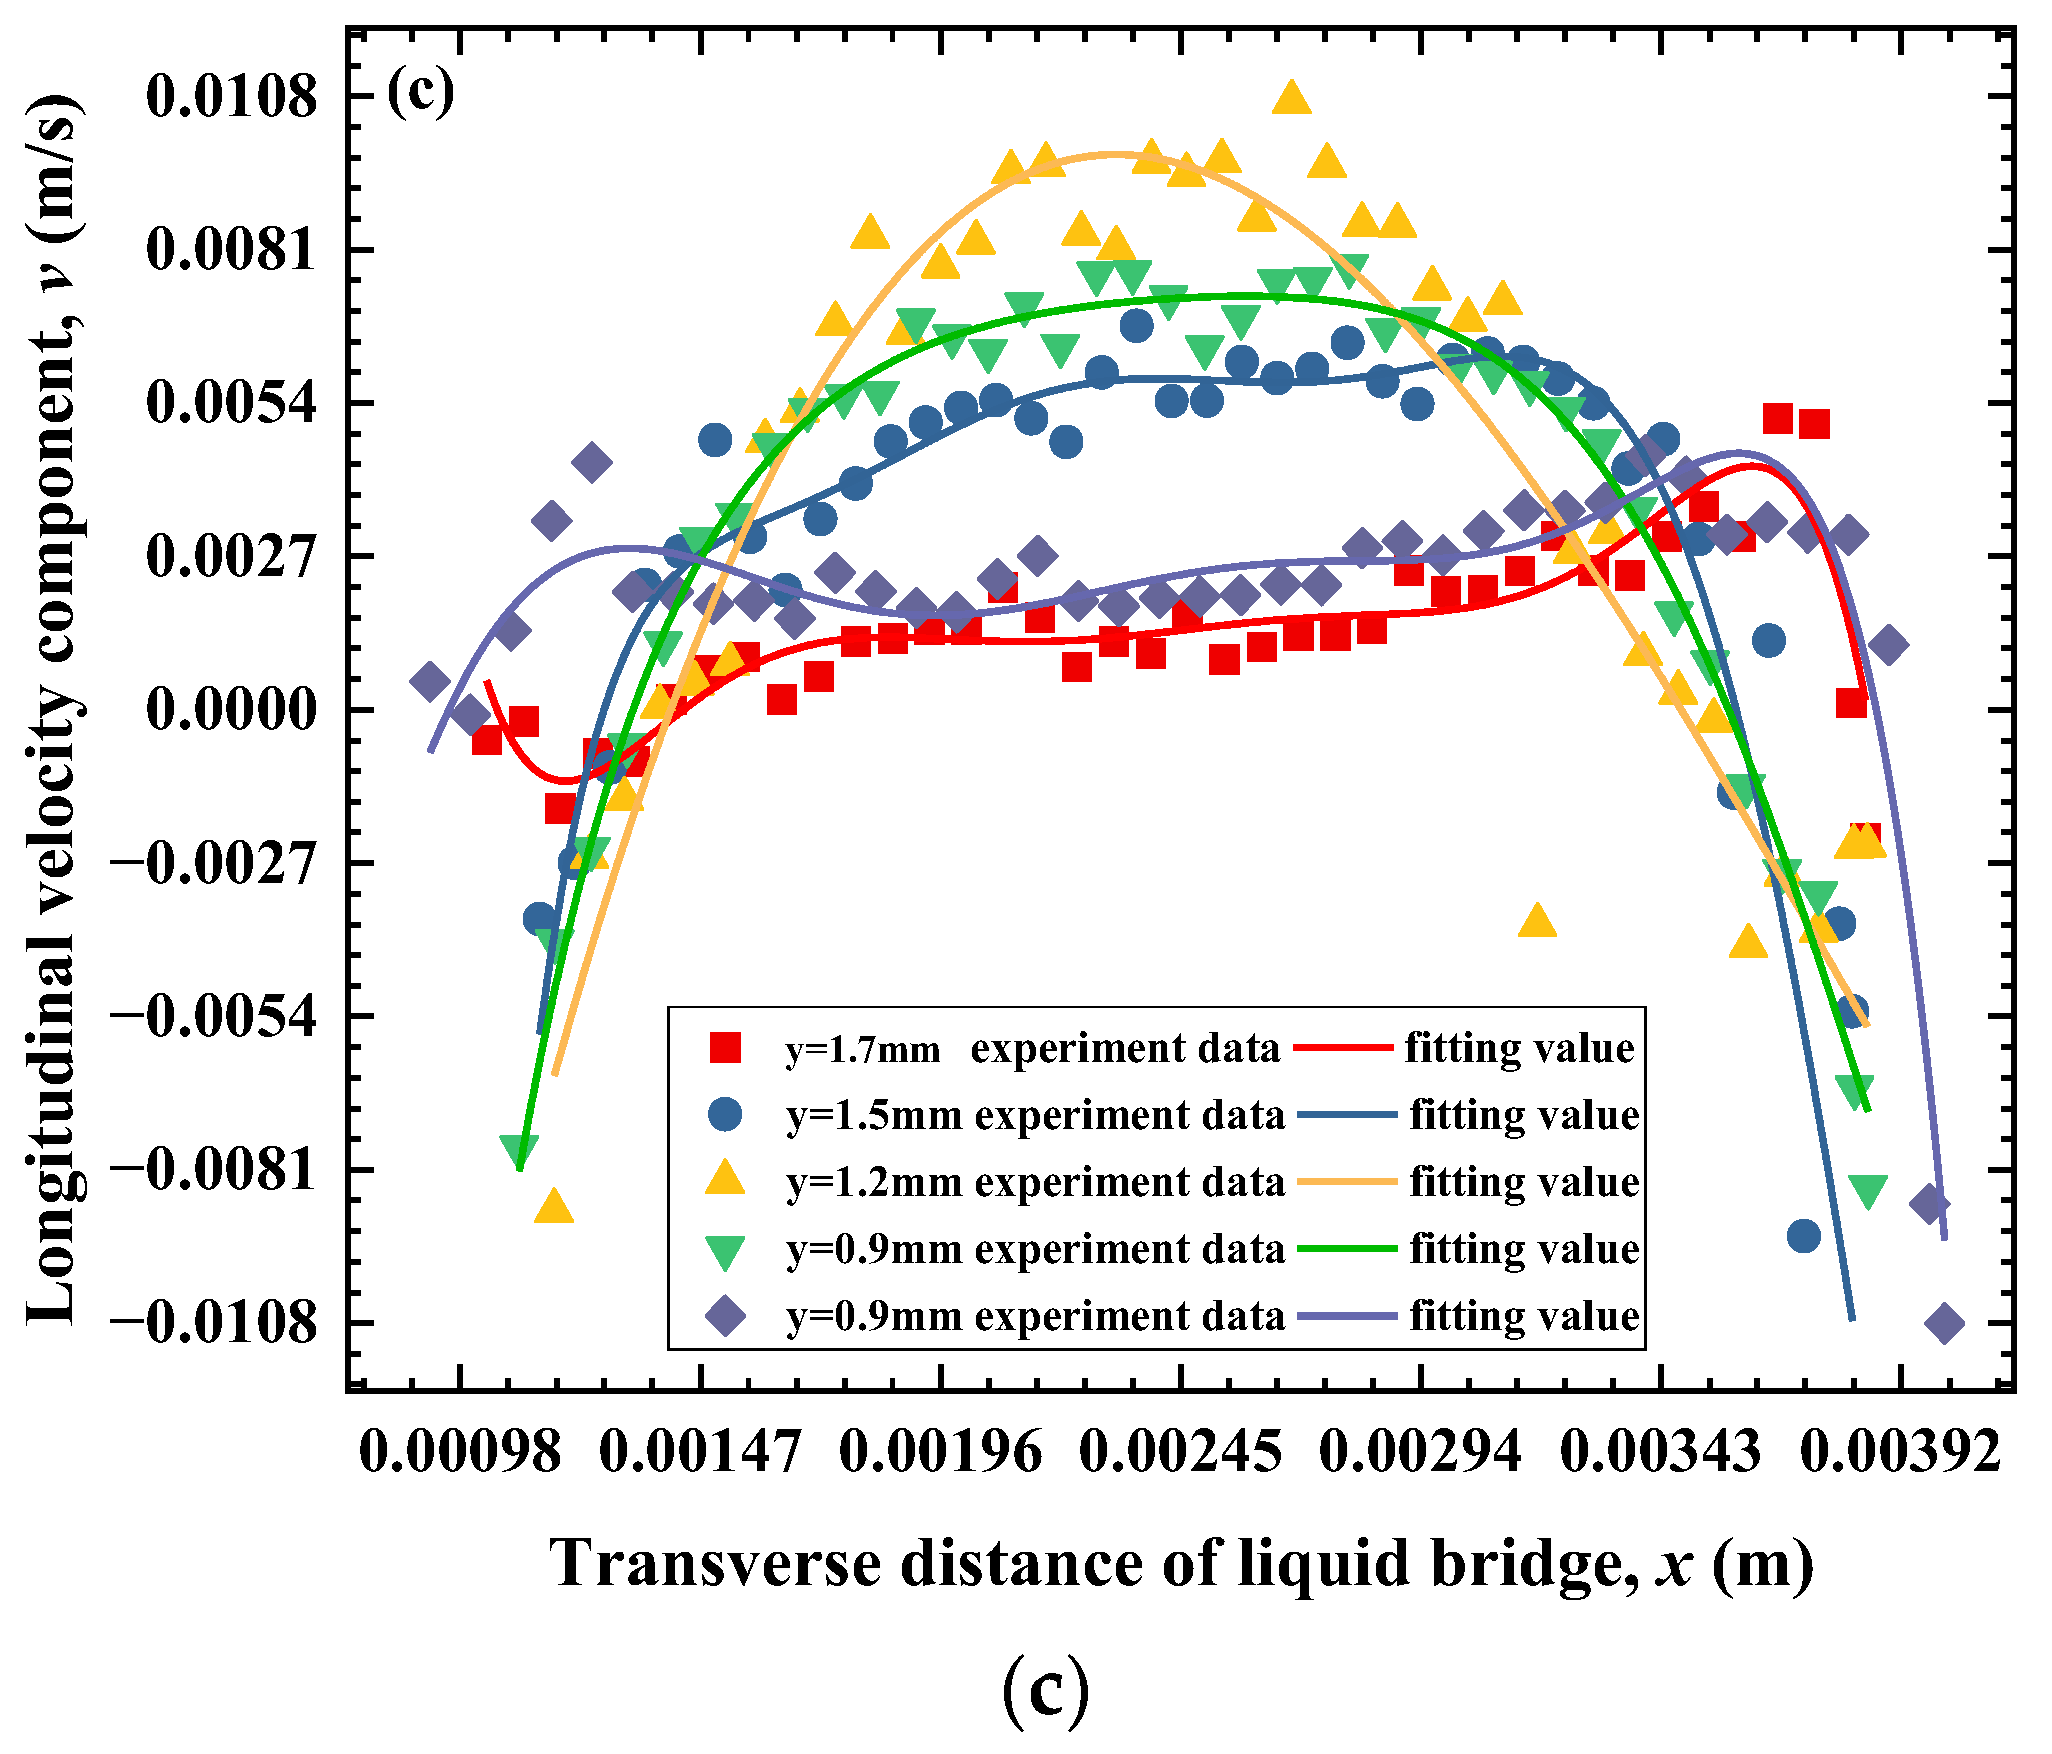
Figure 8 shows the distribution of the longitudinal velocity components at the five liquid bridge heights at the steady stage of the TBCC at t0 (corresponding to the flow state in Figure 3). Similar to the processing of the lateral velocity component, Figure 8 shows the longitudinal velocity component of the average value of the three moments selected under a certain GTA. At y = 1.7 mm and y = 0.6 mm, the distribution of the longitudinal velocity component is relatively flat near the upper and lower disks (or near the hot and cold disks), and the longitudinal velocity component is almost 0 (v = 0 m/s). The longitudinal velocity component near the intermediate height (y = 0.9 mm, y = 1.2 mm, y = 1.5 mm) of the liquid bridge is larger, showing a single-peak “П”-type. When approaching the intermediate height of the liquid bridge, the position is (y = 1.2 mm), and the wave crest length of the velocity curve along the radial direction becomes narrower. The wave-crest length of the longitudinal velocity component is narrowest at y = 1.2 mm.
As the GTA increases, the influence range of cell flow in the stable TBCC is suppressed, resulting in a decrease in the velocity gradient of the longitudinal velocity component at each height and a significant decrease in the peak value of the longitudinal velocity component (at y = 0.9 mm, y = 1.2 mm, and y = 1.5 mm), as listed in Table 6. The longitudinal velocity components close to the upper and lower disks (y = 1.7 mm and y = 0.6 mm) gradually trend toward zero (v= 0 mm/s). As GTA increases, the wave crest length of the longitudinal velocity component near the intermediate height (y = 0.9 mm and y = 1.5 mm) of the liquid bridge gradually decreases, and the wave crest length attenuation of the longitudinal velocity component is the most obvious at the intermediate height of y = 1.2 mm.
(2)
Oscillation stage of thermal-buoyancy capillary convection
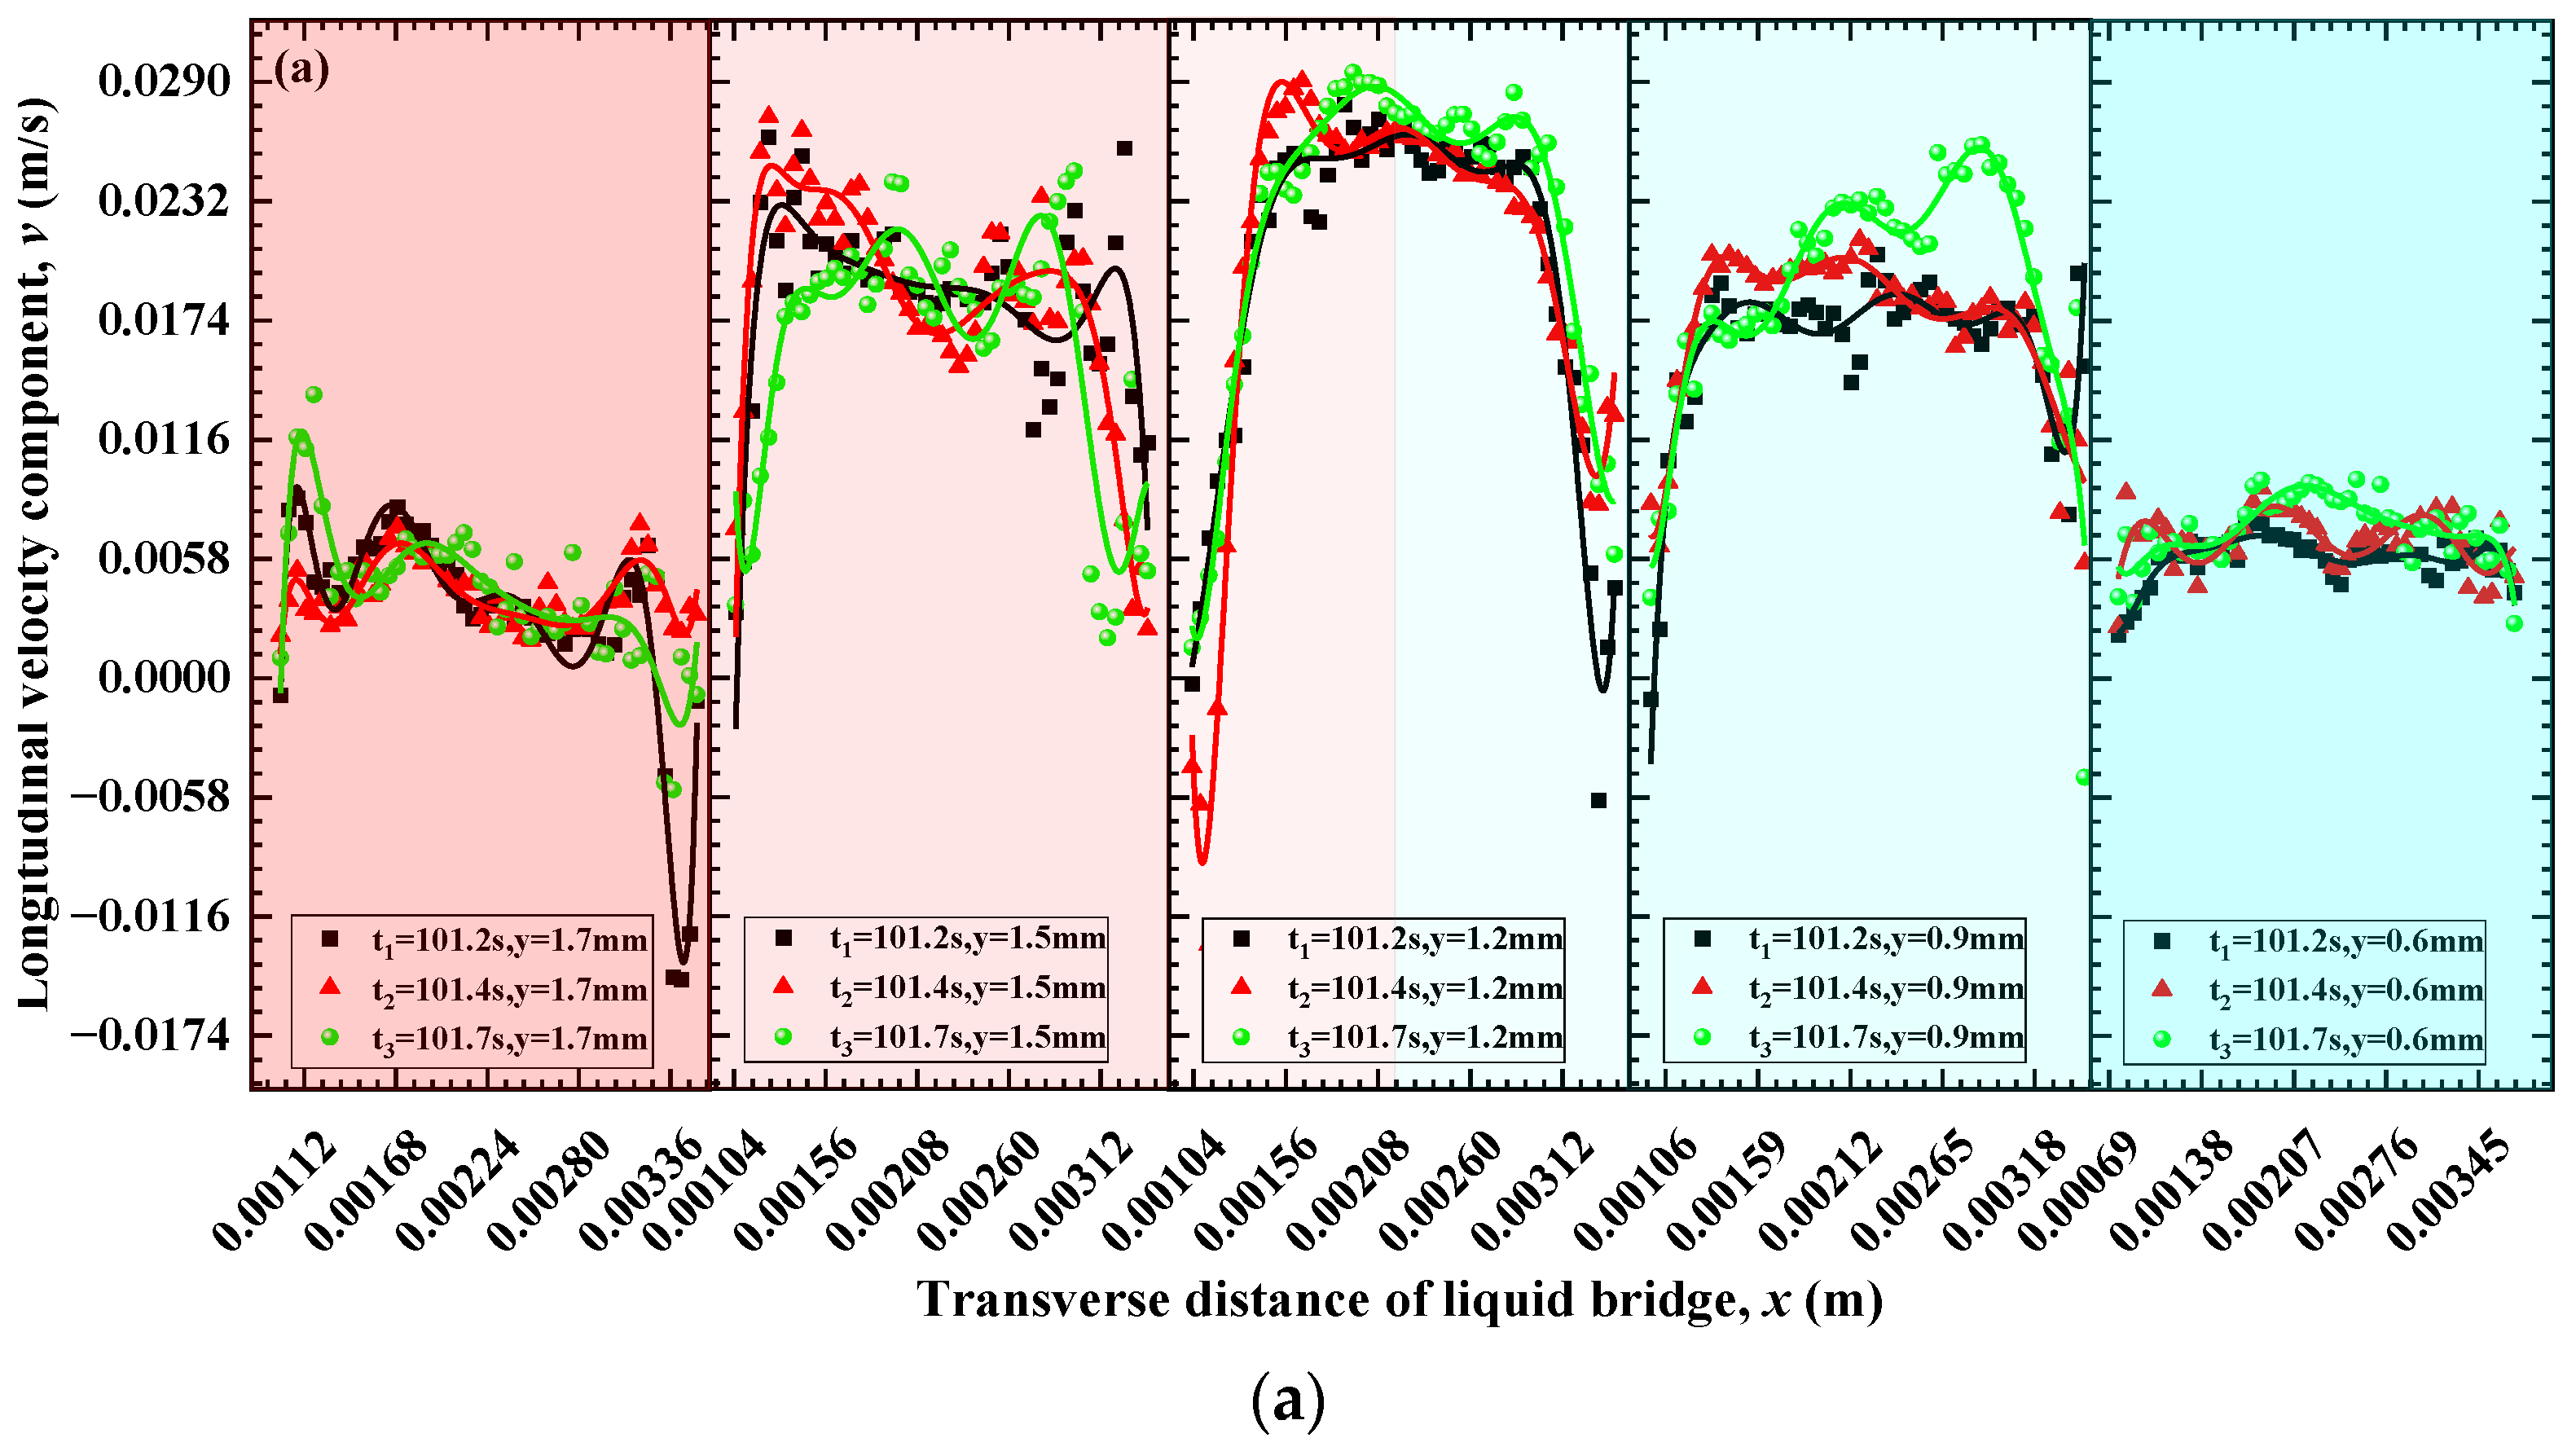
Figure 9 shows the distribution of the longitudinal velocity component at the five liquid bridge heights in one oscillation period (t1, t2, t3) of the oscillating TBCC. The distribution of the longitudinal velocity component in the radial direction presents an irregular “M”-type, and the longitudinal velocity component fluctuates significantly near the free surface. Compared to the longitudinal velocity components at other heights, the longitudinal velocity component is higher at the intermediate height (y = 1.2 mm) of the liquid bridge.
With the application of GTA, the range of influence of the cell flow is suppressed. The vortex cores of the left and right cells gradually narrow and move to the free interface. The vortex cores of the left and right cell flows are kept away from the intermediate height and move towards the corner zone of the upper or lower disk, which increases the alternating flow region in the core zone of the liquid bridge, suppresses the longitudinal velocity component, and gradually reduces the velocity gradient of the longitudinal velocity component at different heights. With the application of GTA, the symmetrical central axis of the cell flow shifts, the curvature radii of the left and right interfaces change unevenly, and the distribution of the longitudinal velocity component is transferred to the right side of the liquid bridge (on the near ground side) as a whole. The distribution of the longitudinal velocity component changes from the multi-peak morphology to the “two peaks and one valley” morphology (“M”-type).
Marangoni number is an important dimensionless parameter for TBCC in the present experimental configuration with a free surface, defined by Ma = δTΔTR/ρυκ, where R denotes the characteristic length (the liquid bridge minimum radius, R = 3.6 mm), δT denotes the variation coefficient of surface tension with the temperature, ΔT denotes the temperature difference between the upper and lower disks, ρ denotes the density of silicone oil, υ denotes kinematic viscosity of silicone oil, and κ denotes the thermal diffusion coefficient. Furthermore, Macr denotes the critical Marangoni number at the critical temperature difference ΔTcr. As shown in Figure 10, with the application of gravitational inclination, the dynamic Bond number gradually decreases (Bo′dyn < 1), the buoyancy effect due to the gravitational field is weakened, and the interface morphology and flow are dominated by capillary forces. With a decrease in the dynamic Bond number (as the inclination angle gradually increases), the Marangoni number increases, indicating that the critical Marangoni number at the onset of the oscillatory thermocapillary convection increases (Macr,10° > Macr,5°). This further demonstrates that the instability of the internal surface energy aids in suppressing the development of oscillatory thermal buoyant capillary convection.

4. Conclusions

In this study, the experimental observation object is the TBCC phenomenon of micron scale in the liquid bridge, and the influence of the interfacial energy instability formed by the GTA on the spatiotemporal evolution of flow pattern and velocity distribution of the TBCC is examined. The conclusions are as follows.
(1)
With the application of the GTA, the left and right interface shapes of the liquid bridge gradually become unbalanced, the curvature radius of the interface on the left (on the far ground side) decreases, and the concave degree of the interface on the right (on the near ground side) increases. Compared with the condition of φ = 0°, the development of cell flow is obviously suppressed in the stable TBCC under GTA of 5° and 10°, but the cell flow morphology still presents an axisymmetric liquid bridge morphology. The left-cell flow (on the far ground side) distorts, and the vortex core morphology is long, narrow and flat. In the oscillating TBCC, the cell flow morphology is restrained, and the deviation of left and right cell flow vortex cores from the intermediate height (y = 1.2 mm) is gradually increased under the application of the GTA, and the scope of the alternating flow in the middle part of the liquid bridge gradually expands.
(2)
Furthermore, the Bo′ydn remains unchanged under the condition of φ = 0°. Conversely, when GTA is φ = 5° or φ = 10°, the Bo′ydn gradually decreases (Bo′ydn,5°= 0.041→0.039→0.037 and Bo′ydn,10° = 0.035→0.034→0.033) with the development of oscillating TBCC. The transverse and longitudinal velocity component at different heights is suppressed, and the position of the velocity peak gradually approaches that of the free interface. In the oscillating TBCC, the disturbance of transverse/longitudinal velocity component is significantly suppressed over time by the GTA, and the distribution of the longitudinal velocity component along the radial direction changes from the multi-peak morphology to the “two peaks and one valley” morphology (“M”-type).
(3)
With the application of gravitational inclination, the dynamic Bond number gradually decreases (Bo′dyn < 1), the oscillation period of TBCC gradually increases (T = 0.46 s <T10° = 0.53 s), and the critical temperature difference of oscillating TBCC increases gradually (ΔTcr,0° = 46.1°C < ∆Tcr,5° = 48.9°C < ΔTcr,10° = 56.2°C). Additionally, Macr increases from Macr,5° = 9.36 to Macr,10° = 10.76, therefore, interfacial energy instability delayed the onset of the oscillating TBCC.

Author Contributions

Project administration, R.L. and S.Y.; Conceptualization, R.L.; Methodology, S.Y.; Validation, S.Z. and S.Y.; Writing—original draft preparation, S.Z.; Writing—review and editing, R.L. and S.Y. All authors have read and agreed to the published version of the manuscript.

Funding

The present work is supported financially by the National Natural Science Foundation of China under the grant of 51976087 and 51906163, the Science and Technology Program Foundation of Liaoning Province (2021-MS-270 and LIKZZ20220138), the Shenyang Science and Technology Project (No. 21-108-9-08 and No. RC210010), and the Postgraduate Education and Teaching Reform Research Project in Liaoning Province.

Institutional Review Board Statement

Not applicable.

Informed Consent Statement

Not applicable.

Data Availability Statement

Not applicable.

Conflicts of Interest

The authors declare no conflict of interest.

References

  1. Fukuda, Y.; Ogasawara, T.; Fujimoto, S.; Eguchi, T.; Motegi, K.; Ueno, I. Thermal-flow patterns of m=1 in thermocapillary liquid bridges of high aspect ratio with free-surface heat transfer. Int. J. Heat Mass Tran. 2021, 173, 121196. [Google Scholar] [CrossRef]
  2. Jayakrishnan, R.; Tiwari, S. Dynamic mode decomposition of oscillatory thermo-capillary flow in curved liquid bridges of high Prandtl number liquids under microgravity. Adv. Space Res. 2021, 68, 4252–4273. [Google Scholar] [CrossRef]
  3. Chen, Q.S.; Hu, W.R. Influence of liquid bridge volume on instability of floating half zone convection. Int. J. Heat Mass Tran. 1998, 41, 825–837. [Google Scholar] [CrossRef]
  4. Chen, Q.S.; Hu, W.R.; Prasad, V. Effect of liquid bridge volume on the instability in small Prandtl number half zones. J. Cryst. Growth 1999, 203, 261–268. [Google Scholar] [CrossRef]
  5. Kuhlmann, H.C.; Nienhüser, C.; Rath, H.J.; Yoda, S. Influence of the volume of liquid on the onset of three-dimensional flow in thermocapillary liquid bridges. Phys. Fluids 2002, 29, 639–644. [Google Scholar] [CrossRef]
  6. A Fan, J.G.; Liang, R.Q. Numerical Simulation of Thermocapillary convection in a half-zone liquid bridge model with large aspect ratio under microgravity. Symmetry 2022, 3, 452. [Google Scholar] [CrossRef]
  7. Le, C.C.; Liu, L.J.; Li, Z.Y. Oscillatory thermocapillary convection in deformed half zone liquid bridges of low Prandtl number fluids. Int. Commun. Heat Mass 2021, 127, 105499. [Google Scholar] [CrossRef]
  8. Brulin, S.; Tropea, C.; Roisman, I.V. Pinch-off of a viscous liquid bridge stretched with high Reynolds numbers. Colloid Surf. A. 2020, 587, 124271. [Google Scholar] [CrossRef]
  9. Meseguer, J.; Espino, J.L.; Perales, J.M.; Laverón-Simavilla, A. On the breaking of long, axisymmetric liquid bridges between unequal supporting disks at minimum volume stability limit. Eur. J. Mech. B-Fluid 2003, 22, 355–368. [Google Scholar] [CrossRef]
  10. Lapuerta, V.; Laverón-Simavilla, A.; Rodríguez, J. Stability of liquid bridges subject to an eccentric rotation. Adv. Space Res. 2008, 44, 2137–2144. [Google Scholar] [CrossRef] [Green Version]
  11. Laverón, S.A.; Perales, J.M. Equilibrium shapes of non-axisymmetric liquid bridges of arbitrary volume in gravitational fields and their potential energy. Phys. Fluids 1995, 6, 1204–1213. [Google Scholar] [CrossRef]
  12. Laverón, S.A.; Checa, E. Effect of a lateral gravitational field on the nonaxisymmetric equilibrium shapes of liquid bridges held between eccentric disks and of volumes equal to those of cylinders. Phys. Fluids 1997, 9, 817–822. [Google Scholar] [CrossRef]
  13. Lowry, B.J. Modes of nonaxisymmetry in the stability of fixed contact line liquid bridges and drops. J. Colloid Interf. Sci. 2000, 224, 28–46. [Google Scholar] [CrossRef] [PubMed]
  14. Ataei, M.; Tang, T.; Amirfazli, A. Motion of a liquid bridge between nonparallel surfaces. J. Colloid Interf. Sci. 2017, 492, 218–228. [Google Scholar] [CrossRef]
  15. Bian, X.H.; Huang, H.B.; Chen, L. Influence of liquid bridge formation process on its stability in nonparallel plates. Rsc. Adv. 2020, 10, 20138–20144. [Google Scholar] [CrossRef]
  16. Rodriguez, J.; Lapuerta, V.; Laveron-Simavilla, A.; Cordero-Gracia, M. Experimental and numerical analysis of non-symmetric breakage of liquid columns in an axial gravitational field rotating around an eccentric axis. Adv. Space Res. 2014, 53, 63–70. [Google Scholar] [CrossRef]
  17. Le, C.; Liu, L.; Li, Z. Numerical investigation of the effect of rotation on the oscillatory thermocapillary convection and dopant transport in a silicon liquid bridge. J. Cryst. Growth 2019, 523, 125149. [Google Scholar] [CrossRef]
  18. Wu, D.L.; Zhou, P.; Wang, G.; Zhao, B.J.; Howes, T.; Chen, W. Modeling of capillary force between particles with unequal contact angle. Powder Technol. 2020, 376, 390–397. [Google Scholar] [CrossRef]
  19. Wang, Y.; Zeng, Z.; Liu, H.; Zhang, L.Q.; Yin, L.M.; Xiao, Y.; Liu, Y. Flow instabilities in thermocapillary liquid bridges between two coaxial disks with different radii. Int. J. Heat Mass Tran. 2022, 183, 122182. [Google Scholar] [CrossRef]
  20. Chen, J.; Wang, P.P.; Li, M.R.; Shen, J.H.; Howe, T.; Wang, G. Rupture distance and shape of the liquid bridge with rough surface. Miner. Eng. 2021, 167, 106888. [Google Scholar] [CrossRef]
  21. Yang, S.; Qin, D.C.; Zhang, Y.P.; Xu, L.; Fu, Y.D.; Cui, J.; Pan, H. Experimental study on the influence of gravitational tilt angle on the spatio-temporal evolution of solutocapillary convection. Symmetry 2022, 12, 2485. [Google Scholar] [CrossRef]
  22. Kang, Q.; Duan, L.; Hu, W.R. Experimental study of surface deformation and flow pattern on buoyant-thermocapillary convection. Microgravity Sci. Tec. 2004, 15, 18–24. [Google Scholar] [CrossRef]
  23. Ciappi, L.; Stebel, M.; Smolka, J.; Cappietti, L.; Manfrida, G. Analytical and Computational Fluid Dynamics Models of Wells Turbines for Oscillating Water Column Systems. J. Energy Resour. Technol. 2022, 144, 050903. [Google Scholar] [CrossRef]
  24. Chen, K.P. Interfacial energy balance equation for surface-tension-driven Bénard convection. Phys. Rev. Lett. 1997, 78, 4395–4397. [Google Scholar] [CrossRef]
  25. Rice, O.K. Molecular theory of gases and liquids. J. Am. Chem. Soc. 1955, 77, 2031–2032. [Google Scholar] [CrossRef]
Figure 1. Physical model (liquid bridge) under GTA.
Symmetry 15 00506 g001
Figure 2. Experimental platform of Marangoni convection of the liquid bridge: (1) Macro close focus lens; (2) High-speed camera; (3) Mobile bracket of high-speed camera; (4) Multi-channel temperature collector; (5) Adjustable laser lens; (6) Rotating bracket of the liquid bridge; (7) Liquid bridge zone; (8) Coil spring heater; (9) Liquid bridge disks: A. The upper disk (hot disk), B. The lower disk (cold disk).
Symmetry 15 00506 g002
Figure 3. Steady stage of TBCC under different GTAs: (a) φ = 0°, ∆T0 = 13.3 °C, t0 = 47.0 s; (b) φ = 5°, ∆T0 = 13.3 °C, t0 = 47.1 s; (c) φ = 10°, ∆T0 = 13.3 °C, t0 = 47.3 s.
Symmetry 15 00506 g003
Figure 4. Oscillating TBCC under different GTAs: (a) φ = 0°, ∆T1 = 46.1 °C, t1 = 101.23 s; (b) φ = 0°, ∆T2 = 46.2 °C, t2 = 101.42; (c) φ = 0°, ∆T3 = 46.3 °C,t3 = 101.69 s; (d) φ = 5°, ∆T1 = 48.9 °C, t1 = 99.23 s; (e) φ = 5°, ∆T2 = 50.0 °C, t2 = 99.51 s; (f) φ = 5°, ∆T3 = 51.9 °C, t3 = 99.72 s; (g) φ = 10°, ∆T1 = 56.2 °C, t1 = 112.21 s; (h) φ = 10°, ∆T2 = 57.5 °C, t2 = 112.39 s; (i) φ = 10°, ∆T3 = 58.1 °C, t3 = 112.74 s.
Symmetry 15 00506 g004
Figure 5. Dynamic Bond number variation in oscillation stage of TBCC under different GTAs.
Symmetry 15 00506 g005
Figure 6. Radial variation of transverse velocity component at different heights of the liquid bridge under the time of t0: (a) φ = 0°, t0 = 46.7 s, t0′ = 47.0 s, and t0′’ = 47.3 s; (b) φ = 5°, t0 = 46.8 s, t0′ = 47.1 s, and t0′’ = 47.4 s; (c) φ = 10°, t0 = 47.0 s, t0′ = 47.3 s and, t0′’ = 47.6 s.
Symmetry 15 00506 g006
Figure 7. Radial variation of transverse velocity component at five heights of the liquid bridge (y = 1.7 mm, y = 1.5 mm, y = 1.2 mm, y = 0.9 mm, y = 0.6 mm) under the time of t1, t2, and t3: (a) φ = 0°; (b) φ = 5°; (c) φ = 10°.
Symmetry 15 00506 g007
Figure 8. Radial variation of longitudinal velocity component at different heights of the liquid bridge under the time of t0: (a) φ = 0°, t0 = 46.7 s, t0′ = 47.0 s, and t0′’ = 47.3 s; (b) φ = 5°, t0 = 46.8 s, t0′ = 47.1 s, and t0′’ = 47.4 s; (c) φ = 10°, t0 = 47.0 s, t0′ = 47.3 s, and t0′’ = 47.6 s.
Symmetry 15 00506 g008aSymmetry 15 00506 g008b
Figure 9. Radial variation of longitudinal velocity component at five heights of the liquid bridge (y = 1.7 mm, y = 1.5 mm, y = 1.2 mm, y = 0.9 mm, y = 0.6 mm) under the time of t1, t2, and t3. (a) φ = 0°; (b) φ = 5°; (c) φ = 10°.
Symmetry 15 00506 g009aSymmetry 15 00506 g009b
Figure 10. The relationship between Marangoni number and dynamic Bond number.
Symmetry 15 00506 g010
Table 1. Physical parameters of KF96-10cSt methyl silicone oil (T = 25 °C).
ParametersUnitKF96-10cSt
Density,ρ[kg/m3]940
Kinematic viscosity,ν[m2/s]10
Dynamic viscosity,μ[Pa·s]9.4× 10⁻³
Refractive index,β[–]1.399
Thermal expansion rate,γ[1/°C]1.06 × 10−3
Thermal conductivity,κ[W/m·K]0.14
Thermal diffusivity,α[m2/s]8.91 × 10−8
Surface tension,σ[N/m]0.0201
Specific heat, Cp[J/(kg·°C)]1672
Table 2. Physical parameters of tracer particle, PF.
ParametersUnitPF
Diameter, d[μm]8.5
Density, ρ[g/cm3]3.43
Refractive index, β[–]2.0
Maximum flow velocity, U m a x l [m/s]1.6 × 10−3
Stokes number, St[–]1.12 × 10⁻⁸
Table 3. Comparison of five groups of parallel experimental data.
No.Actual Volume of Liquid Bridge, V (μL)Critical Temperature Difference in Corner Region, ΔTcr (°C)Oscillation Period,
T (s)
Interface Average Velocity in Hot Corner Region, V (m/s)
12338.50.820.0 × 10−3
22439.10.815.0 × 10−3
32440.10.915.0 × 10−3
42338.40.817.5 × 10−3
52339.60.720.0 × 10−3
Mean value23.439.10.817.5 × 10−3
Mean square error0.240.66 × 10−32.2 × 10⁻³
Note: Position coordinates of monitoring points in corner area (0.00375 m, 0.0016 m).
Table 4. Positive peak of transverse velocity component under different GTAs at the time of t0.
GTAPositive Peak of Transverse Velocity Component, umax (m/s)
Height, y = 1.7 mmHeight, y = 1.5 mmHeight, y = 0.9 mmHeight, y = 0.6 mm
0.010920.009170.004380.00807
0.011790.009230.004950.00711
10°0.007110.005010.002730.00526
Table 5. Negative peak of transverse velocity component under different GTAs at the time of t0.
GTAAbsolute Peak Value of Transverse Velocity Component, |umax| (m/s)
Height, y = 1.7 mmHeight, y = 1.5 mmHeight, y = 0.9 mmHeight, y = 0.6 mm
0.010350.008010.005610.00948
0.007850.009070.005960.00872
10°0.004650.004950.003670.00633
Table 6. The peak value of longitudinal velocity component under different GTAs at the time of t0.
GTAThe Peak Value of Longitudinal Velocity Component, vmax (m/s)
y = 1.5 mmy = 1.2 mmy = 0.9 mm
0.011430.01470.01016
0.008090.013570.01022
10°0.006210.009770.00728
Disclaimer/Publisher’s Note: The statements, opinions and data contained in all publications are solely those of the individual author(s) and contributor(s) and not of MDPI and/or the editor(s). MDPI and/or the editor(s) disclaim responsibility for any injury to people or property resulting from any ideas, methods, instructions or products referred to in the content.