Article

Creep Properties of Cylinder Metal Rubber under Static Compression at Elevated Temperatures

Institute of Metal Rubber & Vibration Noise, School of Mechanical Engineering and Automation, Fuzhou University, Fuzhou 350116, China
*
Author to whom correspondence should be addressed.
Symmetry 2023, 15(2), 281; https://doi.org/10.3390/sym15020281
Submission received: 25 November 2022 / Revised: 6 January 2023 / Accepted: 16 January 2023 / Published: 19 January 2023
(This article belongs to the Section Engineering and Materials)

Abstract

:
In this study, the creep properties of cylindrical metal rubber (MR) specimen under static compression at elevated temperatures were investigated by a series of creep experiments. The cylindrical MR specimen has a good symmetrical property, and the mechanical properties are consistent in its different axial section. The failure determination parameters of MR under the coupling of thermal and mechanical static load of the forming direction were proposed in four aspects: the overall height, the average stiffness, the energy dissipation, and the variation of the loss factor. The variation patterns of the properties of the MR specimens were investigated with a static load at different temperatures for 324 h. The analytical equipment, including the simultaneous thermal analyzer (TGA/DSC), X-ray diffractometer (XRD), and scanning electron microscope (SEM), were used for material characterization and failure analysis. Based on the results, it is found that there are significant differences in the MR property variations subjected to creep tests at different elevated temperatures. The results indicated that an appropriate heat treatment for MR specimens would improve the creep resistance at elevated temperatures. In addition, the overall height and energy dissipation of the MR specimens were increased, and the average stiffness and the loss factor were decreased under the creep tests at 200 °C and 250 °C. However, under the creep tests at 25 °C, 300 °C, 350 °C, and 400 °C, the overall height, the energy dissipation and the loss factor were decreased, but the average stiffness was increased.

1. Introduction

Metal rubber (MR), as a type of porous material based on metallic material, is usually fabricated from metallic spiral rolls or wires twisted/woven into a blank and compression molding. Due to its substantial elasticity and damping properties being similar to the traditional polymer rubber, it is commonly named ‘metal rubber’ [1,2], and a typical MR specimen is represented in Figure 1a. As shown in Figure 1, MR specimens mostly hold symmetrical shapes in engineering applications. In this case, the mechanical load and vibration could be transmitted by MR specimens more evenly in the work conditions. In addition, the damping effect would be consistent in the different axial sections of MR specimens. Because MR specimens are prepared from metallic materials (stainless steel wires or Ni-base superalloy wires), they exhibit superb corrosion resistance and ageing resistance, and they could also withstand extremely atrocious conditions, such as very high or low temperatures, and radiological and vacuum environments. Hence, MRs have been an excellent alternative to replace traditional polymer rubber products in many extreme environments [3,4], including for vibration damping system design in missile launch platforms, power stations, or engine high temperature piping systems, and vibration isolators in aircraft and aerospace instruments [5].
In general, most applications for MR materials and specimens are used in vibration damping devices or vibration isolators. Much published literature focuses on the establishment of the overall dynamic model [6], the influence of various structural parameters, and the preparation process on the vibration isolation effect [7,8] or the analysis of the dynamic fatigue resistance of vibration isolators [9,10]. However, there is little research [11] about the creep properties of MR specimens in the dampers or equipment with a long-term static load. If MR specimens are subjected to a constant static load over a very long service period, there is a high risk that the creep phenomena (performance degradation) would occur, resulting in the physical dimensions and related mechanical properties of the MR specimens no longer meeting the operating requirements of the damping system in which it is served. Ma et al. [11] conducted compression tests on regular cube MR specimens with a static load at room temperature for up to 4000 h at 10% and 15% deformation of specimen initial height, respectively. According to the experimental results, the overall structural dimensional variations of the MR specimens were within the valid range in the test conditions, while the secant modulus parameter of the MR was found to be out of the valid range after 1000 h of testing at 15% of the deformation value. They pioneered the definition of parameters for determining failure in terms of the variation in the height and the secant modulus parameter of the MR material, and the feasibility of these two parameters was verified by their experimental results.
Moreover, most of the published articles on MR in high-temperature environments conducted a short test time and the test conditions were within vibration systems [12,13,14,15]. Xiao et al. [12] studied the effects of different MR densities, loading amplitudes, and frequencies on the energy dissipation characteristics of MR coated damping structures at different temperatures. Zi et al. [13] established a high-temperature mechanical model of the MR coated damping structure using the equivalent linearization method, and experimentally verified the damping performance of the coated damping structure for different ambient temperatures and different MR densities, as shown in Figure 1b. Li et al. [14] studied the fatigue characteristics of knitted-dapped MR at different loading amplitudes at room temperature (25 °C) and high temperature (300 °C), and characterized the damage evolution process of MR specimens by the average stiffness, equivalent viscous damping coefficient, and its loss factor. Ma et al. [15] tested the performance of shape memory alloy metal rubber (SMA-MR) and discussed its differences with conventional MR in terms of damping and nonlinear stiffness, and this study demonstrated the feasibility of using SMA-MR for active control in rotor dynamics. Actually, the static creep properties of MR at elevated temperatures for a much longer service time were rarely involved up until now.
Figure 1. (a) Typical metal rubber specimen [1]; (b) high-temperature test with MR specimens [13].
Symmetry 15 00281 g001
With the widespread application of MR materials or MR specimens [16], the use of MR in high-temperature work conditions is also increasing quickly. For example, nuclear power stations and many kinds of equipment with high-temperature work conditions require that MR materials could withstand environmental damage with a super long-time service life, in other words, excellent high-temperature creep resistance [17,18]. Hence, in this study, the authors aim to investigate the effect of different temperatures on the creep properties of the cylinder MR specimen by using a specially designed machine, the related evaluation methods and failure determination parameters of MR would be proposed.

2. Parameters for Determining MR Failure

2.1. Selection of Parameters for Determining MR Failure

As reported by Ma et al. [11], the material and structural damage mechanisms of MR material under the static load are different from those in vibration work conditions, and they proposed two evaluation parameters for MR: the overall height and the secant modulus. Physical dimensions of MR specimen are important for installation requirements, so the overall height variation has to be considered. During the initial strain range of the loading stress-strain curve of MR, the curve behaved to be a straight line closely, and the secant modulus (Ks) parameter with a strain value of 10% was considered by Ma et al. for the evaluation and characterization, as shown in Figure 2a. In fact, the average stiffness (K) parameter could represent the variation of mechanical properties of MR with a higher strain range, as shown in Figure 2b. Hence, this study is inclined to select the average stiffness instead. Meanwhile, the observation of the energy dissipation and loss factor variation of MR are also considered to support a more comprehensive investigation of the variation of properties for MR at different temperatures.

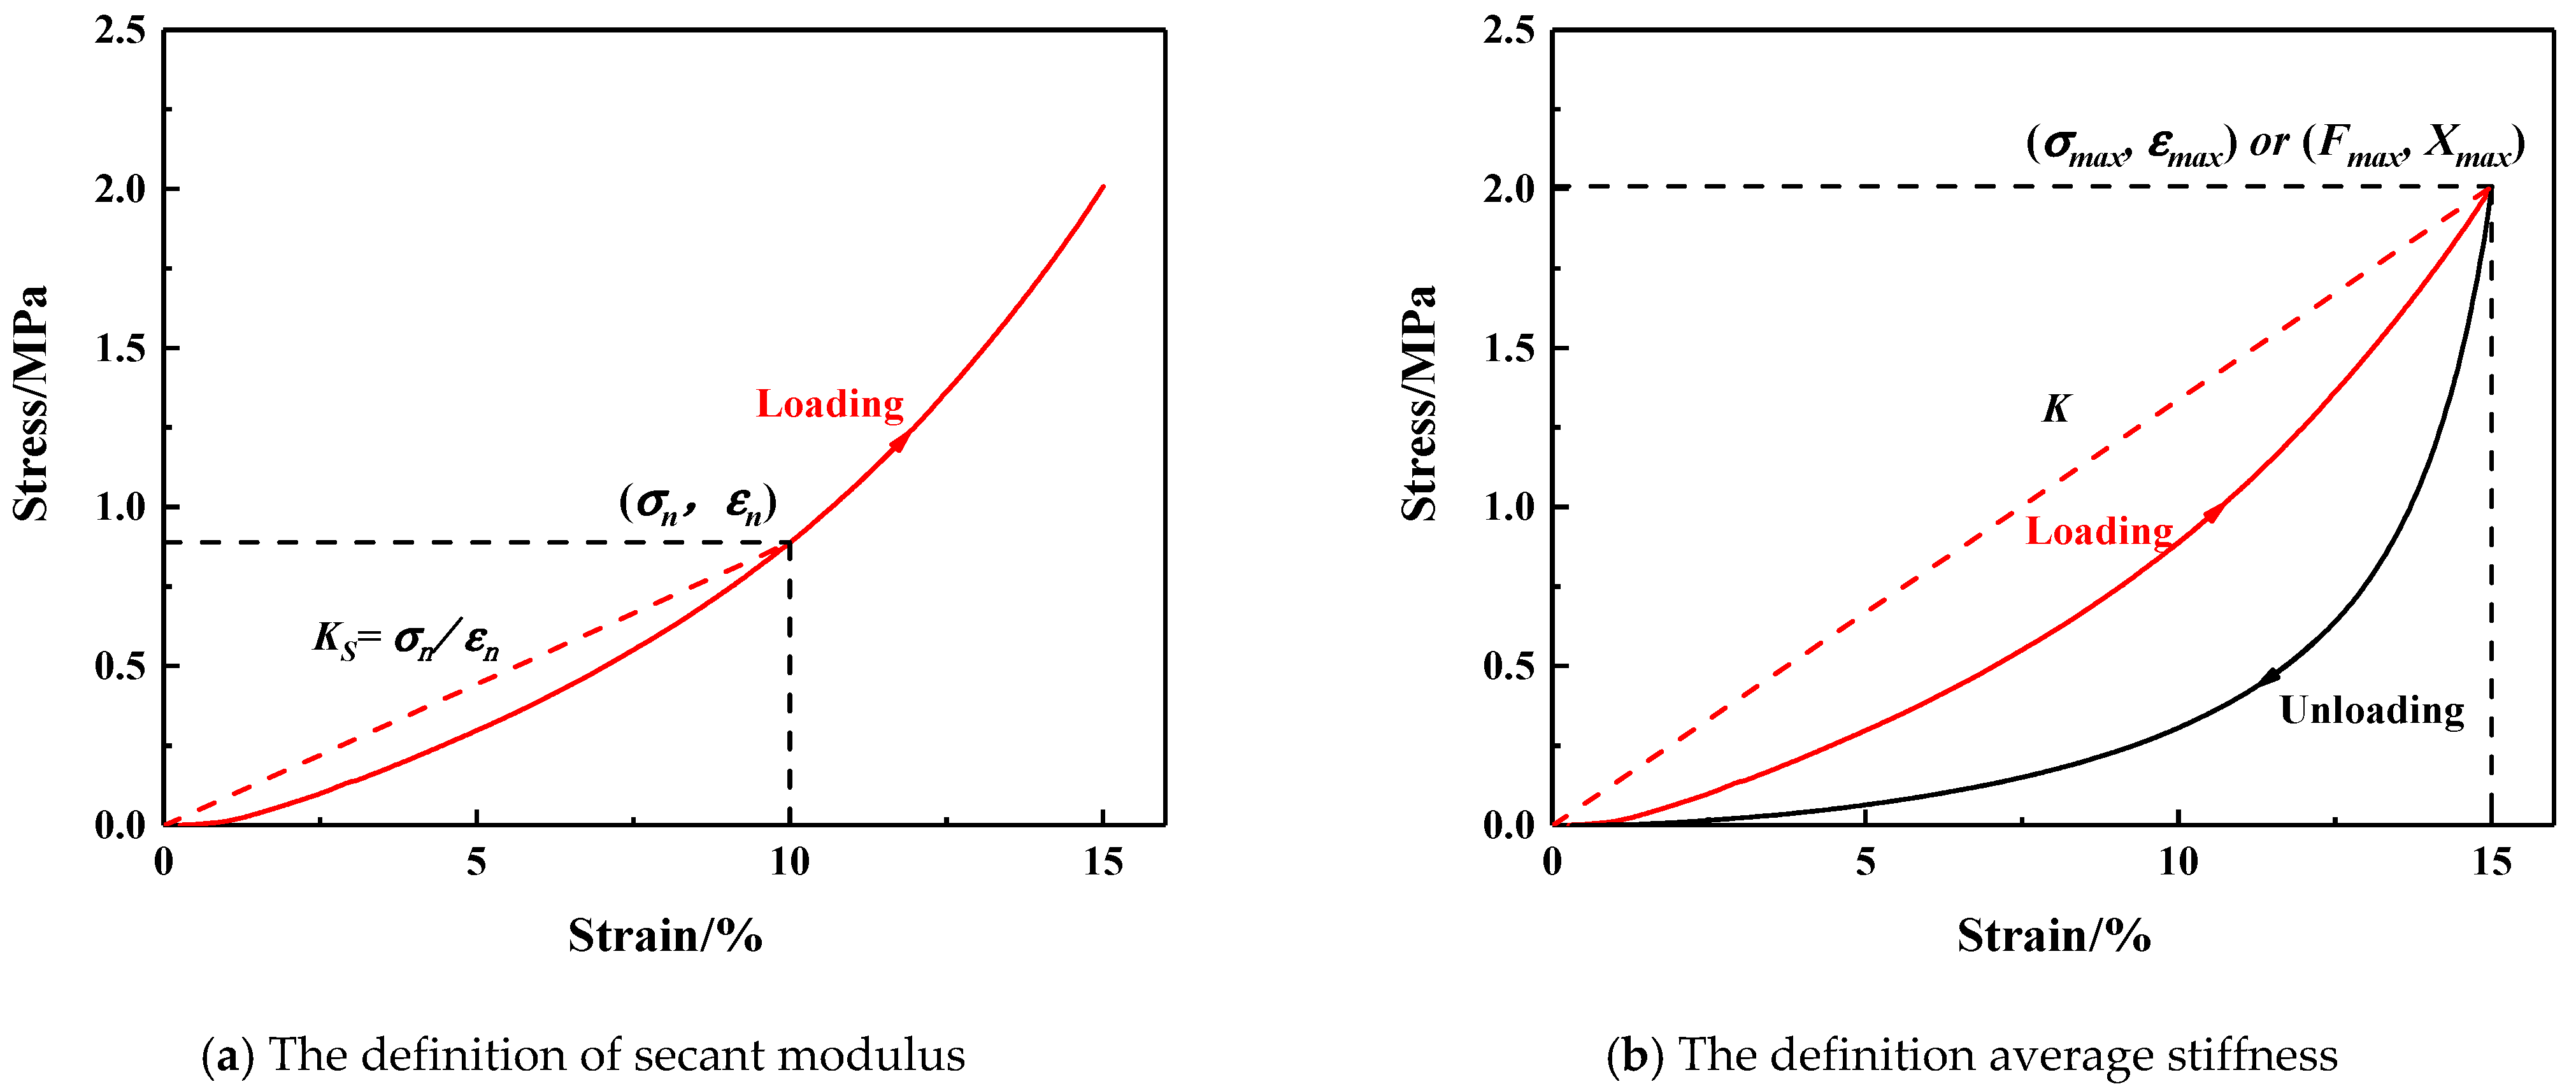
2.2. Characterization of MR Properties with Parameters

Based on the Section 3.1, the four main characterization parameters used to characterize the physical and mechanical properties of MR in this study are proposed as follows.
(1)
Overall height (H-mm)
The overall height (H) of the MR in the direction of forming or non-forming can be obtained by direct measurement. The overall height measured and evaluated in this study is all in the direction of forming (loading bearing) of the MR specimen.
(2)
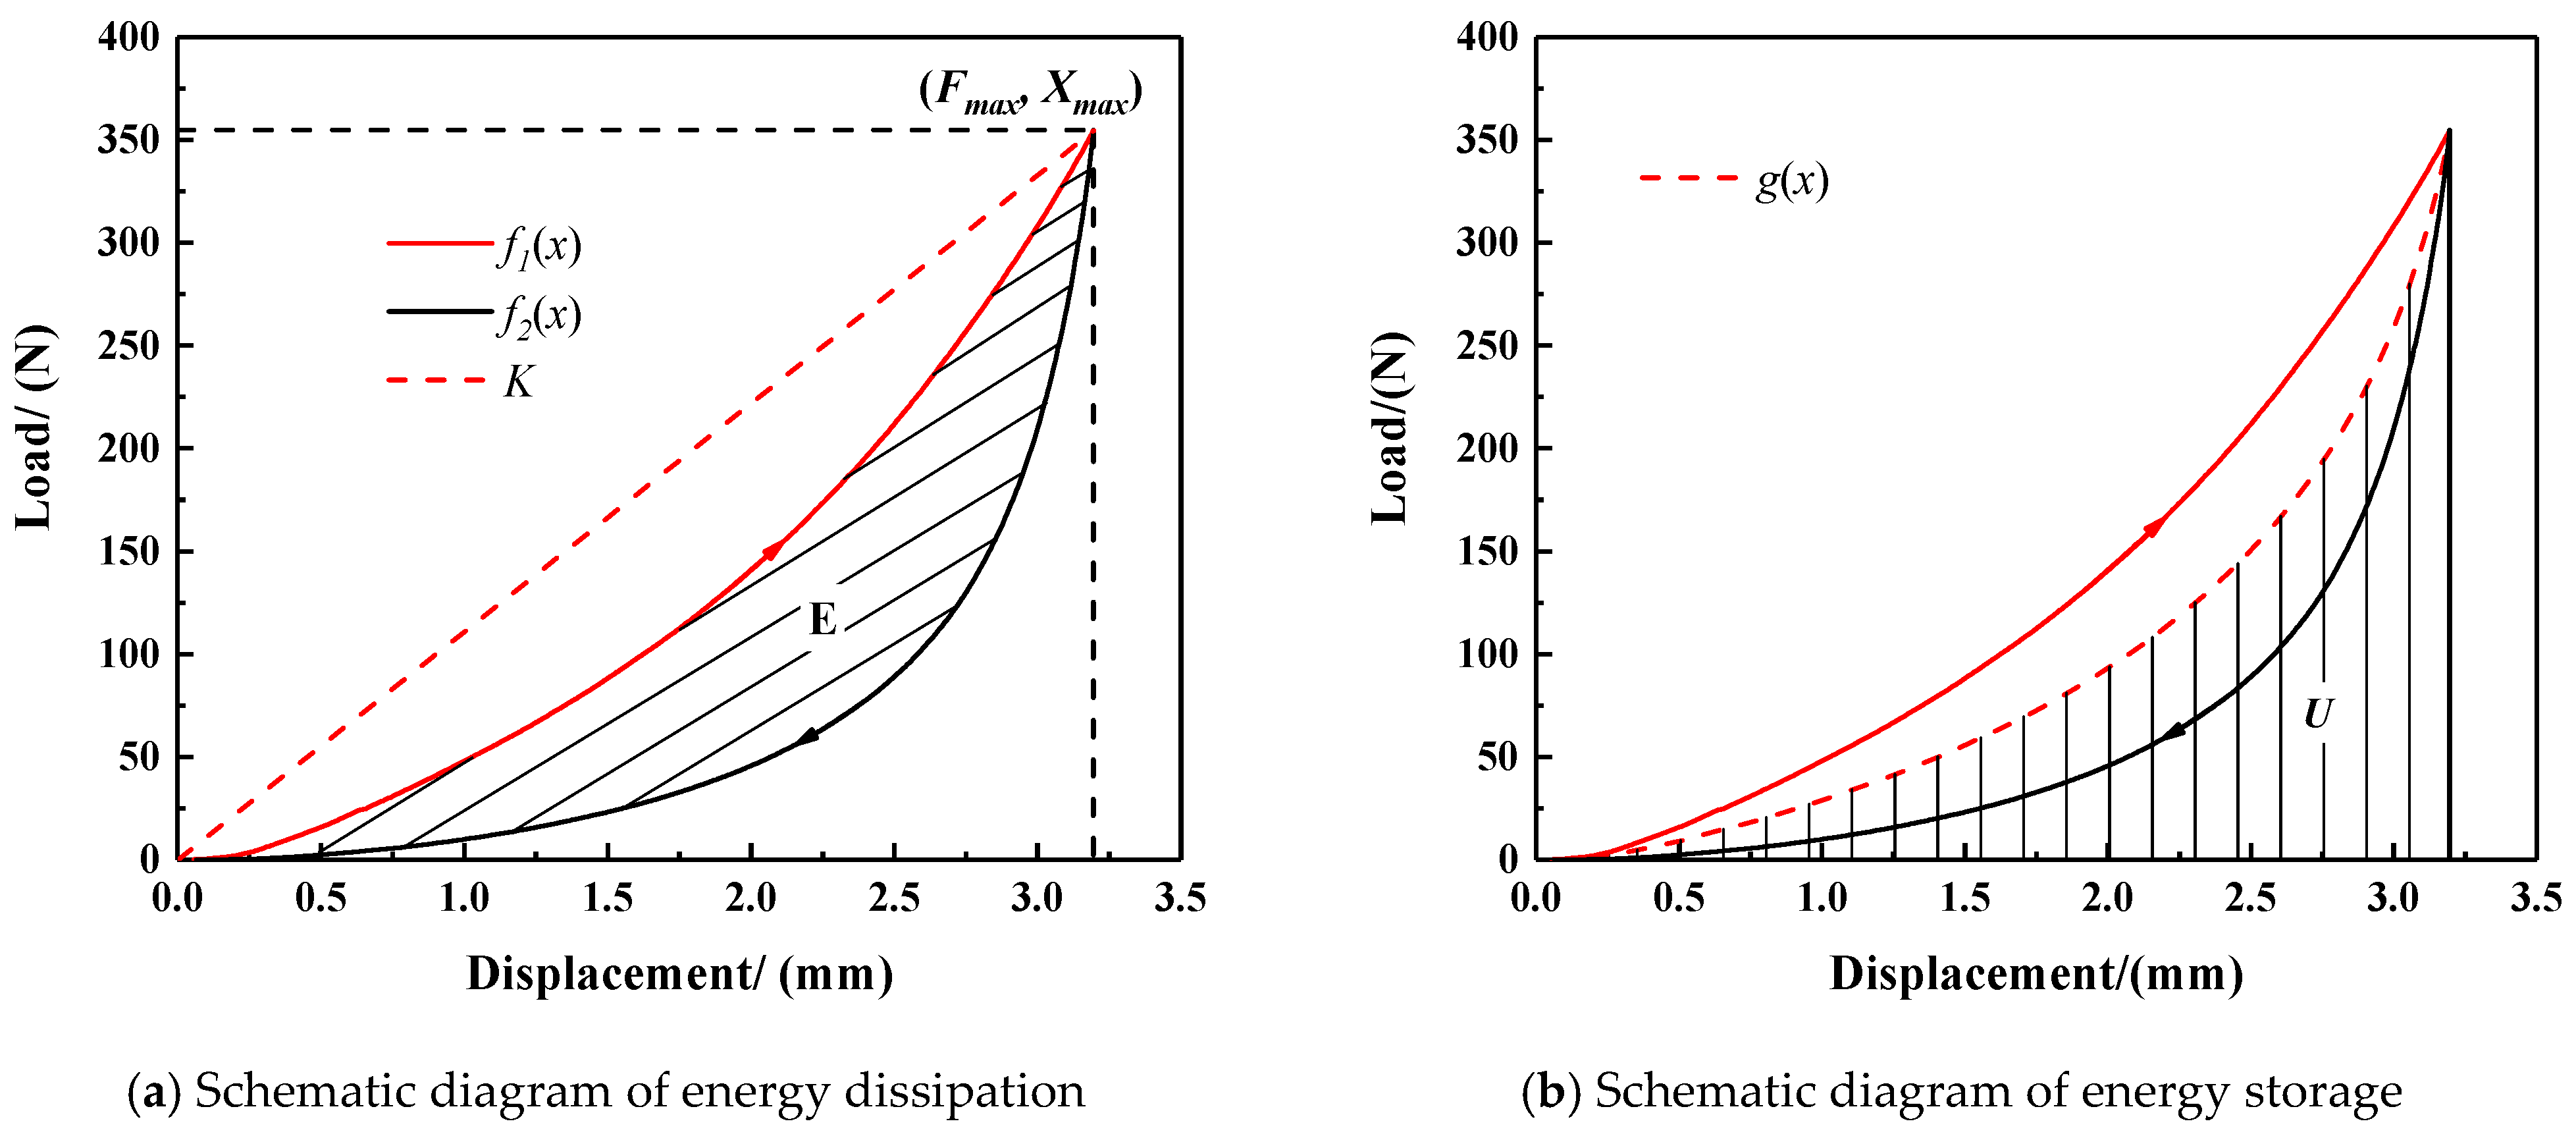
Average stiffness (K-N/mm)
As a MR specimen with nonlinear mechanical properties, it is difficult to find a stiffness function that could directly characterize the non-linear variation behavior of MR. The average stiffness (K) in the quasi-static compression is a more intuitive characterization parameter of the softness and stiffness of MR under a certain deformation. The average stiffness is defined in Equation (1).
K = F m a x X m a x
where X m a x (mm) is the maximum compression displacement during a single quasi-static compression, and F m a x (N) is the axial load required for compression to the maximum displacement.
(3)
Energy dissipation (E-N*mm)
During a quasi-static compression of MR specimen, the energy is dissipated within the MR materials by the damping force. In Figure 3a, the area enclosed between curves of f1(x) and f2(x) could represent the elasticity of the MR in some way. Energy dissipation (E) is expressed in Equation (2).
E = 0 x m a x ( f 1 ( x ) f 2 ( x ) ) d x
(4)
Loss factor (L)
MR specimen is often used as a damping element in the vibration damping/isolation equipment, the loss factor L is used to represent the damping characteristics of the MR. In Figure 3b, the area enclosed between curves of g(x) and the x-axis could represent the maximal energy stored during the quasi-static compression. L can be expressed by the following Equations (3)–(5):
L = E π U
U = 0 x m a x g ( x ) d x
g ( x ) = f 1 ( x ) + f 2 ( x ) 2
where U is the maximal energy stored during a single quasi-static compression.

2.3. Definition of Evaluation Parameters for Determining MR Failure

The four evaluation parameters proposed above can describe and determine the failure of MR, and the following four failure criteria are then proposed: the amplitude of variation in the overall height, the amplitude of variation in the average stiffness, the amplitude of variation in energy dissipation, and the amplitude of variation in the loss factor.
(1)
The amplitude of variation in overall height (h)
h = H T H 0 H 0
where the H 0 is the overall height of MR at the beginning of the creep test, the H T is the overall height of the MR after the T-hour test.
(2)
The amplitude of variation in average stiffness (k)
k = K T K 0 K 0
where the K 0 is the average stiffness of MR at the beginning of the test, and the K T is the average stiffness of the MR after the T-hour test.
(3)
The amplitude of variation in energy dissipation (e)
e = E T E 0 E 0
where the E 0 is the energy dissipation of MR at the beginning of the test, and the E T is the energy dissipation of the MR after the T-hour test.
(4)
The amplitude of variation in loss factor (l)
l = L T L 0 L T
where the L 0 is the loss factor of MR at the beginning of the test, and the L T is the loss factor of the MR after the T-hour test.

2.4. Determination of Failure Thresholds for Evaluation Parameters of MR Failure

Whether the failure of MR specimen occur or not during the creep tests, it should be evaluated by using the four evaluation parameters mentioned above. In this study, the failure thresholds for each evaluation parameter should be determined based on the working conditions and service requirements of MR specimens.
(1)
The failure threshold for h is ±10%. It is necessary to ensure that the overall height of the MR specimen could remain at least at 90% and at most at 110% of its designed initial overall height in an unrestrained state. Hence, MR would not behave with a serious variation in overall height of physical dimensions in the damping/isolation system, and this could avoid installation problems in the whole system. In order to improve the measurement accuracy, a high-accuracy vernier caliper was used to measure the overall height value five times. Then, the average value was determined as the result of each measurement.
(2)
The failure threshold for k is ±30%. The amplitude of the average stiffness indicates how soft or stiff the MR is during its service. If k exceeds this threshold range, excessive boundary excursions would be generated in the system where the MR is installed, which could have a significantly detrimental effect on the resonant frequency of the whole system.
(3)
The failure threshold for e is ±30%. The variation in energy dissipation is inversely related to the variation in average stiffness; with an increase of average stiffness, the stiffness of the MR is increased and the energy dissipation is decreased, and vice versa.
(4)
The failure threshold for l is ±20%. The variation in the loss factor indicates the variation in the damping properties of the MR, a higher value of a loss factor means a high damping level. A reduction in the damping properties of the MR will lead to an increase in the resonance transfer rate of the whole system. Hence, in order to avoid an excessive resonance transfer rate of the working system, the amplitude of variation in the loss factor should be less than 20%.
In summary, when one of the evaluation parameters, which were presented above, exceeds the failure threshold, the failure behavior of the sample can be determined.

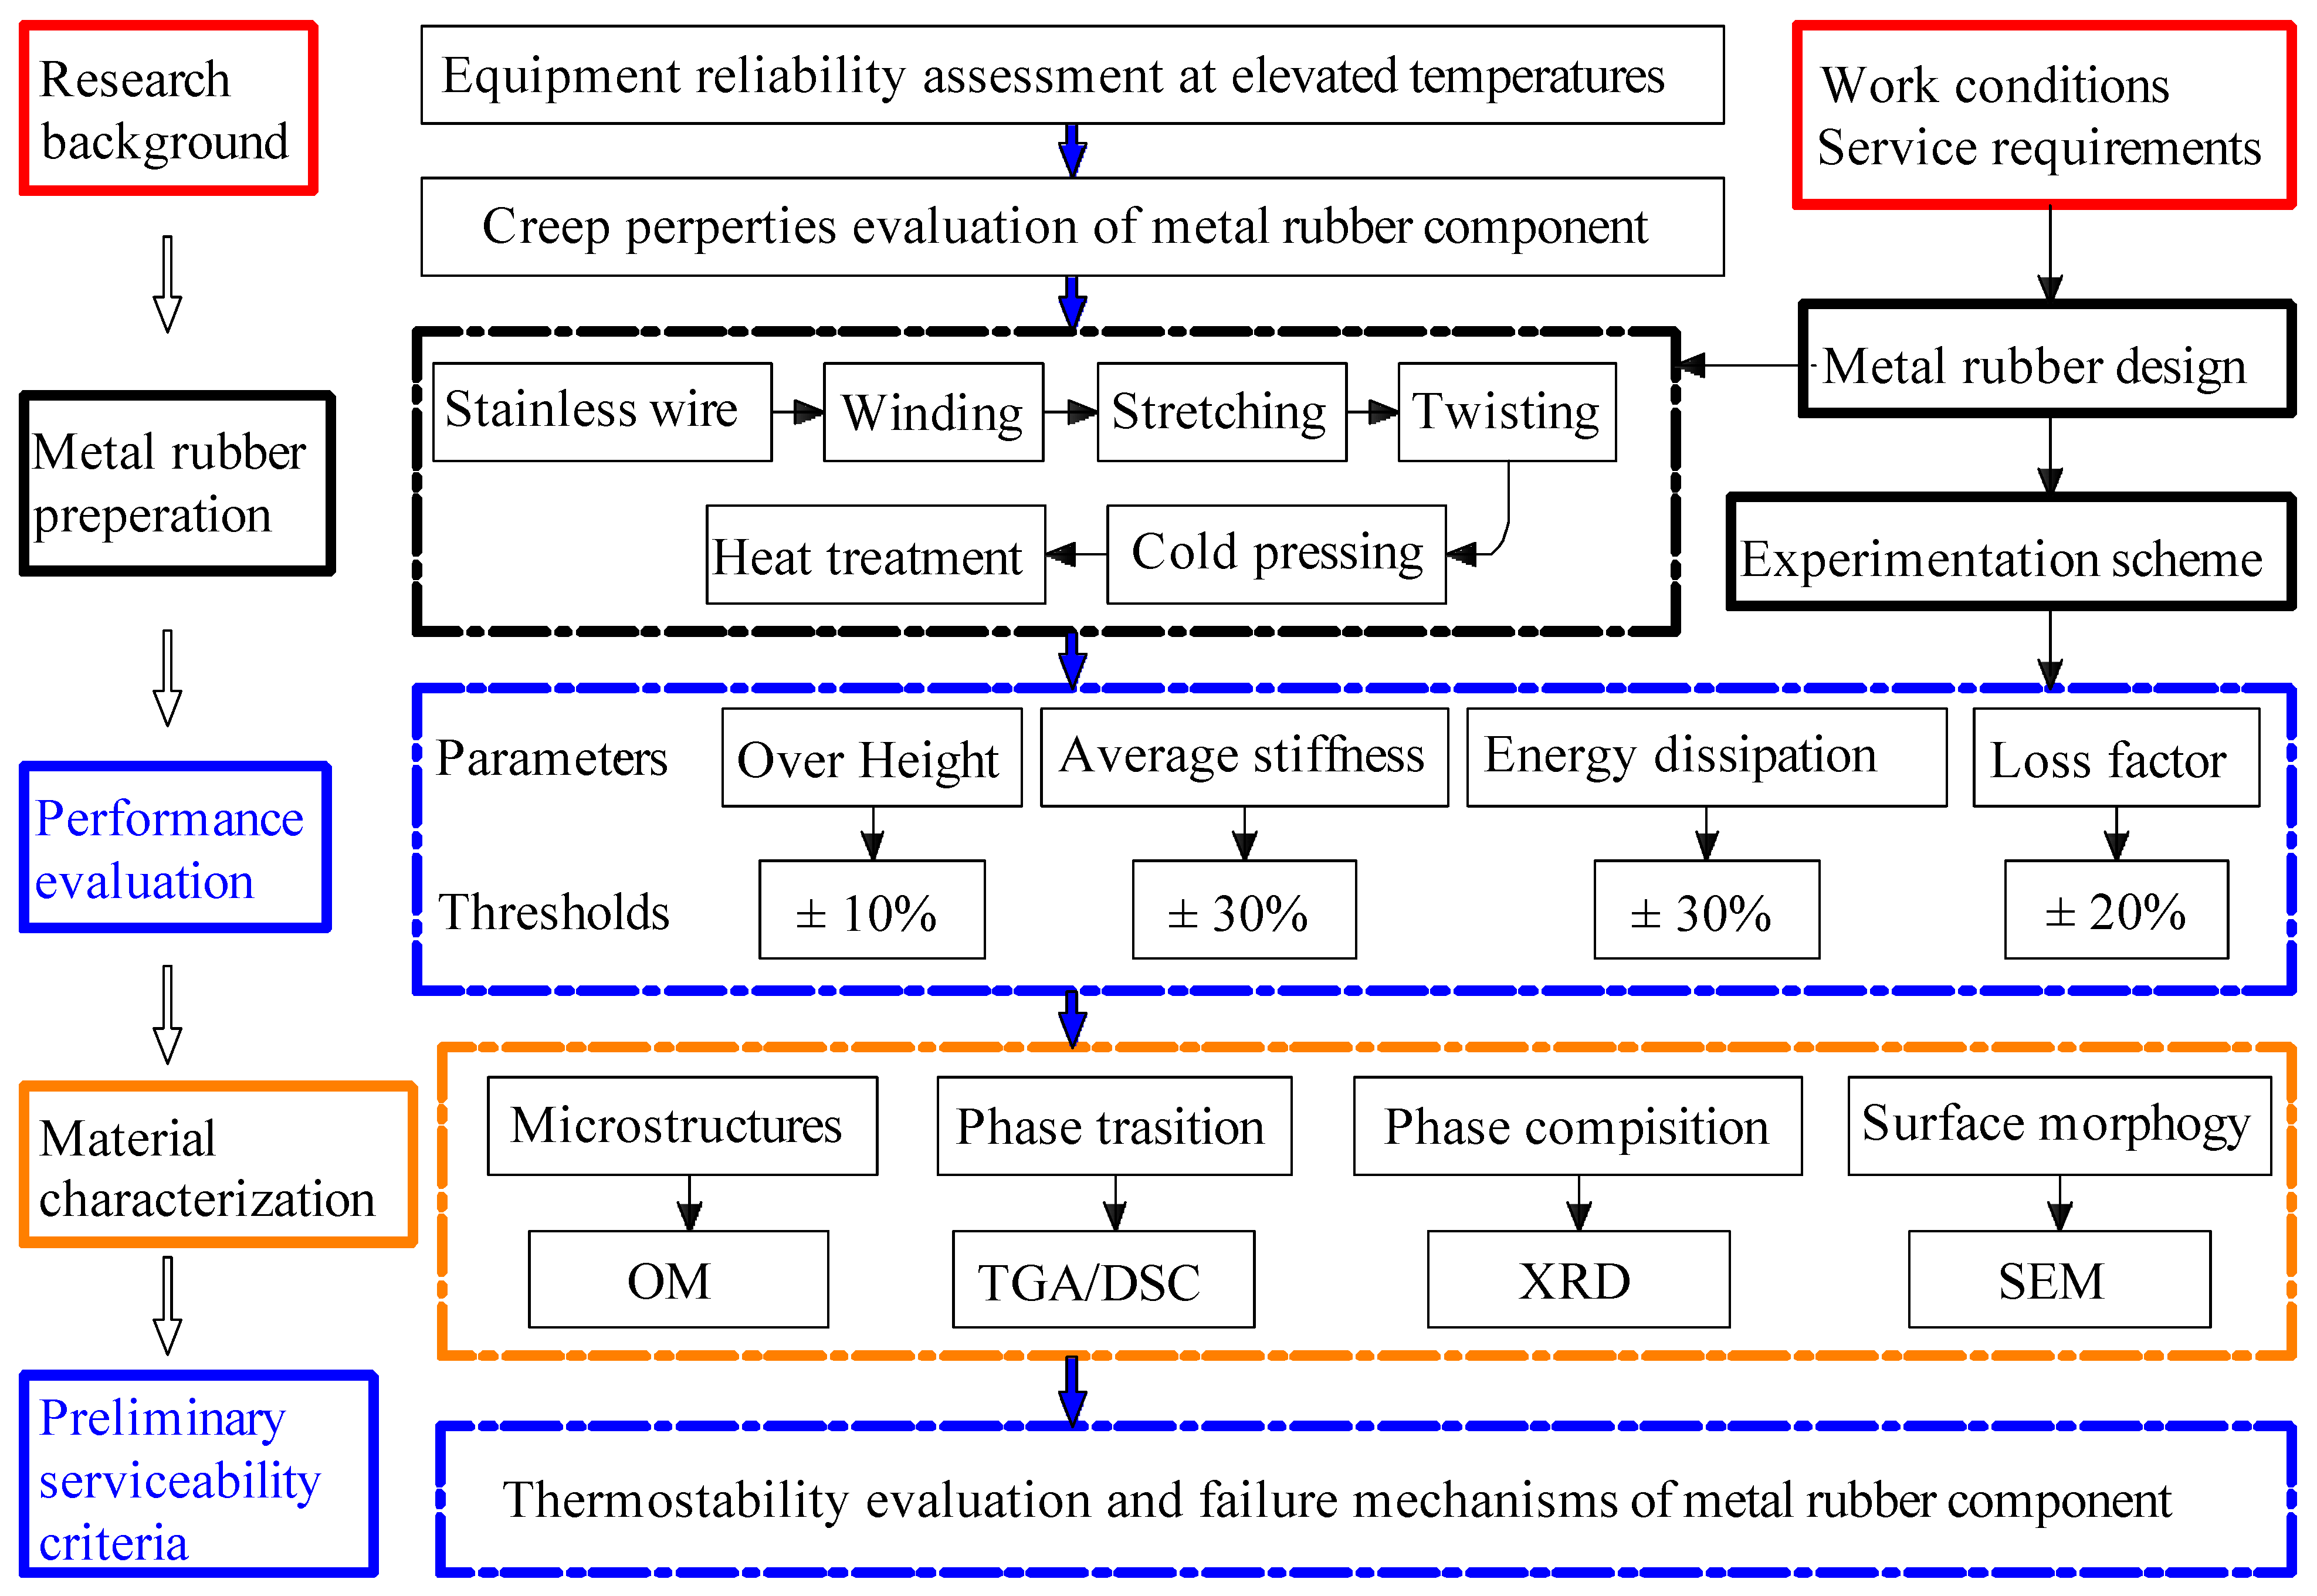
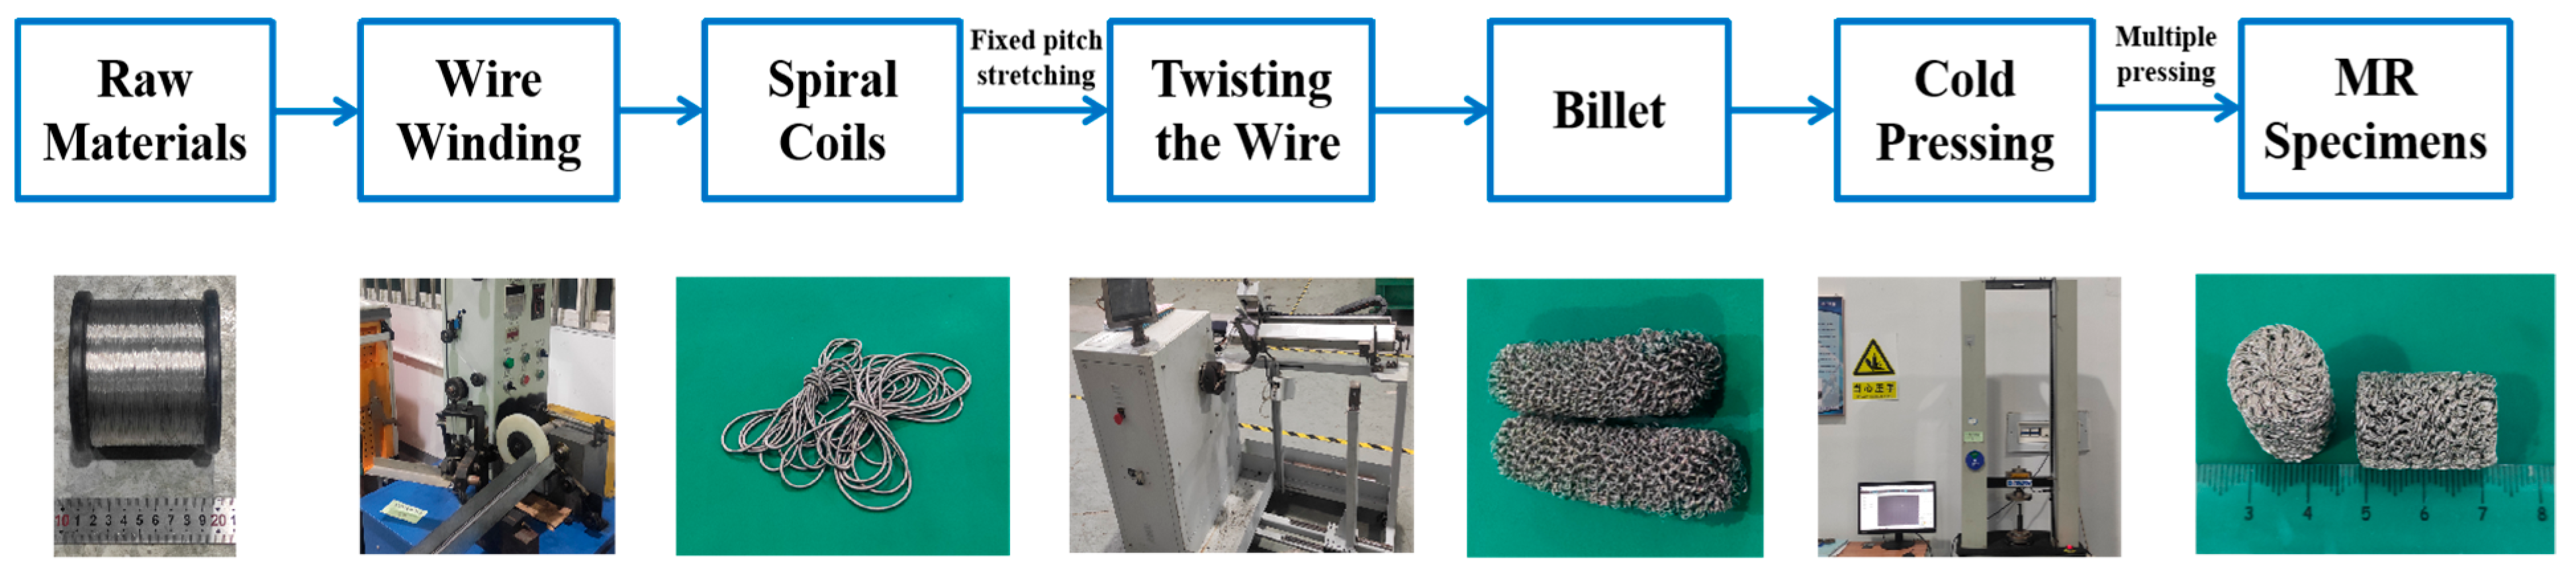
3. Specimens Preparation and Experimentation Scheme

3.1. Processing Parameters of MR Specimens

The cylinder MR specimens investigated in this study were prepared from 304 stainless steel wire (06Cr19Ni10) with a wire diameter of 0.15 mm. Firstly, a wire winding machine (SKRX-10, Xinke Numerical control, Taizhou, China) was used to circle the stainless-steel wire into spiral coils, and the diameter of a spiral coil is 10–15 times that of the metal wire diameter [18]. Then, the spiral coil was stretched with a fixed pitch, the stretched helix coil was wrapped by using an automatic metal rubber blank winding machine (SMT-ZDCR-005, SMTRobot Co., Ltd., Xiamen, China) to make a MR billet. Finally, the MR billet was put into the designed metallic mold with an internal symmetric cavity (cylinder shape), and a hydraulic machine (WDW-200, Tianchen Test Co., LTD, Jinan, China) was used to form the MR specimen through multiple cold pressing and pressure maintaining processes at room temperature (25 °C). The dimensions of the cylindrical MR specimens are 15 mm in diameter and 20 mm in height, and the processing parameters of each group of MR specimens are listed in Table 1. The photos of the MR preparation process are illustrated in Figure 4.

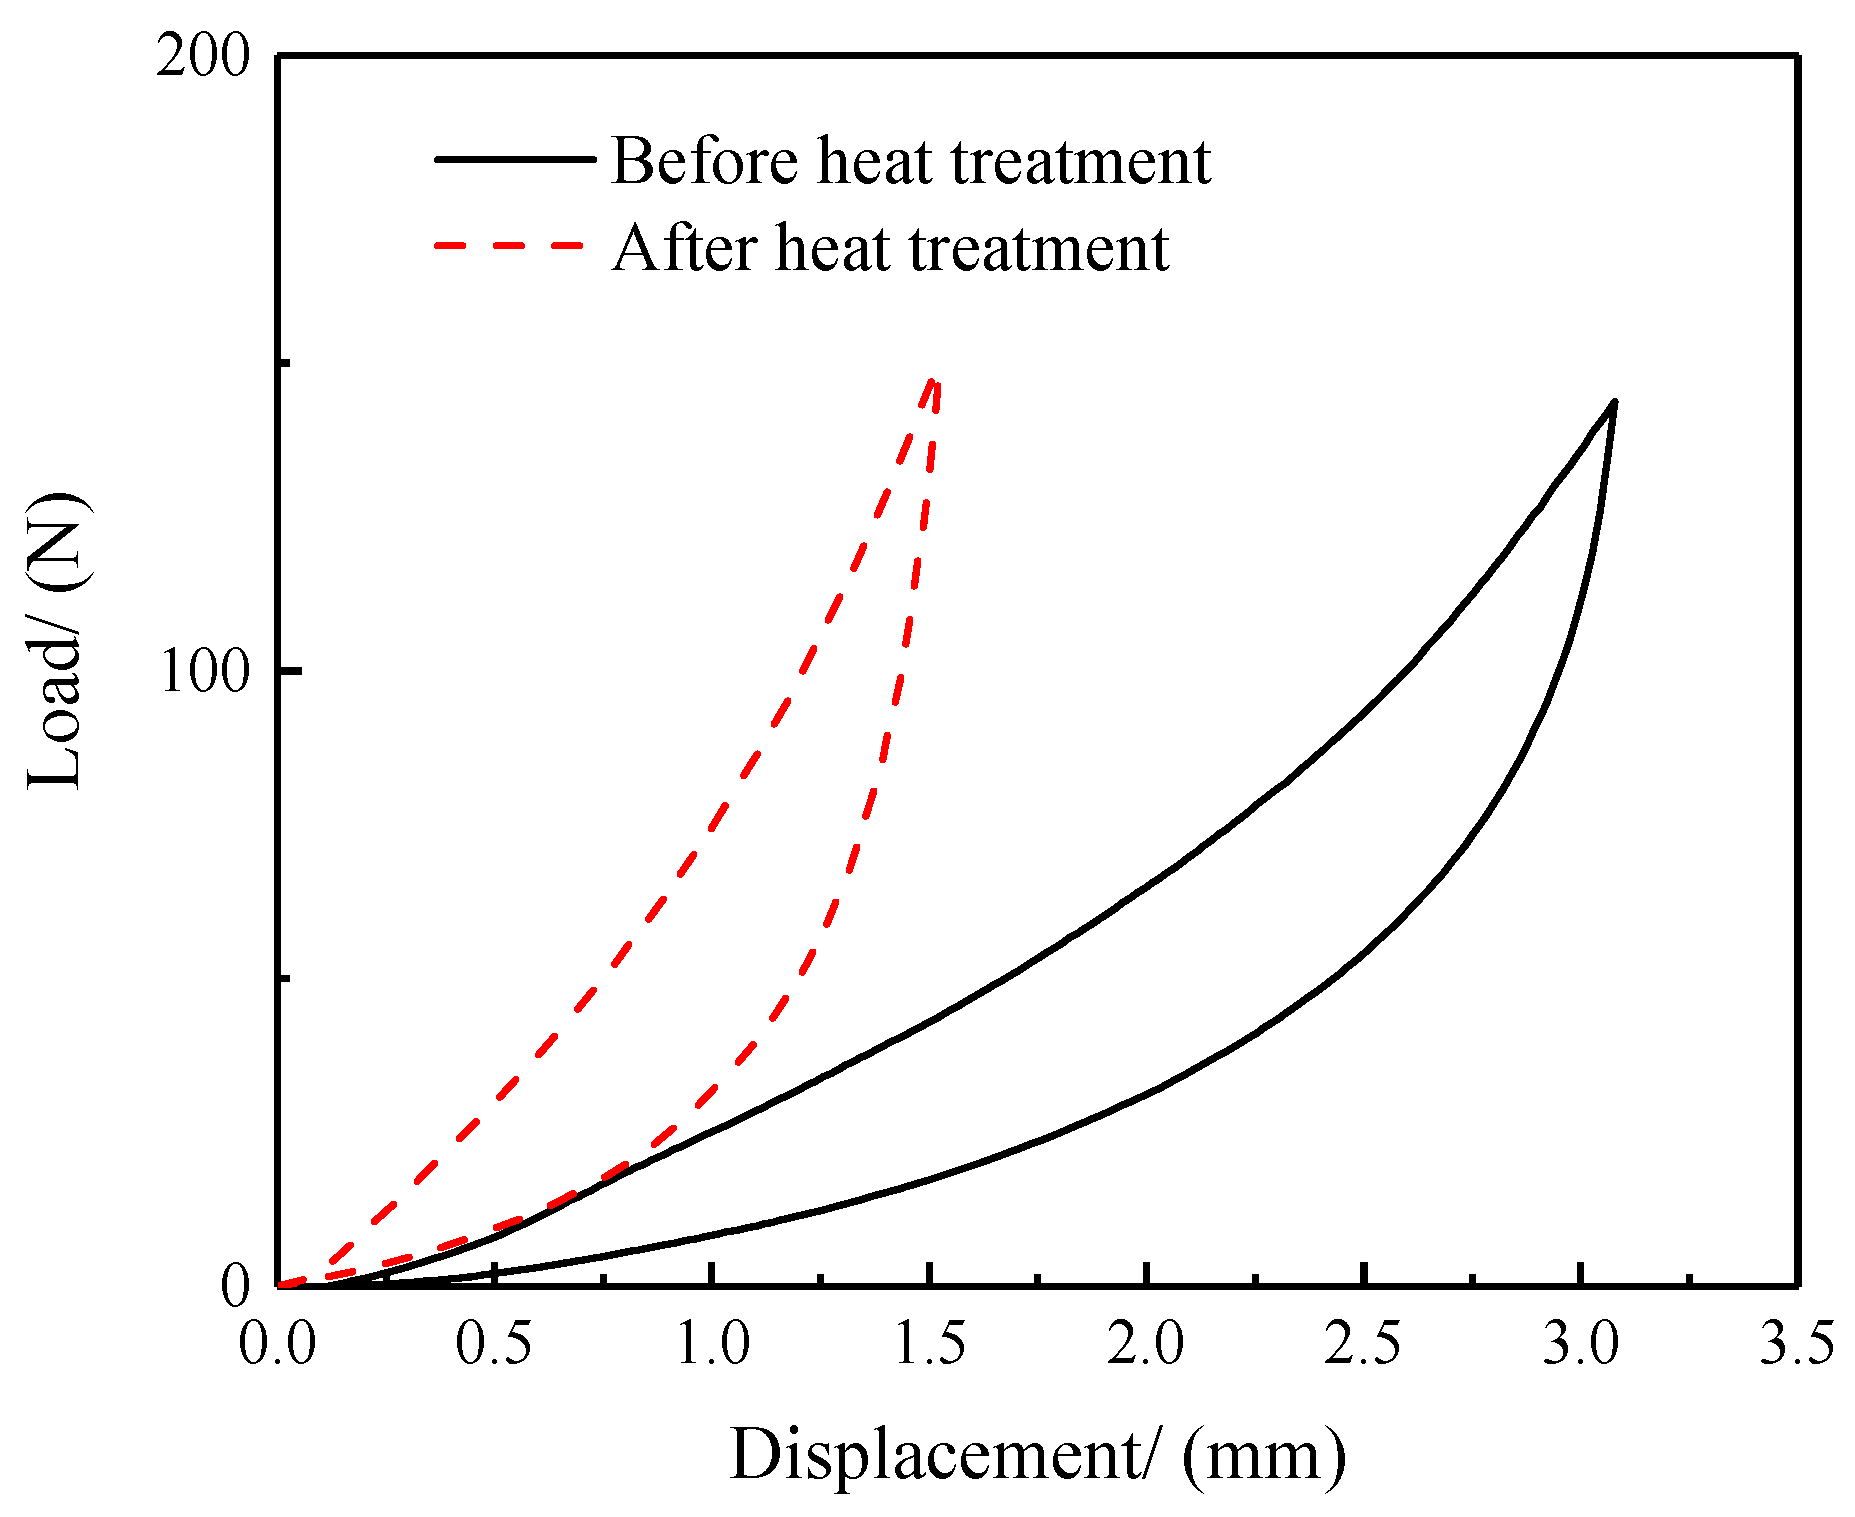
3.2. Tempering Heat Treatment of MR

According to Section 3.1, the MR specimens are wound by 304 stainless steel wire in the original state, and the strength of the MR specimens without heat treatment is at a low level [19], resulting in the overall properties of MR operating at high temperatures possibly deviating seriously from their initial designed properties. Additionally, the cold pressing forming process would also cause residual stresses within the MR specimens, so a suitable heat treatment for the MR specimen could effectively eliminate residual stresses and ensure the thermal stability of the overall structural dimensions and mechanical properties [19,20]. Based on the research experience of the author’s research group, a tempering heat treatment of 450 °C with a holding time of 40 min was used for the MR specimens as one potential step of the MR preparation process [20,21]. The comparison of the property variation of MR with and without heat treatment would be conducted by a creep test and material characterization.

3.2.1. Comparison of the Failure Determining Parameters

A comparison of the properties of the MR specimens before and after heat treatment is shown in Table 2, and a comparison of the hysteresis curves is presented in Figure 5.
It can be seen that the overall height and loss factor of MR specimens are slightly increased after tempering at 450 °C. As a kind of porous material, the high temperature environment causes the thermal expansion of the metal wires, thus increasing the overall height of the MR specimen. According to Equations (3)–(5), the change of the loss factor is closely related to the change of E and U. As can be seen from Table 2, both E and U of MR specimens decrease after heat treatment, but the reduction of E is greater than that of U, so the loss factor shows an increasing trend.
However, the average stiffness is increased by 108.9% and energy dissipation is decreased by 40.4% at a same compression load level, it can be inferred that heat treatment would have a significant effect on the average stiffness and energy dissipation parameters of MR. As the strength of the MR after heat treatment is enhanced [21] and its surface roughness increases, the deformation will decrease under the same compression load level. According to the calculation of Equation (1), the average stiffness of MR will increase after heat treatment. The energy dissipation is mainly caused by the friction between the metal wires. As the deformation of the heat-treated MR is relatively reduced under the same compression load level, the number of metal wires rubbing with each other in the MR specimen will also be reduced. Although the surface roughness of the wire after heat treatment increases, the increase of energy consumption is small, so the overall energy consumption of MR specimen is then reduced.

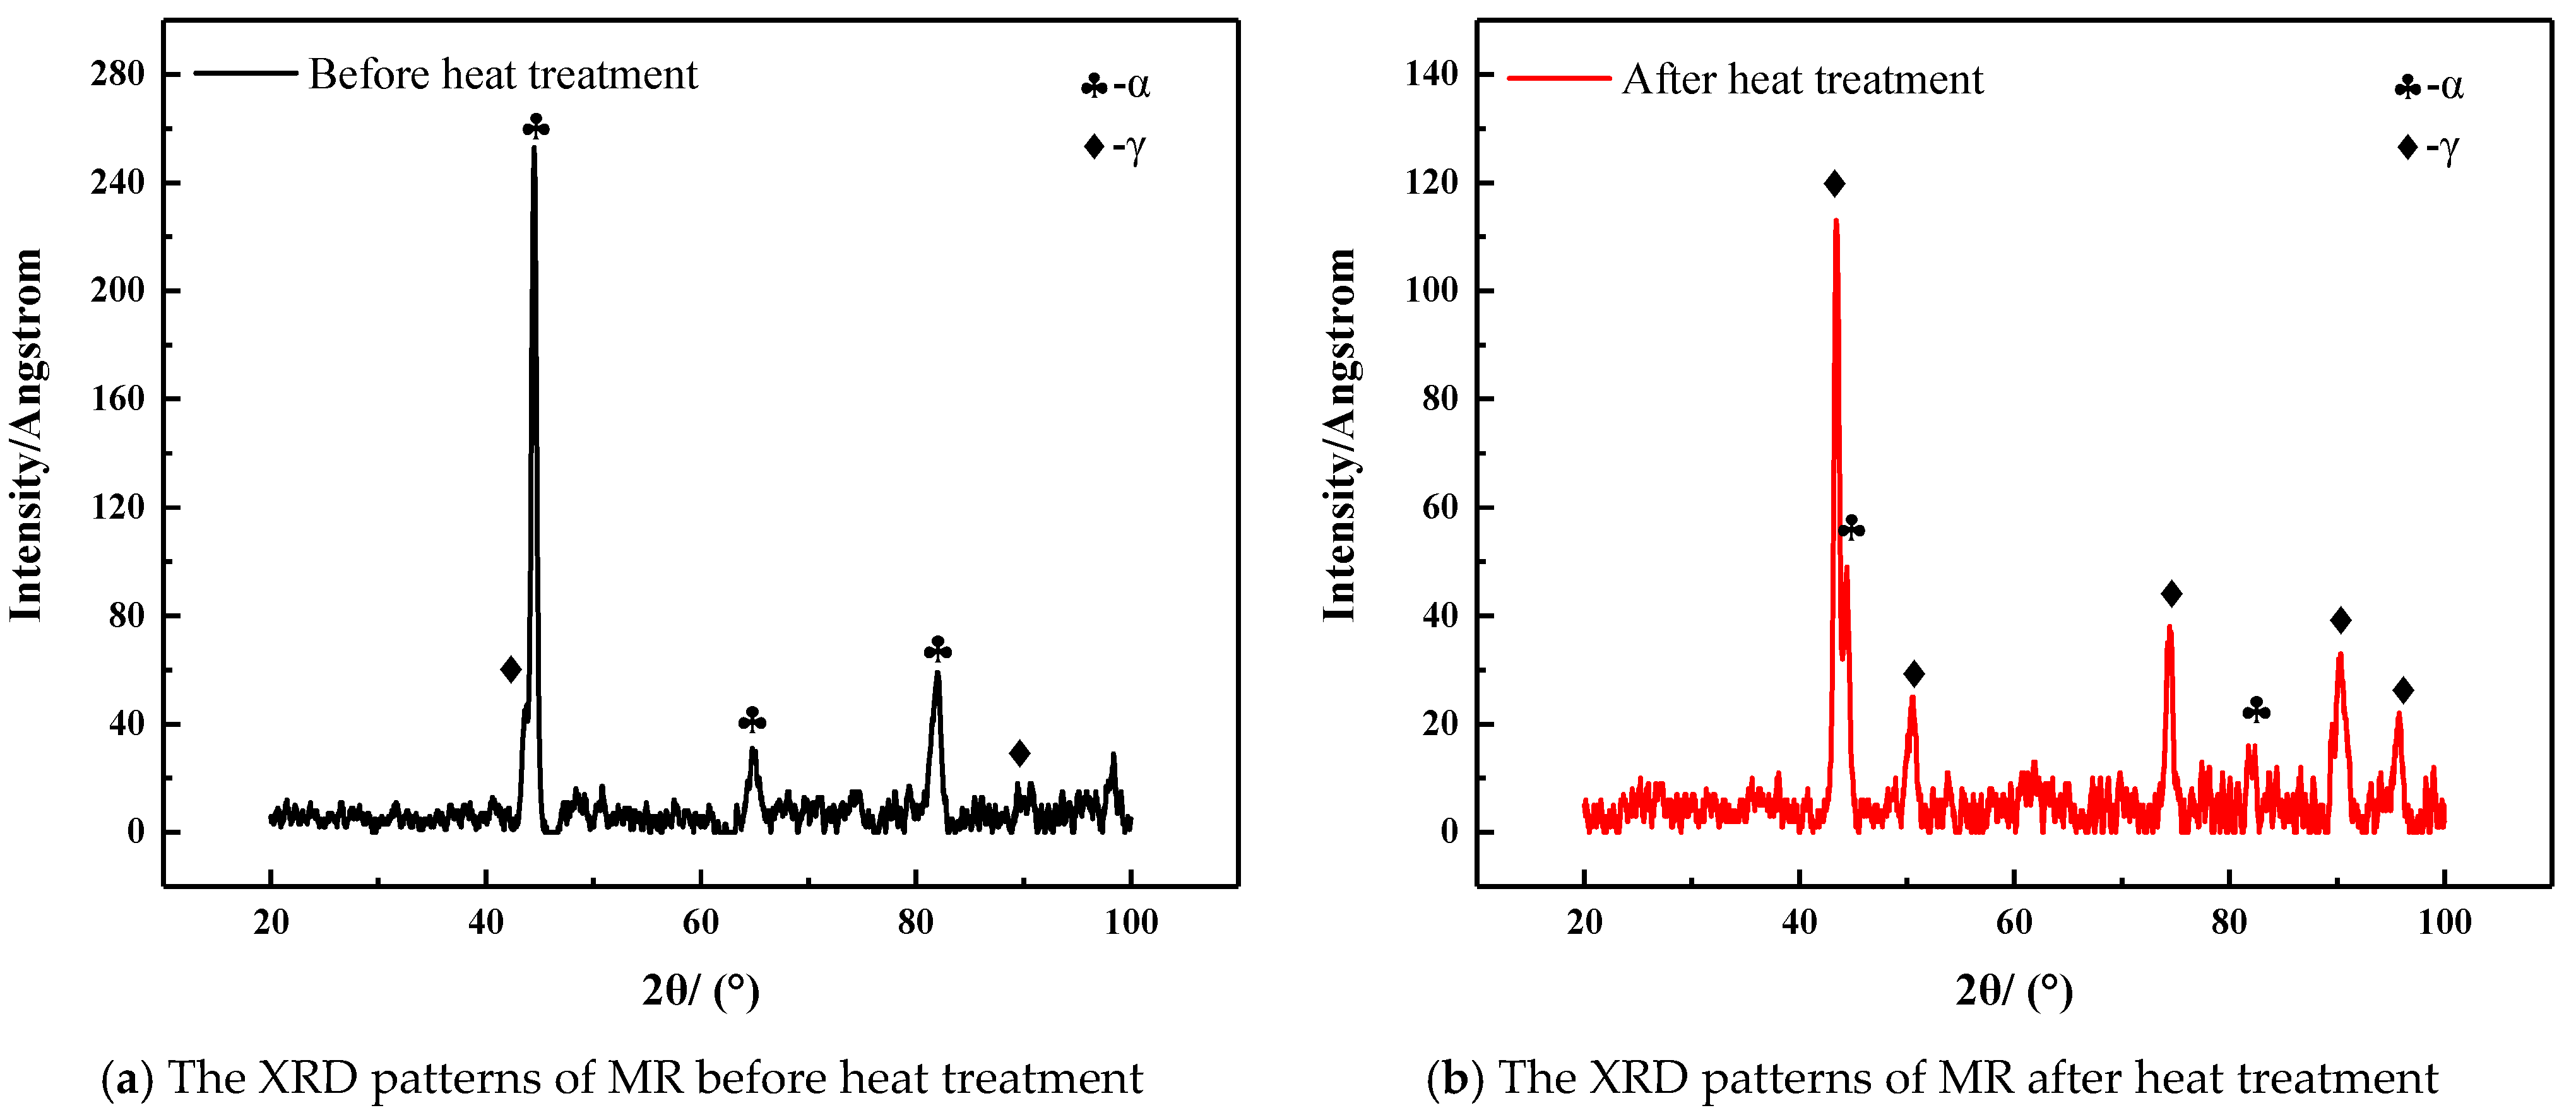
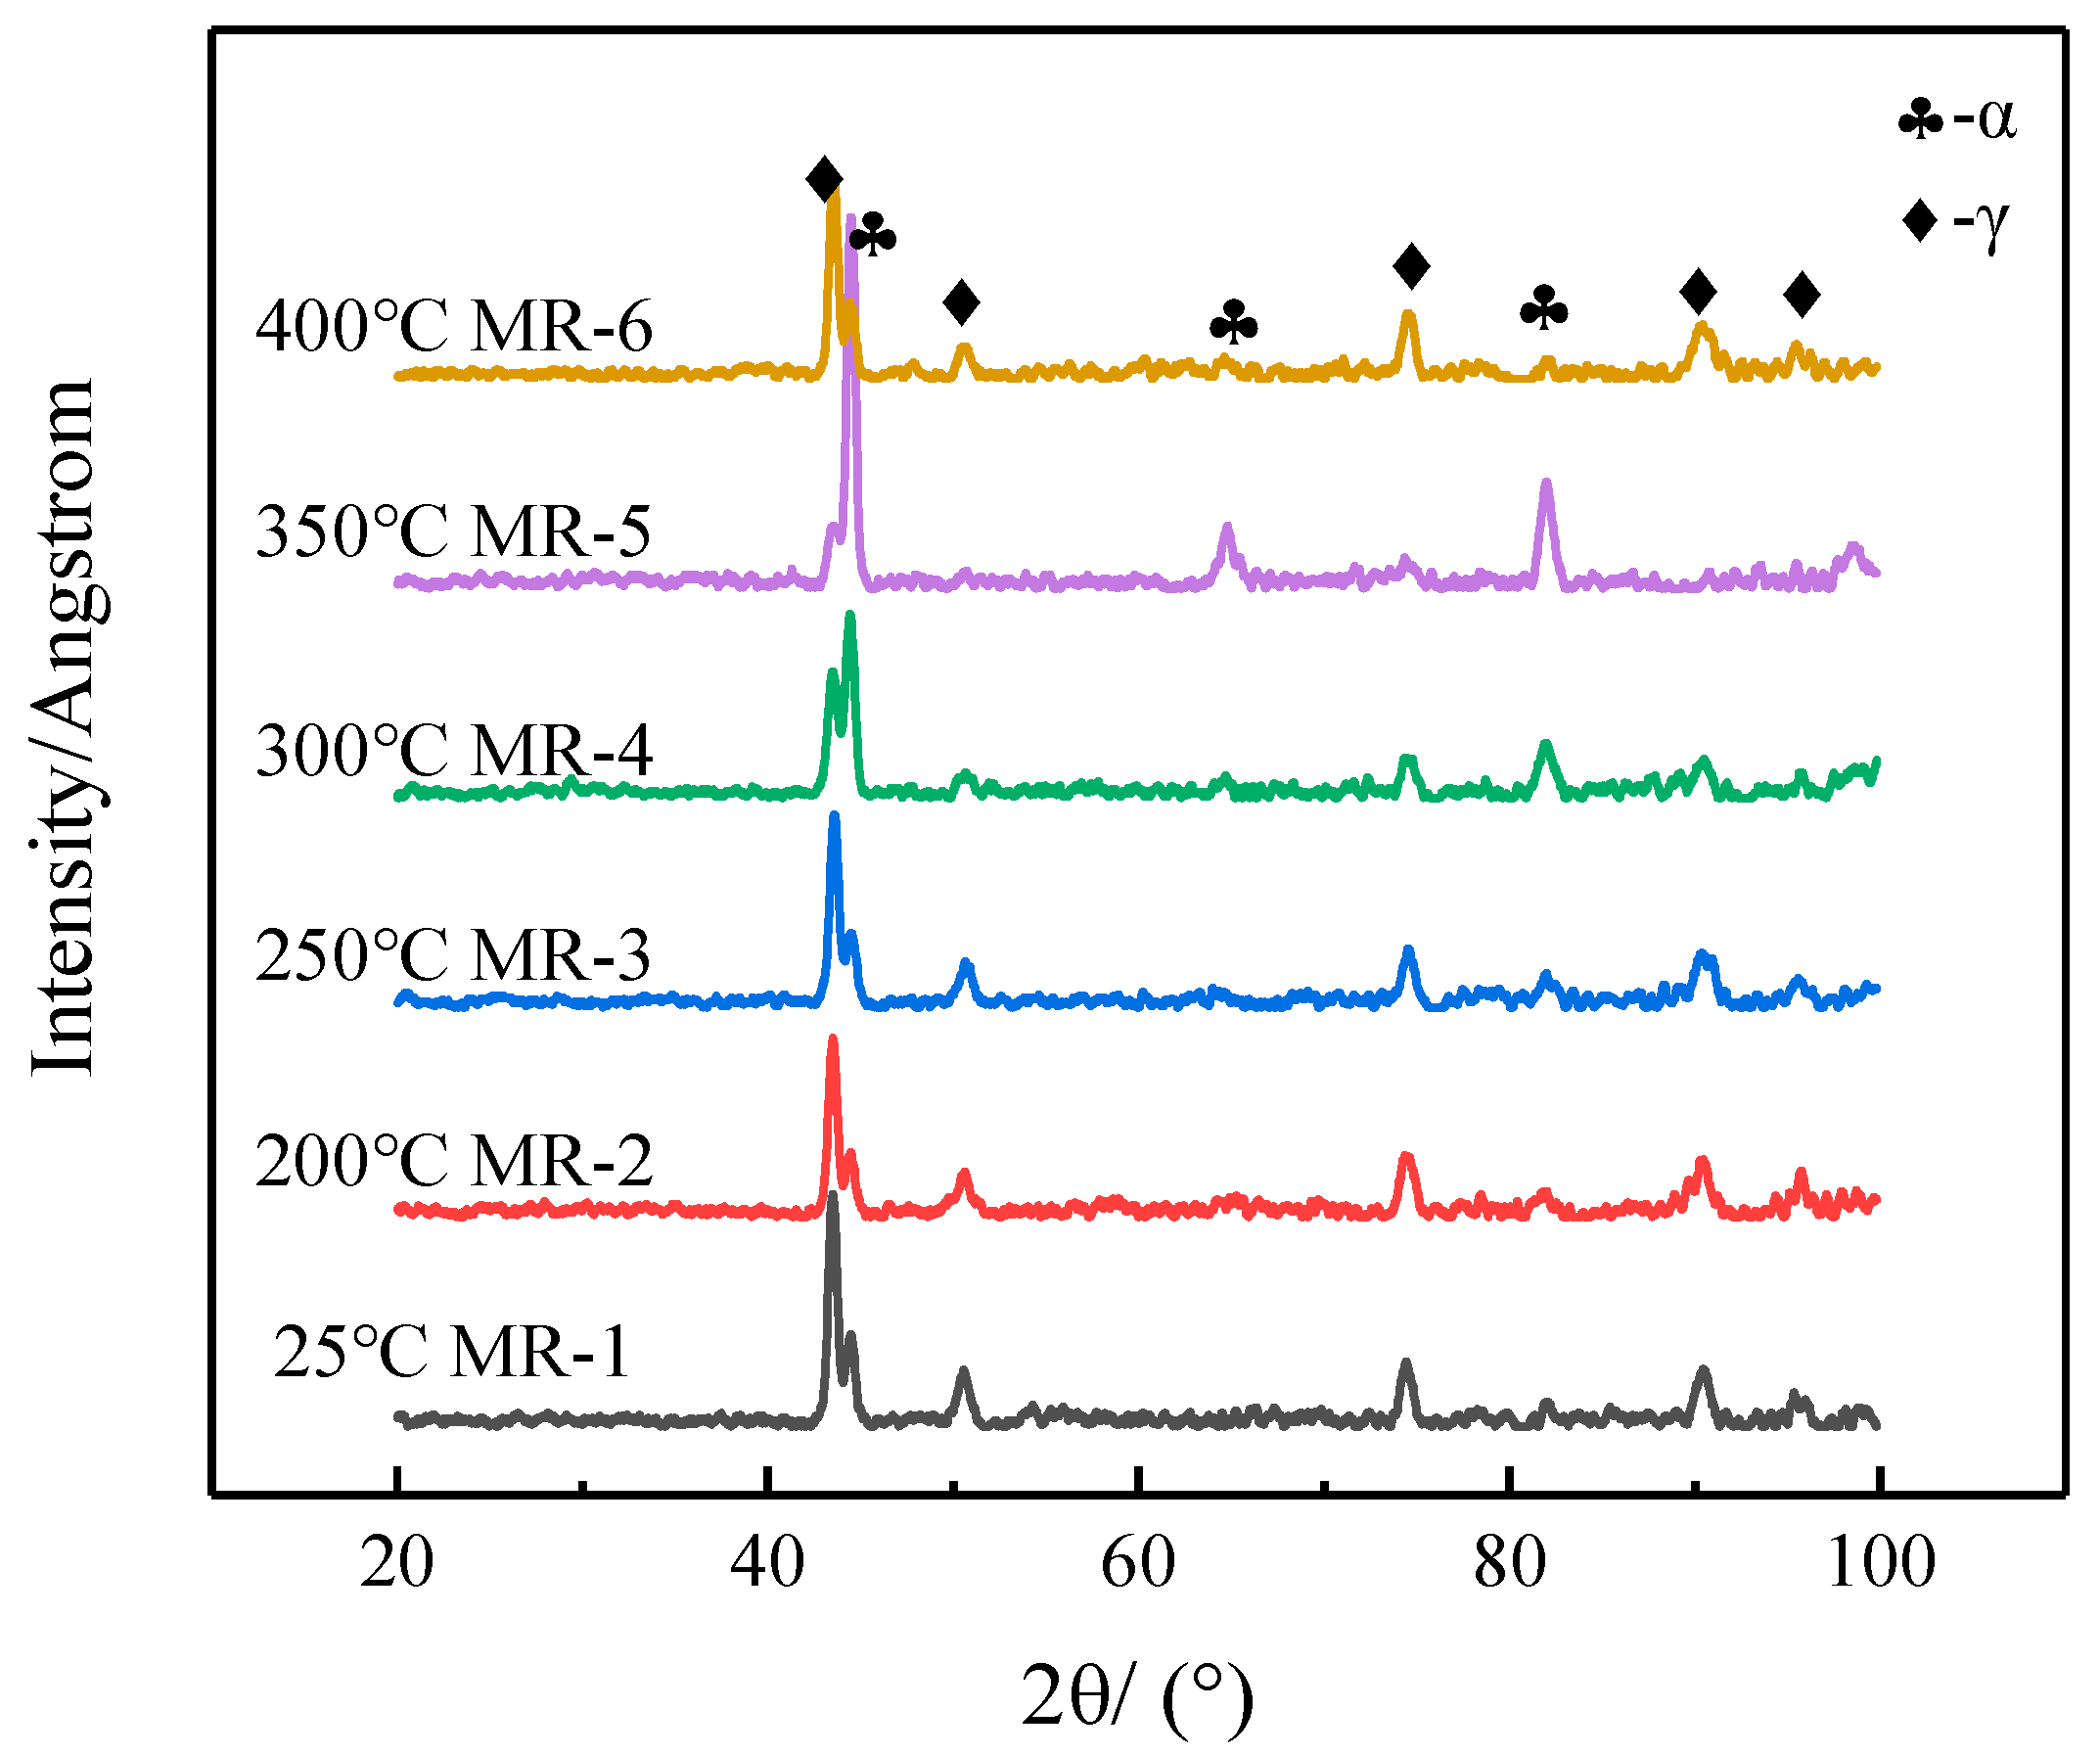
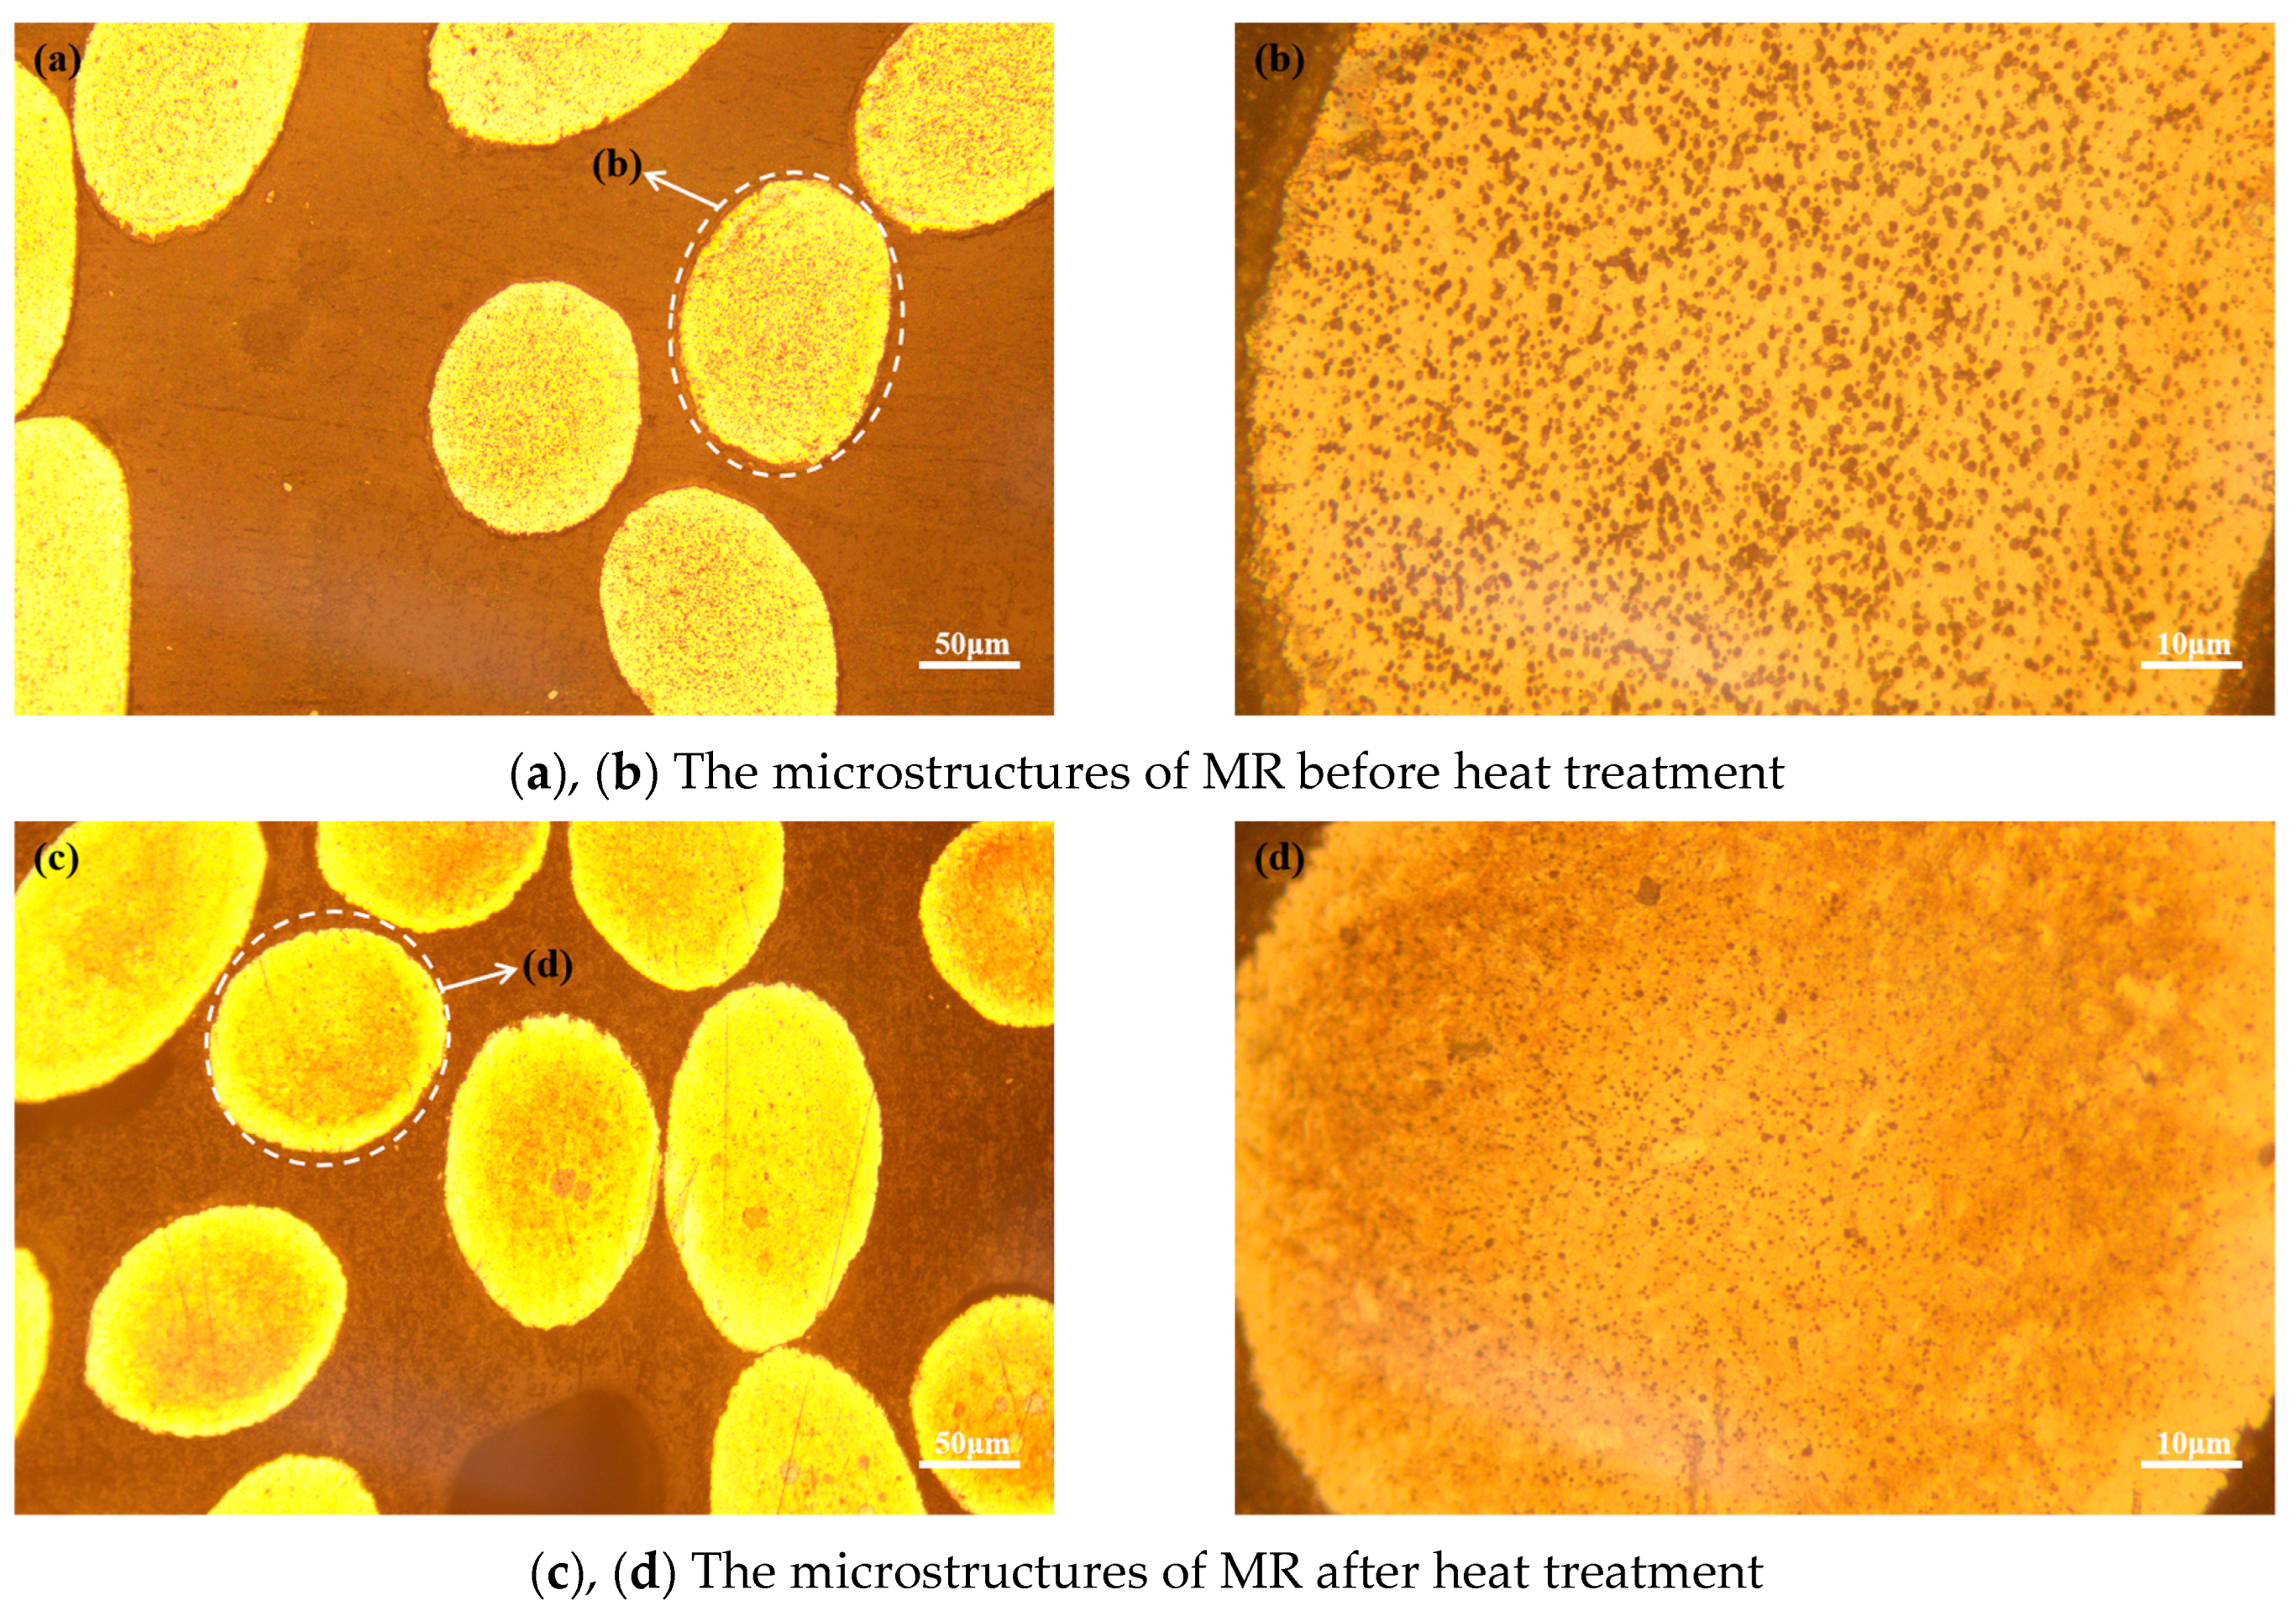
3.2.2. Comparison of the Microstructures and XRD Patterns

In this study, an inverted metallographic optical microscope (MDS400, Kurt technology Co., Ltd., Wuhan, China) was used to observe the metallographic microstructures of the MR specimens before and after heat treatment, respectively, and the captured images are shown in Figure 6. In Figure 4b,d, it can be seen that the internal crystal structures of the wires of MR specimens have less obvious edges after the tempering heat treatment at 450 °C. The change is manifested by a significant reduction of the spots on the cross section of the wires and the beginning of the blurring of the surrounding grain boundaries. According to the results of Yang et al. [19], most of the residual stresses of stainless material in this state would be eliminated, the precipitation of ε-carbide is in an equilibrium status, and no significant reversion and recrystallization has yet occurred, so the MR material with a tempering heat treatment at 450 °C to 475 °C would obtain a higher strength level.
Subsequently, the MR specimens with and without the heat treatment were analyzed by X-ray diffraction patterns. It can be seen from Figure 7 that the ferrite diffraction peaks (110)α, (200)α, and (211)α in the wire were significantly weakened and the austenite diffraction peaks (111)γ, (200)γ, (220)γ, and (311)γ were substantially enhanced after the tempering heat treatment at 450 °C. It is indicated that the MR specimens underwent a significant transformation of the phase during the heat treatment, resulting in significant differences in the mechanical properties of the MR specimens in the two conditions.

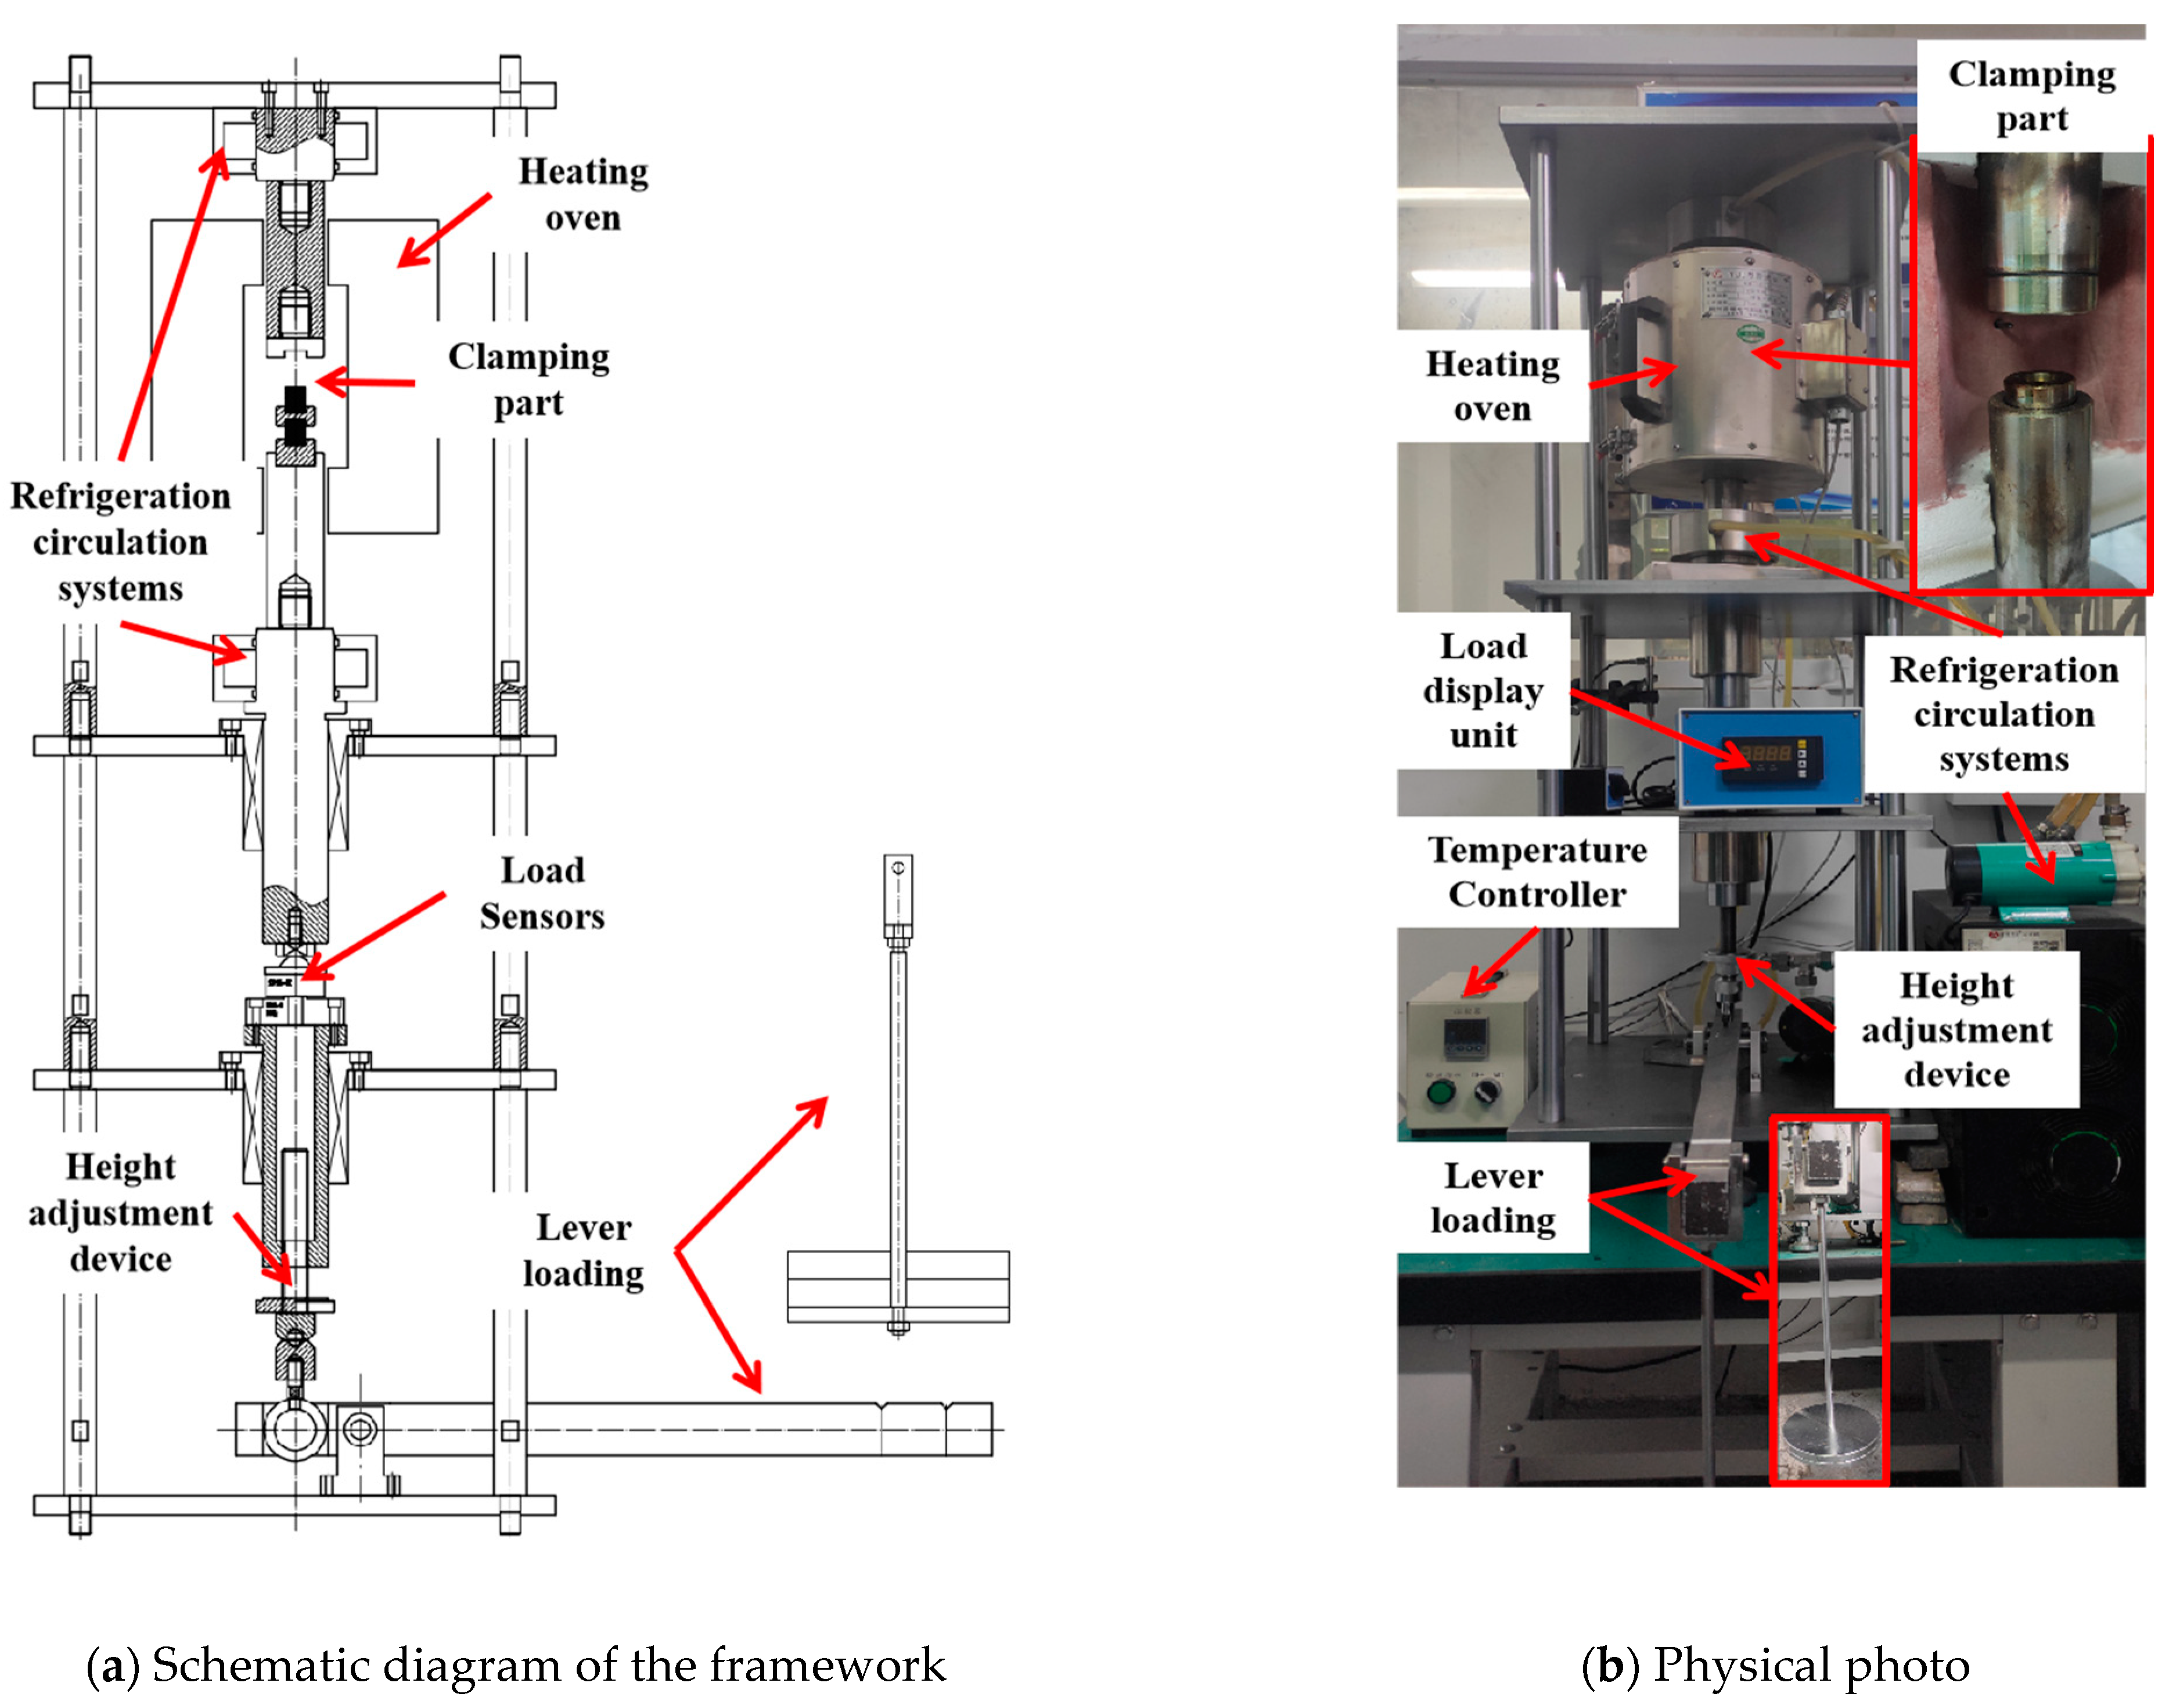
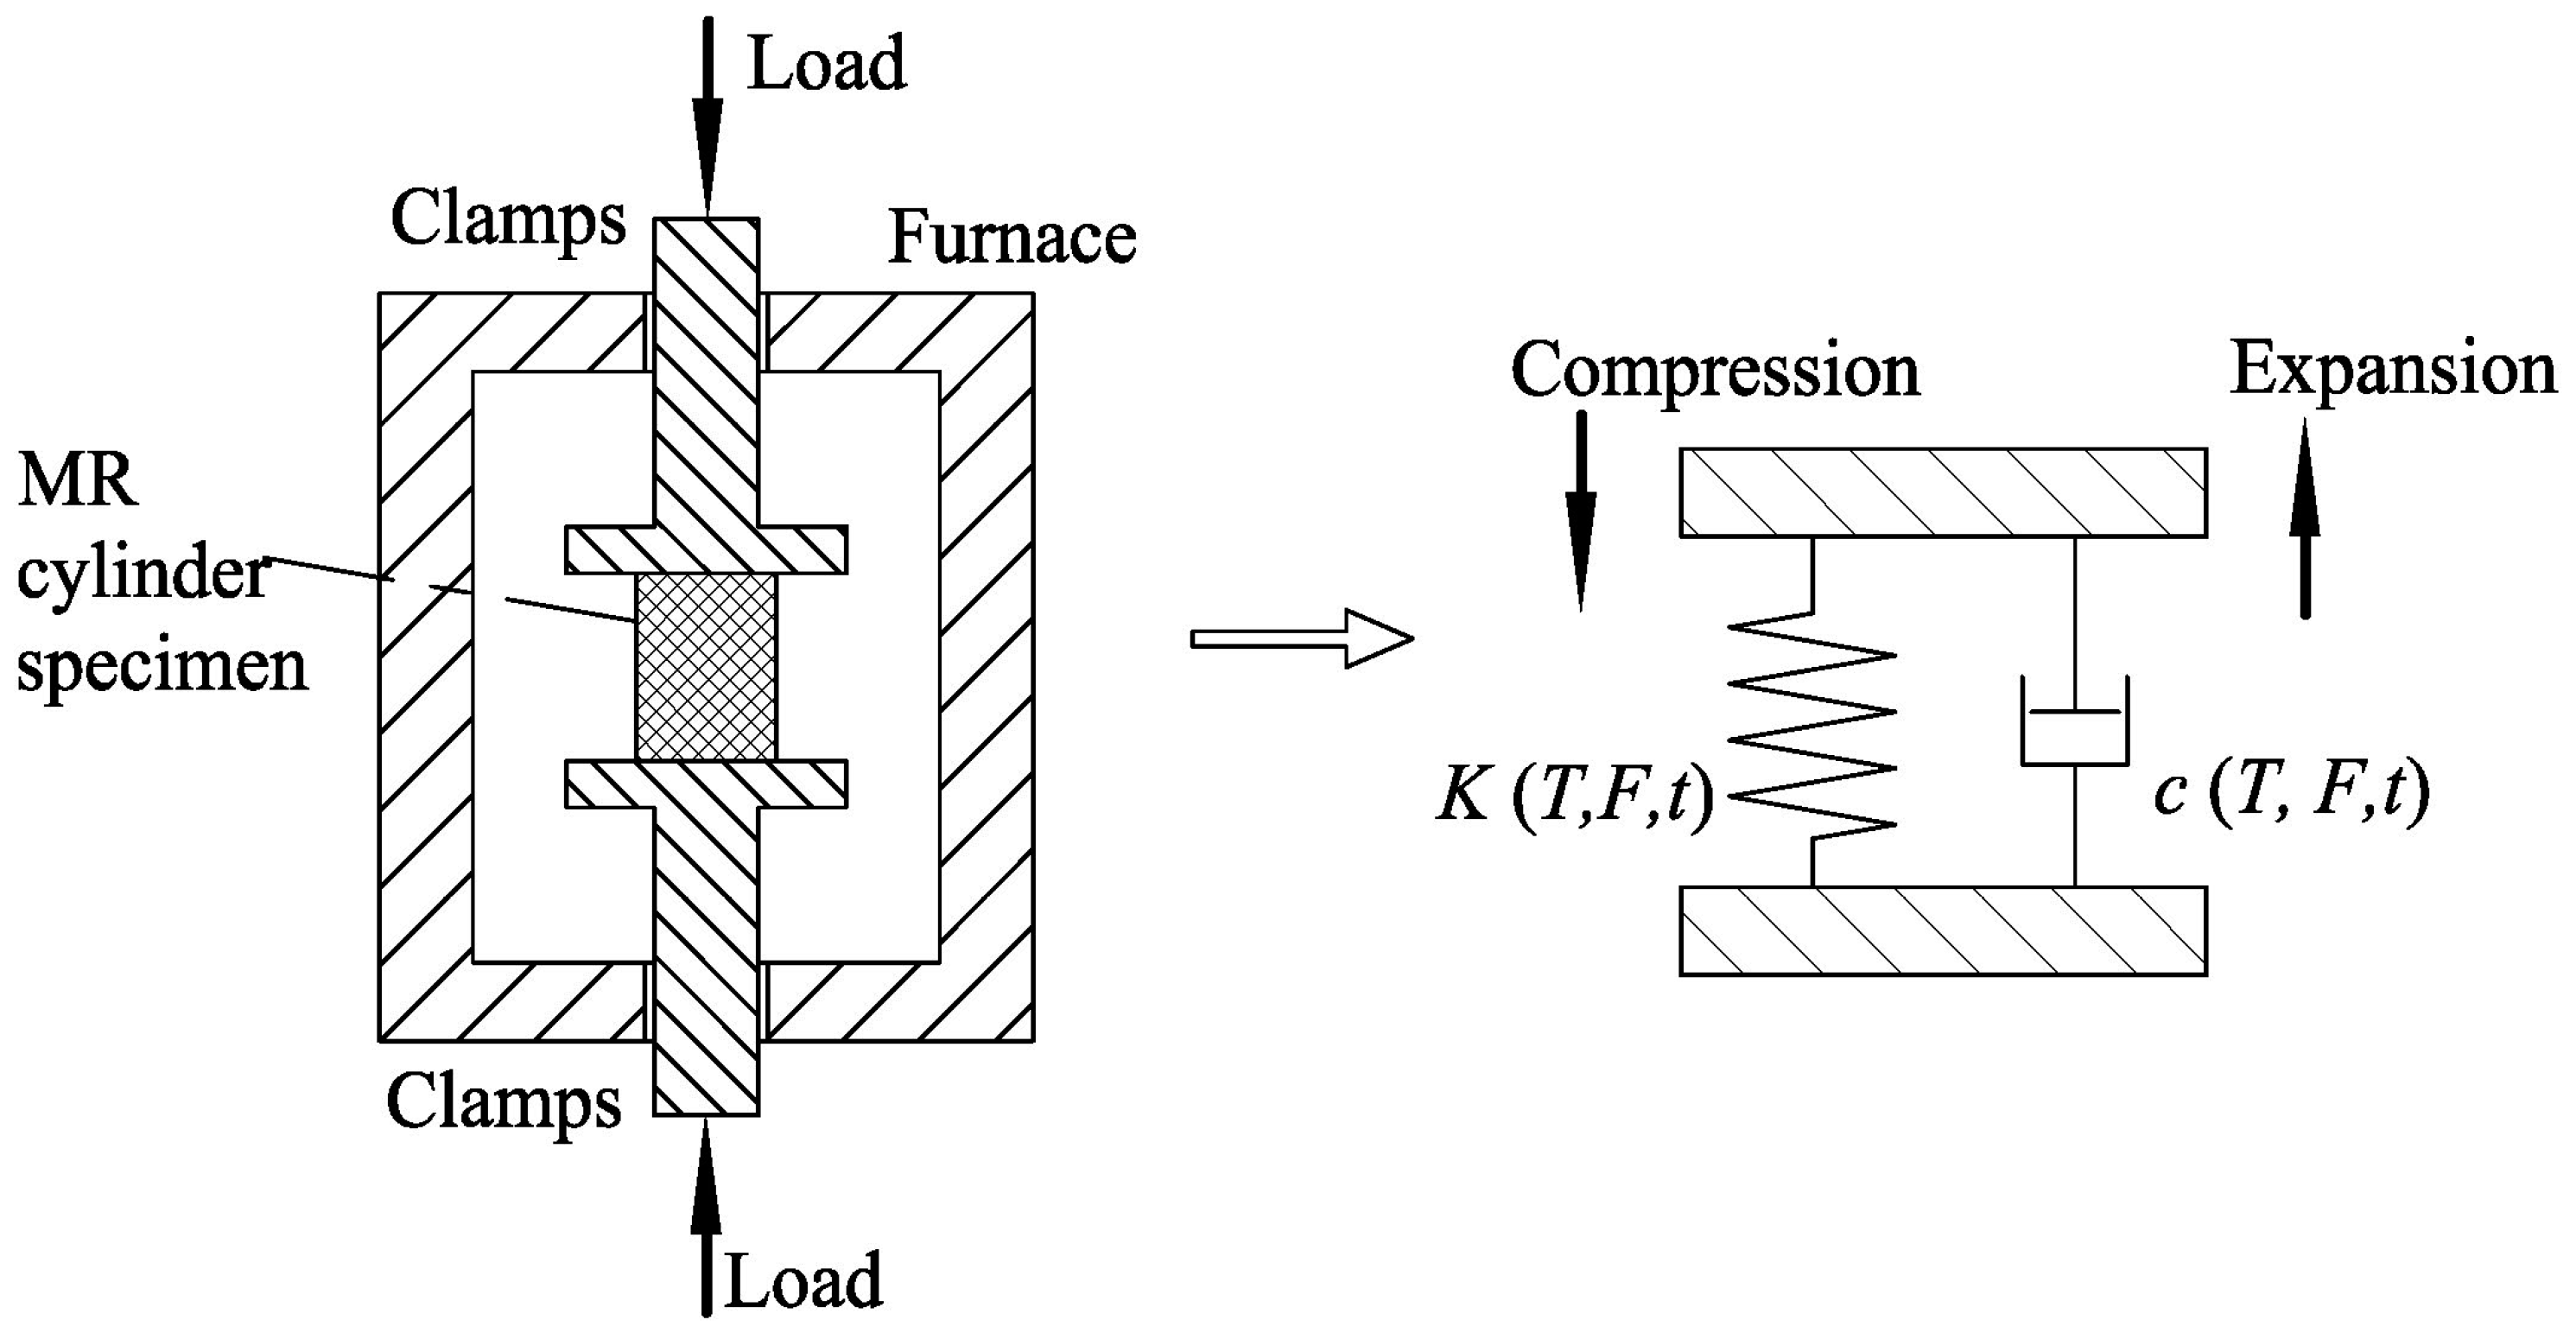
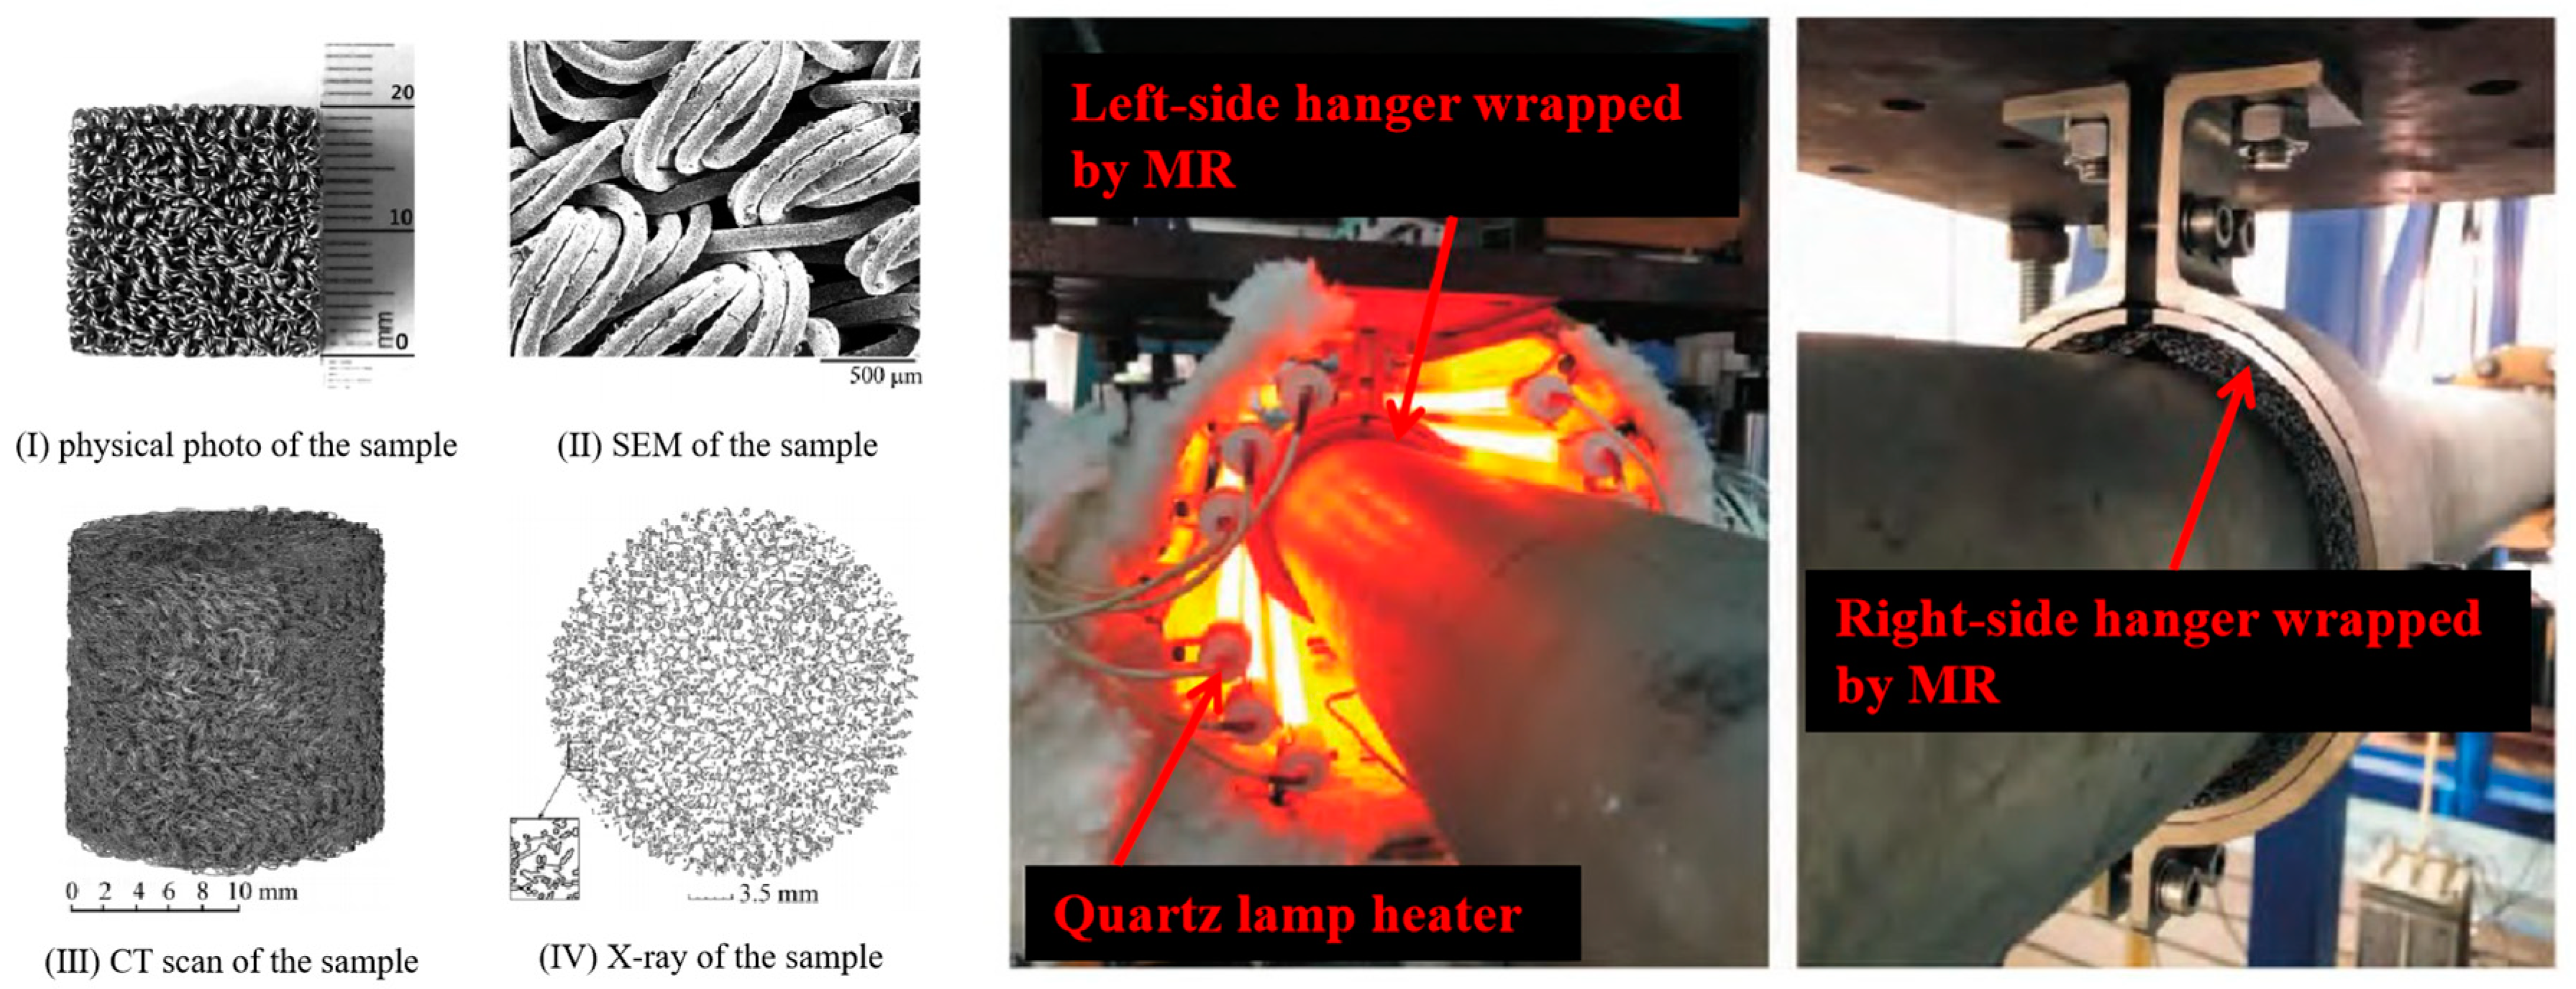
3.3. Machines for Creep Testing at High Temperatures

A designed high-temperature creep test machine (GWRB2000, Jinan Jingcheng Test Technology Co., Ltd., Jinan, China) was used to carry out the creep tests. The framework schematic diagram and a photo of the machine are shown in Figure 8. The machine consists of a lever-loading system, a specimen-clamping system, a high-temperature heating oven, and a refrigeration-circulation system. The axial load is applied through a lever and weights. The metallic loading rod in the specimen-clamping system is made of superalloy to prevent itself from severely deforming at high temperatures. The specimen-clamping system is able to accommodate the dimensions of MR specimens up to a maximum diameter of 35 mm and a maximum height of 40 mm, the maximum temperature inside the oven can reach 800 °C, and the maximum axisymmetric static compression load of the creep machine is 2 kN.

3.4. High-Temperature Creep Test

The six temperature levels of 25 °C, 200 °C, 250 °C, 300 °C, 350 °C, and 400 °C were selected and set for the series high-temperature creep tests, in which a static load that caused a 15% deformation of its initial height was applied, and the specific experimentation scheme is shown in Table 3. During the creep test period, the MR specimens were measured eight times, and three parallel MR specimens were taken at each measurement. The performance parameters of the specimens would be evaluated according to Equations (6)–(9) which would be defined and explained in the following sections, and the measured values were taken as the average value of the three parallel specimens. The time points of each measurement were: 12 h, 36 h, 84 h, 132 h, 180 h, 228 h, 276 h, and 324 h, respectively.
Hence, based on the Sections of ‘Introduction’, ‘Specimens preparation and experimentation scheme’, and ‘Parameters for determining MR failure’, the research framework and flow chart of this study could be illustrated in Figure 9. Based on the equipment reliability assessment research background, the investigation of MR preparation, creep performance evaluation and material characterization are carried out. Then, the preliminary serviceability criteria of MR would be proposed. The output of this study will reveal the thermostability evaluation and failure mechanisms of MR specimen.

4. Results and Discussion

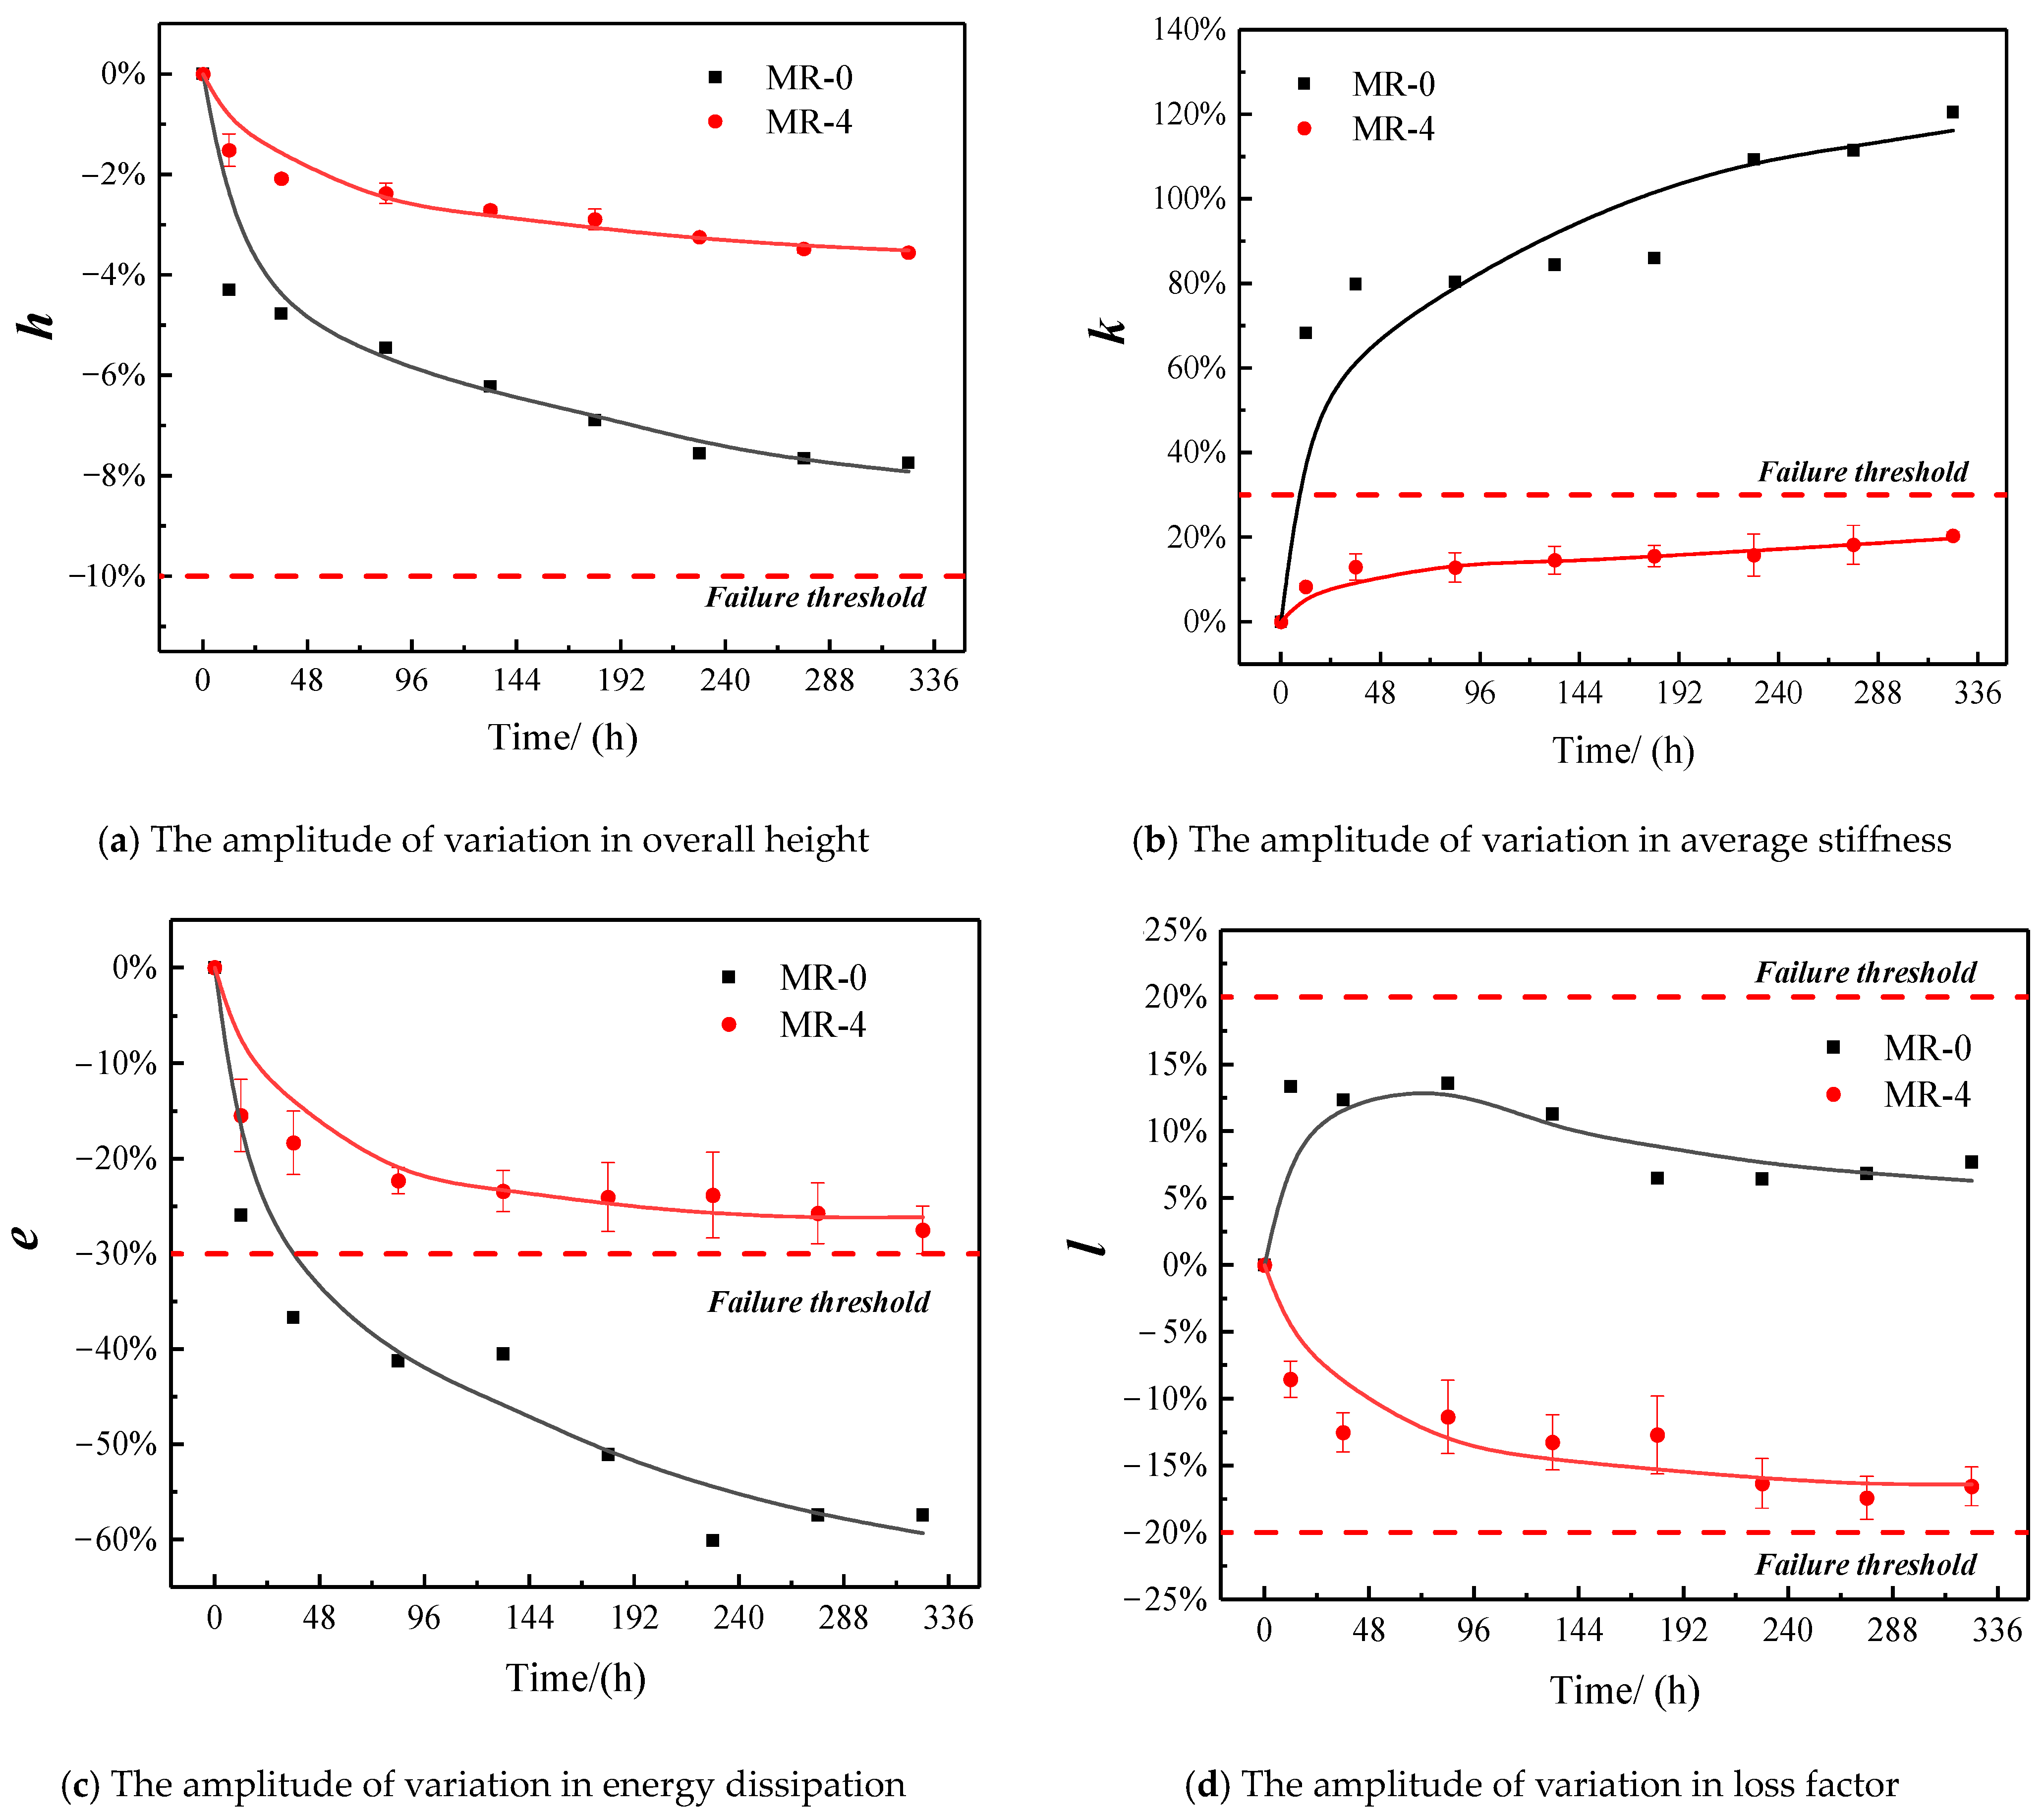
4.1. Comparison of Creep Properties of MR before and after Heat Treatment

In order to investigate the effect of tempering heat treatment on creep properties of MR specimens at elevated temperatures, one group labeled with MR-0 was not subjected to tempering heat treatment after the pressing forming process, and an axial load which would cause a 15% deformation of its initial height was applied. The test temperature was set at 300 °C, which was the same as the MR-4 group. Variations in the properties of the two groups of MR specimens were evaluated and compared by using the evaluation parameters which were defined in Section 3.
As shown in Figure 10, MR-0 was subjected to a creep test at 300 °C; in other words, it suffered a longer tempering heat treatment period at 300 °C. The loss factor is increased to a certain extent at the initial period of the creep test, then, the loss factor is decreased slowly. However, the variation in overall height, average stiffness and energy dissipation of MR-0 are much higher than those of MR-4. Specifically, with the variation in average stiffness reaching 68.26% at 12 h and the variation in energy dissipation reaching 36.69% at 36 h, both of them exceeded the failure threshold, respectively. During the creep test, under the combined action of high temperature thermal load and static compression mechanical load, the MR specimen without heat treatment would produce a large plastic deformation during a short time. With the further increase of the creep test time, the internal structures of the MR specimen were gradually stabilized and compressed, and the MR material density would be increased. Hence, compared with the initial state of the MR specimen, the performance of the specimen has been changed obviously, leading to an excess of average stiffness and energy dissipation parameters.
The variation in overall height is also nearing the failure threshold at the end of the creep test, reaching 7.74%. Therefore, MR specimens served in high-temperature work conditions require appropriate heat treatment processes to ensure that MR specimens would obtain better creep resistance.
Hence, six groups of MR specimens (labeled with MR-1 to MR-6) before the creep experiments were conducted with a tempering heat treatment at 450 °C with a holding time of 40 min.

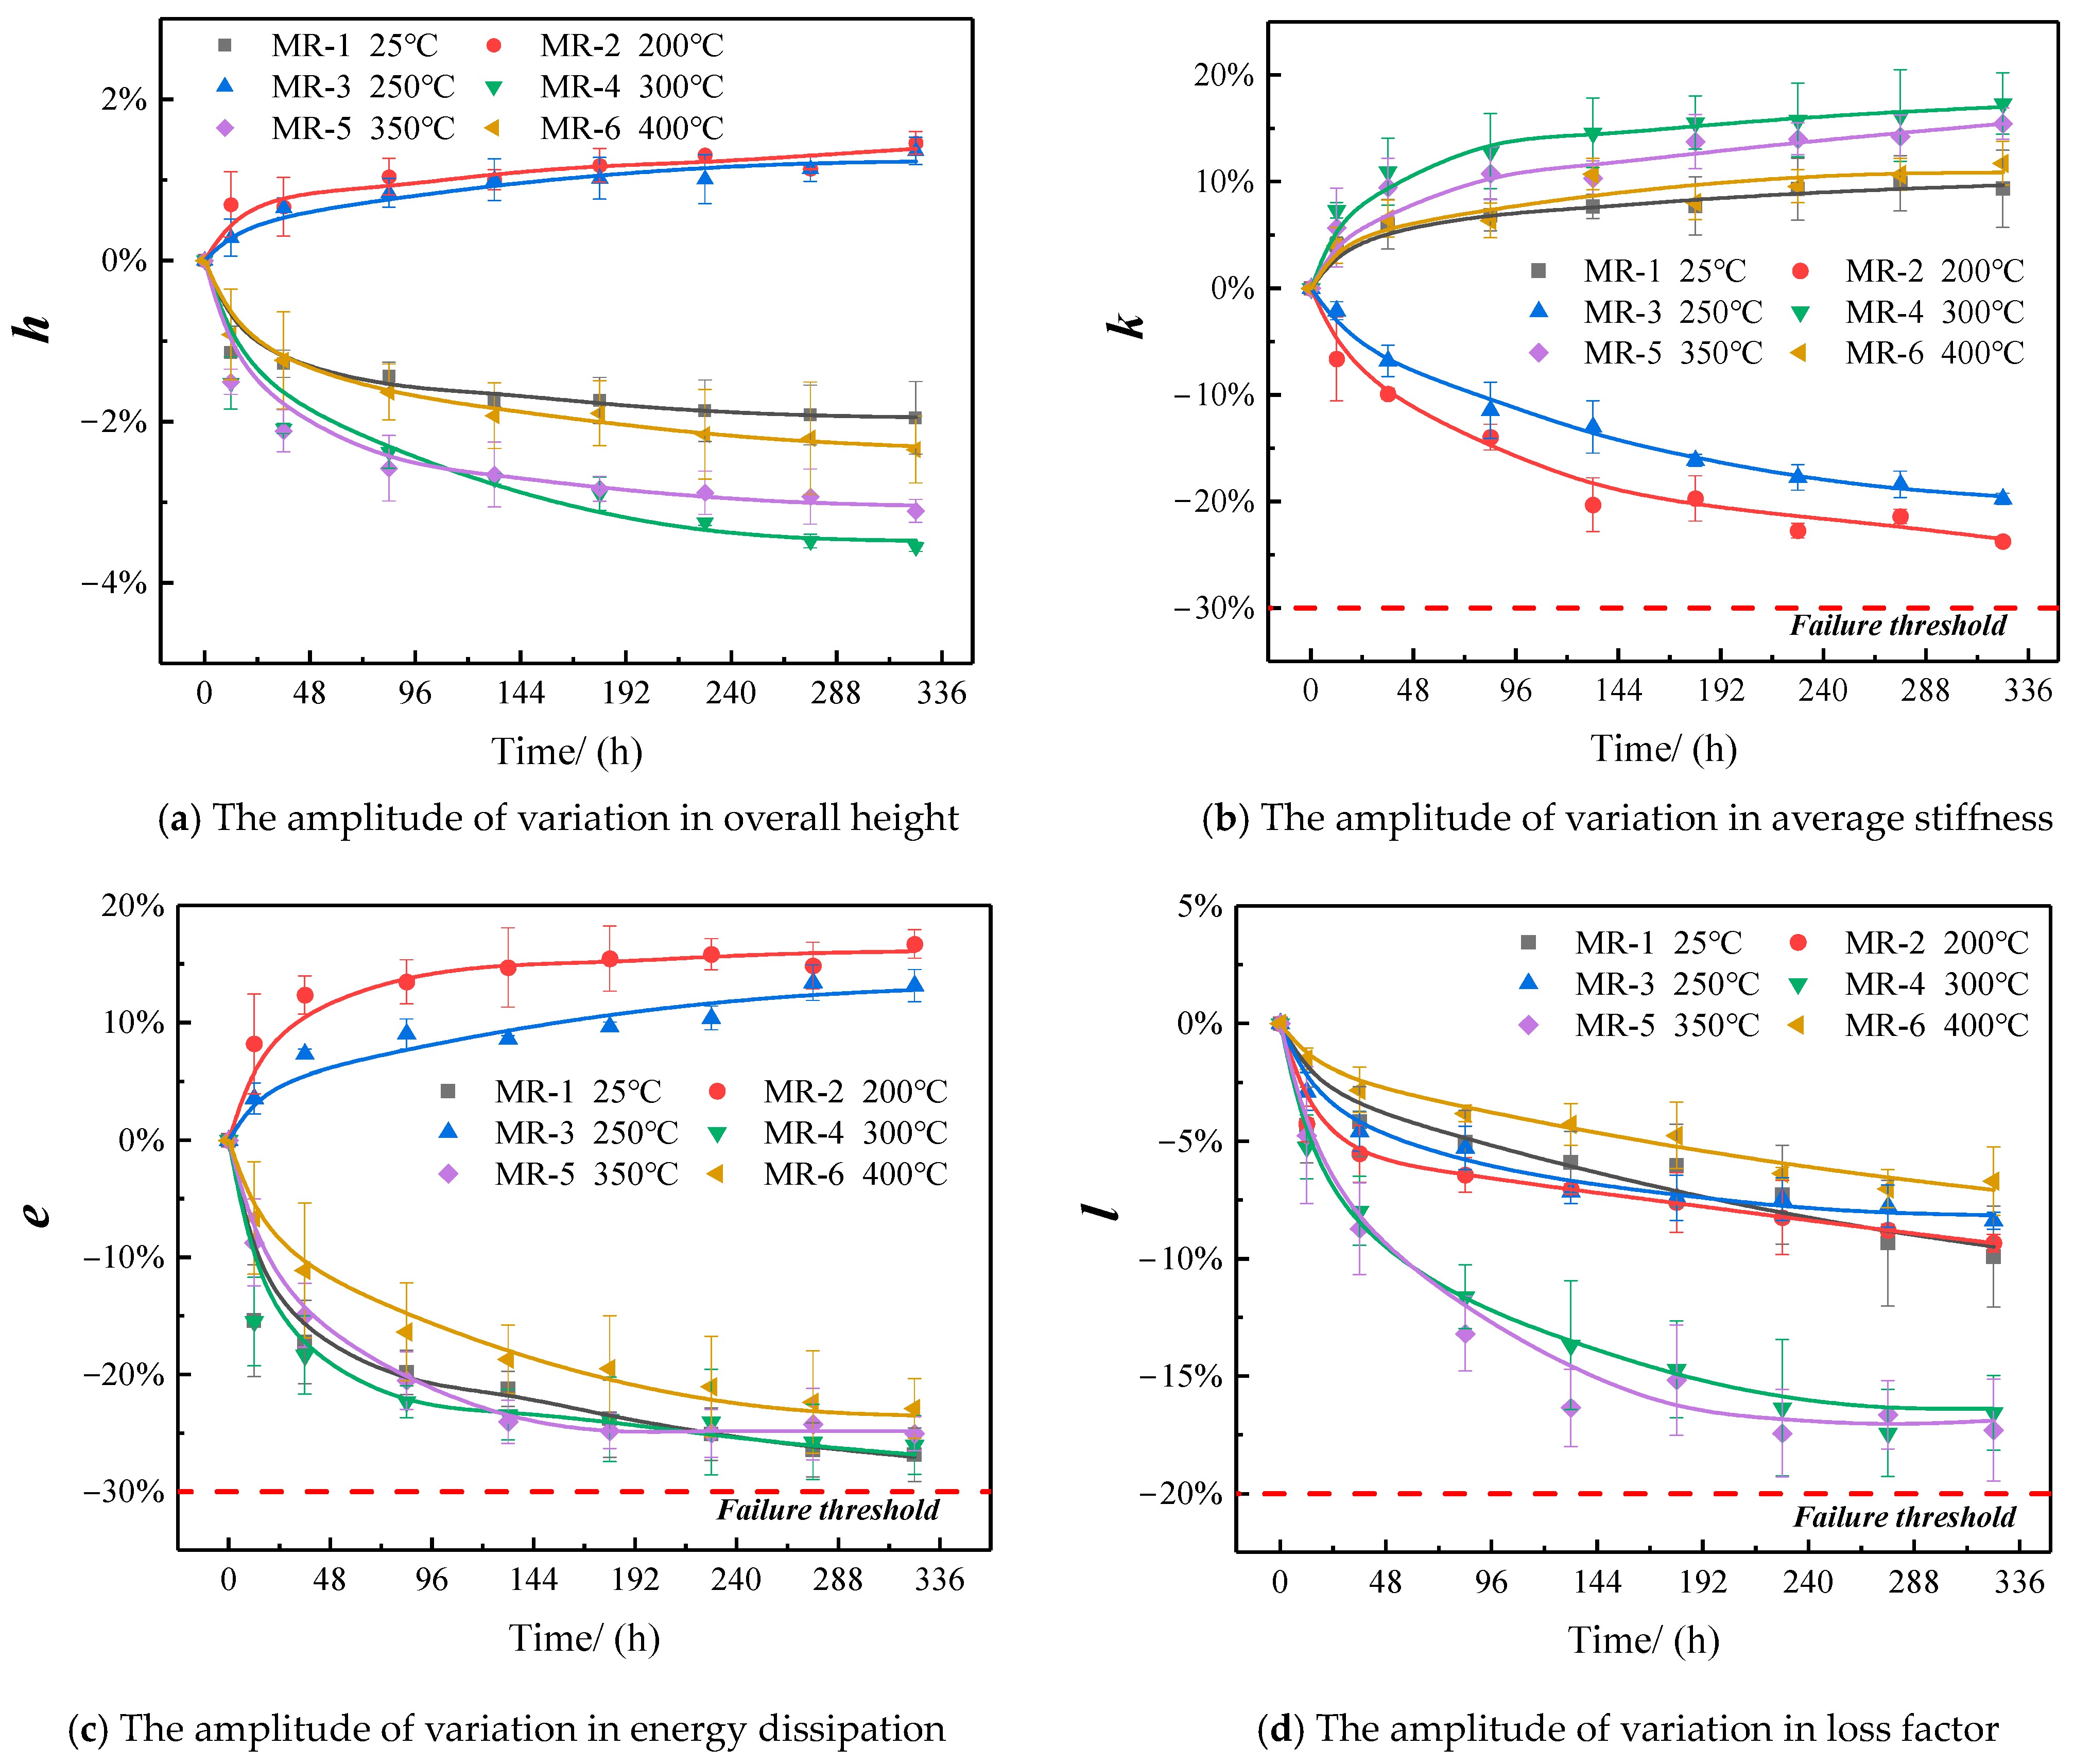
4.2. Effect of Different Environmental Temperatures on Creep Properties of MR

4.2.1. The Amplitude of Variation in the Overall Height of MR at Different Temperatures

During the creep test, the variation in the physical overall dimensions (height) of the specimen could visually represent the creep performance of the specimen. The amplitude of height variation for each group of MR specimens at different test temperatures is shown in Figure 11a. Based on the calculation resulting from Equation (5), it can be seen that the overall height of the four groups of specimens, MR-1, 4, 5, and 6, is continuously decreasing with the increase in creep test time. For the MR specimens (MR-1, 4, 5, and 6) with an overall height reduction, the reduction amplitude is slightly increased and then decreased with the increase in test temperature, indicating that the amplitude of variation in the MR overall height is not simply positively or negatively correlated with the temperature.
However, the overall height of two groups of specimens, MR-2 and 3, is continuously increasing. Which means that MR-2 and 3 expanded after the creep test at 200 °C and 250 °C instead. For the MR-2 and 3 specimens, the overall height increase amplitude of the MR-3 specimens (test at 250 °C) is slightly smaller than the MR-2 specimens (test at 200 °C).
Actually, the measured height variation of the MR during the creep experiment is the result of a combination of the external mechanical load and thermal load. The wires within MR specimens would be wrapped and compressed further during the long--term of static compression loading, leading to a reduction of height. The physical dimension of the metallic porous structure MR would be expanded due to heat, on the contrary, resulting in an increase in height. The schematic diagram of the compression and expansion of MR during the creep test is illustrated in Figure 12. With an increase in the creep test time, the material constitutive properties of MR would be changed due to the loading of the mechanical load and thermal load. Hence, stiffness characteristics and damping characteristics could be regarded as the functions of mechanical load, thermal load, and test time. The final result of the variation of height depends on the competition result of compression and expansion. Furthermore, with the increase of the creep test time, the degradation of the MR material properties is becoming more and more serious, leading to the variation of the performance parameter. In other words, the elasticity and damping parameters of MR are the functions of test temperature, external load, and service time. Hence, the variation of the average stiffness, energy dissipation, and loss factor would be represented in the following sections.

4.2.2. The Amplitude of Variation in Average Stiffness and Energy Dissipation of MR at Different Temperatures

The amplitude of variation in average stiffness and energy dissipation are important indicators of mechanical properties of MR specimens. When the amplitude of variation in the overall height of the specimen has not reached the failure threshold, it is not easy to determine whether the variation in mechanical properties has reached the failure threshold. Hence, it is necessary to consider average stiffness and energy dissipation for determining whether the specimen has failed or not.
In Figure 11b,c, it can be seen that the variation in the average stiffness and the variation in the energy dissipation are inversely related. For the MR specimens (MR-1, 4, 5, and 6), an increase in the average stiffness of the specimen means a decrease in its energy dissipation. This could be attributed that the decrease in the overall height of the forming direction of the specimen, resulting in a relative increase in the density of the specimen. Meanwhile, an increase of density also causes an increase in the number of wires with the slip and stick contact status, as shown in Figure 13a,b, leading to an increase in the friction resistance and hysteresis resistance between the wires. Therefore, when the external applied load of the forming direction remains constant, a relative lowering in the deformation would be caused, the average stiffness is increased, and the energy dissipation is decreased. For the MR-2 and 3 specimens, because the overall height of the specimen increases slowly, leading to a relative decrease in its density, the number of wires with non-contact status is increased, as shown in Figure 13c, and the friction resistance and hysteresis resistance between the wires is then decreased. Hence, the deformation caused by the external applied load increases, the average stiffness is decreased, and the energy dissipation is increased.

4.2.3. The Amplitude of Variation in Loss Factor of MR at Different Temperatures

In Figure 11d, all the loss factors of the six groups MR specimens decrease at different test temperatures, and the decrease trend of the loss factors tended to level off with the increase in test time. It can be seen that there is a significant difference in the reduction amplitude of the loss factor of the six groups of MR specimens. The amplitudes of the reduction of the loss factors of MR-4 (test at 300 °C) and MR-5 (test at 350 °C) specimens are significantly higher than those of the other four groups of specimens, and the reason for this phenomenon would be verified and explained by a further material characterization analysis of the microstructures and phases of the MR in the next sections.
In summary, based on the creep performance curves of the MR illustrated in Figure 11, it can be learned that the trend of performance variations of the specimen at the above six temperatures are not consistent. At the four temperatures of 25 °C, 300 °C, 350 °C, and 400 °C, the overall height of the specimen gradually decreases, the average stiffness gradually increases, and the energy dissipation and loss factor both continue to decrease. However, at 200 °C and 250 °C, the variation in overall height, average stiffness, and energy dissipation of the specimens represent opposite trends compared with the other four temperatures, except for the loss factor which continues to decrease.
Based on the test results in Table 4, it can be concluded that the creep resistance of the above six groups of specimens did not reach the threshold value for determining their failure within the test time range of this study.
It should also be noted that the failure threshold value of the MR specimens should also be adjusted with different MR working conditions and specific design requirements. The failure threshold proposed in this study is based on the previous experience of the authors, thus allowing a relatively large range of variation in the performance of the MR specimen. Under the more restrictive working conditions with higher requirements, the failure threshold specified for the specimens should be smaller to ensure the reliability and stability of the device where the specimen is installed.

4.3. Effect of Different Environmental Temperatures on the Microstructures of MR

The creep properties variations of the MR at high temperature in the above results are reflected in the overall physical structural and performance variations at a macroscopic level, and the differences in the properties variations of the MR at the above six temperatures need to be further analyzed and characterized at a microscopic level.

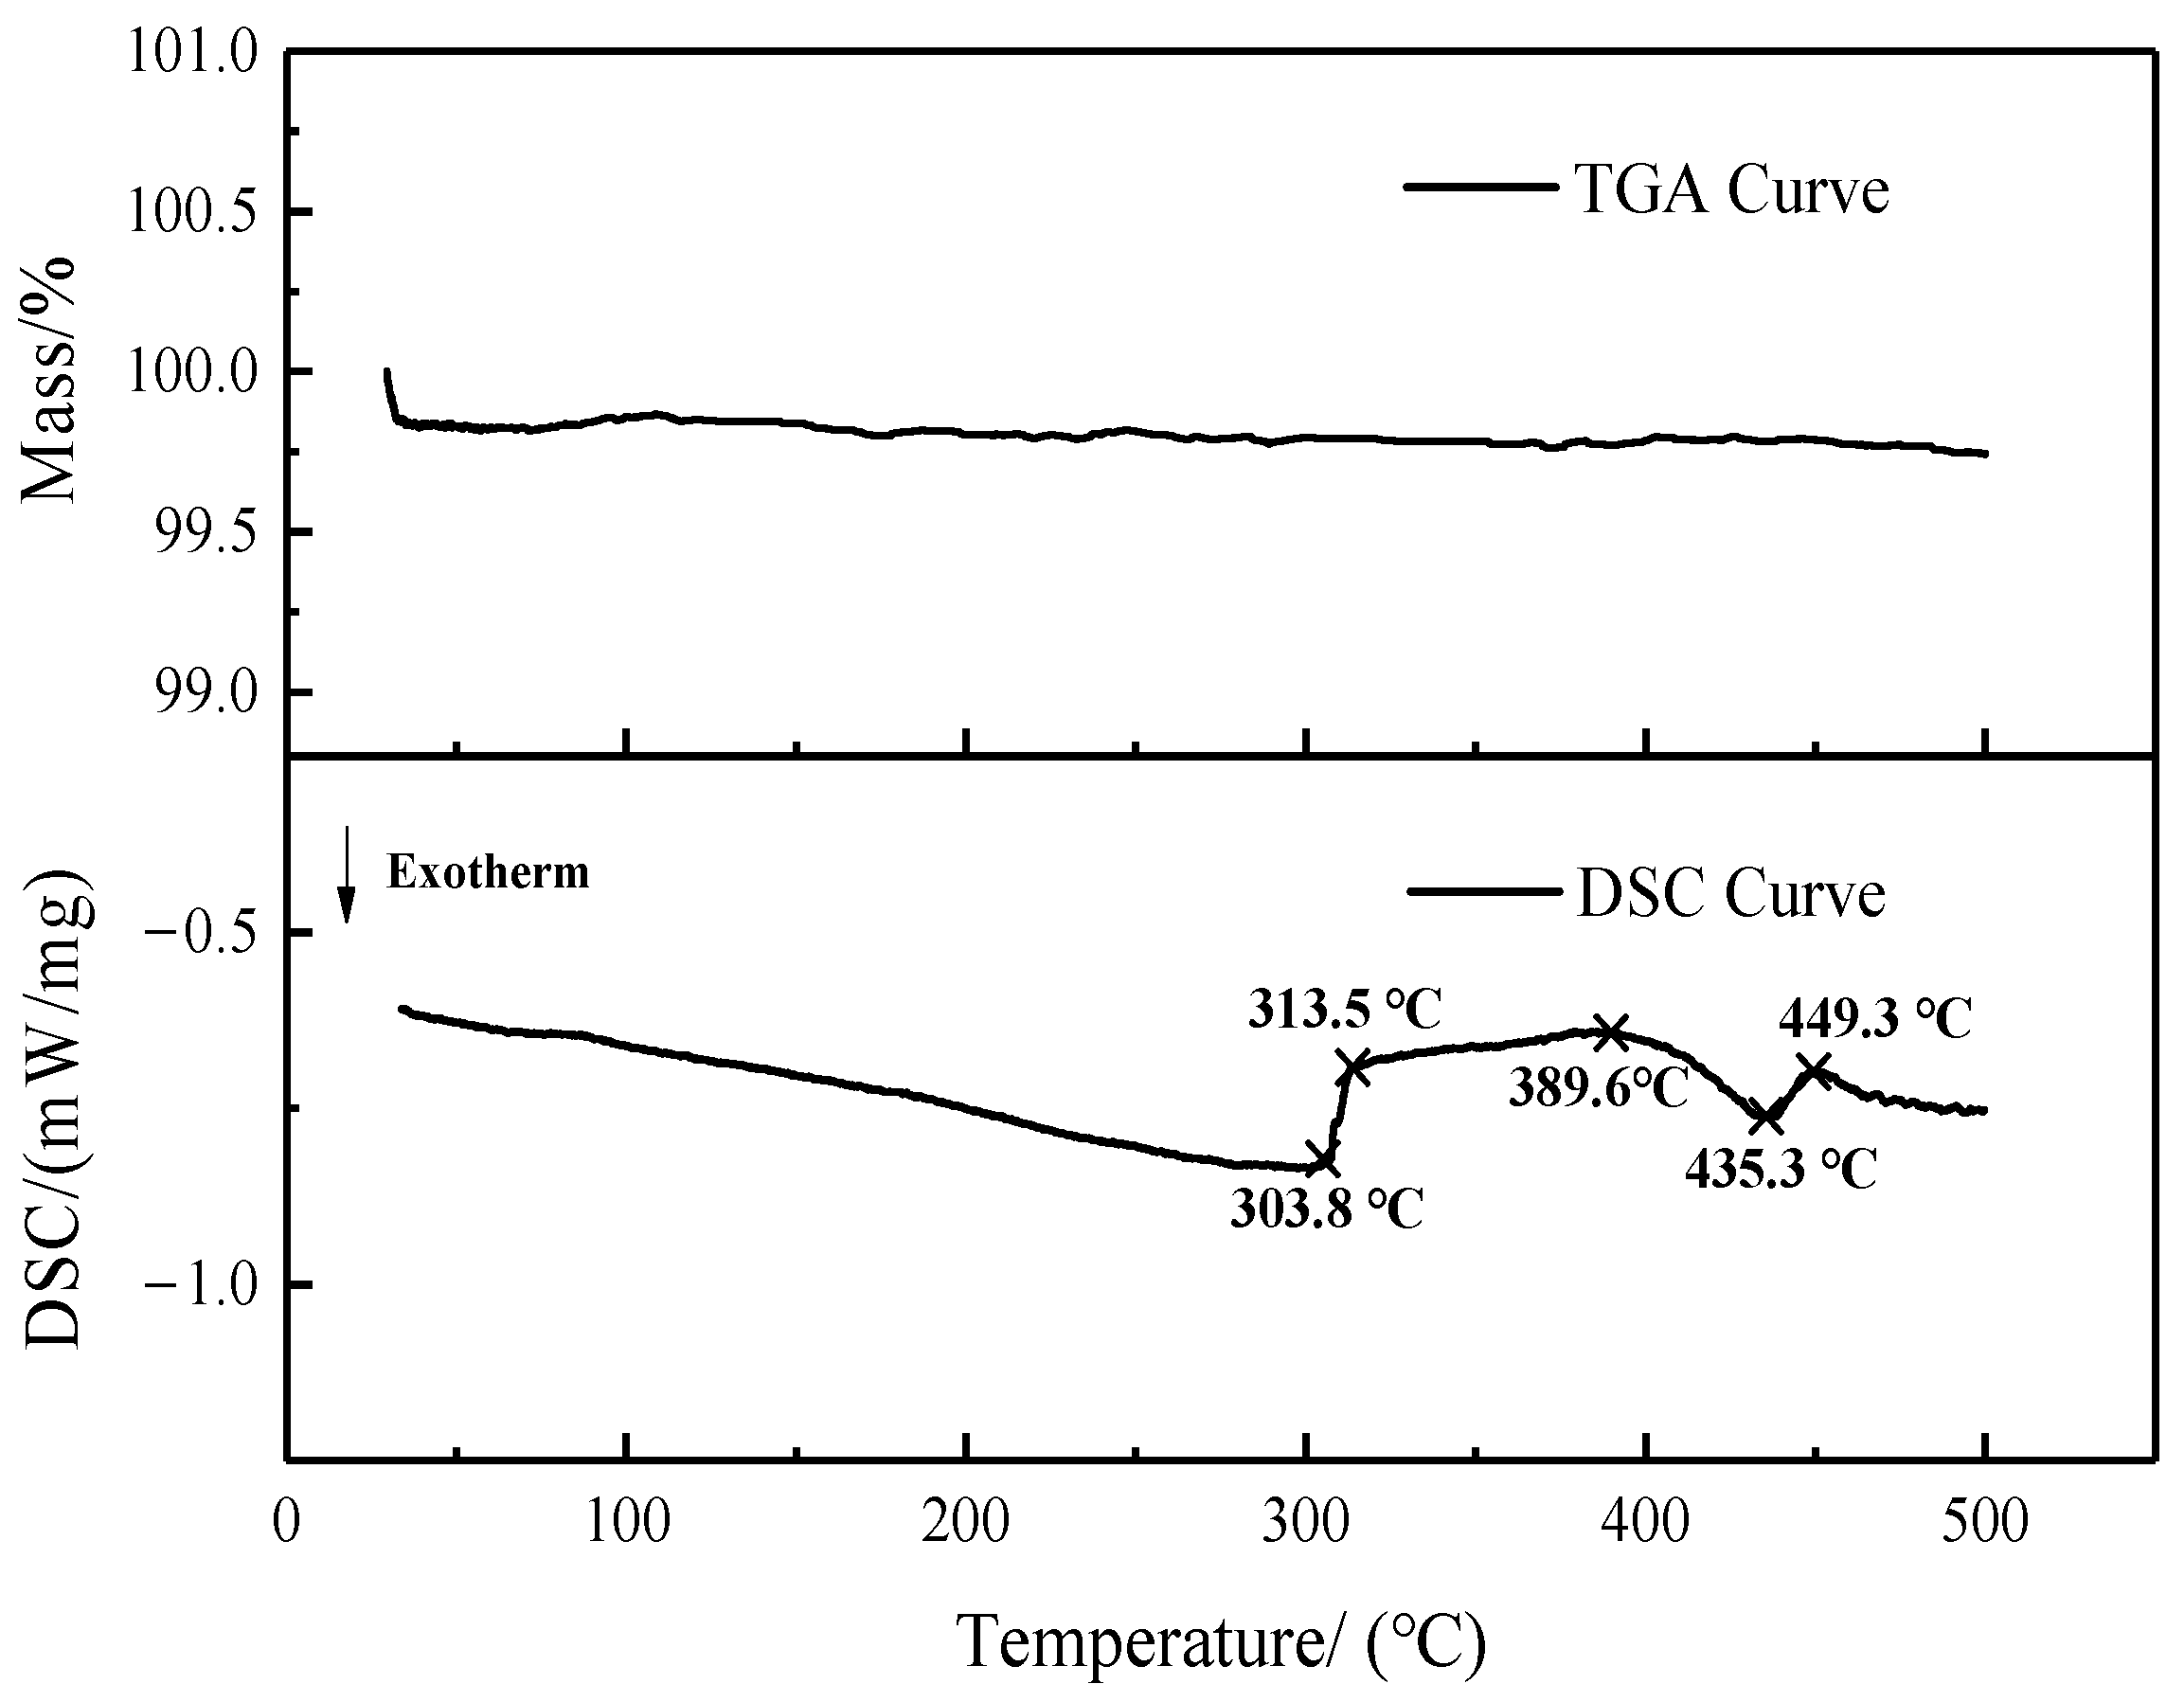
4.3.1. Thermogravimetric Analysis/Differential Scanning Calorimetry Analysis

Before the creep test, some metal wires were extracted from the MR specimen (after heat treatment), the wire samples were then tested and analyzed by using a simultaneous thermal analyzer (STA449C/6/G, NETZSCH, Selb, Germany) within an Argon atmosphere. The thermogravimetric analysis (TGA) results are represented in Figure 14; it is found that the weight of the samples remained almost unchanged within the test temperature range. Based on the differential scanning calorimetry (DSC) results shown in Figure 14, it can be seen that the DSC curve of the sample has a downward trend before 300 °C, indicating an exothermic phenomenon. This could be attributed the fact that the wire samples were removed from the cold pressed and heat-treated MR, wires were wrapped together with each other, and the wire samples behaved in the shape of a spiral bend. With a continued increase in the test temperature, the samples will be heated to release residual stress, leading to the exothermic phenomenon. When the temperature reaches 303.8 °C, the trend of the DSC curve begins to move upwards, with a peak in heat absorption at 313.5 °C, and the upward tendency ends at about 390 °C, indicating that the wire samples behave as a phase transition during this range. From about 390 °C, the DSC curve started to show a downward trend again; the exothermic phenomenon of this time is due to the fact that the samples start to conduct phase transitions again, and an exothermic peak is at about 435 °C. Additionally, the curve started to shift toward the heat absorption direction at about 435 °C and end at about 450 °C. This is due to the fact that the sample itself was tempered at 450 °C, so there is a phase transition at this temperature and a heat absorption peak then appeared.

4.3.2. Phase Composition by X-ray Diffraction Pattern Analysis

In order to make the analytical results of TGA/DSC curves more convincing, the specimens after different temperature tests are analyzed by an X-ray diffraction method (XRD, CEM, Matthews, NC, USA) in this study, and the results of the XRD tests are presented in Figure 15.
Based on the XRD patterns, it can be found that the ferrite diffraction peaks (110)α and (211)α in specimen MR-3 are gradually enhanced compared to specimen MR-2, and the austenite diffraction peak is nearly not shifted, indicating that at 250 °C, martensite starts to be generated in MR-3 specimen, so the plasticity and toughness of MR specimens are slightly decreased, and its hardness and strength are slightly increased, resulting in a slightly smaller amplitude of properties variation of MR-3 specimens than MR-2 specimens.
In Figure 15, compared to MR-1, 2, and 3, it can be inferred that a more significant phase transition occurs in MR-4 and 5 specimens. The austenite diffraction peaks (111)γ, (200)γ, (220)γ, and (311)γ in the specimens are gradually weakened, and the ferrite diffraction peaks (110)α, (200)α, and (211)α are gradually increased. The austenite diffraction peak reaches the lowest and the ferrite diffraction peak reaches the highest for MR-5 tested at a temperature of 350 °C, indicating that a significant portion of austenite generates phase transformation induced martensite during the test at 300 °C and 350 °C, resulting in an increase in hardness and strength of the MR specimens. However, a decrease in plasticity and toughness would also be caused. Therefore, in the process of the high-temperature creep test, the specimens show a higher variation in performance at these two temperatures. Due to a low level of plasticity and toughness, the variation amplitude of the loss factor is significantly different from that of the MR specimens tested at the other four temperatures (Figure 11d), and the damping properties of MR would be decayed more rapidly.
When the creep test temperature reached 400 °C, the austenite diffraction peaks (111)γ, (200)γ, (220)γ, and (311)γ in the specimen are enhanced again, and the ferrite diffraction peaks (110)α, (200)α, and (211)α are weakened again, indicating that the phase transition occurred again at about 400 °C, which is consistent with a downward shift in the TGA/DSC curve at about 390 °C (Figure 14). Hence, an increase in austenite content and a decrease in ferrite content in specimen MR-6 are produced, resulting in a decrease in hardness and strength, as well as an increase in plasticity and toughness. Finally, the variation amplitude in the creep properties of specimen MR-6 was significantly smaller than that of specimens MR-4 and 5.

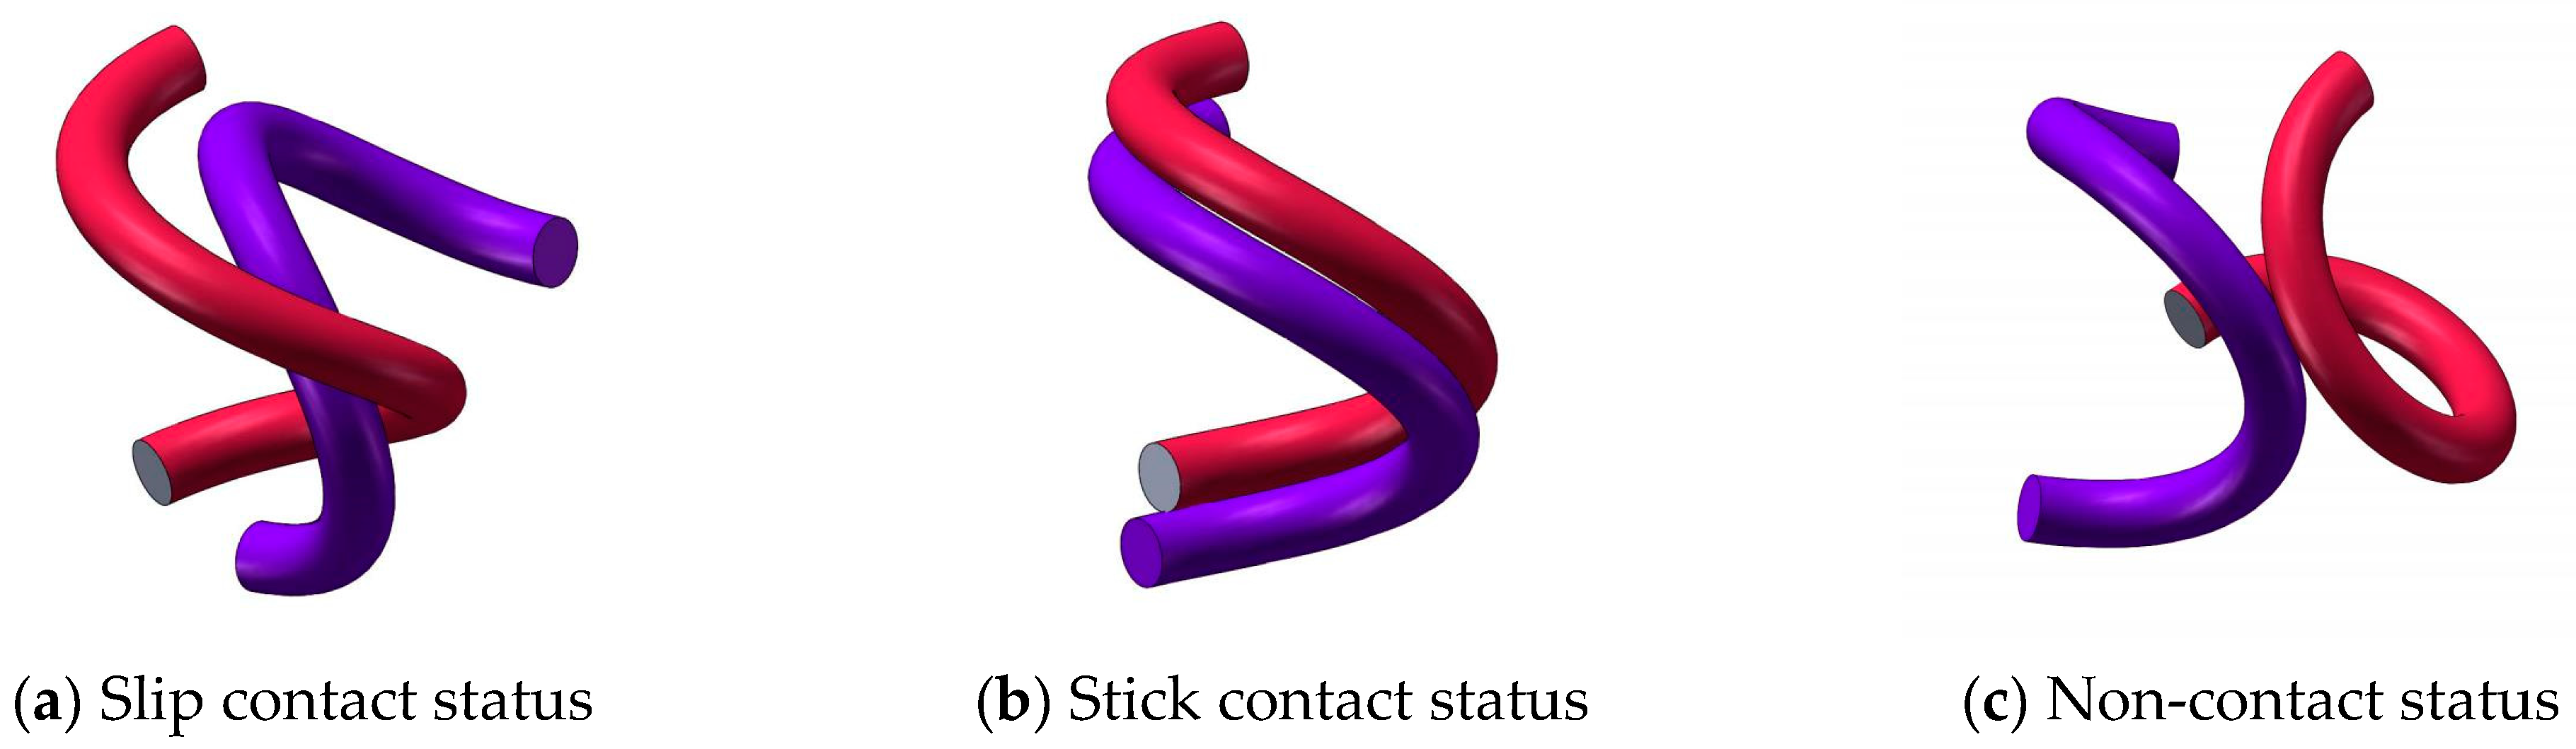
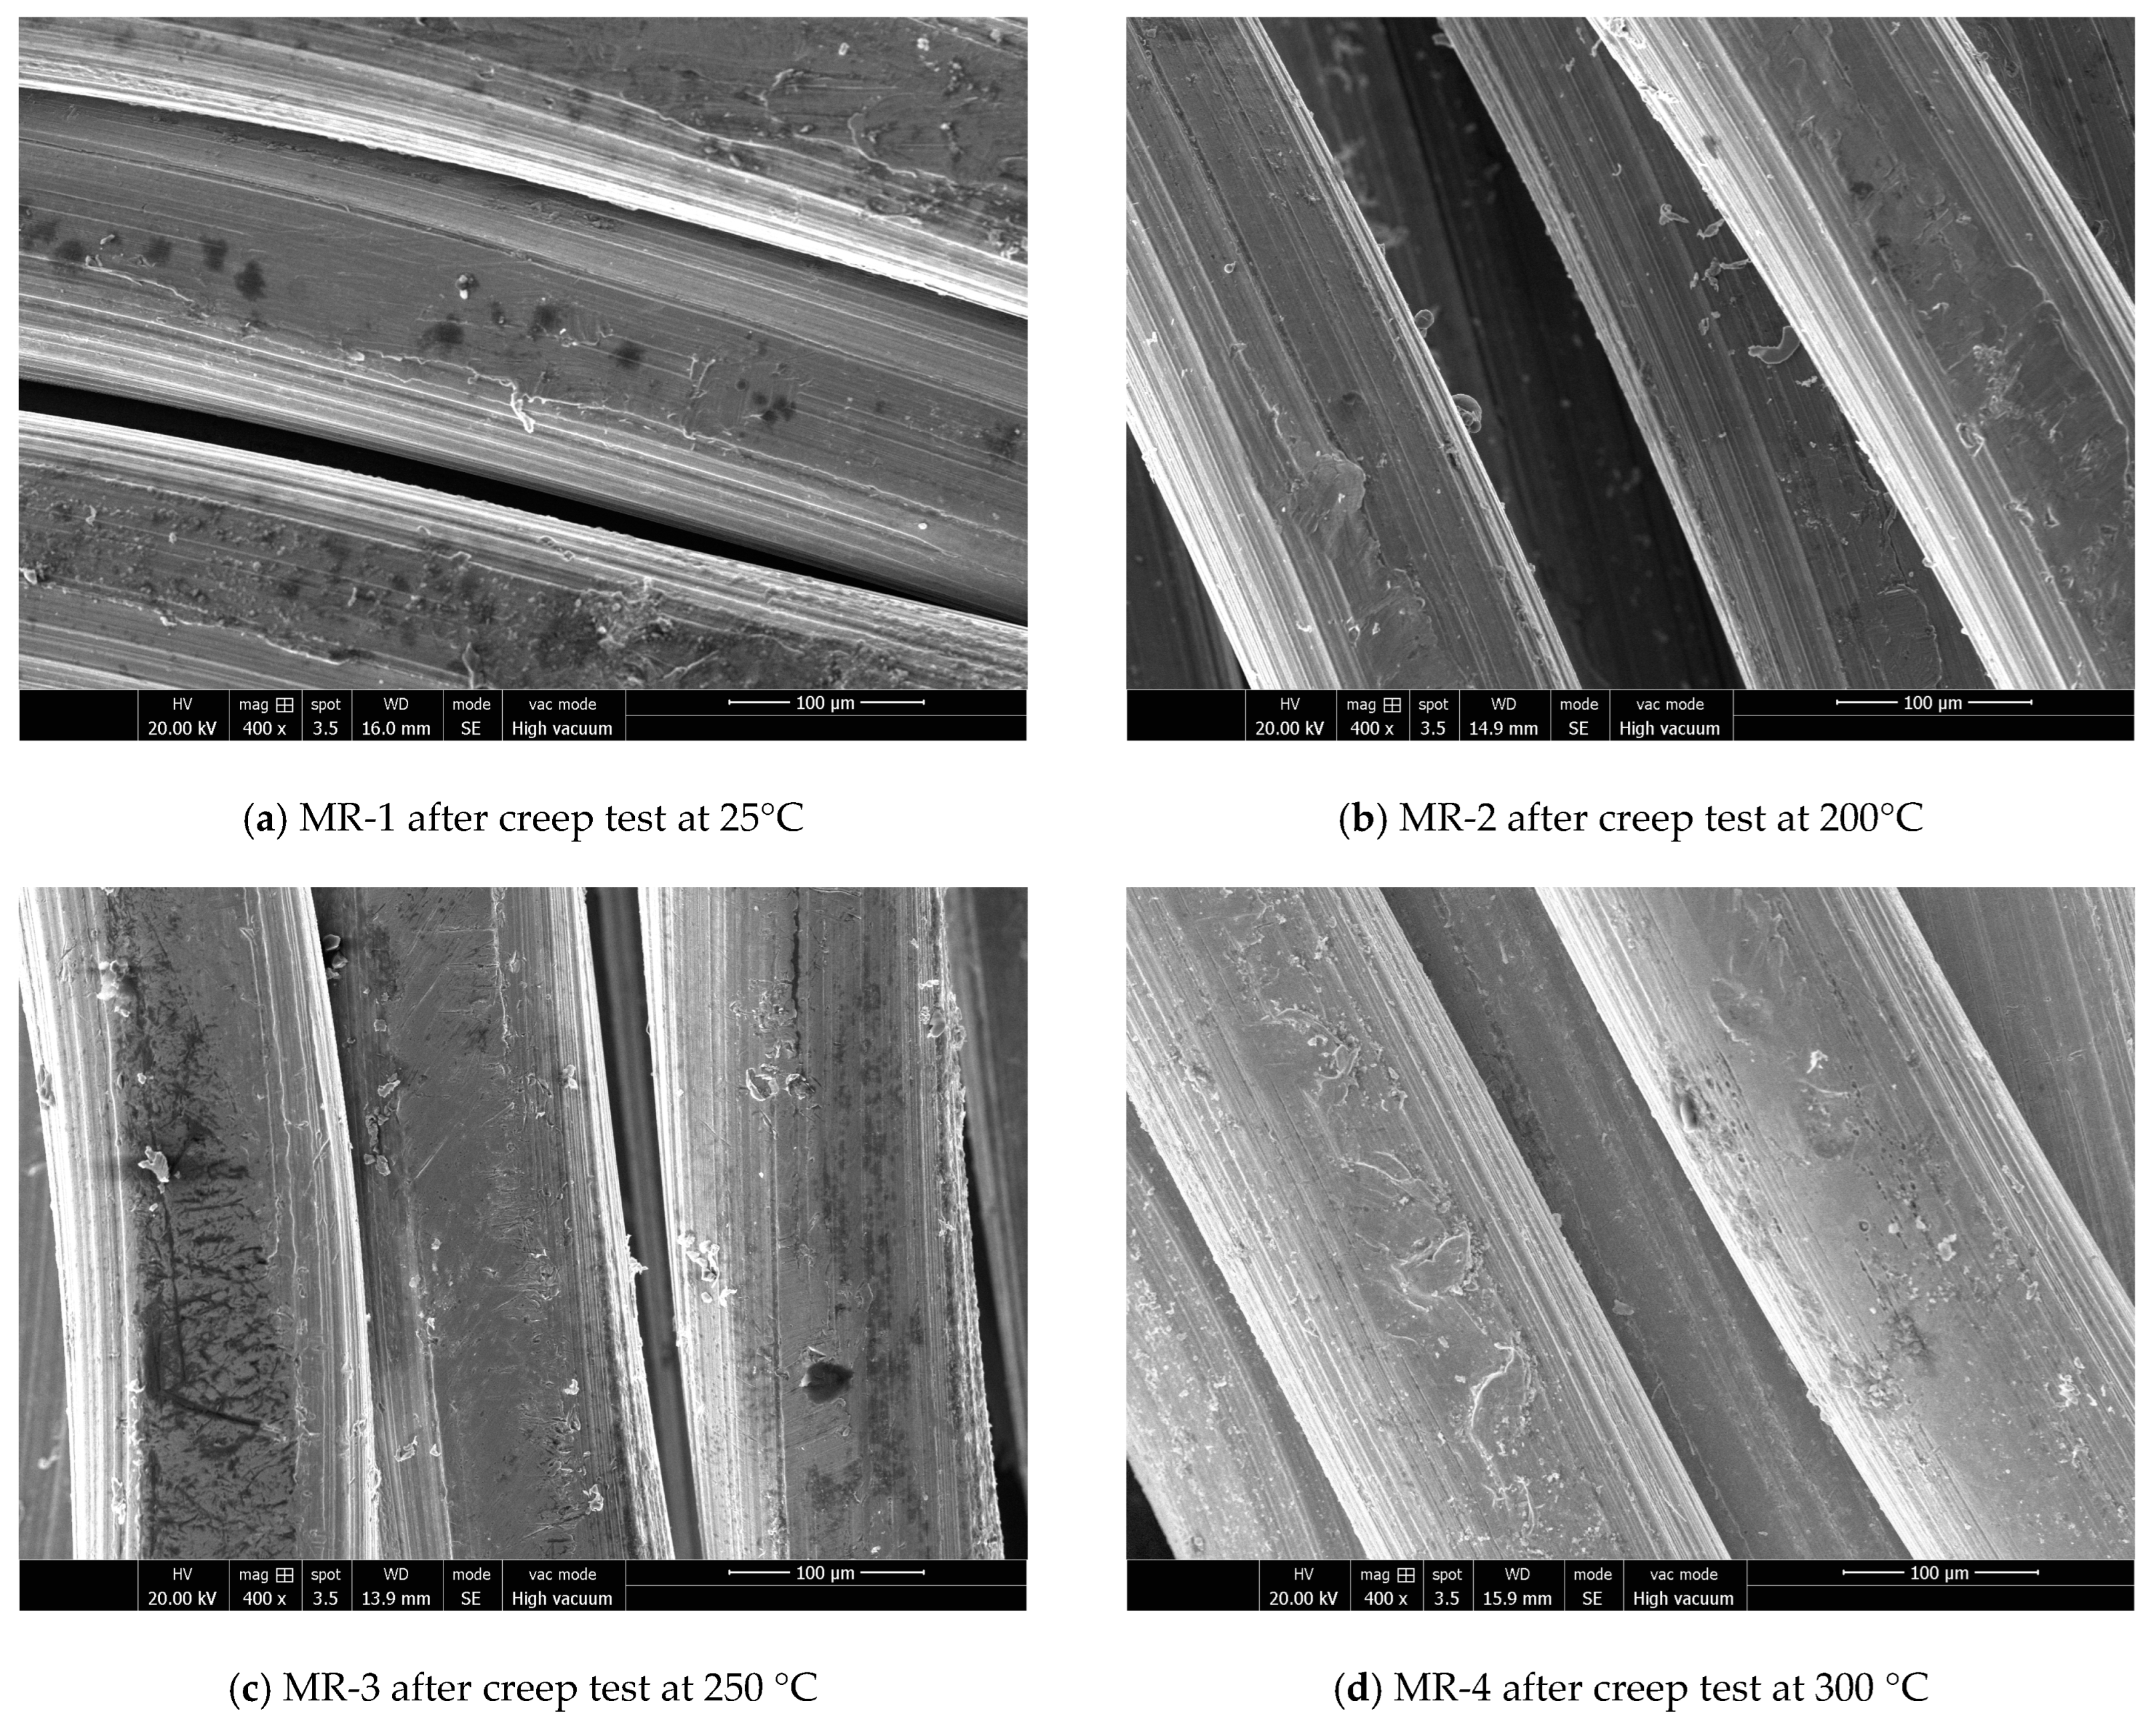
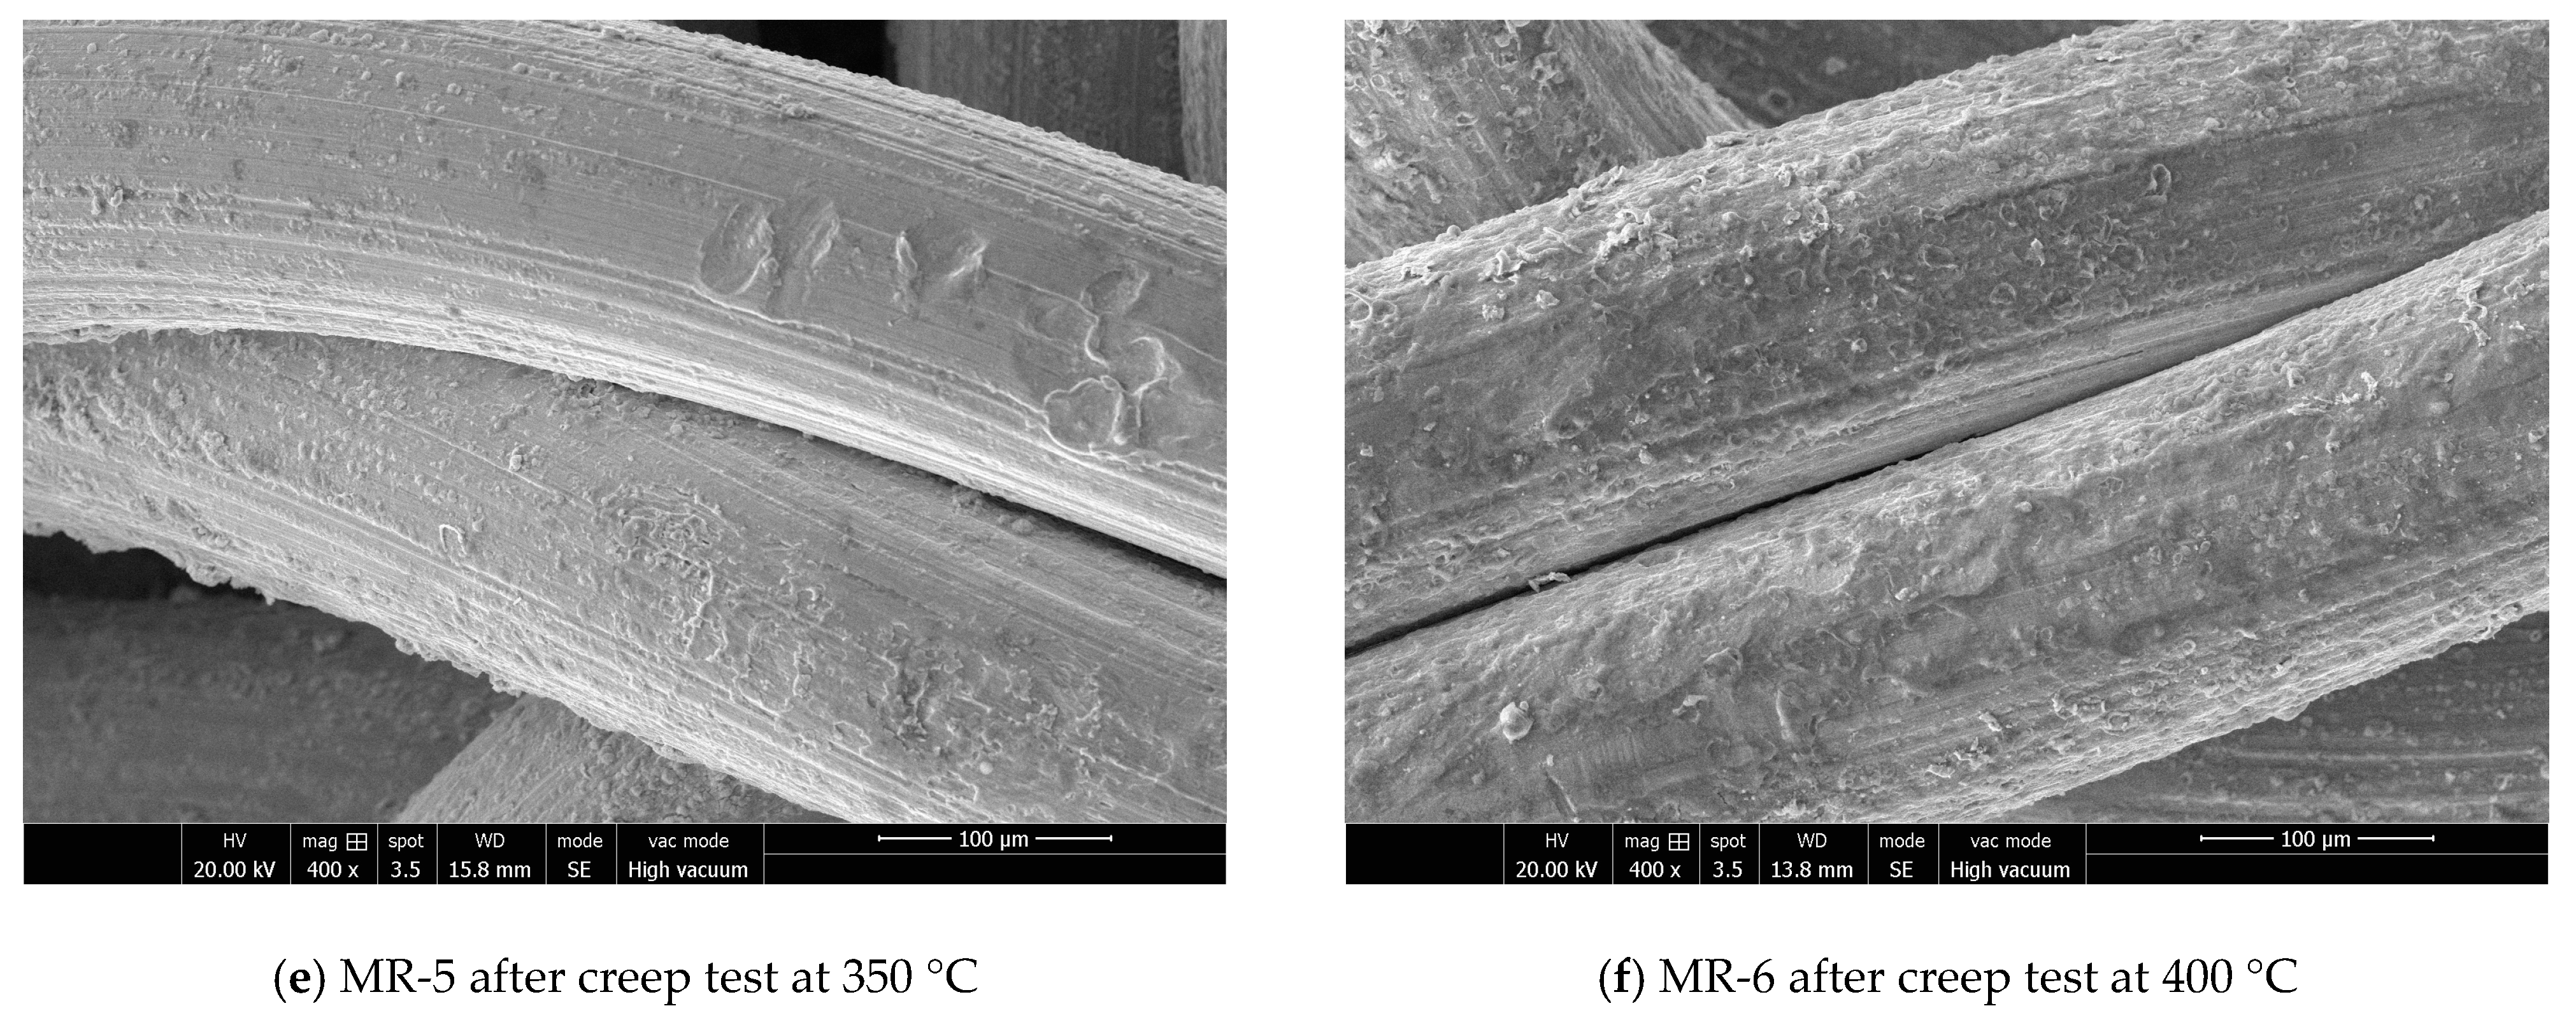
4.3.3. Surface Morphology Observation and Material Failure Mechanism Analysis

In order to investigate the failure mechanisms of MR specimens in the aspect of material surface morphology characterization, the specimens subjected to creep tests at different temperatures were analyzed by a tungsten filament scanning electron microscope (Quanta 250, FEI, Portland, OR, USA), and the surface photographs are illustrated in Figure 16. The specimens were ultrasonically cleaned with alcohol before being placed in the SEM to avoid the effects of impurities generated in the test environments. It can be observed from Figure 16 that there is a significant difference in the surfaces of the specimens tested at different temperatures. With the increase in test temperature, a small amount of adhering oxide gradually appeared on the wire surfaces of MR-1, 2, and 3 specimens. In addition, the wire surfaces of specimens MR-4, 5, and 6 were gradually covered with an oxide layer, leading to an increase in the surface friction coefficient of the wire. Because the austenite transformation of the specimen starts at 389.6 °C, according to Figure 15, it can be found that there is more austenite in specimen MR-6, and its plasticity and toughness are higher than those MR-4 and 5 specimens, therefore the variation amplitude in the properties of specimen MR-6 are smaller than MR-4 and 5. However, although the phases of MR-6 specimen are more consistent with those of MR-2 and 3, the analysis of the surface quality of MR-6 shows that the surface of the wire is rougher and the coefficient of friction on the surface of the specimen is relatively higher, resulting in a much lower plasticity and toughness of specimen MR-6 than that of specimens MR-2 and 3. Hence, the trend of the variation in the properties of specimen MR-6 will show the opposite phenomena to that of MR-2 and 3 specimens.

5. Future Works

The MR material could be regarded as a type of metallic porous material with damping properties. The creep performance of MR would be influenced by many aspects, including the type of raw wire material (stainless steel wires or Ni-base superalloy wires), diameter of the wire, manufacturing process parameters (winding pattern, cold compression load, density of MR), service conditions (temperature, load level, vacuum environment or not), surface treatment (oxidation treatment), and so on. Future research would be conducted on the internal mapping relationships between the creep properties of MR, the manufacturing process parameters, and service conditions. The obtained results would support a valuable reference for reliability evaluation and failure mechanisms analysis of MR material.

6. Conclusions

In this study, the thermostability research of symmetrical metal rubber (MR) specimens (cylinder shape) that were carried out by the long-term creep tests reach 324 h under axisymmetric static compression at elevated temperatures. The failure determination parameters of MR under the coupling of thermal and mechanical static load of forming direction are proposed in terms of four different aspects, and the related failure thresholds for evaluation parameters of MR failure have been determined. The detailed conclusions can be obtained as follows.
(1)
An appropriate tempering heat treatment at 450 °C of cold compression molded MR specimens may bring a reduction of variation in the average stiffness and energy dissipation, and a significant increase in the high temperature creep resistance of the MR specimen can then be obtained. Hence, an appropriate heat treatment for MR specimens can significantly improve the creep resistance at high temperatures.
(2)
There are significant differences in the MR properties variations subjected to creep tests at different elevated temperatures. After continuous static compression loading at 200 °C and 250 °C, the parameters of overall height and energy dissipation of MR specimens are increased; however, the average stiffness and loss factor are decreased. When loading at 25 °C, 300 °C, 350 °C, and 400 °C, the overall height, energy dissipation, and the loss factor are decreased, but the average stiffness is increased. After the creep test at high temperatures with a test time of 324 h in the designed test parameters, all the MR specimens do not reach the failure threshold.
(3)
Based on the analysis of TGA/DSC curves and X-ray diffraction patterns of the MR specimens prepared from 304 stainless steel wire after tempering at 450 °C, its transformation from austenite to martensite is completed at about 313.5 °C. The transformation from martensite to austenite is completed at about 435.3 °C. Then, the transformation of austenite to martensite is completed again at about 449.3 °C. As a result, MR-4 and MR-5 specimens creep tested at 300 °C and 350 °C were predominantly martensitic, resulting in an increase in hardness and strength and a decrease in plasticity and toughness, so that the loss factors of MR-4 and MR-5 specimens are decayed with a higher degree.
(4)
A combination of the results of material characterization could support the explanation for the performance variation trend of MR-2 and MR-3. According to the TGA/DSC curves, the specimens release residual stresses until 300 °C, with the specimen expansion due to the increase of temperature. According to the results of TGA/DSC and X-ray diffraction patterns, the specimens did not undergo a phase transformation at 200 °C and 250 °C, and their microstructures were dominated by austenite, with no significant decrease in overall plasticity and toughness. Finally, by observing the surface of the specimen through SEM, the surface roughness value of the wires inside the specimen would not be increased significantly during the test at 200 °C and 250 °C.

Author Contributions

Conceptualization, F.L. and H.B.; methodology, F.L., N.L., X.X. and H.B.; software, F.L., X.H. and N.L.; validation, X.X., Y.W. and H.B.; formal analysis, F.L.; investigation, F.L., X.H. and N.L.; resources, N.L. and X.X.; data curation, Y.W.; writing—original draft preparation, F.L. and X.H.; writing—review and editing, F.L., N.L. and X.H.; visualization, X.X.; supervision, F.L. and H.B.; project administration, F.L., Y.W. and H.B.; funding acquisition, F.L., Y.W. and H.B. All authors have read and agreed to the published version of the manuscript.

Funding

This research was funded by the National Natural Science Foundation of China (Grant No.52205185, No.51975123, No.52105091 and No. 12272094), Natural Science Foundation of Fujian Province (Grant No. 2020J05102 and No. 2021J05115), and Starting Grants of Fuzhou University (Grant No. GXRC-20018 and No. GXRC-20014).

Data Availability Statement

The data presented in this study are available in article.

Acknowledgments

The authors appreciated the financial supports from the National Natural Science Foundation of China (Grant No.52205185, No.51975123, No.52105091 and No. 12272094), Natural Science Foundation of Fujian Province (Grant No. 2020J05102 and No. 2021J05115), and Starting Grants of Fuzhou University (Grant No. GXRC-20018 and No. GXRC-20014).

Conflicts of Interest

The authors declared that there is no conflict of interest.

References

  1. Bai, H.B.; Zhan, Z.Q.; Ren, Z.Y. Progress and prospect of acoustic properties of metal rubber. J. Vib. Shock. 2020, 39, 242–254. [Google Scholar]
  2. Yu, H.J.; Liu, W.H.; Wang, Y.S. Research on Stiffness Characteristics and Mechanics Model of Metal Rubbers. China Mech. Eng. 2016, 27, 3167–3171. [Google Scholar]
  3. Lu, C.Z.; Li, J.Y.; Zhou, B.Y.; Fang, X.; Li, Y.; He, R.H. Effect of metallic wire materials characteristics on the fatigue properties of metal rubber. J. Vib. Shock. 2018, 37, 137–142. [Google Scholar]
  4. Ao, H.; Ma, Y.; Wang, X.; Chen, J.; Jiang, H. Accelerated Lifetime Test of Vibration Isolator made of Metal Rubber Material; IOP Conference Series: Materials Science and Engineering; IOP Publishing: Bristol, UK, 2017; Volume 167, p. 012051. [Google Scholar]
  5. Safin, A.I.; Igolkin, A.A.; Prokof Ev, A.B. A mathematical model of acoustic properties of gas turbine engine sound absorbing elements made from elastic porous metal rubber. Russ. Aeronaut. (Iz VUZ) 2014, 57, 430–434. [Google Scholar] [CrossRef]
  6. Cao, F.; Bai, H.; He, Z.; Ren, G. A Hysteresis Restoring Force Model of Disc-Shaped Metal Rubber Isolation Component. Appl. Mech. Mater. 2013, 271, 186–189. [Google Scholar] [CrossRef]
  7. Fu, M.; Liu, Y.; Cui, M.L.; Cao, M. Metal-rubber vibration absorber for aerocraft. Opt. Precis. Eng. 2013, 21, 1174–1182. [Google Scholar]
  8. Yan, L.Y.; Qing, H.X.; Lin, L.F. Prediction for Constitutive Relationship of Metallic Rubber with Various Parameters by BP Neural Net. Appl. Mech. Mater. 2012, 110, 3705–3712. [Google Scholar]
  9. Cao, F.L.; Bai, H.B.; Yang, J.C.; Ren, G.Q. Analysis on Fatigue Damage of Metal Rubber Vibration Isolator. Adv. Mater. Res. 2012, 490, 162–165. [Google Scholar] [CrossRef]
  10. Yan, H.; Zhang, W.J.; Jiang, H.Y.; Chen, L. Experimental Study on Fatigue of Metal Rubber Vibration Isolator under Pulsating Cyclic Stress. Appl. Mech. Mater. 2013, 385, 180–183. [Google Scholar] [CrossRef]
  11. Ma, Y.H.; Zhang, Q.C.; Zhang, D.Y.; Zhu, H.; Lu, H.; Hong, J. Failure criterion and durability characteristics of metal rubber under static compression load. J. Beijing Univ. Aeronaut. Astronaut. 2016, 42, 227–235. [Google Scholar]
  12. Xiao, K.; Bai, H.B.; Xue, X.; Wu, Y. High Temperature Energy Dissipation Characteristics of Damping Structure Coated with Metal Rubber. Mater. Mech. Eng. 2019, 43, 28–32. [Google Scholar]
  13. Zi, B.; Ding, Z.Y.; Wu, Y.W.; Bai, H. High Temperature Mechanics Modeling and Experimental Research of Metal Rubber Coated Damping Structure. China Mech. Eng. 2022, 33, 1294–1301. [Google Scholar]
  14. Li, T.; Bai, H.B.; Xue, X.; Wu, Y. Fatigue Properties of Knitted-dapped Metal Rubbers under High Temperature Environment. China Mech. Eng. 2019, 30, 1009–1017. [Google Scholar]
  15. Ma, Y.; Zhang, Q.; Zhang, D.; Scarpa, F.; Liu, B.; Hong, J. A novel smart rotor support with shape memory alloy metal rubber for high temperatures and variable amplitude vibrations. Smart Mater. Struct. 2014, 23, 125016. [Google Scholar] [CrossRef]
  16. Zhang, D.Y.; Xia, Y.; Zhang, Q.C.; Ma, Y.H.; Hong, J. Researches on metal rubber mechanics properties in retrospect and prospect. J. Aerosp. Power 2018, 33, 1432–1445. [Google Scholar]
  17. Wang, B.; Zhang, C.Y.; Ma, X.F.; Lai, K.; Wen, H.H. Key problems on the mechanical behavior of nuclear materials and structures of pressured water reactors. Sci. Sin. (Phys. Mech. Astron.) 2019, 49, 6–23. [Google Scholar]
  18. Gao, Y.J.; He, Y.B.; Cao, M. Long-term Structural Integrity Analysis for Reactor Pressure Vessel under In-vessel Retention Condition. At. Energy Sci. Technol. 2021, 55, 252–257. [Google Scholar]
  19. Yang, J.C.; Liu, G.Q.; Dong, X.P.; Bai, H.B. Effect of Tempering on Microstructure and Property of Cr-Ni-Mn Stainless Steel Wire. Hot Work. Technol. 2011, 40, 175–177. [Google Scholar]
  20. Liu, B.L.; Ma, Y.H.; Zhang, D.Y.; Hong, J. Experiment investigation on the effect of heat treatment on metal rubber mechanical properties. J. Beijing Univ. Aeronaut. Astronaut. 2013, 39, 259–263. [Google Scholar]
  21. Cao, F.L.; Bai, H.B.; Li, G.Z.; Li, D.W.; Yang, J.C. Effects of Tempering on Mechanical Property and Macro-structure Dimension of Meta Rubber. Hot Work. Technol. 2014, 43, 189–191. [Google Scholar]
Figure 2. The definition of secant modulus and average stiffness of MR.
Symmetry 15 00281 g002
Figure 3. Definition of parameters of MR during a quasi-static condition.
Symmetry 15 00281 g003
Figure 4. Preparation process of MR specimens.
Symmetry 15 00281 g004
Figure 5. Comparison of hysteresis curves of MR specimens before and after tempering heat treatment.
Symmetry 15 00281 g005
Figure 6. Comparison of microstructures of MR before and after heat treatment.
Symmetry 15 00281 g006
Figure 7. Comparison of XRD patterns before and after tempering heat treatment.
Symmetry 15 00281 g007
Figure 8. Machines for creep testing at high temperatures.
Symmetry 15 00281 g008
Figure 9. The research framework and flow chart.
Symmetry 15 00281 g009
Figure 10. Comparison of the various properties of MR-0 (without tempering) and MR-4 (with tempering).
Symmetry 15 00281 g010
Figure 11. Effect of different environmental temperatures on the various properties of metal rubber.
Symmetry 15 00281 g011
Figure 12. Schematic diagram of compression and expansion of MR during the creep test.
Symmetry 15 00281 g012
Figure 13. The contact status between wires within the MR specimen.
Symmetry 15 00281 g013
Figure 14. TGA/DSC curves of MR specimen wires.
Symmetry 15 00281 g014
Figure 15. X-ray diffraction patterns of specimens after tests at different temperatures.
Symmetry 15 00281 g015
Figure 16. Morphological observation of MR specimens after creep test at different temperatures.
Symmetry 15 00281 g016aSymmetry 15 00281 g016b
Table 1. Processing parameters of MR specimens.
Test Group
Number
Average Density
/(g/cm3)
Average Mass
/(g)
Average Forming Force/(kN)
MR-02.198.3413.35
MR-12.228.4213.40
MR-22.188.2813.26
MR-32.258.4613.29
MR-42.208.3513.37
MR-52.248.4413.33
MR-62.228.3613.39
Table 2. Comparison of the properties of MR specimens before and after tempering heat treatment.
Status of MRH
/(mm)
K
/(N/mm)
E
/(N*mm)
LU
/(N*mm)
Before heat treatment20.5647.1470.190.179124.97
After heat treatment20.6498.4841.800.19867.33
Amplitude of variation0.4%108.9%−40.4%10.6%−46.12%
Table 3. Experimentation scheme for MR specimens.
Test Group
Number
Test TemperatureTempering
Heat Treatment
The Number of Specimen Tested
MR-0300℃NO1
MR-125℃YES3
MR-2200℃YES3
MR-3250℃YES3
MR-4300℃YES3
MR-5350℃YES3
MR-6400℃YES3
Table 4. The amplitude of variation in various properties of the MR specimens at 324 h.
Group Number of the Specimenh (%)k (%)e (%)l (%)
MR-1−1.959.33−26.84−9.91
MR-21.46−23.7616.71−9.33
MR-31.36−19.7613.15−8.39
MR-4−3.5517.33−27.51−16.55
MR-5−3.1115.44−25.04−17.30
MR-6−2.3511.73−24.88−6.69
Disclaimer/Publisher’s Note: The statements, opinions and data contained in all publications are solely those of the individual author(s) and contributor(s) and not of MDPI and/or the editor(s). MDPI and/or the editor(s) disclaim responsibility for any injury to people or property resulting from any ideas, methods, instructions or products referred to in the content.

