
Audio-Visual Effects of a Collaborative Robot on Worker Efficiency


Abstract
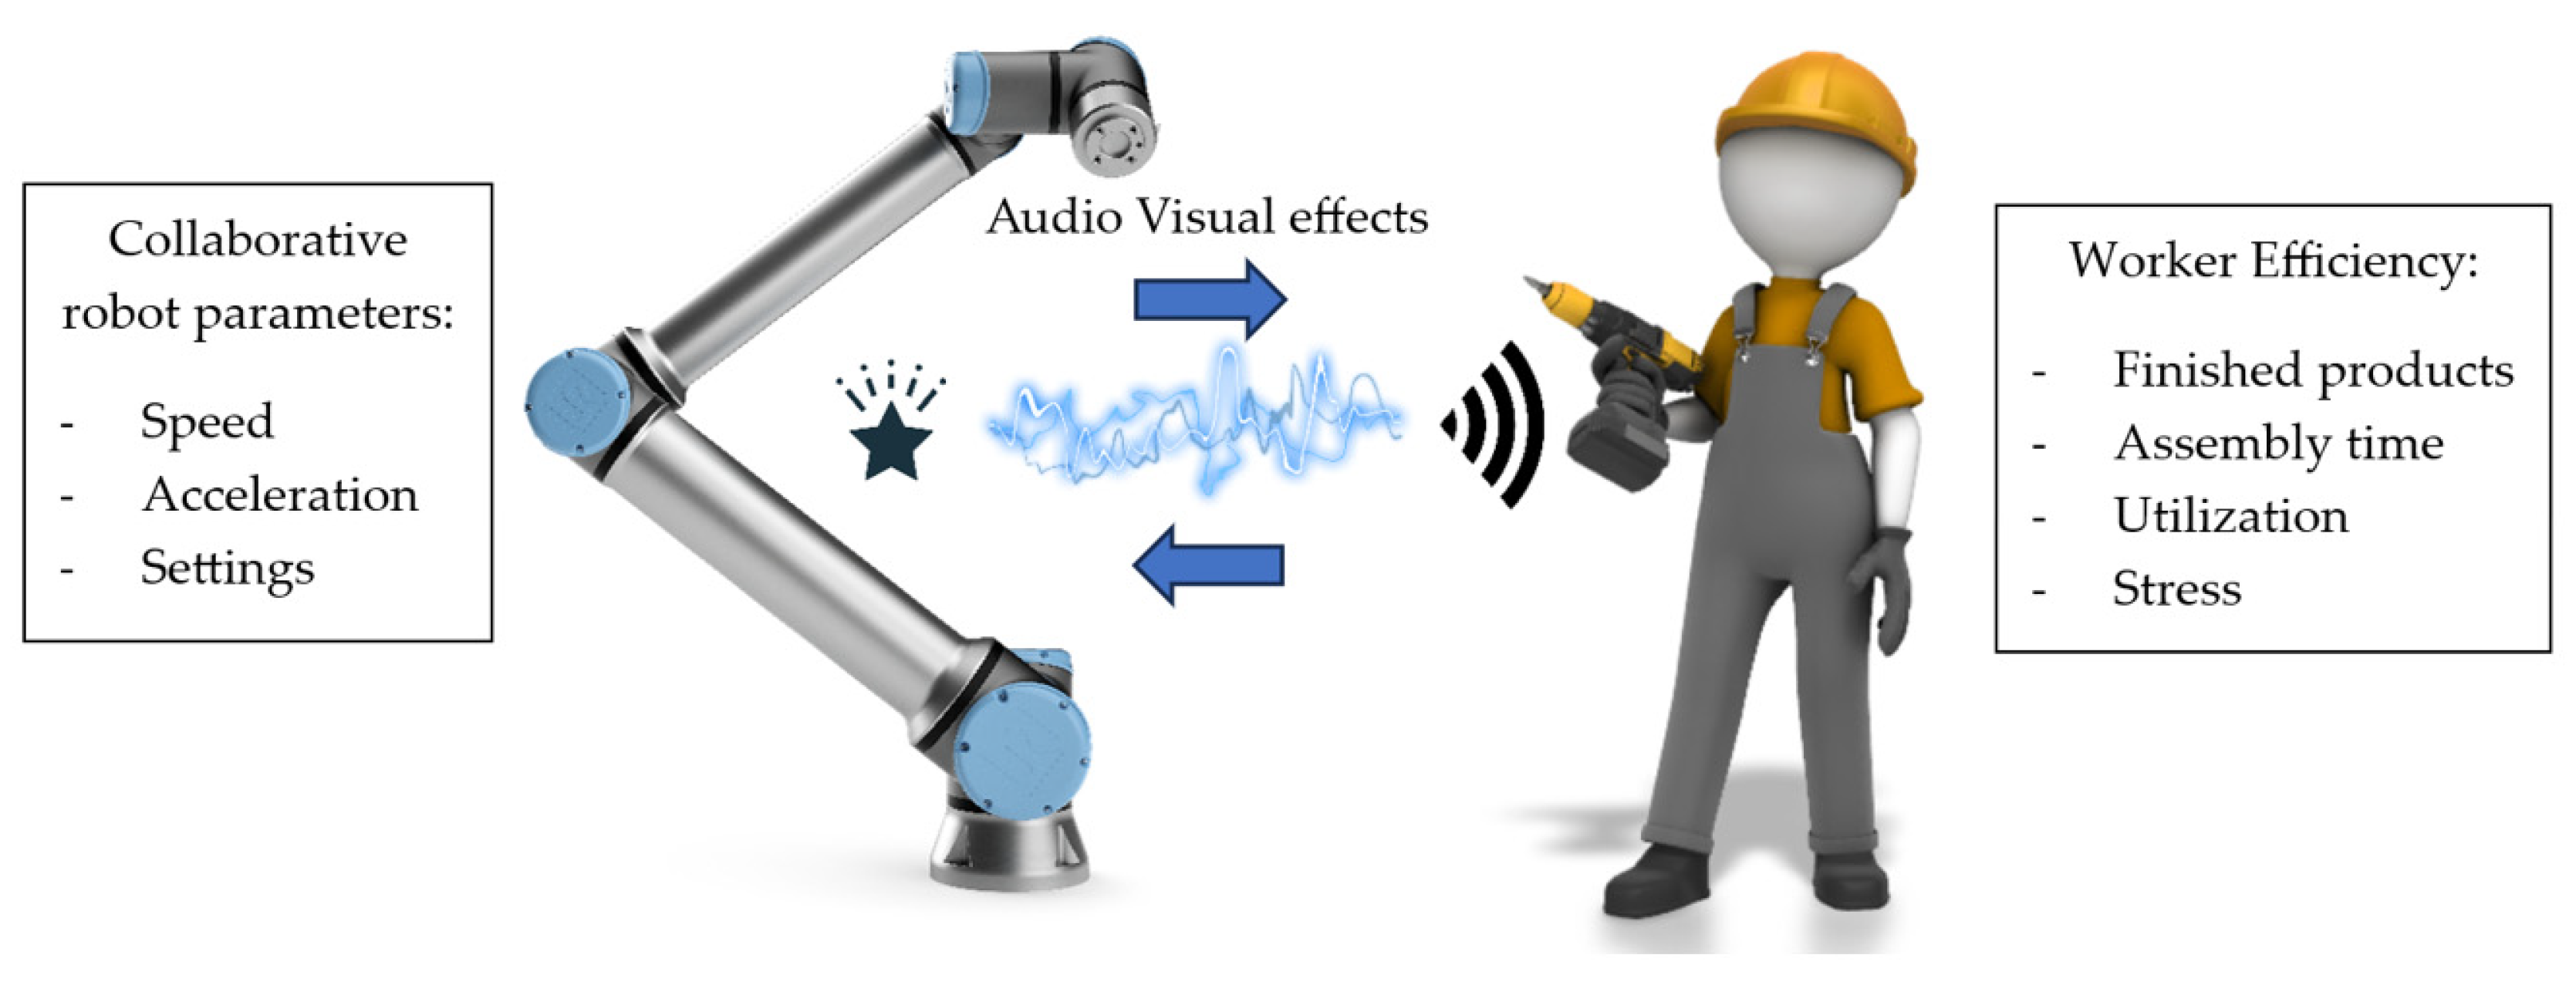
:1. Introduction
- RQ1: Does changing the CR motion parameters affect CW efficiency?
- RQ2: Does CR sound and visual contact between the worker and the CR affect CW efficiency?
- RQ3: Which type of scenario (design of CW) is the most suitable for the workers?
2. Methods
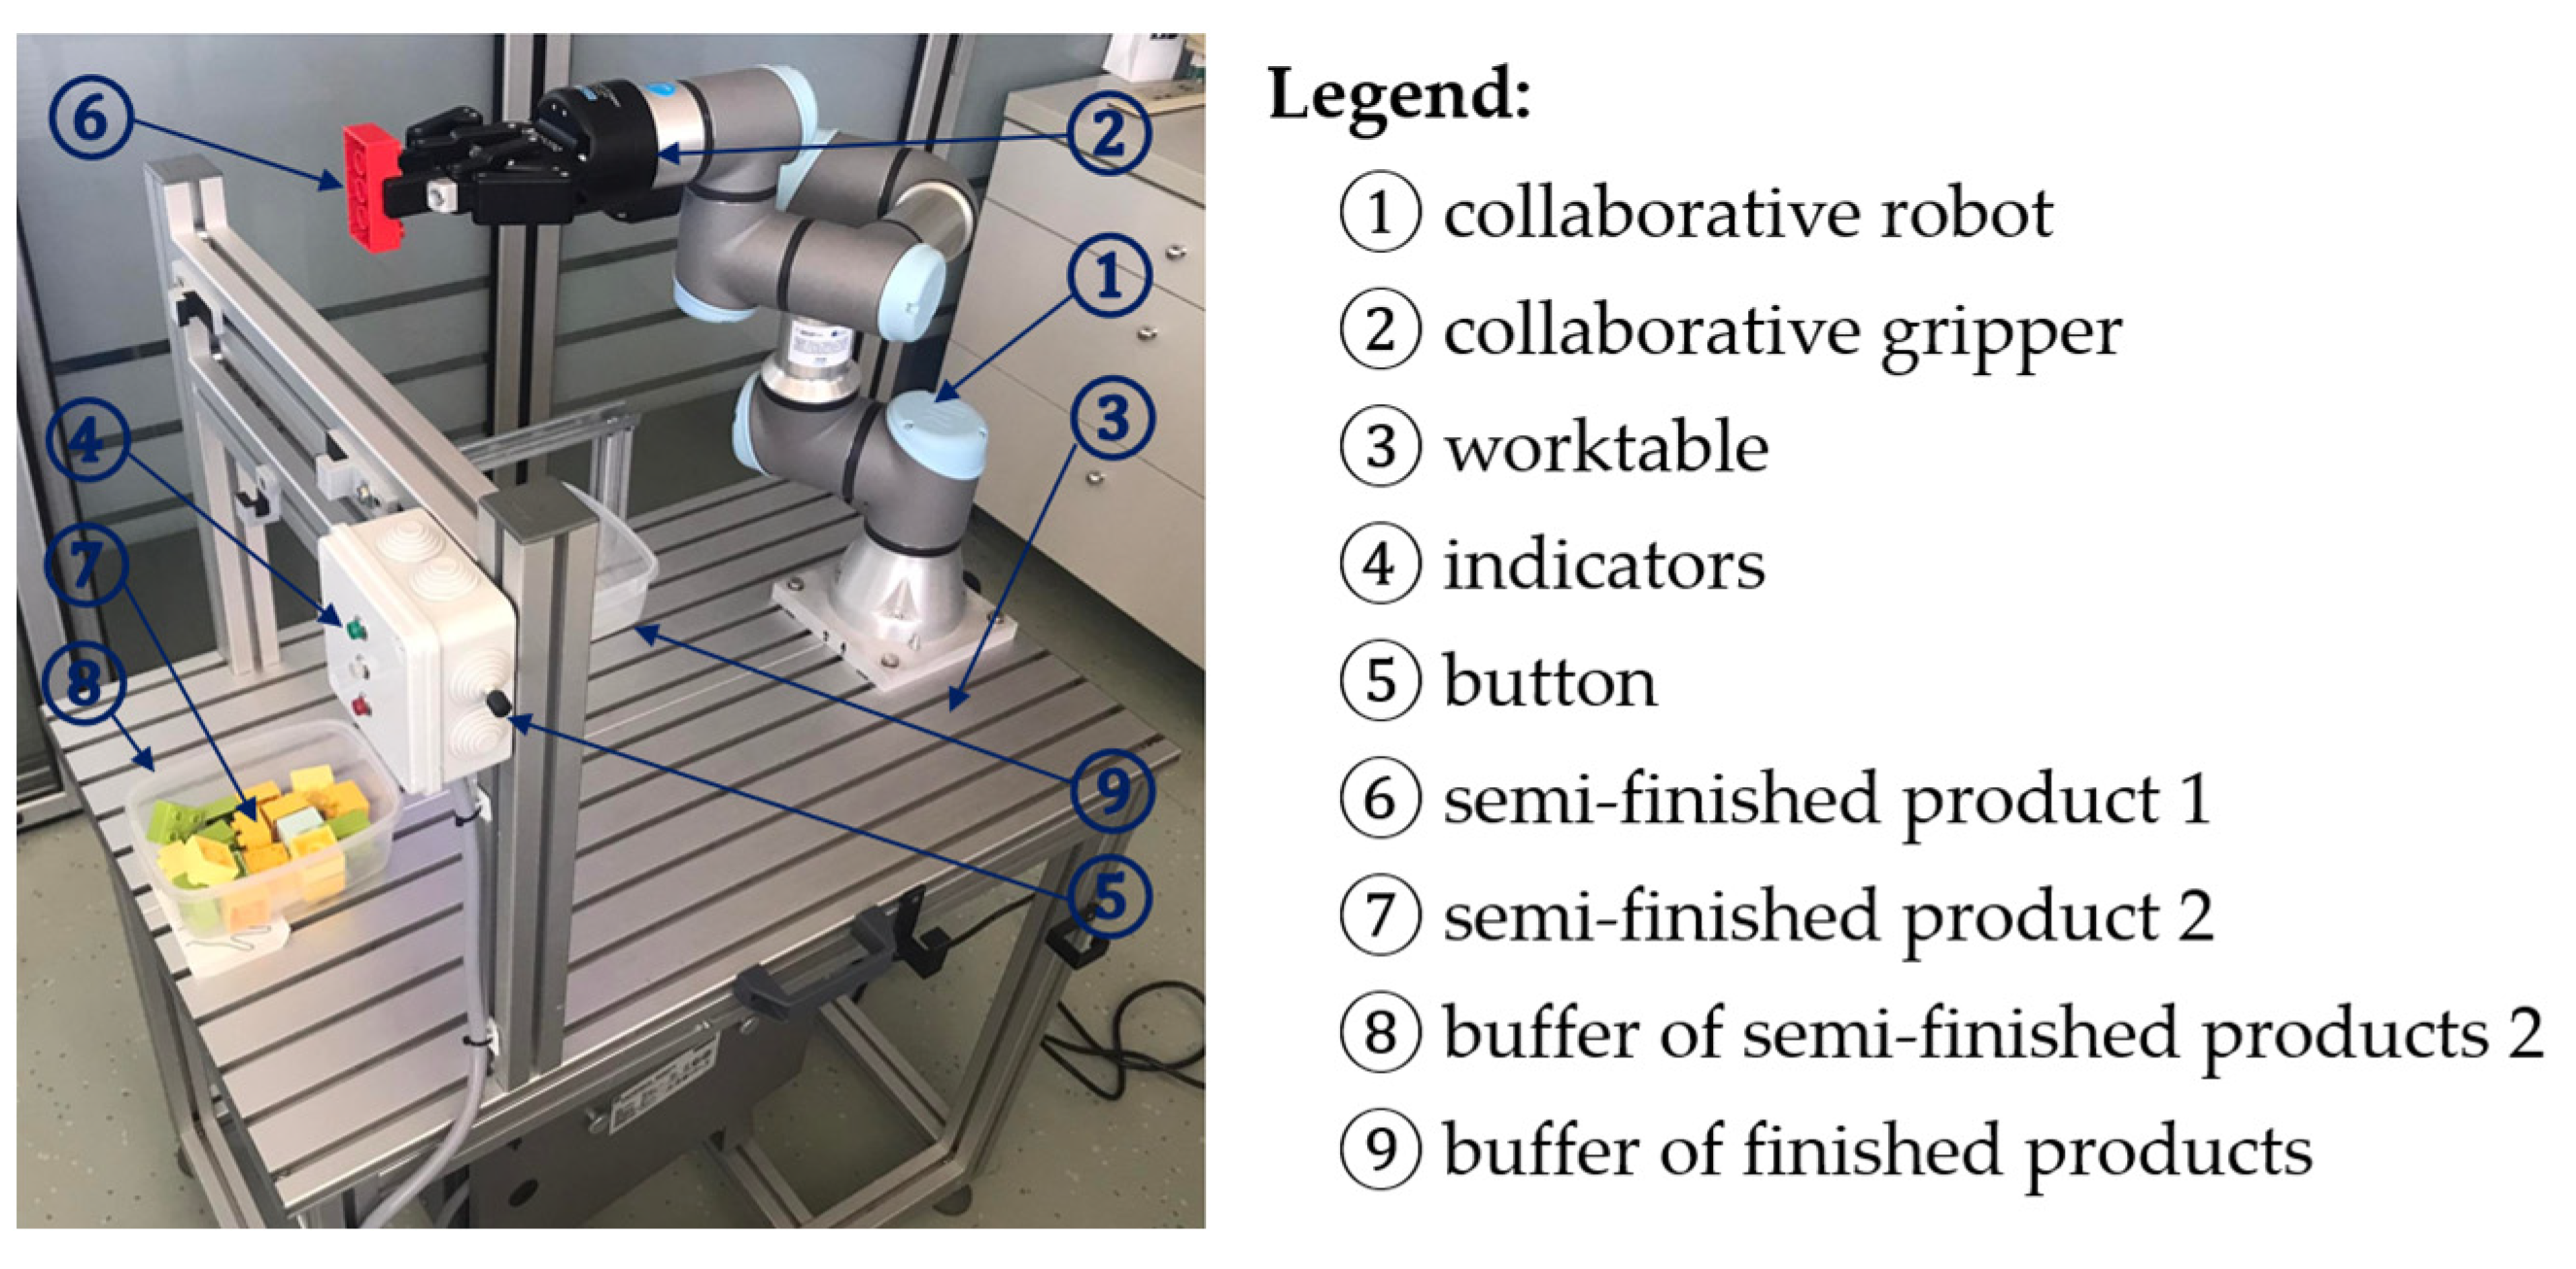
2.1. Collaborative Workplace Description
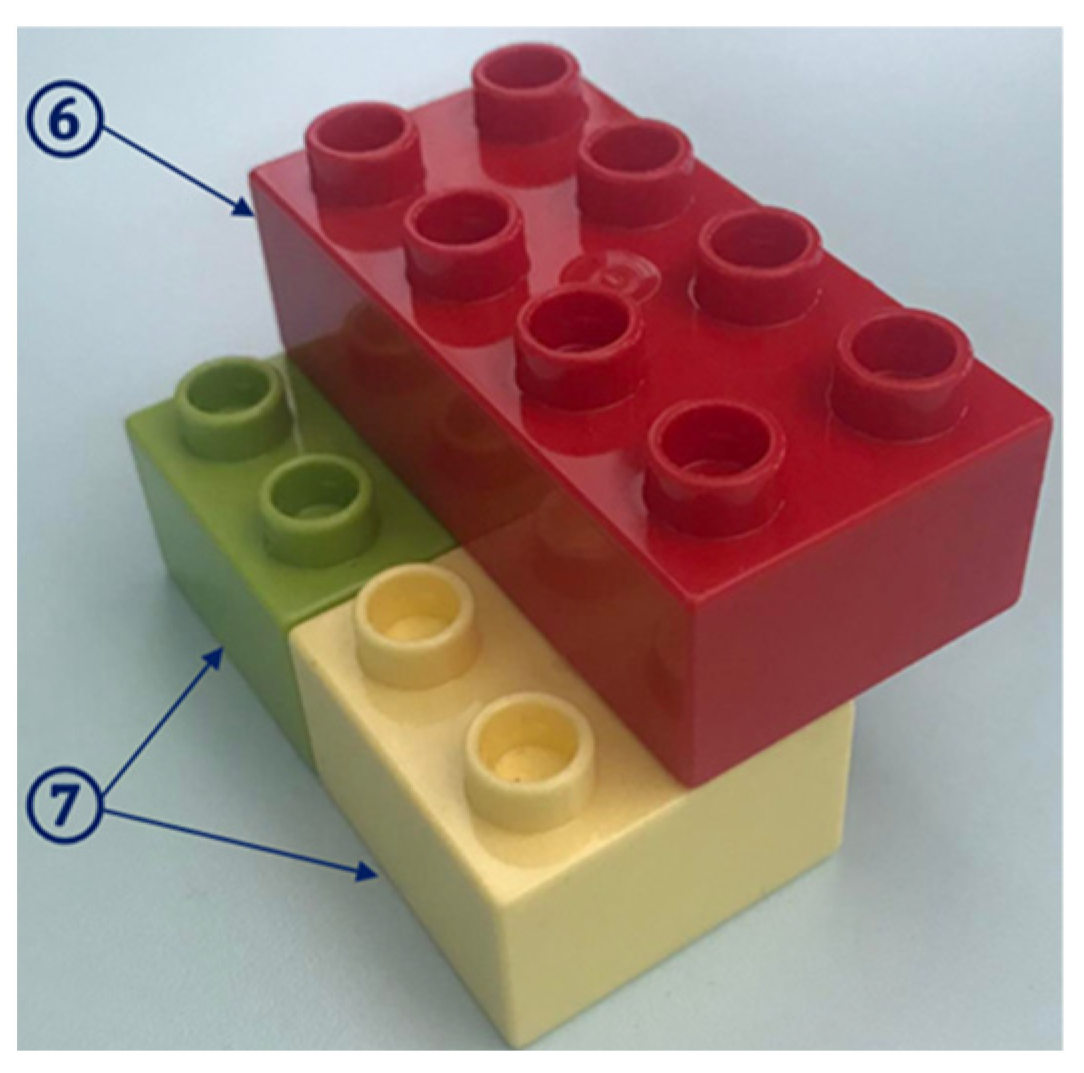
2.2. Description of the Collaborative Assembly Operation
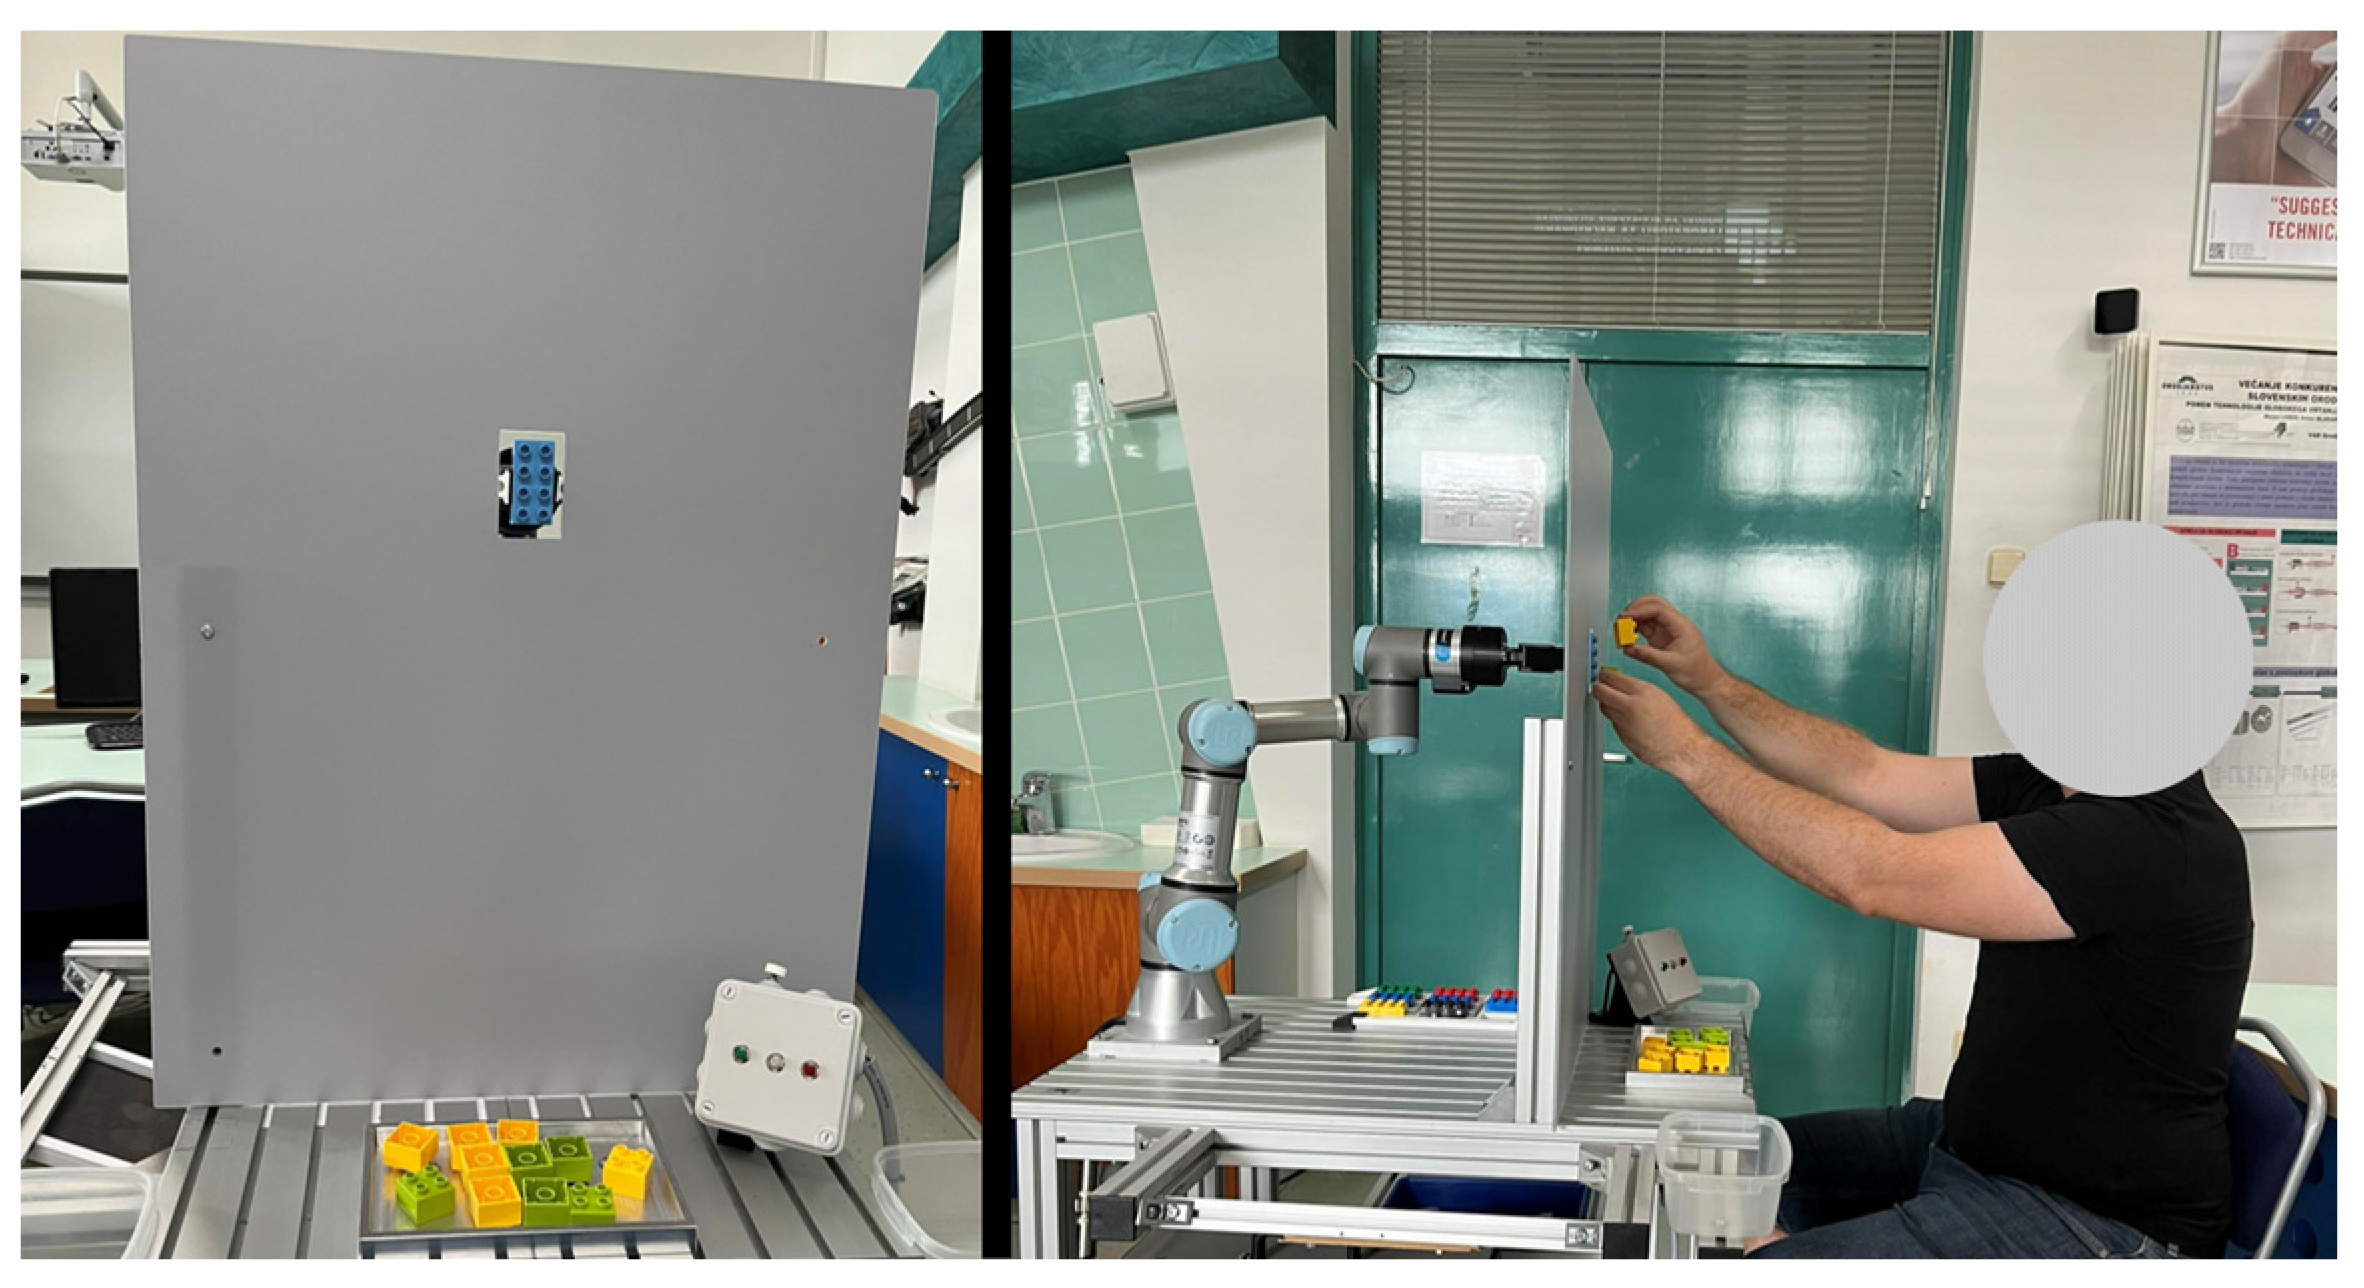
2.3. Experiment Design
2.4. Statistical Methods
- There is a single dependent variable measured on a continuous scale.
- There are three within-subject factors, where each factor has at least two categorical levels.
- There are no significant outliers in any cell of the design.
- Approximate normal distribution of the dependent variable across all design cells.
- Equal variance across the levels of the independent variables (also referred to as the assumption of sphericity).
3. Results
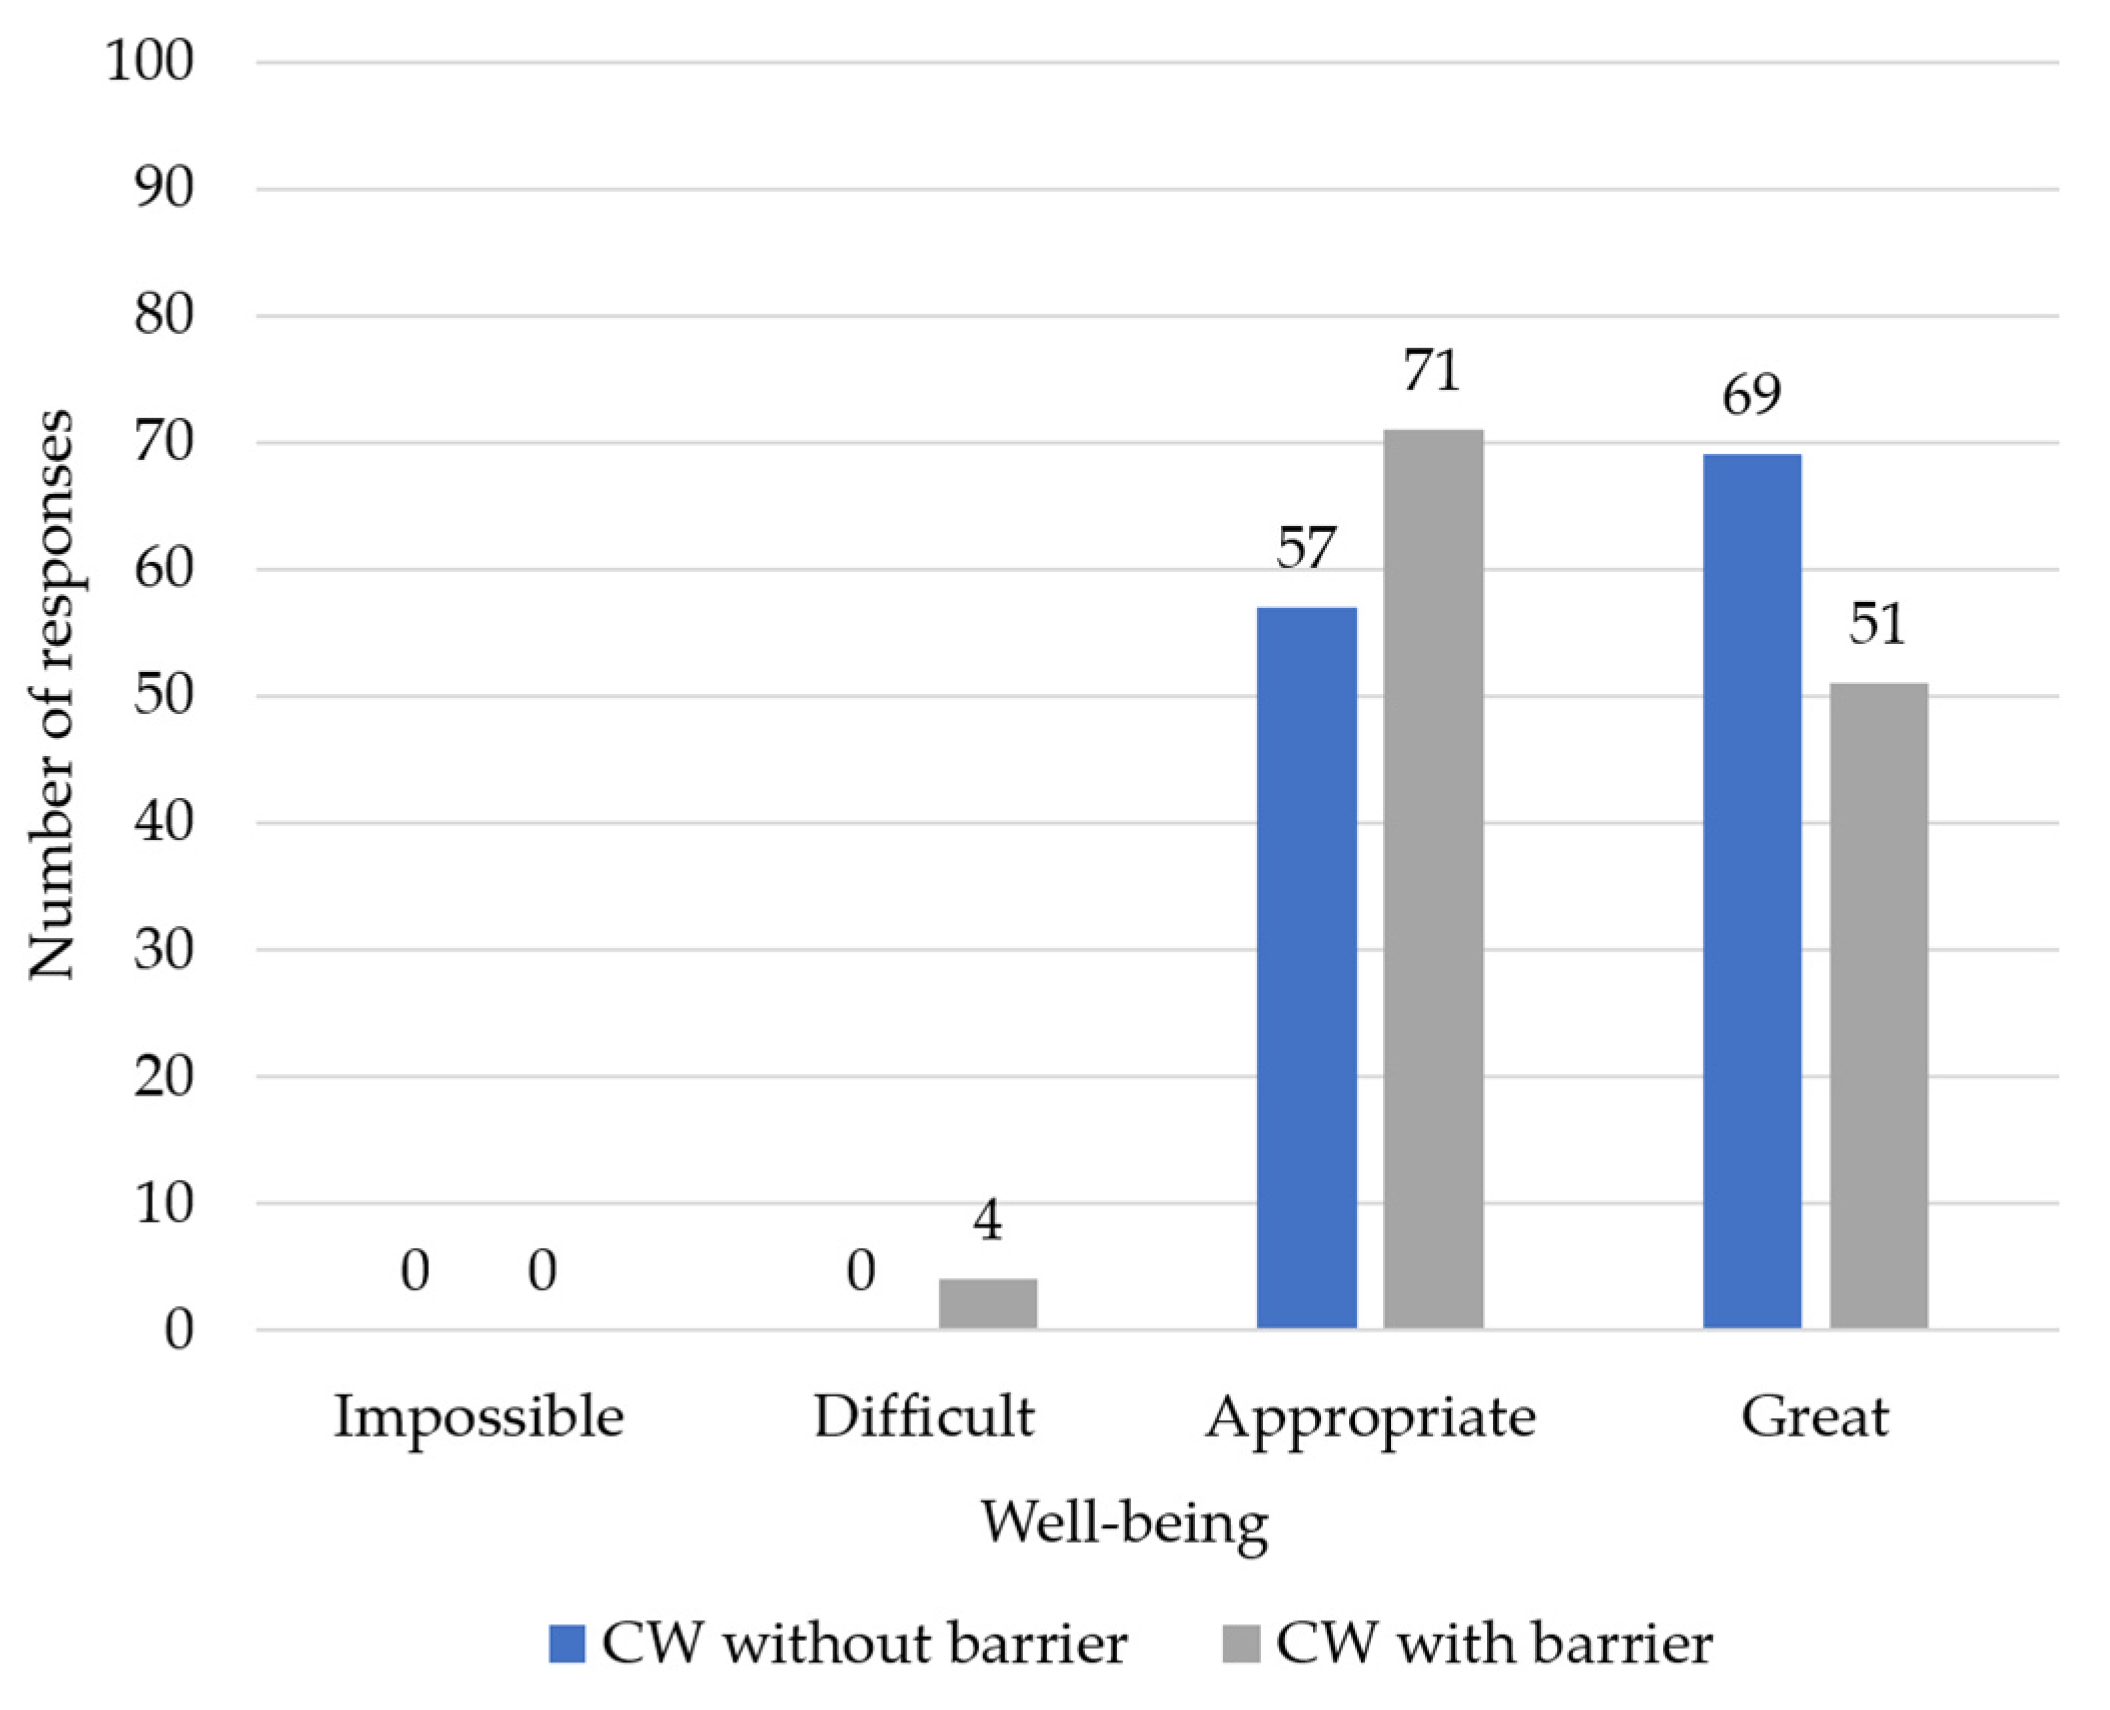
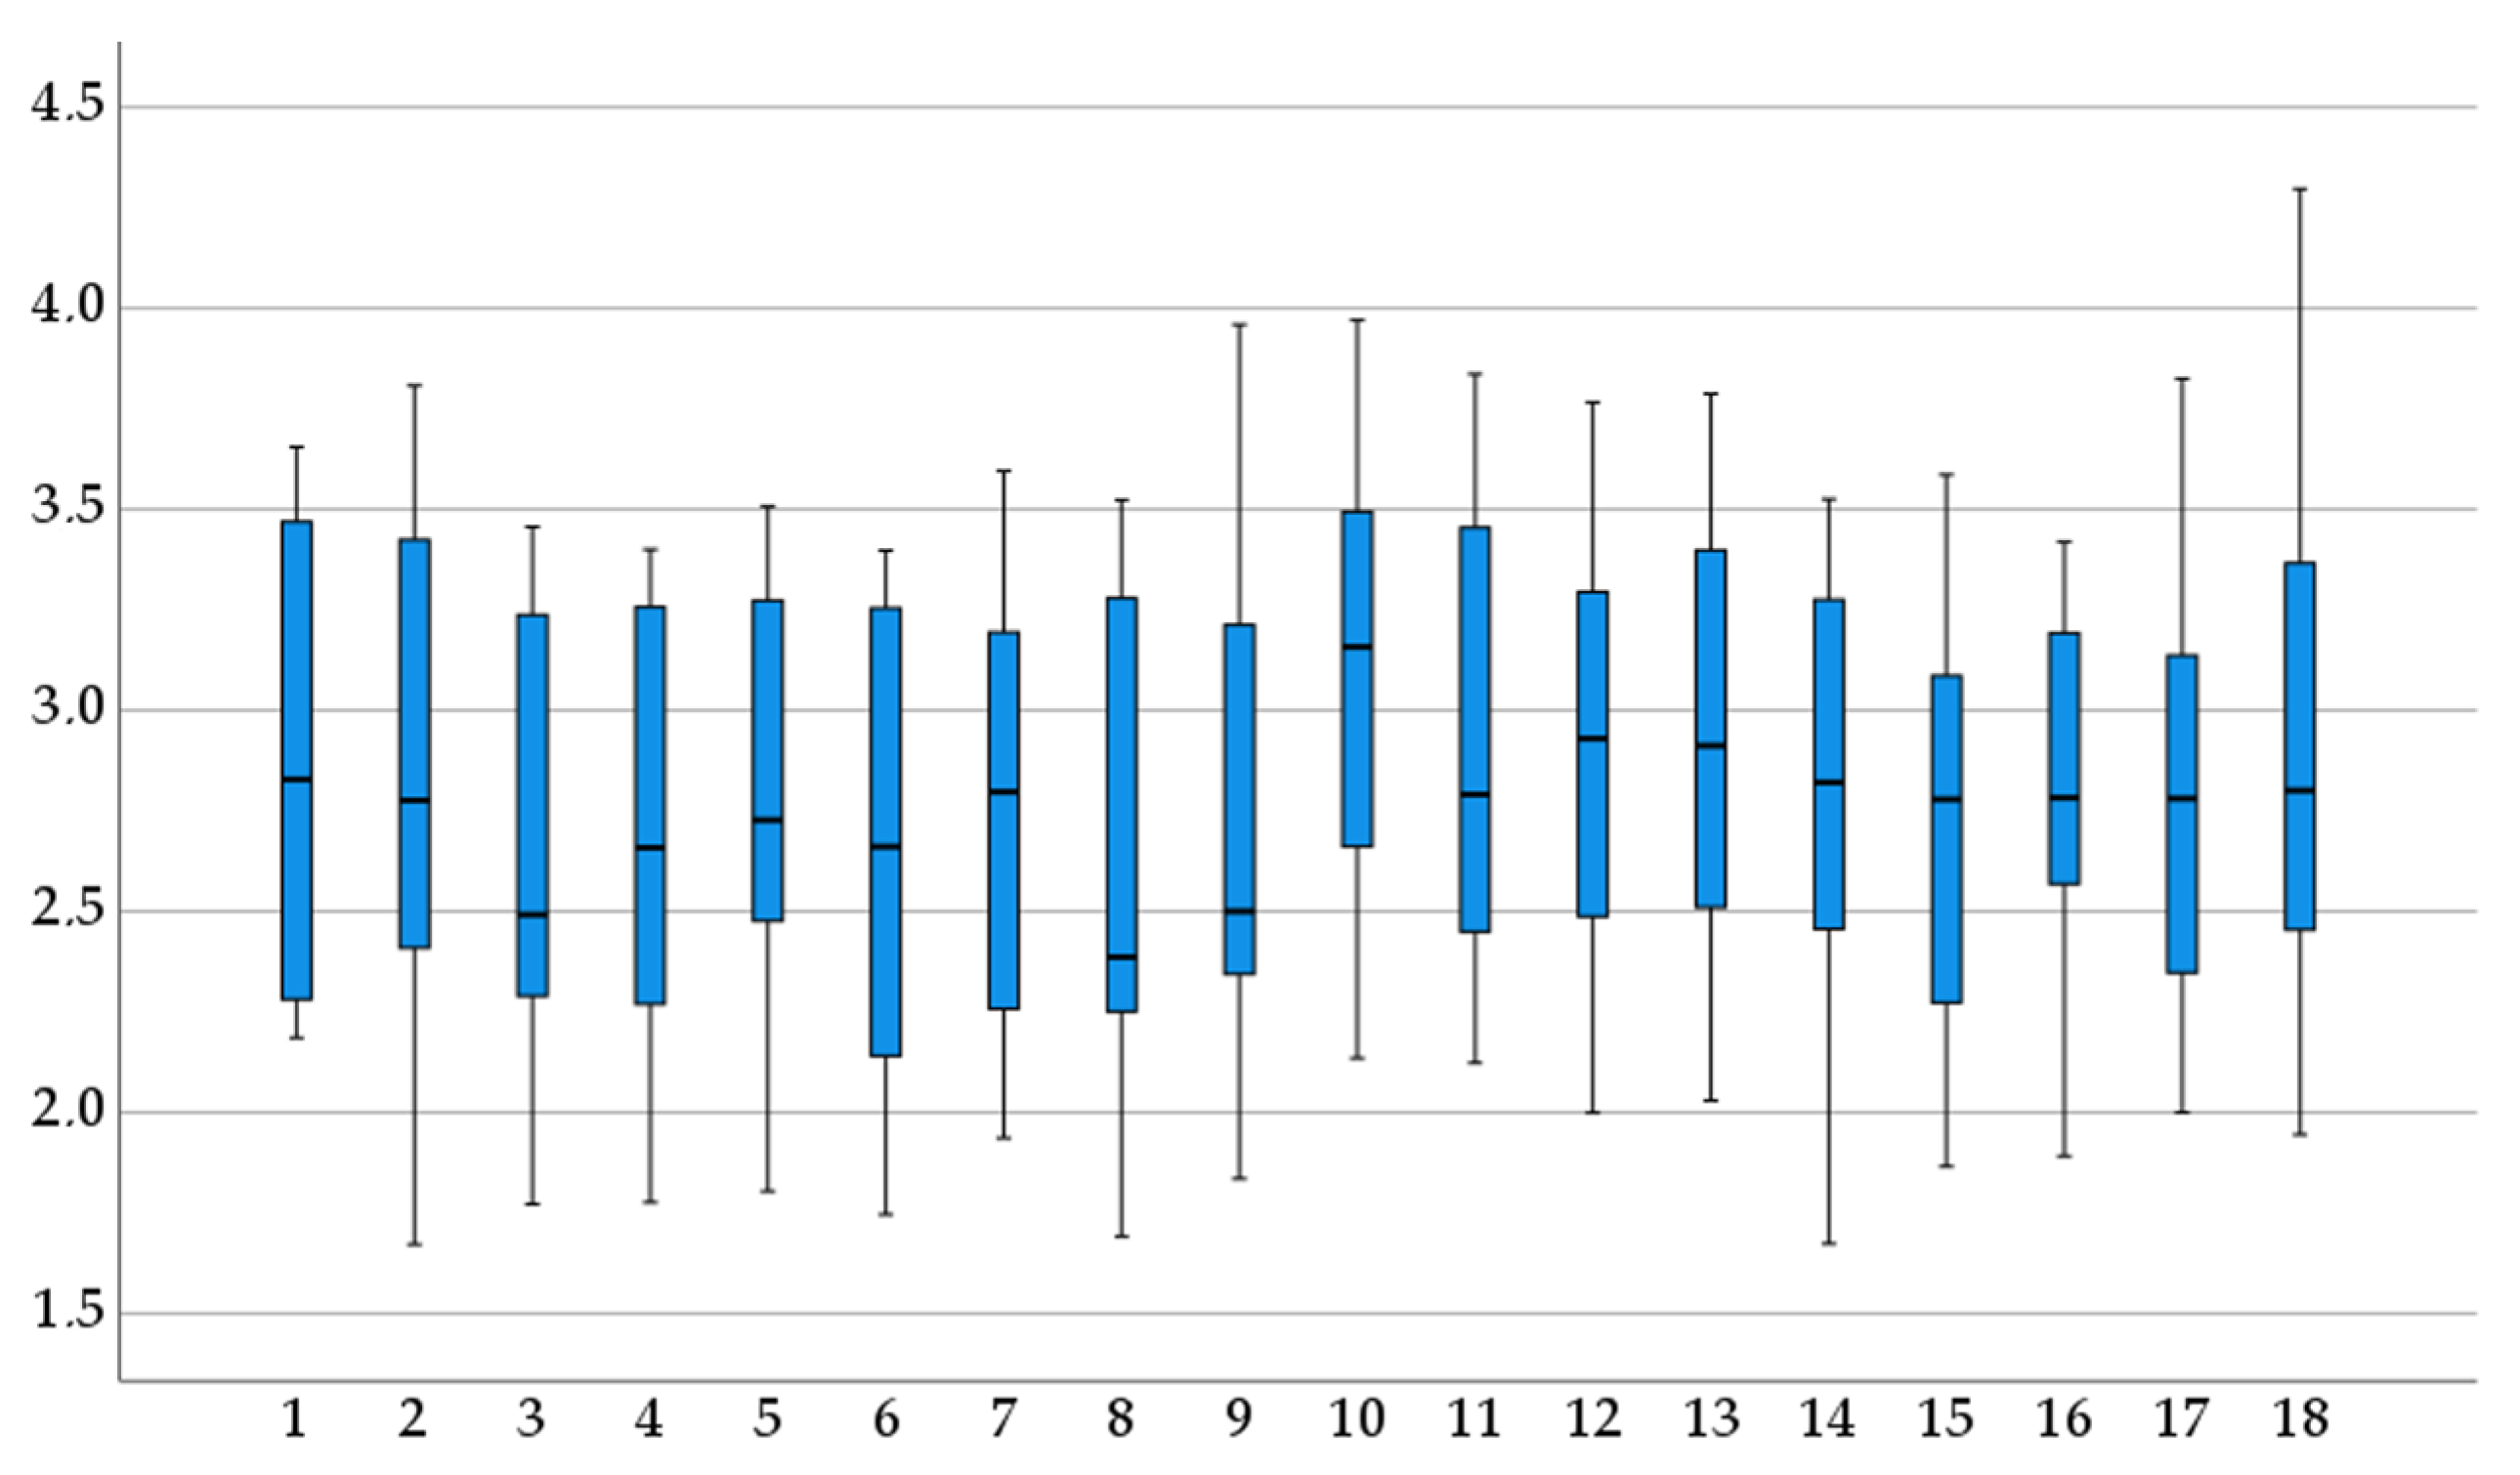
3.1. Experiment Results and Descriptive Statistics
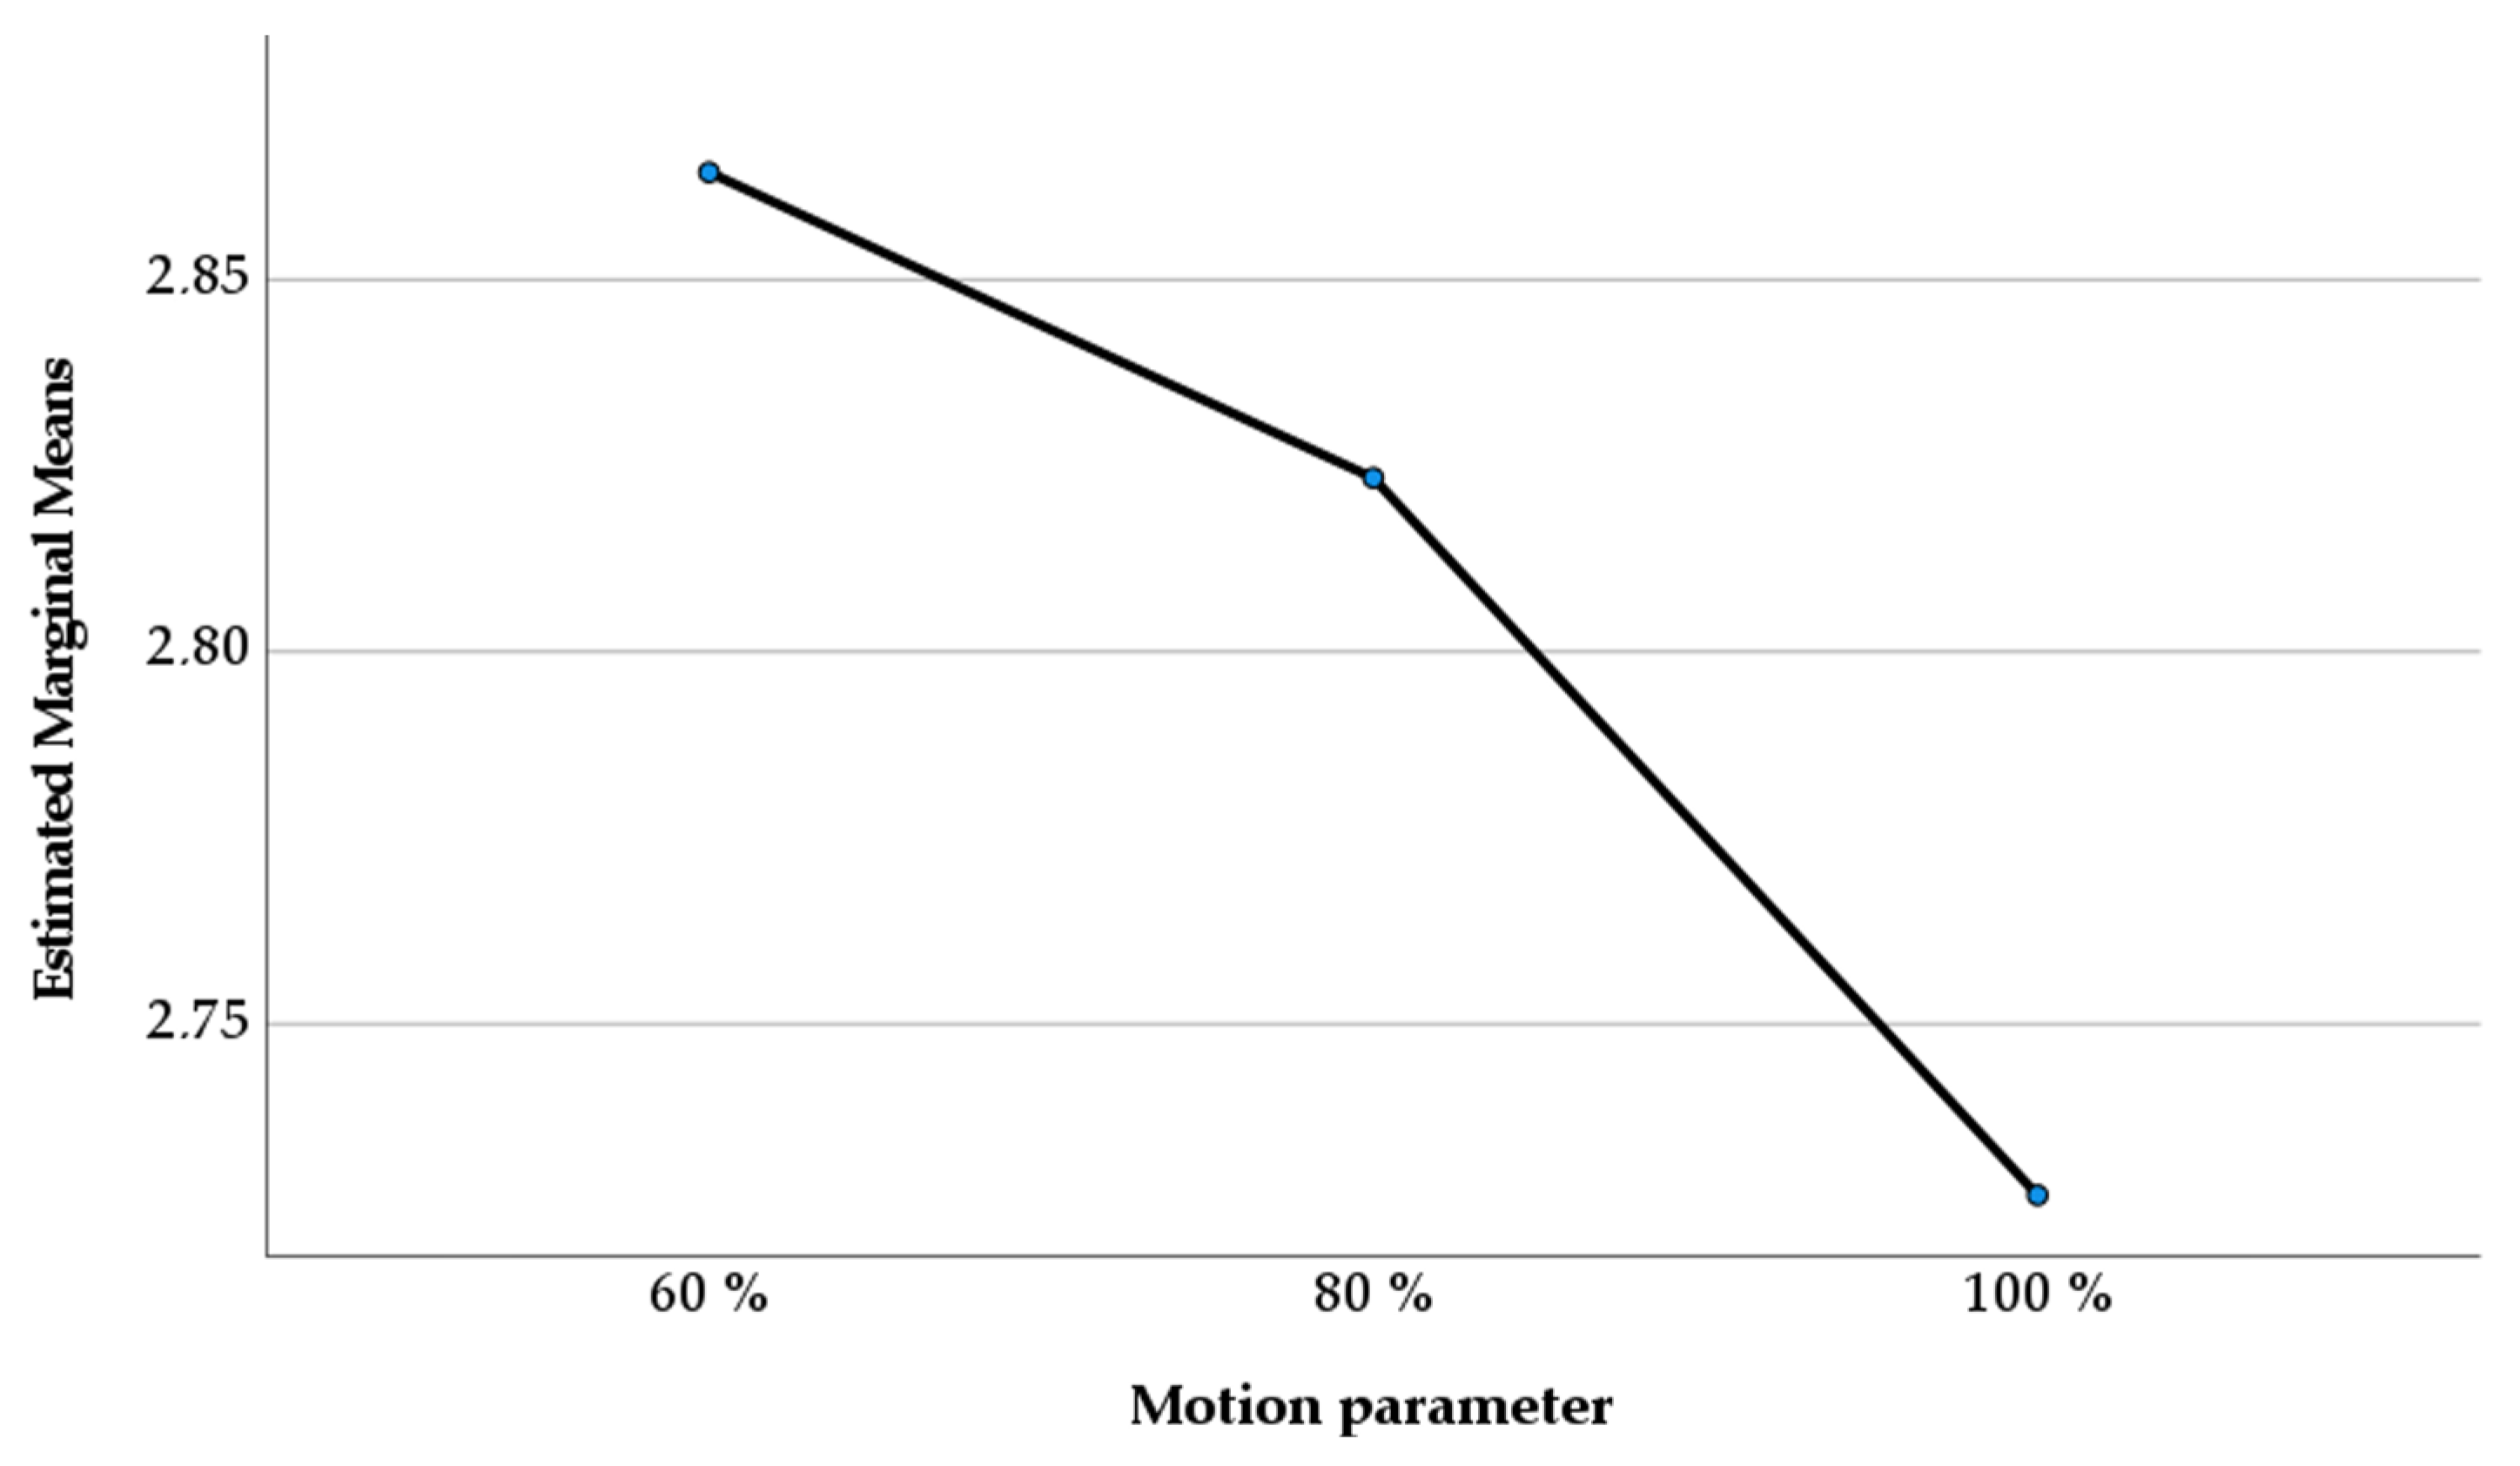
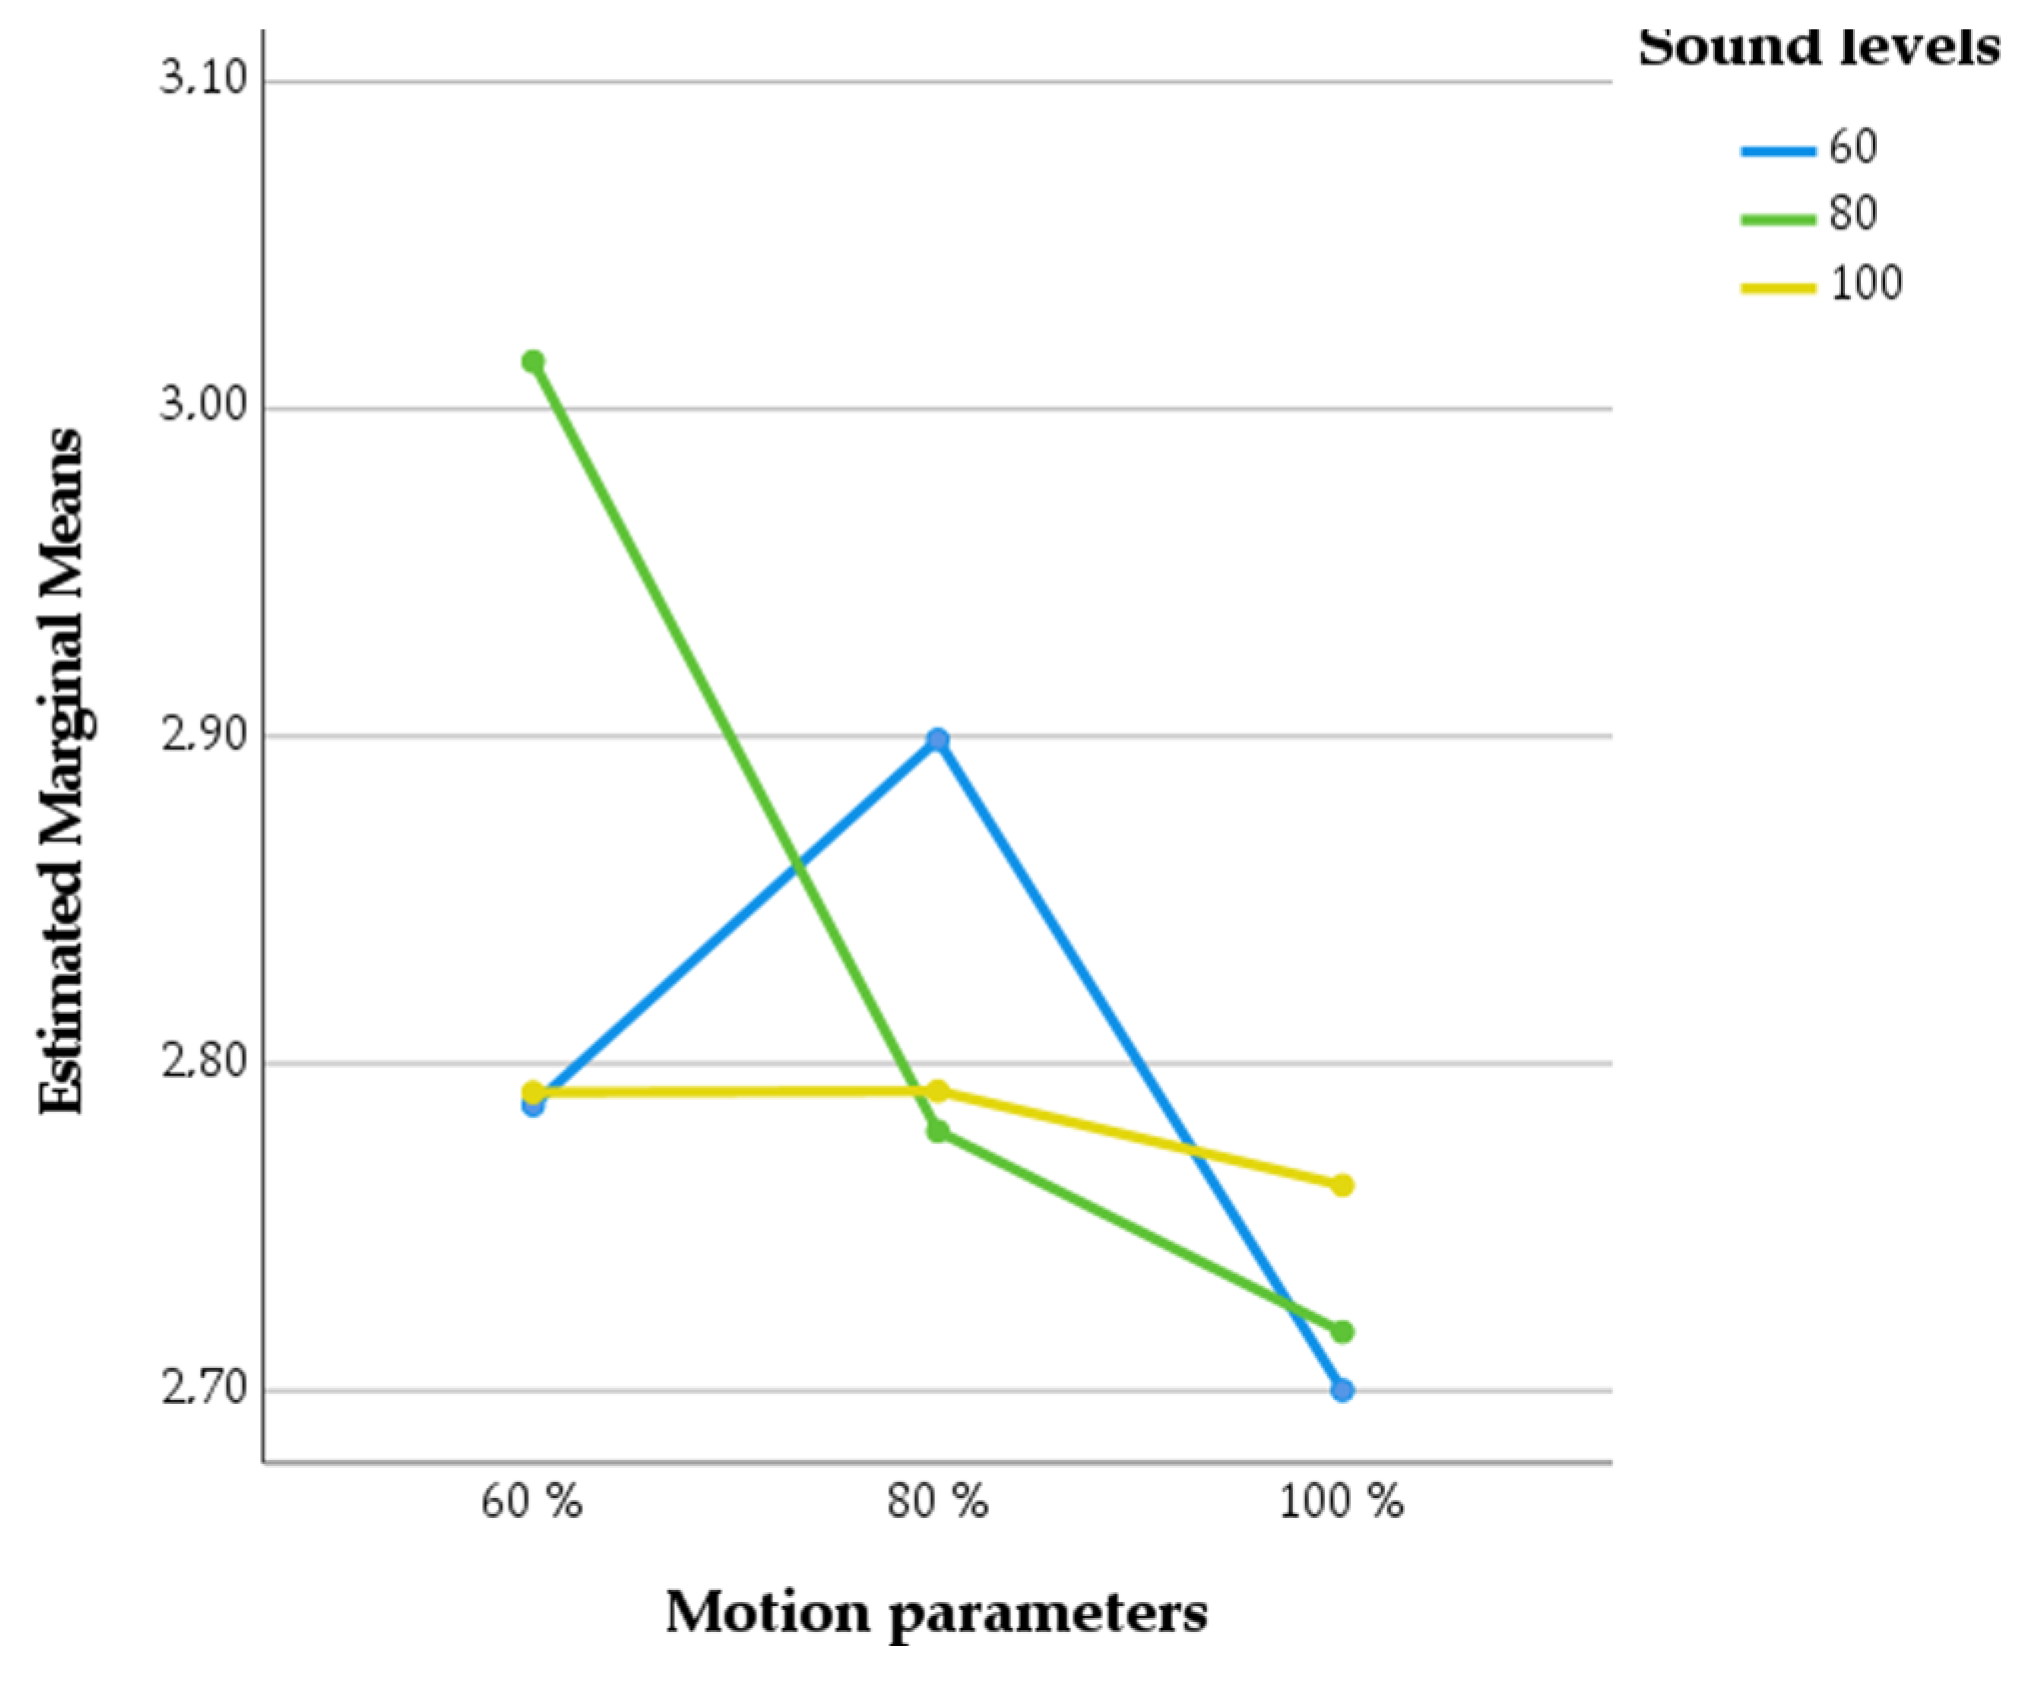
3.2. Experiment Results and Inferential Statistical Tests
4. Discussion
5. Conclusions
Author Contributions
Funding
Data Availability Statement
Acknowledgments
Conflicts of Interest
References
- Villani, V.; Pini, F.; Leali, F.; Secchi, C. Survey on human–robot collaboration in industrial settings: Safety, intuitive interfaces and applications. Mechatronics 2018, 55, 248–266. [Google Scholar] [CrossRef]
- Lu, Y.; Zheng, H.; Chand, S.; Xia, W.; Liu, Z.; Xu, X.; Wang, L.; Qin, Z.; Bao, J. Outlook on human-centric manufacturing towards Industry 5.0. J. Manuf. Syst. 2022, 62, 612–627. [Google Scholar] [CrossRef]
- Ojstersek, R.; Javernik, A.; Buchmeister, B. The impact of the collaborative workplace on the production system capacity: Simulation modelling vs. real-world application approach. Adv. Prod. Eng. Manag. 2021, 16, 431–442. [Google Scholar] [CrossRef]
- Ojstersek, R.; Javernik, A.; Buchmeister, B. Importance of sustainable collaborative workplaces-simulation modelling approach. Int. J. Simul. Model. 2022, 21, 627–638. [Google Scholar] [CrossRef]
- Rinaldi, M.; Caterino, M.; Fera, M. Sustainability of human-robot cooperative configurations: Findings from a case study. Comput. Ind. Eng. 2023, 182, 109383. [Google Scholar] [CrossRef]
- Casalino, A.; Zanchettin, A.M.; Piroddi, L.; Rocco, P. Optimal scheduling of human-robot collaborative assembly operations with time petri nets. IEEE Trans. Autom. Sci. Eng. 2019, 18, 70–84. [Google Scholar] [CrossRef]
- Gualtieri, L.; Palomba, I.; Merati, F.A.; Rauch, E.; Vidoni, R. Design of human-centered collaborative assembly workstations for the improvement of operators’ physical ergonomics and production efficiency: A case study. Sustainability 2020, 12, 3606. [Google Scholar] [CrossRef]
- Zhang, M.; Li, C.; Shang, Y.; Huang, H.; Zhu, W.; Liu, Y. A task scheduling model integrating micro-breaks for optimisation of job-cycle time in human-robot collaborative assembly cells. Int. J. Prod. Res. 2021, 60, 4766–4777. [Google Scholar] [CrossRef]
- Javernik, A.; Buchmeister, B.; Ojstersek, R. Impact of Cobot parameters on the worker productivity: Optimization challenge. Adv. Prod. Eng. Manag. 2022, 17, 494–504. [Google Scholar] [CrossRef]
- Kliment, M.; Trebuna, P.; Pekarcikova, M.; Straka, M.; Trojan, J.; Duda, R. Production efficiency evaluation and products’ quality improvement using simulation. Int. J. Simul. Model 2020, 19, 470–481. [Google Scholar] [CrossRef]
- De Pace, F.; Manuri, F.; Sanna, A.; Fornaro, C. A systematic review of augmented reality interfaces for collaborative industrial robots. Comput. Ind. Eng. 2020, 149, 106806. [Google Scholar] [CrossRef]
- Al-Haija, Q.A.; Al-Saraireh, J. Asymmetric identification model for human-robot contacts via supervised learning. Symmetry 2022, 14, 591. [Google Scholar] [CrossRef]
- Mak, C.M.; Lui, Y.P. The effect of sound on office productivity. Build. Serv. Eng. Res. Technol. 2011, 33, 339–345. [Google Scholar] [CrossRef]
- Abel, S.M. Combined effects of hearing loss and hearing protection on sound localization: Implications for worker safety. In Scientific Basis of Noise-Induced Hearing Loss; Axelsson, A., Borchgrevink, H., Hamernik, R.P., Hellstrom, P.-A., Henderson, D., Salvi, R.J., Eds.; Thieme: New York, NY, USA, 1996; pp. 286–295. [Google Scholar]
- Story, M.; Webb, P.; Fletcher, S.R.; Tang, G.; Jaksic, C.; Carberry, J. Do speed and proximity affect human-robot collaboration with an industrial robot arm? Int. J. Soc. Robot. 2022, 14, 1087–1102. [Google Scholar] [CrossRef]
- Arai, T.; Kato, R.; Fujita, M. Assessment of operator stress induced by robot collaboration in assembly. CIRP Annals 2010, 59, 5–8. [Google Scholar] [CrossRef]
- Kato, S.; Yamanobe, N.; Venture, G.; Yoshida, E.; Ganesh, G. The where of handovers by humans: Effect of partner characteristics, distance and visual feedback. PLoS ONE 2019, 14, e0217129. [Google Scholar] [CrossRef]
- Tidoni, E.; Gergondet, P.; Fusco, G.; Kheddar, A.; Aglioti, S.M. The role of audio-visual feedback in a thought-based control of a humanoid robot: A BCI study in healthy and spinal cord injured people. IEEE Trans. Neural Syst. Rehabil. Eng. 2017, 25, 772–781. [Google Scholar] [CrossRef] [PubMed]
- Mower, E.; Mataric, M.J.; Narayanan, S. Human perception of audio-visual synthetic character emotion expression in the presence of ambiguous and conflicting information. IEEE Trans Multimedia 2009, 11, 843–855. [Google Scholar] [CrossRef]
- Park, E.; Cho, M.; Ki, C.-S. Correct use of repeated measures analysis of variance. Korean J. Lab. Med. 2009, 29, 1–9. [Google Scholar] [CrossRef] [PubMed]
- Girden, E.R. ANOVA: Repeated Measures; Sage: Thousand Oaks, CA, USA, 1992. [Google Scholar]
- Rutherford, A. ANOVA and ANCOVA: A GLM Approach; John Wiley & Sons: Hoboken, NJ, USA, 2011. [Google Scholar]
- Grimm, L.G.; Yarnold, P.R. Reading and Understanding MORE Multivariate Statistics; American Psychological Association: Washington, DC, USA, 2000. [Google Scholar]
- Field, A. Discovering Statistics Using IBM SPSS Statistics; Sage: Thousand Oaks, CA, USA, 2013. [Google Scholar]
- Shapiro, S.S.; Wilk, M.B. An analysis of variance test for normality (complete samples). Biometrika 1965, 52, 591–611. [Google Scholar] [CrossRef]
- Razali, N.M.; Wah, Y.B. Power comparisons of shapiro-wilk, kolmogorov-smirnov, lilliefors and anderson-darling tests. J. Statist. Model. Analyt. 2011, 2, 21–33. [Google Scholar]
- Mauchly, J.W. Significance test for sphericity of a normal n-variate distribution. Ann. Math. Stat. 1940, 11, 204–209. [Google Scholar] [CrossRef]
- Abdi, H. The greenhouse-geisser correction. Encyclo. Res. Des. 2010, 1, 544–548. [Google Scholar]
- Haverkamp, N.; Beauducel, A. Violation of the sphericity assumption and its effect on type-i error rates in repeated measures ANOVA and multi-level linear models (MLM). Front. Psychol. 2017, 8, 12. [Google Scholar] [CrossRef] [PubMed]


| Linear Movements | Joint Movements | |||
|---|---|---|---|---|
| Motion Parameters Levels [%] | Speed [mm/s] | Acceleration [mm/s2] | Speed [°/s] | Acceleration [°/s2] |
| 60 | 600 | 1500 | 206 | 310 |
| 80 | 800 | 2000 | 275 | 413 |
| 100 | 1000 | 2500 | 344 | 516 |
| Sound Levels | LAeq [dB] | Max. Level [dB] | LCpeak [dB] |
|---|---|---|---|
| 60 | 50.5 | 60.9 | 76.1 |
| 80 | 53.6 | 62.4 | 80.0 |
| 100 | 56.5 | 65.3 | 82.3 |
| Combination | Motion Parameters [%] | Sound Levels |
|---|---|---|
| 1. | 60 | 80 |
| 2. | 80 | 60 |
| 3. | 100 | 100 |
| 4. | 80 | 100 |
| 5. | 80 | 80 |
| 6. | 100 | 60 |
| 7. | 60 | 60 |
| 8. | 100 | 80 |
| 9. | 60 | 100 |
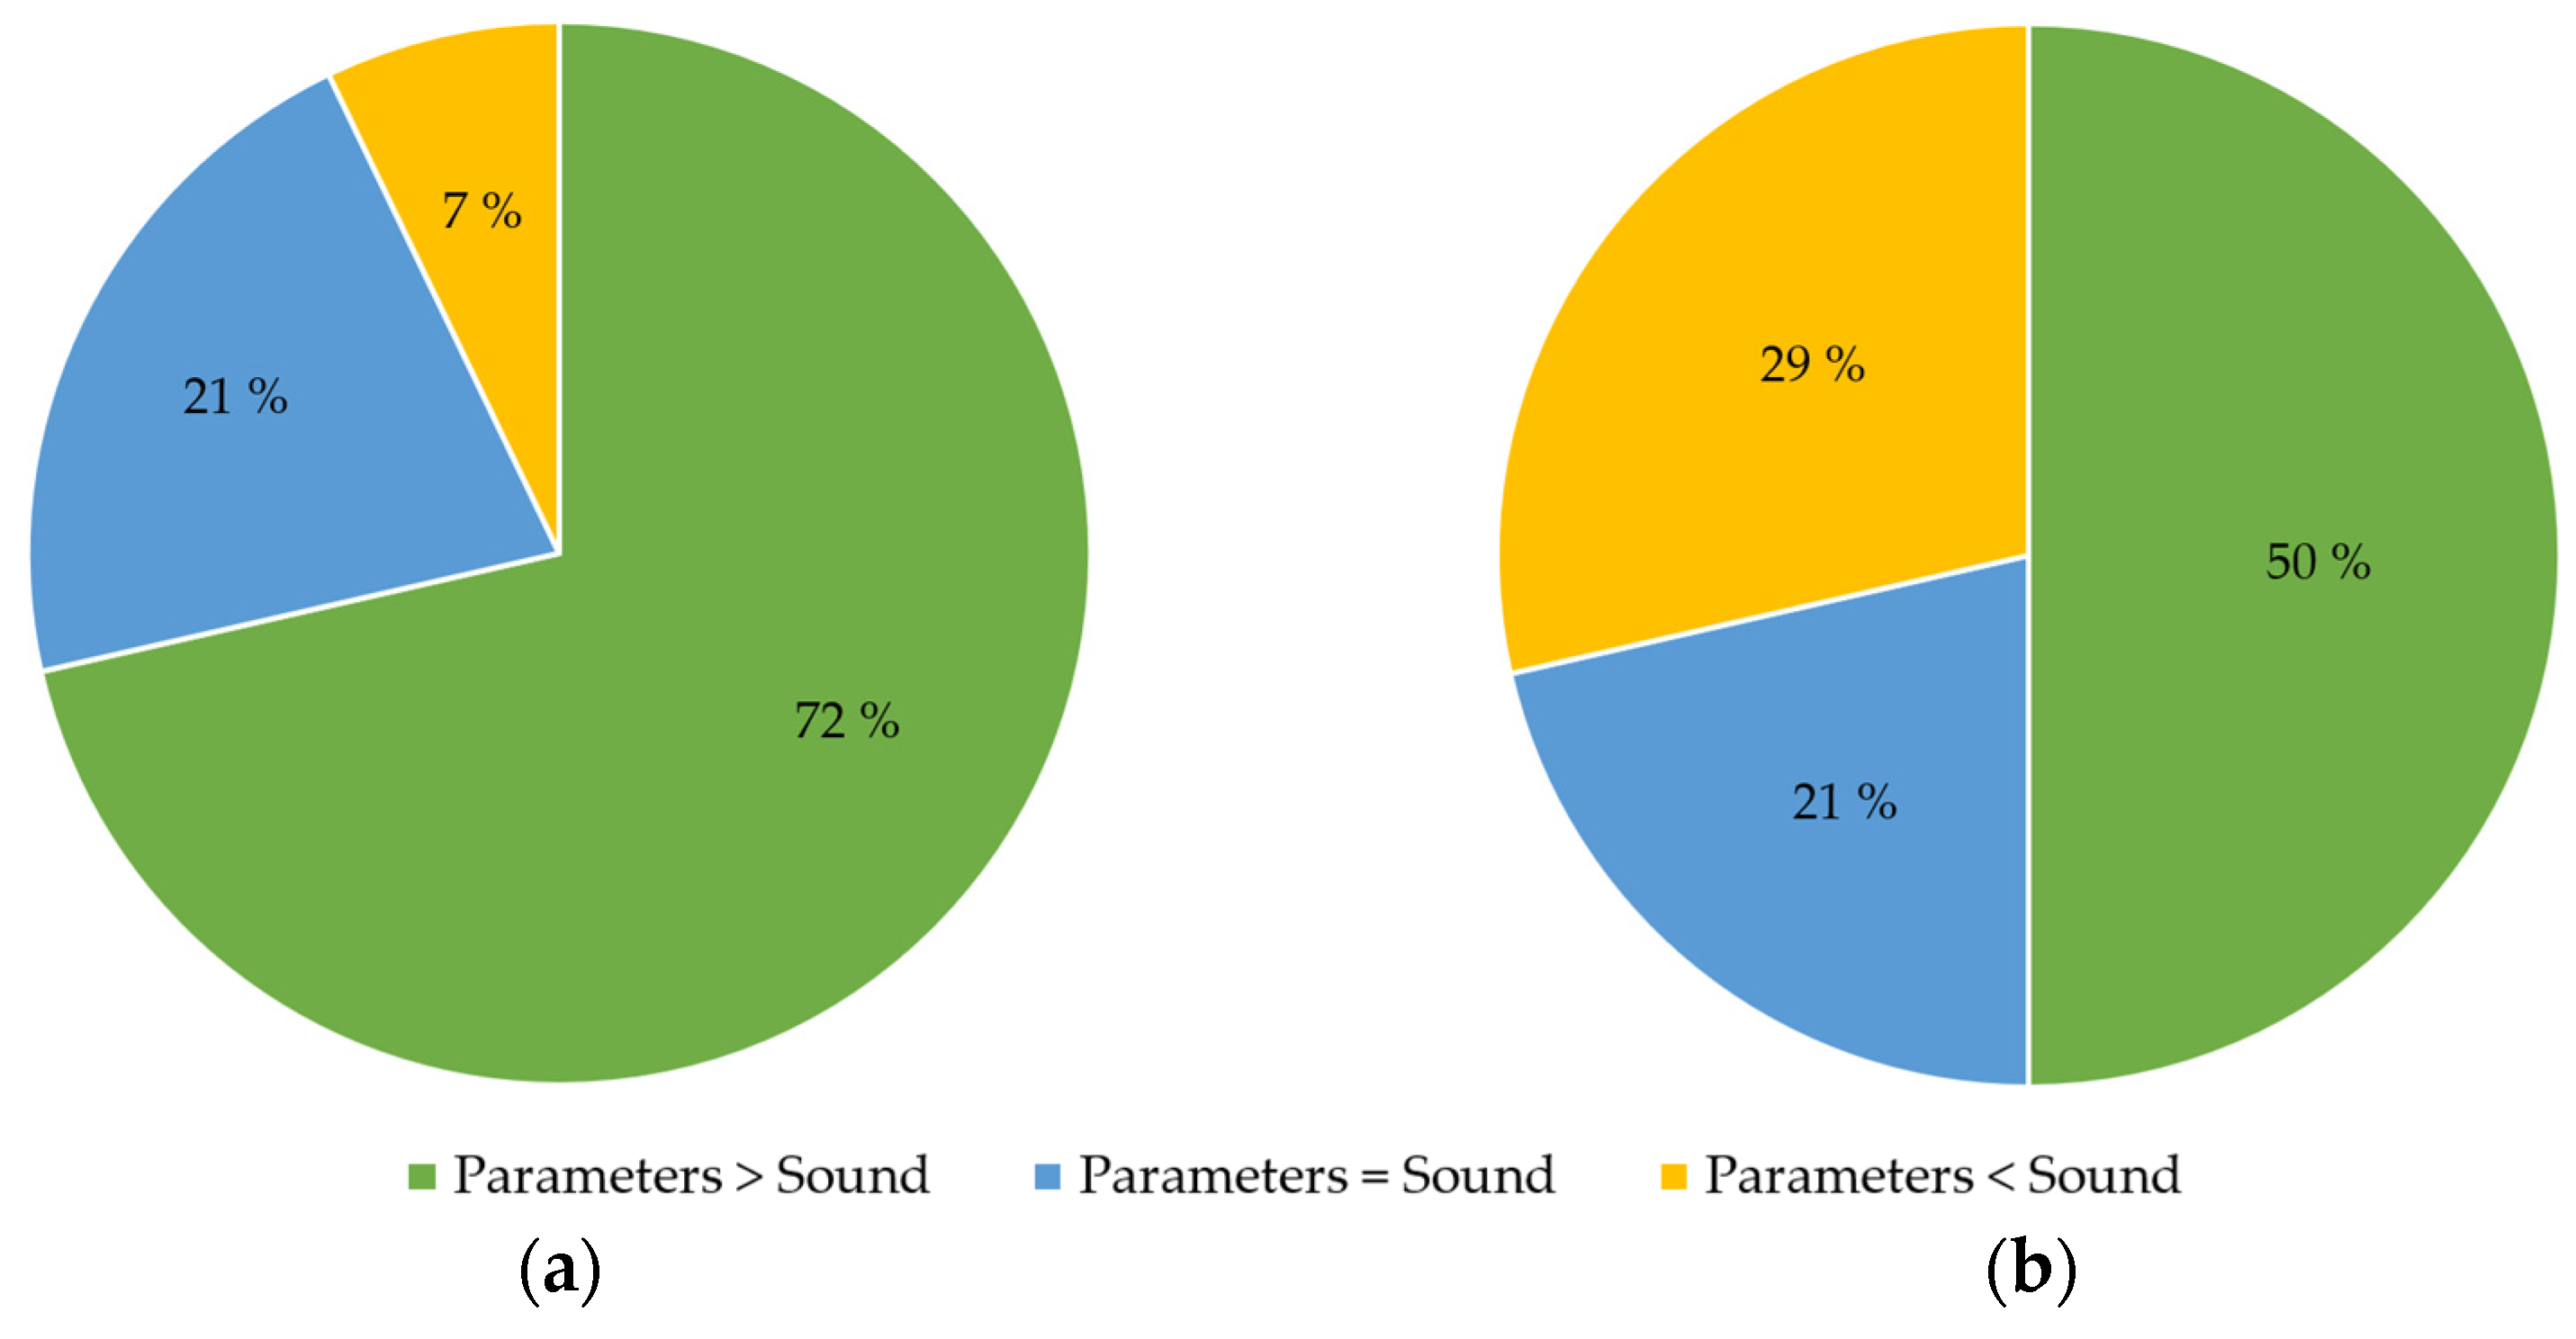
| CW without Barrier | CW with Barrier | |||
|---|---|---|---|---|
| ID | Combination with Shortest Average Assembly Time [Motion Parameters/Sound Level] | Preference | Combination with Shortest Average Assembly Time [Motion Parameters/Sound Level] | Preference |
| 001 | 60/60 | = | 60/100 | < |
| 002 | 100/60 | > | 60/60 | = |
| 003 | 100/60 | > | 60/100 | < |
| 004 | 80/60 | > | 60/100 | < |
| 005 | 80/80 | = | 80/60 | > |
| 006 | 100/60 | > | 100/60 | > |
| 007 | 100/60 | > | 100/80 | > |
| 008 | 100/60 | > | 80/100 | < |
| 009 | 100/60 | > | 100/60 | > |
| 010 | 80/60 | > | 100/80 | > |
| 011 | 60/60 | = | 60/60 | = |
| 012 | 60/100 | < | 100/80 | > |
| 013 | 100/80 | > | 100/100 | = |
| 014 | 100/60 | > | 100/80 | > |
| Barrier | No Barrier | ||||
|---|---|---|---|---|---|
| Nr. | Motion Parameter | Sound Level | Nr. | Motion Parameter | Sound Level |
| 1 | 60 | 80 | 10 | 60 | 80 |
| 2 | 80 | 60 | 11 | 80 | 60 |
| 3 | 100 | 100 | 12 | 100 | 100 |
| 4 | 80 | 100 | 13 | 80 | 100 |
| 5 | 80 | 80 | 14 | 80 | 80 |
| 6 | 100 | 60 | 15 | 100 | 60 |
| 7 | 60 | 60 | 16 | 60 | 60 |
| 8 | 100 | 80 | 17 | 100 | 80 |
| 9 | 60 | 100 | 18 | 60 | 100 |
| Experiment Factor | χ2 | df | Sig. | Greenhouse–Geisser |
|---|---|---|---|---|
| Barrier | 0.00 | 0 | / | 1.00 |
| Motion parameter | 7.19 | 2 | 0.03 | 0.69 |
| Sound level | 0.21 | 2 | 0.90 | 0.98 |
| Barrier × motion parameter | 0.92 | 2 | 0.63 | 0.93 |
| Barrier × sound level | 0.13 | 2 | 0.94 | 0.99 |
| Motion parameter × sound level | 15.29 | 9 | 0.09 | 0.60 |
| Barrier × motion parameter × sound level | 25.42 | 9 | 0.003 | 0.52 |
| Factor | Sphericity or Correction | df | df (Error Term) | F | Sig. | ε |
|---|---|---|---|---|---|---|
| Barrier | Sphericity | 1 | 13 | 2.39 | 0.15 | / |
| Motion parameter | Sphericity | 2 | 26 | 9.38 | 0.027 | / |
| Greenhouse–Geisser | 1.38 | 17.9 | 9.38 | <0.001 | 0.69 | |
| Sound level | Sphericity | 2 | 26 | 3.02 | 0.07 | / |
| Barrier × motion parameter | Sphericity | 2 | 26 | 0.42 | 0.66 | / |
| Barrier × sound level | Sphericity | 4 | 52 | 5.91 | 0.007 | / |
| Motion parameter × sound level | Sphericity | 4 | 52 | 0.28 | <0.001 | / |
| Barrier × motion parameter × sound level | Sphericity | 4 | 52 | 0.04 | 0.78 | / |
| Greenhouse–Geisser | 2.07 | 29.91 | 0.09 | 0.65 | 0.03 |
| Pairwise Comparison | Mean Difference (I–J) | Sig. | 95% Confidence Interval | ||
|---|---|---|---|---|---|
| Motion Parameter [%] (I) | Motion Parameter [%] (J) | Lower Bound | Upper Bound | ||
| 80 | 60 | −0.041 | 0.888 | −0.145 | 0.062 |
| 100 | 60 | −0.137 | 0.009 | −0.241 | −0.034 |
| 100 | 80 | −0.096 | 0.001 | −0.148 | −0.045 |
| Pairwise Comparison | Mean Difference (I–J) | Sig. | 95% Confidence Interval | |||
|---|---|---|---|---|---|---|
| Motion Parameters | Sound (I) | Sound (J) | Lower Bound | Upper Bound | ||
| 60 | 80 | 60 | 0.227 | 0.020 | 0.033 | 0.422 |
| 100 | 60 | 0.004 | 1.000 | −0.138 | 0.145 | |
| 100 | 80 | −0.223 | 0.075 | −0.465 | 0.019 | |
| 80 | 80 | 60 | −0.120 | 0.081 | −0.251 | 0.012 |
| 100 | 60 | −0.107 | 0.024 | −0.202 | −0.013 | |
| 100 | 80 | 0.012 | 1.000 | −0.062 | 0.087 | |
| 100 | 80 | 60 | 0.018 | 1.000 | −0.106 | 0.141 |
| 100 | 60 | 0.063 | 0.482 | −0.053 | 0.178 | |
| 100 | 80 | 0.045 | 0.870 | −0.067 | 0.156 | |
| Pairwise Comparison | Mean Difference (I–J) | Sig. | 95% Confidence Interval | |||
|---|---|---|---|---|---|---|
| Barrier | Sound (I) | Sound (J) | Lower Bound | Upper Bound | ||
| NO | 80 | 60 | 0.095 | 0.045 | 0.002 | 0.189 |
| 100 | 60 | 0.077 | 0.127 | −0.017 | 0.171 | |
| 100 | 80 | −0.018 | 1.000 | −0.137 | 0.101 | |
| YES | 80 | 60 | −0.012 | 1.000 | −0.117 | 0.094 |
| 100 | 60 | −0.104 | 0.018 | −0.191 | −0.017 | |
| 100 | 80 | −0.093 | 0.011 | −0.165 | −0.020 | |
| Research Goal | RM ANOVA |
| The sound impacts on worker efficiency. | NO |
| The motion parameters of CR impact on worker efficiency. | YES |
| The visual contact between the CR and worker impact on worker efficiency. | NO |
| Interaction between the audio and visual contact have an effect on worker assembly time. | YES |
| Interaction between the motion parameters and visual contact have an effect on worker assembly time. | NO |
| Interaction between the audio and motion parameters have an effect on worker assembly time. | YES |
| Interaction between the audio, motion parameters, and visual contact have an effect on worker assembly time. | NO |
Disclaimer/Publisher’s Note: The statements, opinions and data contained in all publications are solely those of the individual author(s) and contributor(s) and not of MDPI and/or the editor(s). MDPI and/or the editor(s) disclaim responsibility for any injury to people or property resulting from any ideas, methods, instructions or products referred to in the content. |
© 2023 by the authors. Licensee MDPI, Basel, Switzerland. This article is an open access article distributed under the terms and conditions of the Creative Commons Attribution (CC BY) license (https://creativecommons.org/licenses/by/4.0/).
Share and Cite
Javernik, A.; Kovič, K.; Palčič, I.; Ojsteršek, R. Audio-Visual Effects of a Collaborative Robot on Worker Efficiency. Symmetry 2023, 15, 1907. https://doi.org/10.3390/sym15101907
Javernik A, Kovič K, Palčič I, Ojsteršek R. Audio-Visual Effects of a Collaborative Robot on Worker Efficiency. Symmetry. 2023; 15(10):1907. https://doi.org/10.3390/sym15101907
Chicago/Turabian StyleJavernik, Aljaž, Klemen Kovič, Iztok Palčič, and Robert Ojsteršek. 2023. "Audio-Visual Effects of a Collaborative Robot on Worker Efficiency" Symmetry 15, no. 10: 1907. https://doi.org/10.3390/sym15101907
APA StyleJavernik, A., Kovič, K., Palčič, I., & Ojsteršek, R. (2023). Audio-Visual Effects of a Collaborative Robot on Worker Efficiency. Symmetry, 15(10), 1907. https://doi.org/10.3390/sym15101907