Article

Numerical Study on Heat Transfer Characteristics of Dielectric Fluid Immersion Cooling with Fin Structures for Lithium-Ion Batteries

Department of Mechanical Engineering, Dong-A University, 37 Nakdong-Daero 550, Saha-gu, Busan 49315, Republic of Korea
*
Author to whom correspondence should be addressed.
These authors contributed equally to this work.
Symmetry 2023, 15(1), 92; https://doi.org/10.3390/sym15010092
Submission received: 8 December 2022 / Revised: 22 December 2022 / Accepted: 26 December 2022 / Published: 29 December 2022
(This article belongs to the Section Computer)

Abstract

:
Electric vehicles (EVs) are incorporated with higher energy density batteries to improve the driving range and performance. The lithium-ion batteries with higher energy density generate a larger amount of heat which deteriorates their efficiency and operating life. The currently commercially employed cooling techniques are not able to achieve the effective thermal management of batteries with increasing energy density. Direct liquid cooling offers enhanced thermal management of battery packs at high discharging rates compared to all other cooling techniques. However, the flow distribution of coolant around the battery module needs to be maintained to achieve the superior performance of direct liquid cooling. The objective of the present work is to investigate the heat transfer characteristics of the lithium-ion battery pack with dielectric fluid immersion cooling for different fin structures. The base structure without fins, circular, rectangular and triangular fin structures are compared for heat transfer characteristics of maximum temperature, temperature difference, average temperature, Nusselt number, pressure drop and performance evaluation criteria (PEC). Furthermore, the heat transfer characteristics are evaluated for various fin dimensions of the best fin structure. The heat transfer characteristics of the battery pack with dielectric fluid immersion cooling according to considered fin structures and dimensions are simulated using ANSYS Fluent commercial code. The results reveal that the symmetrical temperature distribution and temperature uniformity of the battery pack are achieved in the case of all fin structures. The maximum temperature of the battery pack is lower by 2.41%, 2.57% and 4.45% for circular, rectangular, and triangular fin structures, respectively, compared to the base structure. The triangular fin structure shows higher values of Nusselt number and pressure drop with a maximum value of PEC compared to other fin structures. The triangular fin structure is the best fin structure with optimum heat transfer characteristics of the battery pack with dielectric fluid immersion cooling. The heat transfer characteristics of a battery pack with dielectric fluid immersion cooling are further improved for triangular fin structures with a base length -to -height ratio (A/B) of 4.304. The research outputs from the present work could be referred to as a database to commercialize the dielectric fluid immersion cooling for the efficient battery thermal management system at fast and higher charging/discharging rates.

1. Introduction

The increasing energy demand with the rise in world population is depleting the energy sources of fossil fuels continuously. The limited sources of fossil fuels have created an unbearable situation of energy crisis [1]. The excessive consumption of fossil fuels is the reason for environmental pollution which has forced many countries to publish guidelines for zero CO2 emission [2]. Currently, internal combustion engine-based vehicles are replacing EVs as an alternative to fossil fuels with an aim to reduce greenhouse emissions and satisfy the increasing energy demand [3,4]. The lithium-ion batteries are used as a source of energy in EVs owing to their higher efficiency, high power density, long lifespan, and self-discharge rate [5,6]. The increasing popularity of EVs demands an increase in their driving range and comfort; hence, high energy density batteries have been incorporated in recent EVs. The lithium-ion batteries with high energy density generate a larger amount of heat which degrades their operating life and performance [7]. At fast charging and discharging rates, the heat generation in lithium-ion batteries can result in thermal runaway and explosion of batteries [8,9]. The safe and efficient operation of batteries is assured when their operating temperature is maintained in a range of 20 °C–45 °C and temperature uniformity is maintained within 5 °C. Therefore, an effective thermal management technique is requisite to dissipate the heat from batteries and assure their performance and safety [10,11].
Numerous battery thermal management techniques, including air cooling, indirect liquid cooling, phase change material (PCM) cooling, heat pipe -based cooling and direct liquid cooling, have been researched. However, air cooling and indirect liquid cooling are commercially employed as battery thermal management techniques [12]. The cooling performance of indirect liquid cooling is superior compared to air cooling. However, the battery thermal management system based on indirect liquid cooling poses drawbacks of complex structure, heavy weight, and high cost [13]. In addition, indirect liquid cooling uses water/glycol as a coolant which offers electrical conductivity; hence, to minimize the direct contact between the battery and coolant, a cooling plate and channels are required. The heat dissipation from the battery to the coolant reduces due to increased thermal resistance offered by the presence of cooling plates and channels. Therefore, indirect liquid cooling also fails to maintain the safe operating temperature of batteries at high discharge rates [14,15]. The battery thermal management system with PCM cooling shows enhanced temperature uniformity of lithium-ion batteries because PCM absorbs the larger amount of heat from the battery when the temperature of the battery approaches to melting point temperature of PCM. However, when the battery temperature crosses the melting temperature of PCM, the performance of PCM cooling decreases [16]. In addition, the PCM cooling could not effectively dissipate the internal accumulative heat of lithium-ion batteries because the thermal conductivity of PCM is low. To enhance the thermal conductivity of PCM, it is inserted with higher thermal conductivity materials such as metal foam, expanded graphite, carbon nanofibers and other porous media [17]. Direct liquid cooling uses dielectric fluid, which is electrically non-conductive. Thus, batteries can be immersed in dielectric fluid [15]. Due to direct contact between the battery and coolant, the cooling plate and channels are eliminated. Thus, the thermal resistance between the battery and coolant reduces and the heat transfer rate increases compared to indirect liquid cooling. Also, the absence of cooling plates and channels makes a direct liquid cooling-based battery thermal management system less complex and bulky. The cell-to-cell thermal runaway propagation could be suppressed using direct liquid cooling, and hence, the safety of the battery system improves [18]. These benefits have increased the research interest in battery thermal management using direct liquid cooling.
Sundin et al. have shown the maximum temperature of a battery cell within 30 °C at a 2C discharge rate in the case of single-phase immersion cooling whereas that within 35 °C at a 1C discharge rate in the case of forced air cooling [19]. Zhou et al. have concluded that the thermal runaway propagation in a 60 Ah battery could be suppressed by enabling phase change liquid immersion cooling. However, the battery is completely burned in the case when phase change liquid immersion cooling is disabled [20]. Li et al. have investigated the cooling performance of 18,650 lithium-ion batteries using direct liquid cooling with SF33 as coolant. The maximum temperature of the battery is maintained in a range of 33 °C–34 °C at a 4C discharge rate and within 34.5 °C at a 7C discharge rate [21]. Dubey et al. have concluded that the maximum temperature and pumping power for direct liquid cooling using Novec7500 coolant are lower compared to indirect liquid cooling using water/ethylene glycol coolant. However, the temperature uniformity of the battery is lower in the case of direct liquid cooling compared to indirect liquid cooling [22]. Li et al. have studied the heat transfer performance of immersion cooling with SF33 coolant for cylindrical lithium-ion batteries under fast discharge conditions. The subcooled and saturation boiling is observed at a high charging current, and the heat transfer coefficient increases significantly when the transition from single phase to boiling heat transfer occurs [23]. In the case of direct liquid cooling, to distribute the coolant around the battery surface, the baffles and fins should be provided in the flow channel. Air cooling and direct liquid cooling have similar characteristics in that, in both cases, working fluid is in contact with the battery. In the case of battery air cooling, numerous researchers have studied the impact of baffles or fins on the cooling performance of the battery. Sahin et al. have compared the thermal performance and pressure drop of air-cooled battery modules with cylindrical, triangular, diamond and winglet baffles. The air-cooled battery module with baffles shows a 5% lower maximum temperature, 40% lower temperature difference and 3.5 times higher power consumption compared to that without baffles [24]. Cheng et al. have studied the thermal performance and pressure drop of the battery pack with air cooling considering the effect of fin height, fin thickness and fin number. The maximum temperature and standard deviation of temperature for the battery pack decrease by 17.63% and 39.30%, respectively, in the case of air cooling with fins, compared to that without fins [25]. Zhuang et al. have investigated the cooling performance and power consumption of batteries incorporated in air cooling channels with prism shape fins of different dimensions. The lowest average temperature of 22.19 °C with a power consumption of 0.101 W is observed for prism fin with diagonal dimensions of 20 mm × 20 mm. The lowest power consumption of 0.019 W is evaluated for prism fin with diagonal dimensions of 16 mm × 8 mm, which shows an average temperature of 23.04 °C [26]. However, very limited research has been conducted on battery thermal management with direct liquid cooling considering fins and baffles for uniform flow distribution. Patil et al. have proposed hybrid tab forced air cooling and body immersion cooling incorporated with baffles to improve the thermal performance of pouch cell battery pack. The maximum temperature of the battery is achieved as 49.9 °C, 31.7 °C, and 28 °C at a 3C discharge rate for volume flow rates of 0.5 LPM, 3 LPM, and 10 LPM, respectively [27]. Le et al. have optimized the structural parameters of manifold microchannel with baffles to enhance the thermal performance of lithium-ion battery pack with immersion cooling. The maximum temperature, bulk and surface temperature uniformity of the battery pack are evaluated as 35.06 °C, 6.66 °C and 3.52 °C, respectively for the optimized structure [28].
The battery pack achieves enhanced cooling performance and temperature uniformity when the coolant flow is distributed symmetrically around the battery surface. In the case of indirect liquid cooling, extensive research has been conducted to achieve uniform coolant flow around the battery surface by optimizing the shape and structure of cooling channels. In air cooling, the airflow distribution around the battery surface is unified by adding the fins or baffles in the flow channel to various research studies. Similarly, the fins and baffles could be added to the flow channel to improve the overall cooling performance of the battery pack with direct liquid cooling, including maximum temperature, average temperature, and temperature difference. There are few studies on direct liquid cooling considering baffles to improve the heat transfer performance of battery packs. However, the concrete research study on the cooling performance of battery packs with direct liquid cooling according to various fin structures is missing in the open literature. Therefore, in the present study, the heat transfer characteristics of the cylindrical battery pack with dielectric fluid immersion cooling are compared for various fin structures. The maximum temperature, temperature difference, average temperature, Nusselt number, pressure drop and PEC are simulated using ANSYS Fluent for base structure without fins and circular, rectangular and triangular fin structures. The best fin structure is proposed based on the optimum heat transfer characteristics of the battery pack with dielectric fluid immersion cooling. Furthermore, the novelty of the present work is extended by investigating the effect of various fin dimensions on the heat transfer characteristics of the battery pack with dielectric fluid immersion cooling with the aim of further improvement in battery cooling performance.

2. Numerical Method

The heat transfer characteristics of dielectric fluid immersion cooling for thermal management of battery are numerically investigated. The present numerical method elaborates the computational geometry of the battery with dielectric fluid immersion cooling in Section 2.1, followed by an explanation of meshing for computational geometry, governing equations, and boundary conditions in Section 2.2, Section 2.3, Section 2.4 respectively.

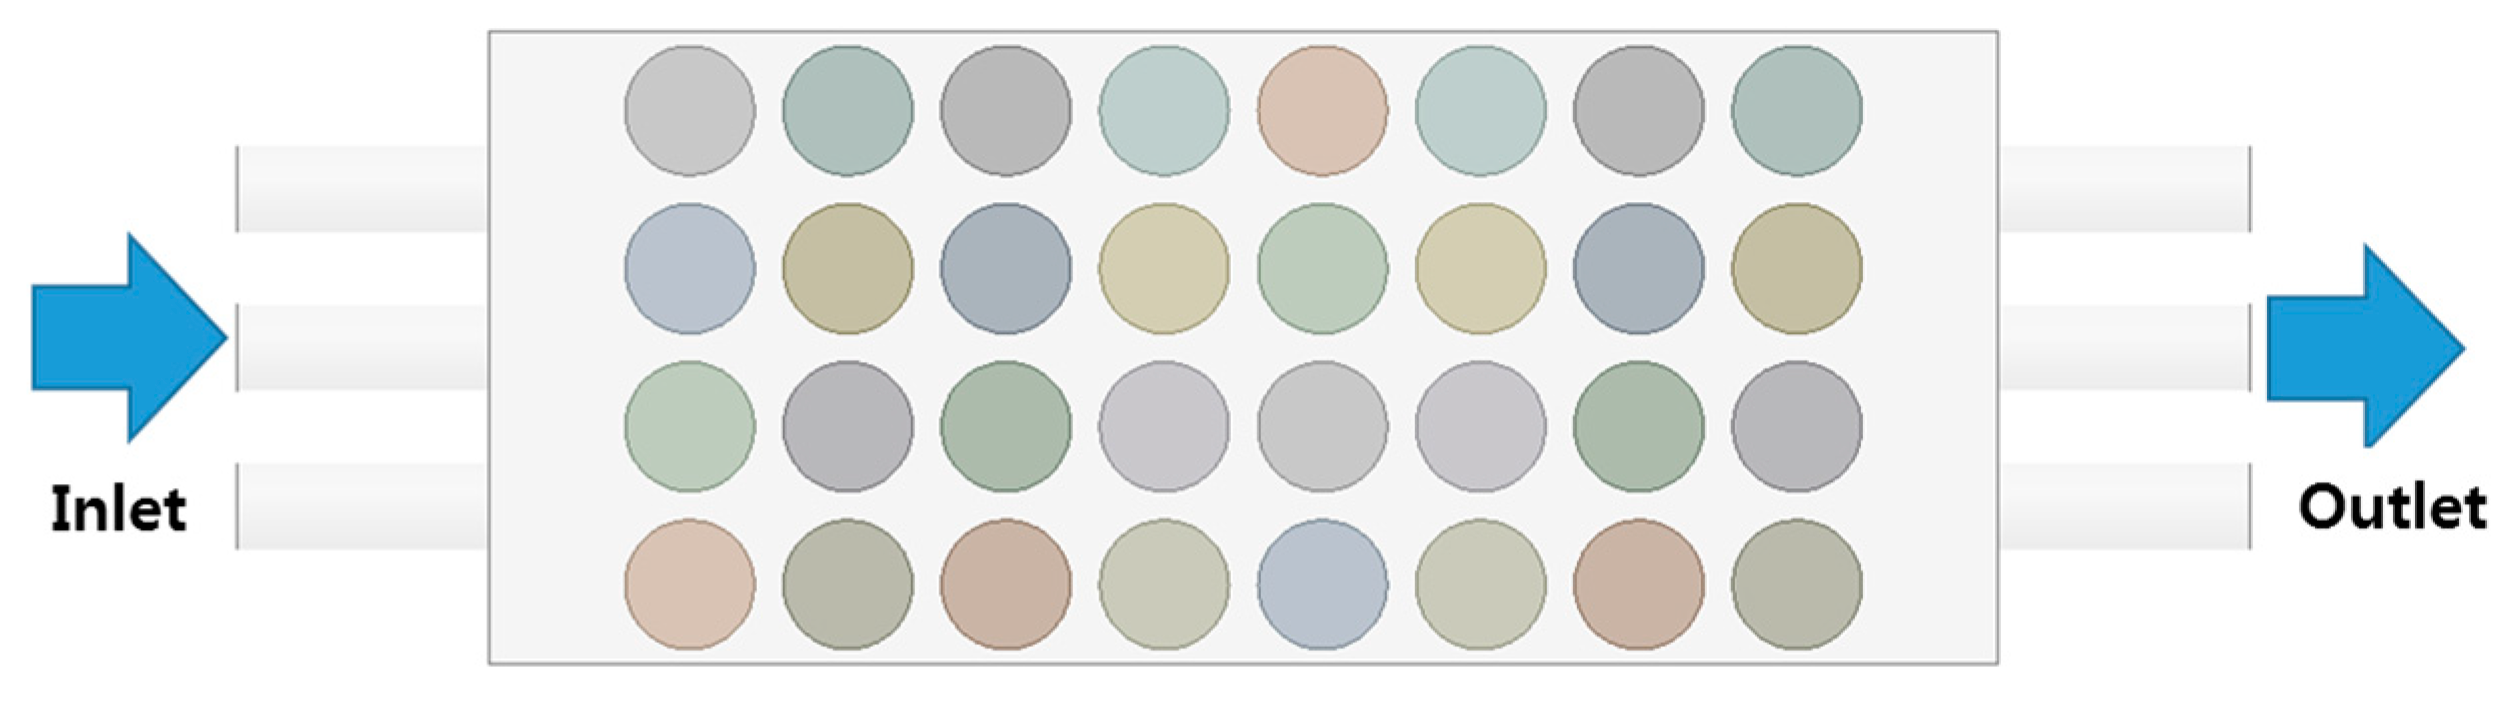
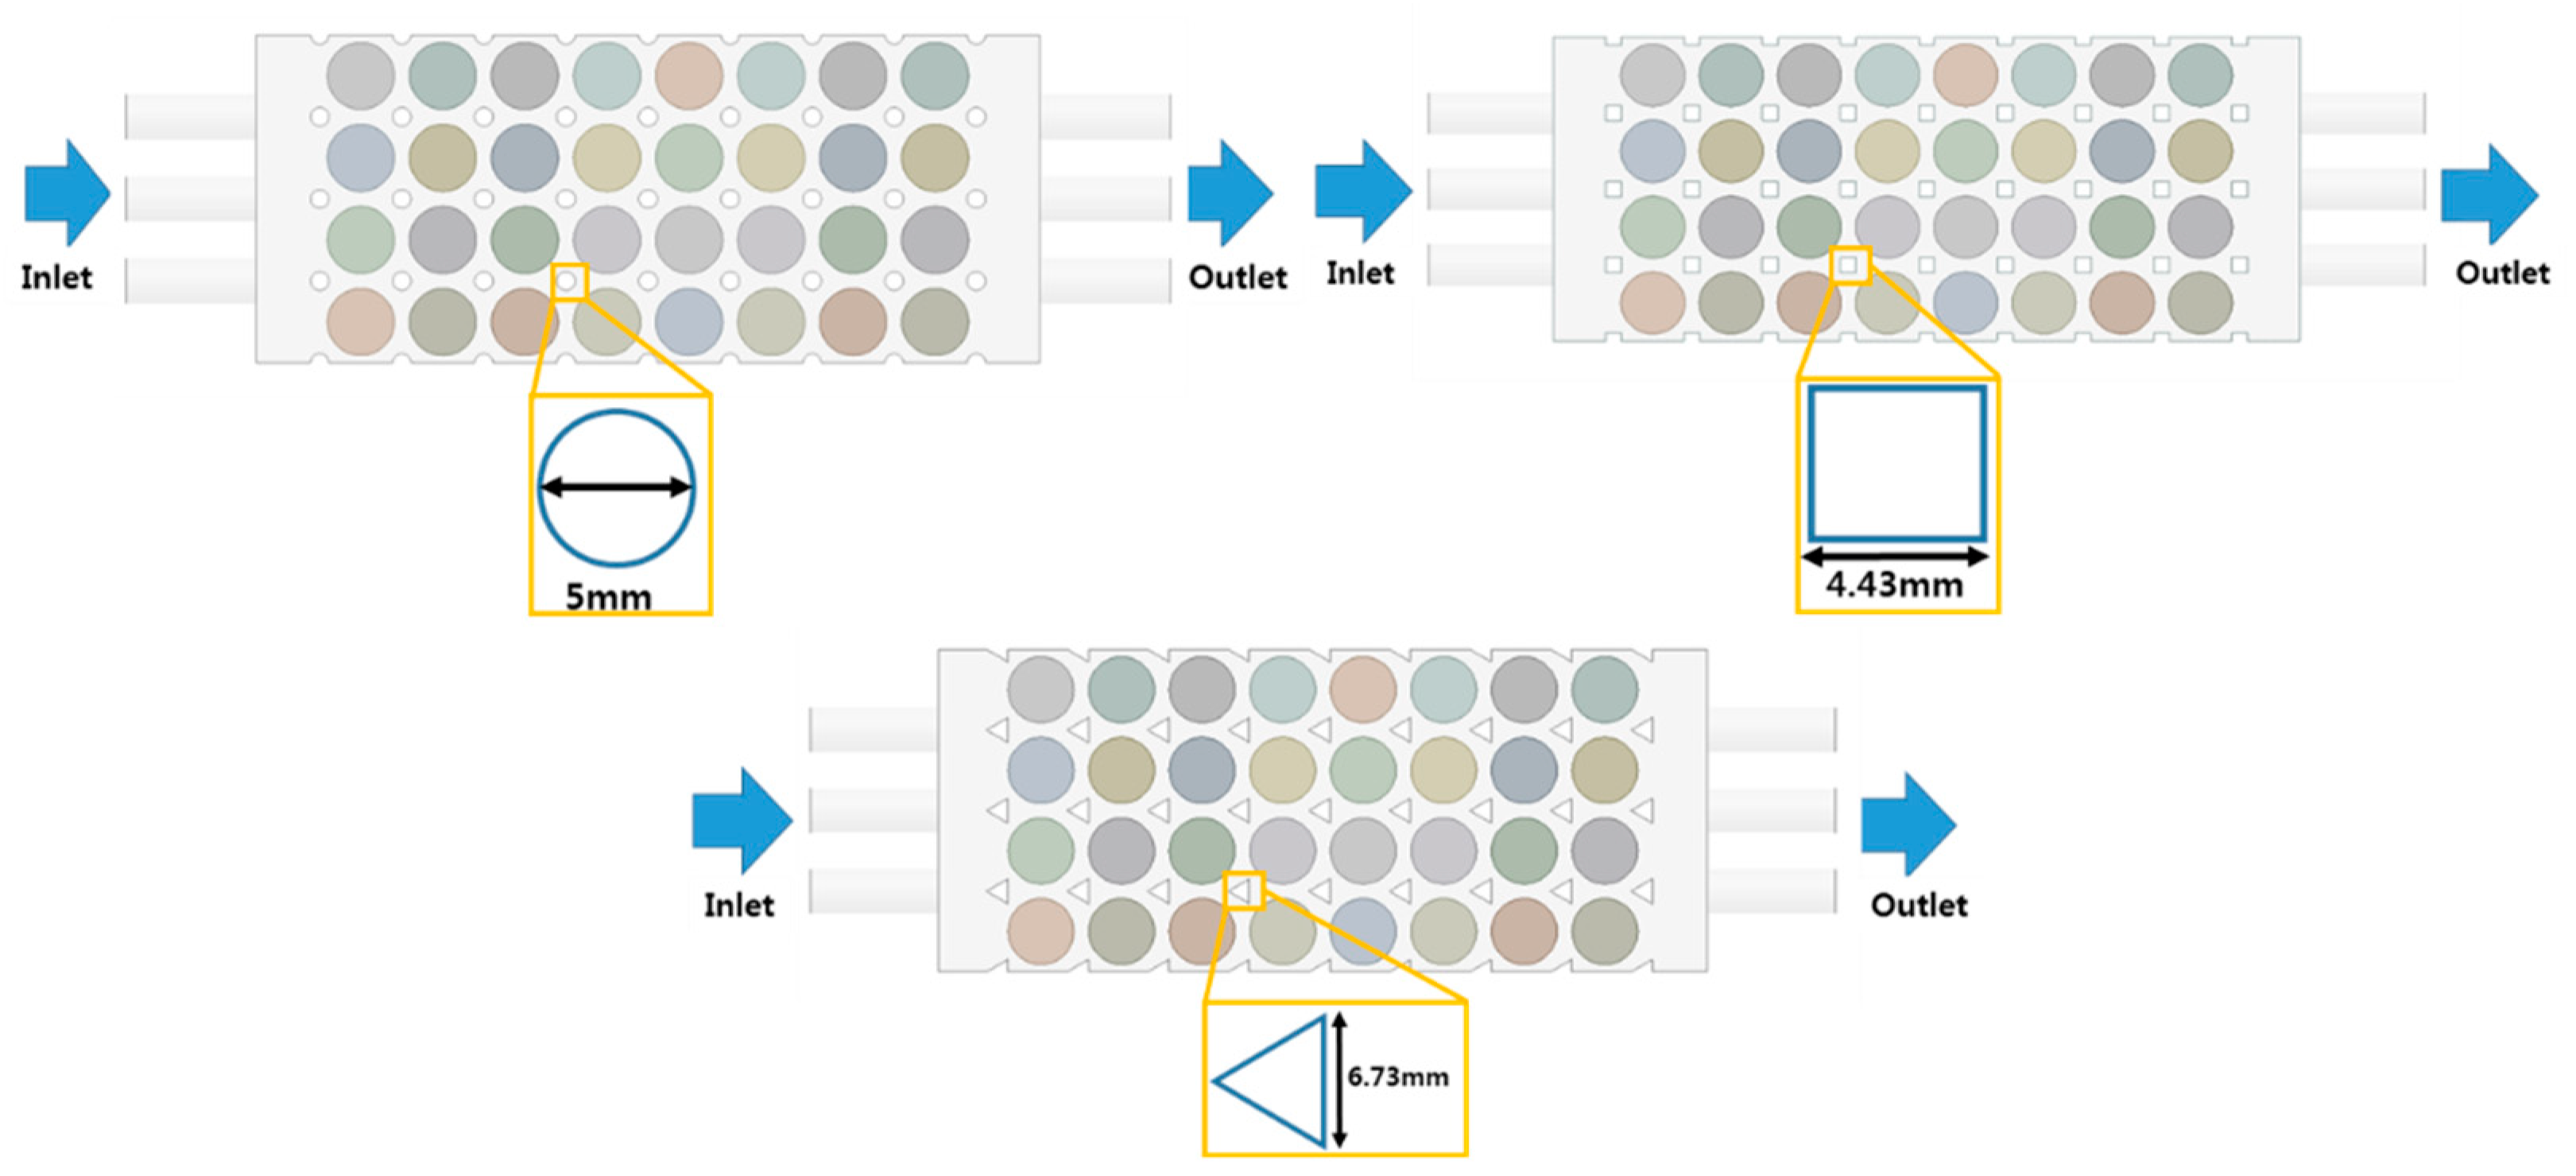
2.1. Computational Geometry
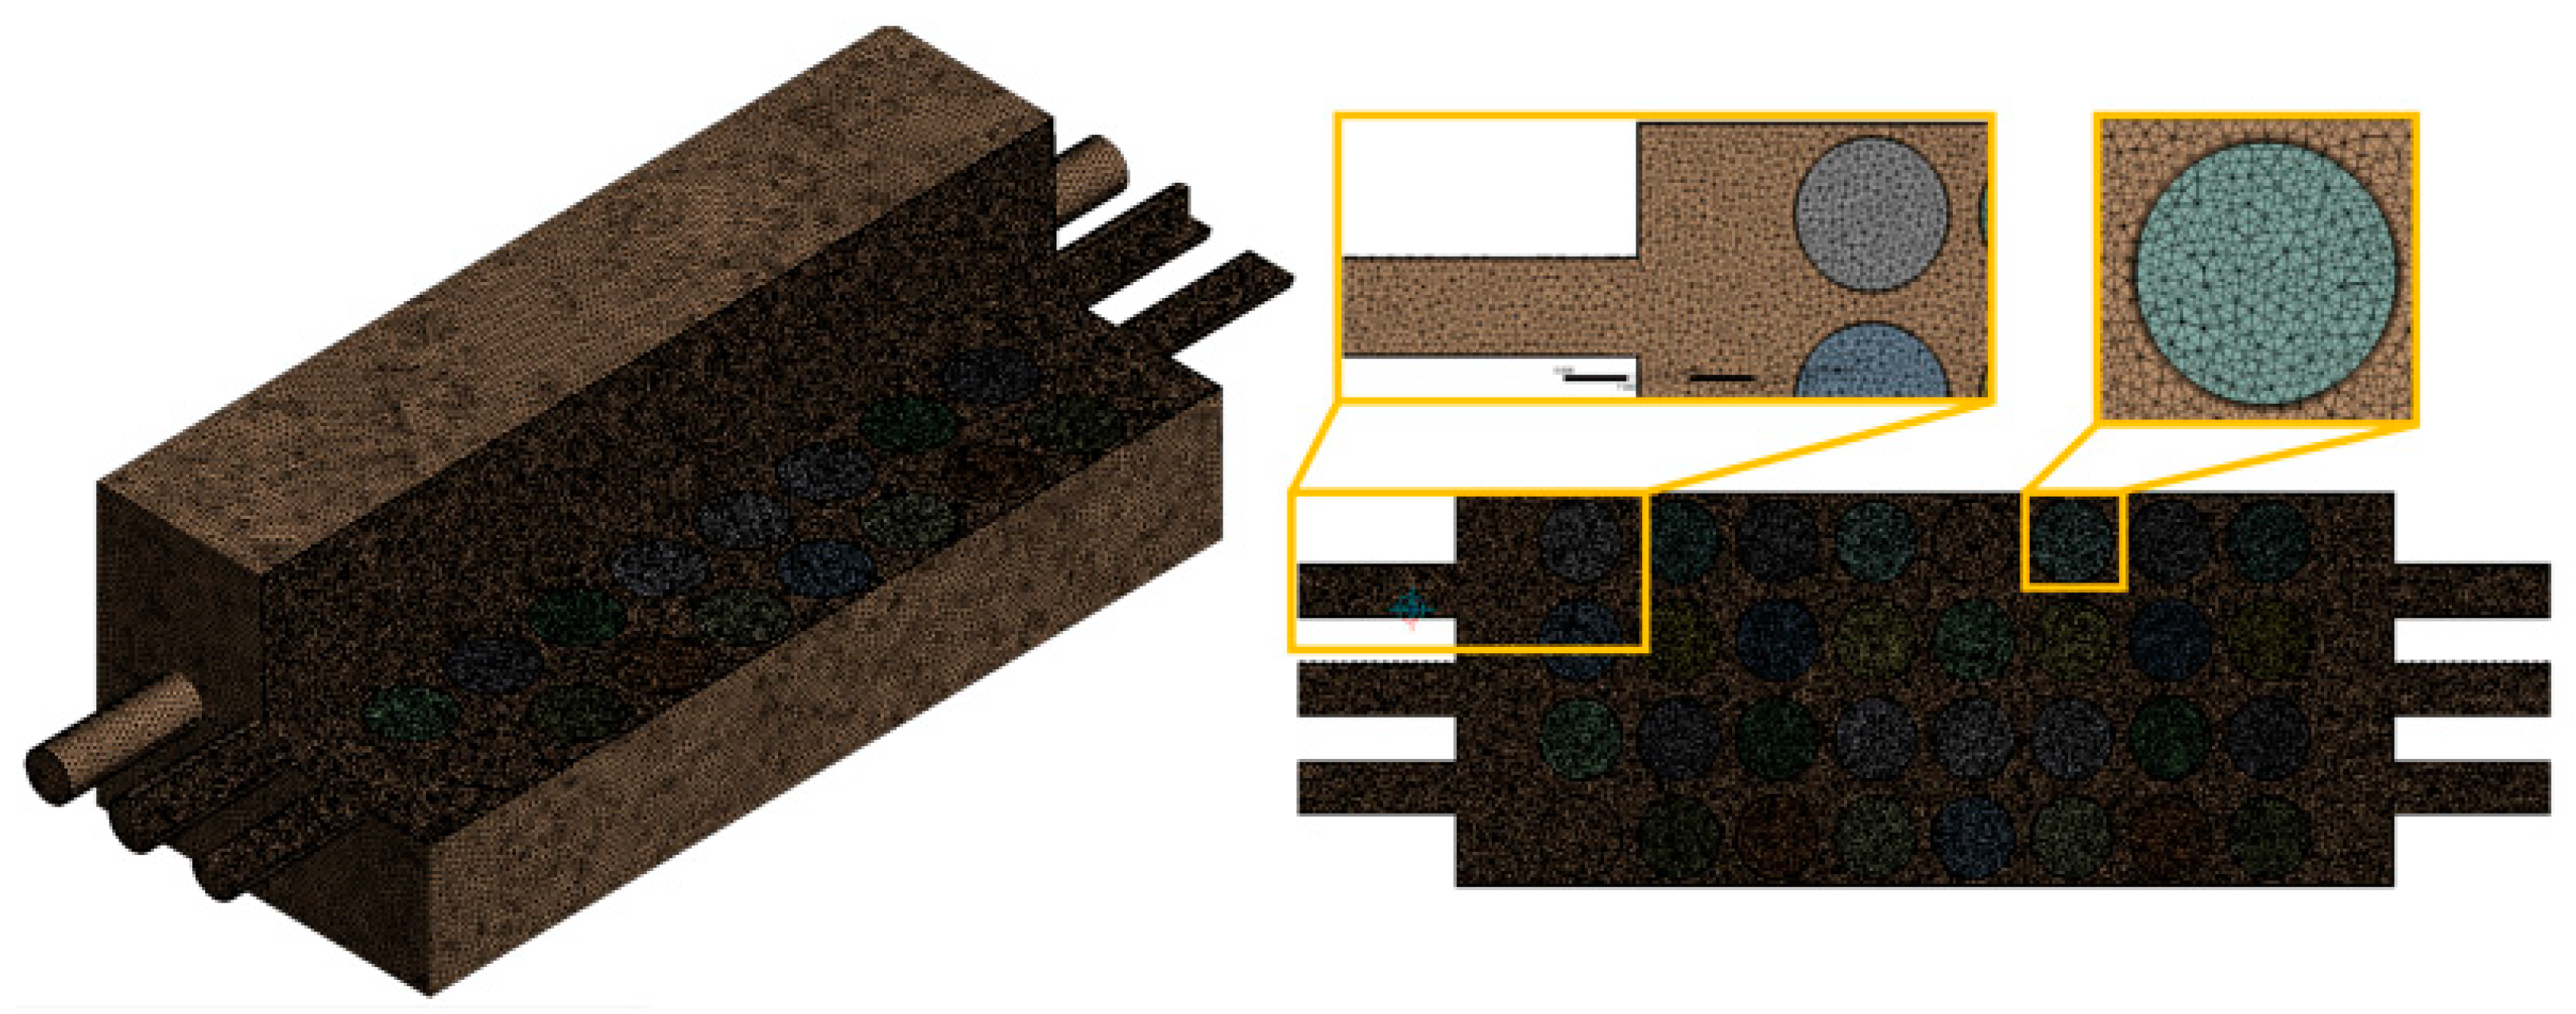
The computational geometry of the battery pack with dielectric fluid immersion cooling is shown in Figure 1. Figure 1 depicts the computational geometry without fins which is named the base structure. The cooling performance is affected by the arrangement of cells in the battery pack; therefore, an aligned arrangement of cells for the battery pack is selected in the present numerical study. The spacing between the battery cells is set to 4 mm, and the battery cell has a height of 65 mm and a diameter of 18 mm.
The fluid flow is an important aspect to improve the cooling performance of direct liquid cooling for the battery pack. Han et al. have found that the bus bar of a battery pack affects the cooling performance of direct liquid cooling because the bus bars act as fins to affect the distribution of fluid flow in direct liquid cooling [29]. Therefore, the computational geometry is modified by incorporating three different fin structures of circular, rectangular and triangular, as shown in Figure 2. A total of 36 fins of each type (circular, rectangular and triangular fins) are inserted in the base structure with the aim of achieving the symmetrical flow distribution of working fluid. The lengths of circular, rectangular and triangular fins are 5 mm, 4.43 mm, and 6.73 mm, respectively with the same area and the same height. The fins are located in the empty space between the battery cells with 4 mm spacing. The ANSYS Fluent commercial software is used to simulate the heat transfer characteristics of the battery pack with dielectric fluid immersion cooling, considering the effect of various fin structures.

2.2. Meshing

The mesh independence test is conducted to confirm the balance between the computational time and the accuracy of the simulated results. The mesh configuration with six different mesh element numbers is considered to conduct the mesh independency test. The maximum temperature of the battery and pressure drop are simulated for six different mesh element numbers. The simulated results of maximum temperature and pressure drop for the considered mesh element numbers are shown in Table 1. The maximum temperature and pressure drop converged within 0.045% and 0.309%, respectively, for mesh type 5. Therefore, mesh type 5 with an element number of 6,239,514 is selected as the final mesh configuration for the computation geometry to conduct the numerical analysis.
The orthogonal quality for mesh type 5 is measured to ensure the quality of the mesh. The minimum value of orthogonal quality for mesh type 5 is reported as 0.156, which is an acceptable value for the numerical simulation. The mesh is provided with the inflation layers between the solid wall and fluid domain to predict the velocity at the boundary layer of flow. The mesh configuration for the computational geometry is shown in Figure 3.

2.3. Governing Equation

To predict the heat transfer characteristics of the battery pack with dielectric fluid immersion cooling, continuity, momentum, and energy equations as presented by Equations (1)–(3) are solved numerically. The Reynolds number for all cases of fin structures is below 2300. Hence, the laminar flow is considered for the present simulations [30].
ρ w t + ρ w U = 0
ρ w t U + ρ w U U = p + μ w U
ρ w C p , w T w t + ρ w C p , w U T w = k w T w
Here, ρ w is the density of the working fluid, U is velocity, p is pressure, k w is the thermal conductivity of the working fluid, μ w is the viscosity of working fluid, C p , w is specific heat of working fluid and T w is temperature of working fluid.
The energy conservation for battery pack is presented by Equation (4) [31].
t ρ b C p , b T b = · k b T b + Q t o t a l
Here, ρ b is density of battery pack, C p , b is specific heat of battery pack, T b is temperature of battery pack, k b is thermal conductivity of battery pack and Q t o t a l is heat generation of battery pack.

2.4. Boundary Condition

The heat source of the battery at 5C discharge rate is shown in Table 2 based on the experiment data presented by Dong et al. [32]. This heat source is considered as heat generation for battery pack while simulating its heat transfer characteristics. The mathematical expression of heat generation to battery cells is presented by Equation (5) which is employed as boundary condition in numerical model. The E5-TM410 coolant is selected as a working fluid in the present numerical simulation. The inlet temperature of the working fluid is set to 25 °C. The wall condition of the surface is set to non-slip condition. The boundary conditions for numerical simulation are shown in Table 3. The thermophysical properties of battery and working fluid are shown in Table 4 [32]. In the numerical simulations, the thermophysical properties are assumed to be constant; hence, the temperature effect on thermophysical properties is neglected [33].
Q b = 0.0013 t 3 0.97 t 2 + 143.12 t + 293016
Here, Q b is heat generation employed as boundary condition to battery cells and t is time.
Table 2. Battery heat source considered in numerical simulations.
Time (s)Heat Generation (W)Time (s)Heat Generation (W)
04.914324.75
714.895044.75
1444.845764.72
2164.826485.57
2874.737206.29
3604.66
Table 3. Boundary conditions for numerical simulation.
Specification
Working fluidE5-TM410
Inlet working fluid temperature (°C)25
Inlet working fluid volume flow meter (LPM)1, 2, 3, 4, 5
Outlet pressure (Pa)0
Wall slip conditionNon-slip
Heat source of battery (W)Table 2
Table 4. Thermophysical properties of battery and working fluid.
PropertyBatteryE5-TM410
Density (kg/m3)2055.1805
Specific heat (J/kg∙K)1129.952100
Thermal conductivity (W/m∙K)1.07 (radial)
19.03 (axial, tangential)
0.14
Viscosity (Pa∙s)-0.015617-

2.5. Data Reduction

In this section, the heat transfer characteristics of dielectric fluid immersion cooling for battery pack are evaluated in terms of maximum temperature, temperature difference, pressure drop, heat transfer coefficient, Nusselt number, friction factor and PEC.
The average heat transfer coefficient of dielectric fluid immersion cooling for battery is calculated using Equation (6) [34].
h a v g = Q w A b a t T a v g , b a t T b u l k , m e a n , w
The bulk mean temperature of working fluid is calculated using Equation (7).
T b u l k , m e a n , w = T b u l k , i n , w + T b u l k , o u t , w 2
The heat absorbed by working fluid is calculated using Equation (8).
Q w = m ˙ w C p , w T b u l k , i n , w T b u l k , o u t , w
The average Nusselt number for working fluid is calculated using Equation (9) [35].
N u a v g = h a v g D h k w
The pressure drop for working fluid is calculated using Equation (10).
Δ P a v g , w = P i n , w P o u t , w
The friction factor for working fluid is calculated using Equation (11) [36].
f = 2 D h Δ P a v g , w ρ L u 2
The PEC is calculated using Equation (12) [37,38].
P E C = N u a v g , w i t h o u t   f i n N u a v g , w i t h   f i n f w i t h o u t   f i n f w i t h   f i n 1 3
Here, Q w is heat absorbed by working fluid, A b a t is surface area of battery, T a v g , b a t is average temperature of batteries, T b u l k , m e a n , w is bulk mean temperature of working fluid, T b u l k , i n , w is inlet temperature of working fluid, T b u l k , o u t , w is outlet temperature of working fluid, m ˙ w , C p , w and k w are mass flow rate, specific heat and thermal conductivity of working fluid, respectively, P i n , w and P o u t , w are inlet and outlet pressures of working fluid, L is length of channel, D h is hydraulic diameter of channel, u is average velocity of working fluid, ρ is density of working fluid.

3. Results and Discussion
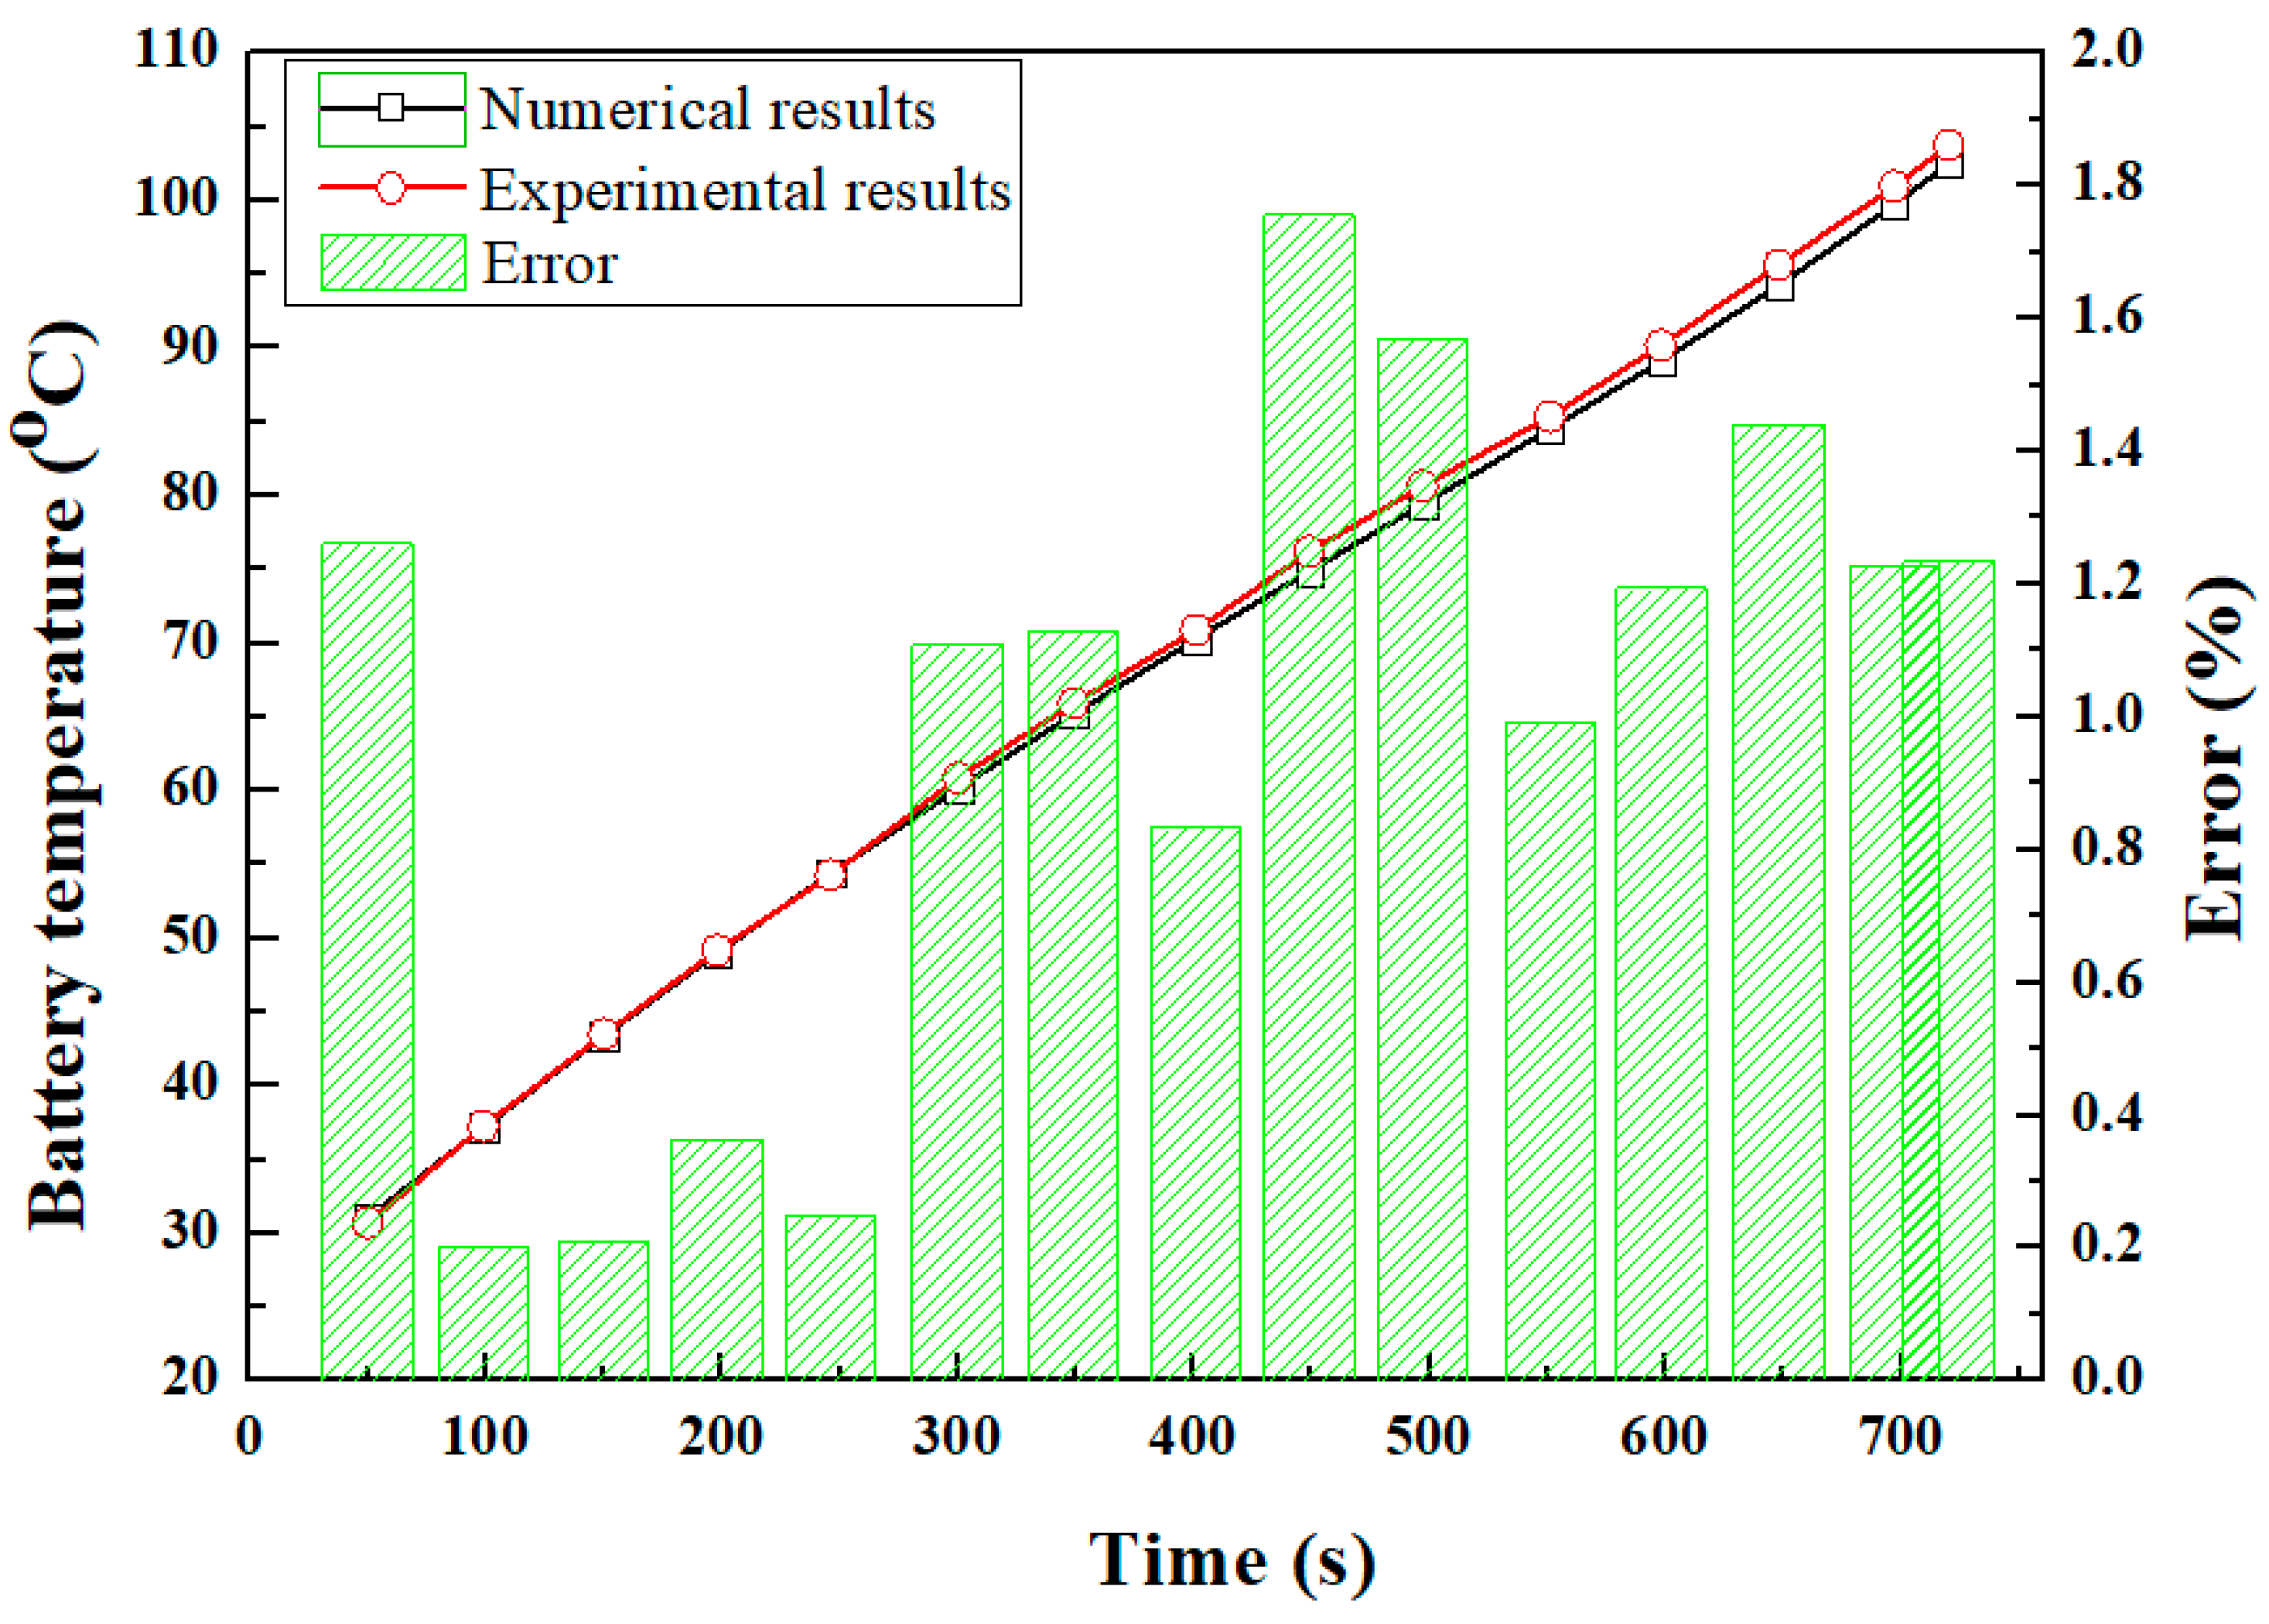
In this section, the numerical simulation model is validated with experiment for heat transfer characteristics of the battery. The heat transfer characteristics of maximum temperature, temperature difference, average temperature, Nusselt number and pressure drop are elaborated considering different fin structures for battery pack with dielectric fluid immersion cooling. The best fin structure is selected based on the parameter, namely performance evaluation criteria (PEC). Furthermore, the effect of different fin dimensions of the best fin structure is studied on heat transfer characteristics of battery pack with dielectric fluid immersion cooling.

3.1. Validation

To assure the accuracy and reliability of the numerical results, the thermal performance of the battery is validated with the experimental data presented by Dong et al. [32]. The comparison of numerical and experimental results of battery temperature at 5C discharge rate is shown in Figure 4. The simulated temperature from the proposed numerical model shows closer agreement with the experimental temperature over the entire discharge period. The maximum error between the simulated temperature and experimental temperature of the battery is restricted within 1.7%.

3.2. Effect of Fin Structure

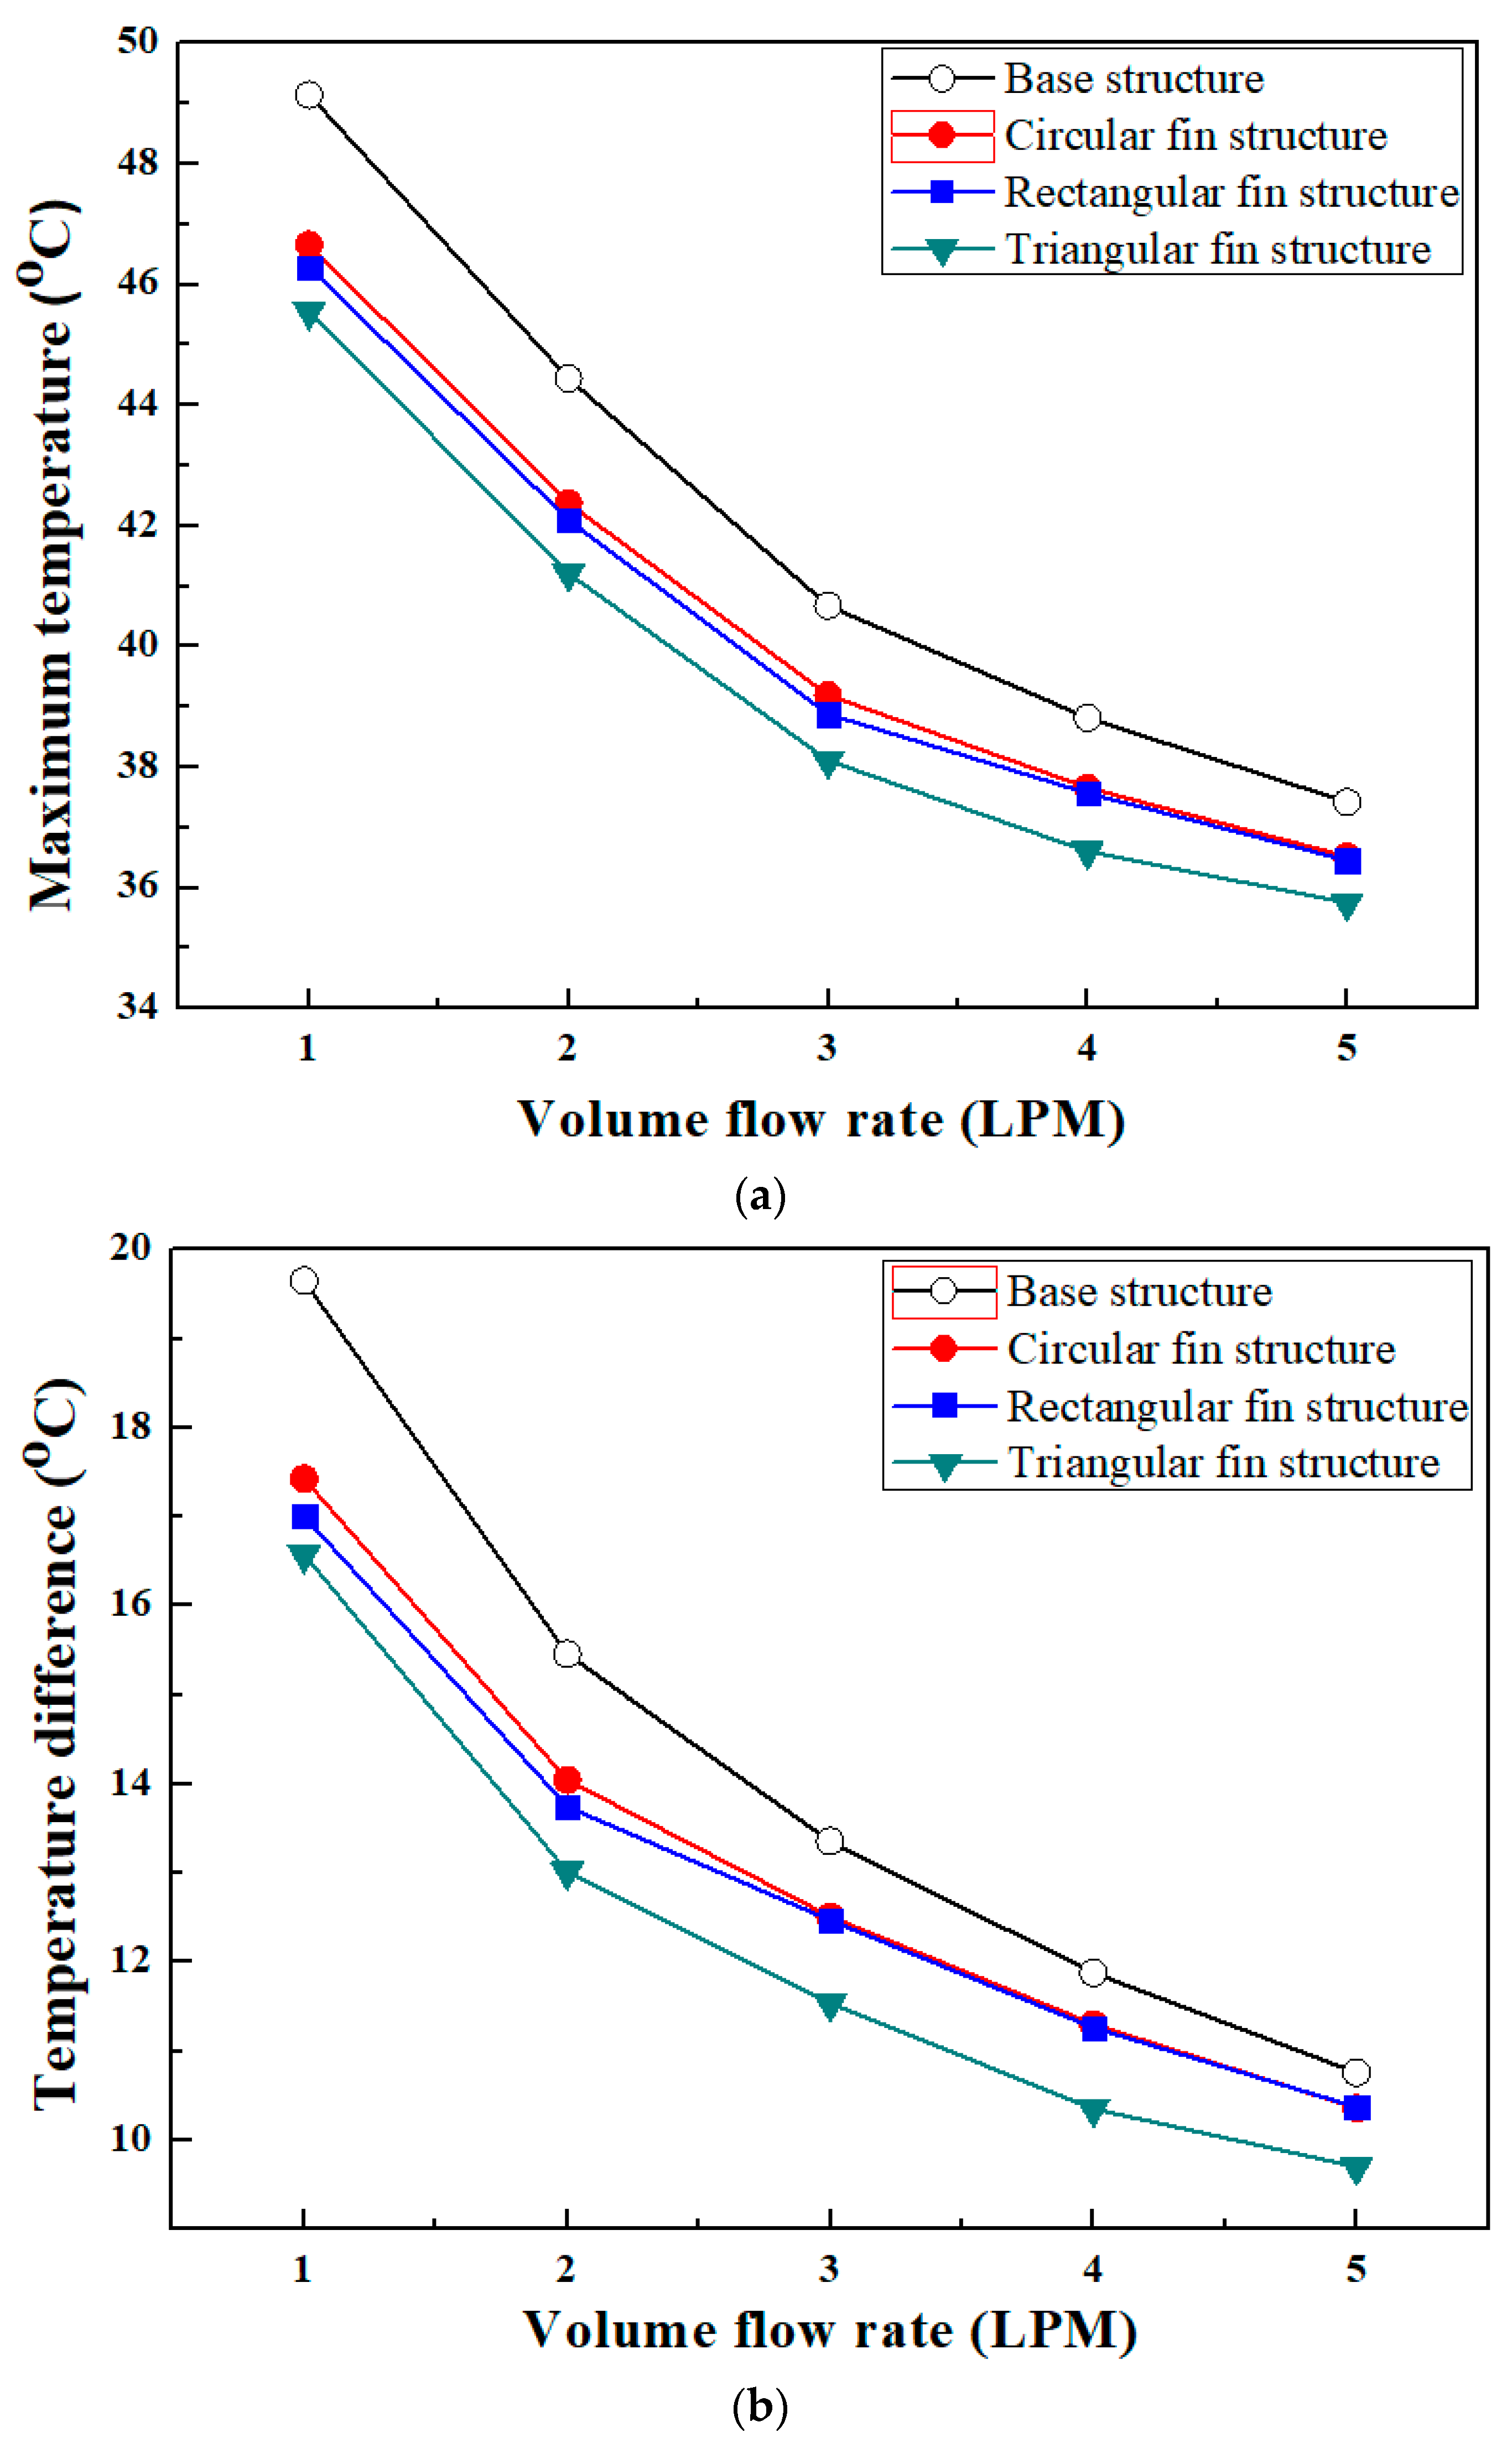
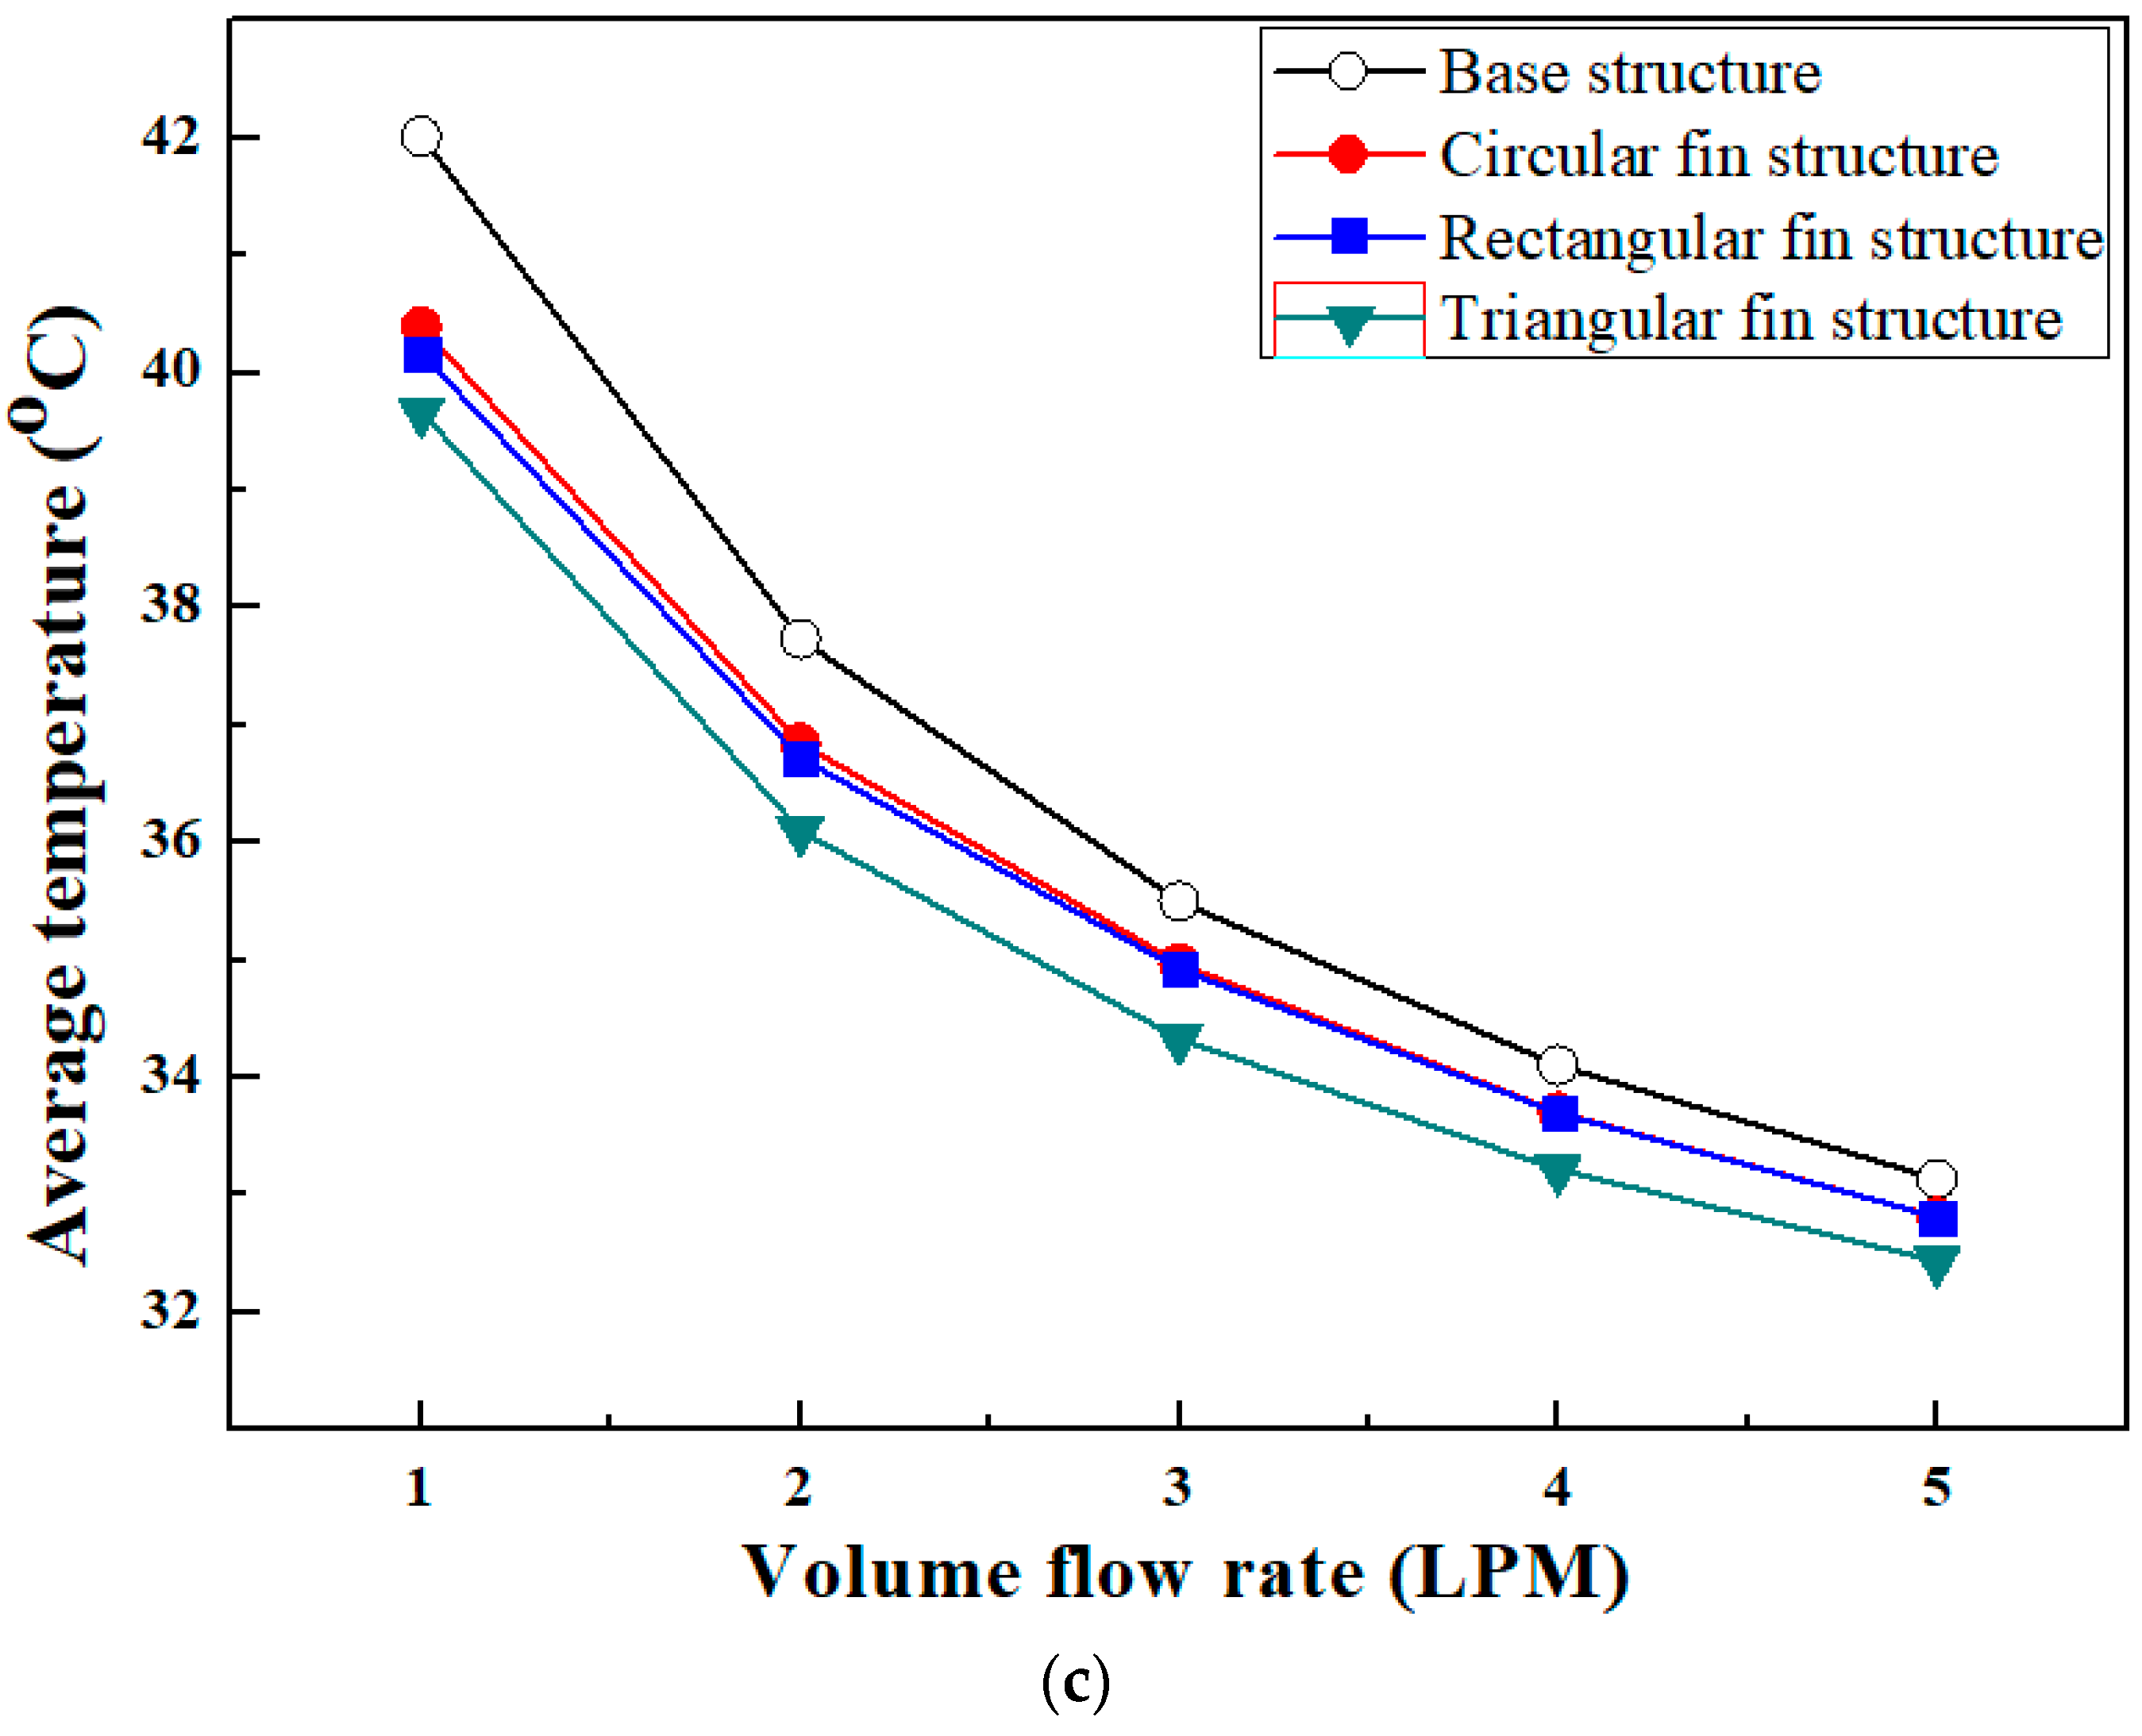
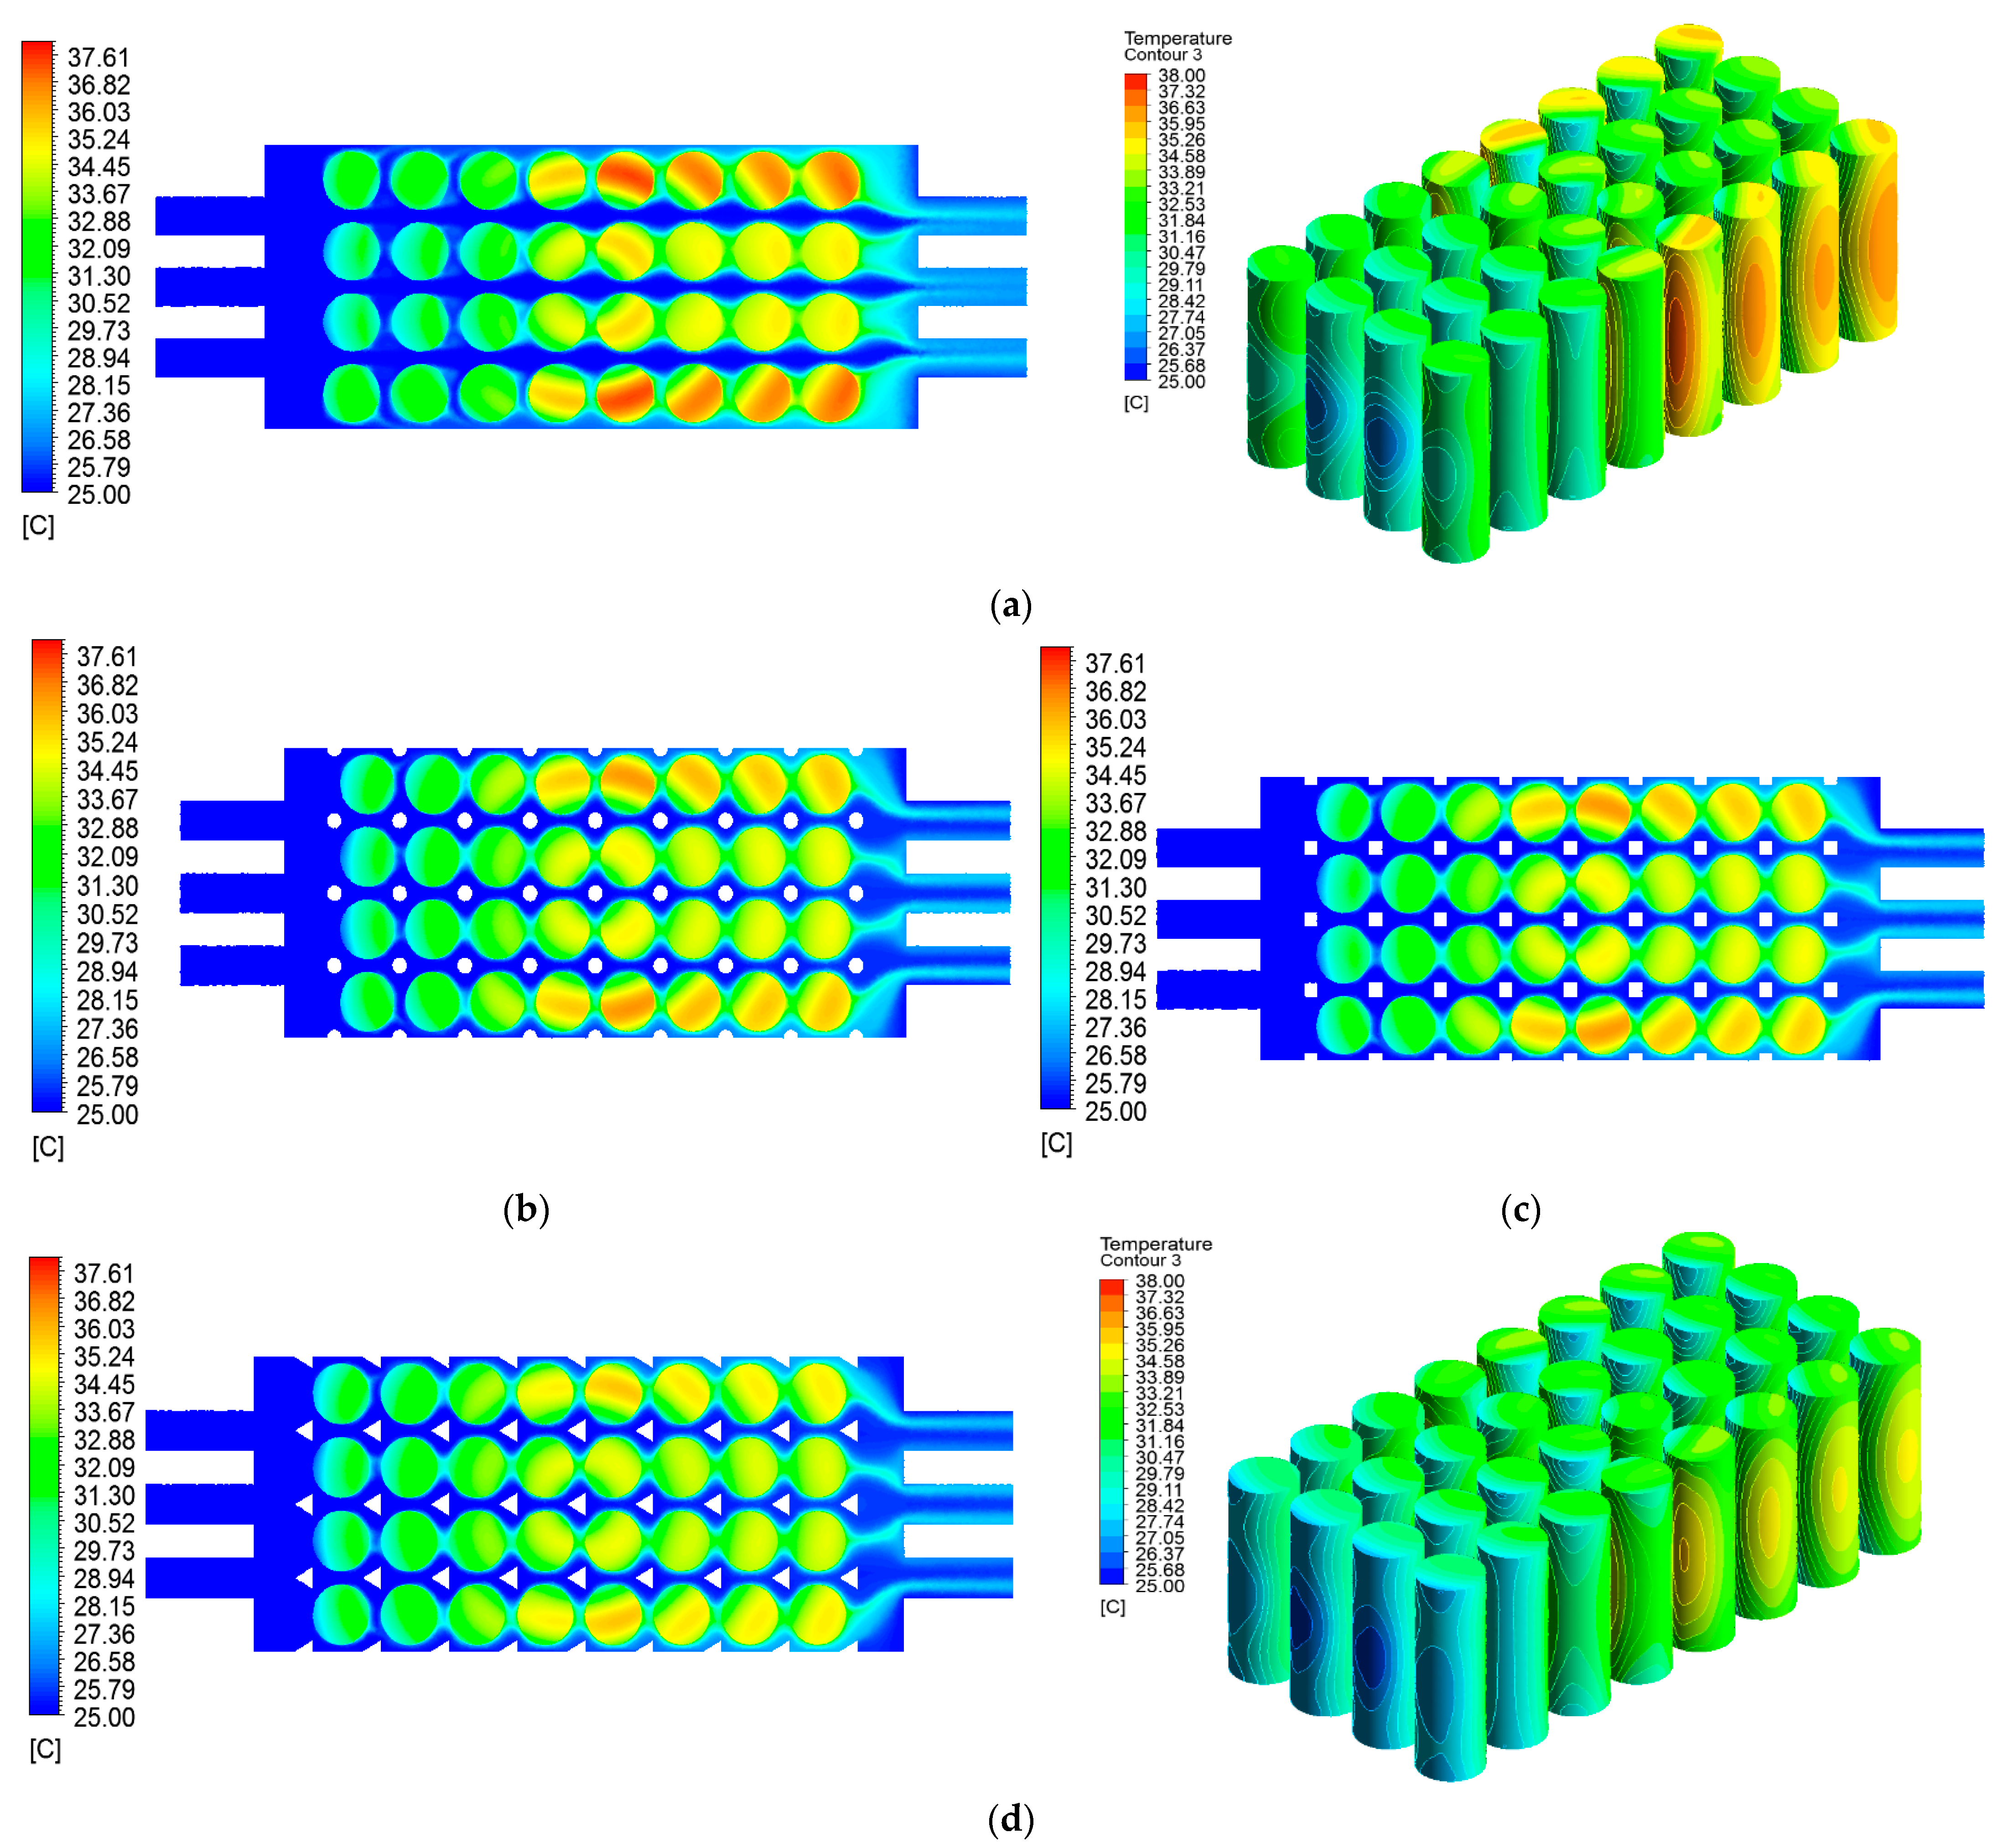
3.2.1. Temperature Performance

The maximum temperature of the battery pack with volume flow rate for different fin structures is shown in Figure 5a. The maximum temperature decreases with increase in volume flow rate for all cases of fin structures. Dubey et al. have also concluded that the maximum temperature of the battery decreases with increase in volume flow rate because the heat transfer coefficient improves with increase in volume flow rate [22]. The optimum operating temperature for the battery pack is achieved at a volume flow rate of 3 LPM in case of fin structure. All cases with volume flow rate higher than 3 LPM satisfy the criteria of battery optimum operating temperature range. The triangular fin structure shows the lowest maximum temperature of battery pack owing to the more uniform distribution of working fluid within the channel compared to other fin structures. The maximum temperatures decease by 2.41%, 2.57%, 4.45% in case of circular, rectangular, triangular fin structures, respectively at volume flow rate of 5 LPM compared to base structure.
Figure 5b presents the temperature difference of battery pack for various fin structures. The temperature difference is calculated by subtracting the minimum point temperature of battery from the maximum point temperature of the battery. The trends of temperature difference are same with maximum temperature at each volume flow rate. The temperature difference decreases with increase in volume flow rate for all cases. The temperature differences of triangular fin structure are lower by 15.67%, 15.77%, 13.64%, 12.86% and 9.82% compared to base structure at volume flow rates of 1 LPM, 2 LPM, 3 LPM, 4 LPM and 5 LPM, respectively.
The variation of the average temperature of the battery pack with volume flow rate for various fin structures is shown in Figure 5c. The average temperature of battery pack represents the overall temperature of the battery pack which decreases with increase in volume flow rate for all fin structures. The average temperature of the battery pack is in the same trend as maximum temperature and temperature difference. The triangular fin structure shows lower average temperature of battery pack compared to other fin structures because of the uniform distribution of working fluid. The average temperatures of battery pack are reported as 39.67 °C, 36.10 °C, 34.33 °C, 33.21 °C, and 32.44 °C at volume flow rates of 1 LPM, 2 LPM, 3 LPM, 4 LPM and 5 LPM, respectively in case of triangular fin structure. Compared to base structure, the average temperature of battery pack decreases by 5.57%, 4.32%, 3.29%, 2.60% and 2.10% at volume flow rates of 1 LPM, 2 LPM, 3 LPM, 4 LPM and 5 LPM, respectively for triangular fin structure. Patil et al. have shown a decrease in temperature with an increase in volume flow rate for battery pack with direct fluid immersion cooling and tab cooling [27].
Figure 6 shows the temperature distribution within the computational geometry for different fin structures. The working fluid carries larger amount of heat from battery cells at the inlet and heat absorption amount decreases as the working fluid passes from inlet to outlet of channel. Hence, the battery cells located near the inlet of the channel show lower temperature compared to that located near the outlet. The maximum temperature observed for the battery cells located near the outlet position and side wall. The symmetrical temperature distribution is observed for all cases however, the presence of fins creates mixing of flow. And the distribution of working fluid improves which results in enhanced heat transfer between battery pack and working fluid compared to that without fins. To understand the flow distribution, the velocity distribution of working fluid for the base structure and triangular fin structure is depicted in Figure 7. Hasan et al. has also found that the heat transfer increases because of mixing of flow created by fins [37].

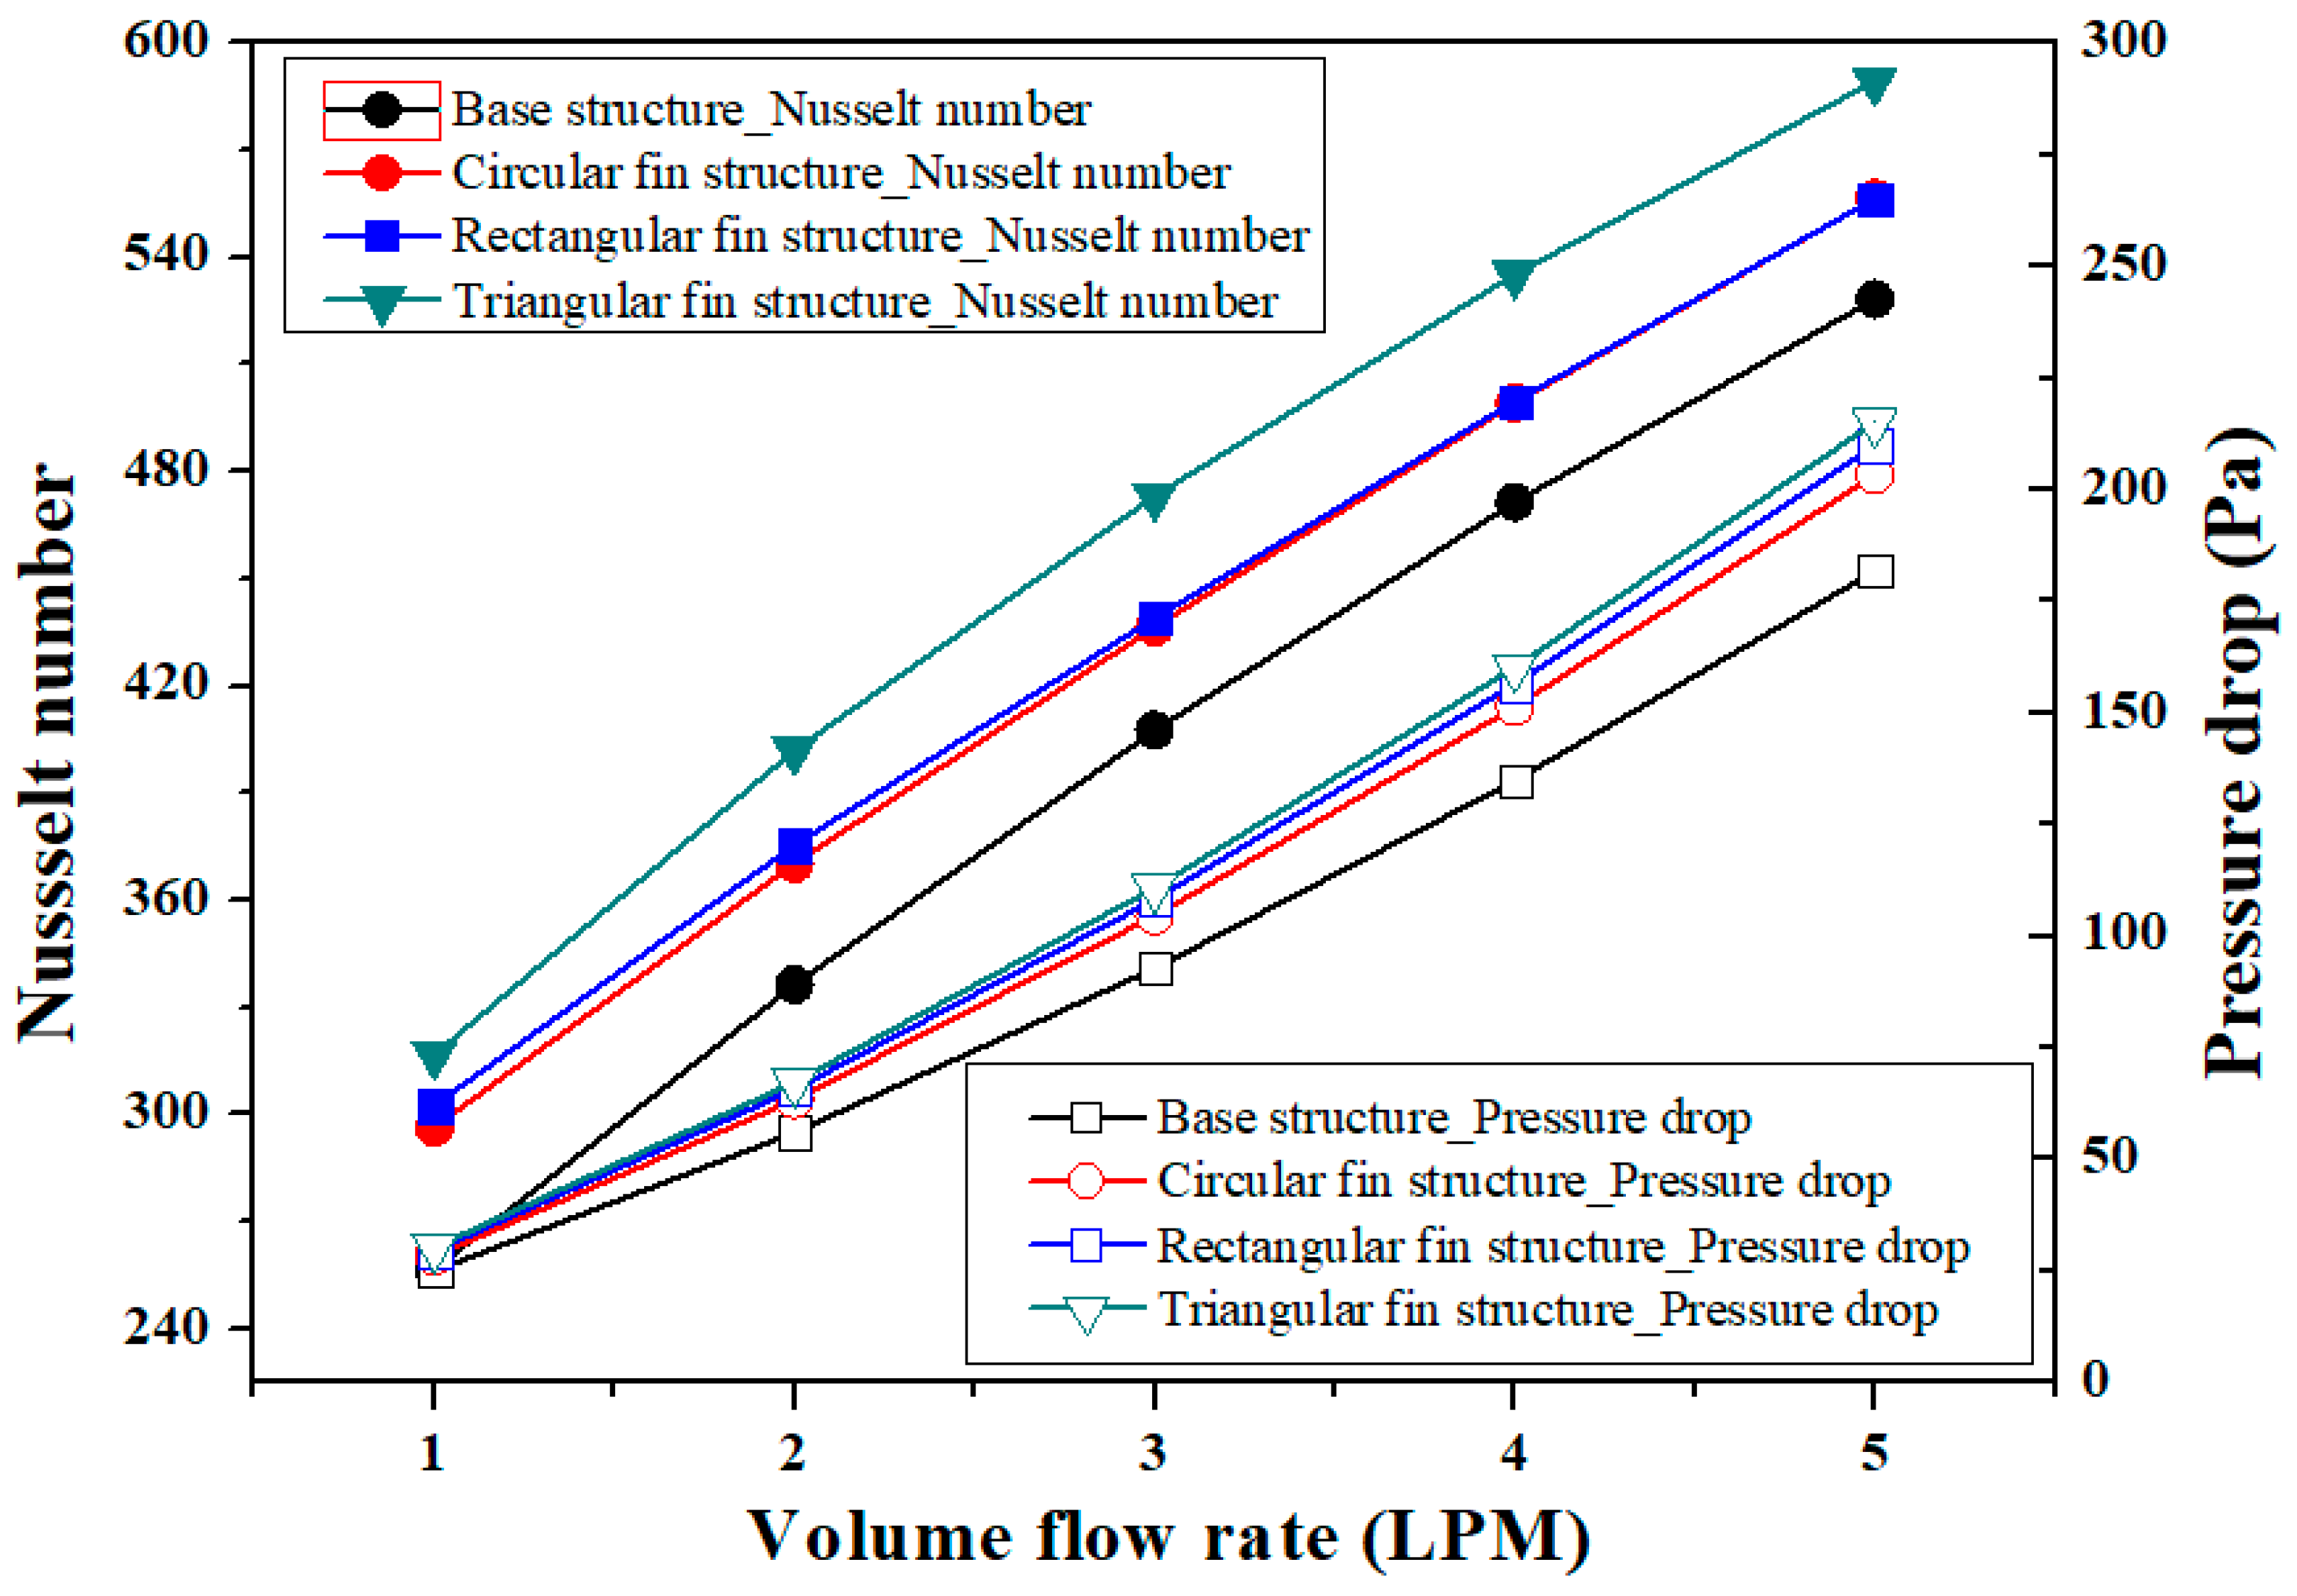
3.2.2. Nusselt Number and Pressure Drop

The trade-off comparison between Nusselt number and pressure drop with volume flow rate for different fin structures is shown in Figure 8. The heat transfer coefficient improves with increase in volume flow rate owing to the superior heat transfer rate at the higher volume flow rate. The Nusselt number increases with increase in volume flow rate because the Nusselt number depends on the heat transfer coefficient. Patil et al. have shown an increase in Nusselt number with increase in volume flow rate [39]. The triangular fin structure has reported the maximum value of Nusselt number followed by rectangular and circular fin structures in decreasing order for all volume flow rates. The triangular fin structure depicts the heat transfer coefficients of 3695.44 W/m2-K, 4690.40 W/m2-K, 5520.47 W/m2-K, 6244.25 W/m2-K and 6876.39 W/m2-K at volume flow rates of 1 LPM, 2 LPM, 3 LPM, 4 LPM and 5 LPM, respectively. The Nusselt numbers of 316.75, 402.03, 473.18, 535.22, 589.41 are reported at volume flow rates of 1 LPM, 2 LPM, 3 LPM, 4 LPM and 5 LPM, respectively for triangular fin structure. The Nusselt number for triangular fin structure is increased by 23.4%, 19.53%, 16.08%, 13.53% and 11.57% at volume flow rates of 1 LPM, 2 LPM, 3 LPM, 4 LPM and 5 LPM, respectively compared to base structure.
The higher volume flow rate results into the higher degree of flow mixing which creates the higher flow resistance. Therefore, the pressure drop increases with increase in volume flow rate for all fin structures. It is obvious that the base structure depicts the lower values of pressure drop over the entire range of volume flow rate because of minimum flow resistance. The triangular fin structure shows the higher flow resistance owing to the higher degree of obstruction to fluid flow which results in maximum pressure drop compared to circular and rectangular fin structures. The lowest pressure drops of 24.92 Pa, 55.98 Pa, 92.76 Pa, 134.78 Pa and 181.73 Pa are reported in case of base structure at volume flow rates of 1 LPM, 2 LPM, 3 LPM, 4 LPM and 5 LPM, respectively. The highest pressure drops of 30.28 Pa, 67.29 Pa, 110.77 Pa, 160.14 Pa and 241.98 Pa are evaluated in case of triangular fin structure at volume flow rates of 1 LPM, 2 LPM, 3 LPM, 4 LPM and 5 LPM, respectively.

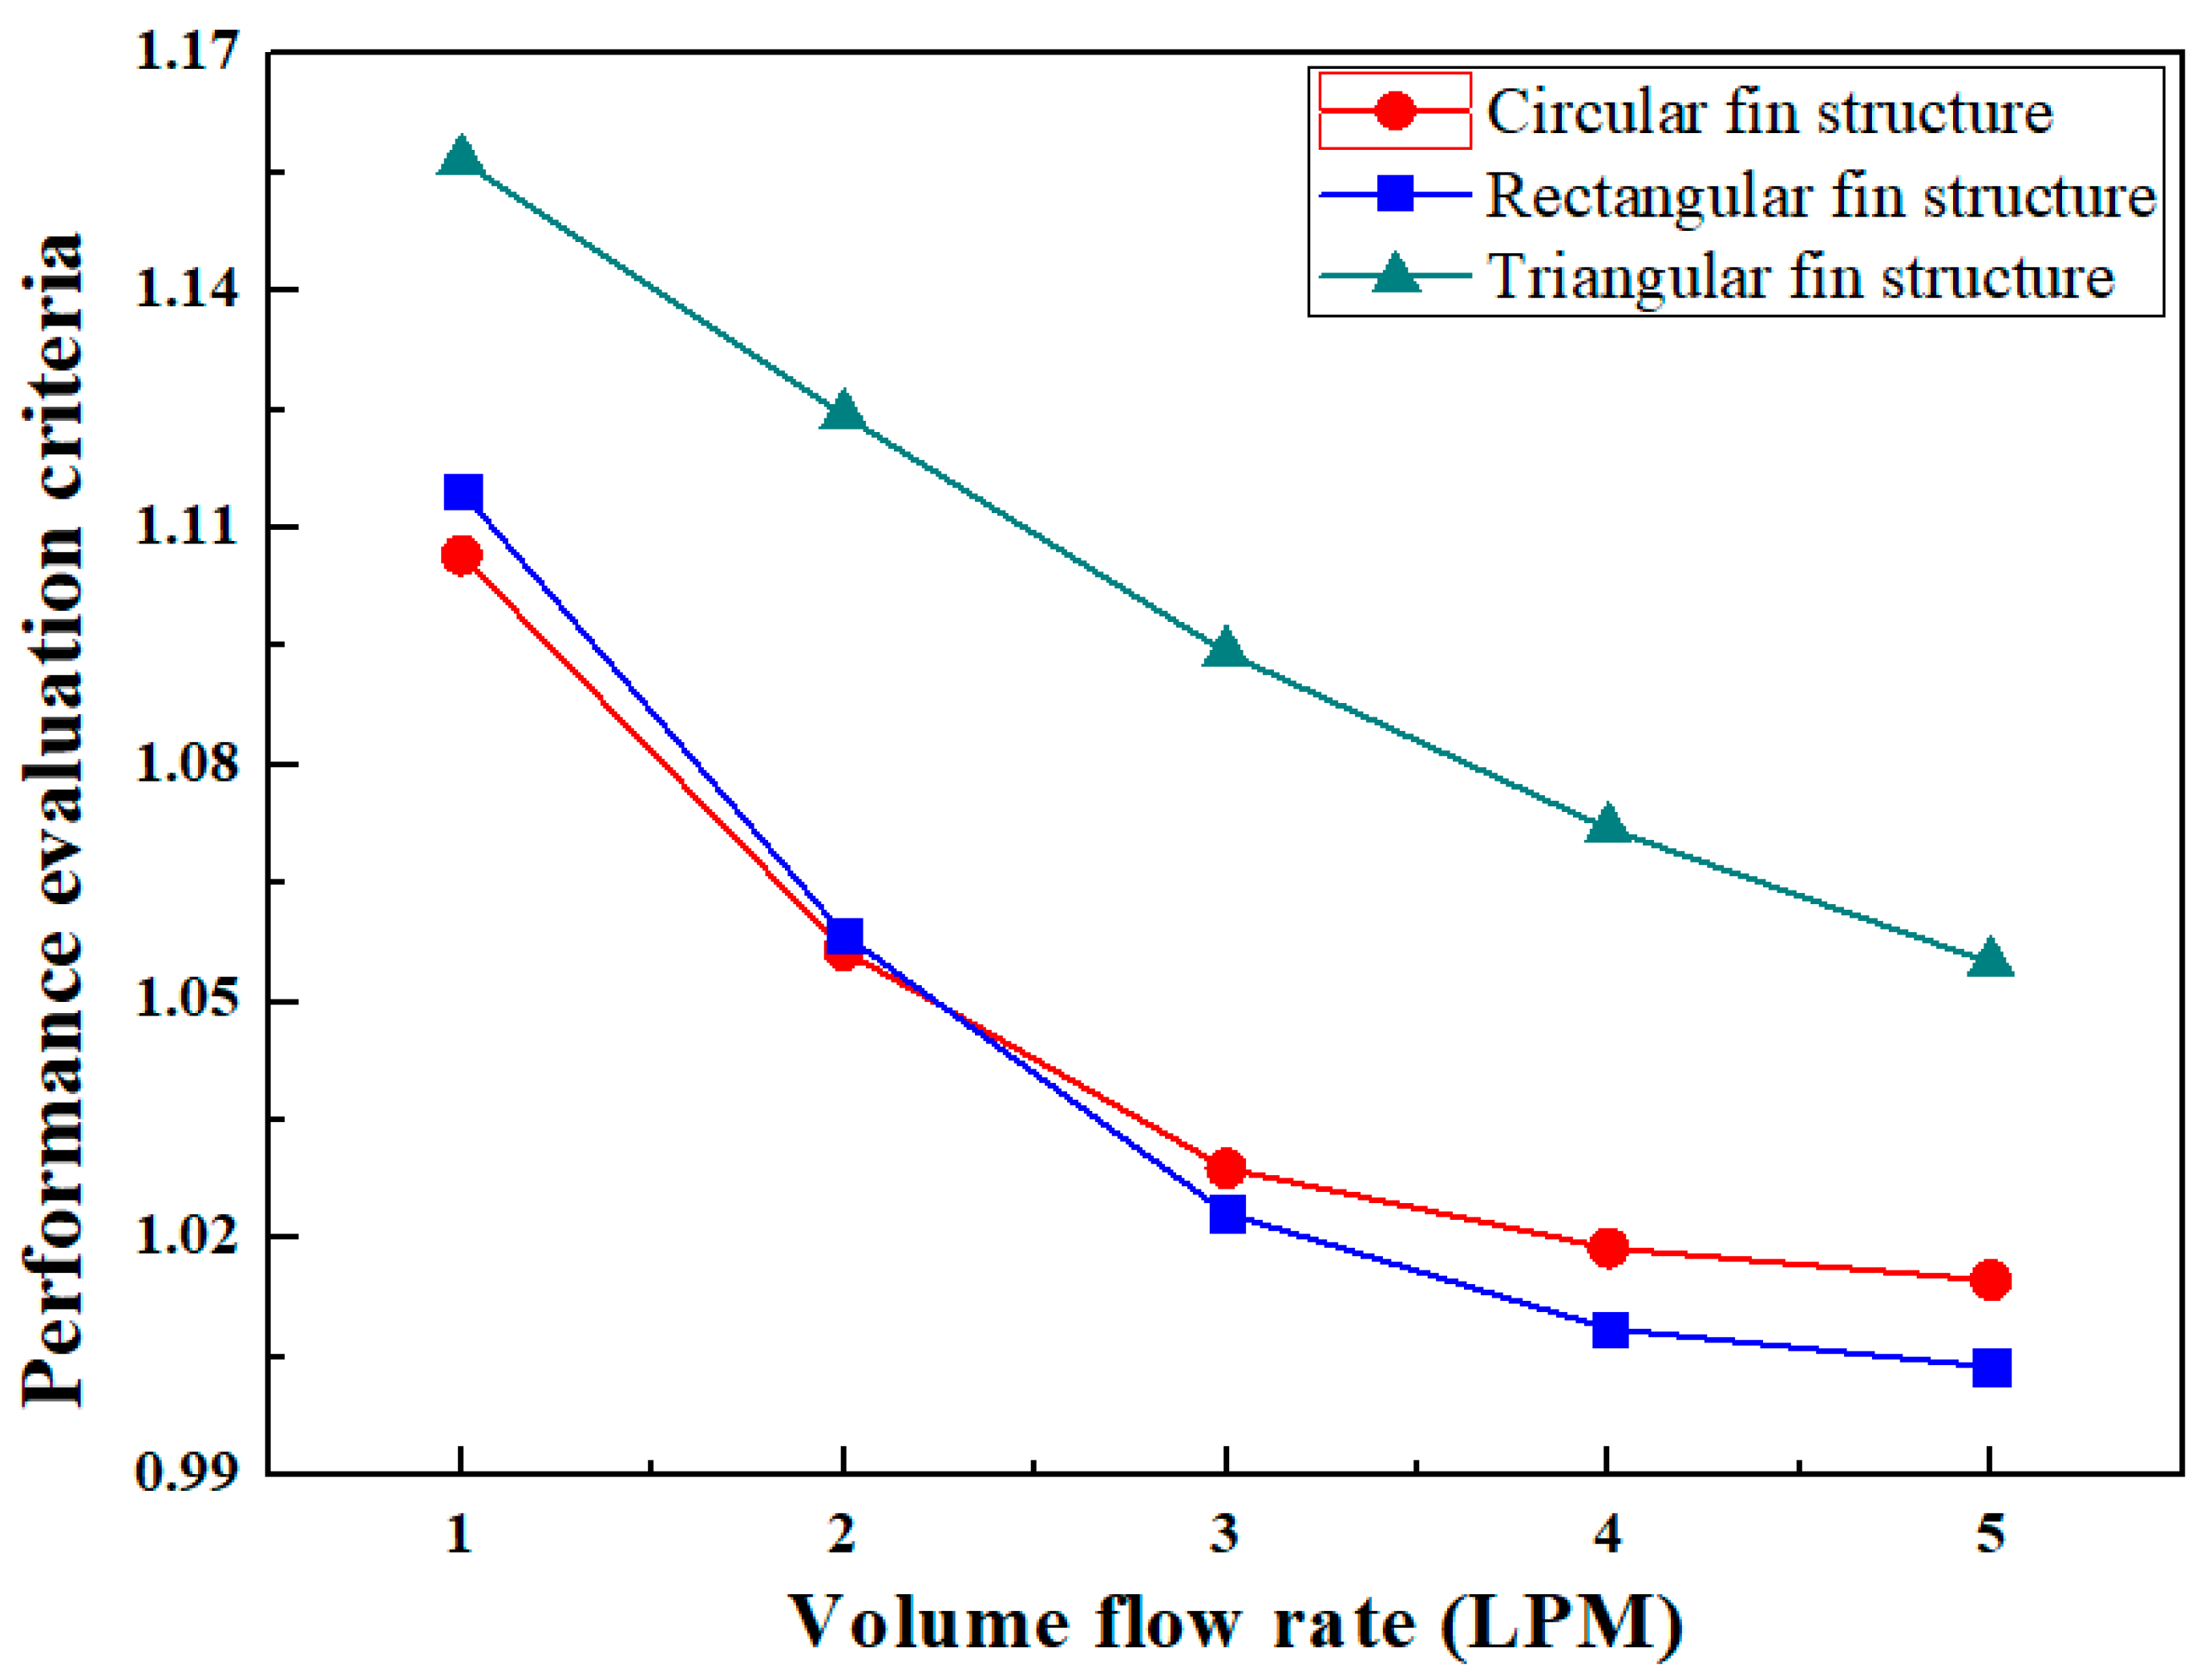
3.2.3. Performance Evaluation Criteria

The behavior of PEC with various volume flow rates and fin structures is presented in Figure 9. The Nusselt number and friction factor show trade-off relation hence, both parameters are integrated in terms of PEC in order to find the best combination for the optimum overall performance of battery pack with dielectric fluid immersion cooling. The Nusselt number increases and the friction factor decreases with increase in volume flow rate for all fin structures. The decrease in friction factor is dominant compared to increase in Nusselt number with increase in volume flow rate. Therefore, the PEC as the ratio of Nusselt number to friction factor decreases with increase in volume flow rate for all fin structures. Despite of the higher pressure drop and friction factor, the superior value of Nusselt number results in the maximum PEC for triangular fin structure at all volume flow rates. The lowest value of PEC is obtained for rectangular fin structure at the higher volume flow rate because of increase in pressure drop at the higher volume flow rate. The PEC of 1.157, 1.124, 1.094, 1.072 and 1.055 are evaluated for triangular fin structure at volume flow rates of 1 LPM, 2 LPM, 3 LPM, 4 LPM and 5 LPM, respectively.

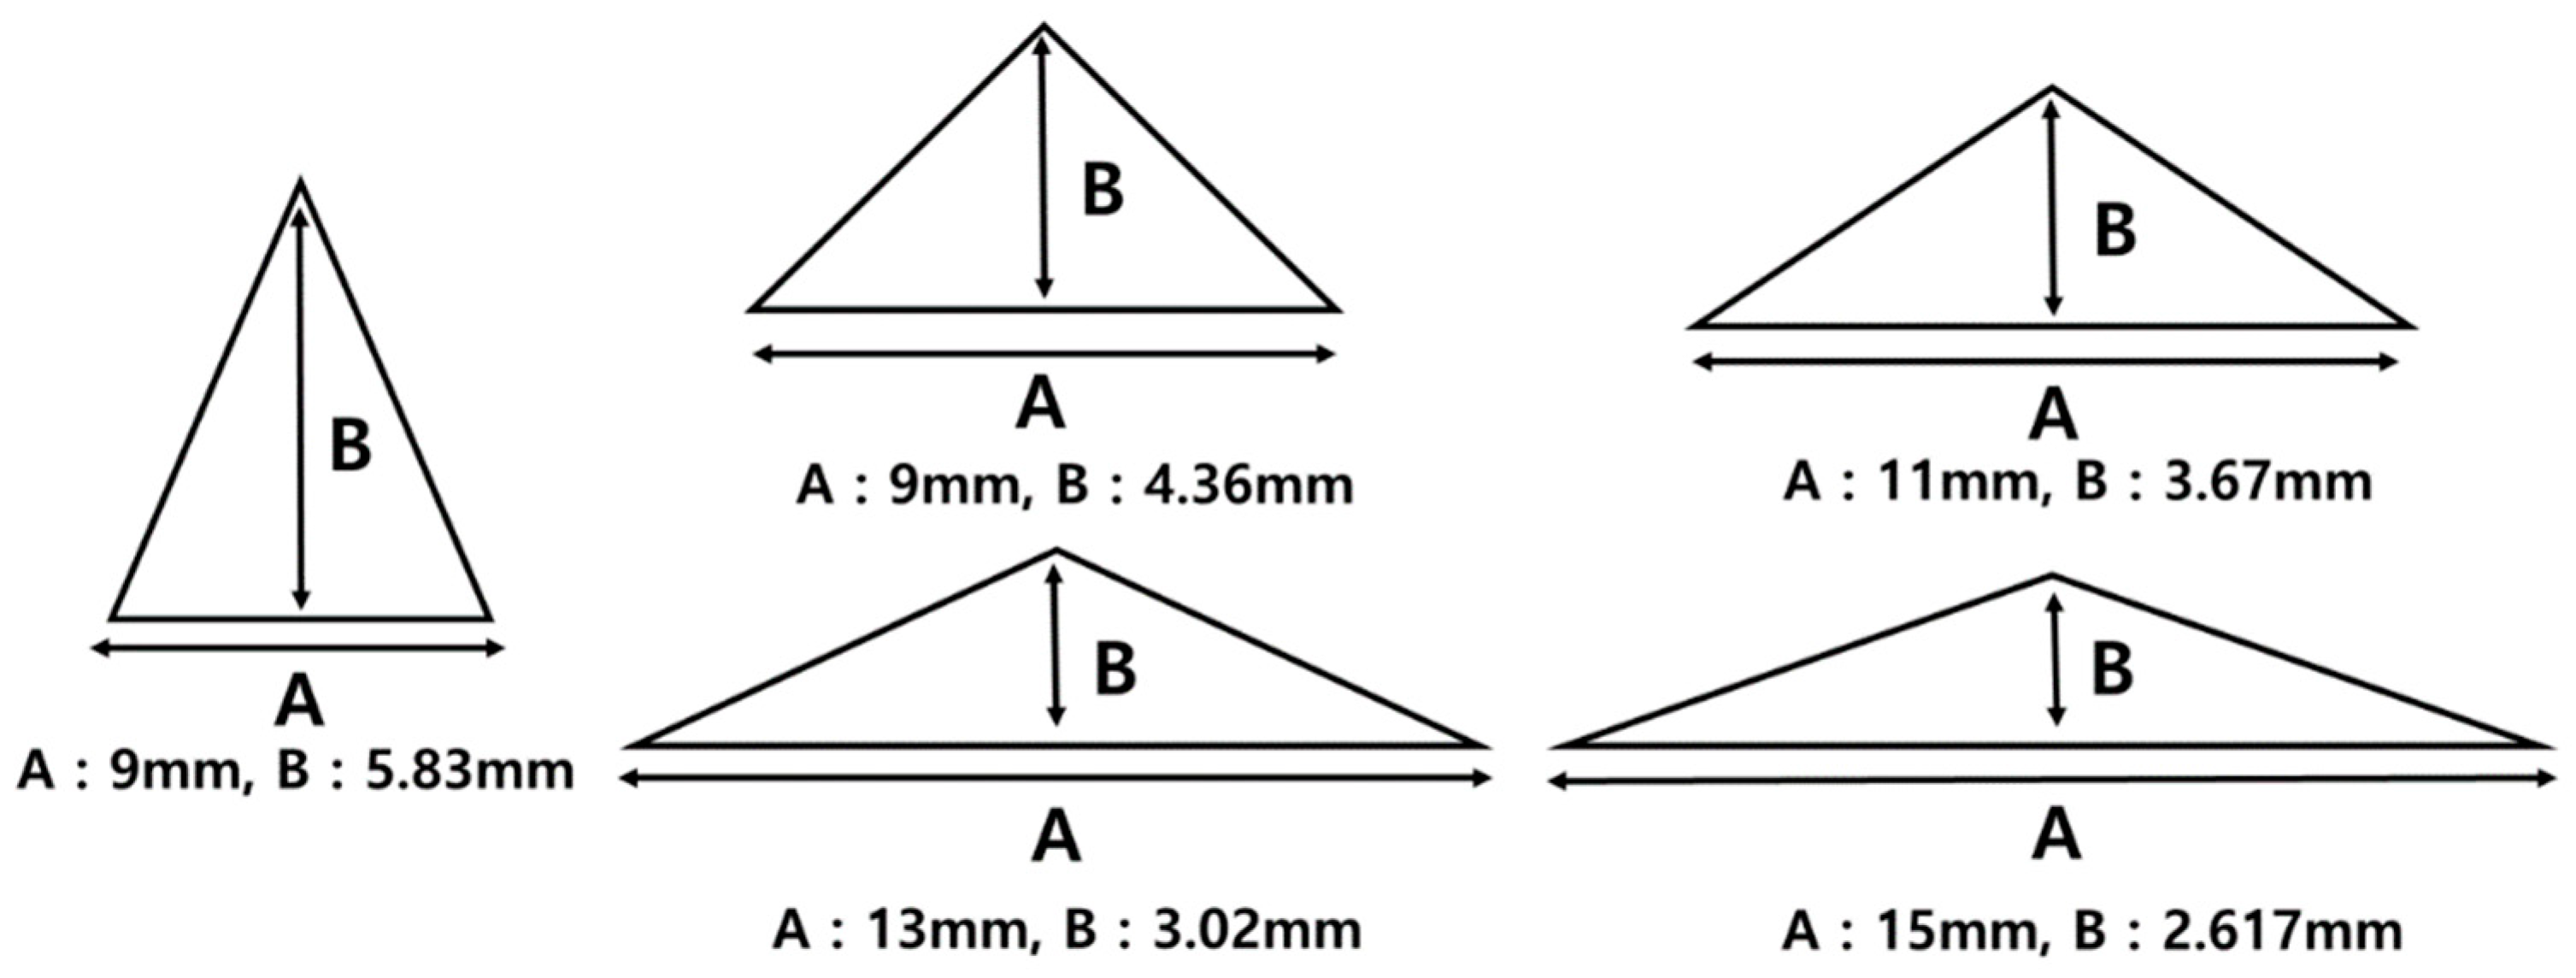
3.3. Effect of Fin Dimension

In the previous section, it is concluded that the triangular fin structure shows superior heat transfer characteristics for battery pack with dielectric fluid immersion cooling. Therefore, the triangular fin structure is recommended as the best fin structure to achieve the optimum cooling performance of dielectric fluid immersion cooling for battery pack. Furthermore, the base length and height of the triangular fin structure are varied in order to evaluate the influence of fin dimensions on heat transfer characteristics of battery pack with dielectric fluid immersion cooling. Figure 10 shows the various combinations of fin dimensions considered for triangular fin structure. In this section, the effect of fin dimensions of triangular fin structure on maximum temperature, temperature difference, average temperature, Nusselt number, pressure drop and PEC of battery pack with dielectric fluid immersion cooling are discussed.

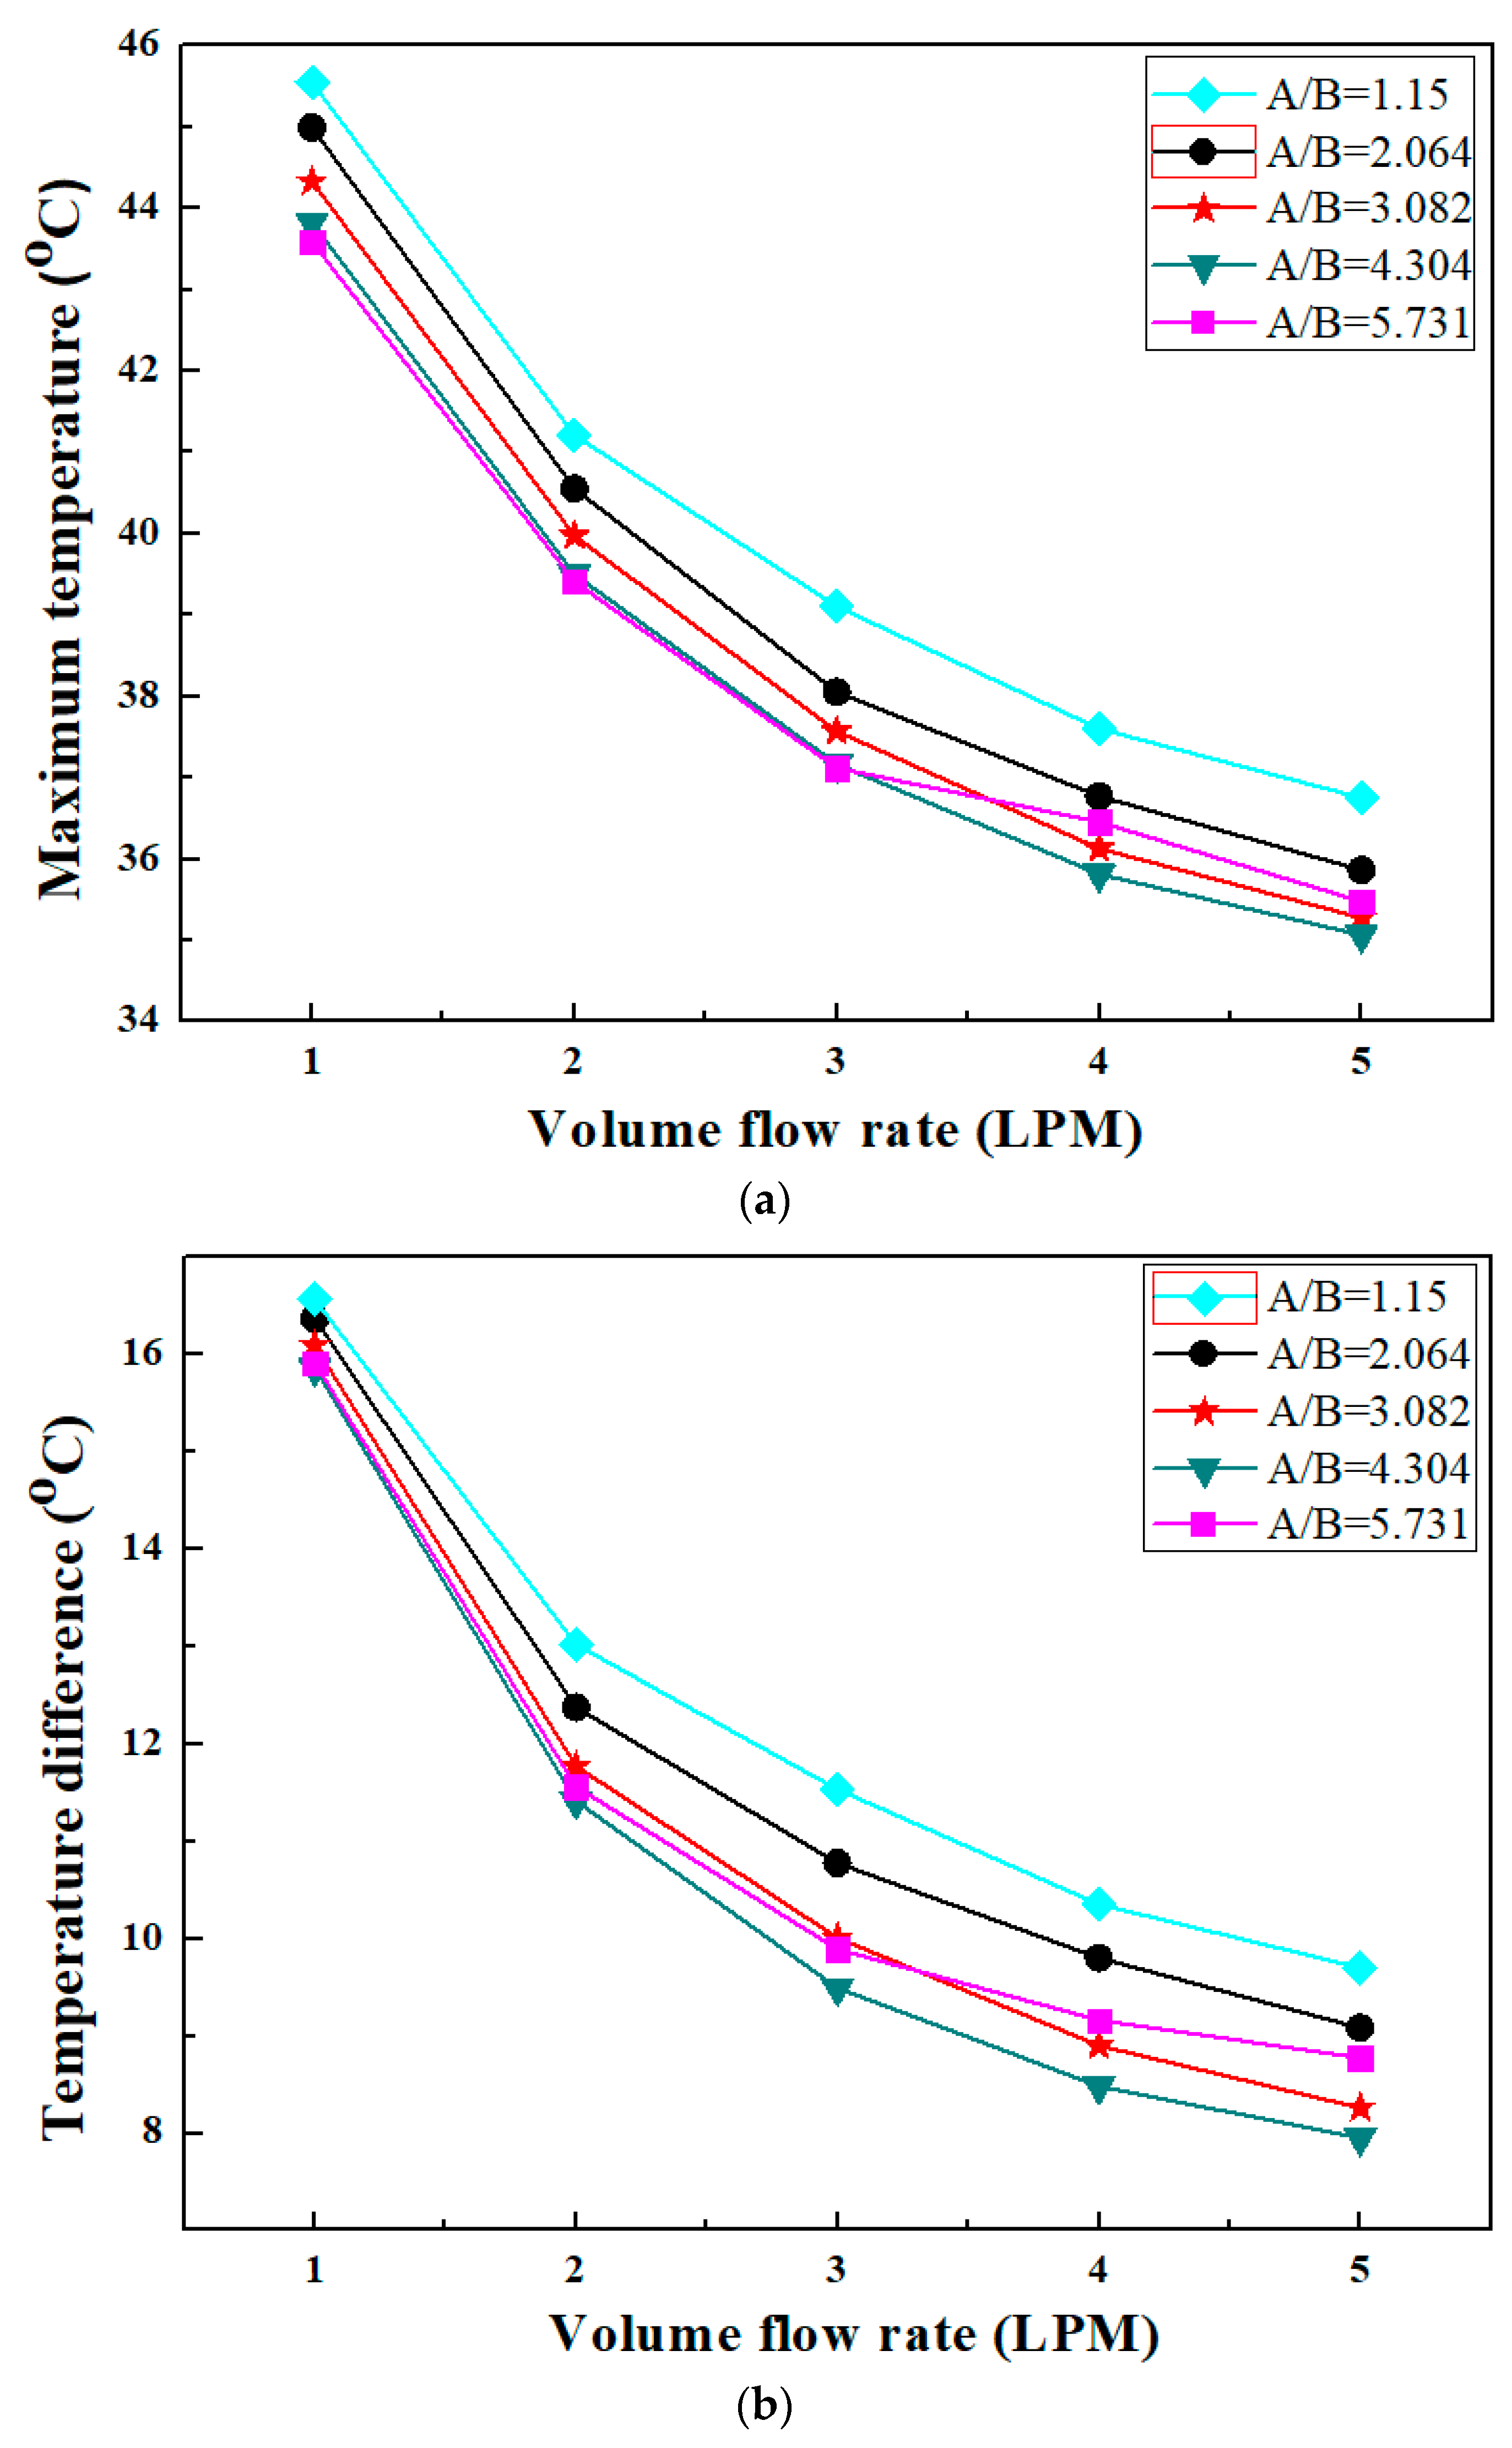
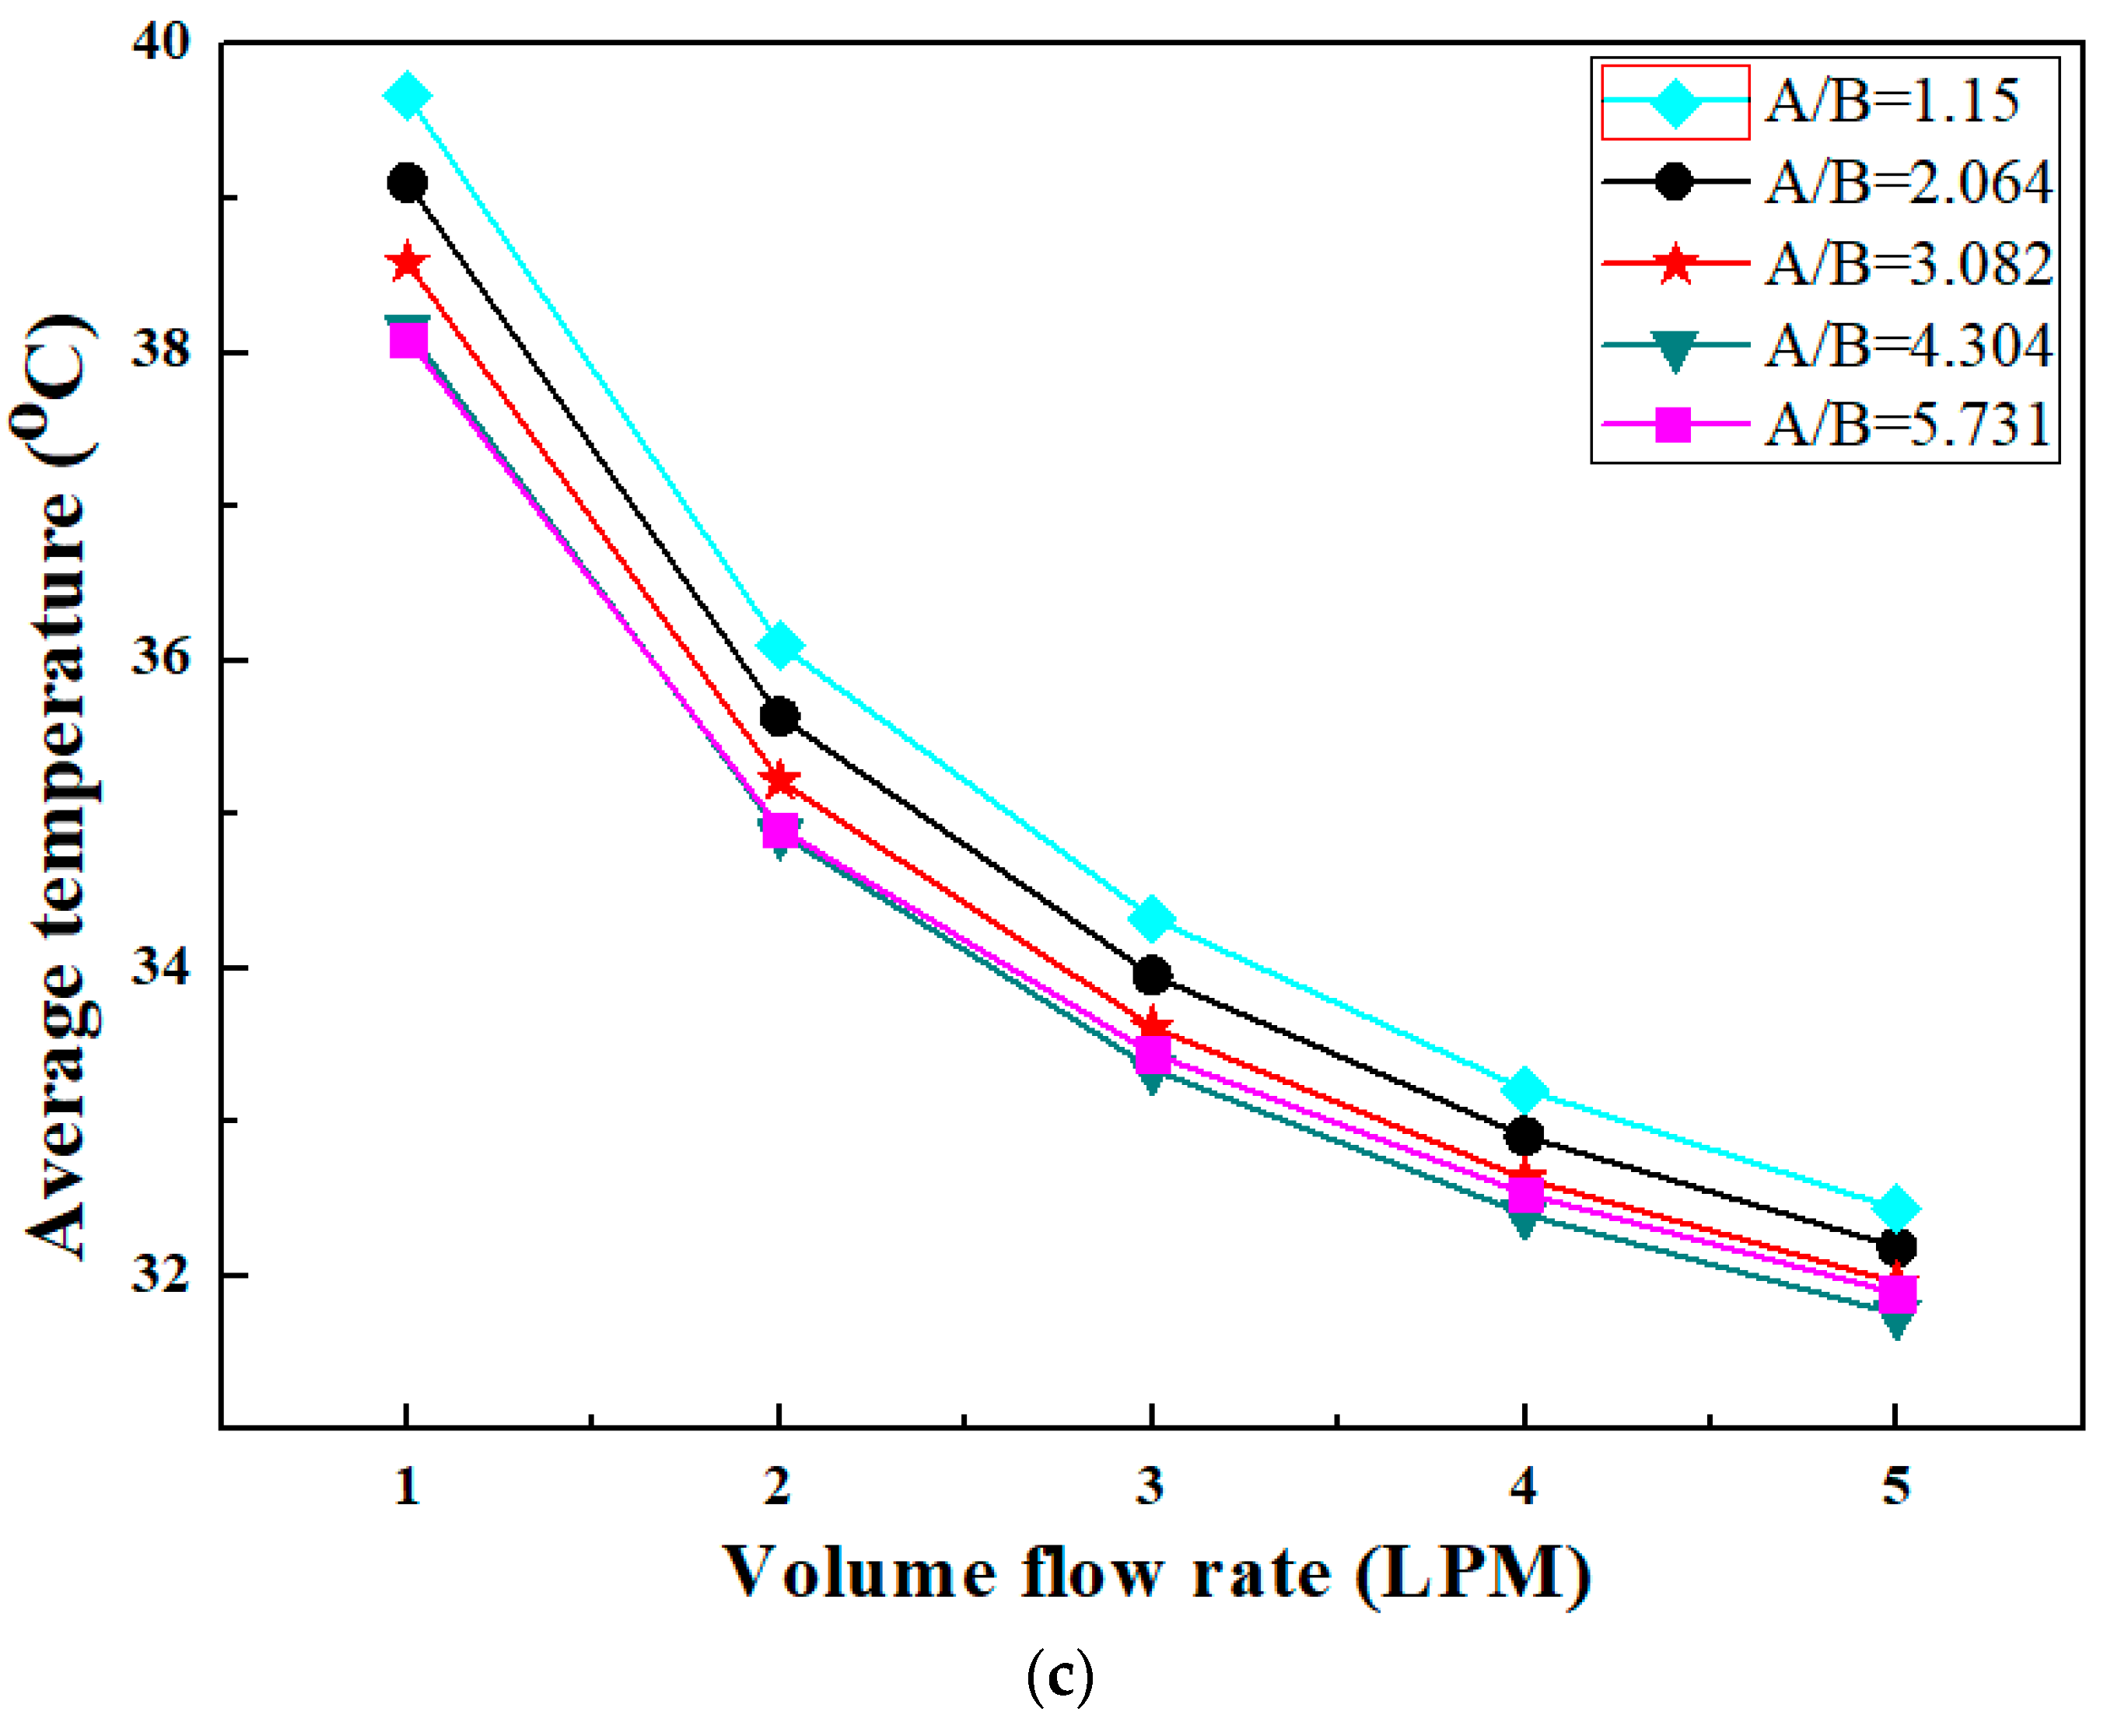
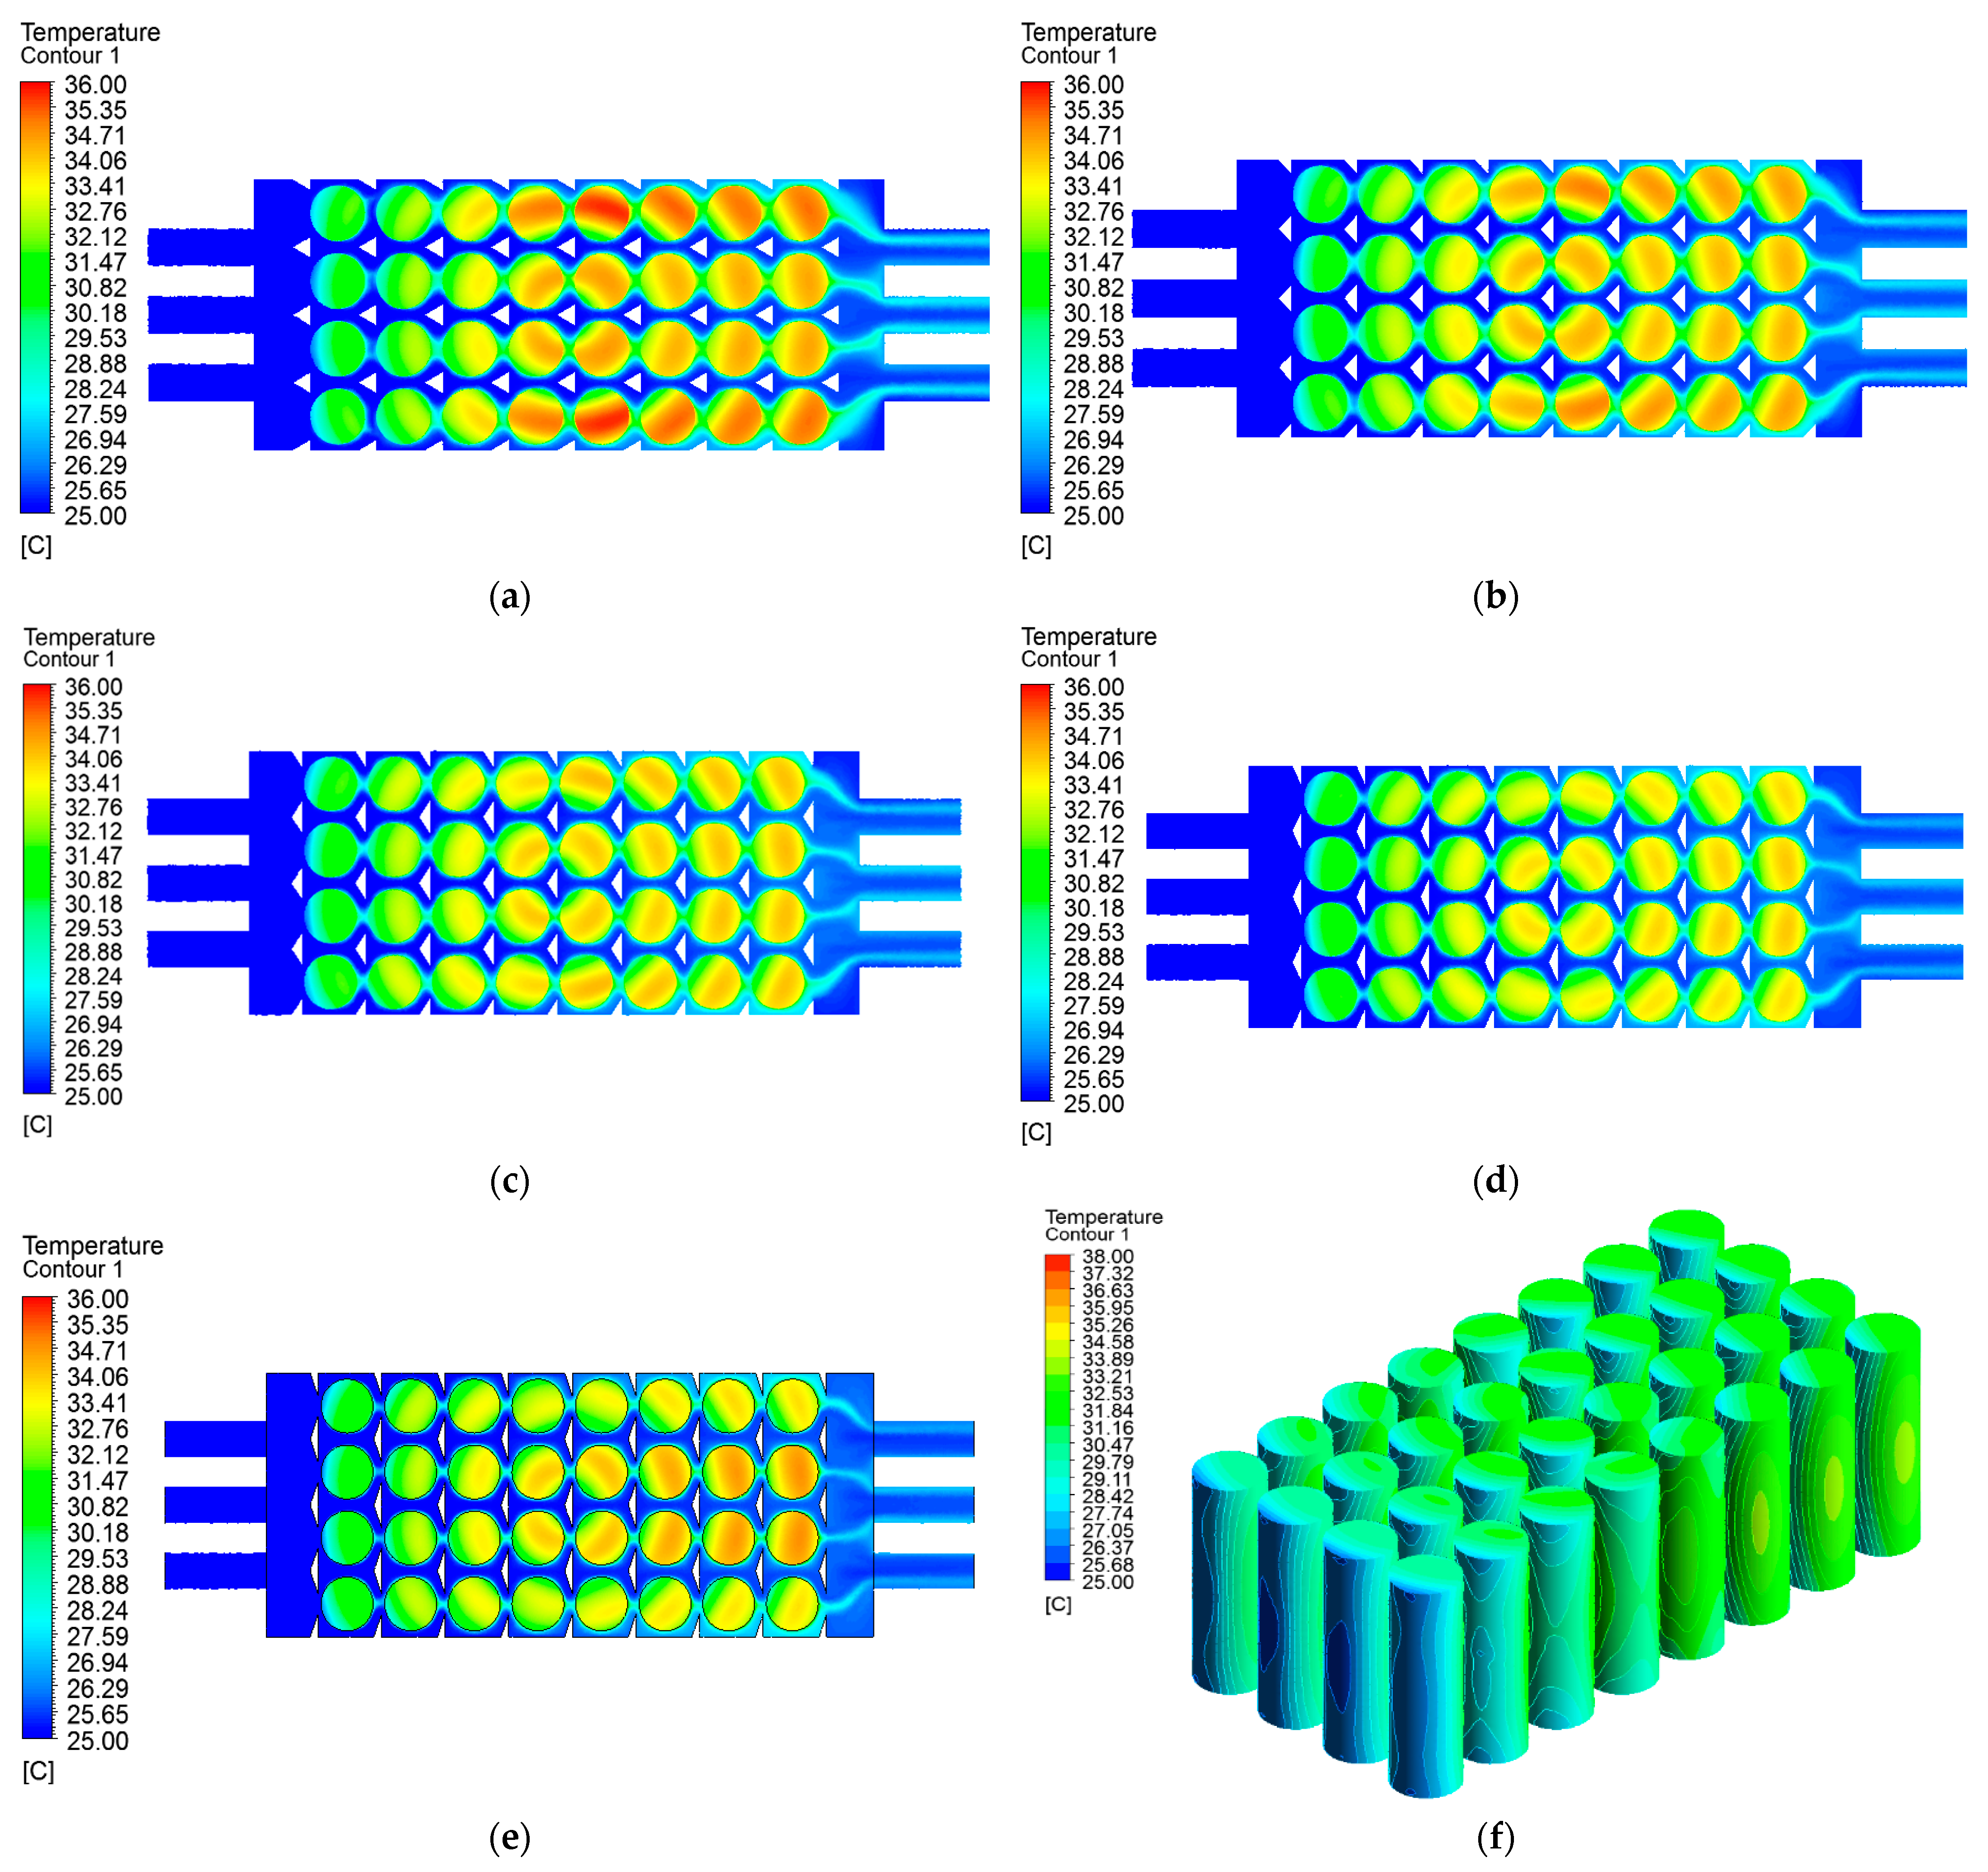
3.3.1. Temperature Performance

Figure 11a shows the variation of maximum temperature of battery pack with volume flow rate for various A/B ratios of triangular fin structure. In all cases, the increase in volume flow rate enhances the heat transfer rate from the battery pack. Hence, with an increase in volume flow rate, the maximum temperature of the battery pack decreases for all A/B ratios of triangular fin structure. The triangular fin structure with A/B ratio of 1.15 shows the highest values of maximum temperature over the entire range of volume flow rate. With the increase in A/B ratio, the maximum temperature decreases; however it is not valid for all volume flow rates because after a certain flow rate value, there exists a critical A/B ratio which shows the lowest maximum temperature. The lowest maximum temperatures of 43.59 °C, 39.41 °C, and 37.12 °C are reported for triangular fin structure with A/B ratio of 5.731 at volume flow rates of 1 LPM, 2 LPM, and 3 LPM, respectively. Whereas, at the higher volume flow rates of 4 LPM and 5 LPM, the lowest maximum temperature is reported for triangular fin structure with A/B ratio of 4.304 which are 35.82 °C and 35.07 °C, respectively.
Figure 11b shows the effect of triangular fin structure with various A/B ratios on temperature difference of battery pack. The temperature difference also decreases with increase in volume flow rate because of an increase in the heat removal rate from the battery pack with rise in volume flow rate. The triangular fin structure with A/B ratio of 1.15 depicts the higher temperature difference owing to the higher maximum temperature. Unlike maximum temperature, the lowest temperature difference is observed for triangular fin structure with A/B ratio of 4.304 at all volume flow rates. The A/B ratio of 4.304 is observed as a critical point such that the A/B ratio above or below this value shows an increase in temperature difference for all volume flow rates. The highest temperature differences of 16.57 °C, 13.02 °C, 11.54 °C, 10.35 °C and 9.7 °C are evaluated for A/B ratio of 1.15 at volume flow rates of 1 LPM to 5 LPM, respectively. The lowest temperature differences of 15.86 °C, 11.42 °C, 9.49 °C, 8.48 °C and 7.95 °C are evaluated for A/B ratio of 4.304 at volume flow rates of 1 LPM, 2 LPM, 3 LPM, 4 LPM and 5 LPM, respectively.
The variation of average temperature of the battery pack with volume flow rate for different A/B ratios of triangular fin structure is shown in Figure 11c. The average temperature of battery pack also decreases with increase in volume flow rate. Except the lower flow rate of 1 LPM, the triangular fin structure with A/B ratio of 4.304 depicts the lowest values of average temperature. For other volume flow rates ranging from 2 LPM to 5 LPM, with increase or decrease in A/B ratio beyond the value of 4.304, the average temperature increases. The highest average temperatures of 39.67 °C, 36.10 °C, 34.33 °C, 33.21 °C and 32.43 °C are observed for triangular fin structure with A/B ratio of 1.15 at volume flow rates of 1 LPM to 5 LPM, respectively. At 1 LPM volume flow rate, the lowest average temperature of 38.09 °C is observed for triangular fin structure with A/B ratio of 5.731. However, at volume flow rates of 2 LPM to 5 LPM, the lowest average temperatures of 34.88 °C, 33.35 °C, 32.40 °C and 31.76 °C are evaluated for triangular fin structure with A/B ratio of 4.304.
The temperature distribution for triangular fin structure with various ratios of A/B is shown in Figure 12. The original triangular fin structure with A/B ratio of 1.15 is considered as reference with which other combinations are compared. From the figure, it can be observed that the triangular fin structure with A/B ratio of 1.15 shows the higher temperature regions of the battery pack. However, the lowest maximum temperature regions are noticed for triangular fin structure with A/B ratio of 4.304 followed by increasing maximum temperature regions for triangular fin structure with A/B ratios of 3.082, 5.731 and 2.064, respectively.

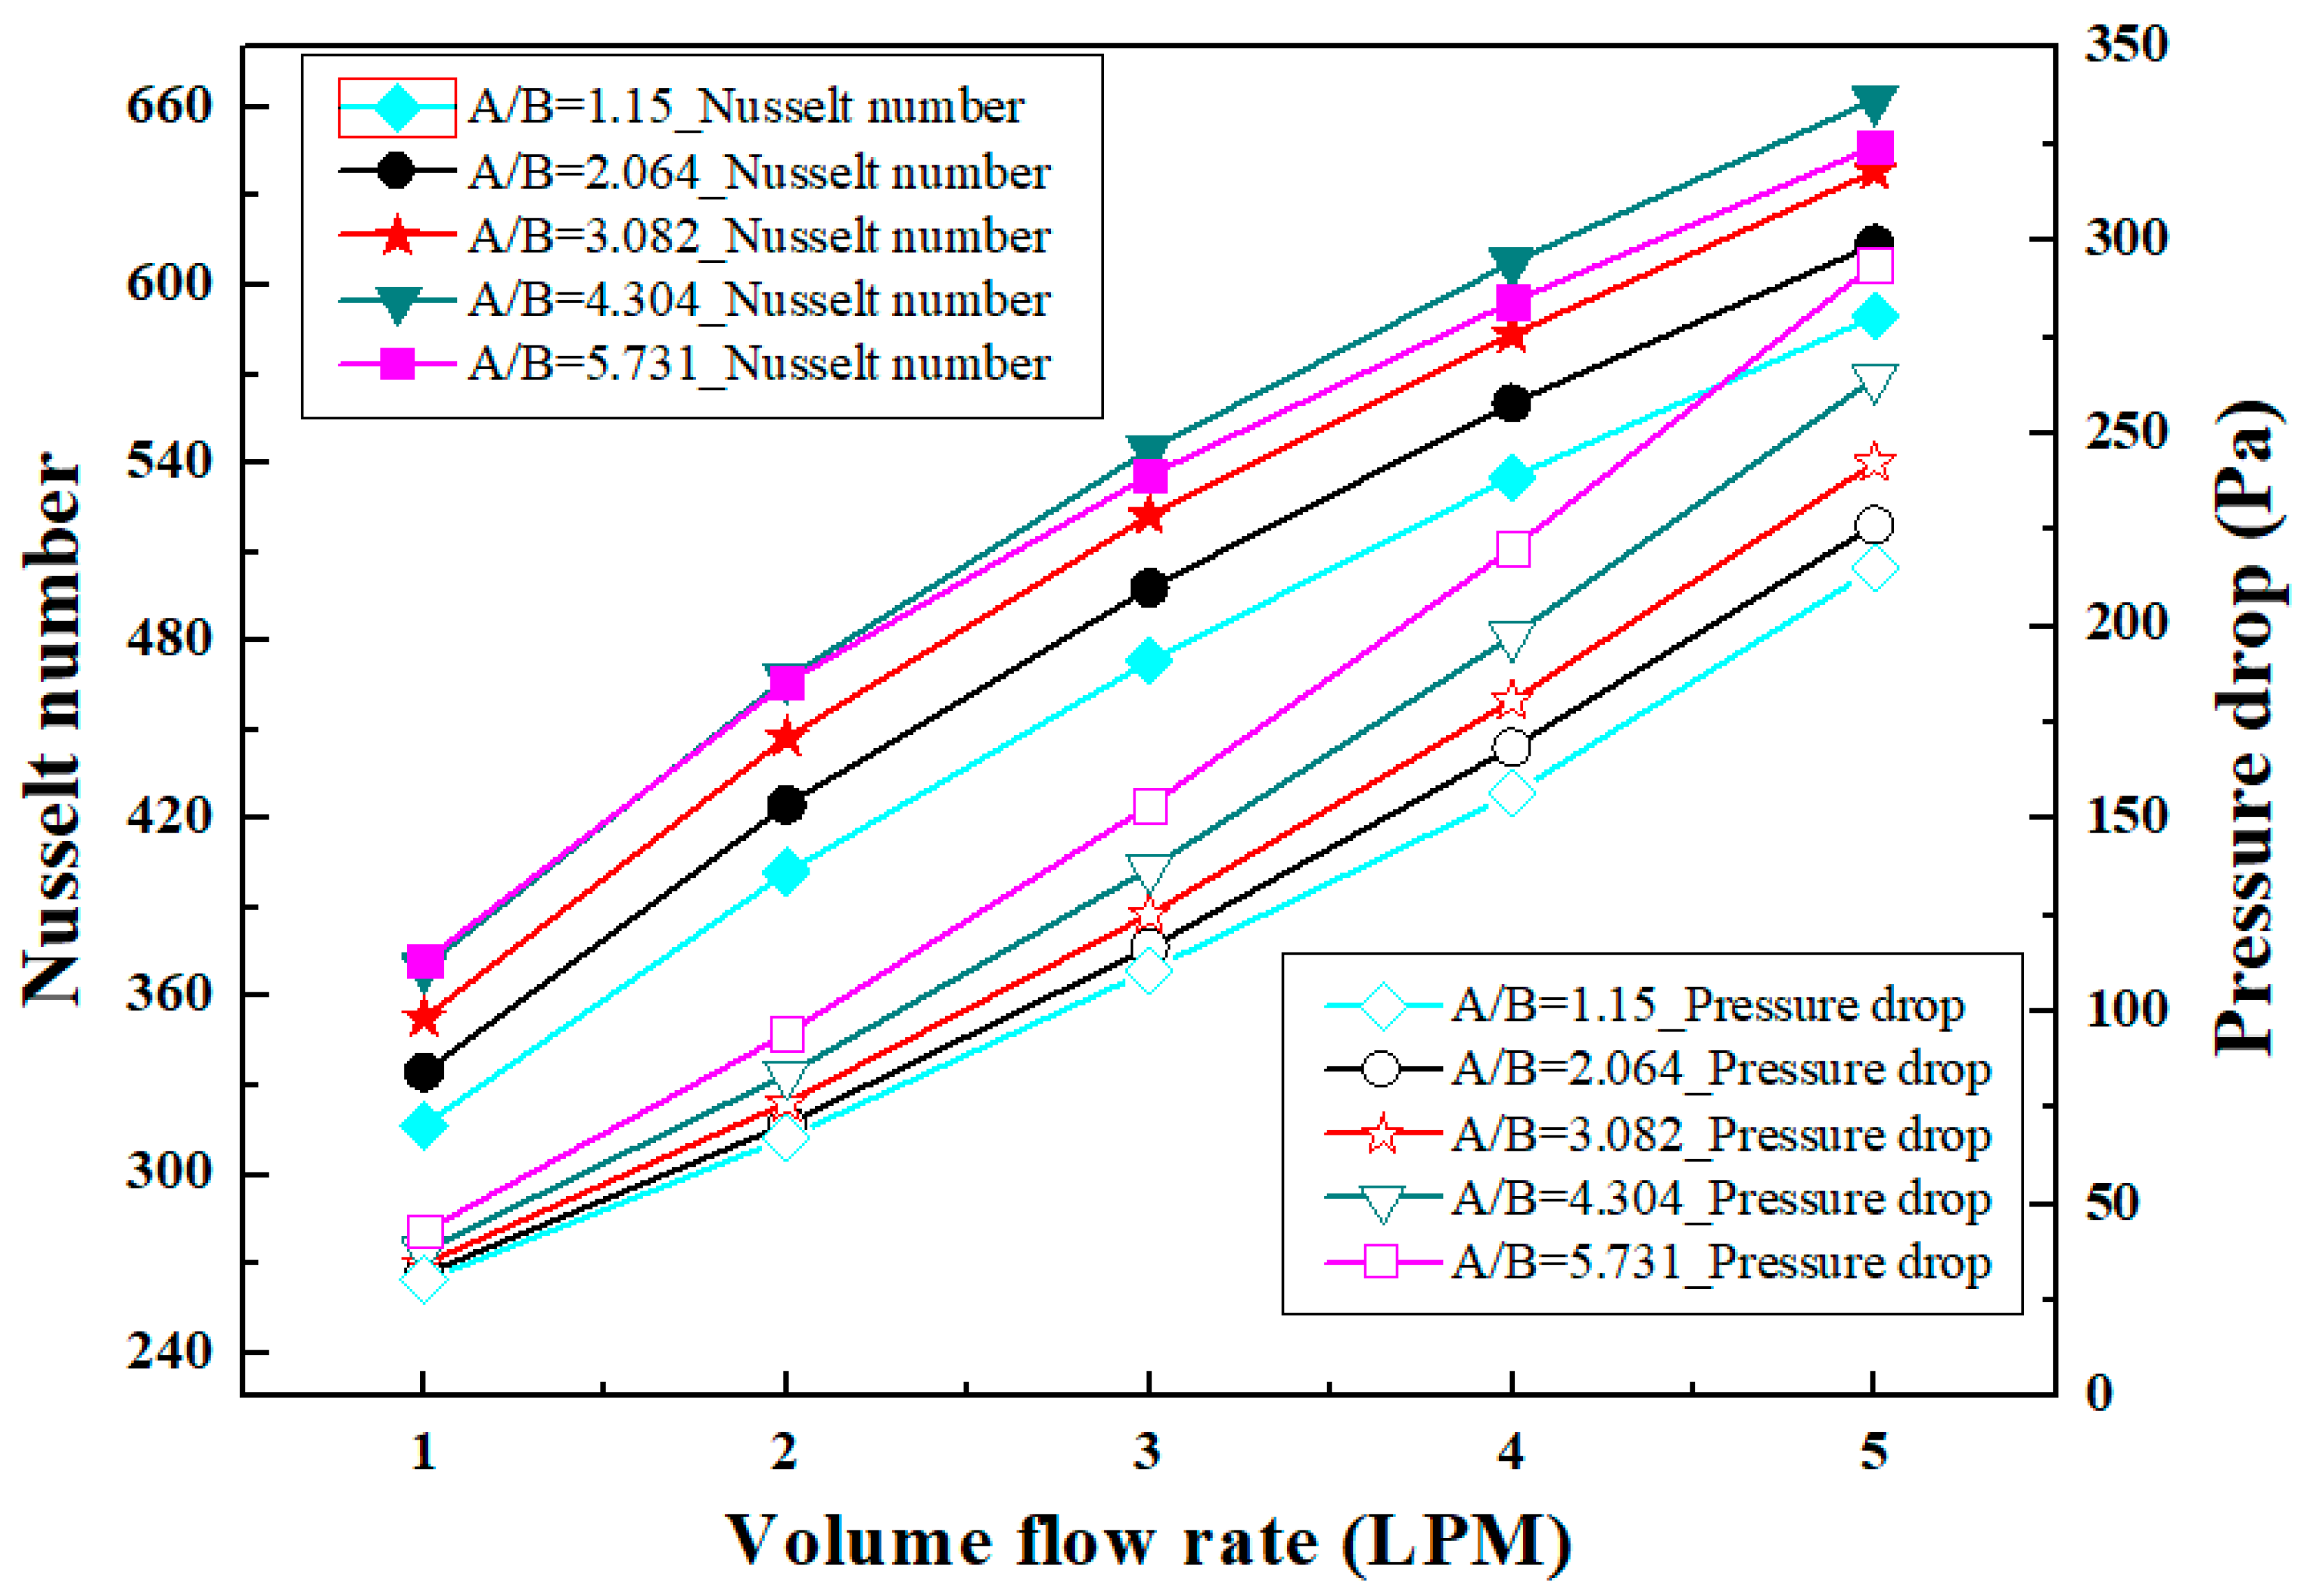
3.3.2. Nusselt Number and Pressure Drop

Figure 13 presents the variation in Nusselt number and pressure drop with change in volume flow rate for various A/B ratios of triangular fin structure. The decrease in maximum temperature and average temperature of battery pack with volume flow rate indicates that the higher amount of heat is transferred to working fluid with an increase in volume flow rate. Therefore, the heat transfer coefficient increases with increases in volume flow rate which results in the higher Nusselt number at the higher volume flow rate. The average temperature of battery pack has significant impact on Nusselt number hence, the Nusselt number follows the same trend as of average temperature. The triangular fin structure with A/B ratio of 4.304 shows maximum values of Nusselt number at all volume flow rates except at the lower volume flow rate of 1 LPM. The maximum Nusselt numbers of 467.54, 544.52, 607.72 and 662.50 are evaluated at volume flow rates of 2 LPM, 3 LPM, 4 LPM and 5 LPM, respectively for triangular fin structure with A/B ratio of 4.304. At a volume flow rate of 1 LPM, the triangular fin structure with A/B ratio of 5.731 shows maximum Nusselt number of 372.15.
The increase in volume flow rate increases the disturbance in working fluid which results into increase in pressure drop. The triangular fin structure with A/B ratio of 1.15 shows the lowest pressure drop at all volume flow rates because of less obstruction to the flow of working fluid compared to other fin structures. At each volume flow rate, the pressure drop increases with increase in A/B ratio owing to the larger obstruction at the larger value of A/B ratio. The lowest pressure drops of 30.28 Pa, 67.29 Pa, 110.77 Pa, 156.38 Pa and 214.99 Pa are observed for triangular fin structure with A/B ratio of 1.15 at volume flow rates of 1 LPM, 2 LPM, 3 LPM, 4 LPM and 5 LPM, respectively. The maximum pressure drops of 43.04 Pa, 94.25 Pa, 153.47 Pa, 220.13 Pa and 293.91 Pa are reported for triangular fin structure with A/B ratio of 5.731 at volume flow rates of 1 LPM, 2 LPM, 3 LPM, 4 LPM and 5 LPM, respectively. However, the triangular fin structure with A/B ratio of 4.304 shows the pressure drops of 38.05 Pa, 83.81 Pa, 137.06 Pa, 197.39 Pa and 264.33 Pa at volume flow rates of 1 LPM, 2 LPM, 3 LPM, 4 LPM and 5 LPM, respectively which all are lower than maximum pressure drop.

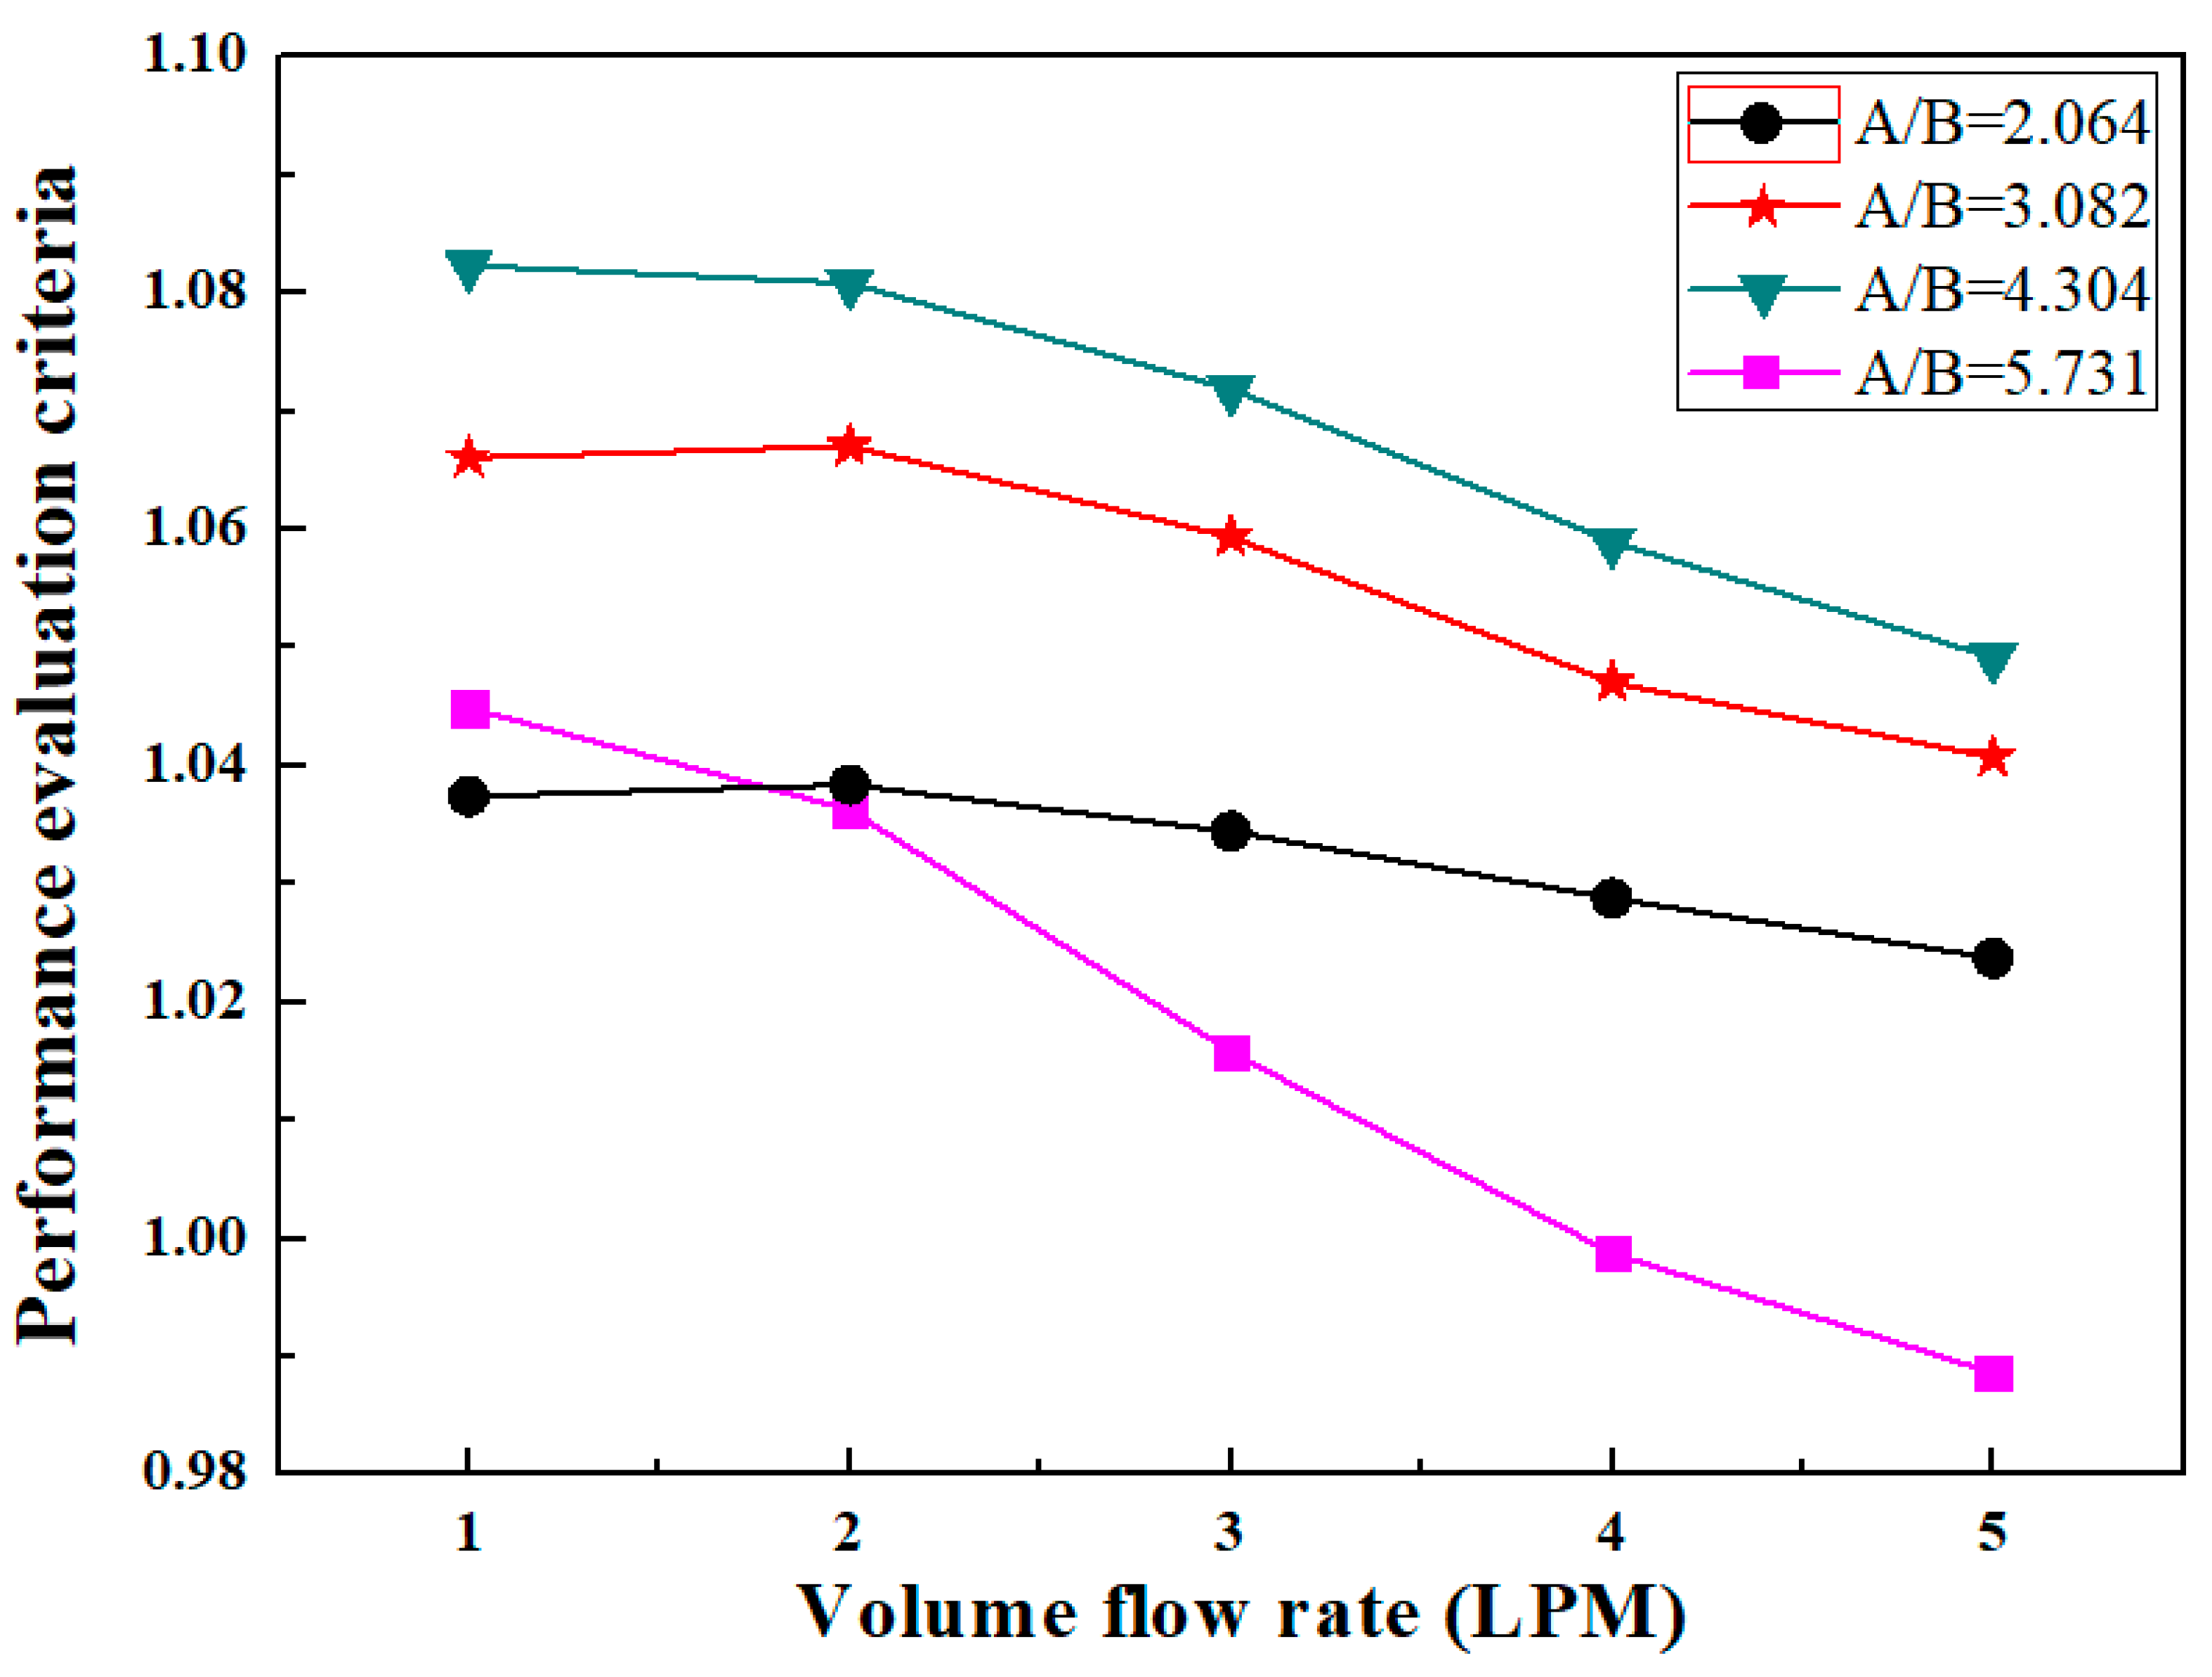
3.3.3. Performance Evaluation Criteria

The variation of PEC with volume flow rate for different A/B ratios of triangular structure is presented in Figure 14. The PEC for triangular fin structure with various A/B ratios is calculated with reference to triangular fin structure with A/B ratio of 1.15. The Nusselt number increases with increase in volume flow rate; however, the friction factor also increases with increase in volume flow rate. The dominance of increase in friction factor is significant over the increase of Nusselt number for increase in volume flow rate. Therefore, in the case of triangular fin structure with all A/B ratios, the PEC decreases with increase in volume flow rate. The triangular fin structure with A/B ratio of 4.304 shows maximum values of PEC for all volume flow rates. The higher pressure drops result in higher values of friction factor; hence, triangular fin structure with A/B ratio of 5.731 shows minimum values of PEC at all volume flow rates. The maximum PEC values of 1.082, 1.081, 1.072, 1.059 and 1.049 are evaluated at volume flow rates of 1 LPM, 2 LPM, 3 LPM, 4 LPM and 5 LPM, respectively for triangular fin structure with A/B ratio of 4.304.
The comparison of present results with results from the literature for battery immersion cooling is depicted in Table 5. Dubey et al. have proposed battery maximum temperature of 44 °C at a 2C discharge rate for immersion cooling. The reason for the higher maximum temperature of the battery pack is low -temperature uniformity in case of immersion cooling because of the non-uniform distribution of coolant around the battery pack [22]. In the present case, the lowest maximum temperature of the battery pack is achieved as 35.07 °C for immersion cooling with the best fin structure and dimensions.
In the present work, optimum fin structure and fin dimensions are suggested to achieve the enhanced thermal performance of dielectric fluid immersion cooling for effective thermal management of high energy density lithium-ion batteries in electric vehicles. The electrical performance of the battery is affected by the thermal performance; hence, in future work, the focus will be on investigating the combined thermal and electrical performance characteristics of lithium-ion battery with dielectric fluid immersion cooling. The coupled numerical analysis will be conducted in the future to study the overall behavior of lithium-ion battery pack with dielectric fluid immersion cooling under actual operating conditions for electric vehicles.

4. Conclusions

The heat transfer characteristics of a cylindrical battery pack with dielectric fluid immersion cooling are numerically studied, considering various fin structures and dimensions. The maximum temperature, temperature difference, average temperature, Nusselt number, pressure drop and PEC are evaluated for base structure, circular, rectangular and triangular fin structures under the influence of various volume flow rates. The following key findings are summarized from the present work.
(a)
The maximum temperature, temperature difference and average temperature of the battery pack are lower for the triangular fin structure at each volume flow rate. The lowest maximum temperature of the battery pack is evaluated as 45.55 °C, 41.21 °C, 38.11 °C, 36.61 °C and 36.76 °C for triangular fin structure at volume flow rates of 1 LPM, 2 LPM, 3 LPM, 4 LPM and 5 LPM, respectively.
(b)
The triangular fin structure shows higher values of Nusselt number and pressure drop compared to other fin structures. The maximum Nusselt number of 589.41 and pressure drop of 241.98 Pa are evaluated for triangular fin structure at a volume flow rate of 5 LPM.
(c)
The PEC as the combined effect of Nusselt number and pressure drop is maximum for triangular fin structure at all volume flow rates. The triangular fin structure shows maximum PEC values of 1.156, 1.124, 1.094, 1.072 and 1.055 at volume flow rates of 1 LPM, 2 LPM, 3 LPM, 4 LPM and 5 LPM, respectively.
(d)
The triangular fin structure is recommended as the best fin structure to achieve the superior heat transfer characteristics of battery packs with dielectric fluid immersion cooling.
(e)
The triangular fin structure with an A/B ratio of 4.304 shows the lowest values of maximum temperature, temperature difference and average temperature as 35.07 °C, 7.95 °C and 31.76 °C, respectively, at 5 LPM volume flow rate.
(f)
The maximum Nusselt number of 662.50 is evaluated for triangular fin structure with an A/B ratio of 4.304 with a pressure drop of 264.33 Pa, which is lower than the maximum pressure drop of 293.91 Pa for triangular fin structure with an A/B ratio of 5.731 at 5 LPM volume flow rate.
(g)
The triangular fin structure with an A/B ratio of 4.304 shows maximum PEC at all volume flow rates from 1 LPM to 5 LPM with corresponding values of 1.082, 1.081, 1.072, 1.059 and 1.049. The A/B ratio of 4.304 is suggested as the optimum dimensions for triangular fin structure as it shows the enhanced heat transfer characteristics of battery pack with dielectric fluid immersion cooling.

Author Contributions

Conceptualization, J.-W.H., K.S.G. and M.-Y.L.; methodology, J.-W.H. and K.S.G.; formal analysis, J.-W.H.; investigation, J.-W.H., K.S.G. and E.-H.K.; resources, J.-W.H., K.S.G. and M.-Y.L.; data curation, J.-W.H. and K.S.G.; validation, J.-W.H. and K.S.G.; software, J.-W.H. and K.S.G.; writing—original draft preparation, J.-W.H., K.S.G. and M.-Y.L.; writing—review and editing, J.-W.H., K.S.G. and M.-Y.L.; visualization, J.-W.H., K.S.G. and E.-H.K.; supervision, M.-Y.L.; project administration, M.-Y.L.; funding acquisition, M.-Y.L. All authors have read and agreed to the published version of the manuscript.

Funding

This work was supported by the Dong-A University research fund.

Institutional Review Board Statement

Not applicable.

Informed Consent Statement

Not applicable.

Data Availability Statement

The data presented in this study will be available on request to the corresponding author.

Conflicts of Interest

The authors declare no conflict of interest.

References

  1. Qureshi, F.; Yusuf, M.; Pasha, A.A.; Khan, H.W.; Imteyaz, B.; Irshad, K. Sustainable and energy efficient hydrogen production via glycerol reforming techniques: A review. Int. J. Hydrogen Energy 2022, 47, 41397–41420. [Google Scholar] [CrossRef]
  2. Ali, A.; Al-Sulaiman, F.A.; Al-Duais, I.N.; Irshad, K.; Malik, M.Z.; Shafiullah, M.; Zahir, M.H.; Ali, H.M.; Malik, S.A. Renewable portfolio standard development assessment in the Kingdom of Saudi Arabia from the perspective of policy networks theory. Processes 2021, 9, 1123. [Google Scholar]
  3. Liu, H.; Wei, Z.; He, W.; Zhao, J. Thermal issues about Li-ion batteries and recent progress in battery thermal management systems: A review. Energy Convers. Manag. 2017, 150, 304–330. [Google Scholar] [CrossRef]
  4. Patil, M.S.; Panchal, S.; Kim, N.; Lee, M.Y. Cooling performance characteristics of 20 Ah lithium-ion pouch cell with cold plates along both surfaces. Energies 2018, 11, 2550. [Google Scholar] [CrossRef] [Green Version]
  5. Liu, H.; Xiao, Q.; Jin, Y.; Mu, Y.; Meng, J.; Zhang, T.; Jia, H.; Teodorescu, R. Improved LightGBM-Based Framework for Electric Vehicle Lithium-Ion Battery Remaining Useful Life Prediction Using Multi Health Indicators. Symmetry 2022, 14, 1584. [Google Scholar] [CrossRef]
  6. Lu, L.; Han, X.; Li, J.; Hua, J.; Ouyang, M. A review on the key issues for lithium-ion battery management in electric vehicles. J. Power Sources 2013, 226, 272–288. [Google Scholar] [CrossRef]
  7. Lee, M.Y.; Kim, N.; Seo, J.H.; Patil, M.S. Thermal abuse behavior of the LIR2450 micro coin cell battery having capacity of 120 mAh with internal short circuit by penetrating element. Symmetry 2020, 12, 246. [Google Scholar] [CrossRef] [Green Version]
  8. Zhang, X.; Li, Z.; Luo, L.; Fan, Y.; Du, Z. A review on thermal management of lithium-ion batteries for electric vehicles. Energy 2022, 238, 121652. [Google Scholar] [CrossRef]
  9. Jiaqiang, E.; Yi, F.; Li, W.; Zhang, B.; Zuo, H.; Wei, K.; Zhu, H.; Deng, Y. Effect analysis on heat dissipation performance enhancement of a lithium-ion-battery pack with heat pipe for central and southern regions in China. Energy 2021, 226, 120336. [Google Scholar]
  10. Liu, Z.; Huang, J.; Cao, M.; Jiang, G.; Yan, Q.; Hu, J. Experimental study on the thermal management of batteries based on the coupling of composite phase change materials and liquid cooling. Appl. Therm. Eng. 2021, 185, 116415. [Google Scholar] [CrossRef]
  11. Huang, Y.; Wei, C.; Fang, Y. Numerical investigation on optimal design of battery cooling plate for uneven heat generation conditions in electric vehicles. Appl. Therm. Eng. 2022, 211, 118476. [Google Scholar] [CrossRef]
  12. Zhao, G.; Wang, X.; Negnevitsky, M.; Li, C. An up-to-date review on the design improvement and optimization of the liquid-cooling battery thermal management system for electric vehicles. Appl. Therm. Eng. 2022, 219, 119626. [Google Scholar] [CrossRef]
  13. Akbarzadeh, M.; Kalogiannis, T.; Jaguemont, J.; Jin, L.; Behi, H.; Karimi, D.; Van Mierolo, J.; Berecibar, M. A comparative study between air cooling and liquid cooling thermal management systems for a high-energy lithium-ion battery module. Appl. Therm. Eng. 2021, 198, 117503. [Google Scholar] [CrossRef]
  14. Tan, X.; Lyu, P.; Fan, Y.; Rao, J.; Ouyang, K. Numerical investigation of the direct liquid cooling of a fast-charging lithium-ion battery pack in hydrofluoroether. Appl. Therm. Eng. 2021, 196, 117279. [Google Scholar] [CrossRef]
  15. Roe, C.; Feng, X.; White, G.; Li, R.; Wang, H.; Rui, X.; Li, C.; Zhang, F.; Null, V.; Parkes, M.; et al. Immersion cooling for lithium-ion batteries–A review. J. Power Sources 2022, 525, 231094. [Google Scholar] [CrossRef]
  16. Lin, J.; Liu, X.; Li, S.; Zhang, C.; Yang, S. A review on recent progress, challenges and perspective of battery thermal management system. Int. J. Heat Mass Transf. 2021, 167, 120834. [Google Scholar] [CrossRef]
  17. Gu, Q.; Li, G.; Wu, Z. The analysis on the battery thermal management system with composite phase change materials coupled air cooling and fins. J. Energy Storage 2022, 56, 105977. [Google Scholar] [CrossRef]
  18. Wu, S.; Lao, L.; Wu, L.; Liu, L.; Lin, C.; Zhang, Q. Effect analysis on integration efficiency and safety performance of a battery thermal management system based on direct contact liquid cooling. Appl. Therm. Eng. 2022, 201, 117788. [Google Scholar] [CrossRef]
  19. Sundin, D.W.; Sponholtz, S. Thermal management of Li-ion batteries with single-phase liquid immersion cooling. IEEE Open J. Veh. Technol. 2020, 1, 82–92. [Google Scholar] [CrossRef]
  20. Zhou, H.; Dai, C.; Liu, Y.; Fu, X.; Du, Y. Experimental investigation of battery thermal management and safety with heat pipe and immersion phase change liquid. J. Power Sources 2020, 473, 228545. [Google Scholar] [CrossRef]
  21. Li, Y.; Zhou, Z.; Hu, L.; Bai, M.; Gao, L.; Li, Y.; Liu, X.; Song, Y. Experimental studies of liquid immersion cooling for 18650 lithium-ion battery under different discharging conditions. Case Stud. Therm. Eng. 2022, 34, 102034. [Google Scholar] [CrossRef]
  22. Dubey, P.; Pulugundla, G.; Srouji, A.K. Direct comparison of immersion and cold-plate based cooling for au-tomotive Li-ion battery modules. Energies 2021, 14, 1259. [Google Scholar] [CrossRef]
  23. Li, Y.; Bai, M.; Zhou, Z.; Lv, J.; Hu, C.; Gao, L.; Peng, C.; Li, Y.; Li, Y.; Song, Y. Experimental Study of Liquid Immersion Cooling for Different Cylindrical Lithium-ion Batteries under Rapid Charging Conditions. Therm. Sci. Eng. Prog. 2022, 37, 101569. [Google Scholar] [CrossRef]
  24. Sahin, R.C.; Gocmen, S.; Cetkin, E. Thermal management system for air-cooled battery packs with flow-disturbing structures. J. Power Sources 2022, 551, 232214. [Google Scholar] [CrossRef]
  25. Cheng, L.; Garg, A.; Jishnu, A.K.; Gao, L. Surrogate based multi-objective design optimization of lithium-ion battery air-cooled system in electric vehicles. J. Energy Storage 2020, 31, 101645. [Google Scholar] [CrossRef]
  26. Zhuang, W.; Liu, Z.; Su, H.; Chen, G. An intelligent thermal management system for optimized lithium-ion battery pack. Appl. Therm. Eng. 2021, 189, 116767. [Google Scholar] [CrossRef]
  27. Patil, M.S.; Seo, J.H.; Lee, M.Y. A novel dielectric fluid immersion cooling technology for Li-ion battery thermal management. Energy Convers. Manag. 2021, 229, 113715. [Google Scholar] [CrossRef]
  28. Le, Q.; Shi, Q.; Liu, Q.; Yao, X.; Ju, X.; Xu, C. Numerical investigation on manifold immersion cooling scheme for lithium ion battery thermal management application. Int. J. Heat Mass Transf. 2022, 190, 122750. [Google Scholar] [CrossRef]
  29. Han, J.-W.; Hwang, S.-G.; Garud, K.S.; Lee, M.-S.; Lee, M.-Y. Numerical Study on Oil Cooling Performance of The Cylindrical Lithium-Ion Battery Pack with Flow Arrangement. J. Korea Acad. Ind. Coop. Soc. 2022, 23, 19–25. [Google Scholar] [CrossRef]
  30. Garud, K.S.; Lee, M.Y. Thermodynamic, environmental and economic analyses of photovoltaic/thermal-thermoelectric generator system using single and hybrid particle nanofluids. Energy 2022, 255, 124515. [Google Scholar] [CrossRef]
  31. Patil, M.S.; Seo, J.H.; Panchal, S.; Jee, S.W.; Lee, M.Y. Investigation on thermal performance of water-cooled Li-ion pouch cell and pack at high discharge rate with U-turn type microchannel cold plate. Int. J. Heat Mass Transf. 2020, 155, 119728. [Google Scholar] [CrossRef]
  32. Dong, F.; Cheng, Z.; Zhu, J.; Song, D.; Ni, J. Investigation and optimization on cooling performance of a novel double helix structure for cylindrical lithium-ion batteries. Appl. Therm. Eng. 2021, 189, 116758. [Google Scholar] [CrossRef]
  33. Garud, K.S.; Lee, M.Y. Numerical Investigations on Heat Transfer Characteristics of Single Particle and Hybrid Nanofluids in Uniformly Heated Tube. Symmetry 2021, 13, 876. [Google Scholar] [CrossRef]
  34. Han, J.W.; Garud, K.S.; Hwang, S.G.; Lee, M.Y. Experimental Study on Dielectric Fluid Immersion Cooling for Thermal Management of Lithium-Ion Battery. Symmetry 2022, 14, 2126. [Google Scholar] [CrossRef]
  35. Garud, K.S.; Hwang, S.G.; Han, J.W.; Lee, M.Y. Performance characteristics of the direct spray oil cooling system for a driving motor of an electric vehicle. Int. J. Heat Mass Transf. 2022, 196, 123228. [Google Scholar] [CrossRef]
  36. Garud, K.S.; Lee, M.Y. Grey relational based Taguchi analysis on heat transfer performances of direct oil spray cooling system for electric vehicle driving motor. Int. J. Heat Mass Transf. 2023, 201, 123596. [Google Scholar] [CrossRef]
  37. Hasan, M.I. Investigation of flow and heat transfer characteristics in micro pin fin heat sink with nanofluid. Appl. Therm. Eng. 2014, 63, 598–607. [Google Scholar] [CrossRef]
  38. Omri, M.; Smaoui, H.; Frechette, L.; Kolsi, L. A new microchannel heat exchanger configuration using CNT-nanofluid and allowing uniform temperature on the active wall. Case Stud. Therm. Eng. 2022, 32, 101866. [Google Scholar] [CrossRef]
  39. Patil, M.S.; Seo, J.H.; Panchal, S.; Lee, M.Y. Numerical study on sensitivity analysis of factors influencing liquid cooling with double cold-plate for lithium-ion pouch cell. Int. J. Energy Res. 2021, 45, 2533–2559. [Google Scholar] [CrossRef]
Figure 1. Computational geometry of battery pack with dielectric fluid immersion cooling and without fin structure.
Symmetry 15 00092 g001
Figure 2. Computational geometry with different fin structures.
Symmetry 15 00092 g002
Figure 3. Mesh configuration of computation geometry for numerical simulation.
Symmetry 15 00092 g003
Figure 4. Validation of numerical results with experimental data.
Symmetry 15 00092 g004
Figure 5. Variation of (a) maximum temperature (b) temperature difference (c) average temperature of battery pack with volume flow rate for different fin structures.
Symmetry 15 00092 g005aSymmetry 15 00092 g005b
Figure 6. Distribution of temperature in case of (a) base structure (b) circular fin structure (c) rectangular fin structure (d) triangular fin structure.
Symmetry 15 00092 g006
Figure 7. Distribution of velocity in case of (a) base structure (b) triangular fin structure.
Symmetry 15 00092 g007
Figure 8. Comparison of Nusselt number and pressure drop for different fin structures.
Symmetry 15 00092 g008
Figure 9. Variation in PEC with volume flow rate for different fin structures.
Symmetry 15 00092 g009
Figure 10. Various combinations of fin dimensions for triangular fin structure.
Symmetry 15 00092 g010
Figure 11. (a) maximum temperature (b) temperature difference and (c) average temperature of battery pack for triangular fin structure with different A/B ratios.
Symmetry 15 00092 g011aSymmetry 15 00092 g011b
Figure 12. Temperature distribution for triangular fin structure with A/B ratios of (a) 1.15 (b) 2.064 (c) 3.082 (d) 4.304 (e) 5.731 and (f) 3D temperature contours for best structure with A/B ratio of 4.304.
Symmetry 15 00092 g012
Figure 13. Nusselt number and pressure drop variation with volume flow rate for various A/B ratios of triangular fin structure.
Symmetry 15 00092 g013
Figure 14. Variation of PEC with volume flow rate for various A/B ratios of triangular fin structure.
Symmetry 15 00092 g014
Table 1. Simulated results for a different number of mesh elements.
Mesh TypeNumber of ElementsMaximum Temperature (°C)Pressure Drop (Pa)
Type 11,917,89648.2223.92
Type 22,718,92048.4624.36
Type 33,719,94648.8224.67
Type 45,313,37649.1424.93
Type 56,239,51449.2225.02
Type 66,772,94349.2425.09
Table 5. Comparison of present results with previous studies.
AuthorsConfigurationResults
Sundin et al. [19]68 Ah battery cell with single phase immersion cooling30 °C at 2C discharge rate
Li et al. [21]18650 lithium-ion battery cell (Single cell) with phase change immersion cooling34.5 °C at 7C discharge rate
Dubey et al. [22]21700 cylindrical battery pack with immersion cooling44 °C at 2C discharge rate
Patil et al. [27]50 V battery pack (pouch cell), immersion cooling with bafflesAt 3C discharge rate,
31.7 °C for 3 LPM
28 °C for 10 LPM
Le et al. [28]Lithium-ion battery pack, immersion cooling with baffles35.06 °C at 5C discharge rate for optimized structure
Present study18650 lithium-ion battery pack, immersion cooling, fin structures35.07 °C at 5C discharge rate for best fin structure
Disclaimer/Publisher’s Note: The statements, opinions and data contained in all publications are solely those of the individual author(s) and contributor(s) and not of MDPI and/or the editor(s). MDPI and/or the editor(s) disclaim responsibility for any injury to people or property resulting from any ideas, methods, instructions or products referred to in the content.

