Abstract
Frontal alpha asymmetry (FAA) has been associated with emotional processing and affective psychopathology. Negative and withdrawal stimuli and behaviors have been related to high levels of right cortical activity, while positive and approach stimuli and behaviors have been related to increased left cortical activity. Inconsistent results in terms of depressive and anxious symptoms and their relationship to FAA have been previously observed, especially at older ages. Additionally, no studies to date have evaluated whether loneliness, a negative feeling, is related to FAA. Therefore, this study aimed (i) to compare FAA between younger and older adults and (ii) to investigate the possible relationships between loneliness, depressive and anxious symptomatology with FAA in young and older adults. Resting electroencephalogram recordings of 39 older (Mage = 70.51, SD = 7.12) and 57 younger adults (Mage = 22.54, SD = 3.72) were analyzed. Results showed greater left than right cortical activity for both groups and higher FAA for older than younger adults. FAA was not predicted by loneliness, depressive or anxious symptomatology as shown by regression analyses. Findings bring clarity about FAA patterns at different ages and open the discussion about the relationship between negative emotional processing and frontal cortical imbalances, especially at older ages.
1. Introduction
Research investigating potential relationships between asymmetries in brain activity, emotional processing and affective psychopathology has been quite prolific in the last 20 years. A model of the relationship between cortical activity asymmetry and emotional processing has been proposed, claiming that the left frontal region may be focused on processing positive/approach related stimuli and behaviors, while the right frontal regions may be involved in processing negative/withdrawal related stimuli and behaviors [1]. Neurobiological evidence supporting this model comes mainly from electroencephalography (EEG) studies that investigated frontal alpha asymmetry (FAA) [2]. The most used index to assess this frontal asymmetry is computed by subtracting the overall power in the alpha frequency band (8–12 Hz) at left frontal electrodes from the alpha power at right frontal electrodes [3]. Accordingly, given that alpha power is inversely related to cortical activity [4], higher FAA (i.e., less alpha power in left than right electrodes) scores calculated that way indicate greater left frontal activity, while lower FAA scores (i.e., more alpha power in left than right electrodes) indicate greater right frontal activity [4].
Support for the aforementioned proposed difference between frontal hemispheres is found in EEG studies showing that greater left frontal activity (i.e., high FAA scores) is associated with trait tendencies towards behavioral activation, motivational system, propensity to approach or engage with a stimulus, aggressive behavior, negatively-valenced but approach-related emotions, more intense responses to positively-valenced stimuli and with emotions such as joy and anger [5,6,7,8,9]. In addition, studies have also shown that greater right frontal activity (i.e., low FAA scores) is associated with trait tendencies towards general avoidance, withdrawal system, propensity to disengage from stimulus, sadness, depression and depressive symptomatology, social inhibition, shyness and more intense responses to negative-valenced stimuli—especially the ones involving fear [9,10,11,12,13,14,15].
One factor characterizing the research on this frontal hemispheric asymmetry is its relationship with affective psychopathology. A meta-analysis of the association of FAA with different affective states found a moderate effect size for the relationship of right-sided resting frontal asymmetry with depression (rs = 0.26) as well as with anxiety (rs = 0.25) [3]. More recent studies continue to solidify previous findings on the relationship between depression and frontal hemispheric asymmetry, showing that depressed individuals present negative FAA scores [16], indicating greater right-lateralized activity, in contrast to the balanced cortical activity shown by healthy controls [17,18,19]. Nevertheless, there are still some conflicting findings in the literature about the relationship of FAA with depression; mainly, due to the unknown effects of some confounding variables, such as anxiety symptoms (for review see [20]). Results on the relationship between anxiety and FAA are scarcer and more contradictory, however. Hence, dividing anxious symptoms between trait and state, Heller et al. [21] found that traits of anxiety were more positively related to left-sided frontal activity (i.e., higher FAA scores), although no differences in this asymmetry index were reported in a study by Gordon et al. [19] when accounting for anxiety symptoms without separating state and trait factors.
The right-side frontal asymmetry (i.e., lower or negative FAA scores) for depressive symptomatology was also translated in terms of volumetric asymmetry, as shown by Kumar and colleagues [22]. Specifically, these authors found right regions to be larger than left regions with an increase of severity for late onset depression, i.e., first episode of depression at age 60 or later. In spite of this result, EEG studies on frontal hemispheric asymmetry and its relationship with affective psychopathology in older adults are scarce and have shown contradictory results. Some research has shown that aging seems to be related with more positive FAA scores when compared to younger adults, indicating greater left frontal brain activity and greater experiences of positive emotions [23,24]. This neural pattern can be explained based on the positivity bias observed on aging, which gives preference to positive over negative stimuli in cognitive processing [25]. Additionally, in the presence of depressive symptoms in older adults, these symptoms seem to rely less on affective aspects than on the cognitive domain [26]. Furthermore, some studies showed no differences between depressed and non-depressed older adults in terms of frontal hemispheric asymmetry [27,28,29]. Therefore, more research is needed to determine if FAA is an indicator of depressive symptomatology, negative emotion and withdrawal motivation traits in the older population.
Among negative emotions, older adults are the population segment with the highest prevalence of loneliness. Estimated figures indicate that 20–34% of older people in Europe and 25–29% in the USA are affected by loneliness [30]. Perceived social isolation or loneliness increase implicit vigilance for social threats along with increasing anxiety, depression, hostility and social withdrawal [31,32,33]. Loneliness is defined as the persistent and distressing feeling produced when there is a mismatch between desired and actual social relationships [34,35]. Withdrawal from social relationships tends to be progressive with age and may trigger further increases in loneliness [33]. Moreover, the COVID-19 pandemic significantly contributed to increasing the feelings of loneliness and social isolation among the aging population [36]. Importantly, there is evidence that the presence of social withdrawal and other negative-type symptoms is related to higher risk of conversion into dementia from the prodromal state of mild cognitive impairment [37].
Objective and perceived social isolation generates changes in brain structures, functions and networks in adult social animals [38]. Evidence from EEG studies searching for certain signatures of loneliness comes mainly through the analyses of event-related potentials (ERPs). Cacioppo et al. [39,40] found that lonely individuals processed negative and threatening social stimuli (as compared with nonsocial stimuli) faster than non-lonely participants. Moreover, brain source localization suggested that lonely individuals showed early recruitment of the associative visual cortex, the inferior and superior temporal gyrus, the parahippocampus, the supramarginal gyrus, the dorsolateral prefrontal cortex, the amygdala and the insula, all of which are involved in attention, self-representation and threat [40]. Accordingly, Greenan et al. [41] also computed EEG source analyses in the context of a facial emotion bias task. These authors showed a positive relationship between loneliness and theta activity in the left transverse temporal region and with beta activity in the left superior parietal region for angry emotion biasing. These regions are associated with social-affective and attentional processing, respectively. However, out of these three EEG studies, just Greenan and colleagues [41] included older adults as participants, adopting a lifespan perspective (age range from 18 to 84 years), even though no effects of age were reported. Moreover, although the link between loneliness and depressive symptomatology/occurrence of major depressive disorders (MDD) is obvious and well-demonstrated [42,43], no studies have been conducted on the relationship between this complex emotion and the asymmetry in frontal alpha activity.
Therefore, the main objective of this study is twofold: firstly, we intend to explore the frontal alpha asymmetry (FAA) pattern in younger and older adults to better characterize the relationship of this index with emotional dispositions such as depressive and/or anxiety symptomatology; secondly, we assessed if loneliness is related to FAA in the same way as depressive feelings and other negative emotions—in other words, we expected greater right frontal activity (i.e., lower or negative FAA scores) to be related to higher loneliness scores. In addition, we expect a greater left cortical activity (i.e., higher FAA scores) in older adults when compared to young adults, given the positivity bias and the lower presence of affective symptoms in the older age group. Ina addition, we expect that the degree of right lateralization in frontal cortical activity (i.e., lower or negative FAA scores) is related with participants’ scores in depressive symptomatology and anxiety traits scales (e.g., Beck depression inventory and State–Trait Anxiety Inventory, respectively). Similarly, higher feelings of loneliness (measured by the UCLA Loneliness scale, for example) are also expected to be related to the degree of right lateralization in frontal cortical activity.
2. Materials and Methods
2.1. Participants
Cognitively healthy older adults (OA) aged 60 years or more were selected from the community and via contacts with different associations of older adults and day-care centers from the city of Braga and its surroundings, through advertisement and informative talks. Additionally, young adults (YA) between 18 and 35 years of age were recruited among University of Minho’s students and received course credits for their participation. All volunteers provided their written informed consent, and the study protocols were in accordance with principles outlined in the Declaration of Helsinki and received approval from the ethics committee for Research in Health and Life Sciences at the University of Minho (CE.CVS 095/2018).
Volunteers were excluded if they had a history of stroke, transient ischemic attack, head injury, Parkinson’s disease, Alzheimer’s disease or other neurological or psychiatric diseases. In addition, volunteers taking anxiolytic or antidepressant medication were excluded. The Mini Mental State Examination (MMSE) [44] was used to assess the general cognitive status according to years of education, and volunteers were excluded if their score lay below the cut-off for probable dementia established in the Portuguese version by Santana and colleagues [45]: illiterates ≤15 points, education from 1 to 11 years ≤22 points and education for more than 11 years ≤27 points. Further, all volunteers accepted for participation were independent or mildly dependent for the instrumental activities of daily life according to the Portuguese validation of the Instrumental Activities of Daily Living Scale (IADL) [46,47].
Accepted volunteers were divided into two groups: an OA group of 39 participants (26 females) aged 59 to 89 years (M = 70.51; SD = 7.12) and a YA group initially composed of 60 participants. Three of them were later excluded as they were identified as multivariate outliers (see Section 2.6 for details). The final YA group included 57 participants (30 females) aged 18 to 34 years (M = 22.54; SD = 3.72). General characteristics of both groups are described in Table 1, including demographic data (age, sex and educational attainment) and cognitive status.

Table 1.
Characteristics of study sample (n = 96).
2.2. Measures
2.2.1. UCLA Loneliness Scale
The UCLA Loneliness Scale [48,49] is an 18 item measure that was used to assess the feeling of loneliness. This scale consists of a self-report measure, and the score ranges from 18 to 72, with a higher score indicating more severe loneliness. The Portuguese version of the scale has demonstrated high internal consistency (Cronbach’s alpha = 0.87) and good concurrent validity as judged by its correlation with self-report measures of loneliness (r = 0.46) and other negative emotional states (e.g., rejection: r = 0.45, abandon: r = 0.38, or isolated: r = 0.45) [49].
2.2.2. Beck Depression Inventory-II
The Beck Depression Inventory-II (BDI-II) [50,51] is a 21 item self-report inventory that measures the severity of depression. The score ranges from 0 to 63, with a higher score indicating more severe depression. The internal consistency of the Portuguese version is high (Cronbach’s alpha = 0.90), and it showed high convergent validity with other depressive symptomatology scales (e.g., Center for the Epidemiologic Studies of Depression Scale: r = 0.71) [51].
2.2.3. State–Trait Anxiety Inventory—Form Y
The State–Trait Anxiety Inventory Form Y (STAI-Y) [52,53] is a 40 item inventory used to measure trait (20 items) and state (20 items) anxiety. The score ranges from 0 to 80 for each measure. For the trait subscale, a higher score indicates more severe anxiety as a personality trait, revealing individual differences related to a tendency to exhibit anxiety traits. For the state subscale, a higher score reflects more anxious psychological and physiological reactions directly related to adverse situations in a specific moment. In the current study, only the trait subscale was considered. The Portuguese version of the scale has demonstrated high internal consistency (Cronbach’s alpha = 0.85; Cronbach’s alpha = 0.88 if trait subscale is considered alone). Further, the trait subscale concurrent validity was demonstrated with its scores’ significant correlation with other measures of emotional tension and negative affect (e.g., Profiles of Mood Scale depression and tension indices: r = 0.31 and r = 0.19) [53].
2.3. EEG Recording
Electroencephalograms (EEG) were recorded using a Biosemi ActiveTwo system (Biosemi, Amsterdam, The Netherlands) from 64 active Ag/AgCl scalp electrodes placed in a nylon head cap. Electrode locations were arranged according to the international standard 10–10 system. Five additional active electrodes were placed in the lateral canthi of both eyes (horizontal electrooculogram—HEOG), above and below the left eye (vertical electrooculogram—VEOG) and at the tip of the nose. A Common Mode Sense (CMS) and Driven Right Leg (DRL) montage was used as reference during the recording, with two additional electrodes around the vertex. The EEG was recorded at a sampling rate of 512 Hz and on-line filtered between 0.01 and 100 Hz. Electrode offsets were below 30 mV before starting the recording. Recorded data were stored for offline analyses.
2.4. Procedure
Data collection was carried out on two different days (see Figure 1). On the first day, the participants signed the informed consent and completed the cognitive and emotional status assessment questionnaires, and it was confirmed if the participants fulfilled all the requirements for inclusion in the sample of the study. In the second session, the participants filled out an EEG checklist (to ensure participants’ safety) and then underwent an EEG recording. The EEG recording took place while participants were seated in a comfortable armchair located in a light- and sound-attenuated room. EEG data collection started with a 3 min eyes-closed resting state condition, followed by a 3 min eyes-open resting state condition. The session finished with EEG data collection during the execution of a cognitive task. For the present study, only data from the resting-state eyes-closed condition were used.
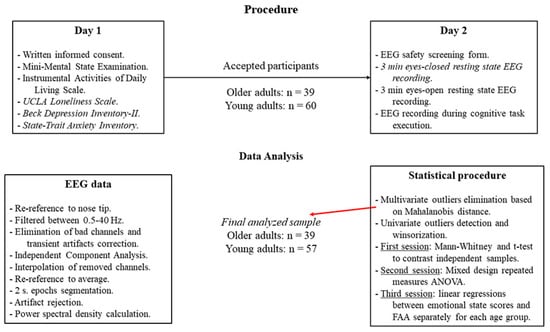
Figure 1.
Experimental flow in the present study, showing the procedure (top) as well as the EEG signal processing and statistical analyses pipelines (bottom).
2.5. EEG Data Processing
Stored EEG data were preprocessed with EEGLab [54]. Data were re-referenced to the nose tip electrode and band-pass filtered between 0.5–40 Hz with a finite impulse response (FIR) filter. Automated detection and elimination of electrodes with a low correlation (r ≤ 0.75) with the neighboring sensors along with the correction of large transient artifacts in the data was performed using artifact subspace reconstruction in Clean Raw Data plugin. Independent Component Analysis (ICA) was then applied, and resulting independent components were inspected with the aid of IC Label plugin [55]. IC components with a low probability of containing brain activity (≤20%) were removed from the data. This was followed by the interpolation of the previously removed channels prior to proceeding to re-reference data to the average reference. Then, preprocessed data were divided into 2 s segments. Segments containing artifacts were removed according to the following criteria: (i) presence of values of ±100 µV; (ii) presence of trends with slopes exceeding 75 µV; (iii) presence of improbable data and abnormal distribution with a single channel limit of 5 SDs; (iv) spectral power in frequencies from 0 to 2 Hz outside the range from 50 to −50 dB, or outside the range 25 to −100 dB for frequencies between 20 and 40 Hz. Finally, those recordings with a minimum of 30 artifact-free data epochs (i.e., 1 min) were selected for power spectral density (PSD) calculations through the p-welch function from the Signal Processing Toolbox in Matlab, using Welch’s overlapped segment averaging estimator windowed with a Hamming window.
For each participant, the eight power values (0.5 Hz resolution) in the alpha frequency band (8–12 Hz) were extracted and averaged for electrodes F3 and F4, separately. Averaged alpha power values were then transformed by calculating their natural logarithm. Frontal alpha asymmetry (FAA) was then calculated using the following formula: FAA = ln(F4) − ln(F3); where ln(F4) represents the natural logarithm of averaged alpha power at electrode F4 and ln(F3) the natural logarithm of averaged alpha power at electrode F3.
2.6. Statistical Analysis
Before conducting the planned statistical analyses, in order to eliminate the influence of extreme values, the Mahalanobis distance (MD) was calculated in a multivariate space with scores on all the analyzed and demographic variables (i.e., MMSE, IADL, Education Years, BDI-II, STAI-Y, UCLA, and FAA). Individuals whose MD exceeded the value with an associated probability of 0.001 in a χ2 distribution with 8 degrees of freedom were defined as multivariate outliers. Three YA were identified as multivariate outliers and discarded for further analysis. Furthermore, individual scores deviating from the variable mean by at least 2.2 times the interquartile range were considered univariate outliers [56,57] and winsorized before the statistical tests [58].
Across the statistical sessions in the present study, the alpha level was kept at p ≤ 0.05. The first session included a series of Mann–Whitney tests for independent samples, contrasting FAA values as well as UCLA and BDI-II scores between groups. STAI-Y scores were adjusted to the normal distribution and thus were compared between groups using an independent samples t-test. To further explore FAA characteristics in YA and OA, a second session was carried out to perform a mixed repeated measures ANOVA with the between-subjects factor Group (YA and OA) and the within-subjects factor Hemisphere (lnF4 and lnF3). Bonferroni correction was employed for planned post hoc comparisons. The final session aimed to delve into the relationship between FAA and loneliness, depression and anxiety. Thus, for each group, linear regression analyses were run using FAA as the outcome variable and scores on UCLA, BDI-II and STAI-Y as predictors independently, given the high correlation among the emotional status variables and the potential effects of multicollinearity.
A priori sample size calculations on G*Power software (https://www.psychologie.hhu.de, accessed on 12 September 2020) estimated for the mixed design ANOVA a minimum sample size of 34 participants for detecting medium effect sizes (f = 0.25) with a statistical power of 0.80 and an alpha level of 0.005 and considering a moderate to high correlation (r = 0.5) between the repeated measures. For the linear regression, the estimation for detecting medium effect sizes (f2 = 0.15) with a statistical power of 0.80 and an alpha level of 0.05 was 55 participants.
3. Results
3.1. Group Differences
The independent samples Mann–Whitney tests to compare FAA values between YA and OA groups reached statistical significance, U = 1484.0; p = 0.006; r = 0.335 (Figure 2A), showing that OA ( = 0.981, SD = 0.36) presented higher asymmetry than YA ( = 0.811, SD = 0.36).
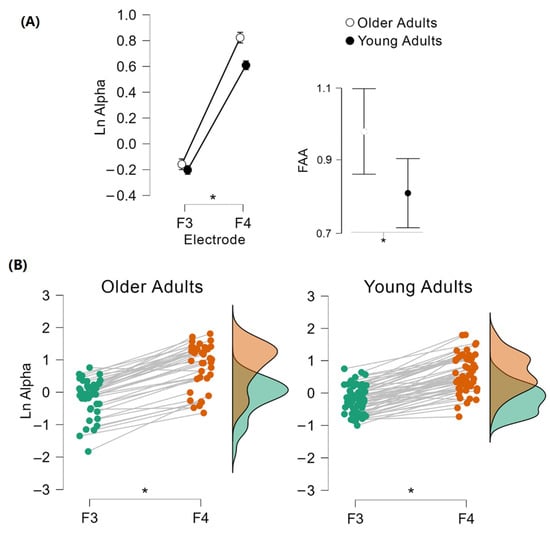
Figure 2.
Comparison of frontal alpha asymmetry (FAA) values between YA and OA. Mann–Whitney test revealed hemispheric activity differences between groups: OA presented higher FAA than YA (A). Mixed repeated measures ANOVA showed a significant main effect for the hemisphere; the right hemisphere presented a higher alpha activity for both age groups (B). * p ≤ 0.05.
Regarding the emotional state questionnaires, UCLA scores did not significantly differ between OA and YA, U = 1322.5; p = 0.116. Similarly, STAI-Y scores were not significantly different for OA and YA, t(94) = 1.62; p = 0.109. Nonetheless, BDI-II scores showed a statistically significant difference, U = 1581.5; p ≤ 0.001; r = 0.423; with OA having larger scores than YA.
3.2. Hemispheric Alpha Power Differences within and between Groups
The mixed repeated measures ANOVA to compare the natural logarithm transform of alpha power between cerebral hemispheres within each age group as well as between them showed a significant main effect for Hemisphere, F(1, 94) = 572.08; p ≤ 0.001; η2p = 0.859 (Figure 2B), as well as a significant interaction between Hemisphere and Group F(1, 94) = 5.16; p = 0.025; η2p = 0.052. Planned post hoc comparisons showed that YA and OA’s F3 electrodes showed a lower natural logarithm of alpha power than YA and OA’s F4 electrodes (all p ≤ 0.001), without age group differences for the natural logarithm of alpha power at any electrode (F3: p = 0.707, F4: p = 0.413). Similarly, there was no main effect for Group, F(1, 94) = 1.36; p = 0.246.
3.3. Relationship between FAA and Loneliness, Depression, and Anxiety
For the OA group, none of the tested regression models were significant (see Table 2). Likewise, for the YA group, none of the models were significant (see Table 2). Thus, it seems that FAA is not predicted by emotional status questionnaires in the sub-clinical groups used in the present study (Figure 3).
Table 2.
Regression models with the emotional status questionnaires as predictors and FAA as outcome for the OA and YA groups.
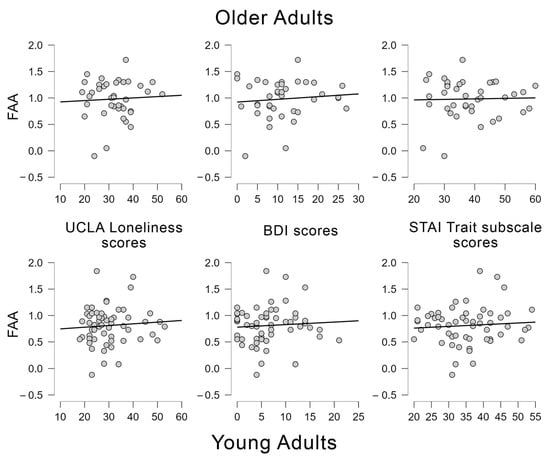
Figure 3.
Scatter plots showing the regression analyses conducted between frontal alpha asymmetries (FAA) and UCLA loneliness scores, BDI scores and STAI Trait subscale scores for younger and older adults.
4. Discussion
The two main objectives of this paper were to compare the frontal alpha asymmetry between younger and older adults to better characterize the relationship of this index with depressive and anxious symptomatology and to understand if these cortical patterns were related to loneliness in the same way they appear to be related to depression and negative emotions in the scientific literature. According to our hypothesis, we found a main effect of frontal alpha asymmetry between the two age groups, in which older adults presented more positive FAA than younger adults. In other words, older adults presented greater hemispheric imbalance with higher left cortical activity in comparison to younger adults. However, contrary to what we expected, this cortical pattern was not related to loneliness, depression or anxiety, meaning that higher scores on the loneliness scale and higher symptoms on depression and anxiety inventories were not significant predictors of FAA levels. We further examined if there were any differences in loneliness, depression and anxiety symptoms between the two age groups. We found no differences in loneliness nor in anxiety symptoms between younger and older adults. However, the two age groups differed in the depression scores, in which older adults presented higher depressive symptoms than younger adults.
Regarding the main effect of FAA found in the present study that revealed greater asymmetry for the older than the younger group, this is in accordance with previous literature that indicates greater left frontal brain activity in older adults [23,24]. Studies on frontal asymmetry have been consistently showing that the left frontal region is more concerned with processing positive emotions, stimuli and behaviors [1,4]. Accordingly, the literature has been showing the presence of a positivity bias on aging, which may explain this greater left frontal activity at older ages. This effect describes how this older population has a tendency to pay more attention and better remember positive than negative stimuli [25]. Thus, this preference pattern for positive stimuli may be related to greater alpha activity on the right hemisphere and consequently to higher activation of those left-brain regions related to the processing of positive stimuli even in resting state recordings.
Furthermore, even in the presence of a clinical depression, which could lead to a negative bias to unpleasant emotions and thus greater right frontal asymmetry, studies have been showing no statistical differences on FAA between depressed and non-depressed older adults [27,28,29]. These results indicate that clinical depression in older ages may be insufficient to provoke a change in the balance of hemispheric activity. However, it is important to deeply understand how late onset depression, i.e., depression in older ages, differs in presentation, etiology, risk and protective factors from depression at younger ages [26]. When depression is manifested in older adults, the symptoms presented are more prominent in the cognitive domain than in the affective domain [26], which can easily lead to cognitive deficits [37]. Thus, the fewer negative affective symptoms manifested in late onset depression may explain the null differences found in FAA patterns between depressed and non-depressed older adults. Additionally, it may sustain the FAA pattern found in this study and previous studies, with older adults revealing a greater left then right cortical activity in the absence of clinical depression.
Interestingly, it is noteworthy here that previous literature in cognitive rather than emotional processing has observed a reduction of hemispheric asymmetry in older people in comparison with younger adults, as summarized in the HAROLD model [59]. Consequently, the present results, as well as those of previous studies on FAA in older adults, are at odds with this model, indicating that, at rest, there may be a greater frontal asymmetry in older than younger adults. Whether this result is also observed when actively processing emotional stimuli or performing cognitive tasks should be examined in future studies.
Regarding our exploration of the FAA patterns and their relationships with emotional disposition on both age groups, we found no significant associations. Thus, the frontal asymmetries found in our results were not significantly explained by loneliness, depressive or anxious symptoms. Firstly, it is important to acknowledge that the cortical imbalance found in our results represents a greater left than right cortical activity for both age groups, and previous literature shows that depression and anxiety seem to be more related to greater right than left cortical activity [3]. Additionally, by the nature of loneliness and its well-demonstrated relationship with depression [42,43], we expected a similar relationship between loneliness and FAA to that observed between depression and FAA (i.e., higher symptoms to be related to greater right than left cortical activity). However, our results do not withstand either of these relationships of negative emotionality and greater right than left cortical activity. Therefore, our null results can be an important call for further research on the relationship between the FAA and the negative emotions symptomatology. Given that several previous studies showed that clinical depression is related to greater right FAA [16,17,18,19], it could be argued that, perhaps, the subclinical symptoms that our participants presented were not enough to provoke an alpha activity imbalance driven by greater right than left cortical activity.
Moreover, even though the older group presented higher depressive symptoms in comparison to the younger group, which could lead to a greater right than left alpha activation or a more balanced cortical activity, this age-group still presented a higher asymmetry than younger adults, which was characterized by greater left than right cortical activity. Deslandes et al. [28] found no differences between depressed and non-depressed older adults in FAA, but, interestingly, these authors also found a main effect of hemisphere for both groups, with higher cortical activity for the left than right hemisphere. It seems, therefore, that at older ages there is a cortical imbalance favoring left hemispheric activation, and that this asymmetry may be associated with the positivity bias and the nature of the depressive symptoms (manifested more prominently on the cognitive than the affective domain) in this age group. However, in our sample, the depressive symptoms were subclinical, and our data cannot reveal if the depressive symptoms in our older group were more prominent in the affective or cognitive domains. Furthermore, the linear regression for the older adults group presented low statistical power, which could hinder finding small but significant effects. Consequently, future studies are needed to explore whether, with aging, a left cortical imbalance prevails even in the presence of negative affective psychopathology (subclinical and clinical symptoms), which tends to be related to greater right than left cortical activity in younger ages [17,18,19].
Regarding anxiety, despite it having been previously related to heightened right hemisphere activity [3], studies on anxiety and FAA are scarce and presented mixed results. For example, Gordon et al. [19] failed to find a relationship between anxiety and FAA, but Heller et al. [21] found that when anxious symptoms are divided between trait and state, traits of anxiety were positively related to left-sided frontal activity. Thus, in our study. we evaluated the traits of anxiety of our participants and their relationship with the FAA. Even though our participants presented a higher cortical activity for the left than the right hemisphere, which seems to be the pattern expected for traits of anxiety, our results showed that this cortical activity pattern was not related to these symptoms.
Finally, with respect to loneliness feelings, when evaluating their relationship to the FAA, we also found no significant association between them. We expected to observe such a relationship, providing that loneliness is a negative affective processing construct [39,40], which has been associated with left hemispheric activity signatures [41] and has a well-established link with depression [42,43]. Therefore, it is possible that other factors, apart from the emotional and affective domains, might explain the different FAA patterns observed in our results and those of previous studies.
Nevertheless, further studies are necessary to make stronger conclusions on FAA and emotional processing throughout a person’s lifespan. Such studies should help to clarify if the positivity bias presented in older ages indeed has more impact on FAA than negative emotions and whether the suggested difference in the nature of the depression symptoms manifested throughout aging is also responsible for the different patterns found in the literature. Thus, it would be important to analyze different levels and types of affective psychopathology and their possible effects on FAA patterns. For example, for depression, and overcoming some limitations of the current work, it could be important to evaluate the level of affective and cognitive symptoms on younger and older adults and the relationship between these affective/cognitive subscores and the FAA. Another factor that may be a limitation for the generalization of the present results and that should be taken into account in future studies is the homogeneity of the sample size for the different age groups, since in our study, the size of the older adults group is smaller than that of the younger group. Additionally, this yielded a low statistical power for the regression analyses in the older group.
5. Conclusions
Taken together, our results bring clarity on the FAA patterns at different stages of the adult lifespan and their relationships with emotional processing and negative affective dispositions. There is a well-known pattern showing that older adults when compared to younger adults pay more attention and better retain memories from positive stimuli and experiences than from negative ones [25]. In addition, left hemispheric frontal activity has been related to positive emotional processing [1,4]. Hence, both factors seem to be translated into a greater frontal alpha asymmetry in older than younger participants, which is driven by higher left than right frontal activity during resting state in the current study. Furthermore, even with higher levels of depressive symptoms than the younger adults, this cortical pattern of greater left hemispheric frontal activity still prevails in the older adults. This latter result can also challenge traditional views on the effect of negative emotion on the FAA. The literature on FAA and emotional processing is scarce and inconsistent; thus, it is possible that factors other than the affective domain could better explain the frontal alpha asymmetries found throughout individuals, especially at older ages. Nevertheless, this study brings light to FAA patterns in different age groups and their relationship to different negative emotions (loneliness, depressive and anxious symptoms); additionally, it further clarifies the rather scarce literature regarding cortical asymmetries on aging.
Author Contributions
Conceptualization, C.B., A.B. and D.P.; methodology, all authors; formal analysis, C.B., A.R.P., A.B. and D.P.; investigation, all authors; writing—original draft preparation, C.B., A.R.P. and A.B.; writing—review and editing, all authors; project administration D.P. and A.S. All authors have read and agreed to the published version of the manuscript.
Funding
This research was funded by Portuguese Foundation for Science and Technology (FCT) projects POCI-01-0145-FEDER-028682 (PTDC/PSI-GER/28682/2017) and NORTE-01-0145-FEDER-032152 (PTDC/PSI-GER/32152/2017) through national and European Regional Development (FEDER) funds. D.P. was supported by the FCT grant SFRH/BPD/120111/2016, and C.B. by FCT grant 2020.07157.BD. The Centre for Research in Psychology (CIPsi/UM-PSI/01662) is supported by FCT through the Portuguese State Budget (UIDB/01662/2020) and by the Portuguese Ministry of Education and Science through national and FEDER funds through COMPETE2020 under the PT2020 Partnership Agreement (POCI-01-0145-FEDER-007653).
Institutional Review Board Statement
The study protocols were in accordance with principles outlined in the Declaration of Helsinki and received approval from the ethics committee for Research in Health and Life Sciences at the University of Minho (CE.CVS 095/2018).
Informed Consent Statement
Informed consent was obtained from all subjects involved in the study.
Data Availability Statement
The data presented in this study are openly available in Open Science Framework and can be found here (accessed on 26 July 2022): https://osf.io/v7y62/.
Acknowledgments
We would like to thank H.T.A. Moore, A.C. Teixeira-santos and V. Ferreira for their assistance in data collection. We also like to thank Câmara Municipal de Vila Nova de Famalicão, Associação Gerações, Café Memoria-Braga and Vale do Homen for their help in participant recruitment and all those that volunteered for their participation.
Conflicts of Interest
The authors declare no conflict of interest. The funders had no role in the design of the study; in the collection, analyses, or interpretation of data; in the writing of the manuscript, or in the decision to publish the results.
References
- Davidson, R.J. Anterior cerebral asymmetry and the nature of emotion. Brain Cogn. 1992, 20, 125–151. [Google Scholar] [CrossRef]
- Segrave, R.; Cooper, N.; Thomson, R.; Croft, R.; Sheppard, D.; Fitzgerald, P. Individualized Alpha Activity and Frontal Asymmetry in Major Depression. Clin. EEG Neurosci. 2011, 42, 45–52. [Google Scholar] [CrossRef]
- Thibodeau, R.; Jorgensen, R.S.; Kim, S. Depression, anxiety, and resting frontal EEG asymmetry: A meta-analytic review. J. Abnorm. Psychol. 2006, 115, 715–729. [Google Scholar] [CrossRef] [PubMed] [Green Version]
- Coan, J.A.; Allen, J.J. Frontal EEG asymmetry as a moderator and mediator of emotion. Biol. Psychol. 2004, 67, 7–50. [Google Scholar] [CrossRef] [PubMed]
- Carver, C.S.; White, T.L. Behavioral inhibition, behavioral activation, and affective responses to impending reward and punishment: The BIS/BAS Scales. J. Personal. Soc. Psychol. 1994, 67, 319–333. [Google Scholar] [CrossRef]
- Coan, J.A.; Allen, J.J.B. Frontal EEG asymmetry and the behavioral activation and inhibition systems. Psychophysiology 2003, 40, 106–114. [Google Scholar] [CrossRef]
- Davidson, R.J. The Neuropsychology of Emotion and Affective Style; Lewis, M., Haviland, J.M., Eds.; The Guilford Press: New York, NY, USA, 1993; pp. 143–154. [Google Scholar]
- Harmon-Jones, E. Cognitive Dissonance and Experienced Negative Affect: Evidence that Dissonance Increases Experienced Negative Affect Even in the Absence of Aversive Consequences. Personal. Soc. Psychol. Bull. 2000, 26, 1490–1501. [Google Scholar] [CrossRef] [Green Version]
- Tomarken, A.J.; Davidson, R.J.; Henriques, J.B. Resting Frontal Brain Asymmetry Predicts Affective Responses to Films. J. Personal. Soc. Psychol. 1990, 59, 791–801. [Google Scholar] [CrossRef]
- Allen, J.J.; Iacono, W.G.; Depue, R.A.; Arbisi, P. Regional Electroencephalographic Asymmetries in Bipolar Seasonal Affective Disorder before and after Exposure to Bright Light. Biol. Psychiatry 1993, 33, 642–646. [Google Scholar] [CrossRef]
- Fox, N.A.; Rubin, K.H.; Calkins, S.D.; Marshall, T.R.; Coplan, R.J.; Porges, S.W.; Long, J.M.; Stewart, S. Frontal Activation Asymmetry and Social Competence at Four Years of Age. Child Dev. 1995, 66, 1770–1784. [Google Scholar] [CrossRef]
- Henriques, J.B.; Davidson, R.J. Regional Brain Electrical Asymmetries Discriminate Between Previously Depressed and Healthy Control Subjects. J. Abnorm. Psychol. 1990, 99, 22–31. [Google Scholar] [CrossRef] [PubMed]
- Henriques, J.B.; Davidson, R.J. Left Frontal Hypoactivation in Depression. J. Abnorm. Psychol. 1991, 100, 535–545. [Google Scholar] [CrossRef]
- Schaffer, C.E.; Davidson, R.J.; Saron, C. Frontal and Parietal Electroencephalogram Asymmetry in Depressed and Nondepressed Subjects. Biol. Psychiatry 1983, 18, 753–762. [Google Scholar] [PubMed]
- Schmidt, L.A. Frontal Brain Electrical Activity in Shyness and Sociability. Psychol. Sci. 1999, 10, 316–320. [Google Scholar] [CrossRef]
- Gollan, J.K.; Hoxha, D.; Chihade, D.; Pflieger, M.E.; Rosebrock, L.; Cacioppo, J. Frontal alpha EEG Asymmetry before and after Behavioral Activation Treatment for Depression. Biol. Psychol. 2014, 99, 198–208. [Google Scholar] [CrossRef] [Green Version]
- Beeney, J.E.; Levy, K.N.; Gatzke-Kopp, L.M.; Hallquist, M.N. EEG Asymmetry in Borderline Personality Disorder and Depression Following Rejection. Personal. Disord. Theory Res. Treat. 2014, 5, 178–185. [Google Scholar] [CrossRef] [Green Version]
- Gheza, D.; Bakic, J.; Baeken, C.; De Raedt, R.; Pourtois, G. Abnormal Approach-Related Motivation but Spared Reinforcement Learning in MDD: Evidence from Fronto-Midline Theta Oscillations and Frontal Alpha Asymmetry. Cogn. Affect. Behav. Neurosci. 2019, 19, 759–777. [Google Scholar] [CrossRef]
- Gordon, E.; Palmer, D.M.; Cooper, N. EEG Alpha Asymmetry in Schizophrenia, Depression, PTSD, Panic Disorder, ADHD and Conduct Disorder. Clin. EEG Neurosci. 2010, 41, 178–183. [Google Scholar] [CrossRef]
- de Aguiar Neto, F.S.; Rosa, J.L.G. Depression biomarkers using non-invasive EEG: A review. Neurosci. Biobehav. Rev. 2019, 105, 83–93. [Google Scholar] [CrossRef]
- Heller, W.; Nitschke, J.B.; Etienne, M.A.; Miller, G.A. Patterns of Regional Brain Activity Differentiate Types of Anxiety. J. Abnorm. Psychol. 1997, 106, 376–385. [Google Scholar] [CrossRef]
- Kumar, A.; Bilker, W.; Lavretsky, H.; Gottlieb, G. Volumetric Asymmetries in Late-Onset Mood Disorders: An Attenuation of Frontal Asymmetry with Depression Severity. Psychiatry Res. Neuroimaging 2000, 100, 41–47. [Google Scholar] [CrossRef]
- Barcelona, J.; Fahlman, M.; Churakova, Y.; Canjels, R.; Mallare, J.; Van Den Heuvel, M.I. Frontal Alpha Asymmetry During Prayerful and Resting States: An EEG Study in Catholic Sisters. Int. J. Psychophysiol. 2020, 155, 9–15. [Google Scholar] [CrossRef]
- Kelley, N.J.; Hughes, M.L. Resting frontal EEG Asymmetry and Emotion Regulation in Older Adults: The Midlife in the United States (MIDUS) Study. Psychol. Aging 2019, 34, 341–347. [Google Scholar] [CrossRef] [PubMed]
- Reed, A.E.; Carstensen, L.L. The Theory Behind the Age-Related Positivity Effect. Front. Psychol. 2012, 3, 339. [Google Scholar] [CrossRef] [Green Version]
- Fiske, A.; Wetherell, J.L.; Gatz, M. Depression in Older Adults. Annu. Rev. Clin. Psychol. 2009, 5, 363–389. [Google Scholar] [CrossRef]
- Carvalho, A.; Moraes, H.; Silveira, H.; Ribeiro, P.; Piedade, R.A.M.; Deslandes, A.C.; Laks, J.; Versiani, M. EEG Frontal Asymmetry in the Depressed and Remitted Elderly: Is it Related to the Trait or to the State of Depression? J. Affect. Disord. 2011, 129, 143–148. [Google Scholar] [CrossRef]
- Deslandes, A.C.; Moraes, H.; Pompeu, F.A.M.S.; Ribeiro, P.; Cagy, M.; Capitão, C.; Alves, H.; Piedade, R.A.M.; Laks, J. Electroencephalographic Frontal Asymmetry and Depressive Symptoms in the Elderly. Biol. Psychol. 2008, 79, 317–322. [Google Scholar] [CrossRef]
- Kaiser, A.K.; Doppelmayr, M.; Iglseder, B. Electroencephalogram Alpha Asymmetry in Geriatric Depression. Z. Gerontol. Geriatr. 2018, 51, 200–205. [Google Scholar] [CrossRef]
- World Health Organization. Social Isolation and Loneliness among Older People: Advocacy Brief; World Health Organization: Geneva, Switzerland, 2021; ISBN 978-92-4-003074-9. [Google Scholar]
- Cacioppo, S.; Cacioppo, J.T. Research in Social Neuroscience: How Perceived Social Isolation, Ostracism, and Romantic Rejection Affect our Brain. In Social Exclusion; Riva, P., Eck, J., Eds.; Springer International Publishing: Cham, Switzerland, 2016; pp. 73–88. [Google Scholar] [CrossRef]
- De la Torre-Luque, A.; Viera-Campos, A.; Bilderbeck, A.C.; Carreras, M.T.; Vivancos, J.; Diaz-Caneja, C.M.; Aghajani, M.; Saris, I.M.J.; Raslescu, A.; Malik, A.; et al. Relationships Between Social Withdrawal and Facial Emotion Recognition in Neuropsychiatric Disorders. Prog. Neuro-Psychopharmacol. Biol. Psychiatry 2022, 113, 110463. [Google Scholar] [CrossRef]
- Porcelli, S.; Van Der Wee, N.; van der Werff, S.; Aghajani, M.; Glennon, J.C.; van Heukelum, S.; Mogavero, F.; Lobo, A.; Olivera, F.J.; Lobo, E.; et al. Social Brain, Social Dysfunction and Social Withdrawal. Neurosci. Biobehav. Rev. 2019, 97, 10–33. [Google Scholar] [CrossRef]
- Lam, J.A.; Murray, E.R.; Yu, K.E.; Ramsey, M.; Nguyen, T.T.; Mishra, J.; Martis, B.; Thomas, M.L.; Lee, E.E. Neurobiology of Loneliness: A Systematic Review. Neuropsychopharmacology 2021, 46, 1873–1887. [Google Scholar] [CrossRef] [PubMed]
- Peplau, L.A.; Russell, D.; Heim, M. The Experience of Loneliness; Frieze, I.H., Bar-Tal, D., Carroll, J.S., Eds.; Jossey-Bass: San Francisco, CA, USA, 1979; pp. 53–78. [Google Scholar]
- Sandu, V.; Zólyomi, E.; Leichsenring, K. Addressing Loneliness and Social Isolation Among Older People in Europe; Policy Brief; European Centre for Social Welfare Policy and Research: Vienna, Austria, 2021; Volume 7. [Google Scholar]
- Lopez-Anton, R.; Santabárbara, J.; De-La-Cámara, C.; García, P.G.; Lobo, E.; Marcos, G.; Pirez, G.; Saz, P.; Haro, J.M.; Rodríguez-Mañas, L.; et al. Mild Cognitive Impairment Diagnosed with the New DSM-5 Criteria: Prevalence and Associations with Non-cognitive Psychopathology. Acta Psychiatr. Scand. 2014, 131, 29–39. [Google Scholar] [CrossRef] [PubMed]
- Cacioppo, S.; Capitanio, J.P.; Cacioppo, J.T. Toward a Neurology of Loneliness. Psychol. Bull. 2014, 140, 1464–1504. [Google Scholar] [CrossRef]
- Cacioppo, S.; Balogh, S.; Cacioppo, J.T. Implicit Attention to Negative Social, in Contrast to Nonsocial, Words in the Stroop Task Differs Between Individuals High and Low in Loneliness: Evidence from Event-Related Brain Microstates. Cortex 2015, 70, 213–233. [Google Scholar] [CrossRef] [PubMed]
- Cacioppo, S.; Bangee, M.; Balogh, S.; Cardenas-Iniguez, C.; Qualter, P.; Cacioppo, J.T. Loneliness and Implicit Attention to Social Threat: A High-Performance Electrical Neuroimaging Study. Cogn. Neurosci. 2015, 7, 138–159. [Google Scholar] [CrossRef] [PubMed]
- Grennan, G.; Balasubramani, P.P.; Alim, F.; Zafar-Khan, M.; Lee, E.E.; Jeste, D.V.; Mishra, J. Cognitive and Neural Correlates of Loneliness and Wisdom During Emotional Bias. Cereb. Cortex 2021, 31, 3311–3322. [Google Scholar] [CrossRef]
- Cacioppo, S.; Grippo, A.J.; London, S.; Goossens, L.; Cacioppo, J.T. Loneliness: Clinical Import and Interventions. Psychol. Sci. 2015, 10, 238–249. [Google Scholar] [CrossRef] [Green Version]
- Domènech-Abella, J.; Lara, E.; Rubio-Valera, M.; Olaya, B.; Moneta, M.V.; Rico-Uribe, L.A.; Ayuso-Mateos, J.L.; Mundó, J.; Haro, J.M. Loneliness and Depression in the Elderly: The Role of Social Network. Soc. Psychiatry Psychiatr. Epidemiol. 2017, 52, 381–390. [Google Scholar] [CrossRef] [PubMed]
- Folstein, M.F.; Folstein, S.E.; McHugh, P.R. “Mini-Mental State”. A Practical Method for Grading the Cognitive State of Patients for the Clinician. J. Psychiatr. Res. 1975, 12, 189–198. [Google Scholar] [CrossRef]
- Santana, I.; Duro, D.; Lemos, R.; Costa, V.; Pereira, M.; Simões, M.R.; Freitas, S. Mini-Mental State Examination: Avaliação dos Novos Dados Normativos no Rastreio e Diagnóstico do Défice Cognitivo. Acta Med. Port. 2016, 29, 240–248. [Google Scholar] [CrossRef] [Green Version]
- Lawton, M.P.; Brody, E.M. Assessment of Older People: Self-Maintaining and Instrumental Activities of Daily Living. Gerontologist 1969, 9, 179–186. [Google Scholar] [CrossRef]
- Reis, G.; Teixeira, L.; Constança, P.; Martins, M. Independencia en las Actividades de la Vida: Estudio de Validación de una Escala para la Población Portuguesa. Gerokomos 2012, 23, 69–73. [Google Scholar] [CrossRef] [Green Version]
- Russell, D.; Peplau, L.A.; Cutrona, C.E. The revised UCLA Loneliness Scale: Concurrent and Discriminant Validity Evidence. J. Persnal. Soc. Psychol. 1980, 39, 472–480. [Google Scholar] [CrossRef]
- Neto, F. A escala de solidão da UCLA: Adaptação Portuguesa. Psicol. Clínica 1989, 2, 65–79. [Google Scholar]
- Beck, A.T.; Steer, R.A.; Brown, G.H. Manual for the Beck Depression Inventory-II; Psychological Corporation: San Antonio, TX, USA, 1996. [Google Scholar]
- Campos, R.C.; Gonçalves, B. The Portuguese version of the Beck Depression Inventory-II (BDI-II): Preliminary psychometric data with two nonclinical samples. Eur. J. Psychol. Assess. 2011, 27, 258–264. [Google Scholar] [CrossRef]
- Spielberger, C.D.; Gorssuch, R.L.; Lushene, P.R.; Vagg, P.R.; Jacobs, G.A. Manual for the State-Trait Anxiety Inventory; Consulting Psychologists Press: Palo Alto, CA, USA, 1983. [Google Scholar]
- Cruz, J.; Mota, M.P. Adaptação e Características Psicométricas do “POMS-Profile of Mood States” e do “STAI –State Trait Anxiety Inventory”; Gonçalves, M., Ribeiro, I., Araújo, S., Machado, C., Almeida, L., Simões, M., Eds.; APPORT: Braga, Portugal, 1997; pp. 539–545. [Google Scholar]
- Delorme, A.; Makeig, S. EEGLAB: An Open-Source Toolbox for Analysis of Single-Trial EEG Dynamics. J. Neurosci. Methods. 2004, 134, 9–21. [Google Scholar] [CrossRef] [Green Version]
- Pion-Tonachini, L.; Kreutz-Delgado, K.; Makeig, S. ICLabel: An Automated Electroencephalographic Independent Component Classifier, Dataset, and Website. NeuroImage 2019, 198, 181–197. [Google Scholar] [CrossRef] [Green Version]
- Hoaglin, D.C.; Iglewicz, B.; Tukey, J.W. Performance of Some Resistant Rules for Outlier Labeling. J. Am. Stat. Assoc. 1986, 81, 991–999. [Google Scholar] [CrossRef]
- Hoaglin, D.C.; Iglewicz, B. Fine-Tuning Some Resistant Rules for Outlier Labeling. J. Am. Stat. Assoc. 1987, 82, 1147–1149. [Google Scholar] [CrossRef]
- Tukey, J.W. The Future of Data Analysis. Ann. Math. Stat. 1962, 33, 1–67. Available online: https://www.jstor.org/stable/2237638 (accessed on 23 November 2021). [CrossRef]
- Cabeza, R. Hemispheric asymmetry reduction in older adults: The HAROLD model. Psychol. Aging 2002, 17, 85. [Google Scholar] [CrossRef] [PubMed]
Publisher’s Note: MDPI stays neutral with regard to jurisdictional claims in published maps and institutional affiliations. |
© 2022 by the authors. Licensee MDPI, Basel, Switzerland. This article is an open access article distributed under the terms and conditions of the Creative Commons Attribution (CC BY) license (https://creativecommons.org/licenses/by/4.0/).