Abstract
The phenomenon of a nonrandom distribution of mutations in a genome has been observed for many years. In fact, recent findings have indicated the presence of mutation clusters in different biological systems, including chemically treated yeast, transgenic mice, and human cancer cells. Until now, an asymmetrical distribution of mutations was only described in a single bacterial species. Here, we used ethyl methanesulfonate mutagenesis and a whole-genome sequencing approach to determine if this phenomenon is universal and not confined to Gram-negative bacteria. The Gram-positive bacterium Bacillus subtilis was selected for ethyl methanesulfonate treatment, followed by the next-generation sequencing of several mutagenized B. subtilis genomes. A nonrandom distribution of mutations was observed. This pilot study with a limited number of sequenced clones may indicate not only the universality of the phenomenon of mutation clusters but also the effectiveness of the use of a whole-genome sequencing approach in studying this phenomenon.
1. Introduction
According to evolutionary theory, mutations are randomly distributed in the genomic space [1,2]. Nevertheless, several studies have revealed the simultaneous occurrence of multiple mutations in particular positions of the chromosome, while the remainder of the genome remains virtually intact [3,4,5,6,7]. As a result, a large number of mutations accumulate within a restricted genome space, leading to cluster formation [8,9]. Such a phenomenon has been referred to as mutation clusters, mutation showers, hotspots, or kataegis, and these clusters can be found in various life forms, from phages to higher eukaryotic organisms such as humans [2,10]. Moreover, recent studies in chemically treated Saccharomyces cerevisiae and Escherichia coli showed an unusual dispersion of mutations in the genome space, which also argues against the traditional idea of random distribution [2]. Together, these results indicate that more studies are required to elucidate this mechanism, as the position of mutations was found to be limited to particular regions of the genome, generating a mutation cluster. Importantly, there was a high prevalence of such clusters detected in cancer genomes, and these clusters are associated with growth and evolution. As multiple studies have reported the nonrandom distribution of mutations, it is possible that further investigations of the uniqueness and significance of such a phenomenon may reveal new genomic insights [2].
The examples mentioned above indicate that the sites of the genome where mutation occurs, as well as the process of mutagenesis itself, are localized and do not always obey random distribution theory. Therefore, studies using biological systems with deliberately induced mutations represent a useful and powerful approach that is appropriate for this kind of research. The example described below in a chemically mutagenized organism revealed the formation of mutation clusters in response to a mutagen. Such observations correlated with a simultaneous mutation pattern previously discovered in nature.
A study conducted by Parkhomchuk et al. revealed an uneven distribution of mutations in several E. coli genomes after induced mutagenesis by the alkylating agent ethyl methanesulfonate (EMS) [11]. The bacterial colonies were grown under the same conditions; after EMS treatment, several single colonies were randomly picked and analyzed by next-generation sequencing. The results revealed several features, e.g., long “stretches” of C-to-T or G-to-A coordinated mutations (mutation types caused by EMS) that formed clusters of different lengths. In addition, a “switch” from one type of “stretch” to another was observed as well as variations in the mutation density in the regions of the genome between sequenced colonies [11].
The fact that such a nonrandom distribution of mutations was found in Gram-negative E. coli after induced mutagenesis by EMS poses the question of whether such asymmetry of mutagenesis can also be observed in other bacterial species. However, there are no available studies on Gram-positive bacteria to date. Therefore, in this work, we examined if a similar nonuniform pattern of induced mutations can be found in the Gram-positive bacterium Bacillus subtilis. In the standard reference of bacterial phylogeny based on 16S rRNA sequence comparison, B. subtilis is a low-G + C Gram-positive bacterium that forms a monophyletic group with high-G + C Gram-positive bacteria such as Mycobacterium tuberculosis, although there is no particular relationship between these two species [12,13].
The application of advanced next-generation sequencing and bioinformatics tools allows studying aspects of genome dynamics with high accuracy [14,15,16]. Thus, the Ion Torrent next-generation sequencing platform was used for the analysis of mutagenized B. subtilis single colonies.
2. Materials and Methods
2.1. Bacterial Strains and Mutagenesis
Bacillus subtilis subsp. subtilis, strain 168 was obtained from Dr. V. Ogryzko (Gustave Roussy, Villejuif, France). Mutagenesis was induced according to the protocol by Miller [17,18]. Bacteria were grown in LB (Luria–Bertani) broth and then diluted in a 1:50 ratio in LB broth on a shaker at 37 °C to an OD of 0.3–0.4. The cells were precipitated by centrifugation at 1500–2000 rpm within 5 min, washed twice with PBS (phosphate-buffered saline; 137.93 mM NaCl, 2.67 mM KCl, 1.47 mM KH2PO4, and 8.1 mM Na2HPO4, pH 7.4; Invitrogen, Waltham, MA, USA), and then resuspended in half of the original PBS volume. EMS (75 µL) was added to 5 mL of a cell suspension, which was placed on a shaker at 50 rpm for 2 h at 37 °C. The cells were then centrifuged, washed in PBS twice, resuspended in 10 mL of LB broth, and cultured for 2 h. The cells were then precipitated by centrifugation at 1500–2000 rpm for 5 min, washed twice with PBS, resuspended in 50 μL of PBS, and streaked on LB agar plates. The next day, the plates were checked for the presence of separate colonies. Five colonies and a B. subtilis control sample were randomly selected and plated on new LB agar. The next day, the colonies were transferred into 2 mL of LB broth and cultured for 2 h to obtain DNA for subsequent full-genome sequencing. The cells were then precipitated by centrifugation, washed in PBS, and stored at 20 °C before DNA extraction.
2.2. DNA Extraction
Extraction of genomic DNA was performed according to a previously described protocol [19]. Three (B. subtilis colonies #1, #3, and #4) out of five mutagenized colonies and a control sample were selected. DNA samples of the other two colonies (B. subtilis colonies #2 and #5) were not processed further and stored at −80 °C. Bacterial cells were resuspended in 100 μL of TE-containing wall-degrading enzyme lysozyme (10 mg/mL) buffer. Lysozyme was also prepared in 1 × TE buffer (pH 8.0), and cells were incubated for 2 h at 37 °C. Then, 5 μL of proteinase K (stock 20 mg/mL, final concentration 100 μg/mL) was added, and the sample was incubated for 1 h at 60 °C. A total of 500 μL of DNAzol reagent (Invitrogen) was added to 100 μL of the lysed mixture and incubated for 5 min at 65 °C. The samples were processed using centrifugal filter units (Millipore, Burlington, MA, USA) according to the manufacturer’s instructions. To elute DNA, 55 μL of warm (65 °C) 1 × TE buffer was added to the center of the membrane to allow interaction with the resin for 1 min. The DNA was eluted by centrifugation at 13,200 rpm for 1 min. The quality of the DNA was checked using a Nanodrop 1000 (Thermo, Waltham, MA, USA) and a Qubit 2.0 fluorometer (Thermo) with a Qubit double-stranded DNA (dsDNA) high-sensitivity (HS) assay kit (Thermo). DNA samples were stored at −80 °C.
2.3. Ion Torrent Sequencing and Mutation Calling
Up to 100 ng of total B. subtilis genomic DNA was used for the library preparation step according to the Ion Torrent protocol. Barcoded libraries were prepared using an Ion Xpress Plus fragment library kit and an Ion Xpress barcode adapters 1–16 kit (Thermo). The median library size of 480 bp for the adapter-ligated 400-base-read library was size-selected with E-Gel SizeSelect II Agarose Gel (Invitrogen). The sequencing was conducted on an Ion Torrent PGM sequencing platform using an Ion PGM™ HiQ sequencing kit (Thermo) and Ion 318TM Chip as described earlier [20].
Ion Torrent sequencing chemistry is based on the detection of the hydrogen ions release by the pH change upon the incorporation of the nucleotide. Liberated proton causes the pH shift in the solution that is proportional to the quantity of incorporated nucleotide during the flow (0.02 pH units equivalent to the one incorporated base). Such pH change (ΔpH) causes a change in the surface charge of the metal-oxide-sensing layer, which subsequently leads to the potential change (ΔV) in the source of the sensor plate and then raw data converted into the base calls through signal-processing software ready for further analysis.
For data analysis, FASTQ files (B. subtilis_col_1, B. subtilis_col_3, B. subtilis_col_4, and B. subtilis_control) were processed with the NGSQC Toolkit v.2.3.3 for end trimming. Quality control of the reads was assessed using the FASTQC v.0.11.5 quality control tool. Alignment with the reference sequence Bacillus_subtilis_subsp_subtilis_str_168 (NZ_CP010052.1) from the Gene Bank database was performed using the BWA v.0.7.12 program through the bwa-men algorithm. The Samtools v.1.3-1.1 utility was used for sorting and indexing the outcome BAM files. Mutation calling was performed by the VarScan v.2.3.9 program. Visualization of the variant type, frequency, and distribution of SNPs in the genome was performed using RStudio v.1.0.44 and Python v.2.7.
3. Results
Sequencing of the four B. subtilis genomes revealed an average of 35 mutations per genome among the mutagenized samples. The predominance of G-to-A and C-to-T replacements was expected as EMS mutagenesis predominantly results in such transitions. The numbers of SNPs found in B. subtilis genomes from colonies 1, 3, and 4 are shown in Table 1. The number of mutations varied between the samples (Figure 1). Additional validation of the mutations was not carried out in this preliminary study.

Table 1.
Genome-wide SNP profiles of the B. subtilis samples.
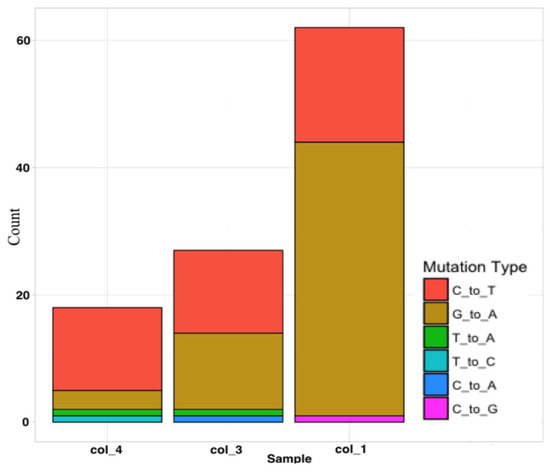
Figure 1.
Type and frequency of SNPs in B. subtilis genomes after EMS mutagenesis. The genome of B. subtilis colony #1 had the highest number of SNPs (62), followed by colony #3 (27) and colony #4 (18). C-to-T and G-to-A transitions were the most prevalent among SNPs. Other base transitions were also present.
From Table 1, we may conclude that the genome of B. subtilis colony #1 had the highest number of SNPs compared with all other samples since the corresponding third column in the figure is red, indicating a high SNP count. In addition to the SNPs caused by EMS (C-to-T and G-to-A transitions), other mutation types, including T-to-A, C-to-G, C-to-A, and T-to-C transitions, could be found in the genomes. However, these were rare, with no more than one such SNP in each sample (Table 1 and Figure 1).
Among the transitions caused by EMS, the genome of B. subtilis colony #1 was characterized by a higher prevalence of G-to-A (42) than C-to-T (19) transitions. In B. subtilis colony #3, there was an almost equal proportion of transitions (12 G-to-A and 13 C-to-T). B. subtilis colony #4 was characterized by the lowest number of SNPs, where only 3 SNPs were G-to-A while 13 were C-to-T transitions. Two changes were observed in the B. subtilis control sample (one G-to-A and one T-to-A). A comparison of the genome sequences from the three randomly selected mutagenized single colonies (B. subtilis #1, B. subtilis #3, and B. subtilis #4) and the non-mutagenized B. subtilis control sample showed a strikingly nonrandom mutation distribution pattern in B. subtilis colony #1 (Table S1 and Figure S1).
For example, the presence of either C-to-T or G-to-A coordinated mutation clusters was observed in the genome of B. subtilis colony #1. Moreover, these clusters were organized in the form of genome “stretches” of different lengths (Figure S1). Such a mutation distribution pattern was not as pronounced in the genomes of B. subtilis colonies #3 and #4 (Figure S2). The distributions of mutation types in the genomes of B. subtilis colonies #3 and #4 are shown in Tables S2 and S3 and Figure S2. None of the identified mutations were common between the colonies in terms of their position on the reference genome (Tables S1–S3).
Notably, B. subtilis colony #1 had an unusual type of stretch that switched to the stretch of the opposite type. For example, C-to-T coordinated mutation clusters were switched to stretches of the G-to-A kind (Figure S1). Moreover, whole-genome sequencing (WGS) of B. subtilis colony #1 revealed a significantly different number of clusters and “switches” that spanned the genome compared with B. subtilis colonies #3 and #4.
In addition, there was a significant difference in the mutation cluster density in different regions of the genomic space. WGS data from colony #1 revealed an uneven distribution of mutations in the genome, characterized by strong clustering in the region from 3,500,000 to OriC, whereas clustering in the other regions of the genome was not as dense. Thus, these findings indicate an asymmetric distribution of mutations, consistent with the pattern observed in Gram-negative E. coli.
To confirm the presence of an asymmetric distribution of mutations, a genetic map with a random distribution algorithm in the genome was constructed. For B. subtilis colony #1, the genetic map on the left shows the actual distribution of mutations found in our study, while the genetic map on the right represents a simulated random distribution of these mutations in the genome (Figure 2).
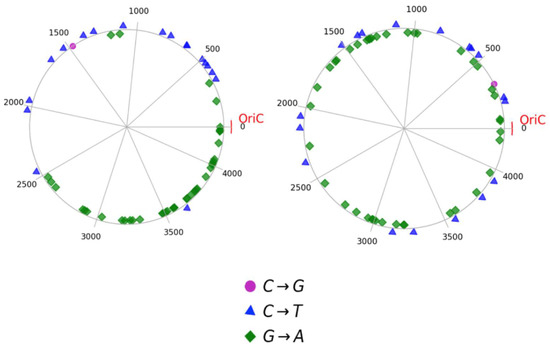
Figure 2.
Comparison of non-random (experimental) and random mutation distribution (simulated). Mutation distribution pattern observed in the genome of B. subtilis colony #1 (left). Simulated random distribution of the mutations in the genome of B. subtilis, based on average of 100,000 simulations of C-to-T, G-to-A and C-to-G transitions (right). OriC is an origin of replication.
4. Discussion
One of the main strengths of the current study was its ability to analyze the effects of mutagenesis from the whole-genome perspective using a next-generation sequencing approach. In the past, mutation distribution was commonly studied from the perspective of mutation hotspots. Later, the incidence of nonrandom mutation distributions in the form of clusters was observed in other organisms and even in cancer genomes, suggesting that mutation clusters are more common and universal than previously believed [11].
One possible explanation for the phenomenon of mutation clusters is that this confers selective advantage for evolution of new traits. One example is somatic hypermutation in adaptive immunity [10]. Interestingly, such asymmetry of mutation distribution was also found in chemically mutagenized organisms such as yeasts and Gram-negative E. coli [10,11]. The fact that the generation of such patterns can be induced by a mutagenic agent is attractive for further studies. Since mutation clusters were discovered in E. coli, we wanted to explore whether this phenomenon also occurs in Gram-positive B. subtilis, potentially indicating a universal phenomenon. We used a next-generation sequencing approach to perform a comprehensive, genome-wide analysis of mutations. Following the original study by Parkhomchuk et al., mutagenesis was induced by the alkylating agent EMS, and individual colonies were randomly selected for analysis by WGS on Ion Torrent PGM [11].
Nonrandom Mutation Distribution
Whole-genome sequencing data allowed us to detect 62 SNPs in mutagenized B. subtilis colony #1, 27 SNPs in colony #3 and 18 SNPs in colony #4. In our pilot study, three genomes of B. subtilis were sequenced after EMS mutagenesis. One mutagenized sample (colony #1) revealed a nonrandom pattern of mutation clustering at the genomic scale.
Notably, the presence of mutation clusters (only C-to-T or G-to-A transitions) coordinated and formed a stretch spanning the entire genome, similar to the pattern observed by Parkhomchuk et al., in E. coli. According to that study, the presence of C-to-T and G-to-A coordinated stretches can be explained by the semiconservative model of DNA replication, since EMS activity results in an O6-alkylguanine that mispairs with thymine; thus, after the second round of replication, G is replaced by A [11]. Considering a DNA stretch where each strand becomes an EMS target, upon segregation of the daughter strands after each replication round, each descendant cell would receive either a C-to-T or a G-to-A transition. The repair process involving conversion of the methylated guanine back to its original state by methyltransferase (MTase) is taken into consideration [21]. Thus, mutation cluster stretches are due to induced mutation fixation by the activity of DNA polymerase and further daughter-strand segregation into individual cells [11].
In addition to the two types of mutation cluster stretches, transition from one stretch type to another was also observed. For example, in B. subtilis colony #1, the switch from one stretch to another was similar to that seen in the E. coli study. An explanation for this feature was also provided by Parkhomchuk et al., i.e., the involvement of homologous recombination in the process of DNA repair. The activity of the alkylating agent results in the addition of an alkyl group to positions of DNA bases. Although strong mutagenicity is present upon the formation of O6-alkylguanine, activity on other bases results in 3-methyl adenine, 3-methyl cytosine, and 1-methyl adenine lesions that lead to replication fork collapse, the repair of which is achieved through sister-strand exchange.
Thus, the resulting hybrid DNA consists of sections of both daughter strands, divided by the recombination site, and it contains lesion records from the parental strands [1]. In the study by Parkhomchuk et al., such a theory was confirmed by sequencing the three recA E. coli mutants after EMS treatment [11]. Analysis revealed a reduction in and even absence of the transition switches in the genomes [10]. Another important feature is the difference in the mutation distribution pattern among the three genomes that were sequenced. Whereas B. subtilis colony #1 was clearly characterized by a significantly high number of mutations and the strong presence of asymmetric features, the genomes of colonies #3 and #4 had fewer mutations, and the asymmetric distribution was less pronounced. While the presence of a stretch of mutation clusters and switches from one transition to another in our study can be explained by known enzymatic processes (repair and DNA replication model), it remains unclear why some genomic regions were subjected to extensive mutation clusters while the remainder of the genome remained intact. In principle, several factors might contribute, at least in part, to the formation of mutation clusters.
Firstly, the authors of the original study suggested that there may be variation in the number of repair enzymes in each cell. Therefore, fluctuations in the number of repair proteins may contribute to differences in the mutation density in the genomes [10]. Secondly, the authors also proposed a theory of competition between the processes of DNA repair and replication. To test this, the mutagenized E. coli was maintained in PBS solution to achieve a nonreplicating state. After plating, restoration of growth conditions, and subsequent sequencing of three E. coli genomes, changes in mutation pattern were detected. In one colony, a significant reduction in the number of mutations was observed; in the remaining two genomes, the position of mutations was predominantly within a replication terminus region [10].
Thus, according to Parkhomchuk et al., since the work was conducted in exponentially growing cultures, the replication process within the OriC region in the majority of cells was already completed [11]. After EMS treatment, the cells were transferred to a nutrient-deficient environment where the replication process around the terminus region could be completed, leading to the conversion of lesions to mutations preceding the repair [11].
However, the opportunity to replicate in the OriC area is lower. Hence, the lesions were probably subjected to repair prior to the replication and further fixation of mutations. Moreover, according to a recent publication by Chan and Gordenin, the study on E. coli remains the only example where replication preceded the repair, leading to the formation of mutation clusters in the genome [10].
It is also worth mentioning that such intergenomic differences in the number of mutations that were found in our study and that by Parkhomchuk et al. could have been caused by the different physiological state of bacteria. Since growth occurred in LB broth and the physiological state of E. coli in the OD600 range of 0.3–1.0 fluctuates, this may have somehow affected the response of individual cells to EMS treatment and led to differences in mutation number among several samples [11,22]. This possibility may have also occurred in B. subtilis.
5. Conclusions
Multiple studies on different biological systems have reported the presence of mutation clusters in the genomic space. Whole-genome sequencing of chemically treated Gram-negative E. coli also revealed a nonrandom mutation distribution. Correlations between individual molecular events were detected at the single-colony level using modern high-throughput sequencing technology.
Thus, mutation clusters appear to arise in response to both endogenous and exogenous stressors. The underlying mechanisms are poorly understood in both cases. In this work, we used this strategy to extend earlier studies in Gram-negative bacteria to Gram-positive B. subtilis to determine whether this phenomenon is universal. The next-generation sequencing approach allowed the analysis of several mutagenized B. subtilis genomes that followed a nonrandom mutation distribution pattern with previously described signatures, such as stretches and switches. Lastly, it is not clear whether clustering of mutations is due to (i) a clustering effect of EMS damage on the DNA duplex with certain regions being better alkylated, (ii) unequal DNA repair and DNA recombination/replication/transcription, or (iii) natural selection, whereby clustered mutations may have less of an effect on cell fitness. All of these possibilities will be addressed in a future study. The main concern regarding this preliminary dataset is that the number of sequenced clones (three) is not sufficient to make final conclusions about the distribution pattern of mutations.
Future studies may confirm our preliminary conclusions on a larger dataset, which will provide a better understanding of the factors that regulate mutation dynamics and how these controls cellular processes in bacteria. In our work, we set out to explore how this analysis can help in observing, at the single-colony level, the interactions between the induced mutagenesis contributing to mutation generation and clustering.
Supplementary Materials
The following supporting information can be downloaded at https://www.mdpi.com/article/10.3390/sym14071431/s1: Figure S1: Distribution of mutation types in the genome of B. subtilis colony #1; Figure S2: Distribution of mutation types in the genome of B. subtilis colonies #3 and #4. Comparison of nonrandom and simulated random mutation distribution; Table S1: A comparative table of detected C-to-T and G-to-A transitions in B. subtilis colony #1 and control sample; Table S2: A comparative table of detected C-to-T and G-to-A transitions in B. subtilis colony #3 and control sample; Table S3: A comparative table of detected C-to-T and G-to-A transitions in B. subtilis colony #4 and control sample.
Author Contributions
Conceptualization, P.T. and Y.R.; methodology, P.T.; software, R.N.; validation, R.N.; investigation, R.N.; data curation, P.T.; writing—original draft preparation, R.N.; writing—review and editing, P.T.; visualization, R.N.; supervision, Y.R.; project administration, P.T.; funding acquisition, P.T. All authors read and agreed to the published version of the manuscript.
Funding
This research was funded by the Science Committee of the Ministry of Education and Science of the Republic of Kazakhstan (Grant No. AP09058045).
Institutional Review Board Statement
Not applicable.
Informed Consent Statement
Not applicable.
Data Availability Statement
Raw sequences were submitted to the Short Reads Archive at the National Center for Biotechnology Information (B. subtilis col#4, SRA accession SRS2354581; B. subtilis col#3, SRA accession SRS2353007; B. subtilis col#1, SRA accession SRS2353006; B. subtilis control sample, SRA accession SRS2352765).
Acknowledgments
The authors would like to thank V. Ogryzko from Gustave Roussy for the support, Ian Carr and Agne Antanaviciute from the NGS facility of Leeds University, and Dmitri Parkhomchuk from the Helmholtz Center for Infection Research for assistance with data analysis.
Conflicts of Interest
The authors declare no conflict of interest.
References
- Cairns, J.; Overbaugh, J.; Miller, S. The origin of mutants. Nature 1988, 335, 142–145. [Google Scholar] [CrossRef] [PubMed]
- Shee, C.; Gibson, J.L.; Rosenberg, S.M. Two Mechanisms Produce Mutation Hotspots at DNA Breaks in Escherichia coli. Cell Rep. 2012, 2, 714–721. [Google Scholar] [CrossRef] [PubMed]
- Gabriel, A.; Dapprich, J.; Kunkel, M.; Gresham, D.; Pratt, S.C.; Dunham, M.J. Global mapping of transposon location. PLoS Genet. 2006, 2, e212. [Google Scholar] [CrossRef] [PubMed]
- Goodarzi, H.; Hottes, A.K.; Tavazoie, S. Global discovery of adaptive mutations. Nat. Methods 2009, 6, 581–583. [Google Scholar] [CrossRef]
- Hall, B.G. Selection-induced mutations. Curr. Opin. Genet. Dev. 1992, 2, 943–946. [Google Scholar] [CrossRef]
- Heffner, C.S.; Herbert Pratt, C.; Babiuk, R.P.; Sharma, Y.; Rockwood, S.F.; Donahue, L.R.; Eppig, J.T.; Murray, S.A. Supporting conditional mouse mutagenesis with a comprehensive cre characterization resource. Nat. Commun. 2012, 3, 1218. [Google Scholar] [CrossRef]
- Lutsenko, E.; Bhagwat, A.S. Principal causes of hot spots for cytosine to thymine mutations at sites of cytosine methylation in growing cells. A model, its experimental support and implications. Mutat. Res. 1999, 437, 11–20. [Google Scholar] [CrossRef]
- Burch, L.H.; Yang, Y.; Sterling, J.F.; Roberts, S.A.; Chao, F.G.; Xu, H.; Zhang, L.; Walsh, J.; Resnick, M.A.; Mieczkowski, P.A.; et al. Damage-induced localized hypermutability. Cell Cycle 2011, 10, 1073–1085. [Google Scholar] [CrossRef][Green Version]
- Wyrick, J.J.; Roberts, S.A. Genomic approaches to DNA repair and mutagenesis. DNA Repair 2015, 36, 146–155. [Google Scholar] [CrossRef]
- Chan, K.; Gordenin, D.A. Clusters of Multiple Mutations: Incidence and Molecular Mechanisms. Annu. Rev. Genet. 2015, 49, 243–267. [Google Scholar] [CrossRef]
- Parkhomchuk, D.; Amstislavskiy, V.; Soldatov, A.; Ogryzko, V. Use of high throughput sequencing to observe genome dynamics at a single cell level. Proc. Natl. Acad. Sci. USA 2009, 106, 20830–20835. [Google Scholar] [CrossRef] [PubMed]
- Fu, L.M.; Fu-Liu, C.S. Is Mycobacterium tuberculosis a closer relative to Gram-positive or Gram–negative bacterial pathogens? Tuberculosis 2002, 82, 85–90. [Google Scholar] [CrossRef] [PubMed]
- Klotoe, B.J.; Kacimi, S.; Costa-Conceicão, E.; Gomes, H.M.; Barcellos, R.B.; Panaiotov, S.; Haj Slimene, D.; Sikhayeva, N.; Sengstake, S.; Schuitema, A.R.; et al. Genomic characterization of MDR/XDR-TB in Kazakhstan by a combination of high-throughput methods predominantly shows the ongoing transmission of L2/Beijing 94-32 central Asian/Russian clusters. BMC Infect. Dis. 2019, 19, 553. [Google Scholar] [CrossRef] [PubMed]
- Bryant, J.; Chewapreecha, C.; Bentley, S.D. Developing insights into the mechanisms of evolution of bacterial pathogens from whole-genome sequences. Future Microbiol. 2012, 7, 1283–1296. [Google Scholar] [CrossRef]
- Brito, P.H.; Chevreux, B.; Serra, C.R.; Schyns, G.; Henriques, A.O.; Pereira-Leal, J.B. Genetic Competence Drives Genome Diversity in Bacillus subtilis. Genome Biol. Evol. 2017, 10, 108–124. [Google Scholar] [CrossRef]
- Zhang, Y.; Bai, X.; Fan, R.; Wang, Z. Deviation-Sparse Fuzzy C-Means With Neighbor Information Constraint. IEEE Trans. Fuzzy Syst. 2019, 27, 185–199. [Google Scholar] [CrossRef]
- Cupples, C.G.; Miller, J.H. A set of lacZ mutations in Escherichia coli that allow rapid detection of each of the six base substitutions. Proc. Natl. Acad. Sci. USA 1989, 86, 5345–5349. [Google Scholar] [CrossRef]
- Miller, J.H. A Short Course in Bacterial Genetics—A Laboratory Manual and Handbook for Escherichia coli and Related Bacteria. Cold Spring Harbor 1992; Cold Spring Harbor Laboratory Press: New York, NY, USA, 1992; p. 456. ISBN 0-87969-349-5. [Google Scholar]
- Chomczynski, P.; Mackey, K.; Drews, R.; Wilfinger, W. DNAzol®: A Reagent for the Rapid Isolation of Genomic DNA. BioTechniques 1997, 22, 550–553. [Google Scholar] [CrossRef]
- Shevtsov, A.; Tarlykov, P.; Zholdybayeva, E.; Momynkulov, D.; Sarsenova, A.; Moldagulova, N.; Momynaliev, K. Draft Genome Sequence of Rhodococcus erythropolis DN1, a Crude Oil Biodegrader. Genome Announc. 2013, 1, e00846-13. [Google Scholar] [CrossRef]
- Rye, P.T.; Delaney, J.C.; Netirojjanakul, C.; Sun, D.X.; Liu, J.Z.; Essigmann, J.M. Mismatch repair proteins collaborate with methyltransferases in the repair of O(6)-methylguanine. DNA Repair 2008, 7, 170–176. [Google Scholar] [CrossRef]
- Sezonov, G.; Joseleau-Petit, D.; D’Ari, R. Escherichia coli Physiology in Luria-Bertani Broth. J. Bacteriol. 2007, 189, 8746–8749. [Google Scholar] [CrossRef] [PubMed]
Publisher’s Note: MDPI stays neutral with regard to jurisdictional claims in published maps and institutional affiliations. |
© 2022 by the authors. Licensee MDPI, Basel, Switzerland. This article is an open access article distributed under the terms and conditions of the Creative Commons Attribution (CC BY) license (https://creativecommons.org/licenses/by/4.0/).