Article

Dendrographic Hologram Theory: Predictability of Relational Dynamics of the Event Universe and the Emergence of Time Arrow

1
Felsenstein Medical Research Center, Beilinson Hospital, Petach Tikva 4941492, Israel
2
Sackler Faculty of Medicine, Tel Aviv University, Tel Aviv 6934206, Israel
3
Department of Neurology, Rabin Medical Center, Petach Tikva 4941492, Israel
4
Department of Mathematics, Faculty of Technology, Linnaeus University, 351 95 Växjö, Sweden
*
Author to whom correspondence should be addressed.
Symmetry 2022, 14(6), 1089; https://doi.org/10.3390/sym14061089
Submission received: 10 April 2022 / Revised: 16 May 2022 / Accepted: 21 May 2022 / Published: 25 May 2022
(This article belongs to the Special Issue Shape Dynamics)

Abstract

:
Recently we started the development of Dendrographic Hologram Theory (DH-theory). It is based on the novel mathematical representation of the relational event universe (in the spirit of Smolin et al.). Elementary events are represented by branches of dendrograms, finite trees that are generated from data with clustering algorithms. In this context, we studied the dynamics of the event universe generated by the appearance of a new event. Generally, each new event can generate the complete reconstruction of the whole dendrogramic universe. However, we found (via numerical simulation) unexpected stability in this universe. Its events are coupled via the hierarchic relational structure, which is relatively stable even with respect to the random generation of new events. We also observed the regularity patterns in the location of new events on dendrograms. In the course of evolution, the dendrogram’s complexity increases and determines the arrow of time in the event universe. We used the complexity measure from particle shape dynamics, which was shown to increase in both directions away from a Janus point and thus determine the arrow of time in symmetrical manner away from a Janus point. The particle shape dynamics theory is a relational theory with close ideological resemblance to DH-theory, as both rely on Mach’s principle and Leibniz’s relationalism and principles. By using the complexity measure on dendrograms and its p-adic string representation, we demonstrate the emergence of a time arrow from the p-adic zero-dimensional field, where space and time are absent.

1. Introduction

In a series of papers [1,2,3], we developed the basics of Dendrographic Hologram Theory (DH-theory). This theory grew from information physics (starting with Wheeler’s “it from bit” [4]) and relational event representation of the universe (Smolin et al. [5,6,7,8,9,10,11,12,13]). The latter approach was combined with methods of p-adic theoretical physics, in which physical structures are represented by p-adic numbers (see [14,15,16,17,18,19,20,21,22,23,24,25,26,27] for applications to strings and quantum theory; see [28,29,30] for applications to disordered systems (spin glasses)). In contrast to the mainstream, we explore not the number theoretical methods, but the treelike geometry in that p-adic numbers (see Appendix A) are visualized as the branches of the p-adic tree (a homogeneous tree with p > 1 edges leaving each vertex). (Treelike geometry was heavily explored in cognitive modeling and psychology [31,32,33,34,35,36]; see also our recent paper on applications of DH-theory to the medical diagnostics of mental disease [37]).
In DH-theory, elementary events such as outcomes of measurements are represented by the branches of a finite tree, a so-called dendrogram (Cf. with discrete and fractal approach to quantum physics [38,39]). The latter by itself represents a complex event combined with elementary events. A dendrogram can be generated from experimental data with the aid of a hierarchic clustering algorithm (although the form of a dendrogram depends on the concrete algorithm, the general structure of the theory is the same for all basic algorithms. In our studies, we use the simplest algorithms of 2-adic, 0/1 (yes-no) clusterization). One of the aims of development of DH-theory is to merge classical and quantum descriptions; the same dendrogramic description of events is used in both cases. The degree of classicality and quantumness of events is characterized by a dendrogram’s size; an increase in size is treated as an increase in classicality (see, e.g., [2] for application to the violation of CHSH inequality). The merging of classical and quantum descriptions might lead to the resolution of the problem of the creation of quantum gravity.
In complete accordance with the ontic–epistemic approach to science [40,41,42,43,44,45], DH-theory has two counterparts. The epistemic one is devoted to special (hierarchically relational) structuring of knowledge obtained by an observer from experiments. The ontic one gives the mathematical model of “the universe as it is.” In our theory, the epistemic and ontic descriptions are naturally coupled: They are based on finite and infinite trees, respectively. This paper is based on the results of numerical simulation, and we did not address the ontic model (cf. Refs. [1,2,3]). The epistemic counterpart of DH-theory is briefly presented in Section 2, and a few words about its ontic counterpart are said in Section 3.
We studied the dynamics of the event universe generated by the appearance of a new event. Generally, each new event can generate the complete reconstruction of the whole dendrogramic universe. The elementary events created up to the moment t = k are hierarchically ordered via the dendrogram’s structure. The appearance of a new event at t = k + 1 can, in principle, destroy the previous hierarchic structure. The dynamics that are local in the physical space becomes nonlocal in dendrogram space. Thus, all events are permanently in dynamic motion; an event that happened a milliard years ago is not frozen at the same point in dendrogram space; contemporary events disturb it and vice versa: The position of a newly generated event in the dendrogram space is determined by all previous events. The dendrogram universe is in permanent motion and recombination.
Nevertheless, this event motion has some degree of regularity and stability. The appearance of a new event does not generate a totally random redistribution of events. Only very special dendrogramic configurations can be created with high probability.
Total recombination of the events and change in the structure of the event universe can also happen, but with relatively small probability (a kind of catastrophic perturbation of the otherwise stable hierarchic interrelation between events in the universe).
This (unexpected) stability and regularity of the hierarchically coupled event universe is one of the main outputs of our extensive numerical simulation. We understand “stability” as the relative stability of the dendrogram’s structure. The majority of previous events preserve their positions. The number of dendrogram levels is also stable (under the appearance of just one new event). We understand “regularity” as the following feature of the dendrogramic dynamics. The branches of a dendrogram can be represented by vectors with 0/1 coordinates or the corresponding natural numbers in the binary representation. At moment t = k, a dendrogram Dn representing n elementary events has N(Dn) levels. A new elementary event generated at t = k + 1 can in principle be any natural number between 0 and 2N(Dn). However, this new event can take on only very special values (in natural number representation).
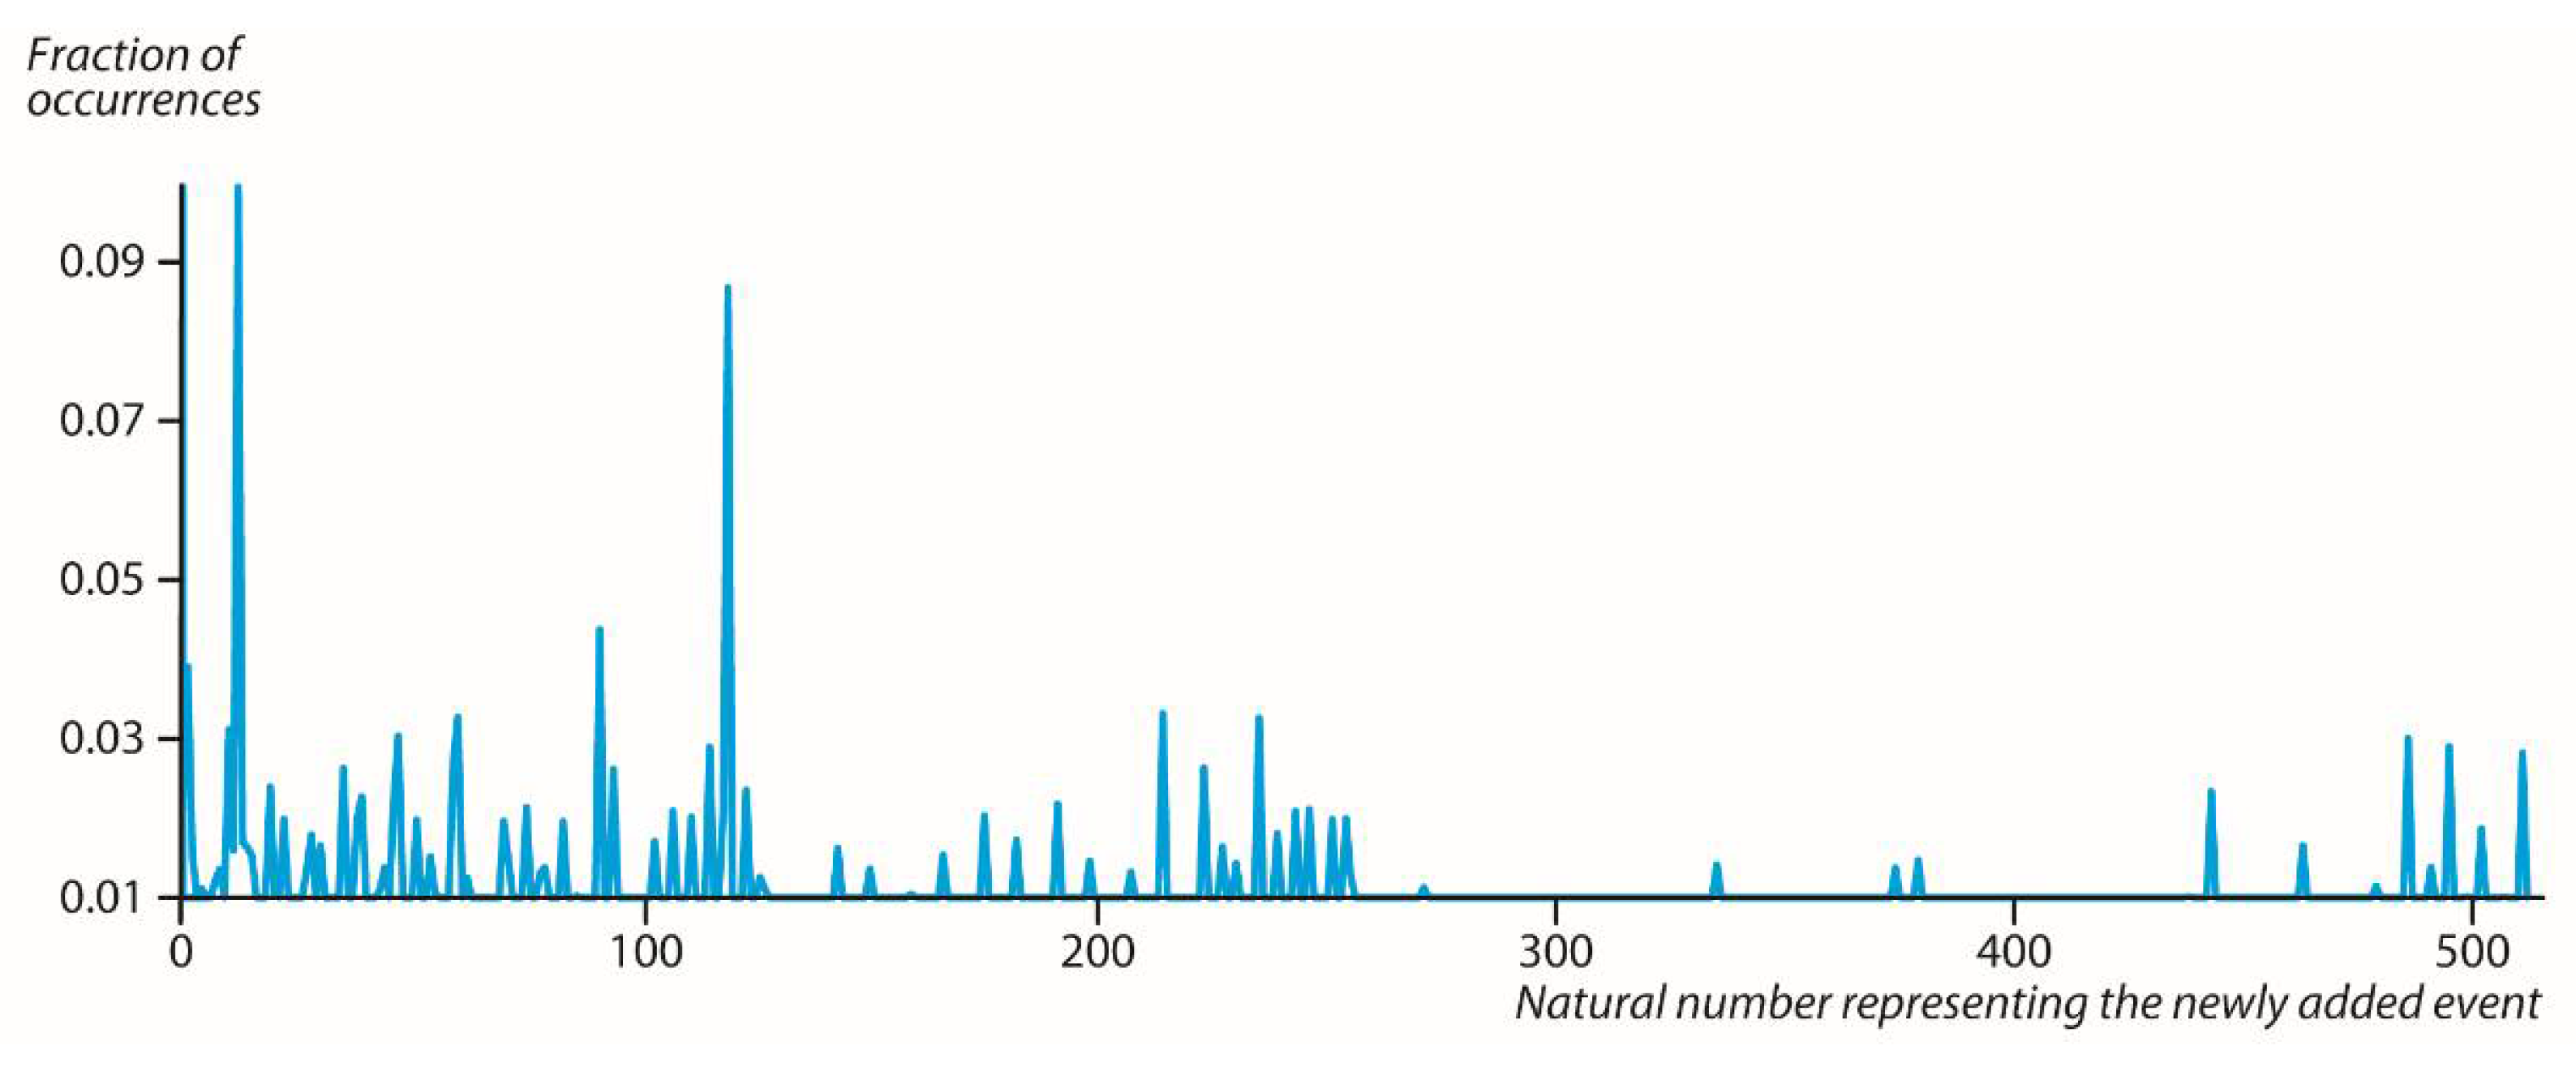
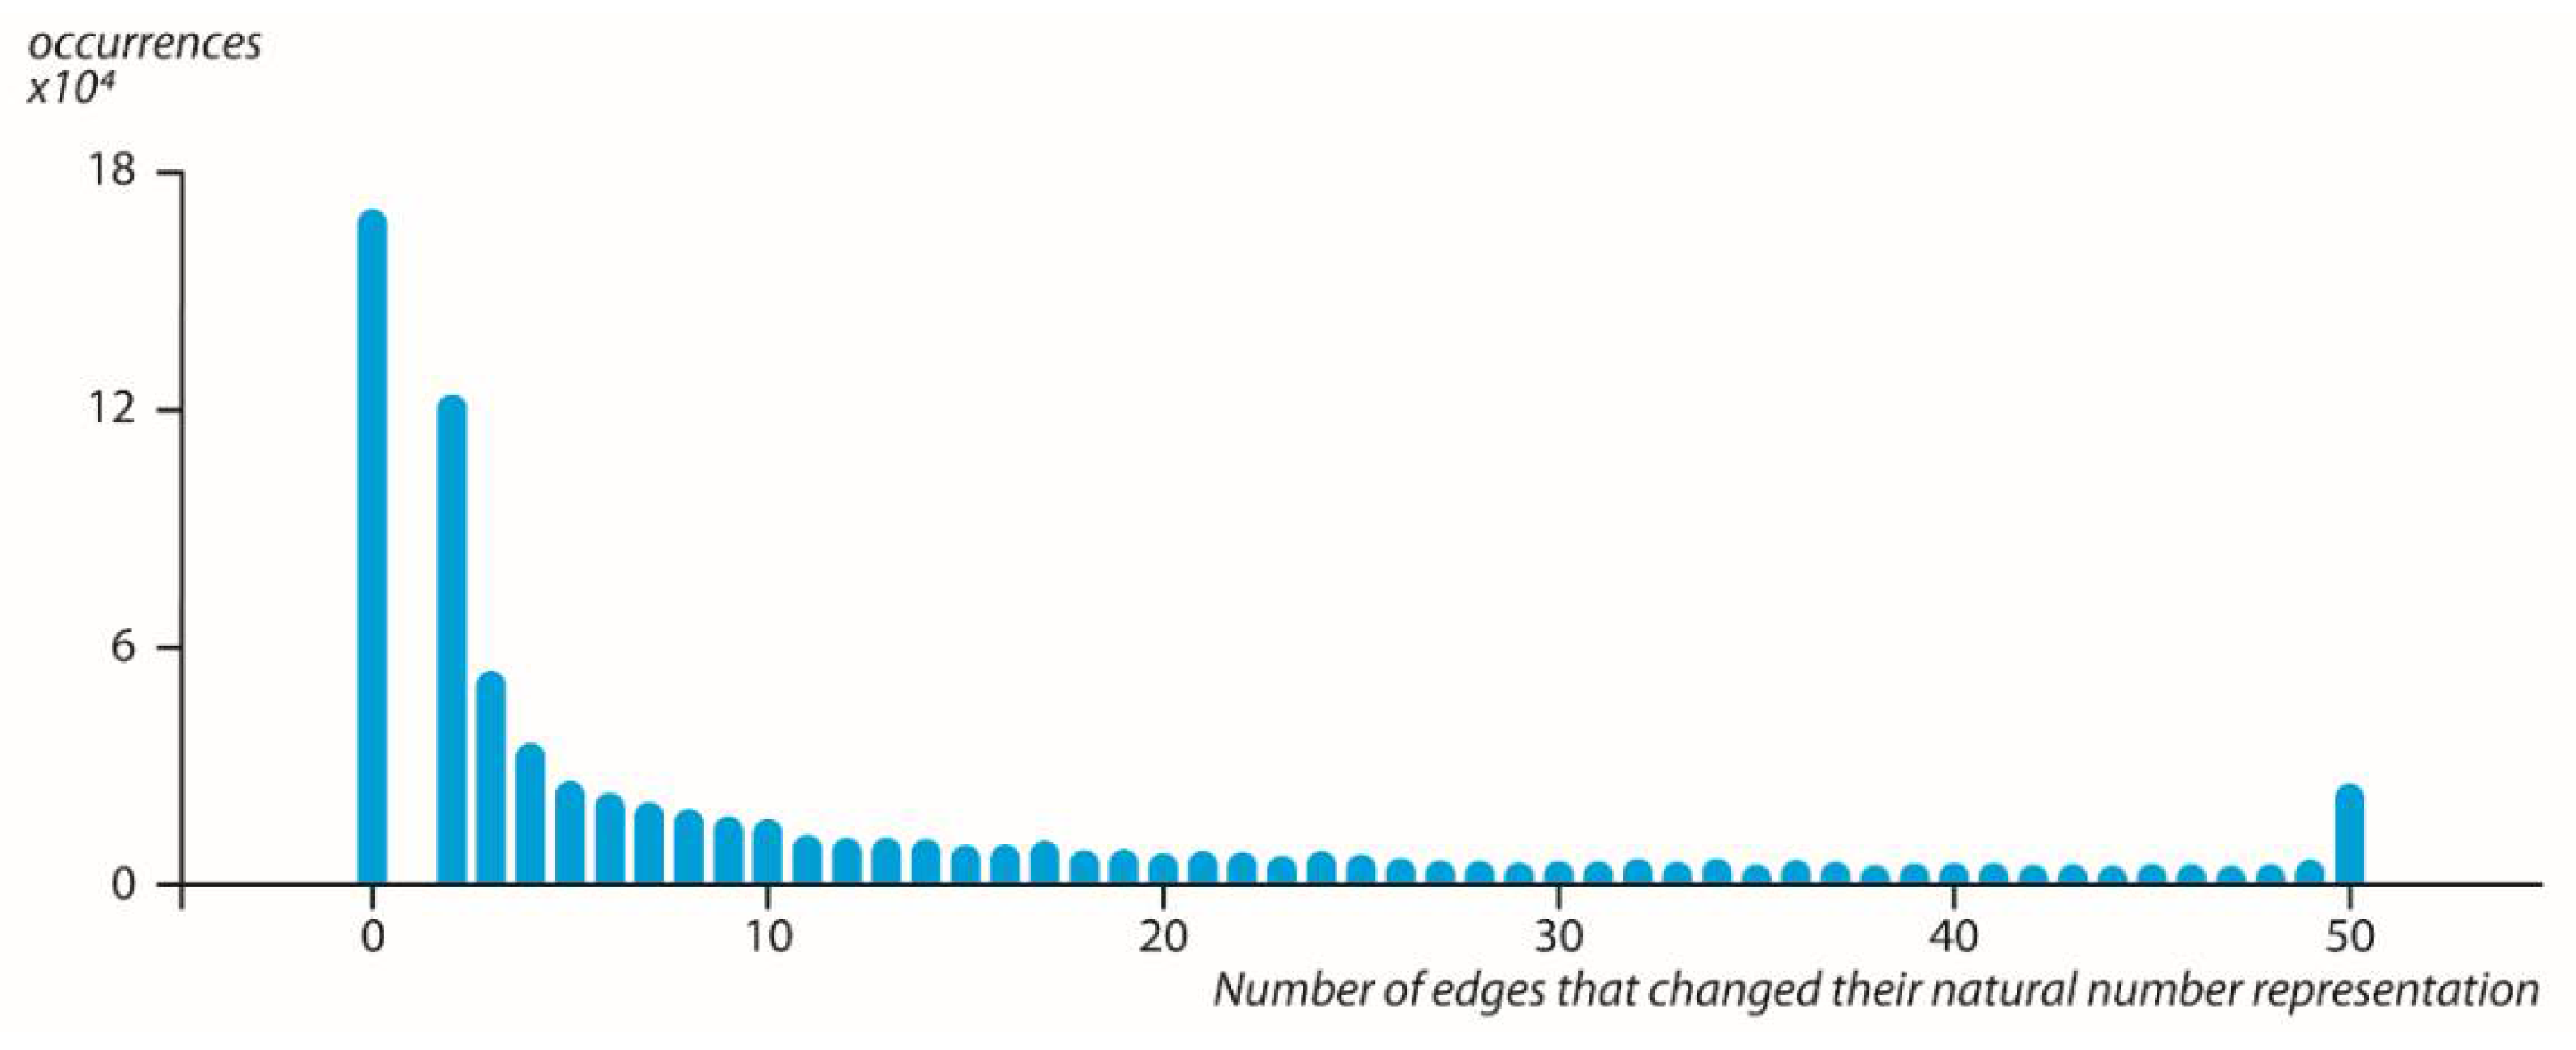
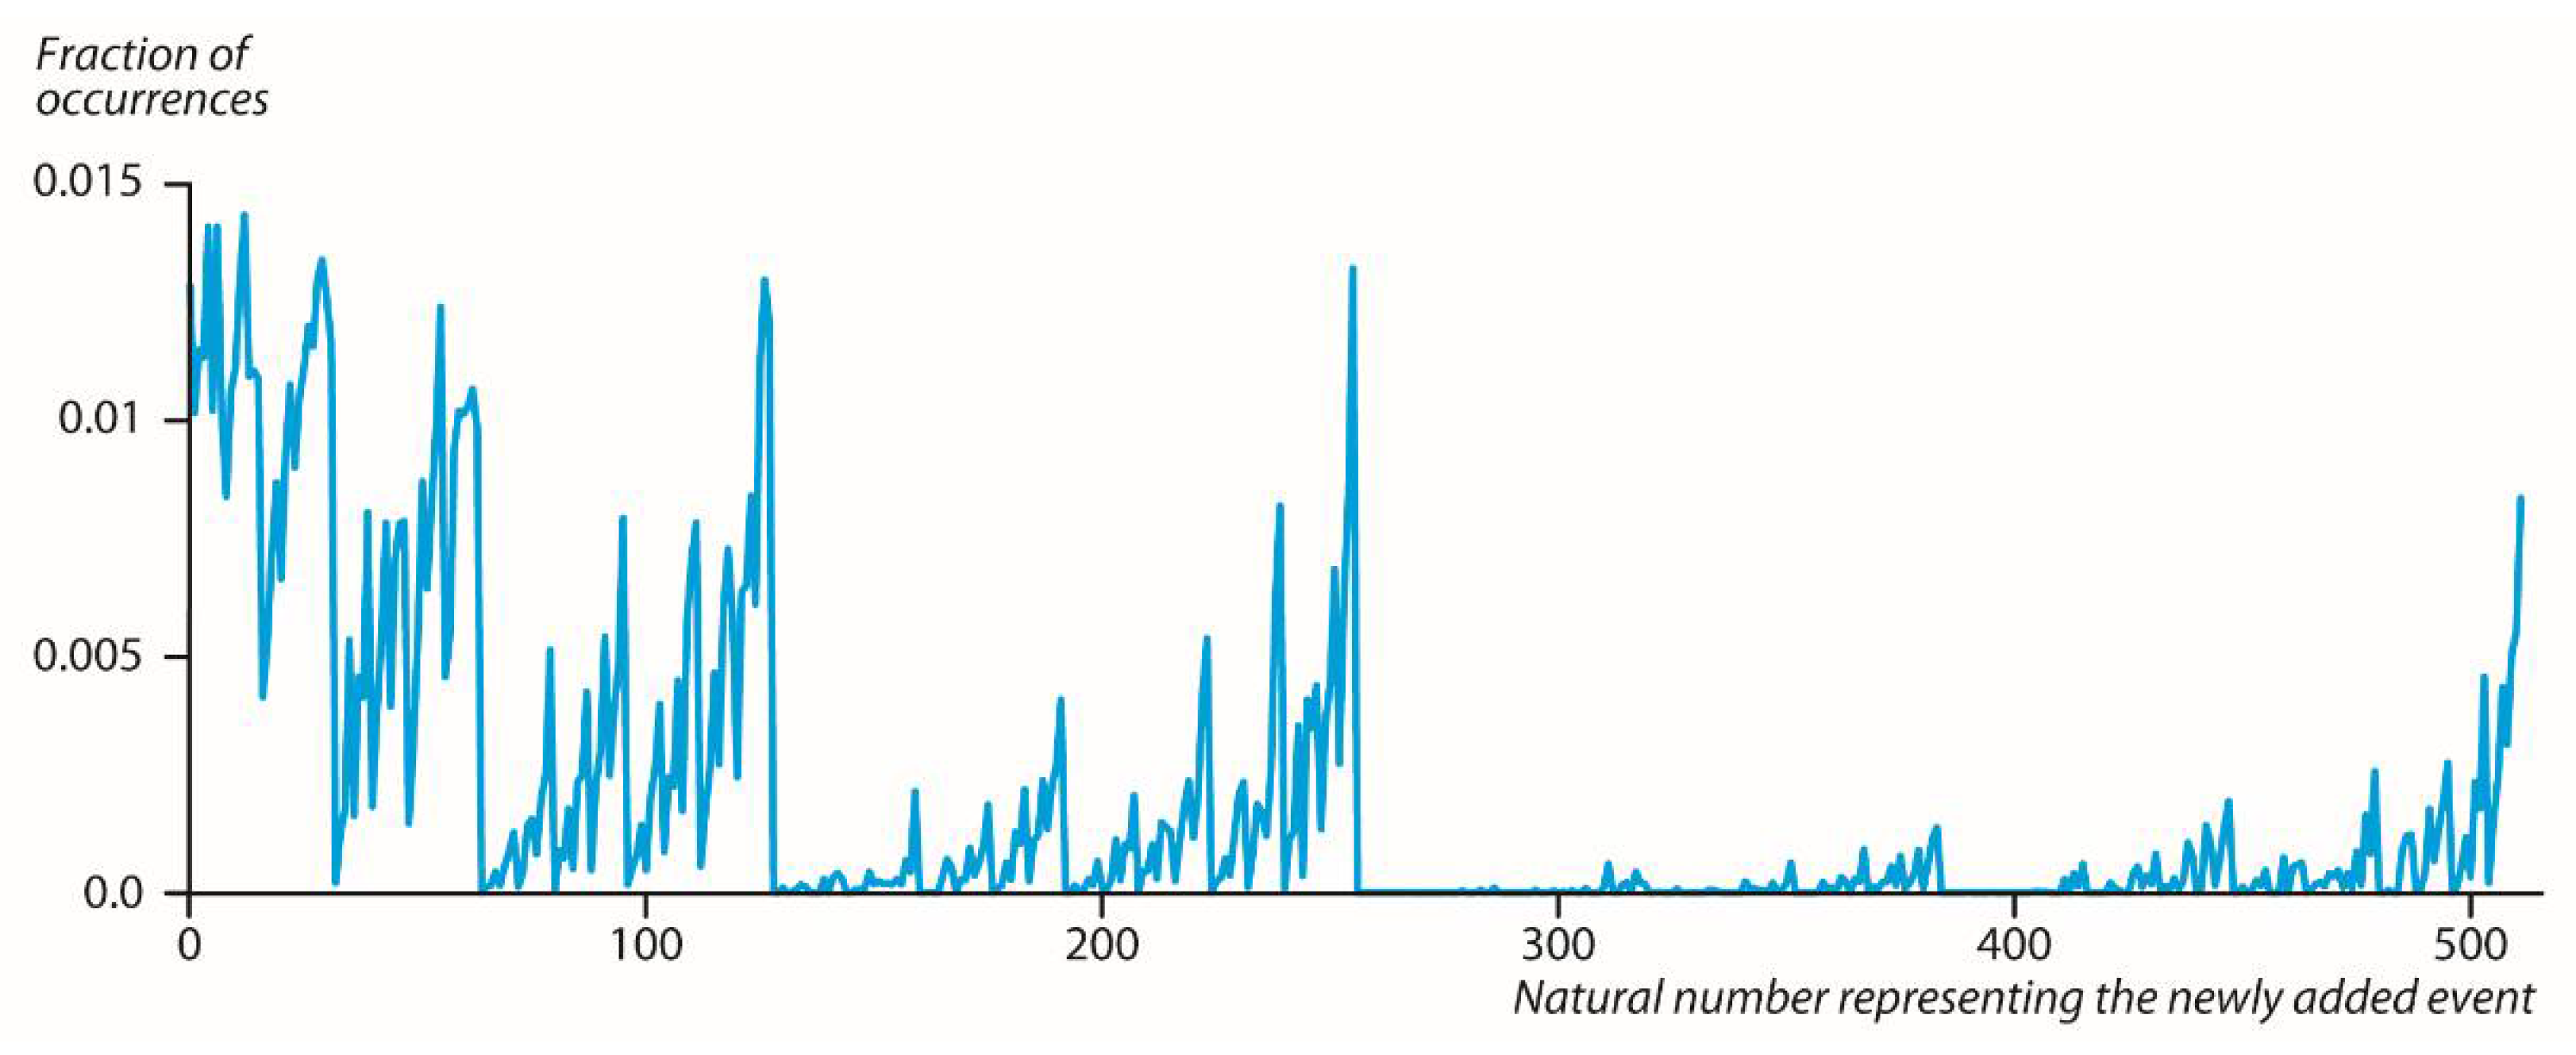
We show that even random generation of a new event does not induce a (statistically) crucial redistribution of events on the dendrogram. The graphs of Figure 1 and Figure 2 demonstrate some patterns of regularity. As we can also see from Figure 3, the dendrogramic event universe is essentially stable w.r.t. in the appearance of a new event: With high probability, most events do not change their tree representation.
As was noted, the dendrogram dynamics induced not only a redistribution of events, but also increased the dendrogram’s size and thus its number of levels. Quite trivially, the number of dendrogram levels N = N(Dn) for dendrogram Dn with n events increases with the increase in the number of events n. Similarly, for entropy, N(Dn) can be used to determine the arrow of time. However, in contrast to entropy (governed by the second law of thermodynamics, N(Dn) it has local minimums on the increasing phone.
The increasing number of levels, which is an expectable feature, is not satisfactory enough to serve as a “thermodynamic” law that concerns only the scale-free structure of the dendrogram (in a similar manner we obtained scale-free features of dendrograms as the ratio of dendrogramic constants of nature in a recent study [3]). Moreover, we need a macro-state function that, given a certain initial size of a dendrogram, will give us some probabilities on the future macro state in the dynamical development of the dendrogram or p-adic string representation of the future events. Each of the macro-states will have a finite number of possible micro states. These micro states are all possible dendrogram structures, where n is the number of events. The result of evaluating a certain structural feature of all these micro states will correspond to the same macro state value, which is event related. This kind of state function, like entropy, will provide predictive tools for the dendrogramic dynamics of any developing system of events. To capture the scale-free dynamic features of dendrogram dynamics, we use the shape complexity measure, which was introduced by Barbour et al. in the framework of N-body shape dynamics theory [46,47]. In this context we suggest the following definitions.
Definition 1.
micro state: Unique dendrogramic structure (coded in a p-adic manner) of relations between events or an event’s p-adic representation of its relation to the rest of the events.
Definition 2.
macro state: Certain structural feature value that is the same for different dendrogram structures or a different p-adic representation of events.
Shape dynamics is a field theory describing gravity differently than general relativity. Although the differences between the two theories in most situations are indistinguishable, the two theories have different ontology. Some differences to note are that shape dynamics is not based on space–time representation; instead, the entities in shape dynamics are three-dimensional geometries fitted together by relational principles. These fitted relations results in temporal relationalism: Time emerges from physical changes in shapes. The relational principle of shape dynamics is the Mach–Poincare Principle:
Physical (or relational) initial configurations and their first derivatives alone should determine uniquely the future evolution of the system [47].
This principle is implemented through an intrinsic derivative, which is called best matching. Best matching allows one, by using only relational data, to say when points are at the same position at different temporal instances. Moreover, Barbour et al. [10,11,12,13,14,15] formulated an intrinsic feature of a system serving as a physically meaningful labeling of change, where the evolution of the structure of a system is towards configurations (i.e., shapes) that maximize the complexity of the system. In what follows we will define this complexity measure in the event/dendrogramic universe. We note that although previous studies in shape dynamics [9,10,11,12] showed that the complexity increases in both directions away from a Janus point and thus determines the arrow of time in a symmetrical manner away from a Janus point, we cannot produce data in reverse temporal order and thus cannot find a Janus point with its two opposite symmetrical time arrow directions. Thus, our results will indicate an arrow of time directed from past to future only.
The p-adic universe that arises in DH-theory is background independent and fully relational. These properties are in accordance with the loop approach to quantum gravity (LQG) but in contrast to string theory and canonical methods [5]. In contrast to all quantum gravity theories, DH-theory is inherently “quantized,” not in the regular quantum theory quantization scheme but rather in the unique structure of the p-adic number field. Thus, in DH-theory we do not need to quantize any fields or properties.
We show in Section 5 that the shape complexity measure can be used as a statistical law of the dynamics of the evolving dendrograms. This statistical law eventually leads to the determination of the arrow of time in a manner similar to the second law of thermodynamics but with different consequences, which will be discussed in Section 7, and then when operating with entropy [10,46,47].
Our main motivation in this paper is to have the methods and tools to predict the behavior of complex systems. In particular, in the framework of medical diagnosis and as a follow up to our recent study on EEG signals of the brain, these tools will help us to anticipate epileptic and psychotic seizures [37].
The next two sections are devoted to a brief representation of the foundations of DH-theory. In principle, the reader can jump directly to Section 4, where we consider the (numerically simulated) dendrogramic dynamics for the simplest physical dynamics given by a randomly generated time series. The latter is transferred into the time series of dendrograms and we study its statistical properties.

2. Brief Introduction to Epistemic DH-Theory

2.1. Info—Physical Principles

Here we briefly recall the basic principles of DH-theory [1,2,3]. This theory is about the representation of special information in the physical universe: event representation (cf. Smolin et al. [5,6,7,8,9]).
Principles:
(P1) Event physics. The basic structures in nature are events.
(P2) Relational structures. Interrelations between events are basic structures of the theory.
(P3) Hierarchy. Relational structures are hierarchic.
(P4) Operational representation. An observable A is a composition of preparation and measurement procedures; P and M:A = MP (first preparation and then measurement).
(P5) Event picture of experimental data. Experimental data are used to form the event picture. Elementary events are single datapoints; events are subsets of an experimental dataset.
(P6) Relational observables. Data collected for a physical observable A serve as the input for algorithm Λ for the detection of a relational structure. The composition R = Λ A(=Λ MP) is a relational observable (First preparation, then measurement, and finally clustering algorithm).
(P7) Free will. The assumption of an observer’s free will to select different observables (e.g., axes of PBSs) is extended and an observer O has free will to select an event-relational structure expressed via algorithm Λ.

2.2. Mathematical Formalism

We list the main mathematical methods serving as the base of the DH-theory [1,2,3].
(M1) Hierarchic clustering algorithms. Relational structures are determined by hierarchic clustering algorithms.
(M2) Dendrogramic (treelike) representation. Outputs of relational observables are dendrograms (finite trees). Dendrograms represent events, and their branches (points on the dendrogram’s basement) represent elementary events corresponding to the measurement’s outcomes.
(M3) Ultrametricity. A natural metric on a dendrogram is ultrametric based on the common root of two branches, connecting the tree’s root with points of the basement of a dendrogram.
(M4) P-adic number encoding of elementary events. Elementary events can be encoded by natural numbers, and the ultrametric is given by the p-adic absolute value (see Appendix A).
For a big dataset, the set of all subsets is too big. To make the situation numerically treatable, our modeling is restricted to time series, and for each natural number L, observer O can split the series into blocks of length L. These are L-events. Denote this event-selection operation with the symbol Φ = Φ(L). The model is restricted to relational observables in the form R = Λ Φ M P. Consider clustering algorithm Λ = Λ (p) with a p-branching structure, where p > 1 is a natural number.
A p-adic tree is a homogeneous tree such that, for each node, there is one incoming and p outcoming wedges. A p-adic tree with n levels (branches of length n) is denoted by the symbol Z(p,n). Its branches are encoded either by vectors x = (x0 x1 … x(n − 1)), xj = 0,…, p − 1 or by natural numbers {0, 1,…, pn−1}. In the latter representation, Z(p,n) has a ring structure with mod pn addition, subtraction, and multiplication (see Appendix A).
(M5) Configuration space. The relational observable R = Λ(p) Φ(L) M P takes values in Z(p,n), where n = L − 1.

2.3. Explanatory Comments

(C1) Causal vs. relational structures. Typically, causal structures are employed as event-relational structures. However, this leads to the apotheosis of the role of space time (or at least time, as in the works of Smolin et al. [5,6,7,8,9,10]). The use of space time and causal structures based on it led to tremendous success in natural science. However, events can be related not only via causality, but also via more complex relational structures. Moreover, one of the most important physical theories, quantum mechanics, is acausal, at least in some basic interpretations. (Here we do not discuss “quantum nonlocality,” but measurement acausality, which was emphasized by von Neumann. This issue is related to the solution of measurement problems in quantum mechanics and to theories with hidden variables.)
(C3) Bohr’s principle of complementarity and event physics. Bohr repeatedly stated that outcomes of physical observables are not objective properties of systems but generated in the process of a measurement. This is the basic part of his principle of complementarity [48]. However, the notion of a system without objective properties is not as foundationally attractive as the notion explored in classical physics. This led to attempts to define systems operationally via measurement outputs. (In private discussions with one of the authors (A.K.H.), Zeilinger defined a photon as photodetector’s click. It is even more natural to consider this click not as the exhibition of the physical system’s existence (in this case, a photon), but as an event.)
(C4) Operational approach to observation. This approach is widely explored in quantum measurement theory. It is closely related to the Copenhagen viewpoint that quantum mechanics is about state preparation and measurement procedures, P and M, respectively, and outputs of the latter. (In particular, originally Feynman’s integral formalism was rejected by Bohr as unphysical, since it handles system trajectories between P and M.) However, most operational researchers still refer to systems.
(C5) Real vs. ultrametric representations. Traditionally, the event approach to physics has been handled within real-number representation by emphasizing the role of space time and the causal structure in it (e.g., Smolin et al.). Geometrically this is a straight-line (multi-dimensional) picture of the universe. However, generally hierarchic relational structures have treelike geometry. This leads to ultrametric representation. One of the simplest and at the same time most well-developed of them is based on p-adic trees. We remark that if p = 1, then the p-adic tree trivializes and coincides with a discretized real line—a lattice.
(C6) Free will vs. total determinism. In DH-theory, the hypothesis that an observer O has free will plays an important role. In physics, free will is treated restrictively as the ability of O to select settings of measurement devices, e.g., in Bell-type experiments. In the absence of free will the selection of experimental settings would be predetermined. The latter situation is well accommodated under the superdeterminism hypothesis. Although most quantum physicists accept the free will assumption, others do not. Typically, free will vs. superdeterminism are considered mutually exclusive foundational viewpoints. In DH-theory these viewpoints can be brought closer together, as superdeterminism exists as a dynamic law that connects one event to another (see the action principle in [1,3]) and free will exists alongside it with the choice, or rather, the willingness, of how many events the observer decides to observe and how he separate these events into different sub-systems of his observable universe [2]. Thus, in every choice the observer makes his observable universe will still be superdetermined by the dynamic law.
(C7) Dimensionality of configuration space. In physics configuration, spaces are multidimensional and the dimension by itself carries physical meaning. In DH-theory, all configuration spaces are treelike. They can be visualized in Euclidean space as two-dimensional structures. Moreover, in general topology their dimension can be characterized internally, and it equals zero. Hence, we work with zero-dimensional configuration topological spaces. This possibility to describe events happening in four-dimensional physical space with zero-dimensional topological structures is the essence of the holographic representation, which is basic in DH-theory. Such holography is very special (see [1] for details and an illustration with a figure).

3. Brief Introduction to Ontic DH-Theory

In this paper, we work solely with experimental data.

3.1. Principles

(PO1) Events and relations. The event-relational hierarchic structure of the universe is mathematically represented by an infinite tree endowed with a common root ultrametric. Elementary events are represented by branches of the tree; events are all possible sets of branches.
(PO1a) P-adic universe. Restriction of trees to p-adic ones gives a p-adic picture of the universe: an infinite homogeneous tree with one incoming and p-outcoming wedges for each node. This tree is endowed with the ring algebra, addition, subtraction, and multiplication of branches, and the ring of p-adic integers Zp.
Therefore, the observer’s free will disappears in the ontic universe: One may say that “epistemic free will” is apparent; this is the observer’s illusion generated by incomplete knowledge about the event interrelations. An observer O cannot see the complete picture given by the infinite tree of interrelations between events and he has the feeling of free will. However, since O would never be able to approach the ontic picture—to map all possible events (in the past and future) onto the infinite tree—for him super-determinism is a theoretical abstraction.
(PO2) Super-determinism. All possible events are predetermined and simultaneously present in the treelike event universe.

3.2. Mathematical Features of the p-adic Universe

(U1) Zp is totally disconnected. The formal topological definition [31] is that each point x has the basis of neighborhoods that are at the same time open and closed (“clopen”). It is equivalent to a more intuitive definition. The set of locally constant functions (i.e., constructed from characteristic functions of balls) is dense in the space of real-valued continuous functions. Another interesting property is that any continuous trajectory t to x(t) with real-time parameter t is piecewise constant, so the real-time dynamics consist of jumps.
(U2) Zp is disordered: It is impossible to introduce an ordered structure compatible with algebraic operations.
(U3) Zp is zero dimensional as a topological space.

4. Predictability of an Evolving Dendrogram

We started by examining n events ( E m   where   m 1 , 2 n   and   n = number   of   events ) . For that purpose, we generated n random numbers (in the figures below we show the example for n = 50, but examining different ns was done with the same qualitative results). From these base n events we constructed a dendrogram D n   by using the procedure outlined in Appendix B. We then add another event generated randomly and from the n + 1 events we compose a dendrogram D n + 1 .
Thus, for the dendrogram D n we have n branches in each path of branch m ,   where   m 1 ,   2 n   and   n = number   of   events   from root to leaf corresponding to event m. Each branch is a string of 1/0, where 1 represents a bifurcation of the branch to the left and 0 is a bifurcation of the branch to the right. This string can be represented by a natural number V m   by using the p-adic expansion:
V m = i = 1 k a i 2 i 1   w h e r e   a i 0 , 1   a n d   k = m a x i m a l   b a l l   o f   d e n d r o g r a m
Thus, we represent each event as a natural number that corresponds to the event path in the dendrogram.
Our main concern is to understand to what extent we can predict what the natural number V m + 1 representing event E n + 1 in the D n + 1 dendrogram will be. For that purpose, we followed the following procedure:
  • We randomly generated a base (fixed) n events and composed out of it the dendrogram with n edges.
  • Then, to the same n events we added one more event E n + 1 and computed its natural number representation V n + 1 .
  • We generated the E n + 1 event 6000 times and each time computed its V n + 1 .
  • We then changed the base n events and repeated steps 2 and 3 for these new n base events.
  • We changed the base n events 100 times.
We first checked what V n + 1 (the p-adic expansion representing   E n + 1 ) would be in the following case: E n + 1 does not cause the original dendrogram D n (with 50 edges) to change the number of levels in it. So if, for example, D n has 9 levels, D n + 1 has 9 levels as well. As is shown in Figure 1, the natural number V n + 1 representing E n + 1 is very predictable and tends to favor values closer to 2 k 1 ,   where   k inf , 1 , 2 r   and   r = max ball   of   the   dendrogram   in each interval [2ki 2ki+1]. We also saw that less than 400 natural numbers were obtained out of 512 such possible numbers.
We also show (in Figure 2) that given one fixed base of 50 events, only a very limited set of natural numbers resulted that represent the E n + 1 event: around 80 such natural numbers out of a possible 512 (9 levels of dendrogram). Although in Figure 1 and Figure 2 we simulated with n = 50 base events dendrograms where D n   a n d   D n + 1 both had a number of levels equal to 9, we witnessed similar qualitative results with 100, 150, 200, …, 500 base events and different numbers of levels.
Moreover, we checked how many V m in the D n dendrogram changed their natural number representation upon adding the E n + 1 event with the result of a D n + 1 dendrogram. This is shown in Figure 3, which demonstrates the essential stability of the dendrogram representing n events w.r.t. in the appearance of a new event.
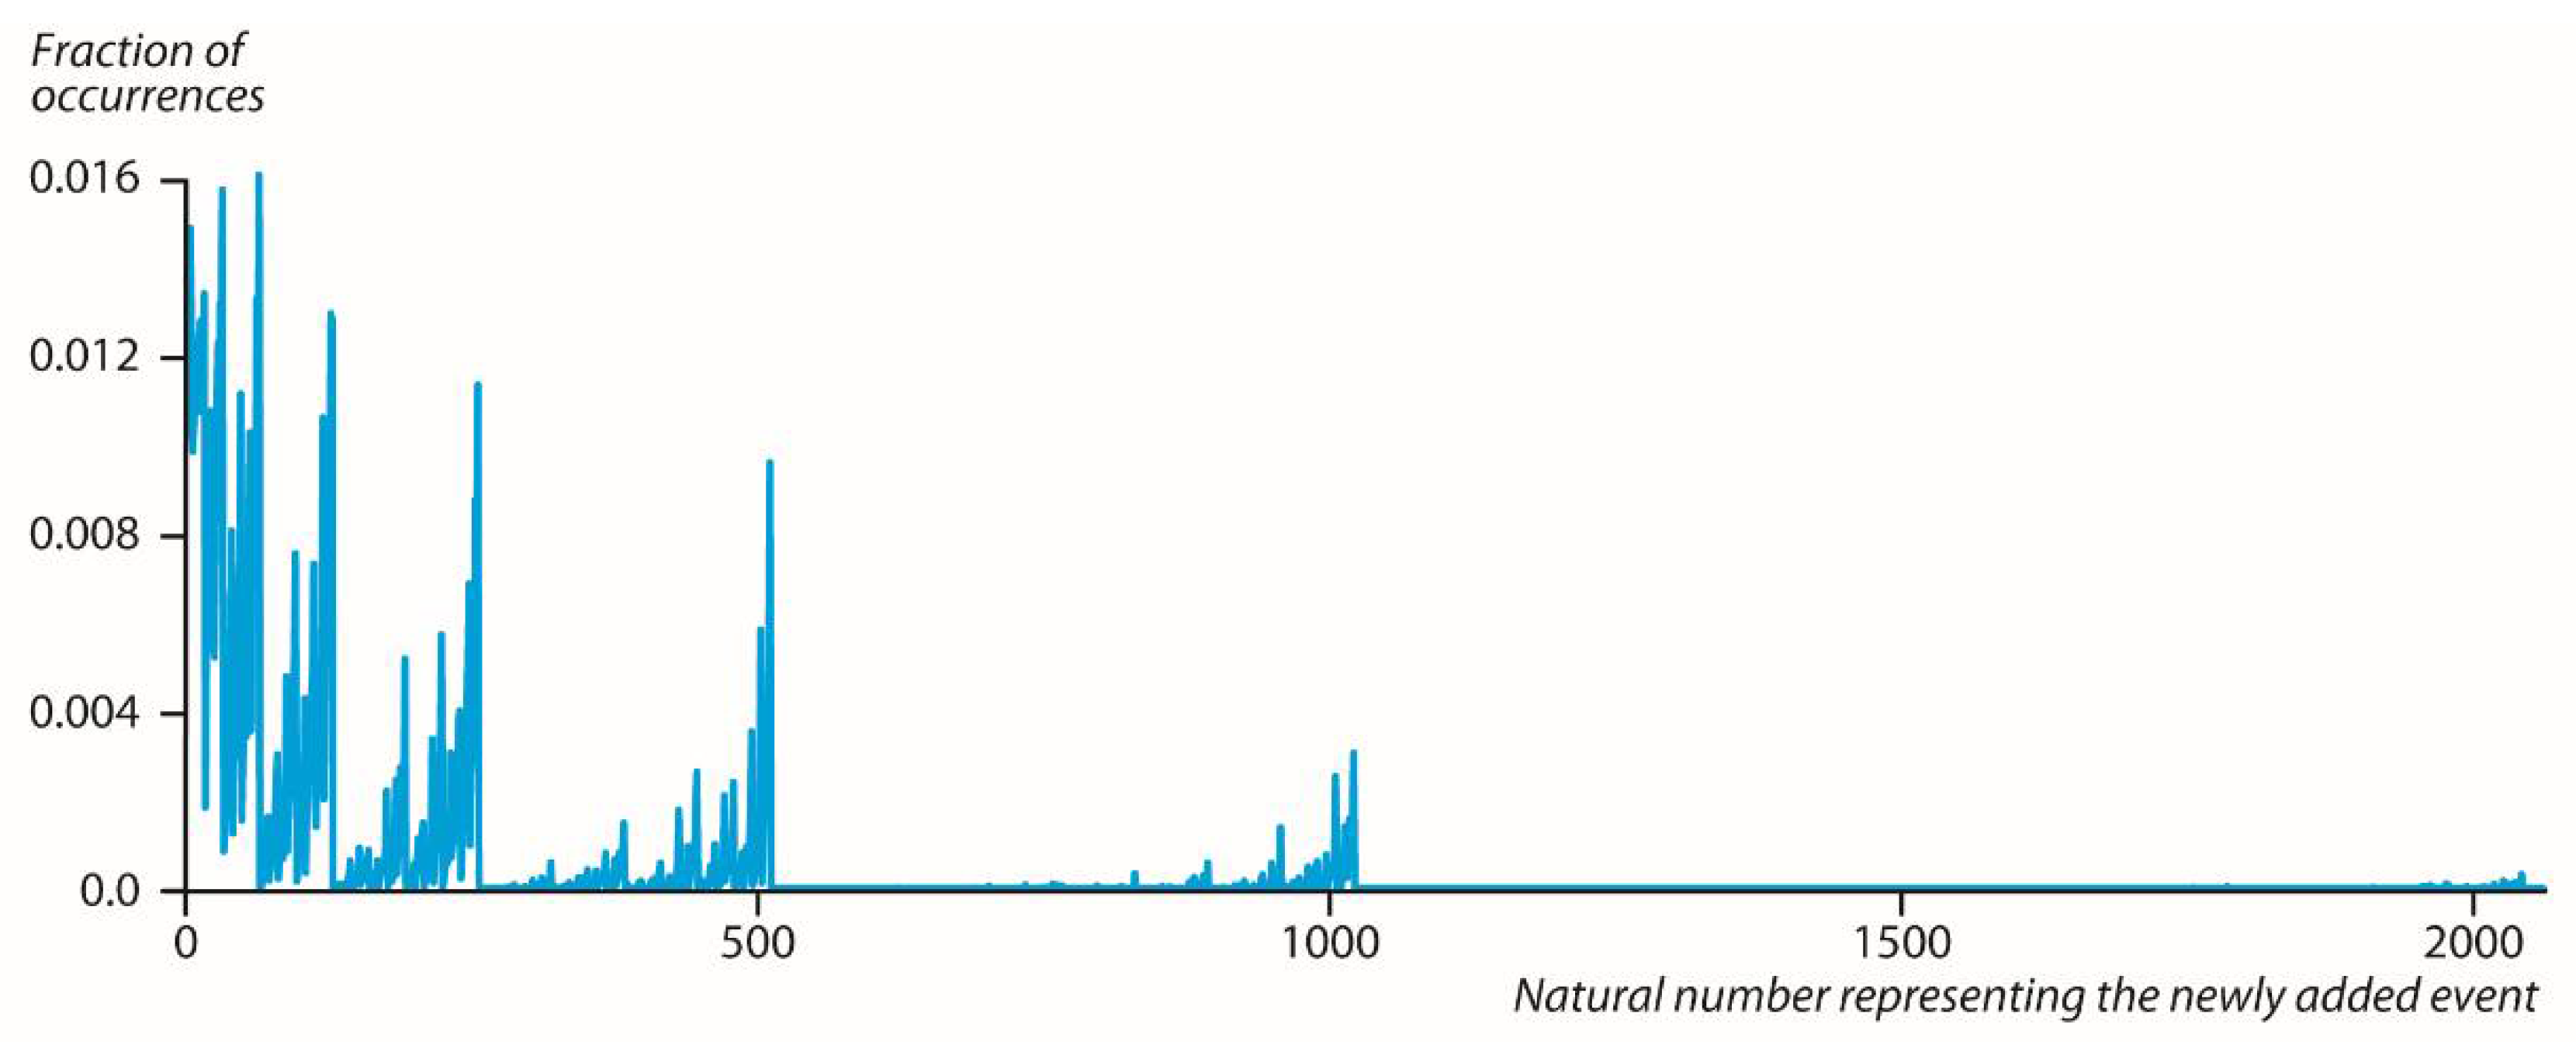
Furthermore, we removed the restriction that if N ( D n ) = 9 then N( D n + 1 ) = 9 . Thus, in the case where N ( D n ) = 9 but N( D n + 1 ) can have any maximal ball value by adding E n + 1 , we again witnessed the same qualitative results as in Figure 1 but with more possible V m values (Figure 4).
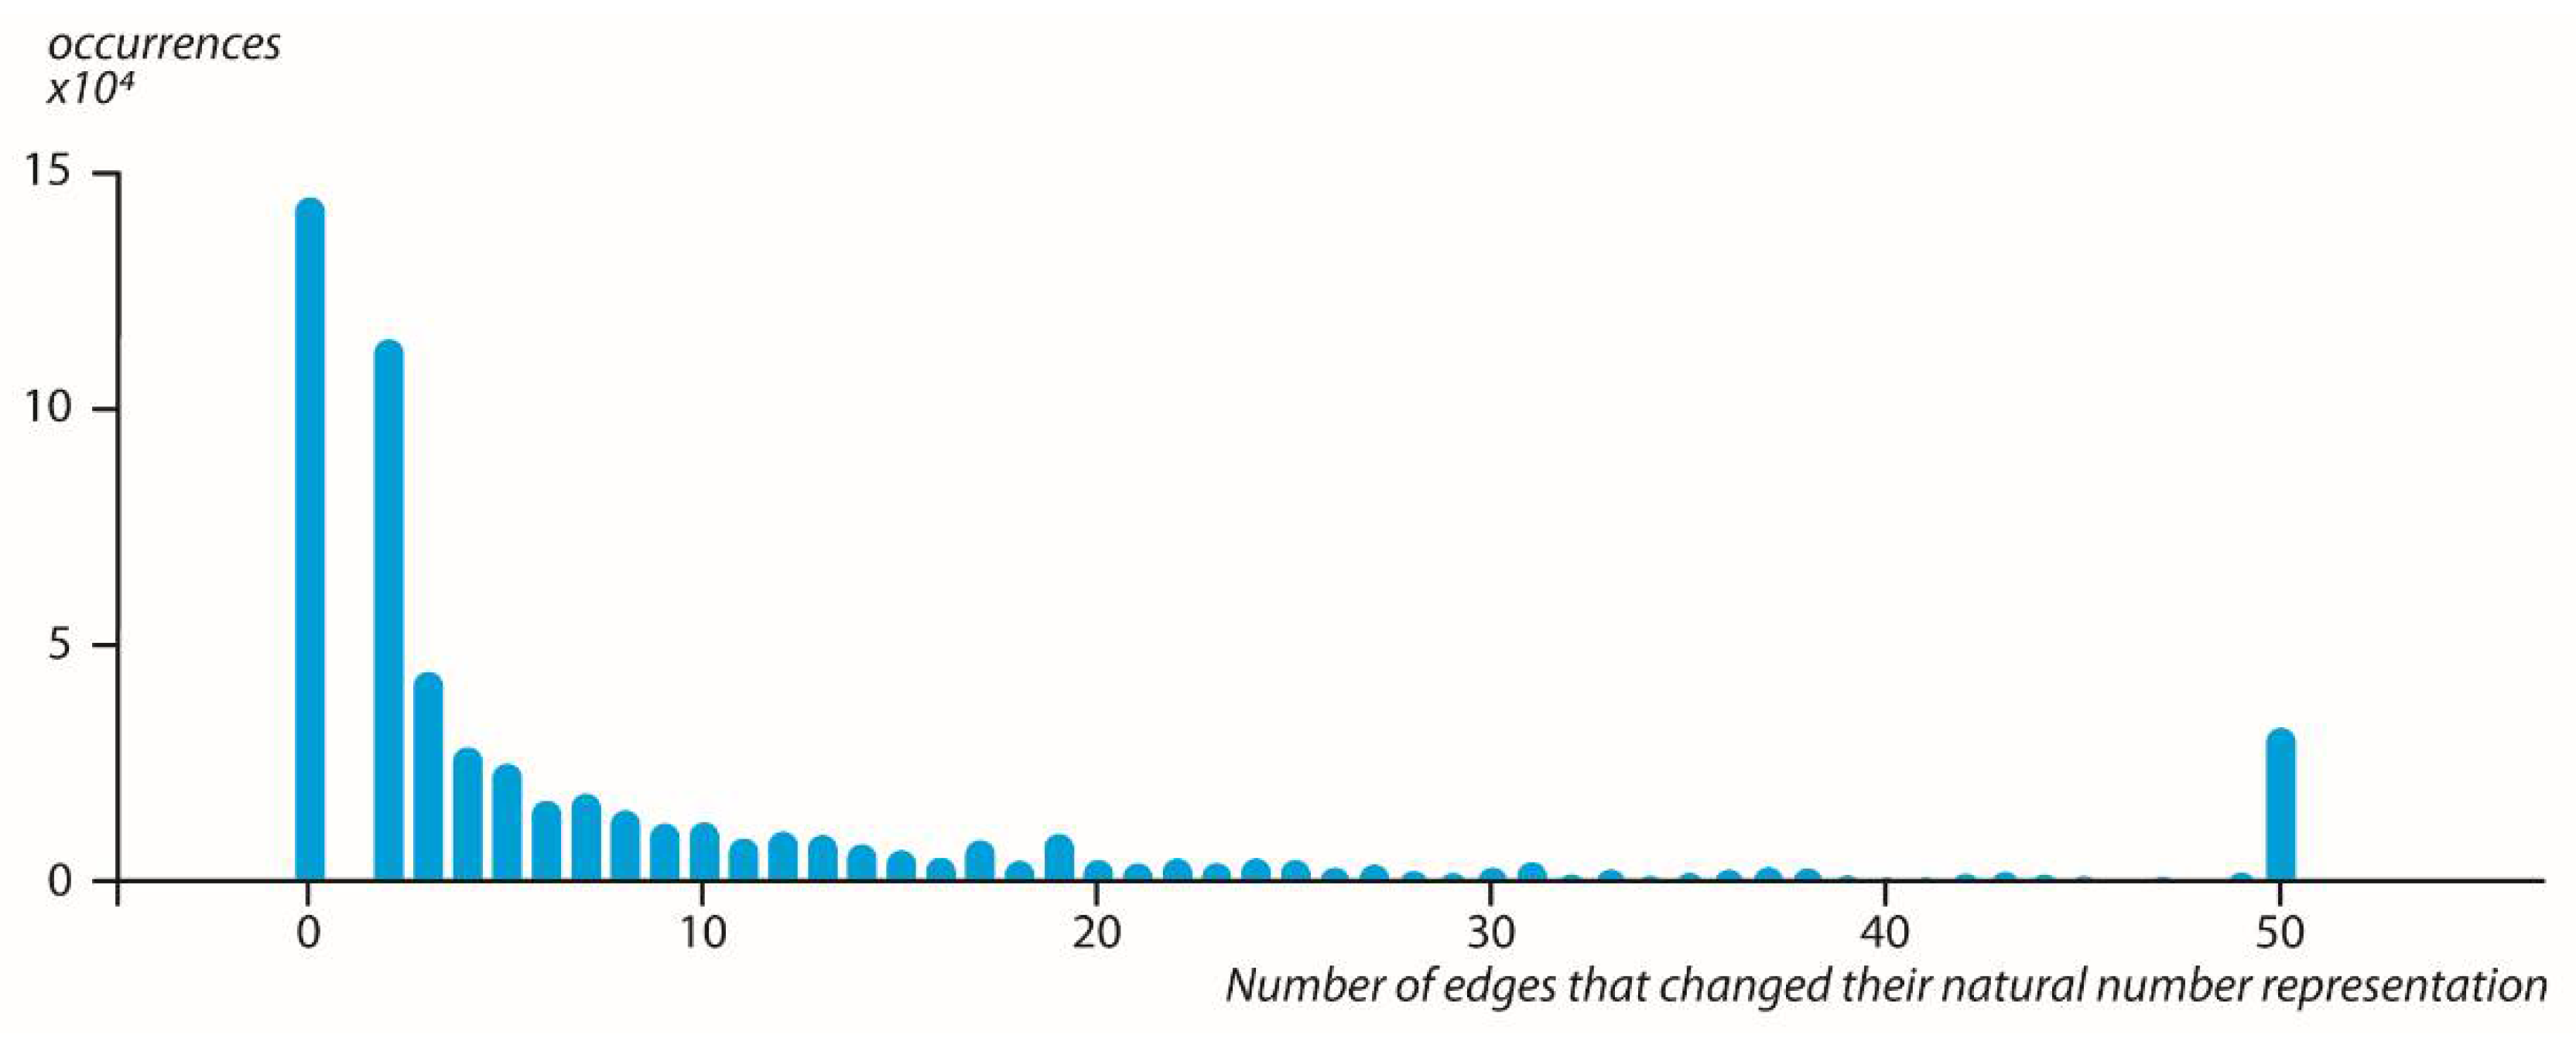
We again checked how many edges in the D n dendrogram changed their natural number representation upon adding the E n + 1 with the result of a D n + 1 dendrogram. We saw (Figure 5) that although now D n + 1 resulted in any maximal ball value we obtained the same qualitative result as in Figure 3, which is with the restriction that if N ( D n ) = 9 then N ( D n + 1 ) = 9 .
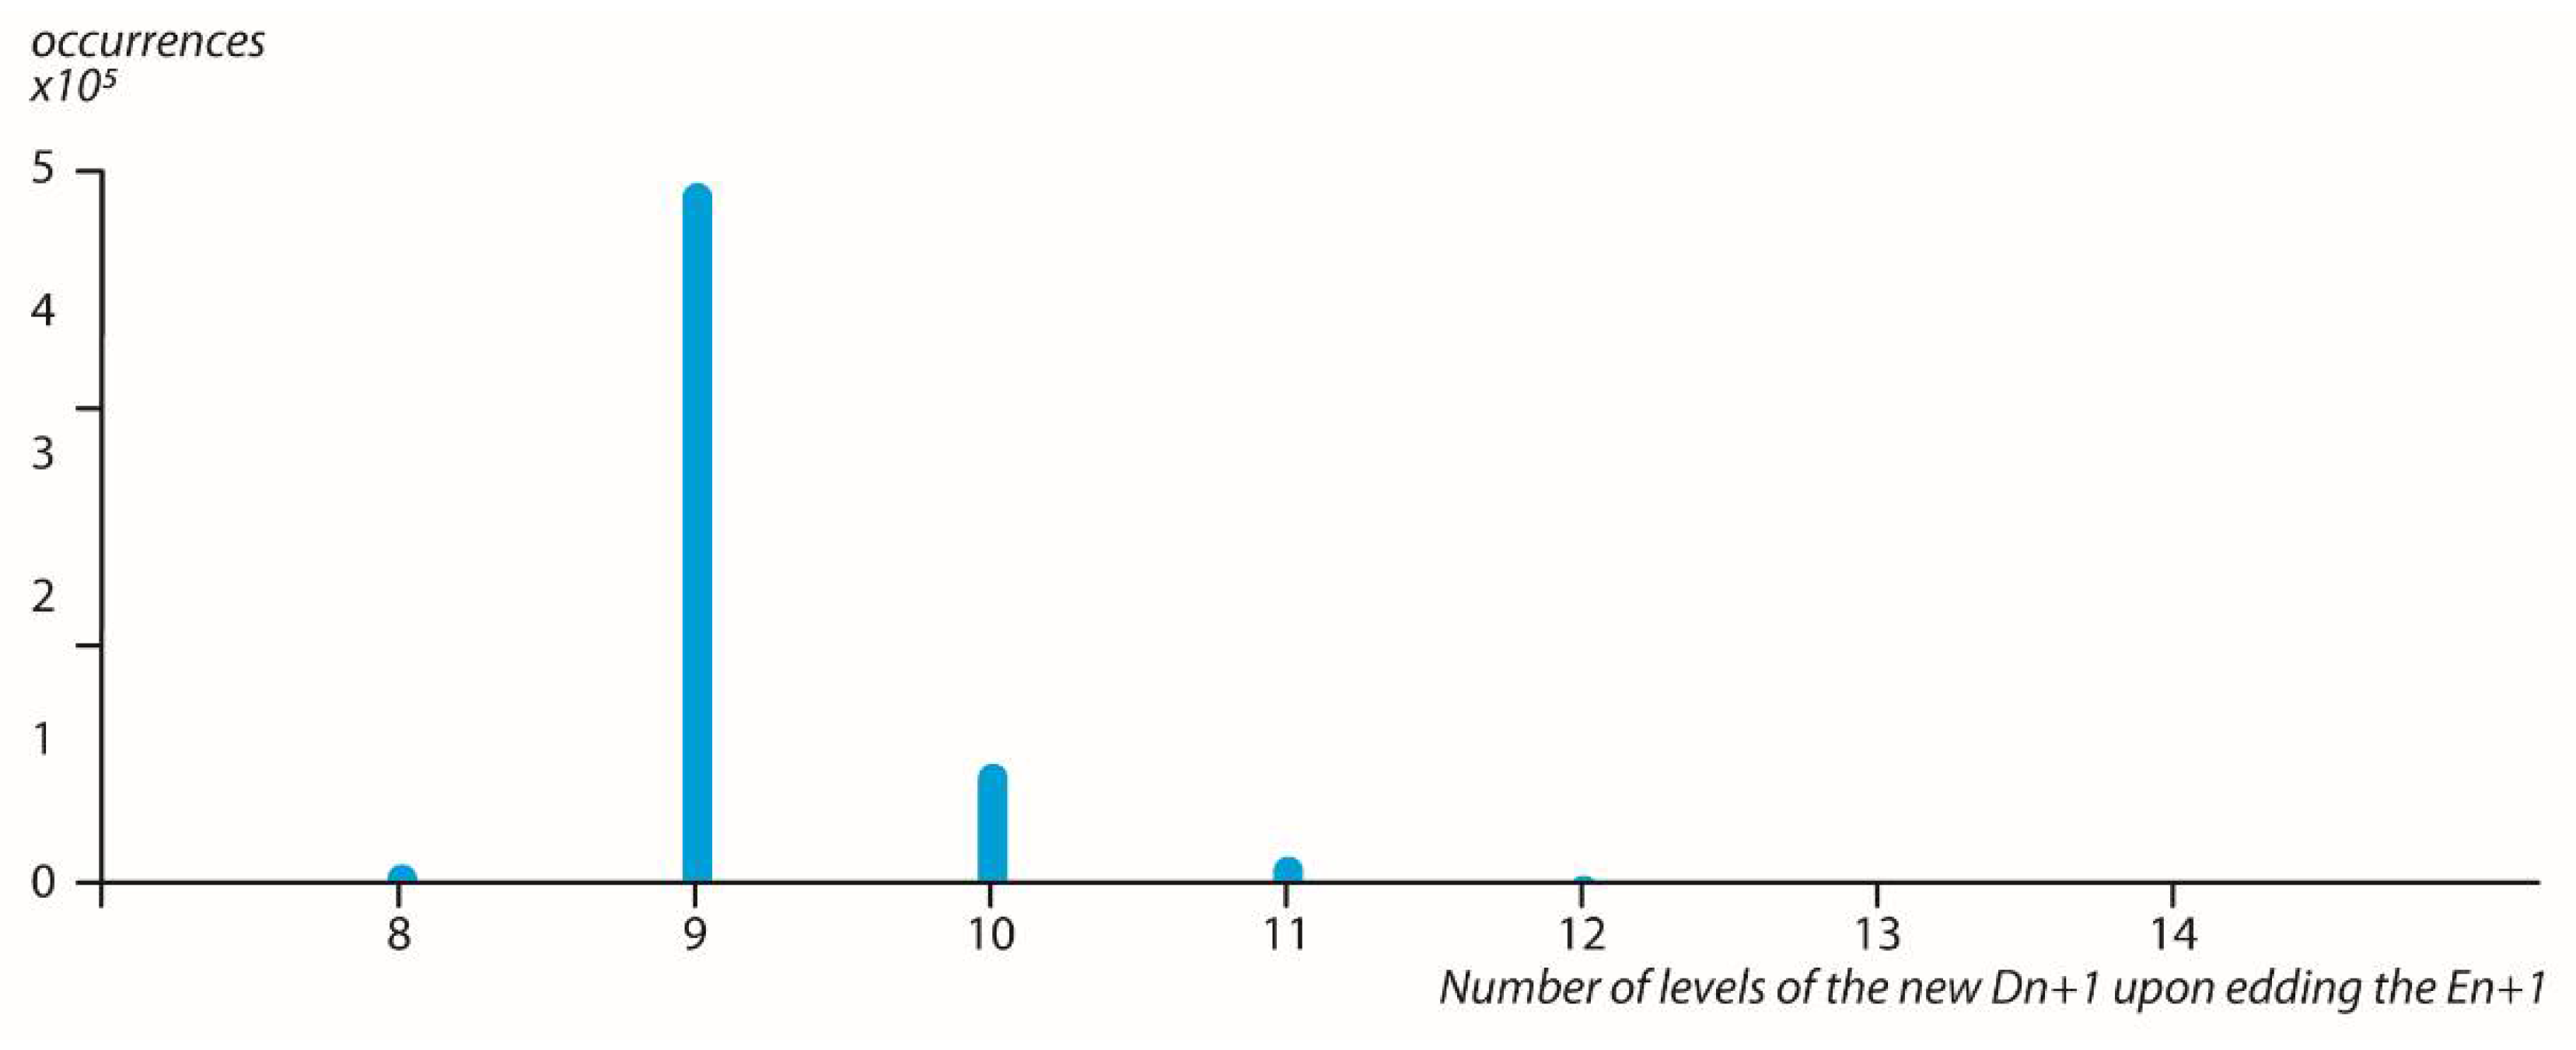
Checking the number of levels of the newly formed dendrogram D n + 1 showed a very significant peak in the maximal ball value of 9 (Figure 6).

5. Complexity Measures of Events and Dendrograms

Our main motivation in this section is to understand the dynamic process that changes the dendrogram structure upon adding more and more events. In order to obtain a meaningful measure of dendrogramic structure dynamics, we need to overcome the trivial problem that by adding events to a dendrogram we are repeatedly making the dendrogram larger. So, we have a sequence D n   ,   D n + 1   ,   D n + 2   . . We therefore need some scale invariant measure of the system.
Interestingly, we showed in a previous study [3] the scale-free similarities between different sizes of dendrograms and their relations to the constants of nature G , h ,   and   c . In order to quantify in a scale-free manner the complexity of a dendrogram structure (and even the structure of a single branch in a dendrogram, as detailed below), we decided to use the complexity measure suggested by Julian Barbour in his studies of N-body shape dynamics.
We first present Barbour’s complexity measure in an N-body system with N masses.
l r m s = i = 1 N 1 j = i + 1 N m i m j r i j 2 2 M   a n d   1 l m h l = 1 M 2 ( i = 1 N 1 j = i + 1 N m i m j r i j ) s h a p e   c o m p l e x i t y   m e a s u r e = l r m s l m h l

5.1. Complexity Measure of Dendrograms

We started from n = 50 events (random numbers) that were composed in a dendrogram, and then we added one event at a time and composed a dendrogram of n + 1 events. This procedure was done repeatedly up until event n = 5000. In order to measure the shape complexity of the dendrogram with n events, we assigned
m i = V i
where Vi is the monna map representing the i′th dendrogram branch p-adic expansion
V i = m = 1 k a m 2 m 1
where a m 0 ,   1 and k = maximal ball of dendrogram.
And
r i j = | V i V j |   w h e r e   i < j
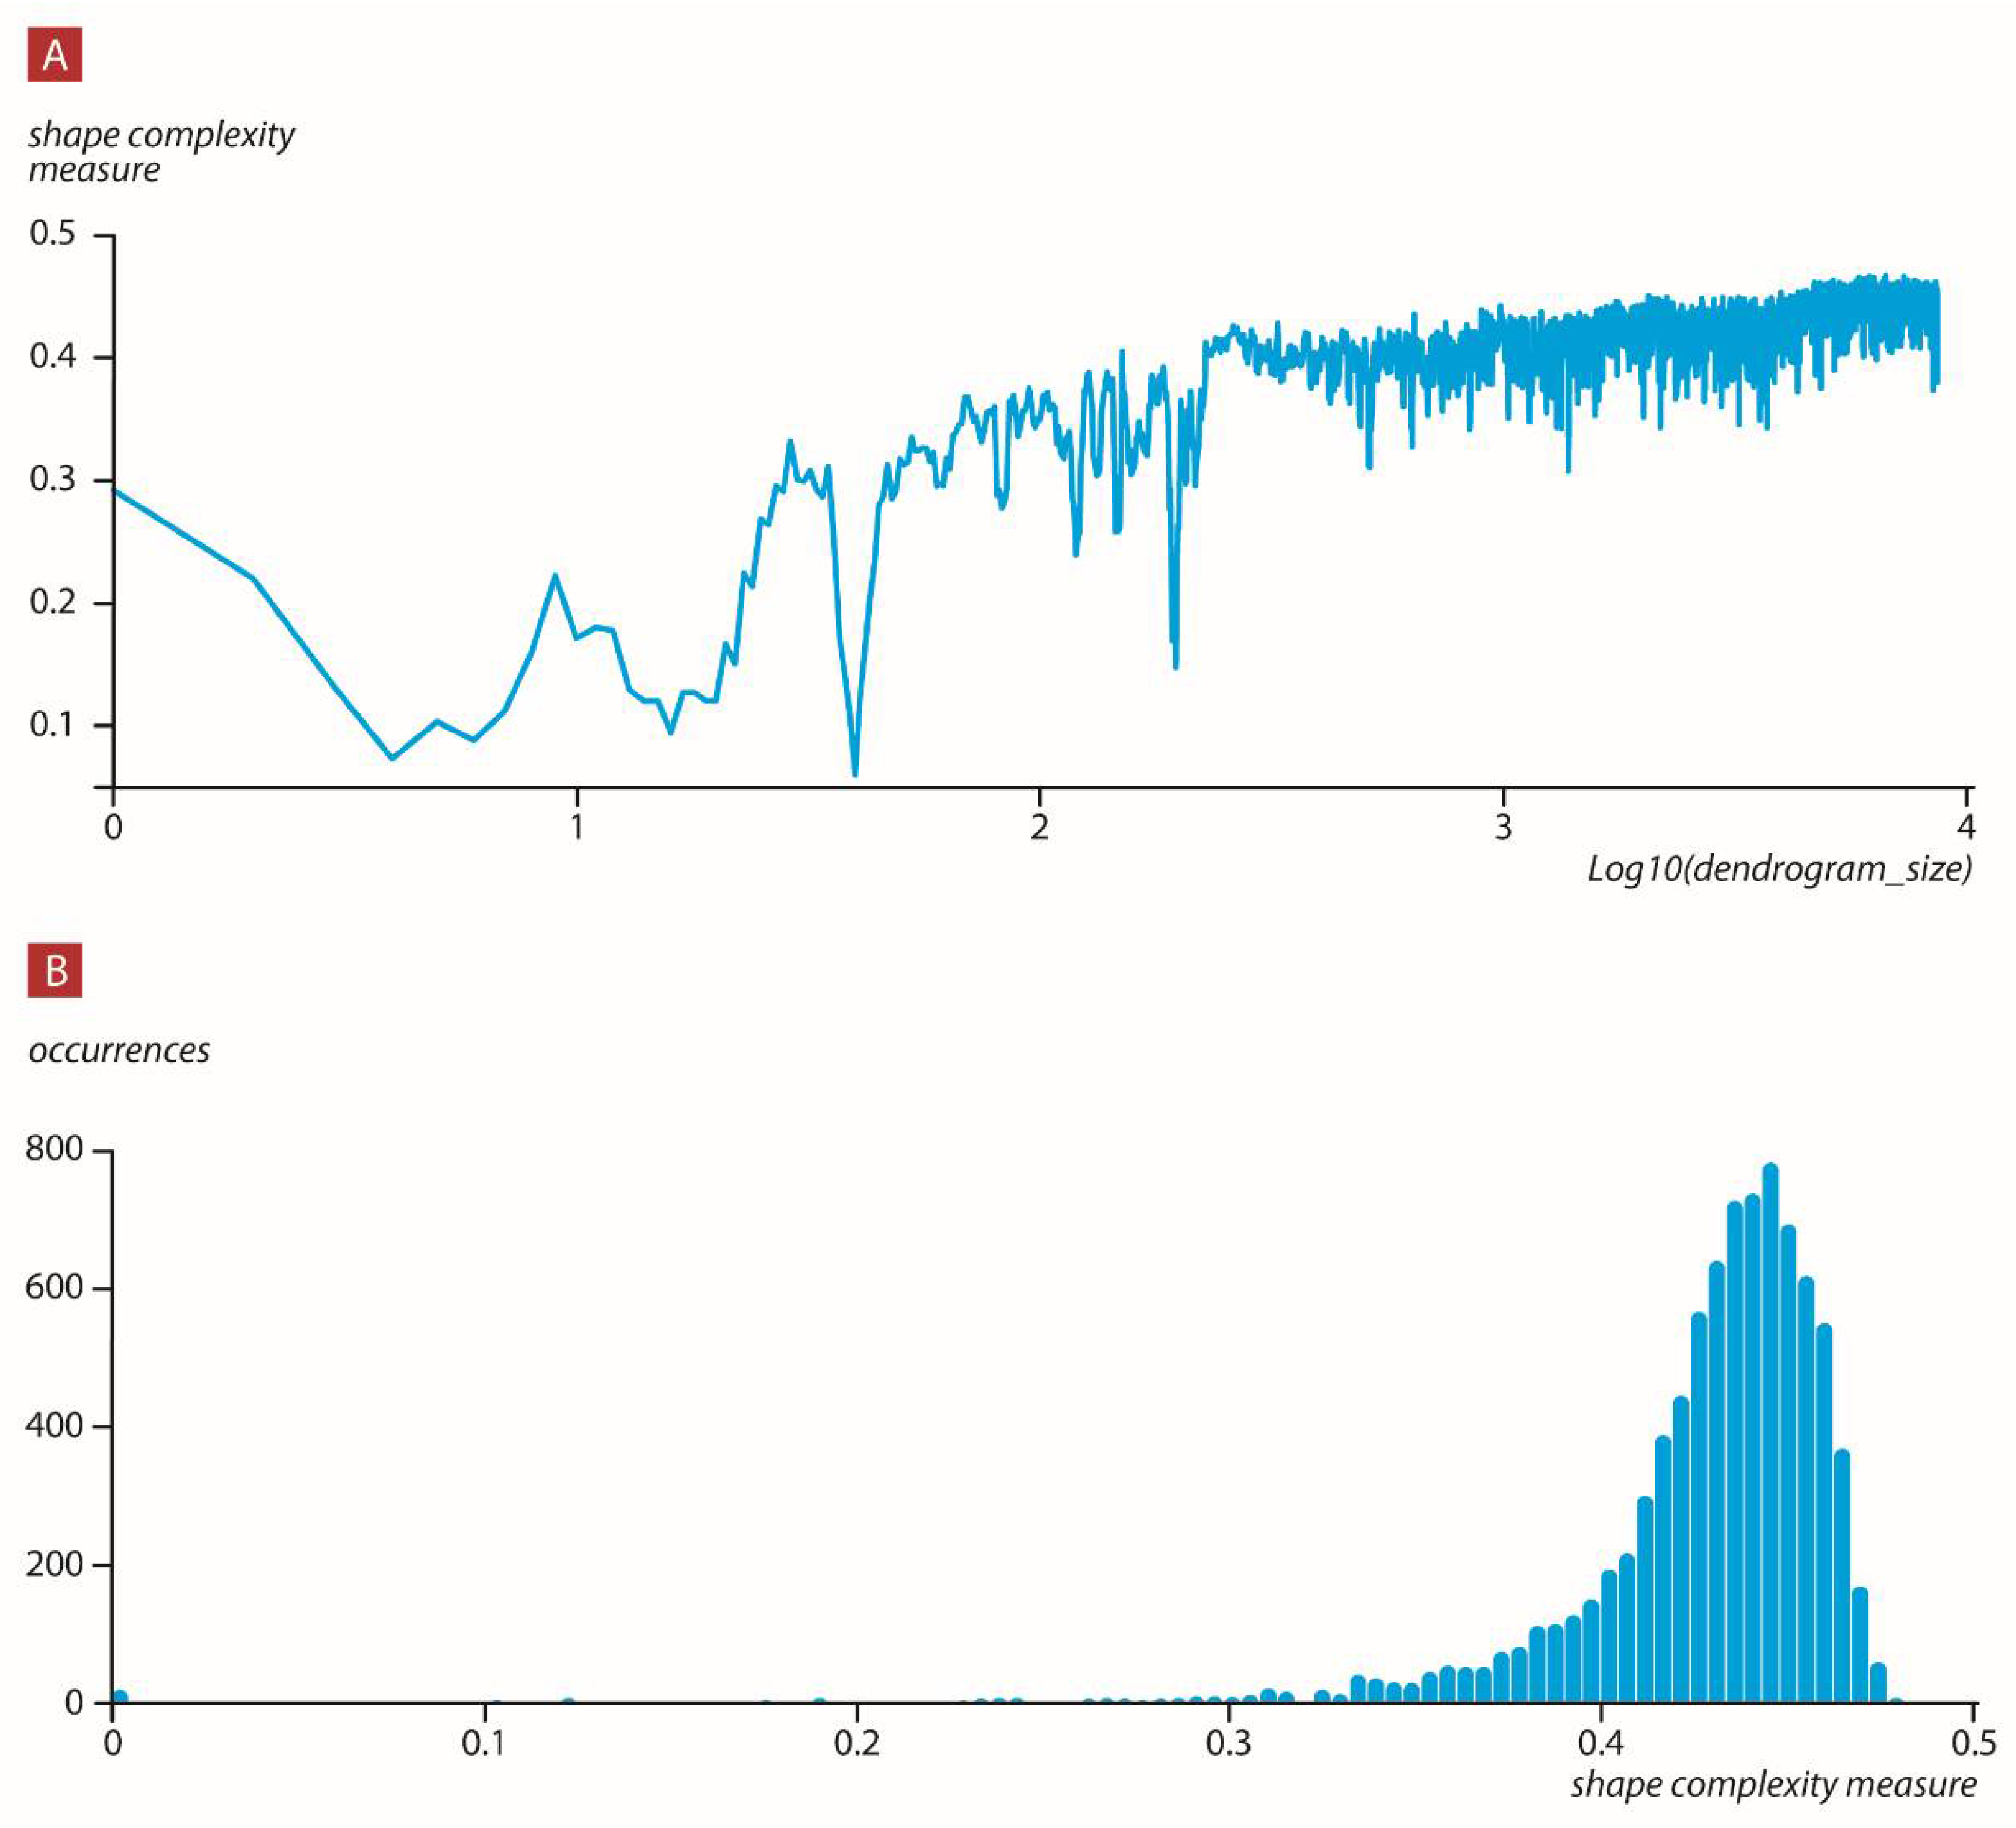
By adding more and more events the dendrogram shape complexity measure tended to rise. The mean of the distribution of the shape complexity measure values constantly moved its peak to higher values (Figure 7).

5.2. Complexity Measure of the Ball Distribution in the p-adic Representation of an Event

We again started from n = 50 events (random numbers) that were composed into a dendrogram, then we added one event at a time and composed the dendrogram of n + 1 events. This procedure was done repeatedly up until event n = 5000. Each time we examined the added event, the n + 1 event, and the branch 1/0 string, and then we calculated the shape complexity measure in the following way: For a string a 1 ,   a 2 , a 3   . a n   we identified i ,   where   a i   = 1 . This is a p-adic ball value.
Thus,
m j = i   w h e r e   a i   = 1
and
r k j = | m k m j |
Again, by adding more and more events, the next event branch string shape complexity measure tended to rise. The mean of the distribution of the shape complexity measure values constantly tended to move its peak to higher values (Figure 8).
One can argue that these results are trivial, as by sequentially adding one event at a time the dendrogram increases in size and the next event branch path is represented by a longer string. Thus, we moved to a higher N number of “bodies.” In order to show that higher shape complexity values do not depend on a possible larger N number of “bodies” in the system, we turned to our static universe view, which was discussed in our recent papers. We generated a temporal sequence of n random number of events and produced, from all n events, their static representative dendrogram, where their temporal feature was not included in order to form the dendrogram. We then calculated the three-body shape complexity measure obtained from the dendrogram in the following way:
We started with the first h temporal events and marked them as the past of the h + 1 event. Thus, our three-bodies were the universal past of the h + 1 event, which is calculated as follows:
B = j = 1 h V j  
where V j is a natural number such that
V j = m = 1 k a m 2 m 1
where a m 0 , 1 and k = maximal ball of dendrogram.
We represent B as a binary string b and calculate
m p a s t = m 1 = m = 1 k b m 2 m 1
where b m 0 ,   1 and k = length of binary string, so the present
m p r e s e n t = m 2 = V h + 1
where V h + 1 is the monna map representing the present (h + 1) dendrogram branch p-adic expansion:
V h + 1 = m = 1 k a m 2 m 1
where a m 0 ,   1 and k = maximal ball of dendrogram, and the center of mass of the present and the past m 3 = ( m 1 m 2 ) / 2 . We then calculated the above-mentioned shape complexity measure for h = 50, 51…4950 (thus moving the present each time one event to the future).
where
r k j = | m k m j |
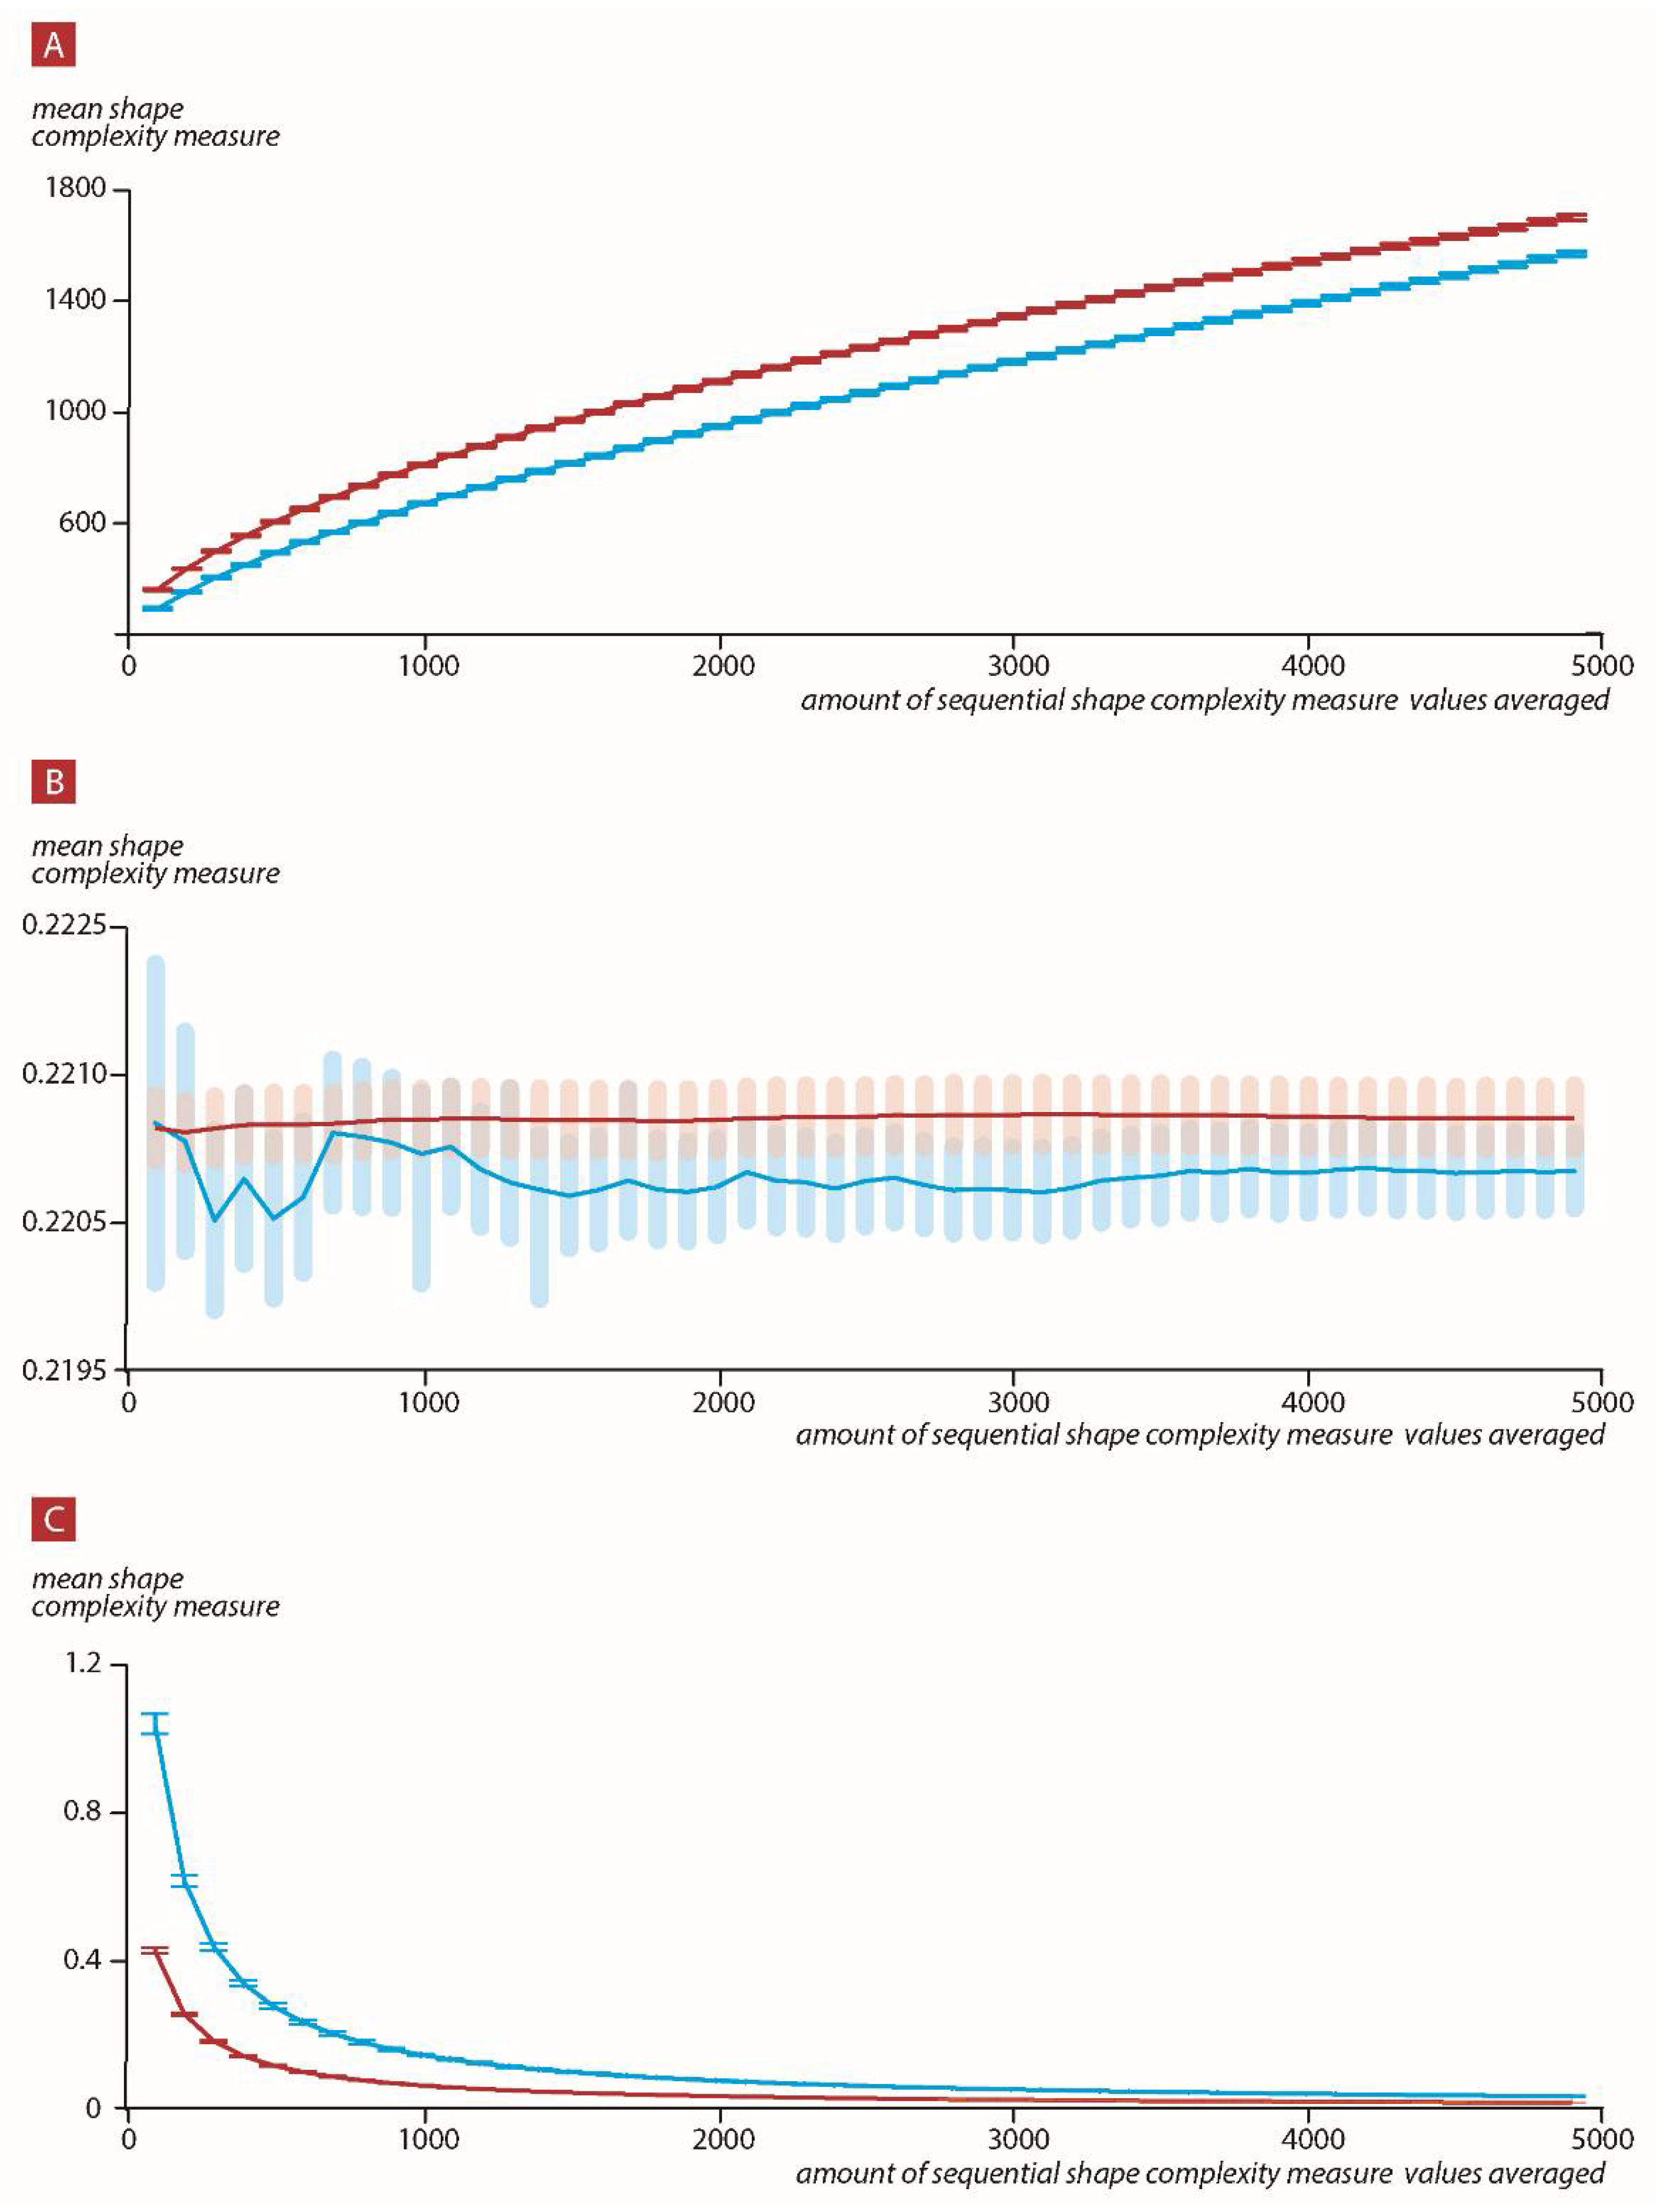
For each such temporal sequence we randomized the temporal order of events 10 times and calculated again the complexity measure of the non-temporal ordered sequence. We show the result of the progressing mean values (thus, the mean of values of 1 to k, where k = 100, 200, …, 4900) of the complexity measure values in Figure 9A across all 400 temporal sequences and the progressing mean values of the complexity measures values across all 100 × 400 randomized temporality sequences.
When we moved the present forward one event at a time in the direction of the future produced events, we show, in the figure below, that the shape complexity measure grew with time. Upon reversing the direction of time, we moved the present from the future to the past. Our three-body system was composed of the universal future, where the number of events in the future is (total number of events) − h event, which is calculated as follows:
B = j = number   of   events n u m b e r   o f   e v e n t s h   V j
where V j is a natural number, such that
V j = m = 1 k a m 2 m 1
where a m 0 ,   1 and k = maximal ball of dendrogram.
We represent B as a binary string b and calculated
m f u t u r e = m 1 = m = 1 k b m 2 m 1
where b m 0 ,   1 and k = length of binary string.
The present is m 2 = V n u m b e r   o f   e v e n t s h 1 and was calculated as above, and the center of mass obtained from the present and the past is m 3 = ( m 1 m 2 ) / 2 . We again calculated the above-mentioned shape complexity measure for h = 50, 51…4950 (thus moving the present each time one event to the past),where
r k j = | m k m j |
For the randomized temporal order of events, we again calculated the complexity measure of the non-temporal ordered sequence, now in regards to the present and future as defined above. We show the result of the progressing mean values (thus the mean of values of 1 to k where k = 100, 200, …, 4900) of the complexity measure values in Figure 10B across all 400 temporal sequences and the progressing mean values of the complexity measure values across all 100 × 400 randomized temporality sequences.
As can be seen in Figure 9A,B, the shape complexity measure always grew when we considered the present direction from past to future (Figure 9A) in both the past–present system and future to past in the future–present system, where we set the positive direction as for the present moving from the past towards the future. The real temporal order of the sequences resulted in the present–past and present–future system complexity measure values being below the mean of the same systems that are randomized in a non-temporal order.
Again in both simulations, past to future and future to past, we had m 1 increasing in size as a p-adic expansion string. Thus, again one can argue that the size of the universal past/future gets larger, which influences the shape complexity measure to go up. Thus, we need to overcome the argument that one component’s p-adic string ( m 1 ) in the three-body system gets increasingly bigger. For that purpose, we again defined the past, present, and future as m 1   and   m 2 ,   as outlined above for h = 50, 51…4950 (thus moving the present each time one event to the future). As can be seen in Figure 9C, the shape complexity decreased when considering the whole system of past, present, and future, where we set the positive direction as when the present moves from the past towards the future. Moreover, the real temporal order of the sequences resulted in mean complexity measure values for both systems that were above the mean of the systems that were randomized in a non-temporal order.
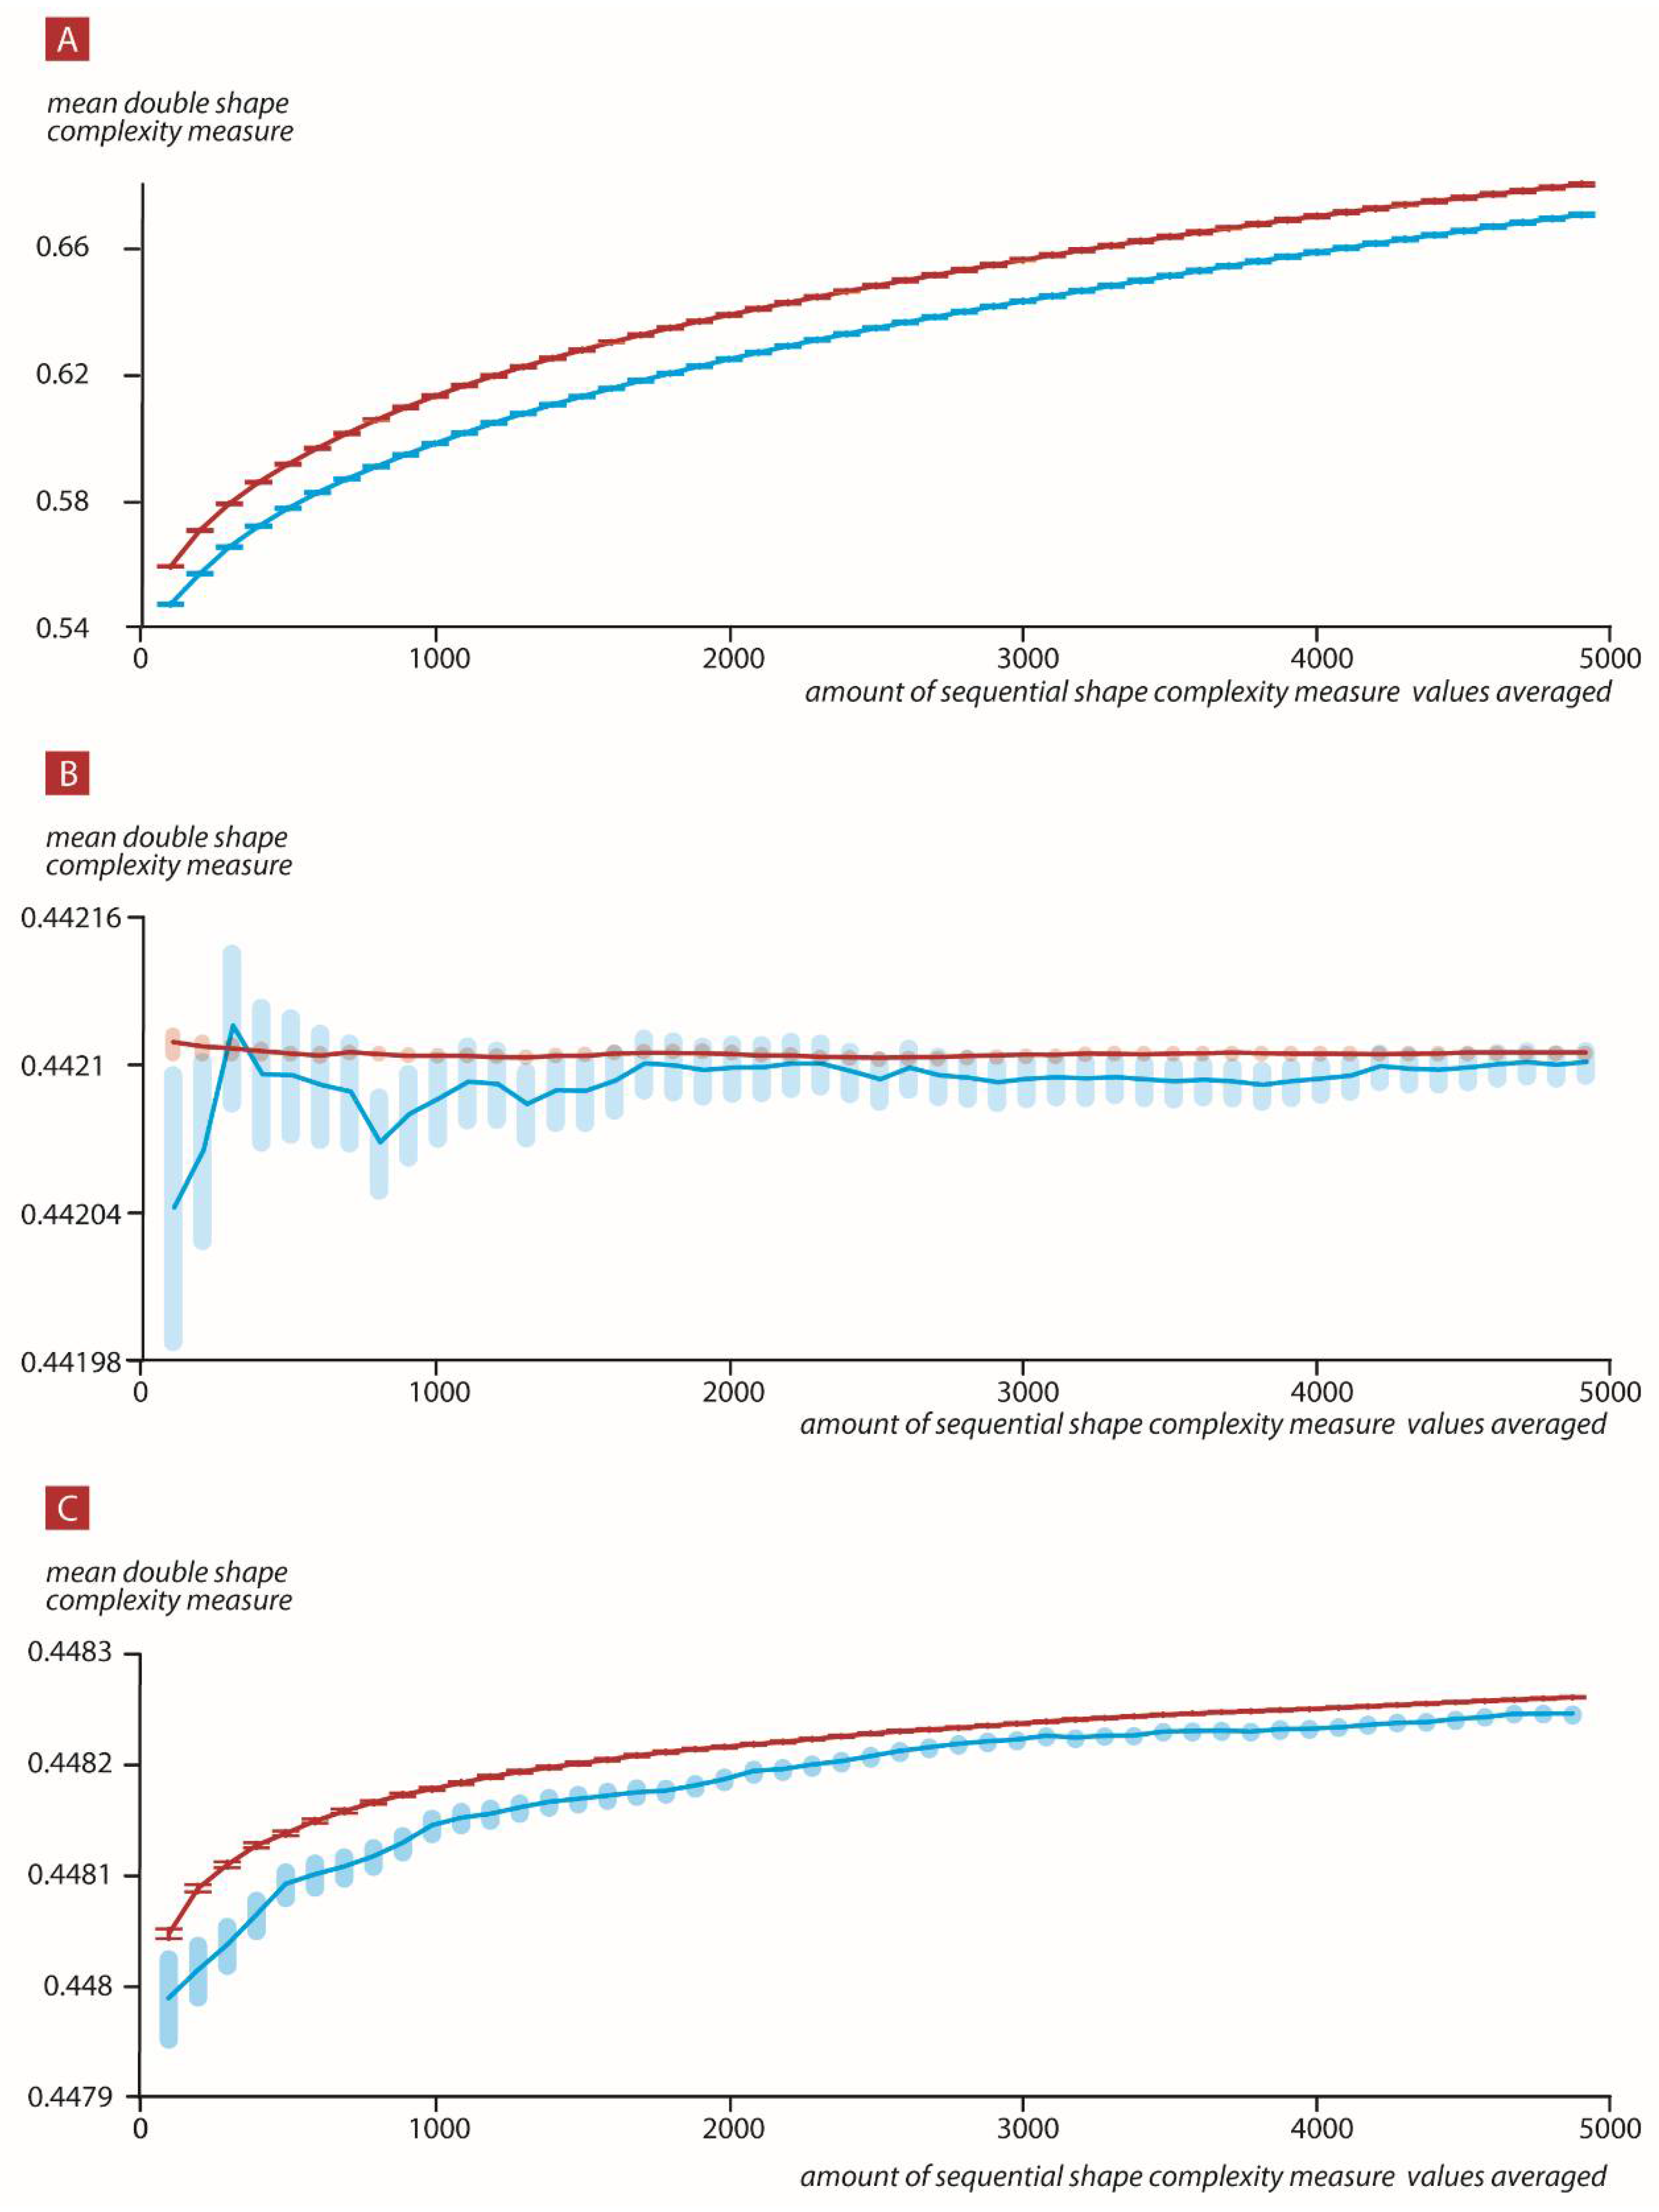
The above complexity measures are clearly rational numbers, and as such, not p-adic. Thus, we moved from the p-adic 1-bounded ball, where our dendrogram resides, to the whole of the rational number field. This was an unwanted outcome. In order to overcome this problem, we represented each complexity measure rational number as a p-adic expansion string and calculated the string complexity measure as outlined above. In the figure below we show the results of the p-adic representation of the complexity measure, or, as we call it, the double shape complexity measure.
Please note that the whole universe system went up when the present progressed to the future with an asymptote of the p-adic ball of 2, thus to 2−1. The most interesting feature is revealed in the two top figures, namely, in the past and present system, where the present moved in the direction of the future and the complexity measure increased from values greater then 2−1 and approached values closer to 20, whereas in the future and present system, the present moved in the direction of the future and the complexity measure increased from values greater than 2−2 and approached values closer to 2−1. Thus, the value 2−1 or the p-adic 2 ball was the Janus point of the two systems. These are two “separate” systems that operate dynamically on two different p-adic balls, where in both the time arrow is defined by the complexity measure.

6. p-adic Complexity Measure of Rational Numbers

Any rational number can be represented by its a p-adic expansion; thus, again we can calculate its complexity measure of ball distribution as outlined above. We generated a series of 200 random numbers in the interval (0, 1). Each series contained 5000 such random rational numbers, which were created temporally. For each random number we calculated the complexity measure of its ball distribution. For n = 100, 200, …, 4900 we calculated the mean of the first number to the n’s complexity measure values (Figure 11A). When we calculated from this rational number the double complexity measure value, the double complexity measure of the p-adic expansion showed a reversed picture of temporality (Figure 11B).

7. Concluding Remarks

DH-theory was created as the novel mathematical representation of natural phenomena, which is an alternative to the standard space–time picture. As posited by, e.g., Smolin et al. [5,6,7,8,9,10,11,12,13,46], the universe is composed of events, so we work in the event universe. In DH-theory, elementary events are represented by branches of dendrograms (finite trees). We start the paper with a formalization of DH-theory by listing and commenting on its basic structures and briefly presenting its mathematical basis.
The main part of this paper is devoted to studying the dynamics of the event universe generated by the appearance of new events. We found (via extensive numerical simulation) that, surprisingly, the dendrogramic space structure is relatively stable. In principle, the generation of new events can lead to total recombination of the dendrogram’s branches. However, this is not the case (see the histograms in the figures of Section 4). Even randomly generated events are concentrated at the special sectors of the natural number representation of events (branches), and with high probability the rest of the dendrogram is only slightly modified or even stable. We can say that the dendrogramic universe evolves towards a few special sectors and that this specific evolution is not a consequence of special dynamical laws, but of the treelike structure of the event universe.
We show that, given some initial data, we can predict the future macro state of the system, where this macro state corresponds to a complexity measure value that was first suggested by Barbour and here is implemented on dendrograms and p-adic expansion strings. We note again that the ideology and principles of DH-theory are closely related to shape dynamics (and in fact were inspired by some of the theory’s ideas). The complexity scale-free measure implemented in the p-adic field defines the time arrow, and combined with dendrogram size and natural number probability densities, can be used to predict the dynamic evolution of dendrograms as well as any random number generated sequence. Moreover, we found that the two systems (past–present and present–future) follow the same time arrow, from past to future. The double p-adic complexity measure demonstrates that these two systems operate in two distinct ranges of the p-adic field, where opposite time directions move away from the 2−1 value. This result is in good agreement with Barbour et al.’s studies of three-body shape dynamics simulations. Thus, overall, the complexity of a system, even if randomly generated, increases. This in turn elevates problems with the entropic law, where increasing disorder, which is in contradiction to the state of the universe, is always expected. We hope that these tools can be implemented in real systems that produce non-random signals in order to predict their dynamics (in particular, biological signals from EEG signals for prediction of unwanted events and conditions [37]).
DH-theory can be applied to model not only physical, but even biological evolution. Our result supports evolution theory in which the variety of new possible evolutionary events is constrained by the hierarchic relational (treelike) structure of previous events. However, that is a topic for a separate work.
Author Contributions

Conceptualization, A.K., O.S. and F.B.; methodology, A.K., O.S. and F.B.; software, O.S.; validation, A.K., O.S.; writing—original draft preparation, A.K., O.S. and F.B.; writing—review and editing, A.K., O.S. and F.B.; All authors have read and agreed to the published version of the manuscript.

Funding

This research received no external funding.

Institutional Review Board Statement

Not applicable.

Informed Consent Statement

Not applicable.

Data Availability Statement

Not applicable.

Acknowledgments

Varda and Boaz Dotan, Hirsha Leib Tsofnat, and Abraham Shor.

Conflicts of Interest

The authors declare no conflict of interest.

Appendix A. Ultrametric Spaces, Trees, p-Adic Numbers I

In this appendix, we follow the non-expert friendly presentation from paper [3]. In some applications, the point structure of a set X and the properties of a metric ρ may essentially differ from the Euclidean case. We are interested in metric spaces X, where instead of the standard triangle inequality, there is strong triangle inequality,
ρ (x, y) ≤ max[ρ(x, z), ρ(z, y)]
is valid. Such a metric is called an ultrametric, and such metric spaces are called ultrametric spaces. The strong triangle inequality can be stated geometrically: All triangles are isosceles.
Let us discuss the main properties of ultrametric space X. We set
Br(a) = {xX: ρ(x − a) < r}, Br ~ (a) = {xX: ρ(x − a) ≤ r}, r > 0, aX
These are balls of radius r with the center at point a. Our standard intuition tells us that Br(a) is a closed ball, not open, and that Br ~ (a) is an open ball, not closed. However, it is not valid for ultrametric spaces.
In an ultrametric space, each ball in X is open and closed at the same time. Each point of a ball may serve as a center. A ball may have infinite radii.
Let U and V be two balls in ultrametric space X. Thus, there are only two possibilities: (1) The balls are ordered by inclusion (i.e., UV or VU) or (2) the balls are disjointed.
Thus, if two balls have a common point, then one has to be a part of another.
The symbol Sr(a) denotes the sphere {xX: ρ(x, a) = r} of the radius r > 0 with the center at a. There is also a large deviation from the Euclidean case; the sphere Sr(a) is not a boundary of Br(a) or Br ~ (a).
Consider the following class of ultrametric spaces (X, ρ). Every point x has an infinite number of coordinates
x = (ao, a1, ..., an)…).
Each coordinate yields a finite number of values a ∈ {0, ..., p − 1}, where p > 1 is a natural number. We denote the space of sequences (1) by the symbol X = Zp. The standard ultrametric is introduced in this set in the following way.
Let x = (a0, a1, a2, ..., an), y = (b0, b1, b2, ..., bn) ∈ Zp. We set
r_p (x, y) = l/pk if aj = bj, j = 0, 1, ..., k − 1, and akbk
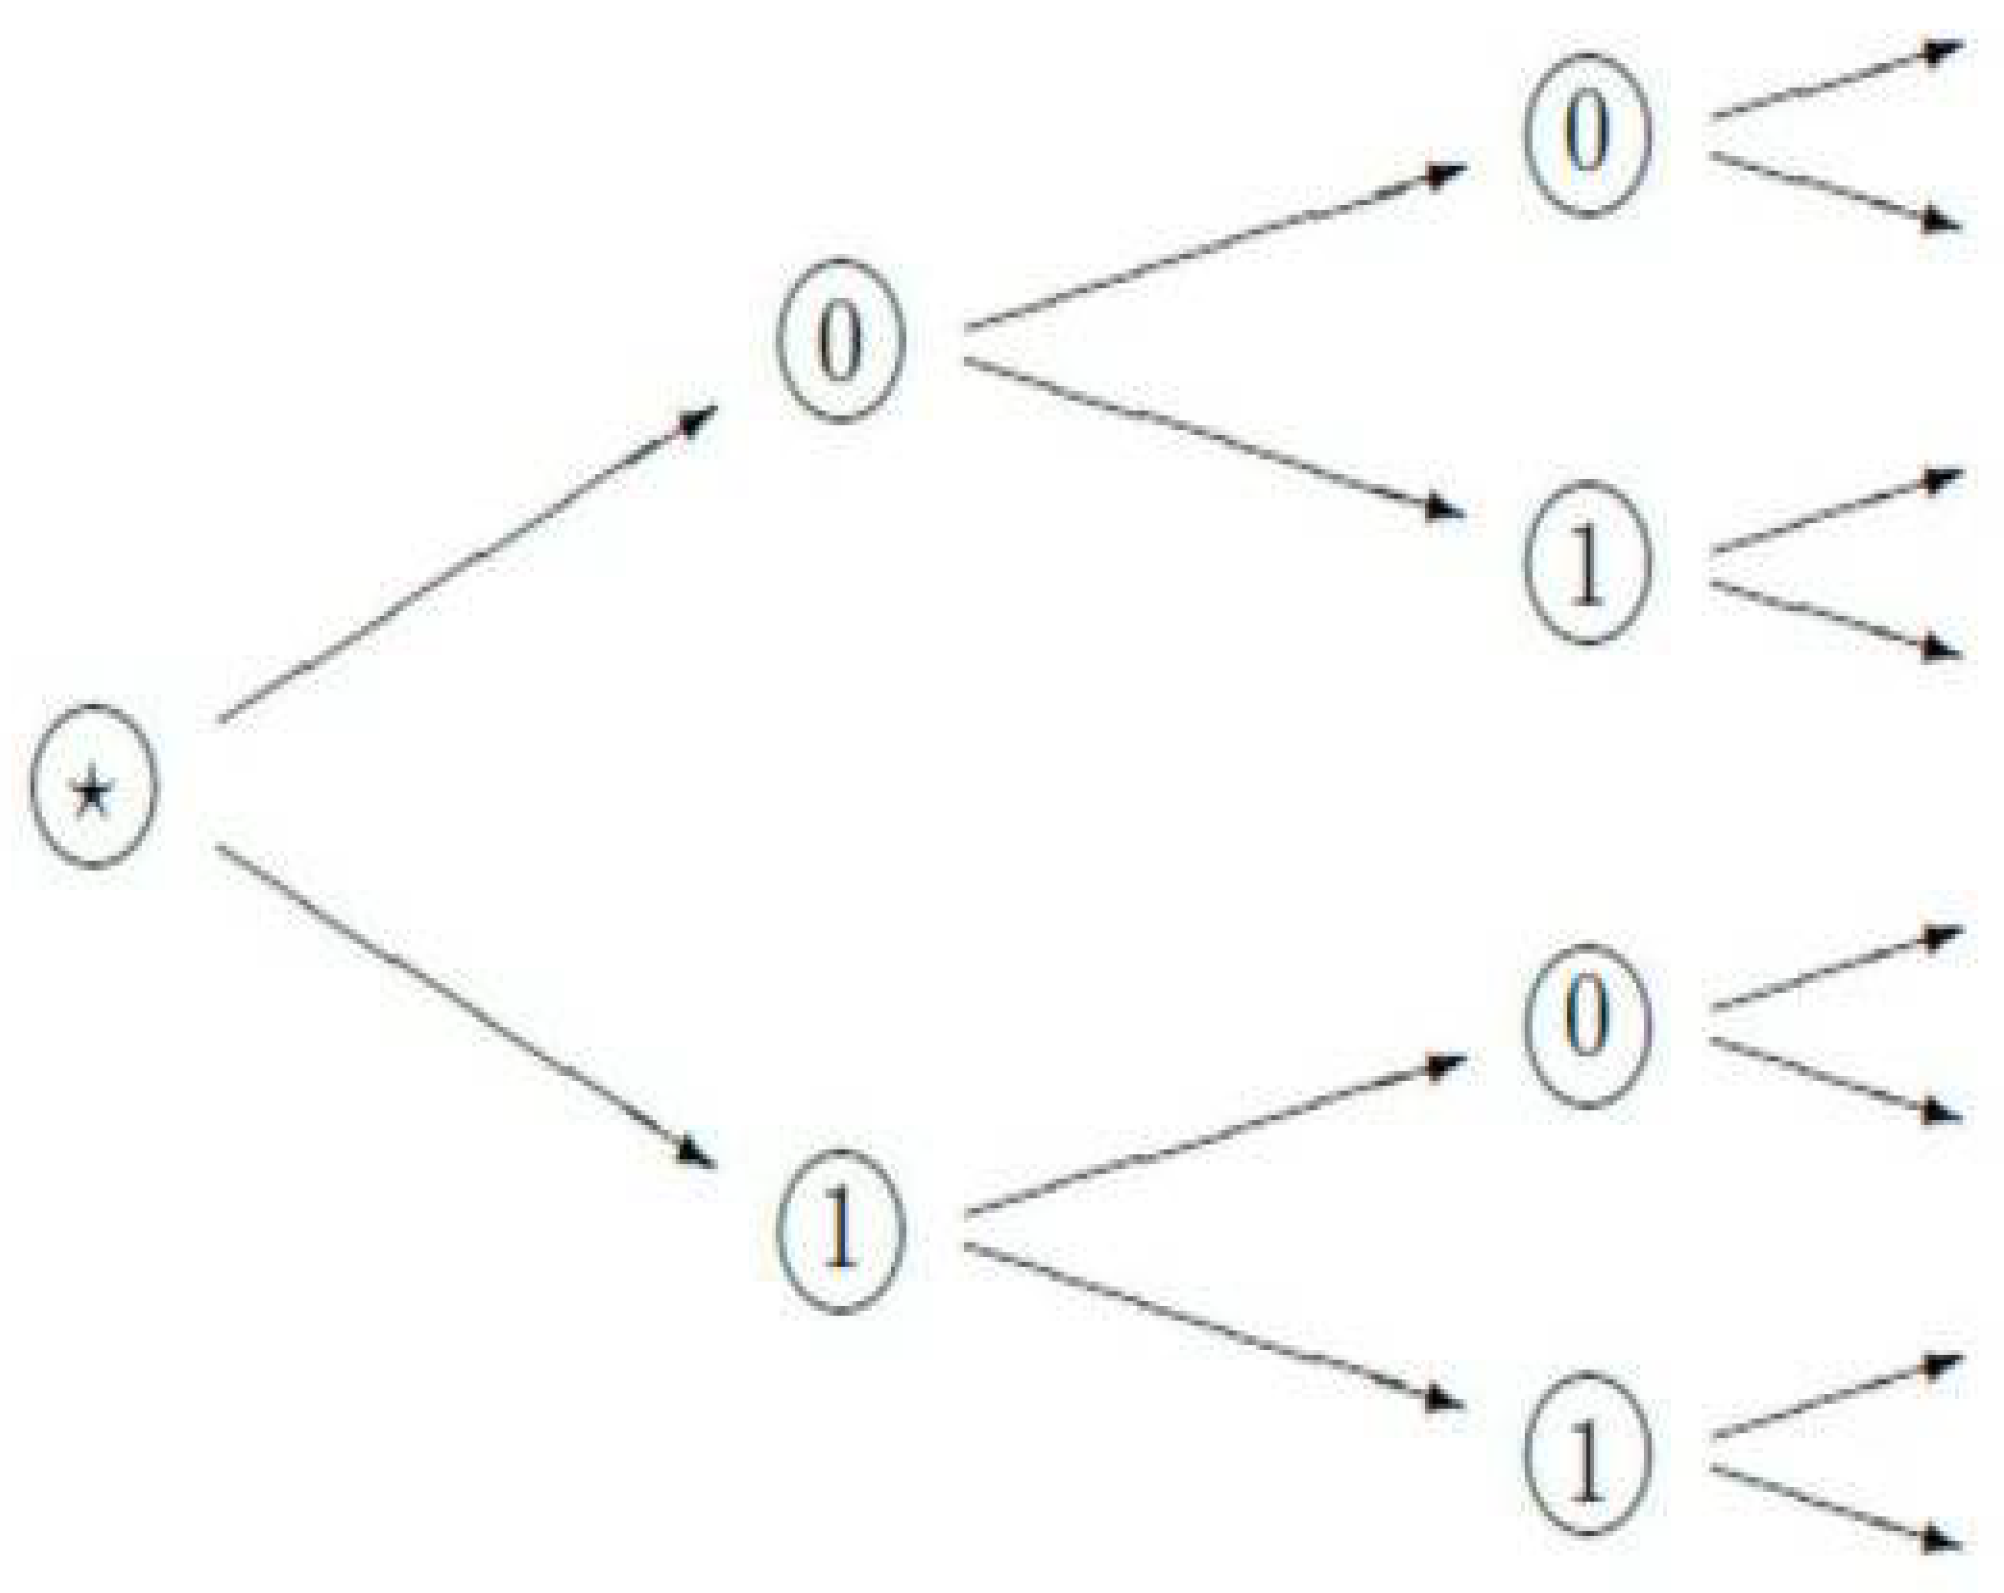
This is a metric and even an ultrametric. To find the distance r_p(x, y) between two strings of digits, x and y, we have to find the first position k at which the strings have different digits. The space X = Zp coincides with the unit ball centered at zero, X = B1(0); this space is compact. Geometrically, it can be represented by the tree (see Figure A1 for the 2-adic tree representing Z2). Here, one vertex, with the root labeled R, is incidental for two edges and other vertices are incidental for three edges. We noticed that it is convenient to consider this tree the directed graph; for each vertex I that is different from R, one edge comes from the branch starting at R, the “input edge,” and two edges go out from I, the “output edges.” These two edges (or vertices at their ends) are labeled a = 0, 1. In Figure A1, the order of labeling of the output edges is based on the embedding of the tree in the plane; the upper output edges are labeled 0 and the lower ones 1. This leads to the concrete numerical representation of this tree. However, the rule used for the labeling of edges is not obligatory; for each vertex I, we can assign 0/1 to each of the output edges in an arbitrary way and obtain another numerical representation of this tree.
Any finite string, x = (ao, a1, ..., an), aj = 0, 1, …, p − 1, can be represented by the natural number, which the w.r.t. powers of p, p-adic expansion, are given by this string; in particular, if p = 2, then this is the usual binary expansion of the natural number. Thus, the set of natural numbers N is embedded in Zp for each p > 1. An infinite string, x = (ao, a1, ..., an…), aj = 0, 1, …, p − 1, is represented by the power series converging the w.r.t. p-adic ultrametric. On the set of these series, one can define the operations of addition, subtraction, and multiplication; they are obtained as extensions by continuity of the corresponding operations on natural numbers. (The set of natural numbers N is dense in Zp.) In this paper, we considered only finite trees, i.e., their branches are encoded by finite strings of 0/1 (the 2-adic clustering algorithm was used). Thus, we could operate on the set of natural numbers N endowed with the ultrametric induced from Zp.
Figure A1. A 2-adic tree, geometric image of Z2.
Symmetry 14 01089 g0a1

Appendix B

Step 1. Producing an agglomerative hierarchical cluster binary tree from a temporal sequence of a random number.
Step 1.1.
Calculating the pairwise distance matrix: for a single E v e n t j ,   w h e r e   j 1 , 2 N   N = n u m b e r   o f   r a n d o m   n u m b e r s   p r o d u c e d   i n   t e m p o r a l   s e q u e n c e .
We then calculated E v e n t i E v e n t j where   is the Euclidean distance between the ith event and jth event.
Step 1.2.
We used the Ward’s linkage method to recursively link clusters according to the distance matrix. The Ward’s linkage method calculates the increase in the total within-cluster sum of squares as a result of joining two clusters. The within-cluster sum of squares is defined as the sum of the squares of the distances between all objects in the cluster and the centroid of the cluster. The sum-of-squares metric we used is defined as:
d ( s , r ) = 2 n s n r ( n s + n r ) | | x ˜ s x ˜ r | |
where
  •   is the Euclidean distance;
  • x ˜ s and x ˜ r are the centroids of clusters r and s;
  • n s   and n r are the number of elements in clusters r and s.
We then obtained, as an output from the Ward’s linkage method, the agglomerative hierarchical cluster tree, returned as a numeric matrix Z, which is an ( n − 1)-by−3 matrix, where
n = n u m b e r   o f   r a n d o m   n u m b e r s   p r o d u c e d   i n   t e m p o r a l   s e q u e n c e .
Columns 1 and 2 of Z contain cluster indices linked in pairs to form a binary tree. The leaf nodes are marked as cluster indices from 1 to n . Leaf nodes are the singleton clusters from which all higher clusters are built. Each newly formed cluster, corresponding to row Z(I,:), is assigned the index n + I. The entries Z(I,1) and Z(I,2) contain the indices of the two component clusters that form cluster n + I. The higher n − 1 clusters correspond to the interior nodes of the clustering tree. Z(I,3) contains the linkage distance between the two clusters merged in row Z(I,:).
Step 2. Producing a p-adic scale-free dendrogram from an agglomerative hierarchical cluster binary tree.
Step 2.1.
Each leaf node of the agglomerative hierarchical cluster binary tree has a path from root to leaf. The leaf path passes m nodes of bifurcations. Each node of bifurcation, in a leaf path, bifurcates right or left. Thus, each leaf path will be represented as a binary string, b r a n c h r   r 1 ,   2 n   n = n u m b e r   o f   r a n d o m   n u m b e r s   p r o d u c e d   i n   t e m p o r a l   s e q u e n c e .
-
The ith ( i 1 ,   2 m )   position of the binary string will have a value 1 if at the ith node of bifurcation ( i 1 ,   2 m ) the path bifurcates right.
-
The ith ( i 1 , 2 m )   position of the binary string will have a value 0 if at the ith node of bifurcation ( i 1 ,   2 m ) the path bifurcates left.
Step 2.2.
All b r a n c h r will be joined to form a matrix D, which represents the p-adic scale-free dendrogram with n number of rows and w number of columns, where
n = u m b e r   o f   r a n d o m   n u m b e r s   p r o d u c e d   i n   t e m p o r a l   s e q u e n c e w = m a x i m a l   i t h   i n   a l l   p a t h r   w i t h   t h e   v a l u e   1
Each b r a n c h r  ith position that is bigger than its m but smaller or equal to w is filled with the value 0.
Each row in the D matrix that represents a p-adic scale-free dendrogram is a string with values of 0/1.
Each such row represents the j th leaf node branch of the p-adic scale-free dendrogram ,   where   j 1 ,   2 n   n = n u m b e r   o f   d i s c r e t e   l o c a t i o n s .

References

  1. Shor, O.; Benninger, F.; Khrennikov, A. Representation of the Universe as a Dendrogramic Hologram Endowed with Relational Interpretation. Entropy 2021, 23, 584. [Google Scholar] [CrossRef] [PubMed]
  2. Shor, O.; Benninger, F.; Khrennikov, A. Dendrogramic Representation of Data: CHSH Violation Vs. Nonergodicity. Entropy 2021, 23, 971. [Google Scholar] [CrossRef] [PubMed]
  3. Shor, O.; Benninger, F.; Khrennikov, A. Towards Unification of General Relativity and Quantum Theory: Dendrogram Representation of the Event-Universe. Entropy 2022, 24, 181. [Google Scholar] [CrossRef] [PubMed]
  4. Wheeler, J.A. Information, Physics, Quantum: The Search for Links. In Proceedings of the III International Symposium on Foun-Dations of Quantum Mechanics, Tokyo, Japan, 28–31 August 1989; pp. 354–358. [Google Scholar]
  5. Smolin, L. Einstein’s Unfinished Revolution: The Search for What Lies beyond the Quantum; Penguin Press: London, UK, 2019. [Google Scholar]
  6. Smolin, L. The Dynamics of Difference. Found. Phys. 2018, 2, 643–653. [Google Scholar] [CrossRef] [Green Version]
  7. Barbour, J.; Smolin, L. Extremal Variety as the Foundation of a Cosmological Quantum Theory. arXiv 1992, arXiv:Hep-th/9203041. [Google Scholar]
  8. Rovelli, C. Relational Quantum Mechanics. Int. J. Theor. Phys. 1996, 35, 1637–1678. [Google Scholar] [CrossRef]
  9. Barbour, J. The End of Time; Oxford University Press: New York, NY, USA, 2000. [Google Scholar]
  10. Barbour, J. The Janus Point: A New Theory of Time; Basic Books: New York, NY, USA, 2020. [Google Scholar]
  11. Barbour, J.; Koslowski, T.; Mercati, F. A gravitational origin of the arrows of time. arXiv 2013, arXiv:1310.5167. [Google Scholar]
  12. Barbour, J.; Koslolwski, T.; Mercati, F. Identification of a gravitational arrow of time. Phys. Rev. Lett. 2014, 113, 181101. [Google Scholar] [CrossRef] [Green Version]
  13. Barbour, J.; Koslolwski, T.; Mercati, F. Entropy and the typicality of universes. arXiv 2015, arXiv:1507.06498. [Google Scholar]
  14. Vladimirov, V.S.; Volovich, I.V.; Zelenov, E.I. p-Adic Analysis and Mathematical Physics; World Scientific: Singapore, 1994. [Google Scholar]
  15. Freund, P.G.O.; Witten, E. Adelic string amplitudes. Phys. Lett. B 1987, 199, 191–194. [Google Scholar] [CrossRef]
  16. Parisi, G. On p-adic functional integrals. Mod. Phys. Lett. A 1988, 3, 639–643. [Google Scholar] [CrossRef]
  17. Khrennikov, A. p-Adic Valued Distributions in Mathematical Physics; Springer: Berlin/Heidelberg, Germany, 1994. [Google Scholar]
  18. Zelenov, E.I. Entropy gain in p-Adic quantum channels. Phys. Part. Nucl. 2020, 51, 485–488. [Google Scholar] [CrossRef]
  19. Frampton, P.H. Particle theory at Chicago in the late sixties and p-Adic strings. J. Phys. A: Math. Theor. 2020, 53, 191001. [Google Scholar] [CrossRef] [Green Version]
  20. García-Compeán, H.; López, E.Y.; Zúñiga-Galindo, W.A. p-Adic open string amplitudes with Chan-Paton factors coupled to a constant B-field. Nucl. Phys. B 2020, 951, 114904. [Google Scholar] [CrossRef]
  21. Dragovich, B. A p-Adic Matter in a Closed Universe. Symmetry 2022, 14, 73. [Google Scholar] [CrossRef]
  22. Parisi, G.; Sourlas, N. P-adic numbers and replica symmetry breaking. Eur. Phys. J. B Condens. Matter Complex. Syst. 2000, 14, 535–542. [Google Scholar] [CrossRef]
  23. Chen, L.; Liu, X.; Hung, L. Emergent Einstein Equation in P-Adic Conformal Field Theory Tensor Networks. Phys. Rev. Lett. 2021, 127, 221602. [Google Scholar] [CrossRef]
  24. Hung, L.-Y.; Li, W.; Melby-Thompson, C.M. P-Adic CFT is a Holographic Tensor Network. J. High Energy Phys. 2019, 2019, 170. [Google Scholar] [CrossRef] [Green Version]
  25. Gubser, S.S.; Heydeman, M.; Jepsen, C.; Marcolli, M.; Parikh, S.; Saberi, I.; Stoica, B.; Trundy, B. Edge Length Dynamics on Graphs with Applications to P-Adic AdS/CFT. J. High Energy Phys. 2017, 2017, 157. [Google Scholar] [CrossRef]
  26. Heydeman, M.; Marcolli, M.; Saberi, I.; Stoica, B. Tensor Networks, P-Adic Fields, and Algebraic Curves: Arithmetic and the AdS_3/CFT_2 Correspondence. Adv. Theor. Math. Phys. 2018, 22, 7639. [Google Scholar] [CrossRef]
  27. Gubser, S.S.; Knaute, J.; Parikh, S.; Samberg, A.; Witaszczyk, P. P-Adic AdS/CFT. Commun. Math. Phys. 2017, 352, 1019–1059. [Google Scholar] [CrossRef] [Green Version]
  28. Khrennikov, A.Y.; Kozyrev, S.V. Replica symmetry breaking related to a general ultrametric space I: Replica matrices and functionals. Phys. A Stat. Mech. Its Appl. 2006, 359, 222–240. [Google Scholar] [CrossRef] [Green Version]
  29. Khrennikov, A.Y.; Kozyrev, S.V. Replica symmetry breaking related to a general ultrametric space—II: RSB solutions and the n→ 0 limit. Phys. A Stat. Mech. Its Appl. 2006, 359, 241–266. [Google Scholar] [CrossRef] [Green Version]
  30. Khrennikov, A.Y.; Kozyrev, S.V. Replica symmetry breaking related to a general ultrametric space III: The case of general measure. Phys. A Stat. Mech. Its Appl. 2007, 378, 283–298. [Google Scholar] [CrossRef] [Green Version]
  31. Khrennikov, A. Information Dynamics in Cognitive, Psychological, Social and Anomalous Phenomena; Springer-Science & Business Media: Dordrecht, The Netherlands, 2004. [Google Scholar]
  32. Albeverio, S.; Khrennikov, A.; Kloeden, P.E. Memory retrieval as a $p$-adic dynamical system. BioSystems 1999, 49, 105–115. [Google Scholar] [CrossRef]
  33. Khrennikov, A. Modelling of psychological behavior on the basis of ultrametric mental space: Encoding of categories by balls. P-Adic Numbers Ultrametric Anal. Appl. 2010, 2, 1–20. [Google Scholar] [CrossRef]
  34. Murtagh, F. Ultrametric model of mind, I: Review. P-Adic Numbers Ultrametric Anal. Appl. 2012, 4, 193–206. [Google Scholar] [CrossRef] [Green Version]
  35. Murtagh, F. Ultrametric model of mind, II: Application to text content analysis. P-Adic Numbers Ultrametric Anal. Appl. 2012, 4, 207–221. [Google Scholar] [CrossRef] [Green Version]
  36. Khrennikov, A. Cognitive processes of the brain: An ultrametric model of information dynamics in unconsciousness. P-Adic Numbers Ultrametric Anal. Appl. 2014, 6, 293–302. [Google Scholar] [CrossRef]
  37. Shor, O.; Glik, A.; Yaniv-Rosenfeld, A.; Valevski, A.; Weizman, A.; Khrennikov, A.; Benninger, F. EEG p-adic quantum potential accurately identifies depression, schizophrenia and cognitive decline. PLoS ONE 2021, 16, e0255529. [Google Scholar] [CrossRef]
  38. Palmer, T.N. Discretization of the Bloch sphere, fractal invariant sets and Bell’s theorem. Proc. R. Soc. A 2020, 476, 20190350. [Google Scholar]
  39. Hossenfelder, S.; Palmer, T. Rethinking Superdeterminism. Front. Phys. 2020, 8, 139. [Google Scholar] [CrossRef]
  40. Atmanspacher, H. Determinism is ontic, determinability is epistemic. In Between Chance and Choice: Interdisciplinary Perspectives on Determinism; Atmanspacher, H., Bishop, R.C., Eds.; Imprint Academic: Thorverton, UK, 2002; pp. 49–74. [Google Scholar]
  41. Atmanspacher, H.; Primas, H. Epistemic and ontic quantum realities. In Time, Quantum and Information; Castell, L., Ischebeck, O., Eds.; Springer: Berlin/Heidelberg, Germany, 2003. [Google Scholar]
  42. Hertz, H. The Principles of Mechanics: Presented in a New Form; Macmillan: London, UK, 1899. [Google Scholar]
  43. Boltzmann, L. Uber die Frage nach der objektiven Existenz der Vorgnge in der unbelebten Natur. In Populre Schriften; Barth, J.A., Ed.; Springer: Leipzig, Germany, 1905. [Google Scholar]
  44. Khrennikov, A. Quantum epistemology from subquantum ontology: Quantum mechanics from theory of classical random fields. Ann. Phys. 2017, 377, 147–163. [Google Scholar] [CrossRef] [Green Version]
  45. Khrennikov, A. Hertz’s Viewpoint on Quantum Theory. Act. Nerv. Super. 2019, 61, 24–30. [Google Scholar] [CrossRef] [Green Version]
  46. Barbour, J. Shape Dynamics. An Introduction. arXiv 2011, arXiv:1105.0183. [Google Scholar]
  47. Mercati, F. A Shape Dynamics Tutorial. arXiv 2014, arXiv:1409.0105. [Google Scholar]
  48. Bohr, N. The Quantum Postulate and the Recent Development of Atomic Theory; R. & R. Clarke, Limited: Edinburgh, Scotland, 1928; pp. 580–590. [Google Scholar]
Figure 1. Probability density function of natural numbers representing the p-adic expansion representing an added event. We generated base 50 random numbers and added 6000 times another random number ( E n + 1 ) to them, resulting in 51 dendrogram edges. The extra event was added under the restriction that D n   and   D n + 1 both had a number of levels equal to 9. We repeated the procedure for 100 base 50 random numbers. For all 100 base 50 random numbers we show the distribution of the possible value of the natural number V n + 1 representing E n + 1 . About 400 such natural number values occurred out of 512.
Symmetry 14 01089 g001
Figure 2. Probability density function of natural numbers representing the p-adic expansion representing an added event. We generated only one base 50 random number and added 600,000 times another random number ( E n + 1 ) to them, resulting in 51 dendrogram edges. We show the distribution of the possible value of the natural number V n + 1 representing E n + 1 . About 80 such natural number values occurred out of 512.
Symmetry 14 01089 g002
Figure 3. Possible rearrangements of dendrogram structure upon adding a new event. We generated only one base 50 random number events E 1 E 50 and added 600,000 times another random number ( E n + 1 ) to them, resulting in 51 dendrogram edges. The extra event was added with the restriction that D n   and   D n + 1 both had a number of levels equal to 9. We checked, for each iteration, how many of the base 50 events’ p-adic representation changed upon adding the extra event E 51 .
Symmetry 14 01089 g003
Figure 4. Probability density function of natural numbers representing the p-adic expansion representing an added event. We generated base 50 random numbers and added 6000 times of another random number ( E n + 1 ) to them, resulting in a dendrogram with 51 edges. The extra event was added without the restriction that D n   a n d   D n + 1 and both had a number of levels equal to 9. We repeated the procedure for 100 base 50 random numbers. For all 100 base 50 random numbers we show the distribution of the possible value of the natural number V n + 1 representing E n + 1 . About 400 such natural number values occurred out of 512.
Symmetry 14 01089 g004
Figure 5. Possible rearrangements of the dendrogram structure upon adding a new event. We generated only one base 50 random number events E 1 E 50 and added 600,000 times of another random number ( E n + 1 ) to them, resulting in a dendrogram with 51 edges. The extra event was added without the restriction that D n   and   D n + 1 and both had a number of levels equal to 9. We checked, for each iteration, how many of the base 50 events the p-adic representation changed upon adding the extra event E 51 .
Symmetry 14 01089 g005
Figure 6. Number of levels of the new D n + 1 upon edding the E n + 1 . We generated only one base 50 random number events E 1 E 50 and added 600,000 times of another random number ( E n + 1 ) to them, resulting in a dendrogram with 51 edges. The extra event was added without the restriction that D n   and   D n + 1 and both had a number of levels equal to 9. We checked, for each iteration, what N ( D 51 ) would be when N ( D 50 ) = 9 .
Symmetry 14 01089 g006
Figure 7. Shape complexity measure of dynamically growing dendrograms. (A). We started with only one base 50 random number events E 1 E 50 and added each time an extra event E n , where n = 51, 52, …, 5000, resulting in a dendrogram sequence D 50 , D 51 . D 5000 . For each dendrogram we computed its shape complexity measure. (B) Histogram of the shape complexity measure values of the 4950 dendrogram structures.
Symmetry 14 01089 g007
Figure 8. Shape complexity measure of the p-adic representation of the next added event. (A) We started with only one base 50 random number events E 1 E 50 and added each time an extra event E n , where n = 51, 52, …, 5000, resulting in a dendrogram sequence D 51 . D 5000 and a p-adic representation of the added event E 51 . E 5000 . For each such event we computed the shape complexity measure of its p-adic representation in the   D n dendrogram. (B) Histogram of the shape complexity measure values of the p-adic representation of the   E n event in the   D n dendrogram of the 4950 events.
Symmetry 14 01089 g008
Figure 9. Shape complexity measure of the p-adic representation in the dendrogramic three-body system. We created for that purpose 400 static dendrograms (each event was created in an increasing temporal manner) each with 5000 events/edges. (A) Calculating the mean complexity measure of each sequence’s first n values, where n = 100, 200, …, 4900. We show the mean ± SE of this mean value of across the 400 dendrograms generated in the past–present system when the present is moved in the direction of the future (red trace-real temporal order blue trace-randomized temporal order). (B) Calculating the mean complexity measure of each sequence’s first n values, where n = 100, 200, …, 4900. We show the mean ± SE of this mean value across the 400 dendrograms generated in the future–present system and their mean value when the present is moved in the direction of the future (red trace-real temporal order blue trace-randomized temporal order) (C) Calculating the mean complexity measure of each sequence’s first n values, where n = 100, 200, …, 4900. We show the mean ± SE of this mean value across the 400 dendrograms generated in the past–present–future system when the present is moved in the direction of the future. (red trace-real temporal order blue trace-randomized temporal order).
Symmetry 14 01089 g009
Figure 10. Double shape complexity measure of the p-adic representation in the dendrogramic three-body system. For that purpose, we created 400 static dendrograms (each event was created in an increasing temporal manner), each with 5000 events/edges. (A) Calculating the mean double complexity measure of each sequence’s first n values, where n = 100, 200, …, 4900. We show the mean ± SE of this mean value across the 400 dendrograms generated in the past–present system when the present is moved in the direction of the future (red trace-real temporal order blue trace-randomized temporal order). (B) Calculating the mean double complexity measure of each sequence’s first n values, where n = 100, 200, …, 4900. We show the mean ± SE of this mean value across the 400 dendrograms generated in the future–present system when the present is moved in the direction of the future (red trace-real temporal order blue trace-randomized temporal order). (C) Calculating the mean double complexity measure of each sequence’s first n values, where n = 100, 200, …, 4900. We show the mean ± SE of this mean value across the 400 dendrograms generated in the past–present–future system when the present is moved in the direction of the future (red trace-real temporal order blue trace-randomized temporal order).
Symmetry 14 01089 g010
Figure 11. Shape complexity measure of the p-adic representation of a random number. For that purpose, we created 800 temporal sequences (each event/random number was created in an increasing temporal manner) of 5000 random numbers. We then calculated for each number in each sequence its p-adic representation shape complexity measure. (A) We then calculated for each sequence the mean complexity measure of its first n values, where n = 300, 400, 4900. We show the mean ± SE across the 800 sequences. (B) We calculated for each sequence the mean double complexity measure of its first n values, where n = 300, 400, 4900. We show the mean ± SE of this mean value of across the 800 sequences.
Symmetry 14 01089 g011
Publisher’s Note: MDPI stays neutral with regard to jurisdictional claims in published maps and institutional affiliations.