Abstract
With the advantage of in situ measurement, the three-probe method is commonly used to measure either the error motion of high-precision spindles or the roundness error of artifacts. The roundness error of artifacts or spindle errors can be obtained through solving error-separation equations. Both the time- and frequency-domain solutions of the three-probe method are presented. In addition, the key points of solutions, i.e., the rounding error induced by inconsistency of sampling points, harmonic suppression, and averaging schemes of multiple revolutions into one circle, are described in detail. Experiments were conducted to compare the two solutions and quantify the influence of setup parameters, including rotational speed probe arrangement, consistency of sampling points, and number of revolutions. The results showed that the roundness error of the time-domain solution was inaccurate due to large rounding errors, while that of the frequency-domain solution with the previous average scheme was accurate. In contrast, the spindle error of the frequency-domain solution with the latter average scheme was more reliable. The findings provided a reference to recommend setup parameters depending on the aim of the three-probe method.
1. Introduction
Error-separation techniques (EST) have been practically used to measure roundness errors or motion errors in precision engineering with specifically designed measurement setups and special mathematical models. Either roundness errors or motion errors can be separated from error equations. Three valuable ESTs include the reversal method [1], the multi-probe method [2] and the multistep method [3], amongst which the three-probe method has the advantage of in situ measurement and has been studied by many researchers.
References [4,5,6] used the three-probe method to measure the roundness and cylindricity of large cylinders. However, the three-probe method has a wider application in the measurement of spindle error motion [7,8] where the roundness errors introduced by imperfect artifacts must be removed from the indicator of probes.
With the help of the Fast Fourier Transform (FFT), the error-separation equation of the three-probe method can be solved in the frequency domain. Harmonic suppression is a major problem of frequency-domain solutions, and extensive efforts are made to improve the separation accuracy. Aiming at mitigating harmonic suppression, studies [9,10] have proposed improvement methods: the angle configuration between sensors; acquisition parameter settings; and sensor installation direction, respectively. Tiainen [11] studied the effect of positional errors on the accuracy of roundness error in multi-probe methods through simulation. Huang [12] proposed a difference algorithm of the roundness error in error-separation equations of three-probe measurement, and investigated the effect of rounding error which is caused by inconsistency of sampling points. References [13,14] studied the measurement-uncertainty of the spindle error-separation techniques.
Some researchers have tried to calculate the roundness error in the time domain directly. Jeong [15] proposed a recursive method which rewrites the error-separation equation into a recursive form of roundness error by setting a two-times relationship of probe arrangements. The drawback of this method is the difficulty in setting the initial value of the recurrence equation, and a usual setting of zero will cause inaccuracy of roundness error [16]. Meanwhile, the recursive method is only effective when the sampling points are consistent. Ma [17] further proposed a new recursive method in the time domain aiming at determining the relationships of inconsistent sampling groups. Lei [18] presented a matrix algorithm to directly solve the roundness error based on the invariability and periodicity of the measured round contour.
The above references focused either on the frequency or the time-domain solution, and comparisons were not mentioned. This paper presents both the frequency and time-domain solutions. The key points which affect the accuracy of the solutions are described in detail. Experiments were designed to compare the roundness error and the spindle error obtained from the two methods under various measurement conditions, and the key influencing of setup parameters are found out, to provide recommendations for the application of the three-probe method.
2. Theory of Three-Probe Measurement
2.1. The Error-Separation Equations
Figure 1 shows the scheme of the three-probe method. Three displacement sensors, denoted as v1, v2 and v3, are placed around the artifact. The indicators v2 and v3 are separated from v1 by angles α and β in the x-y plane. The reading of each sensor is a combination of the roundness error of the artifact and the error-motion of the spindle. s characterizes the roundness error of the artifact; x and y characterize the components of the error-motion of the spindle.
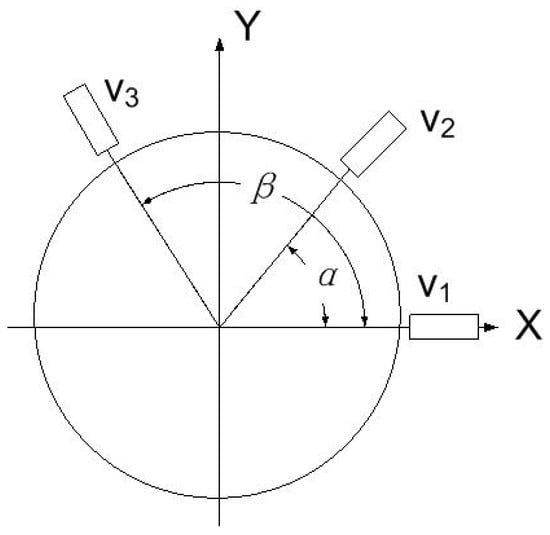
Figure 1.
The principle of the three-probe method.
The error-separation equations of the three-probe method are expressed as:
The three runout datasets in Equations (1)–(3) can be linearly combined into dataset v:
By choosing a, b, c properly, the error motion signal x and y can be eliminated. Equation (4) can be simplified to:
where:
In special case 1, α = 180°, a = b = 1, c = 0
In special case 2, when β = α + 180°, a = b = 1, c = 0
In general cases, a = 1, b = −sinβ/sin(β − α), c = sinα/sin(β − α).
Equation (5) can be solved in frequency domain method and time domain method.
After the roundness error is derived, the x and y component of the spindle error motion can be calculated through the following equation:
During workpiece machining, sensitive direction is defined as the direction perpendicular to the workpiece surface at the functional point. For a spindle of milling or a machining center, sensitive direction rotates synchronously with angular position, called rotating sensitive direction. In this case, the radial error motion of the axis is calculated in the rotating-sensitive direction as:
where r0 is the radius of a basic circle superimposed on the radial error motion to avoid the negative error motion values and for visual representation.
Similarly, the roundness error can also be superimposed on the same basic circle when plotted in polar plot.
2.2. Time-Domain Solution
Equation (5) can be discretized through the relationship θi = 360(i − 1)/N, where θi is the i-th rotational angle, and N is the total number of points in a revolution. The discretized form of Equation (5) is:
where: k is the index number, k = 1, 2, 3, …, N; v(k) is the combined signal sequence of the three probes; s(k) is the roundness error sequence contained in v1(k); s(k + m1) and s(k + m2) are the roundness error sequences contained in probe 2 and probe 3; and m1 and m2 correspond to angle α and β, which can be calculated as:
The roundness error sequence s(k) is written as:
where si is the roundness error at i-th index number.
Due to periodicity, the roundness error sequences of s(k), s(k + m1) and s(k + m2) are the same except for time-delay. The time-delay is related to the angles between the sensors; s(k + m1) and s(k + m2) can be written as:
Consequently, N linear equations are obtained and the roundness errors sequence can be solved simultaneously:
Rearrange the above equation into matrix form:
where:
Λ denotes the identity matrix. O denotes the matrix with element 0. The dimensions of the matrix are shown in the corresponding subscripts. The roundness error can be derived through following equation:
Only when H is a full-rank matrix does Equation (15) have a unique solution. Although the three components of H in Equation (15) are full-rank, the sum of them may rank deficient and lead to infinite solutions.
When m1 and m2 are integers, the sampling points from the three probes are the same group. Otherwise, the sampling points of the three probes are not the same group, indicating inconsistency. It is further noted that the consistency of sampling points contradicts the full-rank matrix H, i.e., integer m1 and m2 lead to a deficient-rank matrix H. However, rounding non-integer m1 and m2 into integers derives a full-rank matrix H with the introduction of unavoidable rounding errors.
One key point is that the unique time-domain solution exists with inconsistent sampling points as well as rounding errors.
Figure 2 gives an example of the consistency of the sampling points in a probe arrangement of 0–127–225°. When N = 360, the angle interval is 1°, and the three probes share the same sampling-points group. However, when N = 200, probe v2 has sampling points inconsistent with the other two probes.
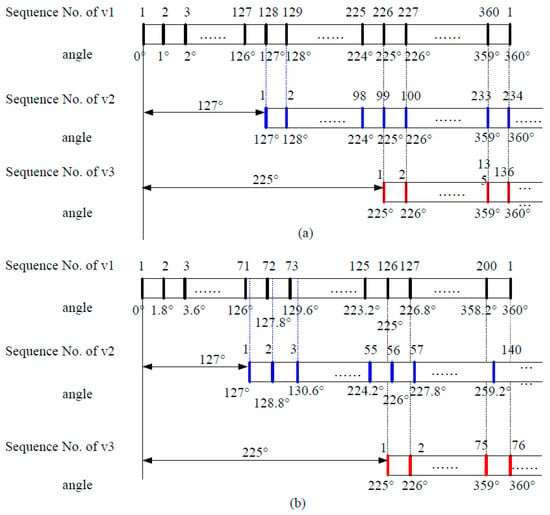
Figure 2.
Example of consistency of the sampling points of three probes in probe arrangement of 0–127°–225°: (a) N = 360, (b) N = 200.
Table 1 lists the rank of matrix H. It is clear that the consistency of sampling points leads to the deficient rank of matrix H. In the inconsistency case, after rounding non-integer m1 to integer, matrix H becomes full and leads to a unique time-domain solution. The rounding error is further quantified in Section 3.

Table 1.
Ranks of matrix H.
2.3. Frequency-Domain Solution
Applying the Fourier Transformation to Equation (5), Equation (18) is obtained:
Defining W(n) as transfer function:
the roundness error of the frequency domain is obtained:
Harmonic components satisfying W(n) ≠ 0 constitute the roundness error in the frequency domain. And the time sequence of the roundness error can be obtained from an inverse Fourier Transformation:
Three key points are addressed to achieve the frequency time-domain solution:
2.3.1. Symmetry of Transfer Function W(n)
It is clear that W(n) should be a symmetrical function with the same symmetrical axis with Fv(n). Otherwise, the resultant Fs(n) is an asymmetrical spectrum and results in a complex sequence of roundness errors in time-domain, which is of no meaning.
Theoretically, the spectrum of Fv(n) obtained from FFT is symmetric about the X-axis. But generally, in order to avoid the negative-frequency domain, frequency shifting is carried out for Fv(n) and a new axis of symmetry appears.
In the negative-frequency domain, W(−n) is expressed as:
Since W(−n) is the conjugated complex of W(n), W(n) is symmetrical about the X-axis. Similarly, frequency shifting is carried out for W(n) to keep its symmetry about the same axis with Fv(n). By doing so, a symmetrical roundness error Fs(n) results, and leads to a real-number sequence in time-domain through inverse FFT.
2.3.2. Harmonic Suppression
Harmonics satisfying W(n) = 0 fail to appear in Fs(n) and thus disappear in the resulted roundness error, which is called harmonic suppression.
where Kh denotes the suppressed harmonic numbers of FFT, nα = 1, 2, …, and nβ = 1, 2, ….
The suppressed frequencies of harmonic numbers are the product of the frequency interval and harmonic numbers. Since the frequency interval is the quotient of sampling rates and the number of sampling points, the suppressed frequencies are highly related to the number of points of FFT. It is apparent that the first harmonic number is suppressed due to Equation (6).
A conversion is made from the harmonics of FFT to rotation-harmonics for convenience, to obtain the multiples of rotation frequency when it comes to rotating machinery.
Kr is the rotation-harmonic number; Δf is the frequency interval of FFT; fr is the rotation frequency; fs is sampling rates; L is the number of points for FFT; N is the number of points sampled per revolution.
2.3.3. The Average Schemes
Usually, multiple revolutions of points are measured, and an average is made to derive the roundness error of a revolution for sake of reducing random error. The average scheme affects the number of points for FFT, thus leading to an effect on the suppressed-rotation-harmonic numbers. When averaging multiple revolutions before FFT, the number of points for FFT is N, i.e., L = N; this is called the previous averaging scheme, and the suppressed-rotation-harmonic numbers remain the same as those of FFT. However, when the average is made after FFT, the actual number of points for FFT is L, and it meets L = NcN, where Nc is the number of revolutions. This is called the latter averaging scheme; the integer harmonic numbers of FFT turn to rotation interhamonic numbers due to the linear coefficient 1/Nc.
3. Experiments
3.1. Test Rig
The tester was built with the commercial spindle (IBAG120AI36HK-00) of a machine center. The spindle was supported with high-precision hybrid ceramic angular ball bearing from SKF. The bearings of the spindle were oil-gas lubricated.
According to ISO 230-7 [19], the recommended instrument for spindle measurements is a non-contact linear displacement sensor insensitive to the metallographic vibration of the test artifact, with adequate range, resolution, thermal stability, accuracy, and bandwidth. Amongst three major non-contact displacement sensors, i.e., laser, capacitive and inductive sensors, only the inductive sensor remains the best choice when non-contaminants such as dust, water, coolant or oil are present in the testing environment. Taking into consideration the fact that the oil-gas mixture is ejected to the artifact surface through the gap between the rotating shaft and stationary parts during rotation, inductive sensors were used.
Three eddy-current-displacement sensors and drives (Micro-epsilon S1 probe and DT 3010 driver) were calibrated for the artifact before the test. With regard to the electrical runout effect, the artifact was made of paramagnetic material, which leads to the lowest electrical runout [20]. In addition, the artifact was three times larger in diameter than the probe tip. The data-acquisition system was built with device NI 6366 and Labview software. The measurement-uncertainty of the measurement system composed of the eddy-current sensors was 0.65μm.
Figure 3 shows the test rig. The test section was provided by an artifact clamped at the front end of the spindle. Three eddy-current-displacement sensors were fixed on the vernier holder, which was installed on the master scale holder, and could slide circumferentially to adjust the installation angle of the sensor. The reading of the angle was obtained from a combination of master scale and vernier.
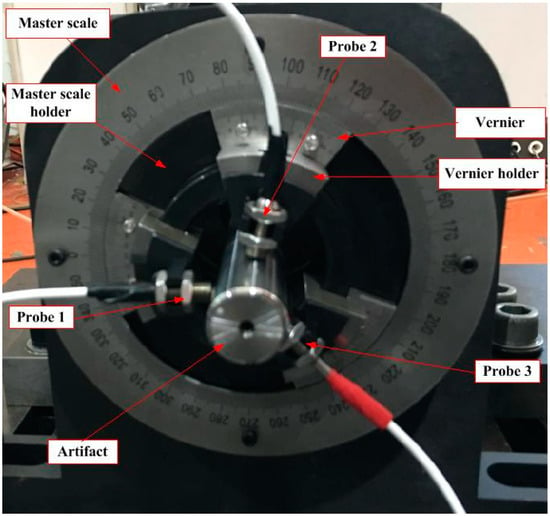
Figure 3.
Test rig of the three-probe method.
Table 2 lists four experiment conditions, including probe arrangements, rotational speed, the number of sampling points per circle, and sampling rate. It is noted that the last three parameters were not independent of each other. Once two parameters were determined, the other was also determined.

Table 2.
Experiment Conditions.
3.2. Analysis of Time-Domain Solution
According to Section 2.2, the unique time-domain solution exists with rounding error introduced by inconsistency of sampling points. Figure 4 shows the polar plot of the time-domain solution in Experiment 1. The target rotation-harmonic number was set to 10. It was achieved through a Butterworth filter with a low-pass cutoff frequency of 10 times of rotation. The revolution was set as 50. It was clear that the roundness errors presented a heart-shape with an apparent eccentricity, which indicated that the centre of the roundness error shape did not coincide with the centre of the polar coordinates. The spindle error presented a three-lobe shape. In order to further compare the result, the least square circle method was used to evaluate the roundness error as well as the spindle error. The radial difference between the two reference circles passing through the least square centre of the polar plot was defined as the corresponding values.
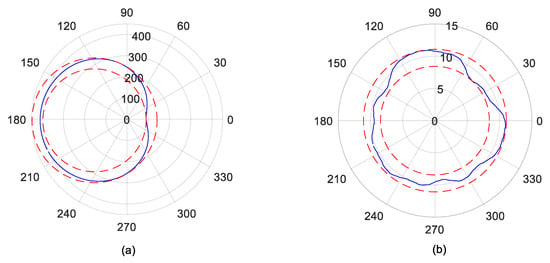
Figure 4.
Polar plot of time-domain solutions in Experiment 1: (a) roundness error; (b) spindle error. Units: μm.
Table 3 lists the values of the time-domain solutions. It was observed that the roundness error value reached 51.5 μm, which is too large for a standard tested artifact. This indicated that the time-domain solution is disadvantageous in separating roundness errors. The spindle error value was about 2.6 um.

Table 3.
Time-domain solution Values in experiment 1.
3.3. Analysis of Frequency-Domain Solution
According to Section 2.3, the average schemes affect the suppressed harmonics, and consequently affect the frequency-domain solutions. The suppressed-rotation-harmonic numbers are listed in Table 4.

Table 4.
Suppressed harmonics.
In the previous average schemes, the first rotation number was suppressed in all the experiments. Experiment 2 presented more suppressed-rotation-harmonic numbers than the other three experiments. If only the first 10 rotation-harmonic numbers are considered, all the experiments only suppressed the same first rotation-harmonic number, indicating that they presented close roundness errors. However, in the latter average scheme, interharmonic rotation numbers were suppressed.
Figure 5 shows the intermediate and final results of the frequency-domain solution under two average schemes in experiment 1.
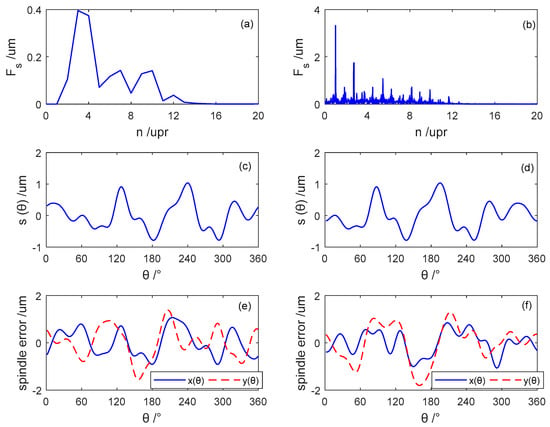
Figure 5.
Intermediate and final results of the frequency-domain solutions under the two average schemes in Experiment 1: (a) the frequency-domain roundness error in the previous average scheme; (b) the frequency roundness error in the latter average scheme; (c) the time-domain roundness error in the previous average scheme; (d) the time-domain roundness error in the latter average scheme; (e) the spindle error in previous average scheme; (f) the spindle error in the latter average scheme. “upr”, short for undulation per revolution, is used to stress n as a rotation-harmonic number.
Figure 5a–d plots the roundness error in both the frequency domain and the time domain. It is clear to see that the roundness error in the frequency domain presented a significant difference in both components and amplitudes. The latter average scheme contained more rotation-harmonic components. The root cause was the larger number of points participant in FFT under the latter average schemes. In agreement with Table 4, the first rotation-harmonic number was remained in the latter average scheme while suppressed in the previous average scheme. The components in the roundness error under the previous scheme were the rotation-harmonic numbers, and the third and fourth rotation-harmonic numbers presented large amplitudes. On the contrary, the components in the roundness error under the latter scheme had not only rotation-harmonic numbers but also interhamonic rotation numbers, among which the first rotation-harmonic number was of the largest amplitude.
Although the difference of rotation-harmonic components in the roundness error was obvious, the resultant roundness errors in the time domain presented quite similarly in both amplitude and pattern.
Figure 5e,f plots the spindle error motion components. Although the total trend of spindle error motion under the two average schemes presented closely, the x and y components contained more waves, which corresponds to more frequency components.
4. Analysis of Influencing Factors
Since the time-domain solution had unavoidable rounding errors which present low accuracy, only the frequency-domain solution was considered in this section.
4.1. Rotational Speed
Theoretically, the roundness profile of the artifact is objective and thus the roundness error should be irrelevant to the measuring condition. In fact, the roundness error was obtained through separation from measured data. Thus, it was affected by the rotational speed, and the greater the influence of the rotational speed, the lower the separating accuracy of the three-probe method in separating roundness error and spindle error.
Comparing Experiments 3 and 4, the effect of rotational speed on the polar plots of the frequency-domain solutions is shown in Figure 6. The number of revolutions was set as 50. The concerned rotation-harmonic number range was within 10.
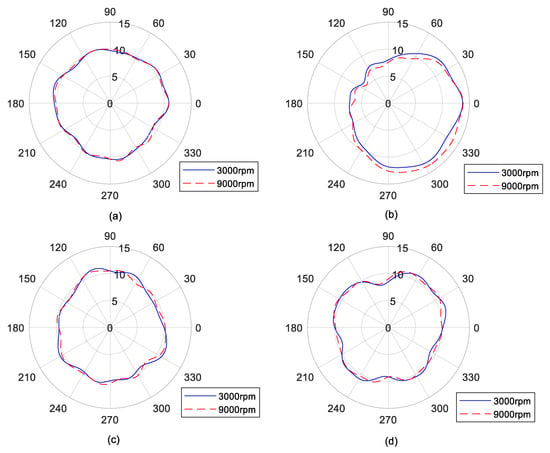
Figure 6.
The effect of rotational speed on the polar plot of the frequency-domain solutions: (a) the roundness error under previous scheme; (b) the roundness error under the latter scheme; (c) the spindle error under the previous scheme; (d) the spindle error under the latter scheme. Units: μm.
Table 5 lists the frequency-domain values under the two rotational speeds. As rotational speed increased, the spindle error value presented 14.8% of decrease under the previous average scheme, and 12.1% of decrease under the latter average scheme. Although the spindle error decreased under both average schemes, the roundness error value showed a slight change. The maximum change was less than 1% under the previous average scheme, and 2.7% under the latter average scheme. This indicates that the three-probe method is accurate to separate roundness from the measured data, and the obtained spindle error is reliable.

Table 5.
The effect of rotational speed on frequency-domain solution values.
4.2. Consistency of Sampling Points
It can be seen from Section 2, that consistency of the sampling points of the three probes leads to infinite time-domain solutions, and inconsistency of the sampling points leads to a unique time-domain solution as well as rounding error. In contrast, the unique frequency-domain solution exists in both cases, and the inconsistency also leads to rounding errors.
By comparing Experiments 1 and 3, the effect of consistency of sampling points on the polar plots of the frequency-domain solutions is shown in Figure 7. The number of revolutions remained at 50. The target harmonic order was set as 10. The polar plots of roundness and spindle error presented similarly.
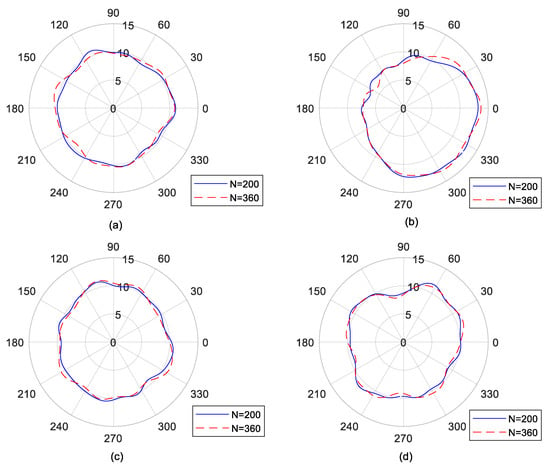
Figure 7.
The effect of consistency of sampling points on the polar plot of frequency-domain solutions: (a) roundness error under the previous scheme; (b) roundness error under the latter scheme; (c) spindle error under the previous scheme; (d) spindle error under the latter scheme. Units: μm.
Table 6 lists the roundness error values and the radial spindle error values calculated from the two average schemes. It is clear that consistency of sampling points led to less than 1% of change in roundness error values and 8.4% of change in spindle error values under the previous average scheme. However, the effect of consistency of sampling points on the latter average scheme was totally contrary. The roundness error presented a 25.4% increase, and the spindle error showed less-than-1% change. In other words, the rounding error introduced by inconsistency of sampling points was negligible for roundness error only in the previous average scheme. For spindle error, it was negligible in the latter average scheme. This provides a recommendation for choosing the average scheme depending on the purpose of the three-probe method. If the aim is to obtain the roundness error, the previous average scheme is non-sensitive to the rounding error. If the aim is to measure the spindle error, latter average scheme is preferred.

Table 6.
The effect of consistency of sampling points on frequency-domain solution values.
4.3. Probe Arrangement
By comparing Experiments 1 and 2, the effect of the probe arrangement on the polar plots of the frequency-domain solutions is shown in Figure 8. The rotational speed was set as 3000 rpm. The number of revolutions was set as 50. The target harmonic order was set as 10. Under the two probe arrangements, the polar plots of the roundness errors in the previous average schemes were quite close, with no eccentricity, while with obvious eccentricity in latter schemes. In spite of the difference, the polar plot of spindle error under the two probe arrangements in the two average schemes tended towards a three-lobe polar plot, to some extent, compared to the time-domain solution.
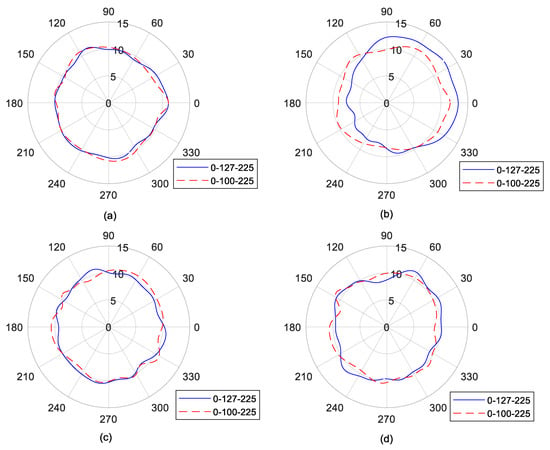
Figure 8.
The effect of probe arrangement on the polar plot of the frequency-domain solutions under the two average schemes: (a) roundness error under the previous scheme; (b) roundness error under the latter scheme; (c) spindle error under the previous scheme; (d) spindle error under the latter scheme. Units: μm.
Table 7 lists the frequency-domain solution values under the two probe arrangements. It was observed that the values of roundness under the two probe arrangements were very close under the previous average scheme. This was in agreement with the fact that the two probe arrangements suppressed the same first rotation-harmonic number of roundness error within the concerned range. Comparatively, the probe arrangements had a great effect on the roundness error under the latter average scheme. From Table 4, it can be seen that the probe arrangement 0–100–225 suppressed more interhamonic rotation numbers than the other, so the roundness error presented more distortion and the value of roundness increased by 20.7%.

Table 7.
The effect of probe arrangement on Frequency-domain solution values.
The effect of the probe arrangement on the spindle error values was the same with the roundness error. The probe arrangement 0–100–225 led to a 2.5% increase of spindle error value under the previous average scheme and a 26.7% decrease under the latter average scheme. The time-domain method at the probe arrangement 0–127–225 used the same measured data with the frequency-domain method, and the spindle error value from the time-domain method was between the values of the two average schemes. This indicates that the time-domain method can lead to a reliable spindle error.
4.4. Number of Revolutions
As mentioned in the second key point of Section 2.3, the number of revolutions Nc defines the rotation interhamonic numbers, and thus leads to influence of frequency-domain solution.
Figure 9 shows the effect of the number of revolutions on the polar plots of frequency-domain solutions in Experiment 1. The target rotation-harmonic number is 10. It is shown that the number of revolutions has an obvious influence on roundness error and spindle error under both two average schemes.
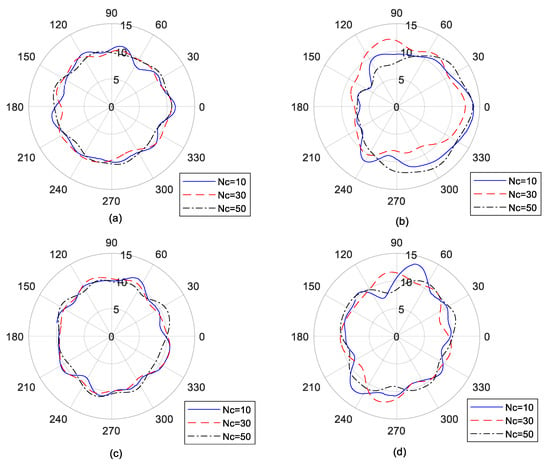
Figure 9.
The effect of the number of revolutions on the polar plot of frequency-domain solutions: (a) roundness error under the previous scheme; (b) roundness error under the latter scheme; (c) spindle error under previous scheme; (d) spindle error under the latter scheme. Units: μm.
Figure 10 shows the effect of the number of revolutions on roundness error values and spindle error values under both average schemes. Compared to the previous average scheme, the latter average scheme led to a large change of roundness error and spindle error values when the number of revolutions changed, indicating that the latter average scheme is more sensitive to the number of revolutions.

Figure 10.
The effect of the number of revolutions on values of frequency-domain solutions: (a) roundness error value; (b) spindle error value.
The 40 revolutions led to a minimum roundness error and spindle error under both schemes. And the value differences between the two schemes were the minimum. The difference of roundness error value was 3.6% and 11.4% for the spindle error value. Below 40 revolutions, the roundness error and the spindle error values decreased as the number of revolutions increased. Beyond 40 revolutions, the roundness error value remained constant while the spindle error value increased 11%.
Although ISO 230-7 suggested a minimum number of revolutions of 20 for spindle error evaluation, more revolutions led to better results. And for roundness error evaluation, at least 40 revolutions were needed.
5. Conclusions
Both the time- and frequency-domain solutions of the three-probe method were analyzed and compared through experiment. The rounding error introduced by inconsistency of the sampling points of the three probes was evident. Harmonic suppression of frequency-domain solution was described in detail and the effects of influencing factors were quantified, such as average schemes of multiple revolutions into one circle, probe arrangement, and number of revolutions.
- (1)
- The separating accuracy between rounding error and spindle error was demonstrated through the rotational speed experiments.
- (2)
- When the three-probe method aim was to obtain the roundness error, the previous average scheme of frequency-domain solution was recommended. When the aim was to measure spindle error, the latter average scheme of frequency-domain solution and time-domain solution was preferred.
- (3)
- The probe arrangement leading to less suppressed harmonic was preferred, and the number of revolutions was suggested to be at least 40 for roundness error to keep constant.
The limitation of this paper is that the time-sampling scheme was adopted in the experiments, which could not consider the influence of inconsistency of sampling points caused by variation of rotational speed. The angular sampling scheme through a rotary encoder is more reliable, and is planned for future studies.
Author Contributions
Conceptualization, C.Z.; methodology, C.Z. and M.Z.; validation, C.Z., Z.C. and M.Z.; formal analysis, C.Z. and M.Z.; investigation, C.Z. and Z.C.; resources, C.Z.; data curation, M.Z.; writing—original draft preparation, M.Z. and J.G.; writing—review and editing, M.Z., J.G. and C.Z.; visualization, M.Z.; supervision, C.Z. and Z.C.; project administration, J.G.; funding acquisition, C.Z. All authors have read and agreed to the published version of the manuscript.
Funding
This work was supported in part by Foundation of Guangdong Provincial Key Laboratory of High-Performance Servo System (Grant 2020B121202017).
Institutional Review Board Statement
Not applicable.
Informed Consent Statement
Not applicable.
Data Availability Statement
Not applicable.
Conflicts of Interest
The authors declare no conflict of interest.
References
- Cui, H.; Lei, D.; Zhang, X.; Lan, H.; Jiang, Z.; Kong, L. Measurement and analysis of the radial motion error of aerostatic ultra precision spindle. Measurement 2019, 137, 624–635. [Google Scholar] [CrossRef]
- Chen, Y.; Zhao, X.; Gao, W.; Hu, G.; Zhang, S.; Zhang, D. A novel multi-probe method for separating spindle radial error from artifact roundness error. Int. J. Adv. Manuf. Technol. 2017, 93, 623–634. [Google Scholar] [CrossRef]
- Qiao, L.X.; Chen, J.N.; Che, W.H.; Zhang, L.; Tian, J. A High-precision Spindle Error Separation Algorithm Based on Multi-step Process. Acta Metrol. Sinica 2018, 39, 6–11. [Google Scholar]
- Bai, J.; Wang, Y.; Wang, X.; Zhou, Q.; Ni, K.; Li, X. Three-Probe Error Separation with Chromatic Confocal Sensors for Roundness Measurement. Nanomanuf. Metrol. 2021, 4, 247–255. [Google Scholar] [CrossRef]
- Liu, W.; Zhou, X.; Hu, Y.; Hu, P. A v-block three-probe separation technique for portable measurement of cylindricity. Precis. Eng. 2019, 59, 37–46. [Google Scholar] [CrossRef]
- Liu, W.; Fan, K.; Hu, P.; Hu, Y. A parallel error separation method for the on-line measurement and reconstruction of cylindrical profiles. Precis. Eng. 2018, 51, 1–9. [Google Scholar] [CrossRef]
- Lee, D.H.; Lee, W.R. Easy measuring instrument for analyzing the radial and tilt error motions of a rotating shaft. Proc. IMechE J. Eng. Marit. Environ. 2017, 23, 667–674. [Google Scholar] [CrossRef]
- Niu, Z.; Chen, Y.L.; Matsuura, D.; Lee, J.C.; Kobayashi, R.; Shimizu, Y.; Ito, S.; Gao, W.; Oh, J.S.; Park, C.H. Precision measurement of Z-slide vertical error motion of an ultra-precision lathe by using three-probe method. Int. J. Precis. Eng. Manuf. 2017, 18, 651–660. [Google Scholar]
- Ding, F.; Luo, X.; Chang, W.; Wang, Z. In Situ Measurement of Spindle Radial and Tilt Error Motions by Complementary Multi-probe Method. Nanomanuf. Metrol. 2019, 2, 225–234. [Google Scholar] [CrossRef]
- Baek, S.W.; Kim, M.G.; Lee, D.H.; Cho, N.G. Multi-probe system design for measuring the roundness and rotation error motion of a spindle using an error separation technique. Proc. IMechE Part B J. Eng. Manuf. 2019, 233, 1547–1560. [Google Scholar] [CrossRef]
- Tiainen, T.; Viitala, R. Effect of positional errors on the accuracy of multi-probe roundness measurement method. Mech. Syst. Signal Process. 2020, 144, 106883. [Google Scholar] [CrossRef]
- Huang, R.; Pan, W.; Lu, C.; Zhang, Y.; Chen, S. An improved three-point method based on a difference algorithm. Precis. Eng. 2020, 63, 68–82. [Google Scholar] [CrossRef]
- Cappa, S.; Reynaerts, D.; Bender, F.A. A sub-nanometre spindle error motion separation technique. Precis. Eng. 2014, 38, 458–471. [Google Scholar] [CrossRef]
- Shi, S.; Zhang, H.; Qu, J.; Jin, G.; Kuschmierz, R.; Czarske, J. Measurement uncertainty propagation in spindle error separation techniques-Investigation by means of stochastic spectral method. Int. J. Mach. Tools Manuf. 2019, 141, 36–45. [Google Scholar] [CrossRef]
- Jeong, G.B.; Kim, D.H.; Jang, D.Y. Real time monitoring and diagnosis system development in turning through measuring a roundness error based on three point method. Int. J. Mach. Tools Manuf. 2005, 45, 1494–1503. [Google Scholar] [CrossRef]
- Hwang, J.; Park, C.H.; Gao, W.; Kim, S.W. A three probe system for measuring the parallelism and straightness of a pair of rails for ultra-precision guideways. Int. J. Mach. Tools Manuf. 2007, 47, 1053–1058. [Google Scholar] [CrossRef]
- Ma, H.F.; Zhuang, C.G.; Xiong, Z.H. Multipoint recursive sequential three-point method for on-machine roundness measurement. Procedia CIRP 2015, 31, 459–464. [Google Scholar] [CrossRef][Green Version]
- Lei, X.Q.; Li, Y.; Zhou, J.W.; Li, J.S.; Xue, Y.J. A new algorithm of roundness error separation technique of three-point method. J. China Ordnance 2008, 4, 141–145. [Google Scholar]
- ISO 230-7:2015; Test Code for Machine Tools-Part 7: Geometric Accuracy of Axes of Rotation. ISO: Geneva, Switzerland, 2015. Available online: https://www.iso.org/standard/56624.html (accessed on 1 March 2022).
- Knapp, B.; Arneson, D.; Martin, D. Electrical runout using an eddy-current sensor for roundness measurements. In Proceedings of the 28th Annual Meeting of the American Society for Precision Engineering, ASPE 2013, Saint Paul, MN, USA, 20–25 October 2013. [Google Scholar]
Publisher’s Note: MDPI stays neutral with regard to jurisdictional claims in published maps and institutional affiliations. |
© 2022 by the authors. Licensee MDPI, Basel, Switzerland. This article is an open access article distributed under the terms and conditions of the Creative Commons Attribution (CC BY) license (https://creativecommons.org/licenses/by/4.0/).