1. Introduction
Due to the improvement of the concept of green environmental protection and the rapid development of renewable energy technology, the shortcomings of centralized power supply, such as severe pollution and insufficient flexibility, are becoming exposed. Therefore, the application of microgrids and distributed power supply networks using green energy is becoming more and more important. Compared to centralized power supplies, distributed generation networks have the following advantages:
Due to a distributed power source, it can effectively solve the problem of voltage drops in the network and simultaneously reduce line loss;
Each power source is distributed and independent and is thus capable of formulating blocks in the case of accidental failure, reducing the probability of large-scale failures;
The network can facilitate power quality detection, expansion and reconstruction;
It has significant advantages supplying power to islands or independent large-scale equipment;
Loads can be powered by different distributed sources, increasing the penetration rate of renewable energy and promoting environmental protection;
The distributed power supply is small and flexible, providing the possibility for the comprehensive utilization of renewable energy.
Therefore, distributed power supply networks, in combination with renewable energy, have received considerable attention in the academic and industrial communities. Regarding distributed generation networks, topology affects the design, function, operation mode, control method, reliability and other aspects of the whole system. In the control field, for the strict-feedback form of the nonlinear systems represented by the Takagi–Sugeno fuzzy model, Farzad et al., proposed a novel multi-objective robust control design scheme [
1]. This method can manipulate the matched and the unmatched uncertainty concurrently. Simorgh et al., employed the successive quadratic programming method to solve the resulting nonlinear programming problem using the direct optimal control approach [
2]. This method reduces the dimensions of problem greatly. In the reliability and invulnerability field, research on the topology of networks is always a key direction. Thus, substantial research has been carried out on the topology design of distributed generation networks. Che et al., proposed an optimal topology planning method for a loop-based microgrid that integrates two stages [
3]: firstly, graph partitioning is used to identify loops; secondly, integer programming is used to determine the loop structure. Badre et al., presented a new control strategy of doubly fed induction generators [
4] for variable speed wind turbines connected to the grid, which shows excellent improvement and robustness for system efficiency. Camacho-Gómez et al., researched the joint optimization of the network topology and the location of distributed renewables [
5], in which the harmony search algorithm is included in a multi-objective framework with great improvement. Mohamed et al., proposed a two-stage algorithm framework [
6] to solve a similar problem. Nguyen et al., established a microgrid multi-objective economic optimization model based on a novel Flying Sparrow Search Algorithm [
7] to plan microgrid operations.
The mature development of microgrid technology is effective for balancing the load locally, improving the reliability of the power supply and increasing the utilization rate of renewable energy. However, due to the limited capacity of the microgrid and its inadequate anti-disturbance capability, transient events may occur during the working process, e.g., a sudden change in the output power of the distributed generation, and the reliability of an individual microgrid is insufficient for critical infrastructure. Consequently, multi-microgrids or microgrid cluster systems have gradually gained attention. Joint operation of several microgrids can partly improve power system reliability and resilience, increasing the individual microgrid’s operation effectiveness and promoting further utilization of renewable resources [
8,
9,
10,
11]. PV fed DC-Microgrids consist of clusters of several Nano-Grids, and Zakir et al., proposed an optimal power management system [
12,
13] which incorporated a power-sharing capability among the NGs. To construct optimal network topology, Albaker et al., proposed an optimal model for multi-microgrids [
14] with the objective of minimum system-wide operation costs and maximum reliability. Ruan et al., proposed a new honeycomb distribution network topology [
15] and verified its high reliability. Erol-Kantarci et al., developed an idea for energy sharing among smart microgrids [
16] to increase network reliability. Ansari et al., considered prioritized loads and distributed resources and used a hybrid analytical simulation method [
17] to evaluate the reliability of distributed generation networks. Wu et al., proposed a novel microgrid planning model [
18], jointly optimizing the network’s topology and the location of distributed renewables, which was converted to a two-stage robust optimization problem.
In summary, in research of topology structures, people’s work focusses mainly on the following aspects:
Optimization of alternative routes and distributed energy locations;
Algorithm-based optimization model improvements, such as new search algorithms and two-stage solution methods;
For microgrids or distributed power generation network clusters that can realize energy interactions, while improving models and algorithms, reliability is greatly considered in order to obtain high reliability and invulnerability, an energy mutual topology structure, as well as control and operation methods.
Nevertheless, all these studies mentioned consider invulnerability from the perspective of the system, in which the particular requirement of nodal invulnerability is ignored. This paper intends to fill this gap. Based on the above research content and according to the idea of energy complementation between microgrids, aimed at a distributed generation network, this paper combines energy complementation and invulnerability requirements and establishes a topology design model. Energy complementation can enable efficient energy utilization and can enhance network invulnerability. Moreover, we creatively propose a novel invulnerability evaluation criterion on the perspective of each node. This is different from the conventional method, which only considers invulnerability at the system level and ignores the particular difference of the individual node. Our method is much more reality-oriented, and based on this method, we can obtain more practical optimal topology according to the different invulnerability requirements of each node. This work has vital practical significance and application prospects. Moreover, it also can be guidance for the planning and design of a distributed power generation network.
The remainder of this paper is organized as follows.
Section 2 is dedicated to problem formulation, including the problem’s description and constraint definition. In
Section 3, numerical simulations are implemented to investigate the impact of nodal types and generation capability on optimal topology design.
Section 4 is devoted to the conclusion.
3. Numerical Simulation
3.1. Example Description
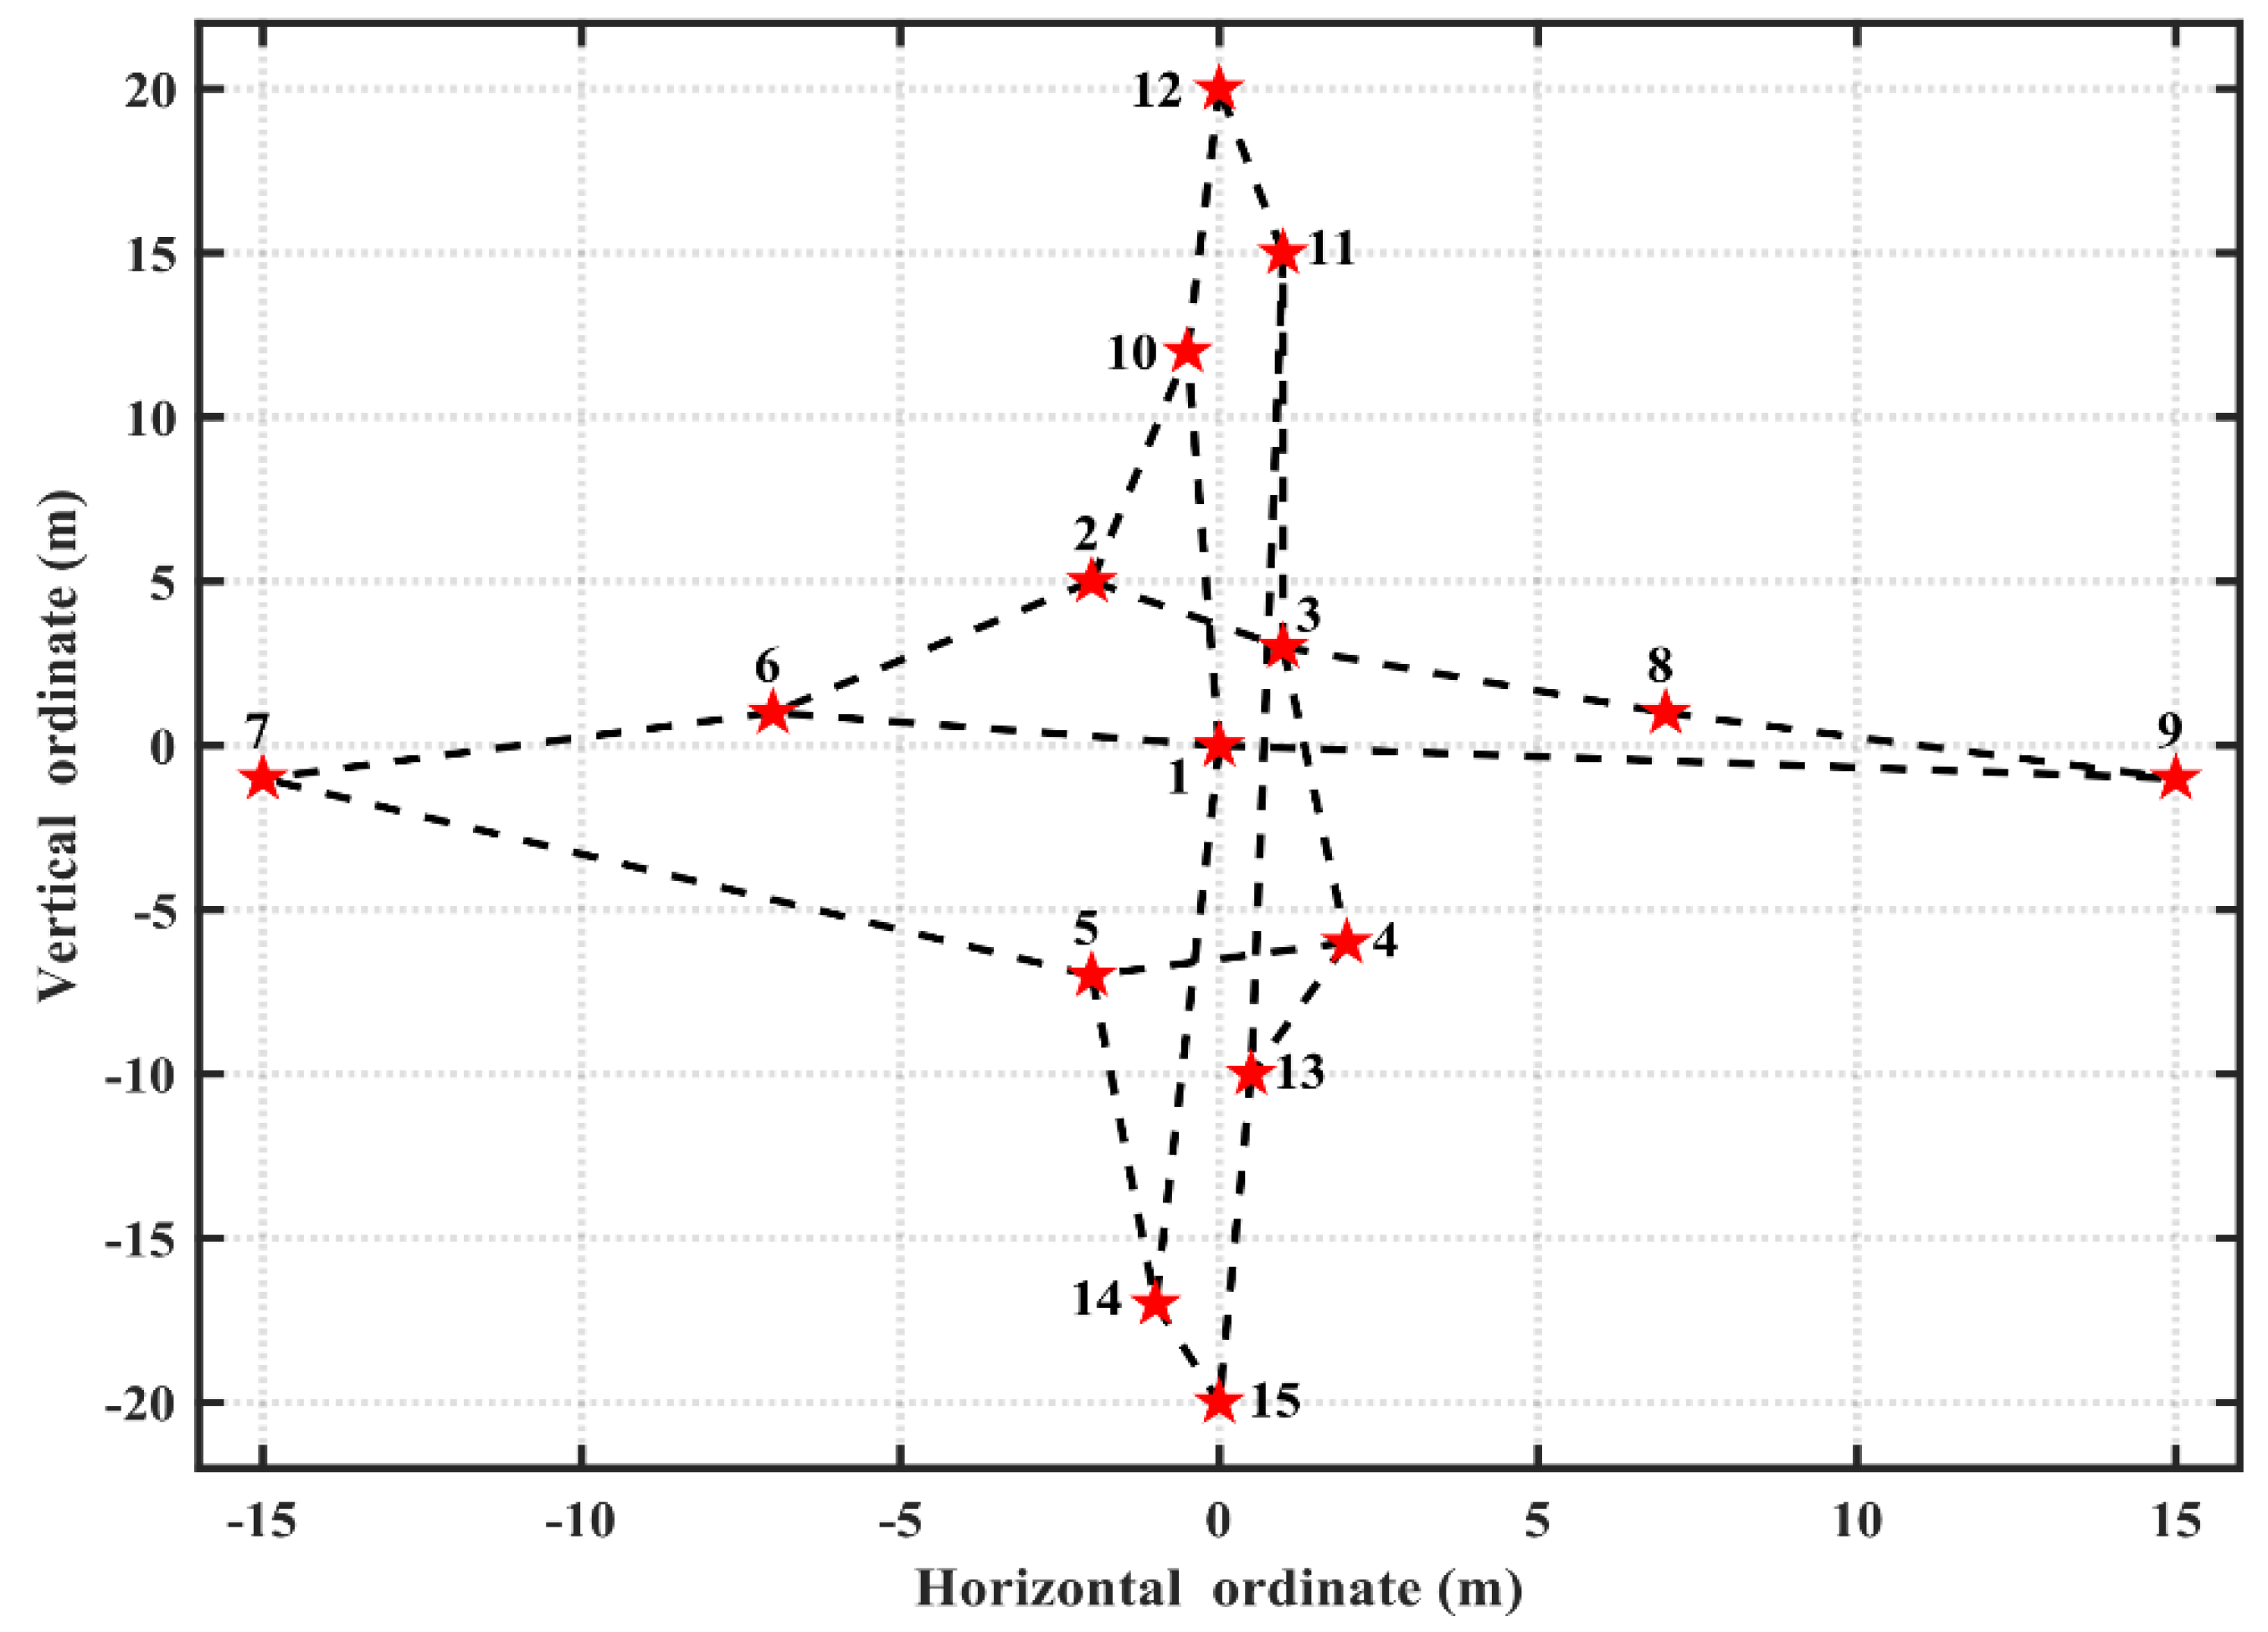
Take the distributed generation network of a certain type of aircraft as an example. Assume that the fuselage is 40 m long and that the wings are 15 m long. The center point is taken as the origin of the coordinates, and the two-dimensional coordinates of the nodes are shown in
Table 2.
Assuming that the total load is 90 kW, which is roughly evenly distributed on each node, the nodal load demand and power generation capacity are set as shown in
Table 3. Considering the actual difference of nodes, we can make some changes in it, such as setting a large load and some low loads and adjusting the load of the other loads, in order to make data more realistic. The power generation of each node has a surplus according to a certain proportion of its load demand. Tentatively, we set the power generation surplus of each node to 80% of its load demand.
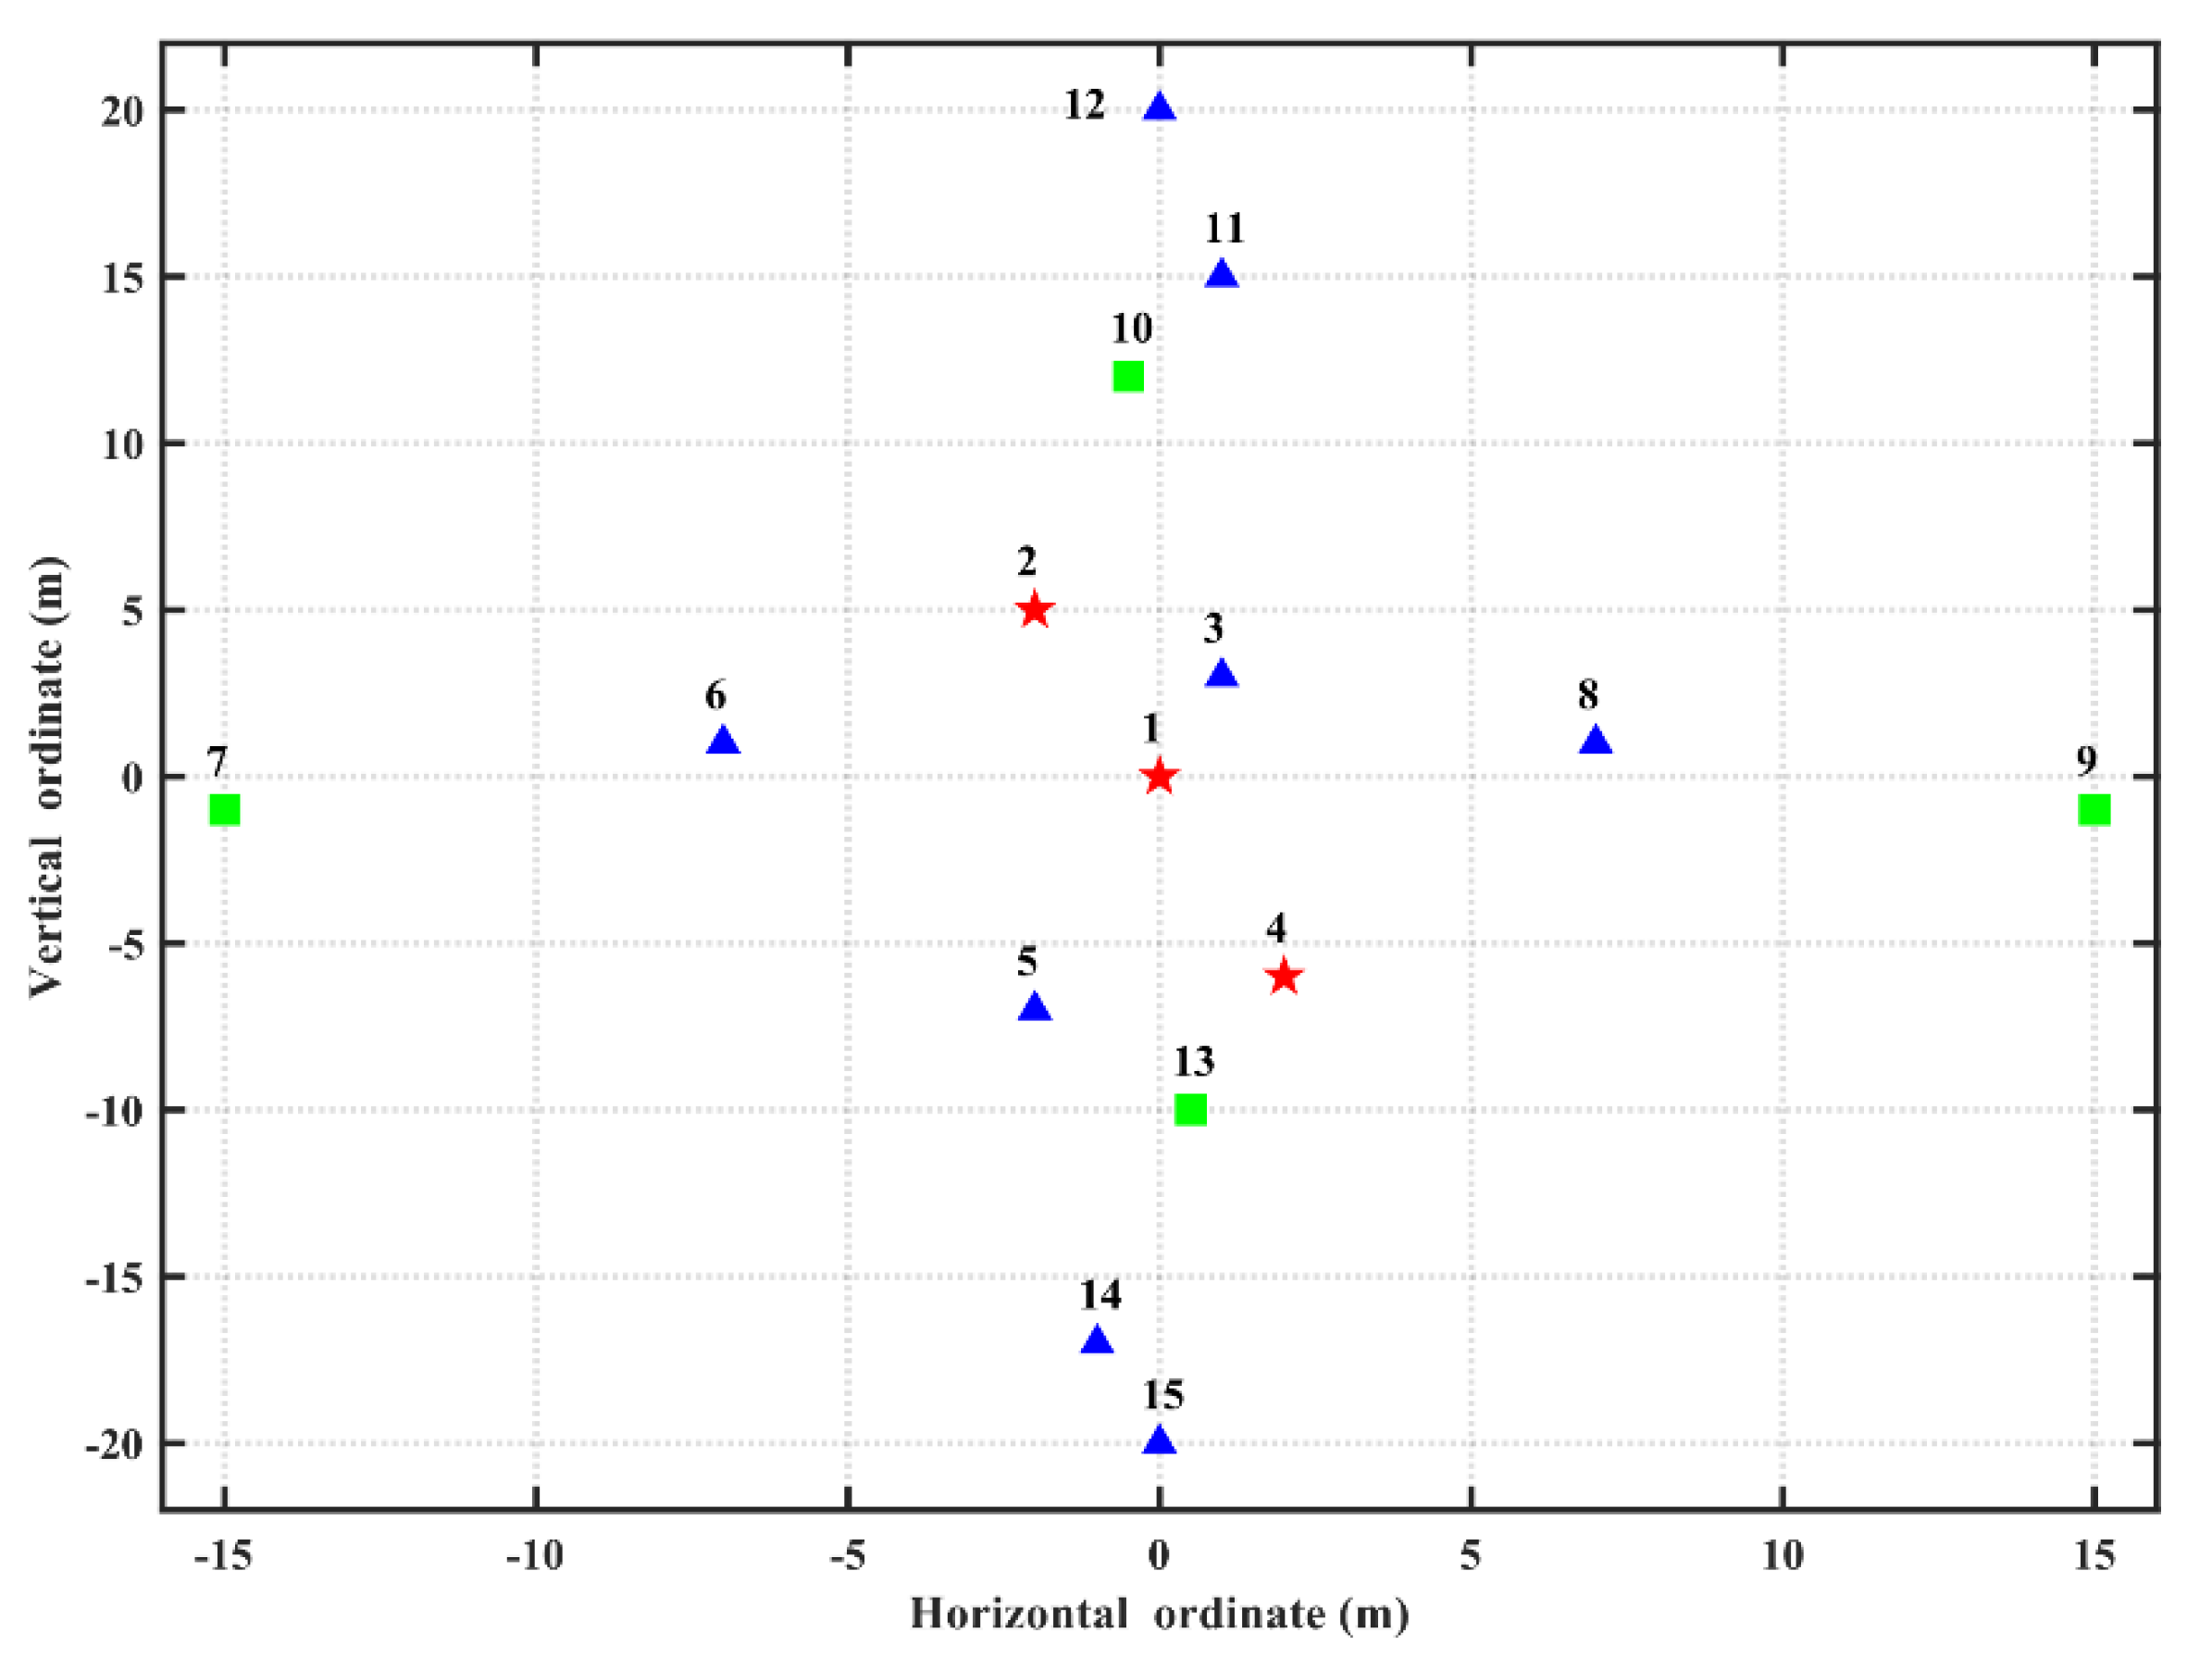
The node distribution of the example is shown in
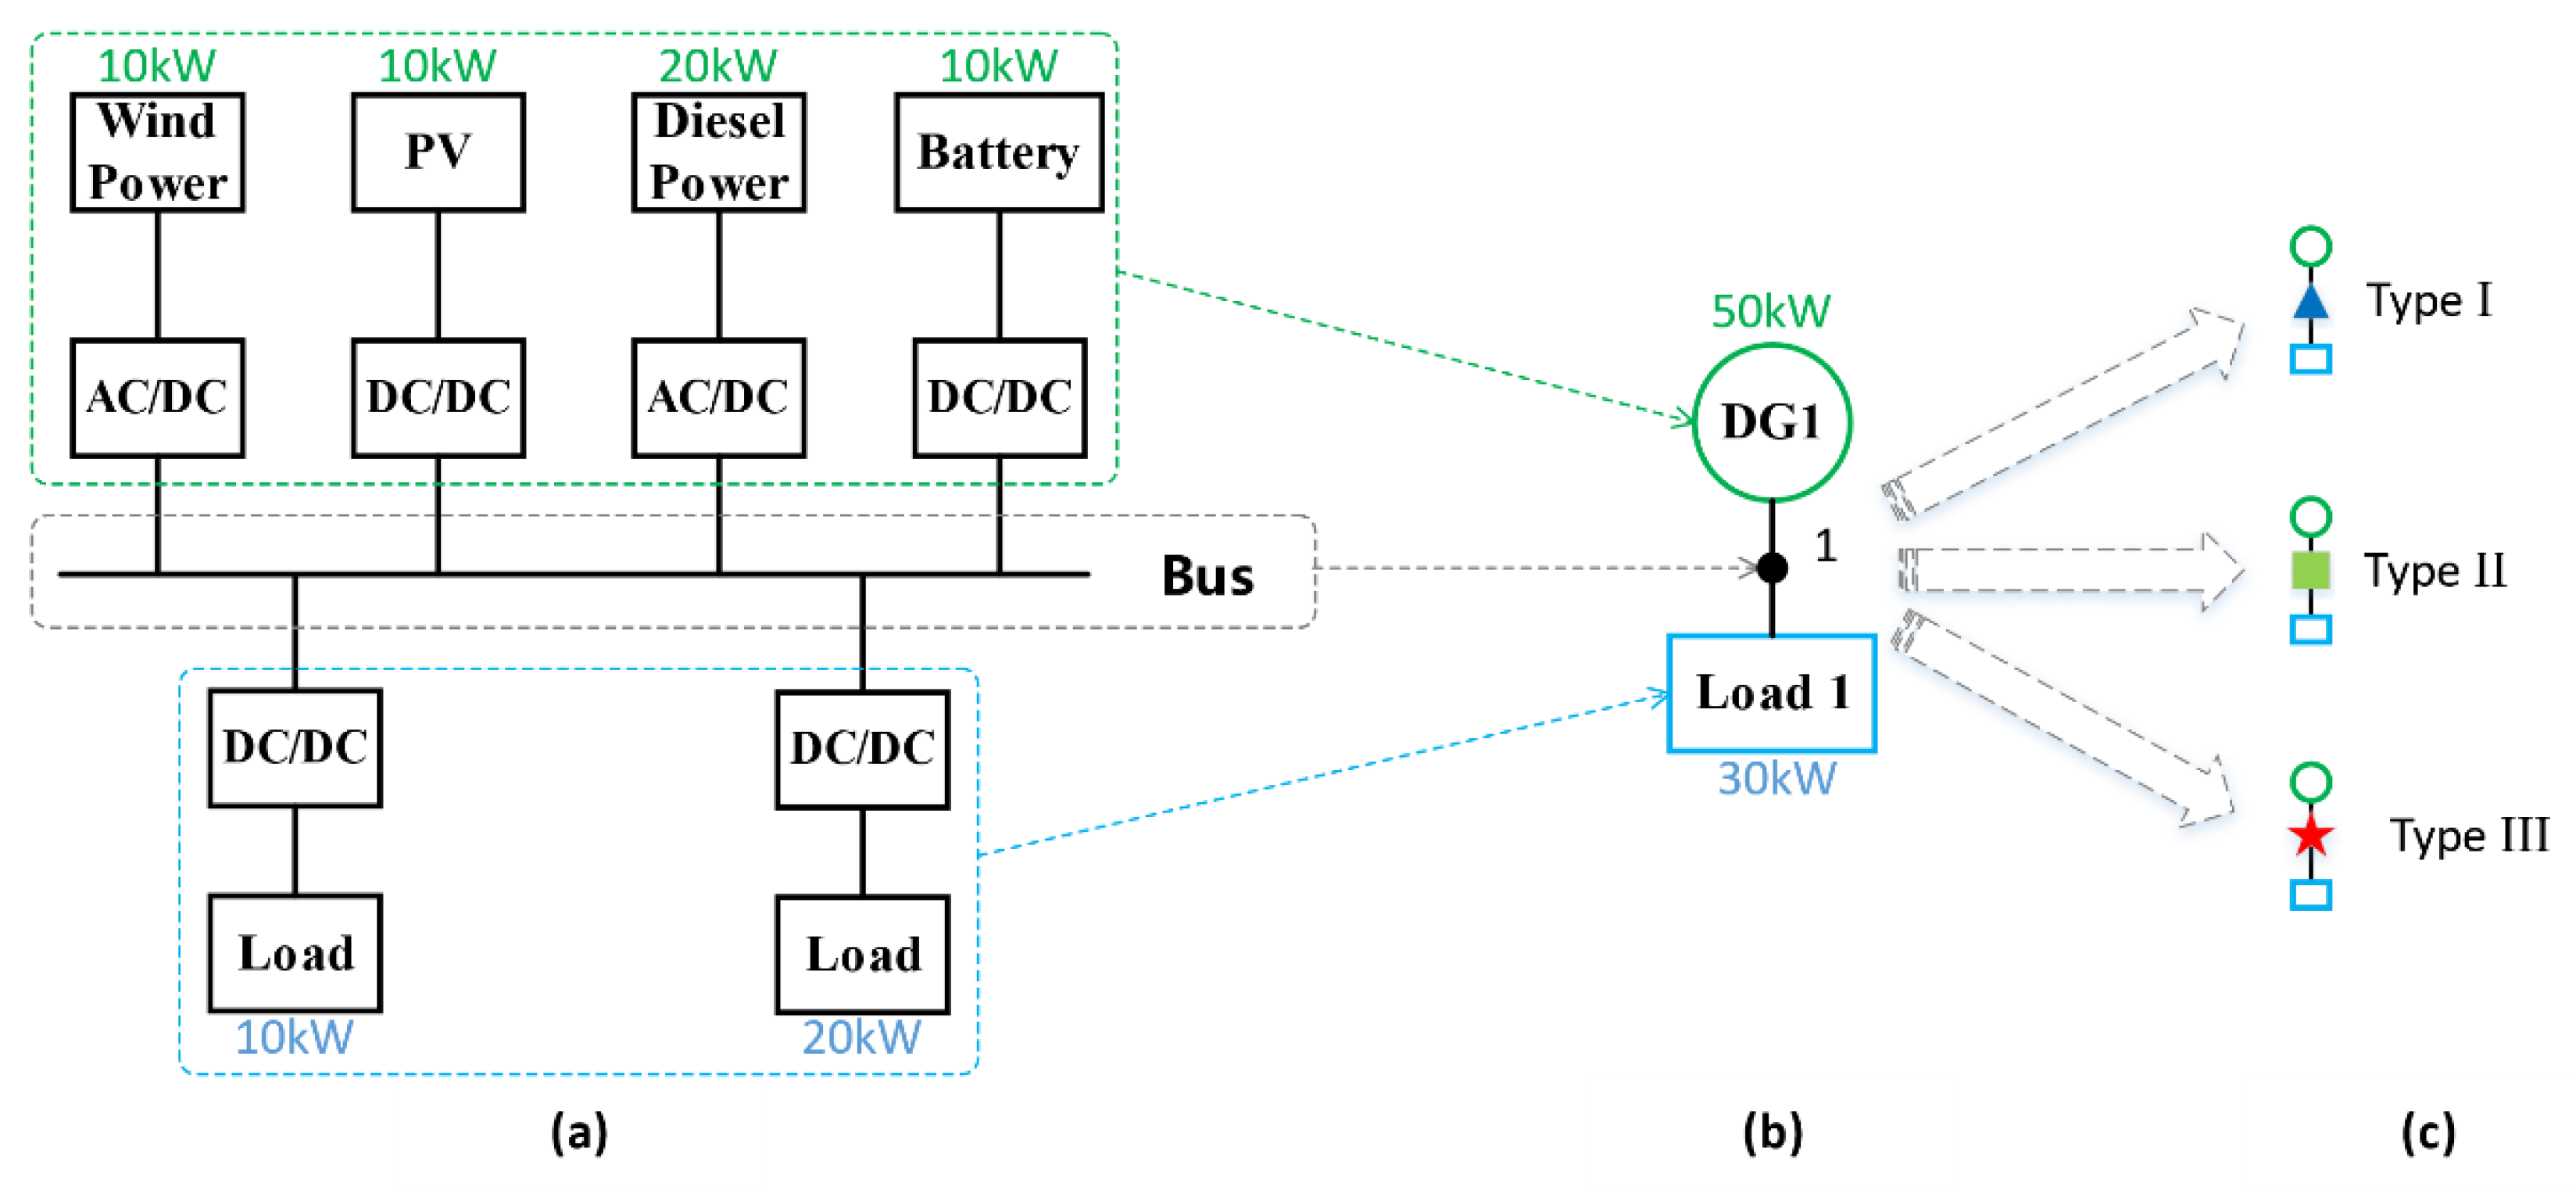
Figure 6. Triangular nodes represent type I, square nodes represent type II and star nodes represent type III. All nodes are divided into these three types according to different invulnerability requirements, and the nodal types can be set based on their function or importance, as needed.
3.2. Analysis of the Basic Results
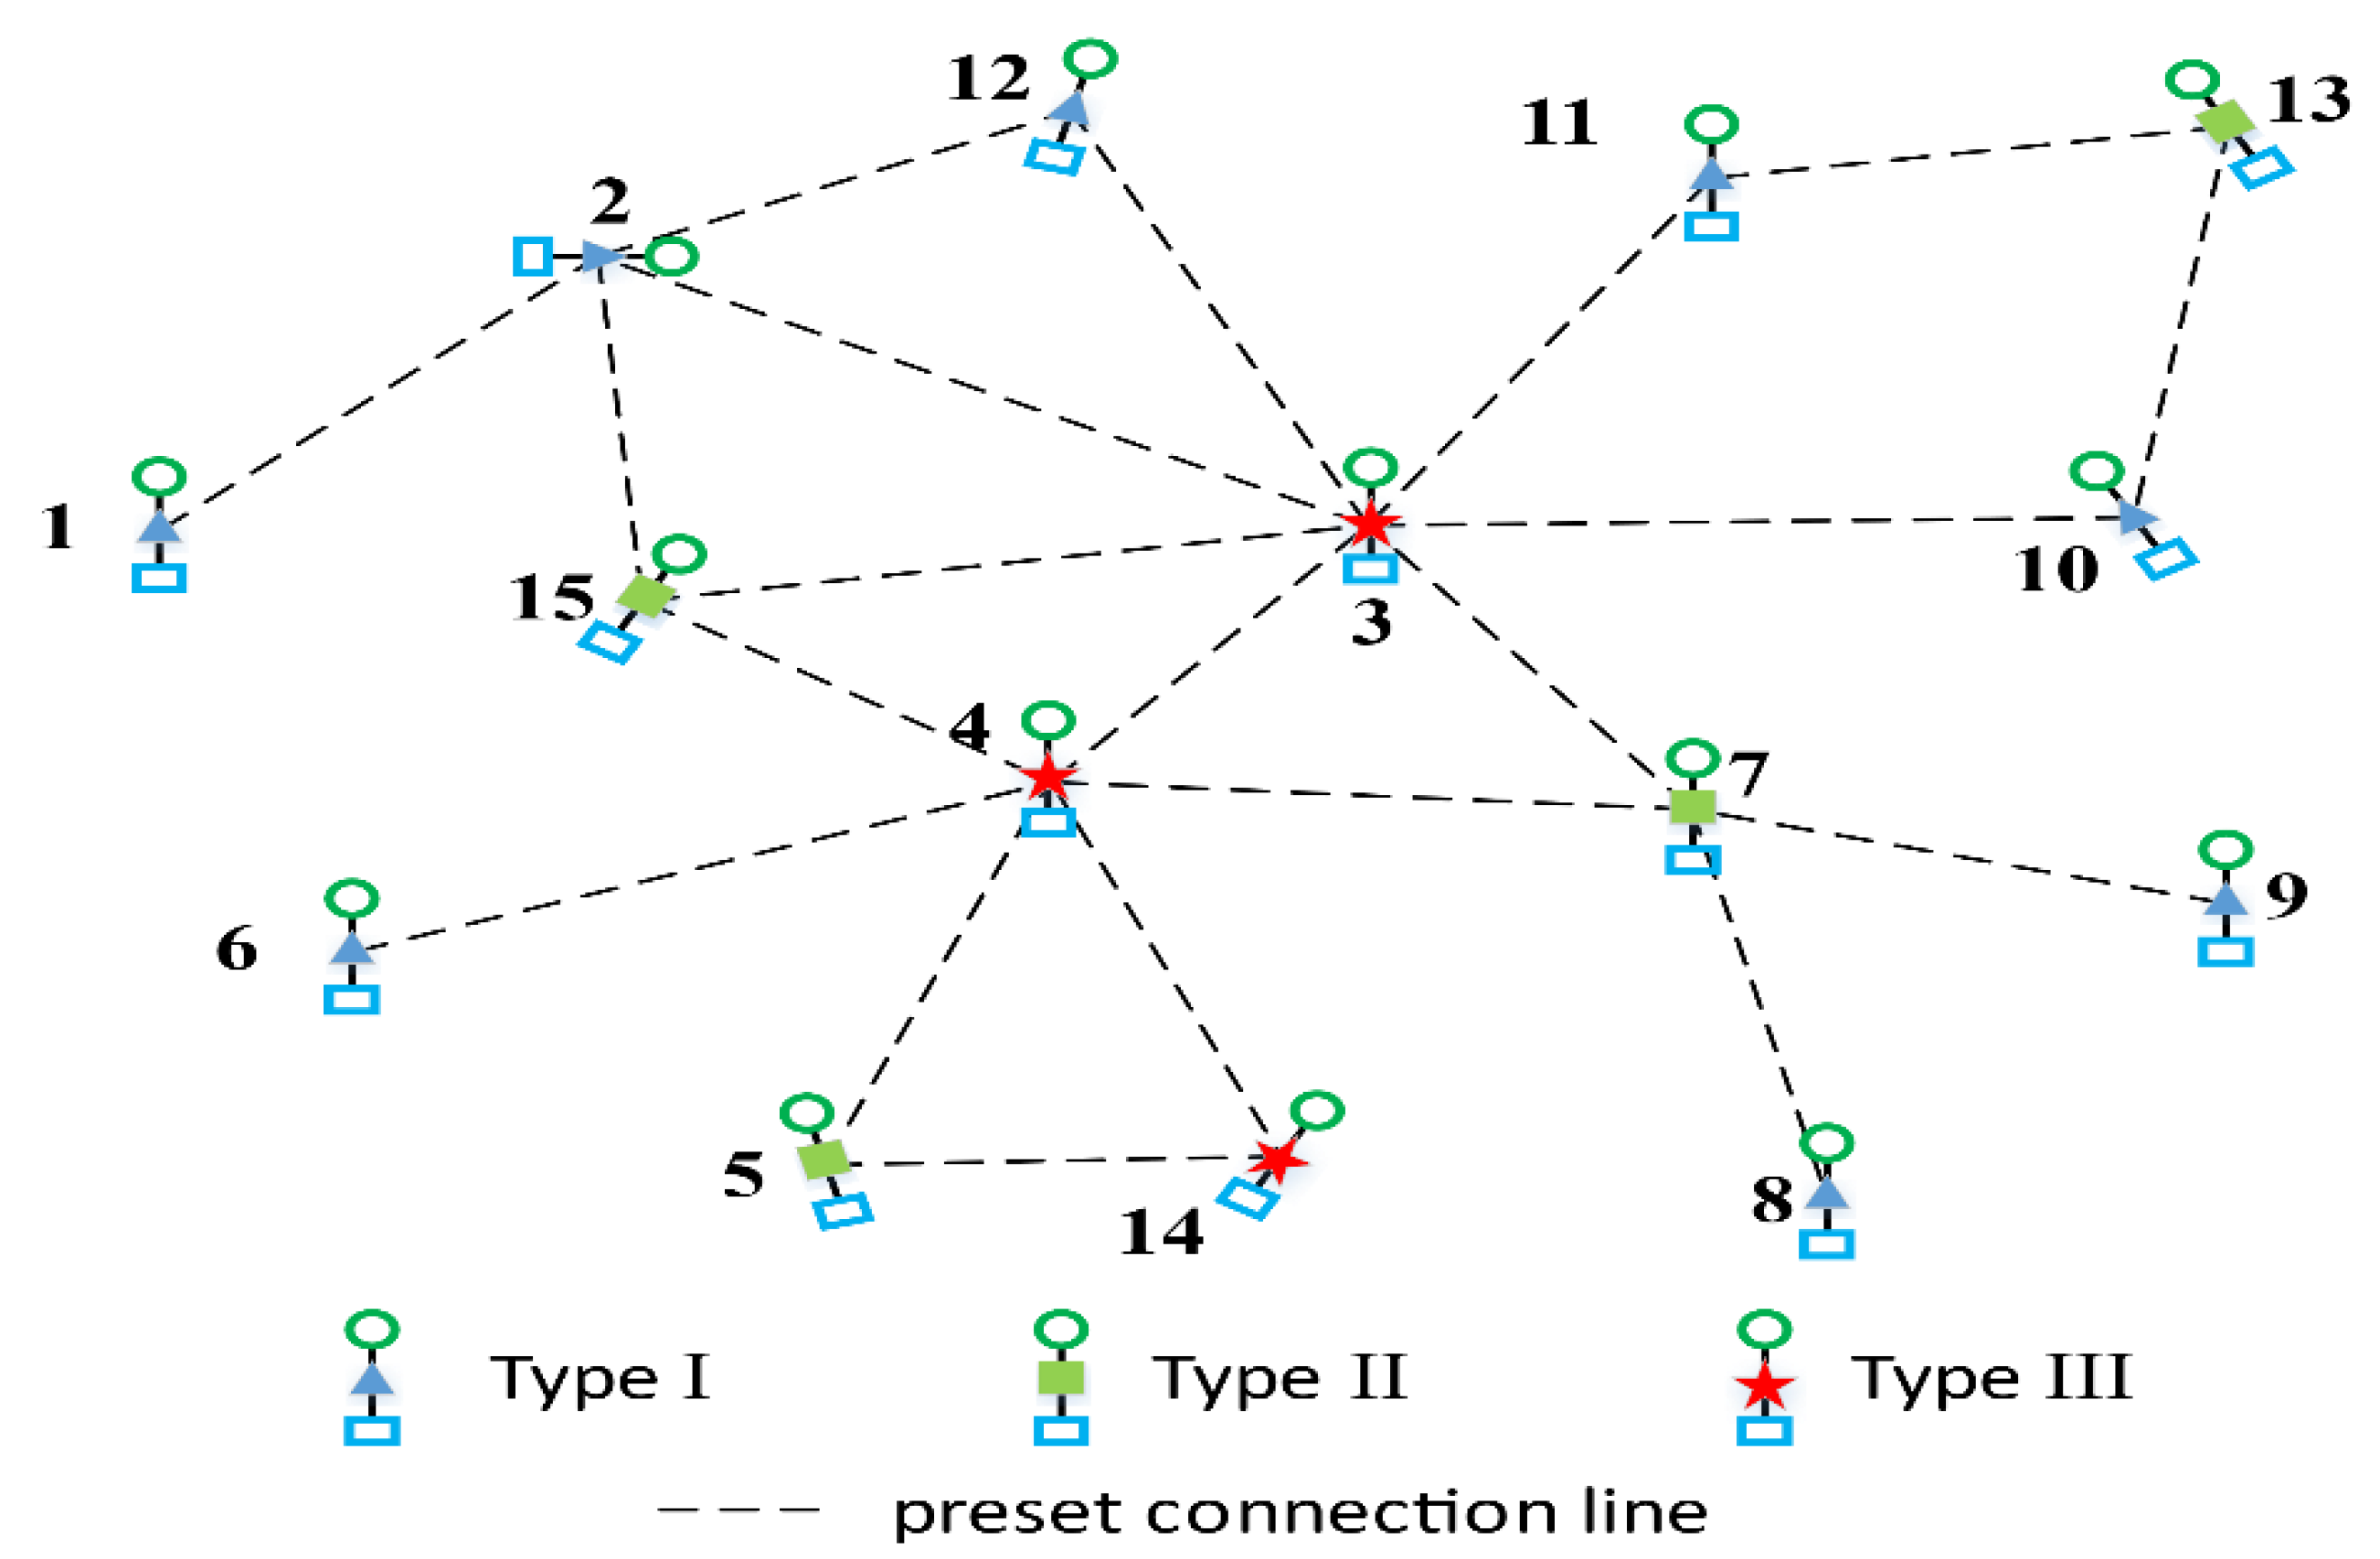
The results when all the nodes are type I are shown in
Figure 7. Since the constraints are relatively loose, and the surplus of power generation at each node is sufficient, the topology structure formed is relatively simple. Although it is not a connected graph, the invulnerability requirements of each node can be met within these independent structures. Due to the surplus of node 1 being larger than the loads of nodes 6, 7, 8 and 9, the connection lines are preset from node 1 to these nodes respectively. Otherwise, nodes 6, 7, 8 and 9 link with the other two nodes to ensure their loads when they are faulty, and this increases the objective value greatly. Since the loads of nodes 2 and 3 are a little larger than the surplus of node 1, they need to connect with another node to obtain power for their respective failure scenario. On the other hand, nodes 2 and 3 are close to node 1, so they have preset lines to node 1. Moreover, they have preset lines on each other in order to supply power to the other. Finally, the rest of nodes all need two neighbors to sustain their loads, and that is the way that they form two independent loop structures to minimize objective value.
The results when all the nodes are type II are shown in
Figure 8. As the constraints become stricter and more difficult to satisfy, the topology structure formed is relatively complex. Although it is still not a connected graph, a more obvious mesh topology appears. Since each node of type II needs to meet two loads of faulty nodes at the same time, once one of its neighbors fails, and the loads may not be satisfied. Therefore, nodes generally need more neighbors. However, if two faulty nodes are linked, they can share power from their neighbors, which may cause one of the faulty nodes to be supplied by the neighbors of the other faulty node completely, such as node 7, which still has only one preset line to node 1. When it is faulty, node 7 can be met by nodes 3, 6 and 8, which are neighbors of node 1.
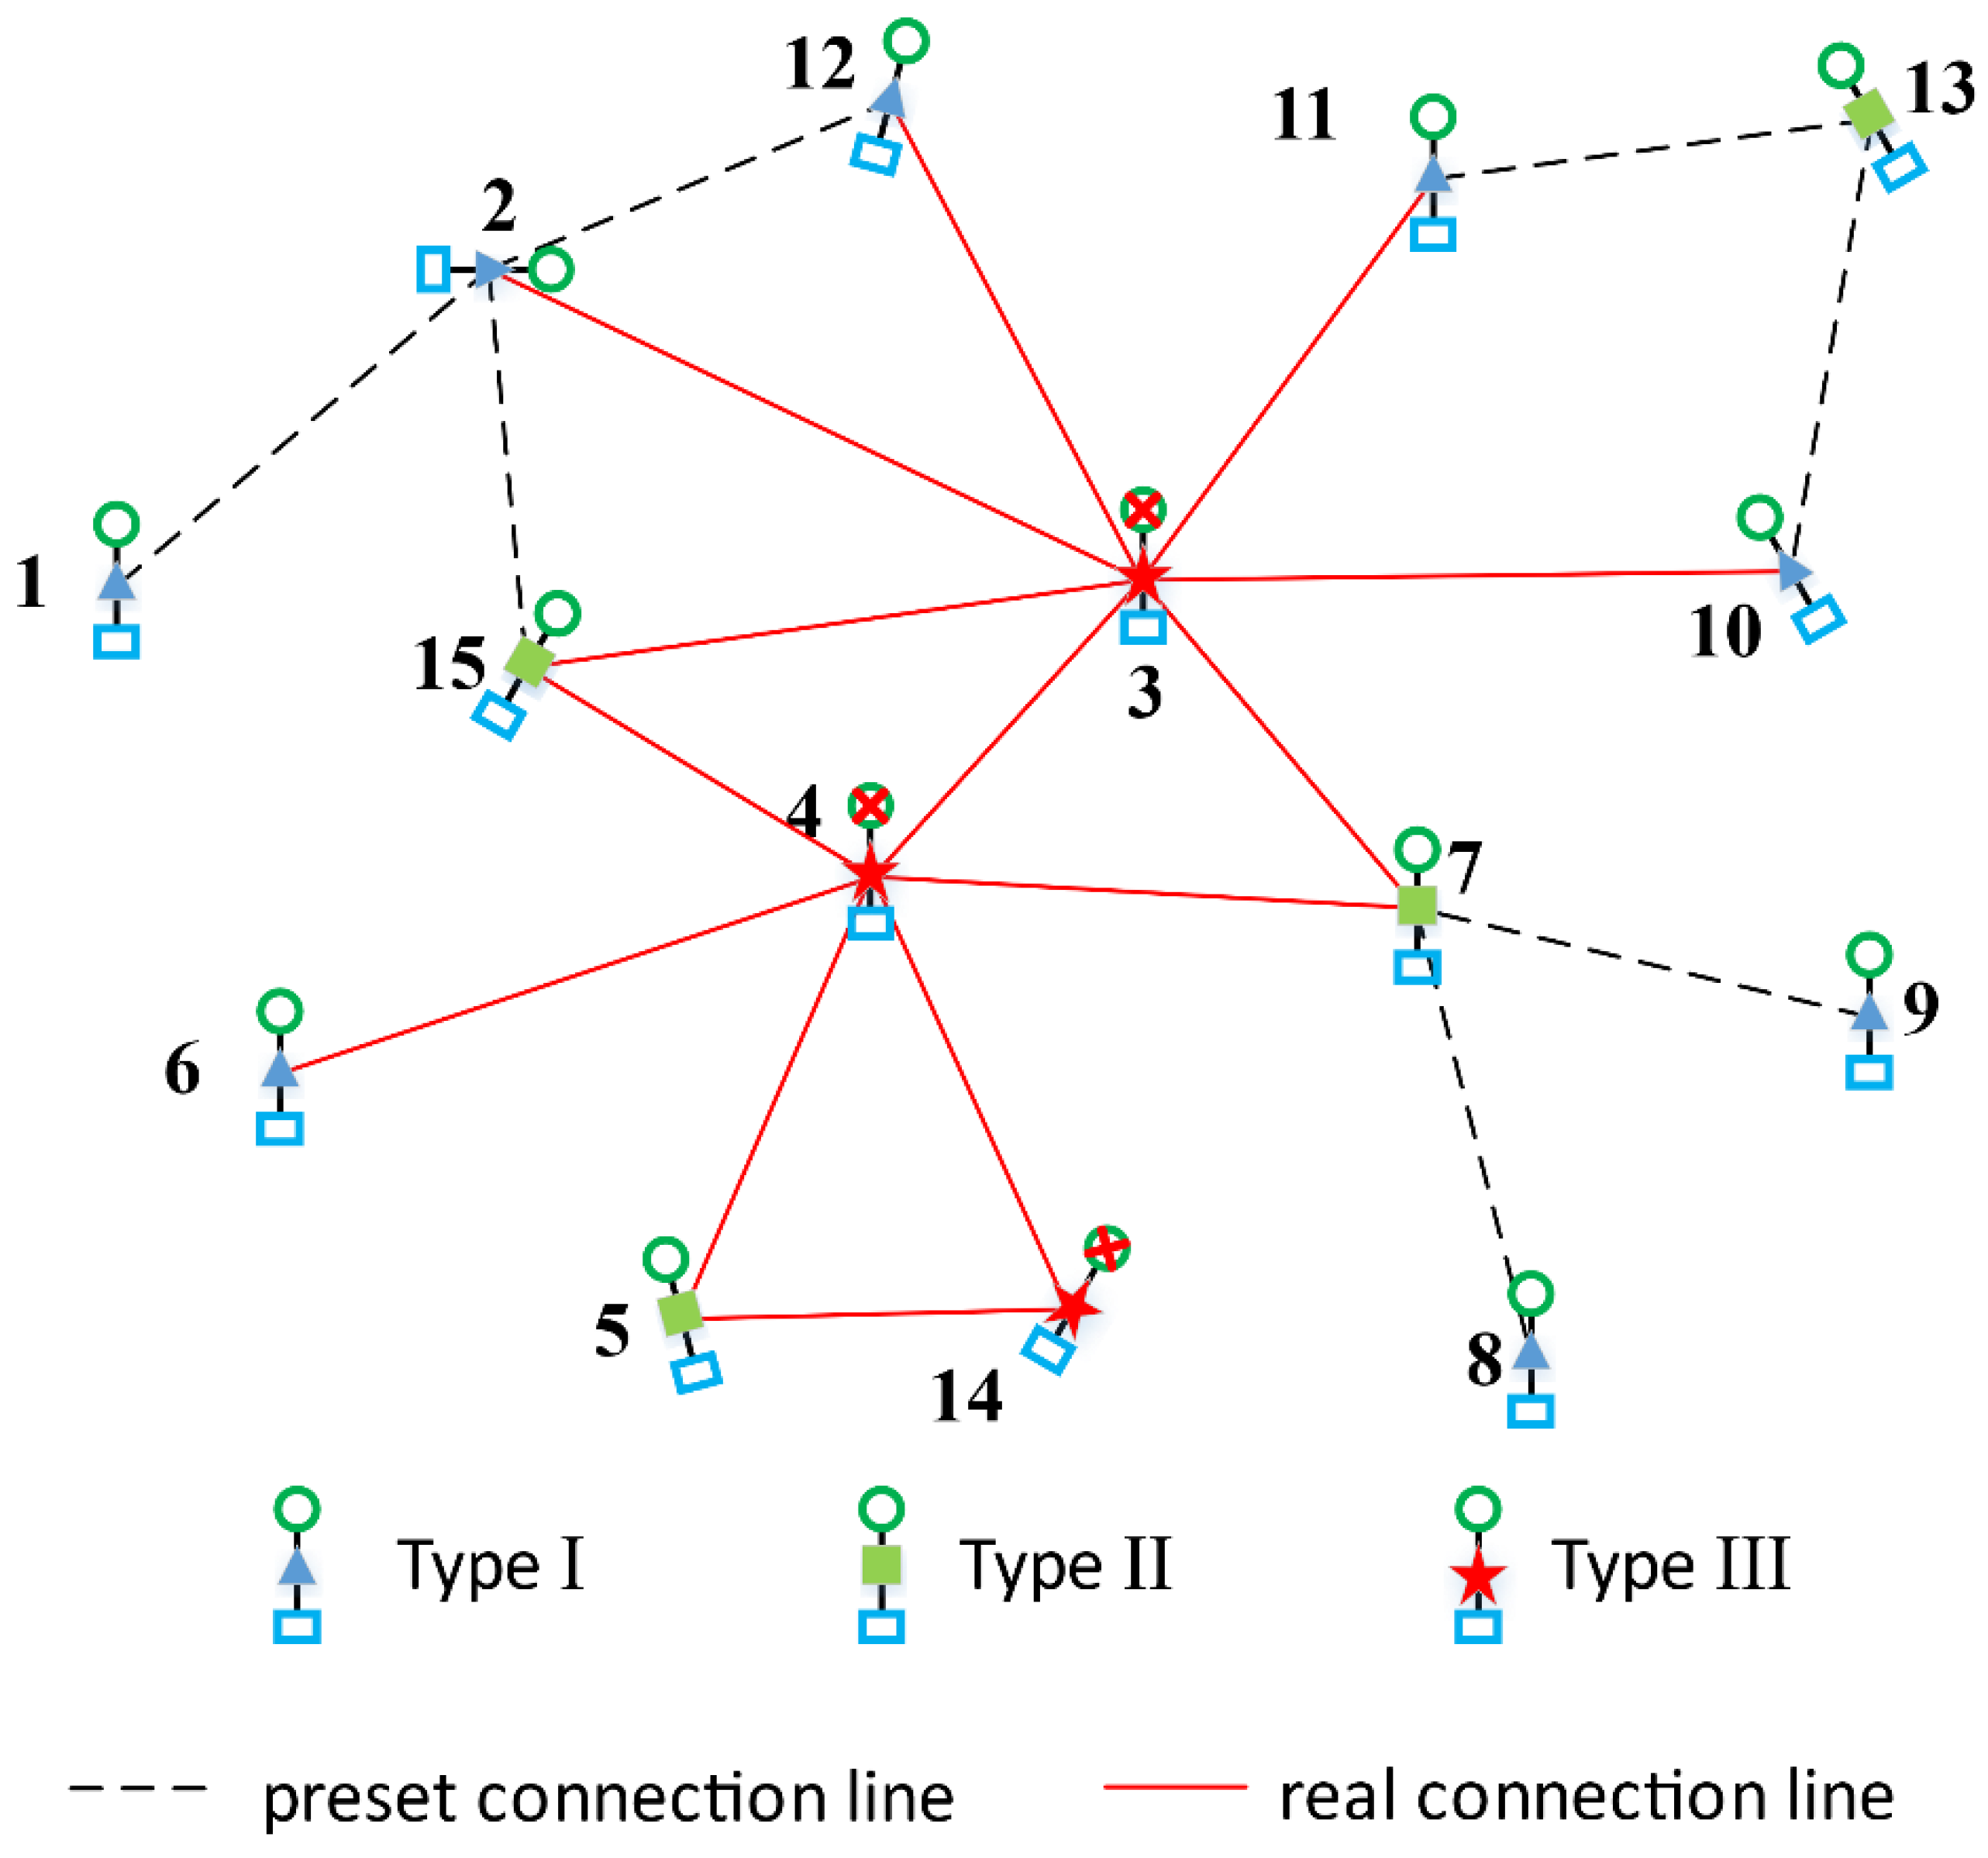
The results when all the nodes are type III are shown in
Figure 9. Since the constraints are strict, and the surplus of power generation is not as sufficient as it is in the preceding situation, the topology structure is quite complex. In addition, the results show a connected graph. To meet the invulnerability requirements of each node, heavy costs must be paid. Since we need to meet three faulty nodes at the same time, more neighbors are needed, and the connections between nodes are enhanced greatly to ensure that the faulty nodes can obtain enough power supply. Take nodes 9, 10, and 14 as an example, even though they are far from each other. They can also obtain connection via node 1 when they are faulty, and they can obtain enough power from their neighbors to recover loads.
3.3. Results of Changing Nodal Generation Capacity
For distributed power generation networks on some platforms, such as the aircraft in this paper, carrying space and capacity are limited, so the power generation capacity of the nodes is also limited due to the limitations of the actual physical equipment. Therefore, understanding the results under different power generation capacities may help the selection of adequate and appropriate power generation equipment.
If a change occurs in node generation capacity, the optimal topology also changes. Nodal load and generation capacity have a combined effect on performance, and the more important factor is the proportion of generation capacity surplus to load. This proportion fundamentally decides the number of nodal neighbors, and it has a major influence on objective value. As shown in
Figure 10, when the surplus proportion of power generation capacity is small, faulty nodes need a lot of neighbors to meet their loads, and large amounts of connecting lines are needed. As the surplus increases, the total length of the preset lines decreases substantially. When the surplus proportion of power generation is large, the effect of its increase on the total length of the lines has a step-like tendency, i.e., the total length of lines changes slightly or even remains constant within a certain power generation surplus range; then, once it exceeds a certain value, a more obvious change occurs.
From the results when all the nodes are type I, we find that the total length of preset lines decrease rapidly with an increase in the surplus of power generation, because more adequate generation capacity is obtained due to fewer node associations. Once a critical value is reached, the power generation capacity is sufficient. Continuing to increase the power generation capacity does not change the preset line’s topology.
When all the nodes are type II, if the generation capacity surplus proportion is low, nodal power generation is insufficient, and the connection is much complex. Either the optimal line preset scheme cannot be obtained without load shedding, or the line density is so high that the scheme cannot be applied in practice. Moreover, the power generation threshold that minimizes the total length of lines is greatly improved.
When all the nodes are type III, the demand for power generation required to build the optimal topology is further increased, and the downwards trend becomes slower. Hence, the effect of increasing the power generation capacity on the change in topology structure becomes weaker.
Different generation capacities have different impacts on different types of nodes, so we can find a balance point to coordinate the generation capacity and nodal invulnerability requirements.
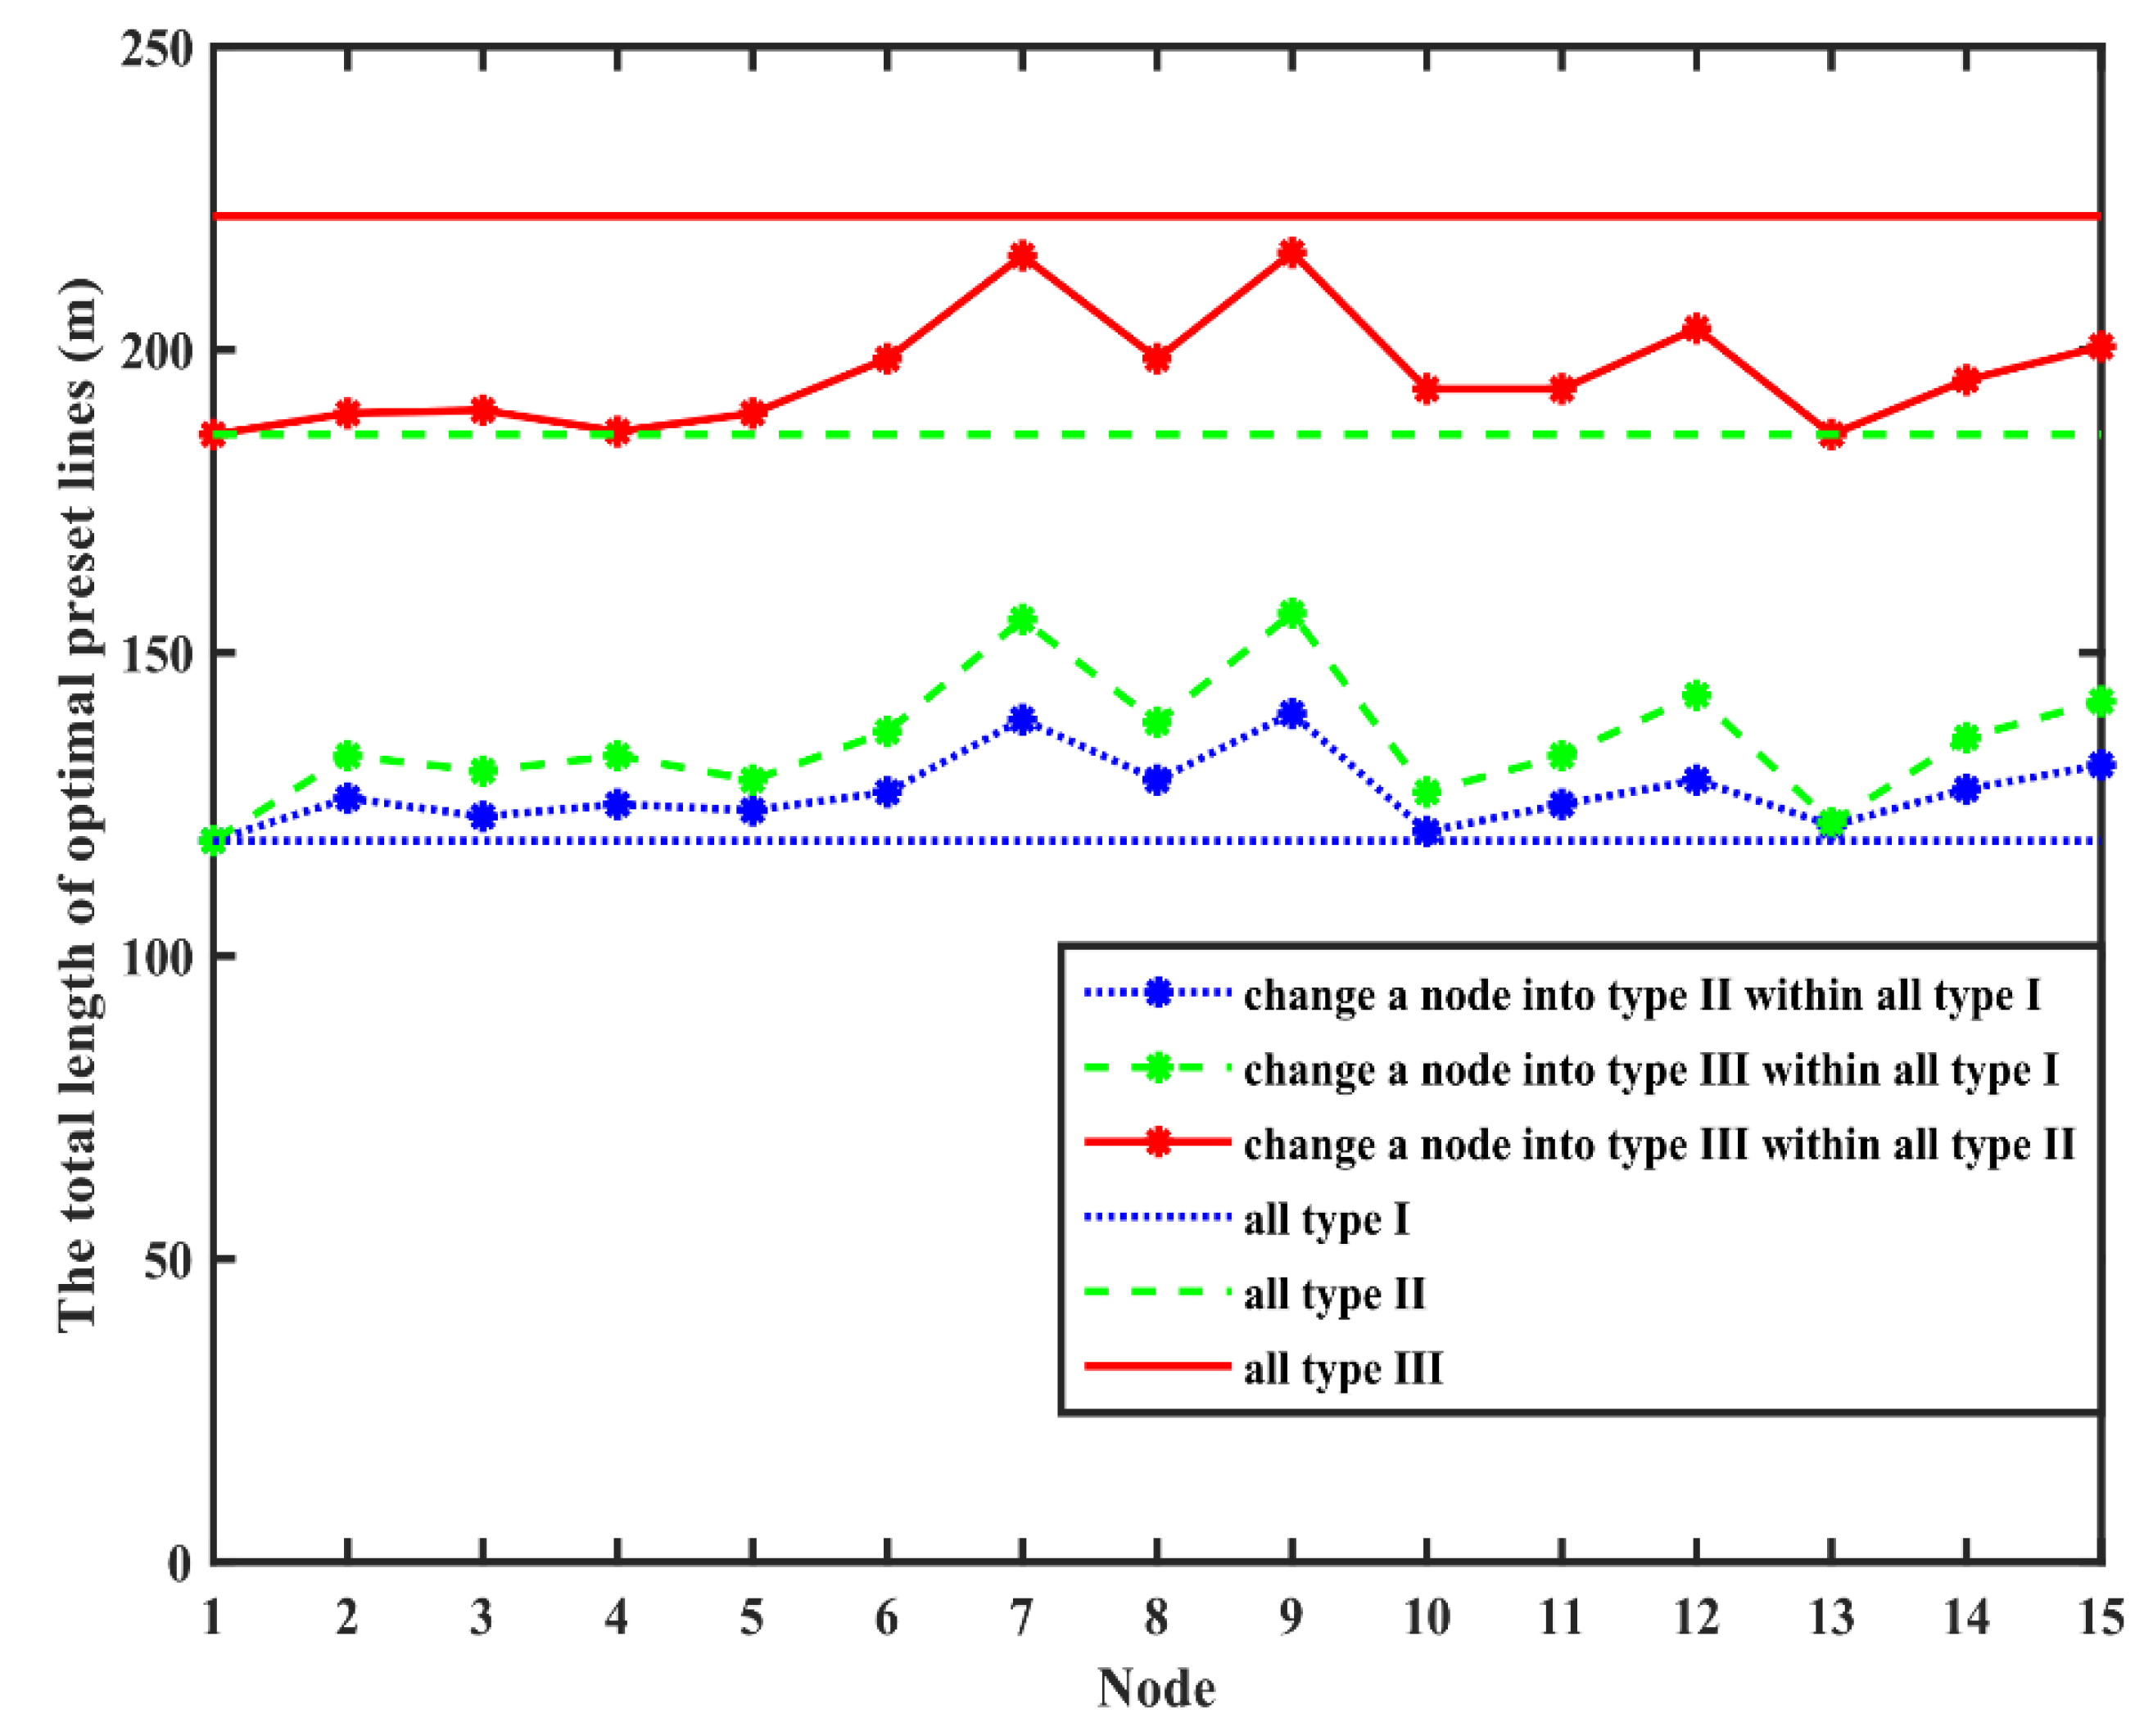
3.4. Results of Changing Nodal Type
Nodal type represents the invulnerability requirement and decides the stringency of constraints. The stricter that the constraints are, the more complicated that the topology is, and the larger that the objective value is. As shown in
Figure 11, due to differences in the spatial location and attributes of each node, different nodes also lead to different changes under different invulnerability requirements. Changes to nodes 7 and 9 cause a substantial increase in the total length of lines because these two nodes are placed in remote locations, so they need more lines to meet their invulnerability requirements. On the other hand, node 1 is in the central location. Although we do not assign it a high invulnerability requirement, it is also satisfied when its neighbors need greater invulnerability requirements. In addition, if there is a node close to the center, a topology change due to an increase in its invulnerability requirements is not conspicuous.
We can obtain a design strategy to configure nodes with high invulnerability requirements in a position close to the center, use the generated line topology to influence adjacent nodes and then transmit this influence to distant nodes to improve the remote nodes’ invulnerability. This strategy can avoid the following shortcomings: significant increases in lines caused by improving only the invulnerability of remote nodes, and the invulnerability performance being concentrated on only this remote node. Furthermore, we do not need to set the invulnerability requirements of multiple important loads at a high level. We can achieve the effect of mutual promotion by configuring them in a relatively close position, which can not only achieve sufficient protection for them, but it can also reduce additional costs due to improvements to equipment.
4. Conclusions
In this paper, a topological design model for distributed power generation networks is proposed by presetting connection lines, in which different nodal invulnerability requirements are considered. This paper innovatively proposes different invulnerability constraints for different types of nodes. In addition, the original nonlinear problem is linearized, and numerical simulations, including sensitivity analyses, are provided. One of the shortcomings of the proposed model is high constraint complexity. The complexity of our method mainly reflects large constraints and complex associations caused by linearization operations. In addition, in order to obtain optimal results, it needs to decide on optimal neighbor selection. Since the size of the decision space is , the stricter that the constraints are, the wider that range that needs to be explored is, and the more difficult that the optimal result is to find.
Because of the high constraint complexity of the proposed model, variations in nodal invulnerability requirements and large numbers of constraints generated during linearization represent a considerable challenge in obtaining the optimal solution in a relatively limited amount of time. How to improve computational efficiency will be a focus of future work. In addition, using genetic algorithms to obtain a high-quality solution is also worth researching, as it is a valuable direction.


