Article

Spatial-Temporal Epidemiology of COVID-19 Using a Geographically and Temporally Weighted Regression Model

1
Statistics Study Program, Department of Mathematics, Faculty of Mathematics and Natural Sciences, Mulawarman University, Samarinda 75119, Indonesia
2
Pulmonologist, Tadulako General Hospital, Palu 94119, Indonesia
3
Department of Pulmonology and Respiratory, Faculty of Medicine, Tadulako University, Palu 94118, Indonesia
4
Department of Mathematics, Faculty of Mathematics and Natural Sciences, Gadjah Mada University, Yogyakarta 55281, Indonesia
5
Faculty of Public Health, Hasanuddin University, Makassar 90131, Indonesia
6
School of Medicine, Universitas Islam Negeri Alauddin Makassar, Kabupaten Gowa 92113, Indonesia
*
Author to whom correspondence should be addressed.
Symmetry 2022, 14(4), 742; https://doi.org/10.3390/sym14040742
Submission received: 5 January 2022 / Revised: 7 March 2022 / Accepted: 22 March 2022 / Published: 4 April 2022
(This article belongs to the Special Issue Mathematical Modelling in Science and Engineering)

Abstract

:
This article describes the application of spatial statistical epidemiological modeling and its inference and applies it to COVID-19 case data, looking at it from a spatial perspective, and considering time-series data. COVID-19 cases in Indonesia are increasing and spreading in all provinces, including Kalimantan. This study uses applied mathematics and spatiotemporal analysis to determine the factors affecting the constant rise of COVID-19 cases in Kalimantan. The spatiotemporal analysis uses the Geographically Temporally Weighted Regression (GTWR) model by developing a spatial and temporal interaction distance function. The GTWR model was applied to data on positive COVID-19 cases at a scale of 56 districts/cities in Kalimantan between the period of January 2020 and August 2021. The purpose of the study was to determine the factors affecting the cumulative increase in COVID-19 cases in Kalimantan and map the spatial distribution for 56 districts/cities based on the significant predictor variables. The results of the study show that the GTWR model with the development of a spatial and temporal interaction distance function using the kernel Gaussian fixed bandwidth function is a better model compared to the Ordinary Least Squares (OLS) model. According to the significant variables, there are various factors affecting the rise in cases of COVID-19 in the region of Kalimantan, including the number of doctors, the number of TB cases, the percentage of elderly population, GRDP, and the number of hospitals. The highest factors that affect COVID-19 cases are the high number of TB cases, population density, and the lack of health services. Furthermore, an area map was produced on the basis of the significant variables affected by the rise in COVID-19 cases. The results of the study provide local governments with decision-making recommendations to overcome COVID-19-related issues in their respective regions.

1. Introduction

The spread of active cases of COVID-19 has significantly increased in a number of countries in 2021, including Indonesia. As of 7 September 2021, COVID-19 had spread to 204 countries and had infected more than 220 million people, resulting in nearly 4.5 million deaths [1]. Moreover, Indonesia was also reported to have more than 4 million confirmed positive cases of COVID-19, with over 130 thousand deaths [2]. The transmission of COVID-19 was also found to have increased in one of the provinces of Indonesia, specifically in Kalimantan, with a total number of accumulative cases of 245,205 in August 2021. Based on the increasing number of COVID-19 cases in Kalimantan, it is necessary to conduct research to identify the reasons and factors which led to this increase in COVID-19 cases. This purpose of this research was to determine contributing factors to the increase in COVID-19 cases based on the Improved Geographically and Temporally Weighted Regression model.
Spatial data were modeled using spatial regression with geographic weighting, also known as the geographically weighted regression (GWR) model. GWR was first introduced by Fotheringham in 1967 [3,4]. The GWR model is the development of Linear Regression Analysis with the addition of geographic weighting for each regression parameter to handle emerging spatial diversity. GWR theory has been widely used by researchers, including [5,6,7,8]. However, the GWR model only uses spatial data (location) in one time period, while spatial data is usually influenced by the time series. Spatial data should be analyzed by involving several time observations (temporal), thus demanding a more accurate parameter estimation. Therefore, to increase the precision of the parameter estimator on the GWR model, observations should be highly carried out for each location at a certain time. Referring to that matter, a Geographically Temporally Weighted Regression (GTWR) model was developed to overcome the weaknesses of the GWR model [9], by considering the elements of location and time.
The GTWR model is a development of the GWR model, but it is not able to handle non-stationary data both spatially and temporally at the same time. Consequently, this research was conducted by applying the Improved Geographically Temporally Weighted Regression model with the development of the distance function. This model is expected to be capable of generating local models at any location and time, resulting in a more representative model. Furthermore, the spatial and temporal information in the GTWR model is regarded as a crucial element in creating the weighting matrix. Thus, the improved model is expected to be succeed in identifying spatial and temporal variability. The GTWR model, one of the spatio-temporal models, has been widely used in various fields. As stated by Fotheringham, the 2015 GTWR model is generally used to handle issues of spreading infectious diseases, water pollution, hydrology, and urban planning. In this research, the GTWR model was used to address the issue of the spread of the COVID-19 disease. The COVID-19 virus has spread globally in various countries, including in Indonesia.
Indonesia is an archipelagic country, consisting of various large and small islands. Kalimantan represents the largest island in Indonesia, and consists of five provinces—East Kalimantan, North Kalimantan, South Kalimantan, Central Kalimantan, and West Kalimantan Provinces—all with an increasing daily spread of COVID-19. Data from the official COVID-19 website of the five provinces on the island of Kalimantan showed that the highest cumulative number of positive COVID-19 cases, as of 10 August 2021, was East Kalimantan Province with 133,826 cases [10], followed by South Kalimantan Province with 55,257 cases [11], Central Kalimantan Province with 38,123 cases [12], North Kalimantan Province with 26,050 cases [13], and West Kalimantan Province with 17,999 cases [14]. Based on this, it is important to undertake a study to understand the factors causing such an increase from a spatial and temporal point of view. The present study offers local governments information with regard to overcoming the increase in COVID-19 cases in their respective regions.
COVID-19 modeling studies using spatiotemporal analysis include: Pearson’s correlation methods for spatiotemporal analysis in regions of China [15]; Levy’s flight to explain the spatiotemporal dynamics of the pandemic regions in China [16]; prospective space−time statistics to identify active and emerging COVID-19 groups at a county level in the USA [17]; and an online questionnaire for the geographical identification of possible symptomatic regions in Israel [18]. Studies predicting the global spread of COVID-19 based on geographic and climatic data regions include: the Caribe Basin [19]; geographical characteristics and spatiotemporal analysis of infection regions in the USA [20]; analysis by province of the effectiveness of quarantine on the spread of the pandemic in Spain [21]; spatiotemporal analysis of COVID-19 at national and provincial levels in India [22]; the Poisson segmented model for the analysis of changing patterns in different geographic areas in China [23]; spatiotemporal analysis and reflections on health geography in Argentina [24]; spatiotemporal analysis of COVID-19 at national and provincial levels in Mexico [25]; spatiotemporal analysis and reflections on the usefulness of GIS in the pandemic [26]; and the analysis of restrictive measures during the pandemic [27]. A Susceptible–Infected–Recovered (SIR) model for estimating COVID-19 reproduction number in East Kalimantan and Samarinda [28].
Based on the background description above, this research was carried out using the Improved Geographically Temporally Weighted Regression model with the development of the distance function and the application of COVID-19 cumulative data in Kalimantan, Indonesia. The first objective of this research was to identify the factors that influenced the cumulative increase in COVID-19 at a region/city scale in Kalimantan, Indonesia—which consists of 56 regions/cities—by using data from 2020 and 2021. The second objective of this research was to map the spatial distribution for the 56 regions/cities based on significant predictor variables.

2. Materials and Methods

2.1. Geographically and Temporally Weighted Regression

The Geographically and Temporally Weighted Regression (GTWR) model represents an effective approach to dealing with the problem of spatial and temporal non-stationarity [9]. The GTWR model is a development of the GWR model, adding the time (temporal) element. In contrast to the GWR model, GTWR combines temporal and spatial information in a weighted matrix to identify spatial and temporal variability. The GTWR model in Equation (1) is for the independent variable p with the response variable at the location (ui, vi, t) for each observation:
y i = β 0 ( u i , v i ,   t i ) + k = 1 p β k ( u i , v i ,   t i ) x i k + ε i
where y i is the observed value of the response variable for the observation location ( u i , v i ) and time t i ; the parameter β 0 ( u i , v i ,   t i ) is the constant of the intercept value; the parameter β k ( u i , v i ,   t i ) is the regression coefficient of the k-th independent variable at the observation location ( u i , v i ) and time t i ; the variable x i k is the observed value of the k-th explanatory variable at the observation location ( u i , v i ) and time t i ; and ε i is error the i-th observations which are assumed to be identical, independent, and ε i ~ N ( 0 , σ 2 ) .

2.2. GTWR Model Parameter Estimation

The regression coefficient β ^ i ( u i , v i , t i ) at the i-th point can be obtained by using the Weighted Least Square. The estimated parameters of the GTWR model are given in Equation (2):
β ^ ( u i , v i ,   t i ) = [ X T W ( u i , v i ,   t i ) X ] 1 X T W ( u i , v i ,   t i ) y
where the weight W ( u i , v i , t i ) = d i a g ( w i 1 , w i 2 , , w i n ) is the weighting matrix at the observation location ( u i , v i ) and time t i . The diagonal element w i j ( 1     j     n ) is the spatiotemporal distance function at the observation point ( u i , v i , t i ). In the modeling stage, it is assumed that the proximity of the data observation point to the i point in the spatiotemporal coordinate system has a greater effect on the parameter estimator β ^ ( u i , v i ,   t i ) than that of the data located further from the i point. The proximity has two elements, spatial proximity and temporal proximity; thus, the definition and measurement of spatiotemporal proximity in the coordinate system constitute major problems in the construction of the GTWR model.
The present study used a date located at three dimensions in the spatiotemporal coordinate system and it was known that the observations were close to the i point. Therefore, Ref. [9] used an ellipsoidal coordinate system to measure the proximity of the regression point to the observation points that surround it.

2.3. Distance Function and Geographical Weight of the GTWR Model

The spatiotemporal distance function consists of a combination of the spatial distance function and the temporal distance function, which are given as follows [9,14]:
{ ( d i j S ) 2 = ( u i u j ) 2 + ( v i v j ) 2 ( d i j T ) 2 = ( t i t j ) 2 ( d i j S T ) 2 = φ S [ ( u i u j ) 2 + ( v i v j ) 2 ] + φ T [ ( t i t j ) 2 ]
where φ S and φ T are the affecting factors that balance the different effects used to measure the spatiotemporal distance. Based on the distance function in Equation (3), the geographical weighting function according to Equation (4) is obtained:
w i j = exp { ( φ S [ ( u i u j ) 2 + ( v i v j ) 2 ] + φ T [ ( t i t j ) 2 ] h S T 2 ) } = exp { ( [ ( u i u j ) 2 + ( v i v j ) 2 ] h S 2 + [ ( t i t j ) 2 ] h T 2 ) }
The value of h S 2 = h S T 2 φ S and h T 2 = h S T 2 φ T , then Equation (5) is obtained:
w i j = exp { ( ( d i j S ) 2 h S 2 + ( d i j T ) 2 h T 2 ) } = exp { ( ( d i j S ) 2 h S 2 ) } × exp { ( ( d i j T ) 2 h T 2 ) } = w i j S × w i j T
where w i j S = exp { ( ( d i j S ) 2 h S 2 ) } and w i j S = exp { ( ( d i j S ) 2 h S 2 ) }
h S is a parameter of the spatial window width, h T is a parameter of the temporal window width, and h S T is a parameter of the spatial-temporal window width.
In most cases, the value of φ S and φ T is not equal to zero. Let τ be the ratio parameter of = φ T φ S with φ S 0 ; then, Equation (6) [29] is obtained:
( d i j S T ) 2 φ S = [ ( u i u j ) 2 + ( v i v j ) 2 ] + τ [ ( t i t j ) 2 ]
Let φ S = 1 in order to reduce unknown parameters. In this problem, there is only one unknown parameter, τ . The parameter τ serves to increase or decrease the effect of temporal distance on spatial distance. This parameter is obtained from the minimum cross-validation criteria by initializing the initial τ value, as given in Equation (7).
( τ ) = i ( y i y ^ i ( τ ) ) 2
The Gaussian kernel function is a weighting function which is used in the GTWR model, as given in Equation (8).
W i j = exp ( ( d i j S T h S T ) 2 )
The weighting matrix is W i j determined by the spatiotemporal distance ( d i j S T ) and the window width h S T . The window width value can be calculated using the geographic weighted regression model, as proposed by [3]. The estimator value of the response variable is determined by Equation (9).
y ˆ = [ y ˆ 1 y ˆ 2 y ˆ n ] = [ X 1 T ( X T W ( u 1 , v 1 , t 1 ) X ) 1 X T W ( u 1 , v 1 , t 1 ) X 2 T ( X T W ( u 2 , v 2 , t 2 ) X ) 1 X T W ( u 2 , v 2 , t 2 ) X n T ( X T W ( u n , v n , t n ) X ) 1 X T W ( u n , v n , t n ) ] y = S y
The selection of the model’s goodness of fit can be calculated using the AIC (Akaike information criterion) value. The corrected AIC value [30] is used to overcome the spatiotemporal variability, as given in Equation (10).
A I C = 2   n   ln ( σ ^ ) + n   ln ( 2 π ) + n ( n + t r ( S ) n 2 t r ( S ) )

2.4. Research Methodology

2.4.1. Data and Data Sources

Data and data sources are described in Table 1.

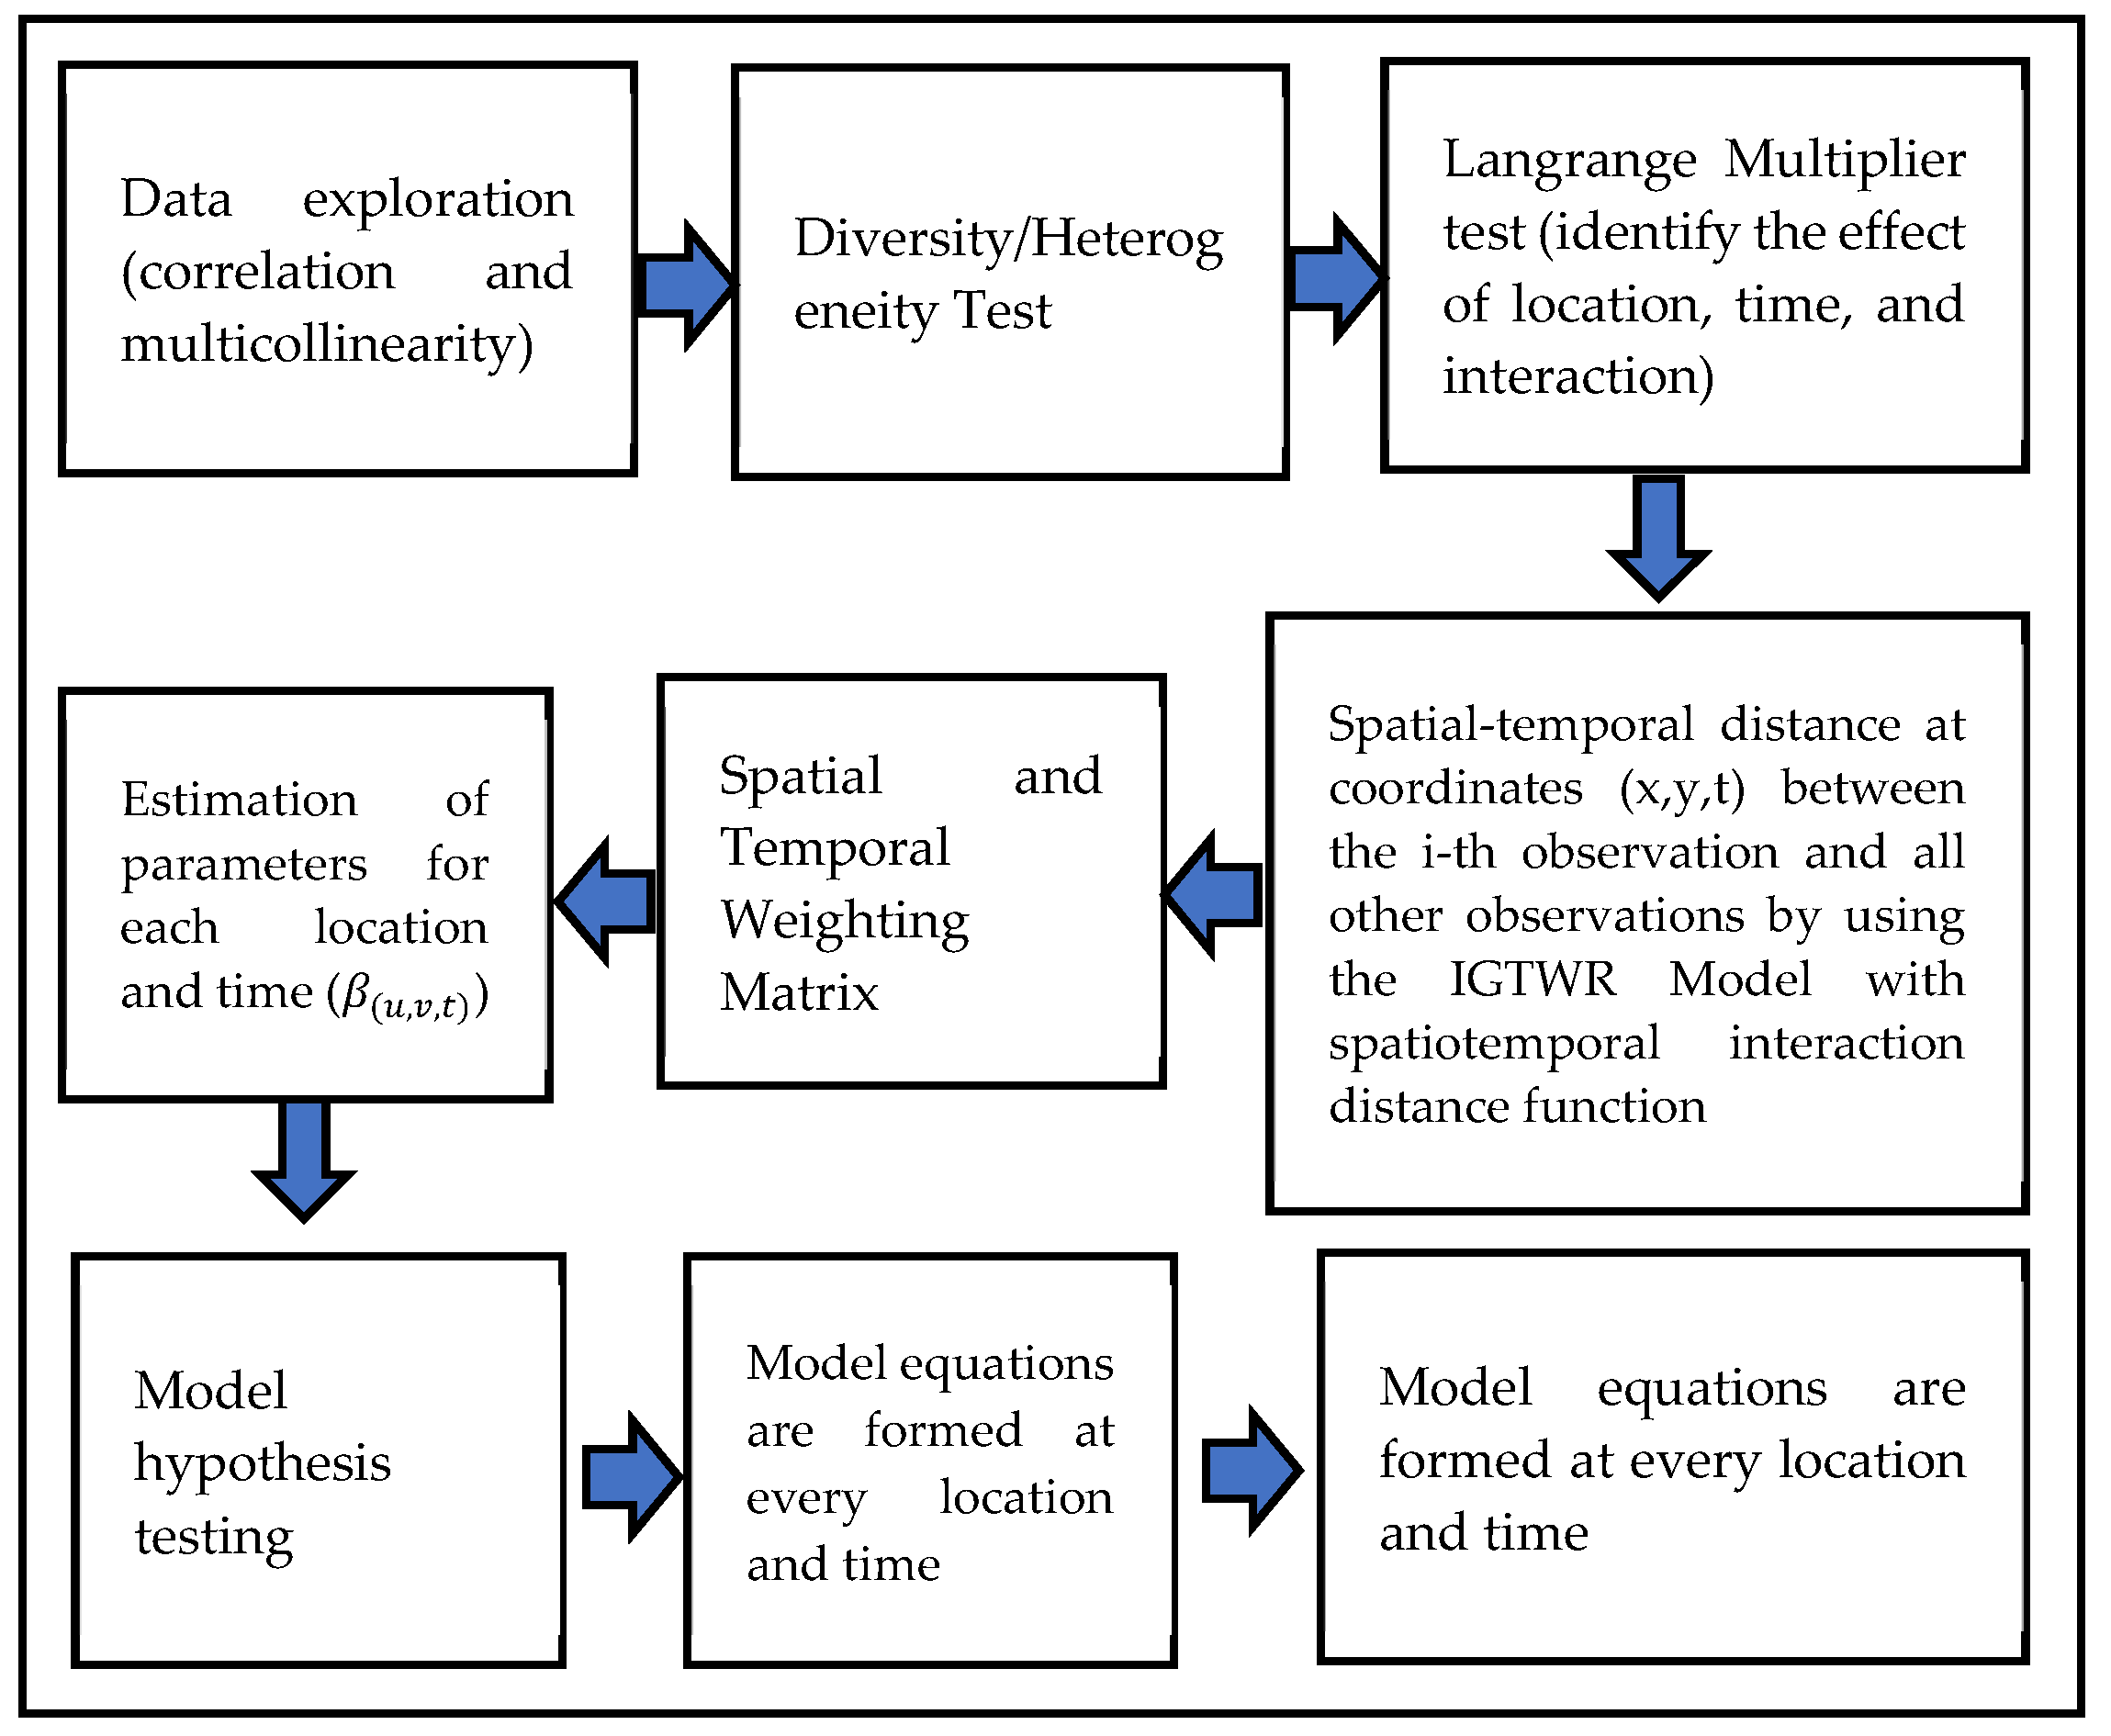
2.4.2. Stages of Analysis

The analysis and modeling processes were carried out by using the R-Studio version 2021.09.1 Build 372. The analysis stages are shown in Figure 1.
Based on the objectives of the study, the following are the stages of data analysis using the GTWR model to determine factors affecting the cumulative increase in COVID-19 cases and to map the spatial distribution based on significant predictor variables.
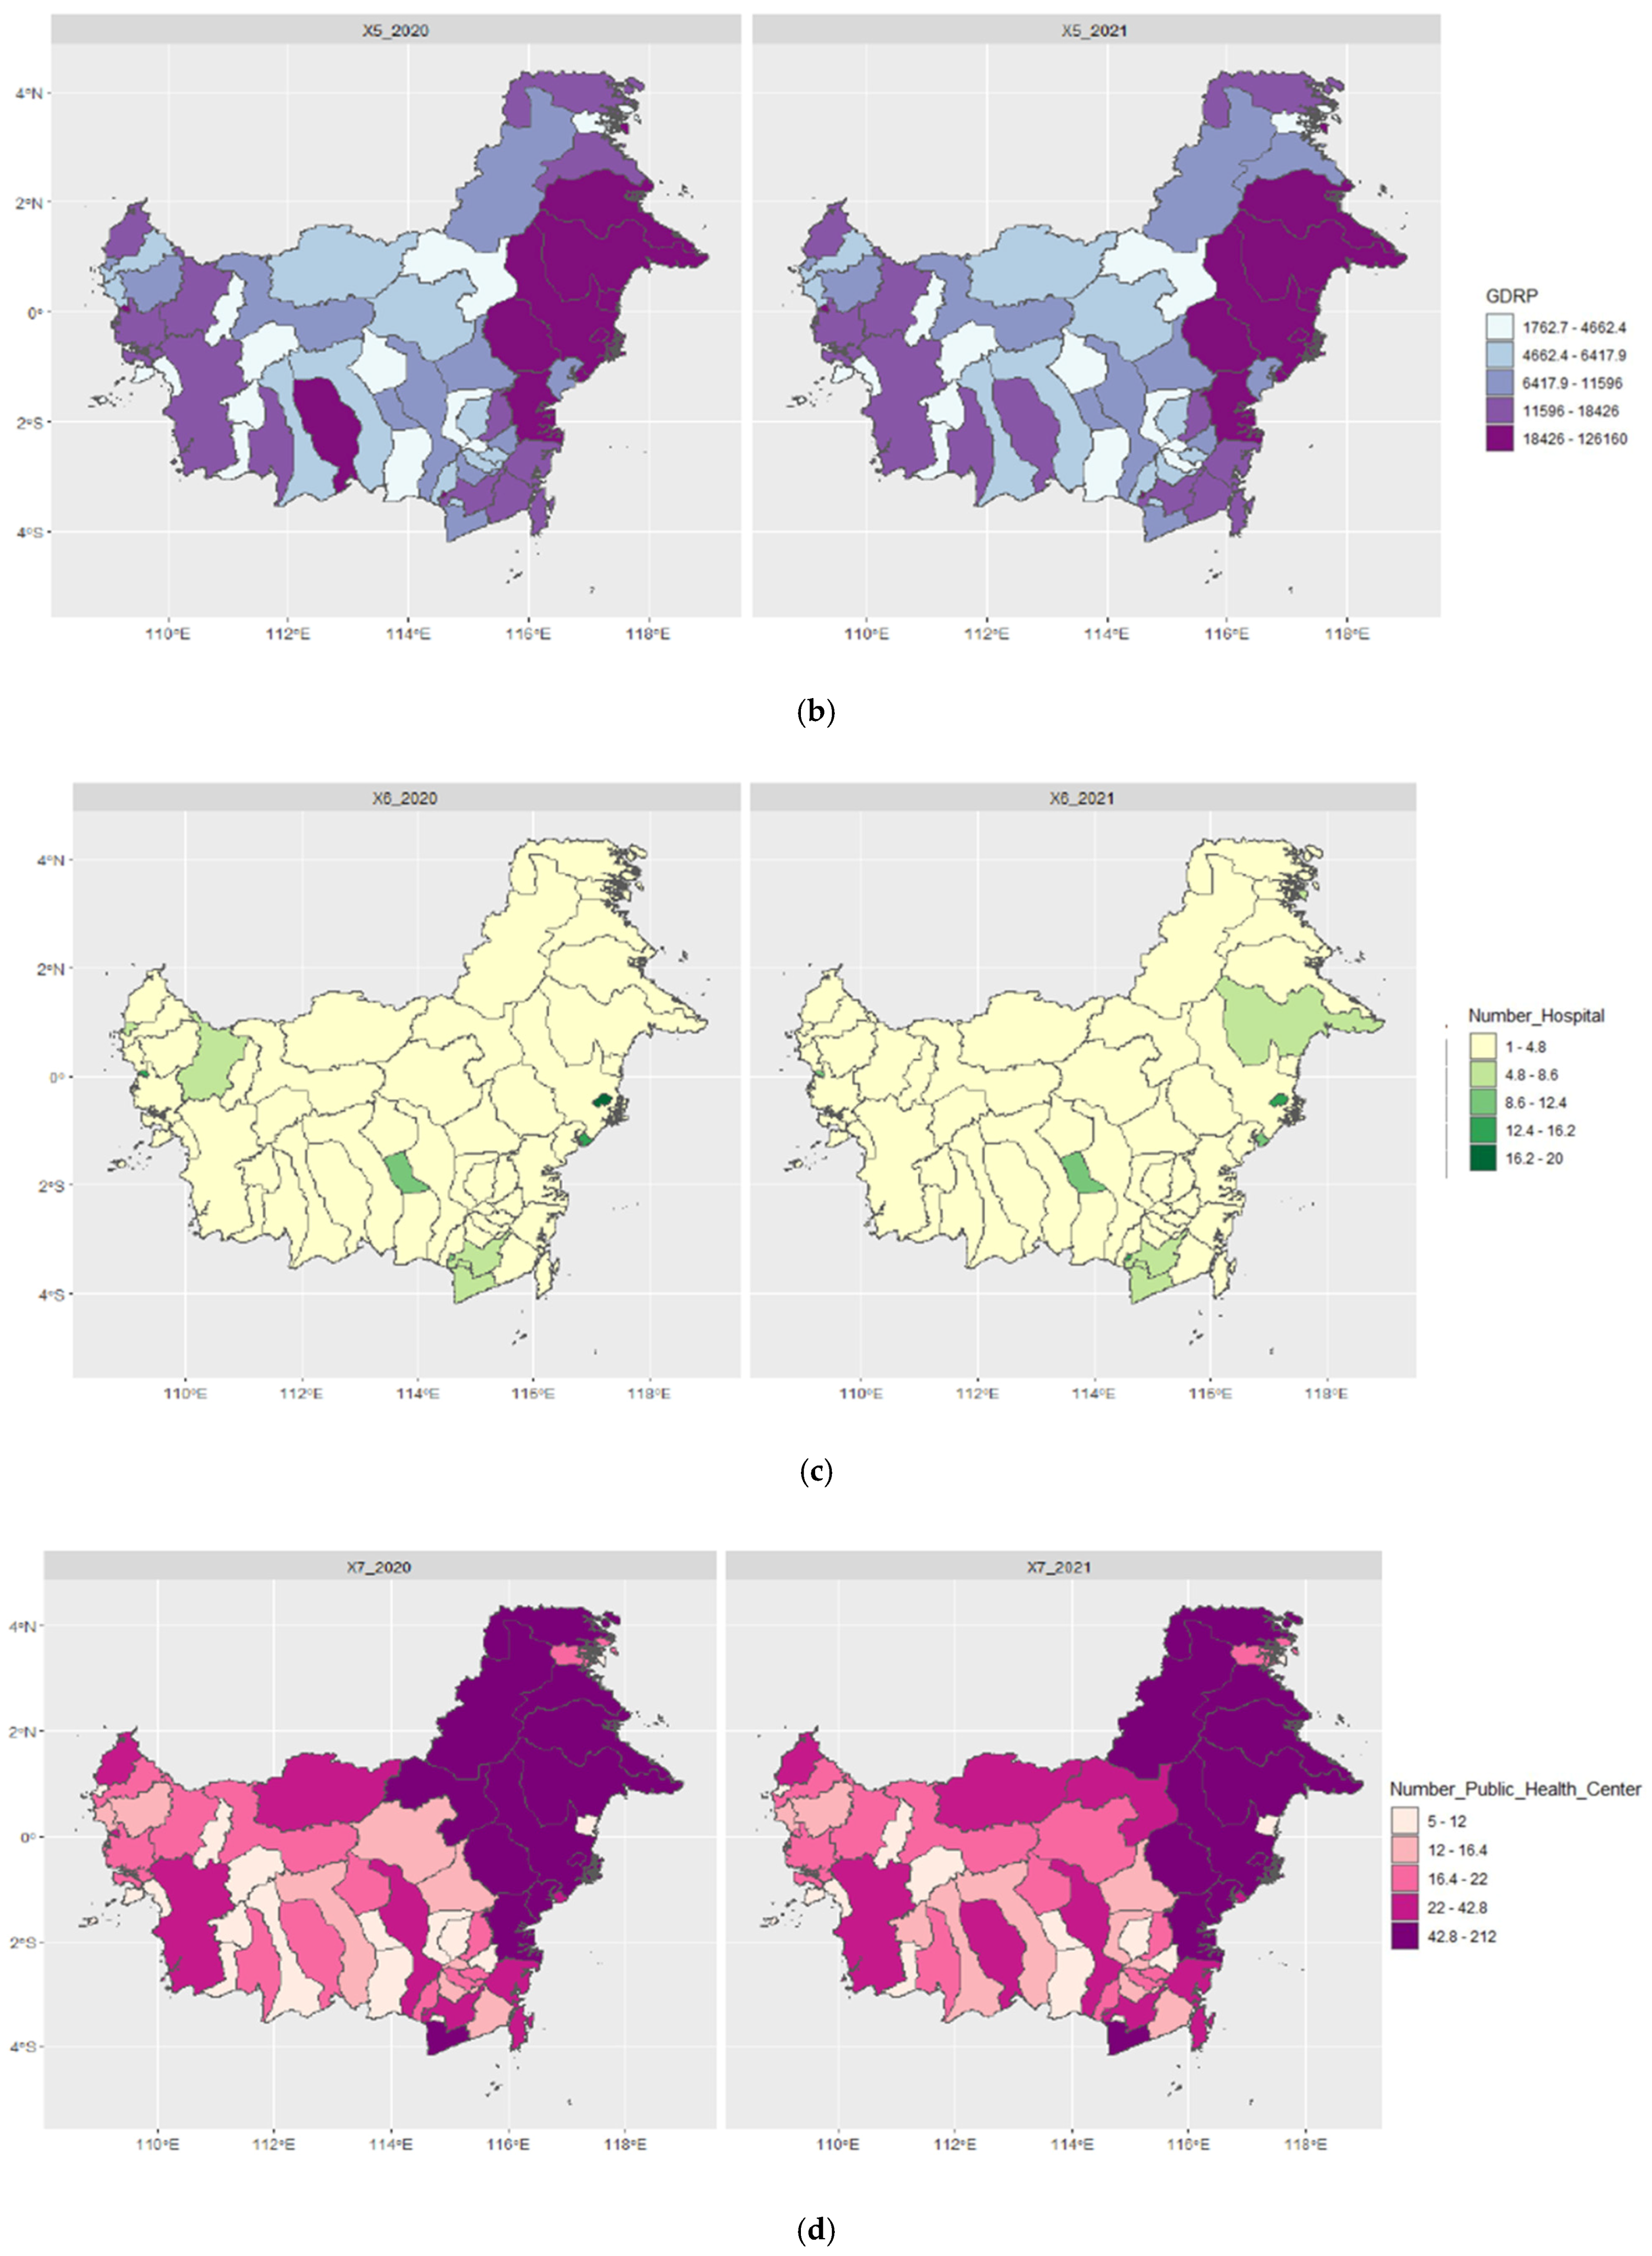
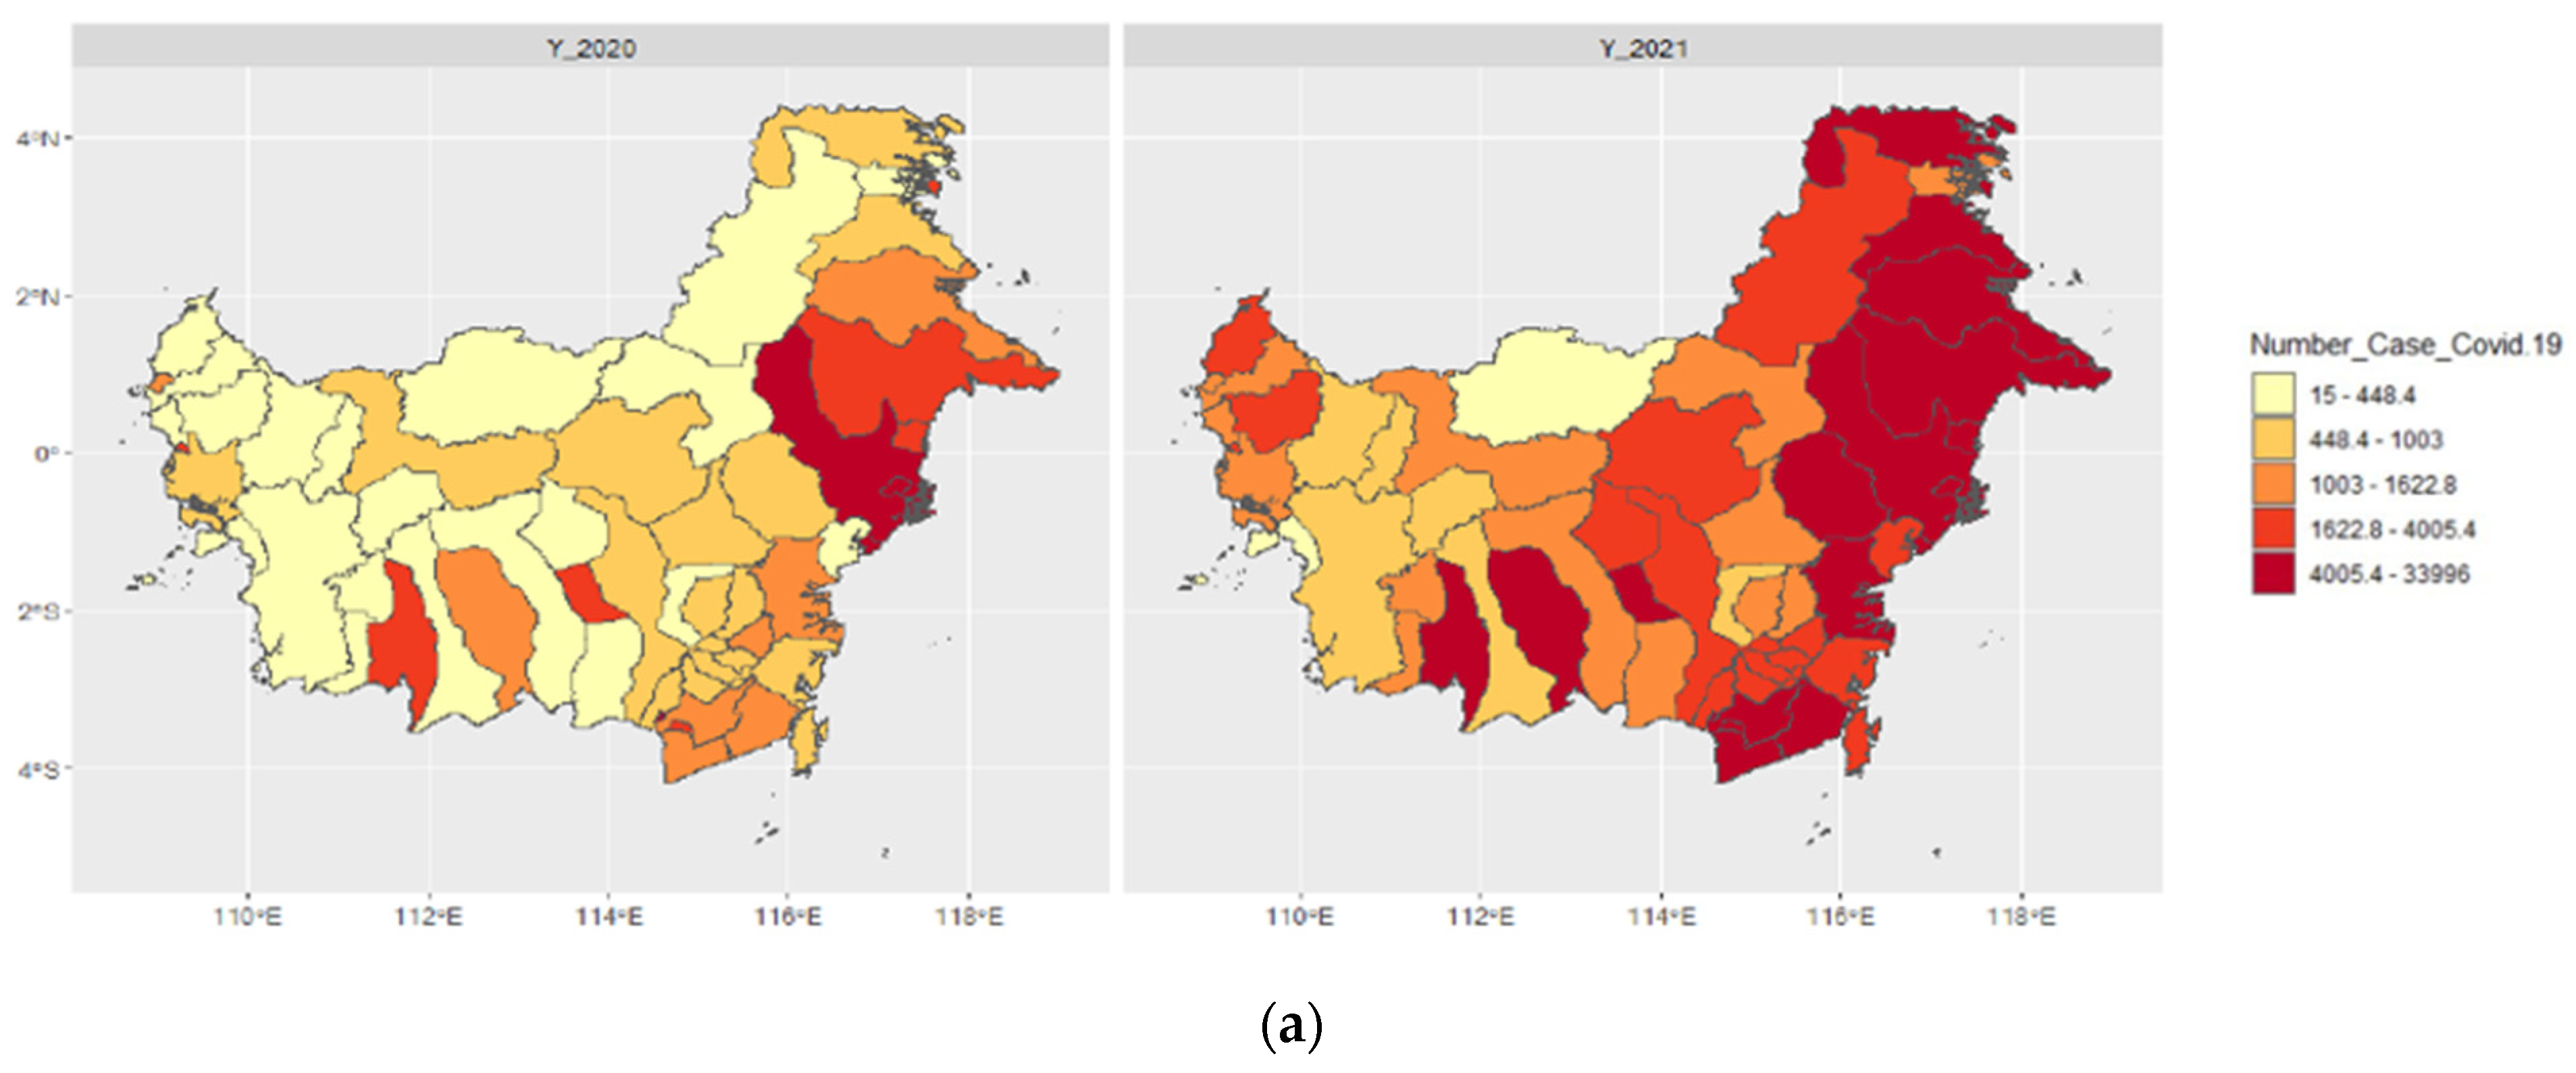
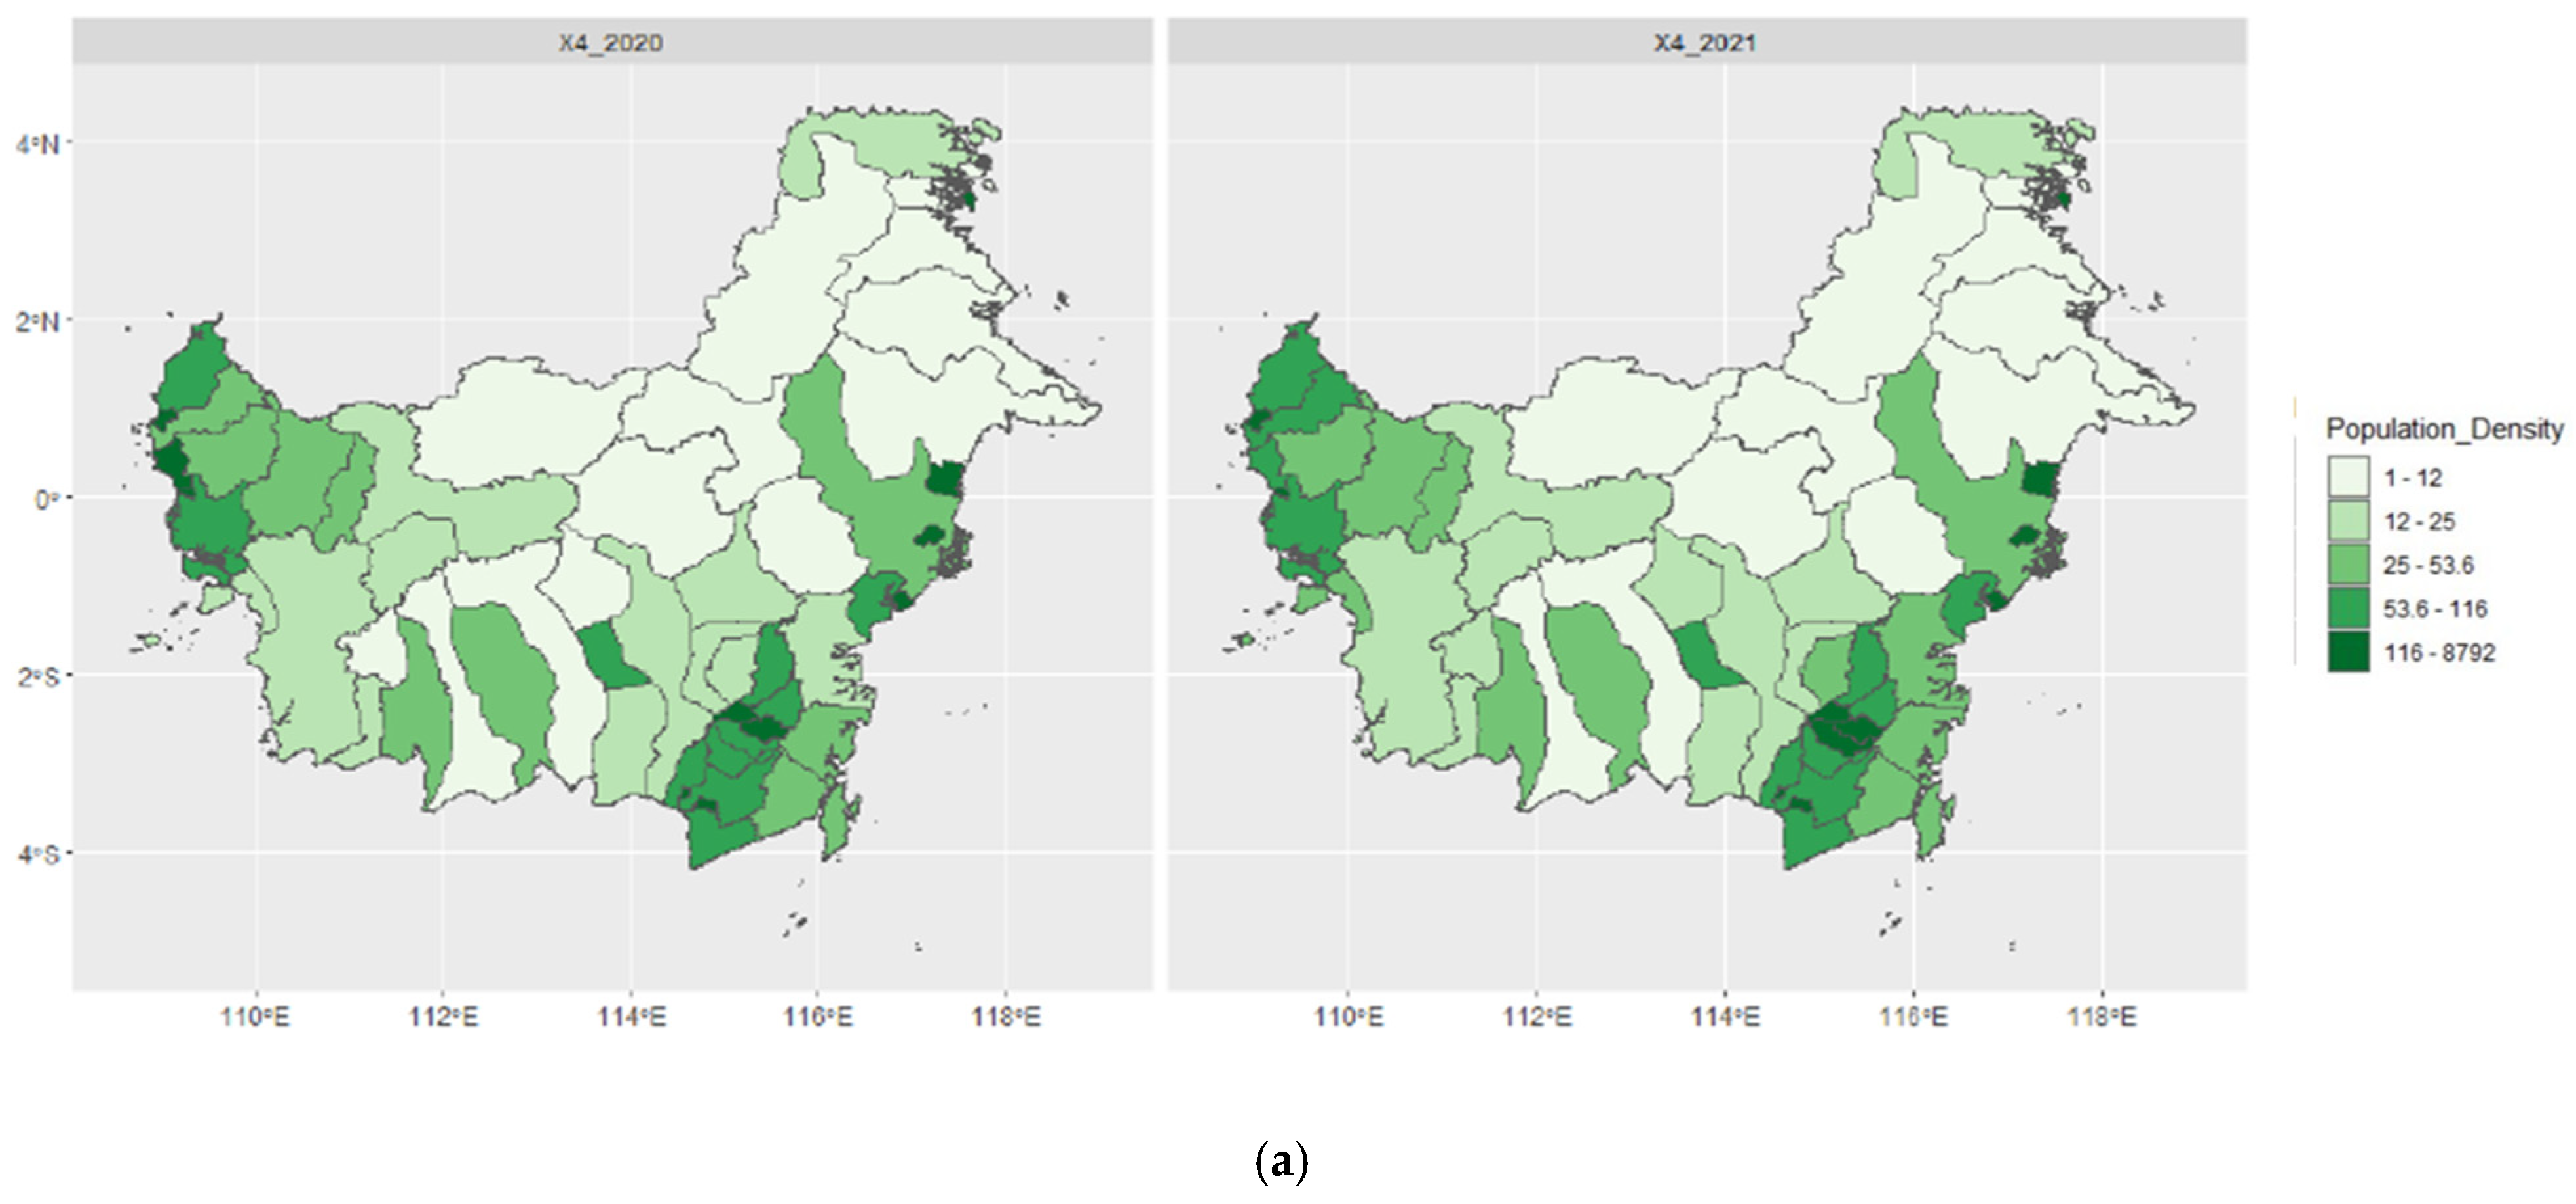
  • Explore the distribution of response variables and predictor variables for the period of 2020–2021 using a spatial distribution mapping;
  • Describe cumulative data of COVID-19 cases and the predictor variables;
  • Perform a multicollinearity test by taking the value of VIF (variance inflation factor) into account;
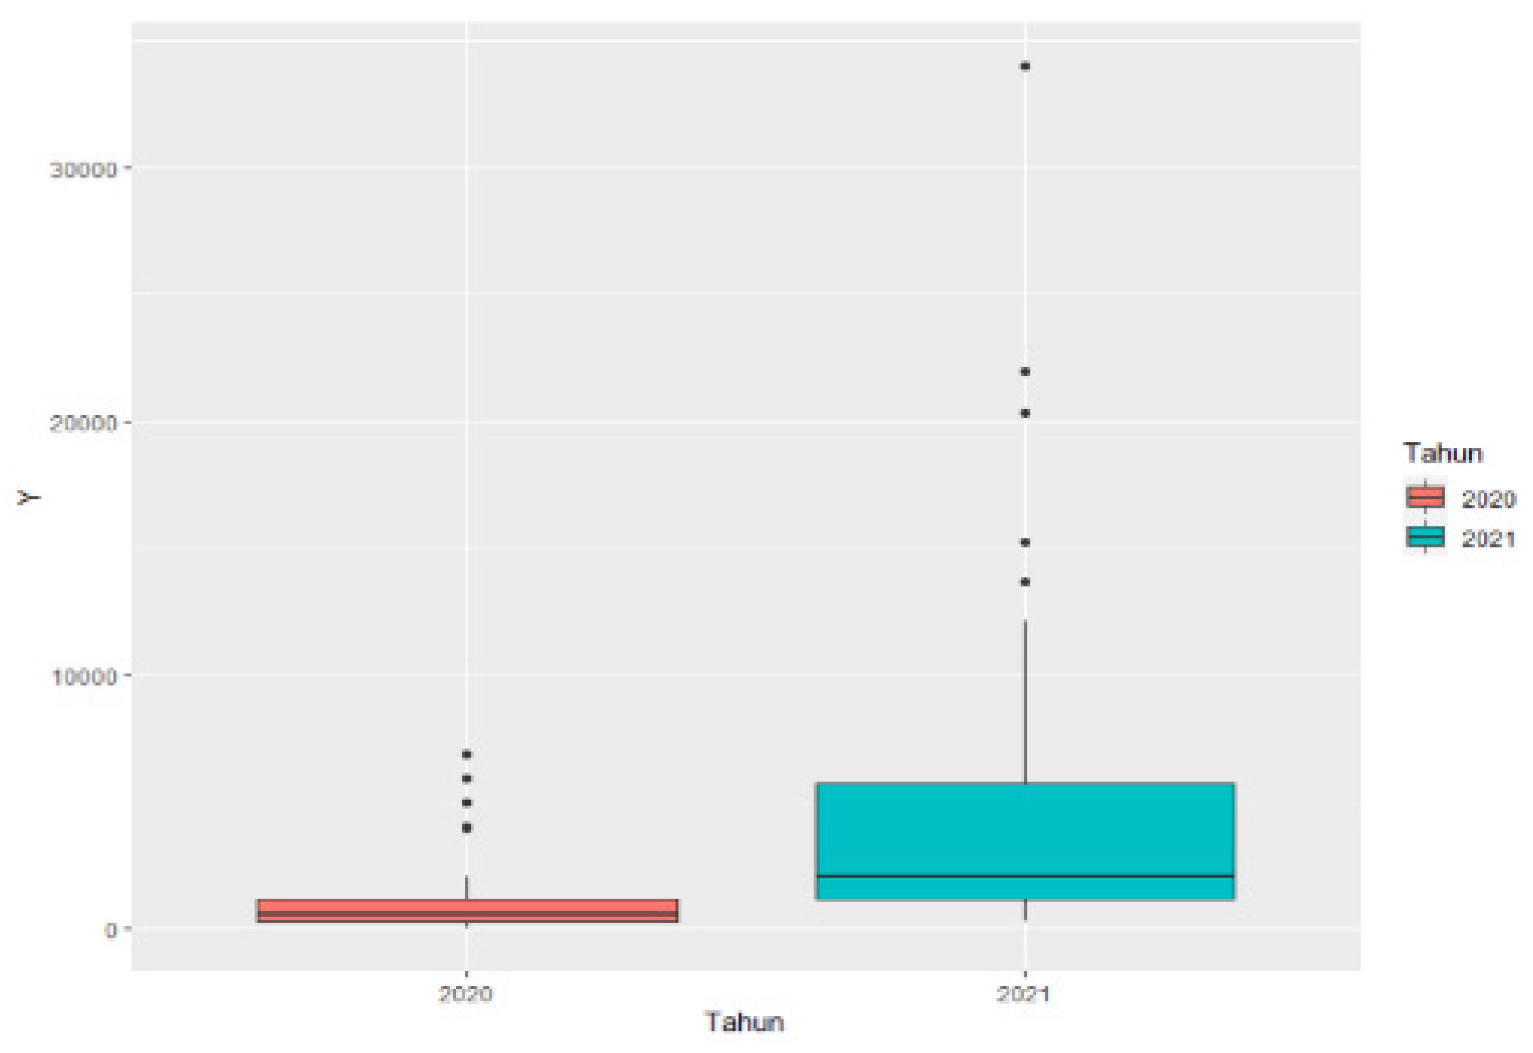
  • Explore temporal variability using a boxplot of response variables for each year;
  • Perform an analysis using the GTWR method as follows:
    • Calculate the optimum spatial bandwidth ( h S ) using cross-validation based on the GWR optimization approach with the formula as given by Equation (11):
      C V ( h S ) = i ( y i y ^ i ( h S ) ) 2
    • Calculate the optimum spatiotemporal ratio parameter ( τ ) ( τ ) using cross-validation based on the GTWR optimization approach with the formula as given by Equation (7);
    • Calculate parameters φ S and φ T using the cross-validation approach with the formula given in point b. Both parameters are based on the spatiotemporal distance function with the formula as given by Equation (12):
      ( d i j S T ) 2 = φ S [ ( u i u j ) 2 + ( v i v j ) 2 ] + φ T ( t i t j ) 2
    • Determine the weighting matrix (W) ( W ) using the spatiotemporal distance measure for each observation location based on the Gaussian kernel function with the formula given by Equation (8).
  • Estimate parameters in the GTWR model at each location using the weighted least square (WLS) according to Equation (2);
  • Perform a parameter significance test for the GTWR model;
  • Map the variable significance for each region.

3. Results and Discussion

This section begins by providing information on descriptive statistics, especially the presentation of data using a spatial distribution map, followed by information on the measure of concentration and the measure of data distribution. The results of the statistical inference research begin with regression analysis and a test of spatial effects, GTWR modeling, GTWR model estimation, the GTWR model significance test, and spatial mapping based on the GTWR model results. The analysis to determine factors affecting the increase in confirmed COVID-19 cases is based on the region/city scale on the island of Kalimantan, Indonesia.

3.1. Spatial Distribution Mapping

The observation data in Table 1 were subjected to descriptive statistical analysis and statistical inference. Observation data were categorized based on variables and are described in Figure 2 and Figure 3.
Figure 2a shows that the number of confirmed positive COVID-19 cases in 2020 spread evenly across the regions/cities in Kalimantan, as indicated by the similar distribution colors. However, in comparison, in 2020 the number of confirmed cases was relatively scant, while the number of positive COVID-19 cases increased in 2021. This is clearly shown by the color changes for regions/cities in East Kalimantan Province. Figure 2b shows the distribution of the number of doctors at the region/city scale in Kalimantan 2020–2021. Most regions/cities in Kalimantan had a small and evenly distributed number of doctors. In 2021, the number of doctors increased quite significantly in Samarinda and Balikpapan. This is shown by the dark color contrast, indicating a large number of doctors in these areas. This is commensurate with the increasing number of COVID-19 cases. Figure 2c shows the distribution of the number of TBC cases in 2020–2021. In general, there was no increase in the number of TBC cases in each region/city in Kalimantan. This is shown by the almost similar and evenly distributed color pattern in each area. However, the City of Banjarmasin had higher TB cases than that of other region/cities, as indicated by its darker color. Figure 3a shows the distribution of population density in 2020–2021. In general, there was no increase in population density in every region/city in Kalimantan. This is shown by the almost similar and evenly distributed color pattern in each area. However, the city of Samarinda had a higher population density than that of other regions/cities, as indicated by the darker color. Furthermore, the city of Samarinda had a decrease in population density from 2020 to 2021, as indicated by the color difference, which gets brighter.

3.2. Description of COVID-19 Cumulative Data and Predictor Variables

The descriptions of the COVID-19 cumulative data and predictor variables for the observation data in Table 1 are shown in Table 2.
Correlation between the variable y and each variable x 1 ,   x 2 ,   x 3 ,   x 4 ,   x 5 , x 6 ,   x 7 , and x 8 is given in Table 3.
The value of the correlation of the explanatory variable to the response variable shows that the variable x 1 had a high and positive correlation to the variable y. In addition, the variable x 1 had a significant correlation to the variable y. It can be concluded that the higher the number of positive COVID-19 cases, the higher the number of doctors will be.
The results of the multicollinearity test in Table 4 show that all variables had a VIF value of < 5; thus, all independent variables had no multicollinearity.
The results of the spatial variability test using the Breusch–Pagan test are shown in Table 5. It shows a p-value of 4.642 × 10 7 < 0.05; thus, there was spatial variability in the multiple linear regression model.
Figure 4 shows the visualization results of the number of positive COVID-19 cases from 2020 to 2021 using a boxplot. Figure 4 shows that, in 2021, the variability in the number of positive COVID-19 cases was larger than that of 2020. This difference in variability indicates a variability between years, or so-called temporal variability. The results of the analysis of the Breusch–Pagan and boxplot tests leads us to the conclusion that GTWR modeling can effectively be performed in the study of the 56 regions/cities in Kalimantan.

3.3. Geographically Temporally Weighted Regression (GTWR) Modeling for 56 Regencies/Cities in Kalimantan

3.3.1. Estimation of GTWR Model

The analysis of the GTWR model estimation uses Equation (2) at the i-th location where the location i = 1 , 2 , , 56 is the initials for 56 regions/cities in Kalimantan, and the t time is 1 for 2020 and 2 for 2021. The estimation results of the GTWR model are given in Equation (13).
y ^ i t = β ^ 0 ( u i , v i ,   t i ) + β ^ 1 ( u i , v i ,   t i ) x i t 1 + β ^ 2 ( u i , v i ,   t i ) x i t 2 + β ^ 3 ( u i , v i ,   t i ) x i t 3 + β ^ 5 ( u i , v i ,   t i ) x i t 5 + β ^ 6 ( u i , v i ,   t i ) x i t 6       ,   i = 1 , 2 , , 56   ;   t = 1 , 2
Table 6 shows the summary results of GTWR modeling using the Gaussian kernel function with a fixed bandwidth on the spatial and temporal weighting function. The variable number of doctors ( x 1 ) has a coefficient value ranging from −3.750 to 23.5555. The variable number of TB cases ( x 2 ) has a coefficient value ranging from −4869 to 2702. The variable percentage of elderly population has a coefficient value ranging from −20,633 to 110,781. The variable GRDP ( x 5 ) has a coefficient value ranging from 0.0303 to 0.2104. The variable number of hospitals ( x 6 ) has a coefficient value ranging from −308.44 to 1024,983. The coefficient values for each of these variables are spread across all regions/cities in Kalimantan.
The results of parameter estimation provide GTWR model estimators which state the correlation of the independent variables of number of doctors ( x 1 ), number of TB cases ( x 2 ), percentage of elderly population ( x 3 ), GRDP ( x 5 ), and number of hospitals ( x 6 ) to the percentage of positive COVID-19 cases in the Kalimantan provinces. Four GTWR models are given for four region/city locations in Equations (14)–(17).
Samarinda City, East Kalimantan Province 2020:
y ^ i t = 206.539 0.898 X i t 1 + 0.248 X i t 2 2.802 X i t 3 + 0.034 X i t 5 + 264.725 X i t 6
Samarinda City, East Kalimantan Province 2021:
y ^ i t = 515.123 + 12.700 X i t 1 + 1.194 X i t 2 + 4.734 X i t 3 + 0.149 X i t 5 + 432.961 X i t 6
Kapuas Hulu Regency, West Kalimantan Province 2020:
y ^ i t = 405.751 0.096 X i t 1 0.149 X i t 2 + 19.508 X i t 3 + 0.04 X i t 5 + 188.398 X i t 6
Kapuas Hulu Regency, West Kalimantan Province 2021:
y ^ i t = 1382.853 + 5.676 X i t 1 4.156 X i t 2 + 74.872 X i t 3 + 0.185 X i t 5 + 903.160 X i t 6

3.3.2. Measure of Model’s Goodness of Fit

The measure of the goodness used to compare the OLS model and GTWR model is the coefficient of determination (R2), adjusted R2, Akaike information criterion (AIC), and the root mean square error (RMSE). The results of the comparison of the value of the goodness-of-fit measure are shown in Table 7.
The above comparison of models shows that the GTWR model is better than the OLS model. This is indicated by the higher values of R2 and adjusted R2, as well as the smaller values of AIC and RMSE criteria.

3.3.3. Simultaneous Significance Test of GTWR Model Parameters

The first hypothesis testing conducted were the simultaneous tests of the model in order to test the goodness of fit of the GTWR model. The hypothesis testing for the goodness of fit of the GWPR model was as follows:
H0: β ^ k ( u i , v i ,   t i ) = β ^ k , k = 1 , 2 , , 5   ; i = 1 , 2 , , 56   ; t = 1 , 2
(There is no significant difference between multiple linear regression models and GTWR models.)
H1:There is at least one β ^ k ( u i , v i ,   t i ) β ^ k   k = 1 , 2 , , 5   ; i = 1 , 2 , , 56   ; t = 1 , 2
Table 8 shows that F-Statistics = 14,440 > F-table = 1537 or p-value = 0.000 < α = 0.05. Thus, H0 was rejected and there was a significant difference between the multiple linear regression model and the GTWR model.

3.3.4. Partial Significance Test of GTWR Model Parameters

Partial parameter tests aim to determine the partial effects of the independent variables on the dependent variable. The hypothesis for the partial tests of the regression model parameters for the parameter β ^ k ( u i , v i ,   t i ) was as follows:
H0: β ^ k ( u i , v i ,   t i ) = 0 , k = 1 , 2 , , 5   ; i = 1 , 2 , , 56   ; t = 1 , 2
(The independent variable X k t has no effect on the number of positive COVID-19 cases in Kalimantan Provinces.)
H1: β ^ k ( u i , v i ,   t i ) 0 , k = 1 , 2 , , 5   ; i = 1 , 2 , , 56   ; t = 1 , 2
(The independent variable X k t has an effect on the number of positive COVID-19 cases in Kalimantan Provinces.)
The test statistic of the partial parameter testing was the statistic of the t-test. The criteria for rejecting H0 at the significance level of α = 0.05 was to reject H0 if the p-value < 0.05. The results of the partial test of parameters are shown in Table 9. The table above shows that the factors affecting the number of positive COVID-19 cases in the Berau region were the human development index, life expectancy, gross regional domestic income, population growth rate, and so on, for all observation locations in the Kalimantan provinces. This is shown by the p-value of those variables that is lower than 0.05.

3.3.5. Mapping Based on the Significance of GTWR Model Parameters

Figure 5 shows the result of a GTWR model analysis, indicating variables significantly affecting the number of positive COVID-19 cases in Kalimantan in 2020–2021. In 2020, GRDP ( x 5 ) and number of hospitals ( x 6 ) had a significant effect on the number of positive COVID-19 cases in the majority of regions/cities. Meanwhile, in 2021, x 2 ,   x 3 ,   x 5 and x 6 were those variables with a significant effect on the number of positive COVID-19 cases in West Kalimantan Province. In North Kalimantan Province, the variables x 1 ,   x 3 and x 5 had a significant effect on the number of positive COVID-19 cases. Furthermore, in South Kalimantan Province, the variables with a significant effect on the number of positive COVID-19 cases were x 1 ,   x 5 , and x 6 .

4. Conclusions

The present study developed a geographically temporally weighted regression (GTWR) model by constructing a distance function with spatial and temporal interactions. The GTWR model uses a Gaussian kernel function with a fixed bandwidth on its spatial and temporal weighting functions. The GTWR model had the greatest goodness of fit, as shown by the coefficient of determination R2 = 0.957, adjusted R2 = 0.928, Akaike information criterion (AIC) = 1900.76, and root mean square error (RMSE) = 1302.99. Based on the spatio-temporal analysis using the GTWR model, the factors that influenced the increase in positive cases of COVID-19 were different for each district/city in Kalimantan. Overall, the factors that affected COVID-19 were the number of doctors, the number of hospitals, the number of villages that had puskesmas, and the number of tuberculosis cases. The population sector included the percentage of elderly population, population density, and the percentage of the poor. The highest effects, based on the GTWR model, were tuberculosis cases, health services, and elderly population percentage. Therefore, local governments need to pay attention to patients with tuberculosis, health services, and population density, considering those who are most vulnerable to contracting the COVID-19 virus. The mapping of the spread of COVID-19 based on the model’s significant variables was grouped into 11 groups, so that each region can identify the factors that can be considered to prevent an increase in positive cases of COVID-19.

Author Contributions

Conceptualization, S.S. and D.R.; methodology, D.R. and M.R.; software, D.R.; validation, S.S., M.R. and D.R.; formal analysis, S.S.; investigation, S.A.; resources, M.R.; data curation, S.A.; writing—original draft preparation, S.S.; writing—review and editing, R.D.W.; visualization, S.S.; supervision, D.R.; project administration, S.J. All authors have read and agreed to the published version of the manuscript.

Funding

This research was funded by KEMENDIKBUD RISTEK Indonesia in 2021 [597/UN17.L1/PG/2021].

Institutional Review Board Statement

Not applicable.

Informed Consent Statement

Not applicable.

Data Availability Statement

The dataset in this article was derived from Official websites https://www.covid19.kaltimprov.go.id/; https://www.coronainfo.kaltaraprov.go.id/; https://www.corona.kalselprov.go.id/; https://www.corona.kalteng.go.id/; https://www.corona.kalbarprov.go.id/ and the National Bureau of Statistics of the Republic of Indonesia, https://www.bps.go.id/ and Public Health Office of Kalimantan. (accessed on 10 August 2021).

Acknowledgments

The authors gratefully acknowledge the funding of KEMENDIKBUD RISTEK Indonesia in 2021 [597/UN17.L1/PG/2021].

Conflicts of Interest

The authors have no conflict of interest related to this research.

References

  1. World Health Organization. COVID-19 Weekly Epidemiological Update Edition 56, 7 Sepetember 2021. World Health Organization 420 COVID-19 Weekly Epidermilogical Update; World Health Organization: Geneva, Switzerland, 2021; Volume 49, pp. 1–3. [Google Scholar]
  2. Ministry of Health, Kementrian Kesehatan. Peta Sebaran dan Kasus COVID-19 di Indonesia. Published online 2021. Available online: https://in-422feksiemerging.kemkes.go.id/dashboard/covid-19/ (accessed on 10 August 2021).
  3. Fotheringham, A.S.; Brundson, C.; Charlton, M. Geographically Weighted Regression: The Analysis of Spatially Varying Relationships; John Wiley & Sons Ltd.: Chichester, UK, 2002. [Google Scholar]
  4. Fotheringham, A.S.; Crespo, R.; Yao, J. Geographical and Temporal Weighted Regression (GTWR). Geogr. Anal. 2015, 47, 431–452. [Google Scholar] [CrossRef] [Green Version]
  5. Brunsdon, C.; Fotheringham, A.S.; Charlton, M. Some notes on parametric significance tests for geographically weighted regression. J. Reg. Sci. 1999, 39, 497–524. [Google Scholar] [CrossRef]
  6. Crespo, R.; Fotheringham, S.; Charlton, M. Application of geographically weighted regression to a 19-year set of house price data in London to calibrate local hedonic price models. In Proceedings of the 9th International Conference on GeoComputation, Maynooth, Ireland, 3–5 September 2007; Available online: https://mural.maynoothuniversity.ie/5816/1/MC_application.pdf (accessed on 5 August 2021).
  7. Leung, Y.; Mei, C.L.; Zhang, W.X. Statistical tests for spatial nonstationarity based on the geographically weighted regression model. Environ. Plan. A 2000, 32, 9–32. [Google Scholar] [CrossRef]
  8. Leung, Y.; Mei, C.L.; Zhang, W.X. Testing for spatial autocorrelation among the residuals of the geographically weighted regression. Environ. Plan. A 2000, 32, 871–890. [Google Scholar] [CrossRef]
  9. Huang, B.; Wu, B.; Barry, M. Geographically and temporally weighted regression for modeling spatio-temporal variation in house prices. Int. J. Geogr. Inf. Sci. 2010, 24, 383–401. [Google Scholar] [CrossRef]
  10. Kalimantan Timur COVID-19. Available online: https://covid19.kaltimprov.go.id/ (accessed on 10 August 2021).
  11. Kalimantan Selatan COVID-19. Available online: https://corona.kalselprov.go.id/ (accessed on 10 August 2021).
  12. Kalimantan Tengah COVID-19. Available online: https://corona.kalteng.go.id/ (accessed on 10 August 2021).
  13. Kalimantan Utara COVID-19. Available online: https://coronainfo.kaltaraprov.go.id/ (accessed on 10 August 2021).
  14. Kalimantan Barat COVID-19. Available online: https://covid19.kalbarprov.go.id/ (accessed on 10 August 2021).
  15. Xiong, Y.; Wang, Y.; Chen, F.; Zhu, M. Spatial Statistics and Influencing Factors of the Epidemic of Novel Coronavirus Pneumonia 2019 in Hubei Province, China. Res. Sq. 2020, 3, 1–25. [Google Scholar] [CrossRef] [Green Version]
  16. Gross, B.; Zheng, Z.; Liu, S.; Chen, X.; Sela, A.; Li, J.; Li, D.; Havlin, S. Spatio-temporal propagation of COVID-19 pandemics. Medrxiv.Org. 2020, 1–7. Available online: https://www.medrxiv.org/content/10.1101/2020.03.23.20041517v3.full.pdf (accessed on 8 August 2021).
  17. Desjardins, M.R.; Hohl, A.; Delmelle, E.M. Rapid surveillance of COVID-19 in the United States using a prospective space-time scan statistic: Detecting and evaluating emerging clusters. Appl. Geogr. 2020, 118, 102–202. Available online: https://www.ncbi.nlm.nih.gov/pmc/articles/PMC7139246/pdf/main.pdf (accessed on 8 August 2021). [CrossRef] [PubMed]
  18. Rossman, H.; Keshet, A.; Shilo, S.; Gavrieli, A.; Bauman, T.; Cohen, O.; Belicer, R.; Geiger, B.; Dor, Y.; Segal, E. A framework for identifying regional outbreak and spread of COVID-19 from one-minute population-wide surveys. Nat. Med. 2020, 26, 632. [Google Scholar] [CrossRef] [PubMed] [Green Version]
  19. de Ángel Solá, D.E.; Wang, L.; Vázquez, M.; Méndez-Lázaro, P.A. Weathering the pandemic: How the Caribbean Basin can use viral and environmental patterns to predict, prepare, and respond to COVID-19. J. Med. Virol. 2020, 92, 1460–1468. [Google Scholar] [CrossRef] [PubMed] [Green Version]
  20. CDC COVID-19 Response Team. Geographic Differences in COVID-19 Cases, Deaths, and Incidence—United States. US Dep. Health Hum. Serv./Cent. Dis. Control Prev. 2020, 69, 15. [Google Scholar]
  21. Orea, L.; Alvarez, I.C. How effective has the Spanish lockdown been to battle COVID-19? A spatial analysis of the coronavirus propagation across provinces. In Documento de Trabajo—2020/03; 2020; pp. 1–27. Available online: https://documentos.fedea.net/pubs/dt/2020/dt2020-03.pdf (accessed on 5 August 2021).
  22. Murugesan, B.; Karuppannan, S.; Mengistie, A.T.; Ranganathan, M.; Gopalakrishnan, G. Distribution and Trend Analysis of COVID-19 in India: Geospatial Approach. J. Geogr. Stud. 2020, 4, 1–9. [Google Scholar] [CrossRef]
  23. Tang, W.; Liao, H.; Marley, G.; Wang, Z.; Cheng, W.; Wu, D.; Yu, R. The changing patterns of coronavirus disease 2019 (COVID19) in China: A tempogeographic analysis of the severe acute respiratory syndrome coronavirus 2 epidemic. Clin. Infect. Dis. 2020, 71, 818–824. [Google Scholar] [CrossRef] [PubMed]
  24. Buzai, G.D. De Wuhan a Luján. Evolución Espacial del COVID-19. Posición 2020, 3, 1–21. Available online: http://ri.unlu.edu.ar/xmlui/handle/rediunlu/683 (accessed on 5 August 2021).
  25. Santana Juárez, M.V. COVID-19 en México: Comportamiento Espacio Temporal y Condicionantes Socioespaciales, Febrero y Marzo de 2020. Posicion 2020, 3, 1–27. Available online: df634b_96bb0dd9fa6b4621b96a2d722105f2bd.pdf(filesusr.com) (accessed on 1 August 2021).
  26. Saha, A.; Gupta, K.; Patil, M.; Urvashi. Monitoring and epidemiological trends of coronavirus disease (COVID-19) around the world. Matrix Sci. Med. 2020, 4, 121. Available online: https://www.matrixscimed.org/text.asp?2020/4/4/121/297630 (accessed on 5 August 2021). [CrossRef]
  27. Andriyanov, N.; Korovin, D. Analysis of the Restrictive Measures Impact on the Disease Spread. In Proceedings of the 2021 International Conference on Information Technology and Nanotechnology (ITNT), Samara, Russia, 20–24 September 2021; pp. 1–6. [Google Scholar] [CrossRef]
  28. Sifriyani, S.; Rosadi, D. Susceptible Infected Recovered (SIR) Model for Estimating Covid-19 Reproduction Number in East Kalimantan and Samarinda. Media Stat. 2020, 13, 170–181. [Google Scholar] [CrossRef]
  29. Wu, B.; Li, R.; Huang, B. A geographically and temporally weighted autoregressive model with application to housing prices. Int. J. Geogr. Inf. Sci. 2014, 28, 1186–1204. [Google Scholar] [CrossRef]
  30. Liu, J.; Zhao, Y.; Yang, Y.; Xu, S.; Zhang, F.; Zhang, X.; Shi, L.; Qiu, A. A mixed geographically and temporallyweighted regression: Exploring spatial-temporal variations from global and local perspectives. Entropy 2017, 19, 53. [Google Scholar] [CrossRef] [Green Version]
  31. West Kalimantan Province in Figures 2020. The Central Statistics Agency of the West Kalimantan Province, Indonesia. Available online: https://kalbar.bps.go.id/publication/2020/04/27/62fcae2341a7a6e3d98d335f/provinsi-kalimantan-barat-dalam-angka-2020.html (accessed on 30 December 2020).
  32. East Kalimantan Province in Figures 2020. The Central Statistics Agency of the East Kalimantan Province, Indonesia. Available online: https://kaltim.bps.go.id/publication/2020/04/27/09a2f696ac7ee2ce6d0bbb27/provinsi-kalimantan-timur-dalam-angka-2020.html (accessed on 30 December 2020).
  33. South Kalimantan Province in Figures 2020. The Central Statistics Agency of the South Kalimantan Province, Indonesia. Available online: https://kalsel.bps.go.id/publication/2020/04/27/b8ffa26a7fa66b9494c10df2/provinsi-kalimantan-selatan-dalam-angka-2020.html (accessed on 30 December 2020).
  34. Central Kalimantan Province in Figures 2020. The Central Statistics Agency of the Central Kalimantan Province, Indonesia. Available online: https://kalteng.bps.go.id/publication/2020/04/27/b7a4b35150ad5fd151230c48/provinsi-kalimantan-tengah-dalam-angka-2020.html (accessed on 30 December 2020).
  35. North Kalimantan Province in Figures 2020. The Central Statistics Agency of the North Kalimantan Province, Indonesia. Available online: https://kaltara.bps.go.id/publication/2020/04/27/713e58e4215d5b908b609194/provinsi-kalimantan-utara-dalam-angka-2020.html (accessed on 30 December 2020).
  36. West Kalimantan Province in Figures 2021. The Central Statistics Agency of the West Kalimantan Province, Indonesia. Available online: https://kalbar.bps.go.id/publication/2021/02/26/fd6563fa45106b2442988fbf/provinsi-kalimantan-barat-dalam-angka-2021.html (accessed on 10 August 2021).
  37. East Kalimantan Province in Figures 2021. The Central Statistics Agency of the East Kalimantan Province, Indonesia. Available online: https://kaltim.bps.go.id/publication/2021/02/26/be2498bbcd1727ce780e4814/provinsi-kalimantan-timur-dalam-angka-2021.html (accessed on 10 August 2021).
  38. South Kalimantan Province in Figures 2021. The Central Statistics Agency of the South Kalimantan Province, Indonesia. Available online: https://kalsel.bps.go.id/publication/2021/02/26/dcf0c95d8cf054b7f498e75c/provinsi-kalimantan-selatan-dalam-angka-2021.html (accessed on 10 August 2021).
  39. Central Kalimantan Province in Figures 2021. The Central Statistics Agency of the Central Kalimantan Province, Indonesia. Available online: https://kalteng.bps.go.id/ (accessed on 10 August 2021).
  40. North Kalimantan Province in Figures 2021. The Central Statistics Agency of the North Kalimantan Province, Indonesia. Available online: https://kaltara.bps.go.id/publication/2021/02/26/12e7e35f23735148eb3df3c8/provinsi-kalimantan-utara-dalam-angka-2021.html (accessed on 10 August 2021).
  41. The Provincial Health Office of West Kalimantan, Indonesia. Health Profil of West Kalimantan Province 2020. 2020. Available online: https://dinkes.kalbarprov.go.id (accessed on 30 December 2020).
  42. The Provincial Health Office of East Kalimantan, Indonesia. Health Profil of East Kalimantan Province 2020. 2020. Available online: https://dinkes.kaltimprov.go.id (accessed on 30 December 2020).
  43. South Kalimantan Province Public Health Office. Health Profil of South Kalimantan Province 2020. The Provincial Health Office of South Kalimantan, Indonesia. 2020. Available online: https://dinkes.kalselprov.go.id (accessed on 30 December 2020).
  44. Central Kalimantan Province Public Health Office. Health Profil of Central Kalimantan Province 2020. The Provincial Health Office of Central Kalimantan, Indonesia. 2020. Available online: https://dinkes.kaltengprov.go.id (accessed on 30 December 2020).
  45. North Kalimantan Province Public Health Office. Health Profil of North Kalimantan Province 2020. The Provincial Health Office of North Kalimantan, Indonesia. 2020. Available online: https://dinkes.kaltaraprov.go.id (accessed on 30 December 2020).
  46. The Provincial Health Office of West Kalimantan, Indonesia. Health Profil of West Kalimantan Province 2021. 2021. Available online: https://dinkes.kalbarprov.go.id (accessed on 10 August 2021).
  47. The Provincial Health Office of East Kalimantan, Indonesia. Health Profil of East Kalimantan Province 2021. 2021. Available online: https://dinkes.kaltimprov.go.id (accessed on 10 August 2021).
  48. South Kalimantan Province Public Health Office. Health Profil of South Kalimantan Province 2021. The Provincial Health Office of South Kalimantan, Indonesia. 2021. Available online: https://dinkes.kalselprov.go.id (accessed on 10 August 2021).
  49. Central Kalimantan Province Public Health Office. Health Profil of Central Kalimantan Province 2021. The Provincial Health Office of Central Kalimantan, Indonesia. 2021. Available online: https://dinkes.kaltengprov.go.id (accessed on 10 August 2021).
  50. North Kalimantan Province Public Health Office. Health Profil of North Kalimantan Province 2021. The Provincial Health Office of North Kalimantan, Indonesia. 2021. Available online: https://dinkes.kaltaraprov.go.id (accessed on 10 August 2021).
Figure 1. Improved GTWR Model Flowchart.
Symmetry 14 00742 g001
Figure 2. Spatial Distribution Mapping of x 1 x 4 . (a) Map of the number of confirmed positive COVID-19 cases 2020–2021; (b) map of the number of doctors 2020–2021; (c) map of the number of TB cases 2020–2021; (d) map of the percentage of elderly population in 2020–2021.
Symmetry 14 00742 g002aSymmetry 14 00742 g002b
Figure 3. Spatial Distribution Mapping of x 5 x 8 . (a) Map of population density in 2020–2021; (b) map of Gross Regional Domestic Product (GRDP) 2020–2021; (c) map of the number of hospitals in 2020–2021; (d) map of the number of public health centers in 2020–2021.
Symmetry 14 00742 g003aSymmetry 14 00742 g003b
Figure 4. Boxplot of temporal variability for each year.
Symmetry 14 00742 g004
Figure 5. Significance of variables at 5% significance level.
Symmetry 14 00742 g005
Table 1. Description of Resesarch Variables and Data Sources.
VariableSymbolVariable DescriptionObservation Data SourceUnitScale
ResponseyCumulative positive cases of COVID-19Official websites
www.covid19.kaltimprov.go.id
www.corona.kalselprov.go.id
www.corona.kalteng.go.id
www.coronainfo.kaltaraprov.go.id
www.corona.kalbarprov.go.id (accessed on 10 August 2021) [10,11,12,13,14]
People56 regions/cities in the island of Kalimantan
Predictorx1Number of doctorsStatistics Indonesia of East Kalimantan Province, North Kalimantan Province, South Kalimantan Province, Central Kalimantan Province, West Kalimantan Province, 2020–2021 [31,32,33,34,35,36,37,38,39,40]People56 regions/cities in the island of Kalimantan
x2Number of TB casesPublic Health Office of East Kalimantan Province, North Kalimantan Province, South Kalimantan Province, Central Kalimantan Province, West Kalimantan Province, 2020–2021 [41,42,43,44,45,46,47,48,49,50]Cases56 regions/cities in the island of Kalimantan
x3Percentage of elderly populationStatistics Indonesia of East Kalimantan Province, North Kalimantan Province, South Kalimantan Province, Central Kalimantan Province, West Kalimantan Province, 2020–2021 [31,32,33,34,35,36,37,38,39,40]Percentage56 regions/cities in the island of Kalimantan
x4Population densityStatistics Indonesia of East Kalimantan Province, North Kalimantan Province, South Kalimantan Province, Central Kalimantan Province, West Kalimantan Province, 2020–2021 [31,32,33,34,35,36,37,38,39,40]People/Km256 regions/cities in the island of Kalimantan
x5Gross Regional Domestic Product at Market PriceStatistics Indonesia of East Kalimantan Province, North Kalimantan Province, South Kalimantan Province, Central Kalimantan Province, West Kalimantan Province, 2020–2021 [31,32,33,34,35,36,37,38,39,40]Billion Rupiah56 regions/cities in the island of Kalimantan
x6Number of hospitalsPublic Health Office of East Kalimantan Province, North Kalimantan Province, South Kalimantan Province, Central Kalimantan Province, West Kalimantan Province, 2020–2021 [41,42,43,44,45,46,47,48,49,50]Units56 regions/cities in the island of Kalimantan
x7Number of villages/ kelurahan with public health centersPublic Health Office of East Kalimantan Province, North Kalimantan Province, South Kalimantan Province, Central Kalimantan Province, West Kalimantan Province, 2020–2021 [41,42,43,44,45,46,47,48,49,50]Units56 regions/cities in the island of Kalimantan
x8Percentage of poor populationStatistics Indonesia of East Kalimantan Province, North Kalimantan Province, South Kalimantan Province, Central Kalimantan Province, West Kalimantan Province, 2020–2021 [31,32,33,34,35,36,37,38,39,40]%56 regions/cities in the island of Kalimantan
Table 2. Summary of Variable Statistics.
Descriptive StatisticsConfirmed Positive Cases of COVID-19Number of Doctors (x1)Number of TB Cases (x2)Percentage of Elderly Population (x3)Population Density (x4)GRDP (x5)Number of Hospitals (x6)Number of Public Health Centers (x7)Percentage of Poor Population (x8)
Minimum1551121 17631 52
Maximum33,9968212708598792126,1602021212
Range33,9818162697588791124,3971920710
Sum332,48912,08449,283114945,0541,818,6233823861675
Median11837335563185122205
Mean2969108440 10 40216,2383346
SE.Mean4641239 11332122040
Variance24,119,00516,810166,245118 1,969,598504,525,5211116095
Std.dev491113040811140322,4623402
Table 3. Correlation of independent variables to the number of positive COVID-19 cases.
VariableCorrelationp-Value
x 1 0.6840.000 *
x 2 0.2550.006 *
x 3 0.0480.612
x 4 0.2320.013 *
x 5 0.6280.000 *
x 6 0.5010.000 *
x 7 0.3530.000 *
x 8 −0.1440.129
Note: (*) = significant at 5% significance level.
Table 4. Multicollinearity Test.
Predictor VariableVIF
x 1 2.521
x 2 2.481
x 3 1.294
x 5 1.455
x 6 3.557
Table 5. Spatial variability test value.
Breusch–Paganp-Value
0.90079 4.642 × 10 7
Table 6. Summary of the estimated values of the GTWR model parameters.
Parameter EstimatorMinimum Q 1   Median Q 3   Maximum
β ^ 0 −1612.200−886.460−282.050−64.5371206.736
β ^ 1 −3.750−0.6090.0335.81523.556
β ^ 2 −4.870−0.634−0.1970.5602.702
β ^ 3 −20.633−4.8095.69629.529110.782
β ^ 5 0.0300.0330.0860.1700.210
β ^ 6 −308.440170.570220.270849.9601024.984
Table 7. Comparison of models in terms of the number of positive COVID-19 cases.
CriteriaOLSGTWR
R20.61340.95713
Adjusted R20.59520.92855
AIC2128.2291900.76
RMSE3039.911302.99
Table 8. Values of simultaneous hypotheses testing of the model’s goodness of fit.
F-StatisticsF Tablep-ValueKeputusan Uji
14.4401.5370.000Tolak Ho
Table 9. The test statistical value of partial hypothesis testing of the GTWR model parameters.
LocationYearParameterEstimator ValueStandard ErrorT-Valuep-Value
Samarinda2020 β 0 −206.539421.063−0.4910.625
β 1 −0.8984.825−0.1860.853
β 2 0.2480.8590.2890.773
β 3 −2.80221.995−0.1270.899
β 5 0.0340.0113.0160.003 *
β 6 264.725129.7802.0400.044 *
2021 β 0 −515.123422.710−1.2190.226
β 1 12.7002.2005.7730.000 *
β 2 1.1941.1091.0760.284
β 3 4.73424.2350.1950.845
β 5 0.1490.01113.8380.000 *
β 6 432.961142.8563.0310.003 *
Kapuas Hulu 2020 β 0 −405.751388.938−1.0430.299
β 1 −0.0963.698−0.0260.979
β 2 −0.1490.770−0.1940.846
β 3 19.50820.9660.9300.354
β 5 0.0400.0104.0880.000 *
β 6 188.398111.8591.6840.095
2021 β 0 −1382.853400.964−3.4490.001 *
β 1 5.6762.2902.4780.015 *
β 2 −4.1560.738−5.6310.000 *
β 3 74.87222.7603.2900.001 *
β 5 0.1850.01017.6610.000 *
β 6 903.160117.2187.7050.000 *
Note: (*) Significant at the 5% significance level.
Publisher’s Note: MDPI stays neutral with regard to jurisdictional claims in published maps and institutional affiliations.

