Abstract
Sediment abrasion may cause the removal of material and efficiency loss to hydraulic machinery (hydro-turbine, pump, etc.), which may worsen the internal flow and endanger the safe operation of the machines. As abrasion is caused by the impact of sediment on the solid surface, the movement of particles determines the wear intensity. To understand the wear mechanism of hydraulic machinery, the motion characteristics of the asymmetric solid–liquid two-phase flow in a sediment-laden flow around NACA0012 cascades were studied. The laser particle imaging velocimetry (PIV) method was used to measure the flow of quartz particles with median diameters d50 of 82.7 μm, 65.9 μm, and 31.8 μm near the wall of cascades at an impact angle of 10° in a Venturi circuit. The flow characteristics and velocity slip between solid and liquid phases, as well as the effects of particle size and the Reynolds number on velocity slip, were analyzed. The results showed that: (1) the flow is asymmetrically distributed in front of the cascade’s leading edge at a 10° impact angle, and there is strong velocity slip between solid and liquid phases; (2) under the influence of particle inertia, the velocity of the solid phase is higher than that of the liquid phase in the deceleration stage, while the velocity of the solid phase is lower than that of liquid phase in the acceleration stage; (3) in the process of approaching the leading edge, the velocity difference between the solid and liquid phase increases by about 10% and the angle difference increases by about 8.8°.
1. Introduction
Sediment abrasion may cause component damage and efficiency loss to hydraulic machinery (hydro-turbines [1,2,3], pumps [4], etc.). It changes the profile of the flow passage, which will worsen the internal flow pattern and endanger the safe operation of the machines. Brekke [3] divided the wear of the guide vane into turbulence erosion, secondary flow erosion, leakage erosion, and erosion due to acceleration according to the flow characteristics. To reduce the loss caused by wear to hydropower plants and pump stations, many scholars have studied wear mechanisms [5,6] and wear-protection technology for hydraulic machinery. Aponte [7] and Jing [8], respectively, adopted the design-optimization method to reduce the damage of sediment to the flow component of a hydro-turbine and pump from the aspect of hydraulic design.
For a high-head Francis turbine, guide vanes (GVs) are components suffering serious abrasion. Yu [9] investigated the abrasion of the Francis turbine in nine hydropower stations and found that the GV of the high-head turbine would suffer serious wear even under the condition of a low sediment concentration. In the past 20 years, the wear mechanism of turbine guide vanes has been widely studied. Brekke [10] divided the wear of guide vanes into turbulence erosion, secondary flow erosion, leakage erosion, and erosion due to acceleration according to the flow characteristics. Thapa [11] believed that cross-flow comes into being as erosion increases the clearance gap between guide vanes and facing plates, which may have an adverse impact on the velocity profile at the runner inlet. Chitrakar [12] believes that there is a simultaneous effect between secondary flow and sediment erosion in a Francis turbine, and the unsteady secondary flow accelerates the erosion.
Sediment abrasion is defined as a phenomenon wherein the metal material surface is damaged by the impact of sediment-laden water, so there is no doubt that the characteristics of water and sand movement have a decisive influence on the abrasion. Previous studies have shown that the particle characteristics, such as particle size, bulk density, and particle shape, have a significant impact on the wear results [13,14,15,16,17]. To quantitatively predict the wear degree of a hydraulic turbine and pump, numerical simulation combined with a physical test has become a common research method. Based on the wear mathematical model established by the test, CFD calculation, such as solving the combined solid–liquid turbulence equation (K-ε-AP model) or directly tracking the movement of solid-phase particles by the Euler–Lagrange method, can predict the location and amount of abrasion [18,19,20,21,22,23,24,25]. However, due to the limitation of the test’s accuracy or the numerical simulation model, the results obtained by these methods have some deviation from the actual motion of the solid phase.
Therefore, to reveal the process of sediment abrasion, it is necessary to accurately determine the motion characteristics of the solid phase. Many researchers have studied the motion characteristics of the solid phase in the process of abrasion by experimental methods: Liu [26] tracked the motion of ds = 6.0 mm solid particles in a centrifugal pump by adopting a high-speed photography technique and found that larger particles impact blades on the leading edge region at a high impact angle of 60°~90°, while smaller particles impact blades on the middle part and trailing edge region at a low impact angle of 20°~50°. Yang [27] researched the crystallization phenomenon of a liquid–solid two-phase flow in a centrifugal pump using the Particle Image Velocimetry (PIV) method, revealing the process of crystallization in the pump and finding out that the crystal nuclei move towards the pressure side of the blade. Su [28] established a new theoretical model considering the dual role of microparticles, namely, the viscous effect of silt-sized particles (particle size < 50 μm) and the inertial effect of sand-sized particles (particle size > 50 μm) in synergistic cavitation–particle erosion.
With the progress of testing technology, an innovative method of simultaneous solid–liquid two-phase PIV measurements has been used to study sediment movement and water–sediment interaction. Cando studied the solid–liquid two-phase flow over a step with the simultaneous PIV method [29], and Kazunori [30] studied the interaction between particles and turbulence with synchronous measurement of the solid–liquid flow. However, compared with numerical simulation, there are still few experimental studies on simultaneous two-phase flow.
To determine the asymmetric characteristics of sediment-laden flow in hydraulic machinery, the solid–liquid two-phase flow in a cascade was measured by the simultaneous PIV method, and the velocity slip between the two phases and the key influencing factors were analyzed.
2. Methodology
2.1. Hydraulic Circuit
The simultaneous PIV measurement of a sediment-laden two-phase flow was carried out in the Venturi circulation system, as shown in Figure 1. The test section was a rectangle with a size of 200 mm × 30 mm, and the diameter of the circulation pipeline was DN250. To obtain stable flow conditions, the test section was connected to a contraction section with a contraction ratio of 6.53 upstream and a diffusion section with a diffusion angle of 3.3° downstream.
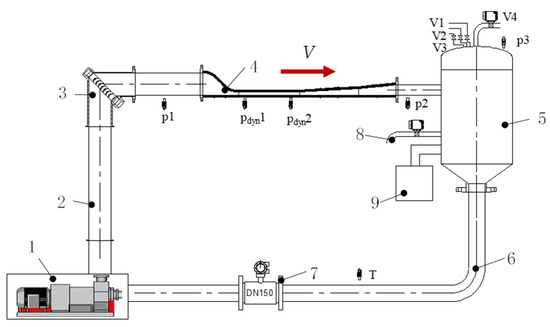
Figure 1.
The Venturi test circuit. (1) 110 kW pump, (2) DN250 pipeline, (3) bend with guide vanes, (4) Venturi test Section, (5) tank, (6) DN150 pipeline, (7) electromagnetic flowmeter, (8) pipe for sediment sampling, and (9) cooling system.
2.2. Parameters of the Cascade Flow Passage
The test cascade contained 5 NACA0012 foils. The nominal chord of the foils was 100 mm, but 3.2 mm of the chord at the trailing edge was cut off to ensure machining strength. Thus, the actual chord C of the airfoil was 96.8 mm. The pitch of the cascade was 40 mm, and the ratio of pitch to chord was 0.4 times. To form stable asymmetric flow conditions, the flow impact angle of the cascade was designed to be 10°. The flow passage of the NACA0012 cascade is shown in Figure 2.
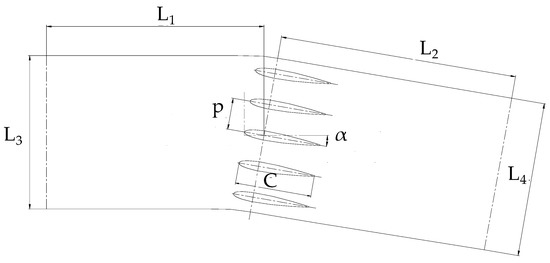
Figure 2.
Profile of NACA0012 cascade.
The cascade and the test section were made of transparent plexiglass material so that high-quality laser illumination and image acquisition could be obtained during PIV tests. The distances L1 and L2 between the inlet and outlet of the test section and the rotating center of the middle foil (25 mm from the leading edge point) were 575 mm and 700 mm, respectively, which were 5.75 times and 7.0 times the chord of the foil. The test section profile was optimized by the CFD method, and the inlet and outlet widths L3 and L4 were determined to be 195.8 mm and 198.7 mm, respectively. Table 1 shows the geometric parameters of cascades.

Table 1.
Geometric parameter of NACA0012 cascade.
2.3. The Sediment
Artificial quartz with a density of 2.19 g/cm3 was selected as the sediment for the test. Three sediment samples with different particle sizes were obtained after screening with 140 mesh, 200 mesh, and 300 mesh screens, which were named 200 mesh(+), 300 mesh(+), and 300 mesh(−), respectively. The particle size and morphology of the sand were analyzed using the dynamic particle size and shape analyzer (QICPIC/R06-MIXCEL). The respective median particle sizes d50 (diameter of a circle of equal projection area, EQPC) of the sediment samples were determined to be 82.7 μm, 65.9 μm, and 31.8 μm.
2.4. Test Method
The PIV test was carried out by using the two-phase simultaneous imaging technique to accurately obtain the simultaneous solid–liquid two-phase velocity fields. In the experiment, quartz is used as the solid-phase tracer particle and Rhodamine B as the liquid-phase tracer particle. Two high-speed cameras are used to take photos of the solid- and liquid-phase particles simultaneously. The particle size of Rhodamine B is about 10~15 μm. It can follow the water flow very well and emit orange light with a wavelength of 550 nm under the irradiation of a 532 nm Nd:YAG laser. A 540 nm cut-off filter and a (532 ± 10) nm band-pass filter are installed in front of the lenses of the two cameras to separate solid and liquid tracer particles, as shown in Figure 3a. When the laser with the wavelength of 532 nm illuminates the flow field, the green light reflected by quartz can only be received by the solid-phase camera through the band-pass filter, and the orange light emitted by fluorescent particles can only be received by the liquid-phase camera through the cut-off filter. With this method, the particle images of solid–liquid two phases can be separated in the imaging stage. After the particle images are obtained, the images of fluorescent and quartz particles are processed by Davis8 PIV algorithm to obtain the velocity fields of liquid phase and solid phase.

Figure 3.
Method of simultaneous two-phase PIV test around cascade. (a) Setup of illumination and image acquisition system; (b) photo of cascade illuminated by laser.
The particle image is acquired in double-frame and double-pulse mode, with a sampling frequency of 100 Hz and a sampling time of 1.0 s at every test point. To ensure the correlation between double images, the particle displacement between 2 frames is limited at about 5 pixels. After the image acquisition is completed, the multi-pass iterative cross-correlation algorithm is used to calculate the flow velocity around the foils, and the size of the query domain is set as 16 pixels × 16 pixels. After 100 instantaneous velocity fields at each test point are calculated, the average velocity distribution within 1.0 s is obtained. Figure 3b shows a photo of the cascade during the PIV test.
2.5. Test Condition
To avoid cavitation, the PIV test was carried out under the pressure of 180 kPa. The Reynolds number of incoming flow is defined with the average velocity u at the inlet of the test section and the chord length C of the airfoil as Formula (1). Tests were carried out under the conditions of Re = 5.0 × 10⁴, 1.0 × 10⁵, 3.0 × 10⁵, and 6.0 × 10⁵.
3. Results
3.1. Verification of Test Results
To verify the accuracy of PIV test results, the steady flow around the cascade is simulated by adopting the SST K-ω turbulence model [31]. The fluid is water at 20 °C, and the Reynolds number condition is consistent with the PIV test. The cascade flow passage of the numerical simulation is the same as that of the PIV test, with an inlet flow rate of 1.0 m/s and outlet pressure of 180 kPa. After the numerical simulation calculation converges, the consistency of the test results and numerical simulation results is verified by the following steps:
- (1)
- The velocity distribution around the cascade is analyzed on the middle symmetry plane (the same plane as PIV test) of the computational domain, and the consistency of the CFD flow field with the solid and liquid flow field measured by the PIV test is compared.
- (2)
- The leading edge point of the cascade at 0° impact angle is selected as the origin to establish the coordinate system. Twenty-one points are taken along the y direction of a single flow passage at x = −50 mm upstream of the middle foil’s leading edge point, and the y range is −15 mm to 15 mm. The average velocity of these points, vave, is calculated. The average velocity deviation of solid and liquid phases is compared between CFD results and PIV measurements.
The relative values of the solid and liquid phase flow rates are defined as follows:
where |vs|1 and |vf|1 are the relative velocities of the solid phase and liquid phase, respectively; vs. is solid-phase velocity; vf is liquid-phase velocity; and vave is the average velocity of the incoming flow.
Figure 4 shows the velocity distribution around the foil, taking Re = 1.0 × 10⁵ as an example. It can be seen from the figure that the velocity field calculated by CFD is consistent with the velocity field flow pattern measured by PIV. The flow pattern around the cascade is relatively stable; the solid–liquid phase flows downstream along the foil surface with no flow separation at the tail of the foil. Unstable flow patterns such as vortex or secondary flow do not occur.

Figure 4.
Comparison of velocity field (Re = 1.0 × 10⁵). (a) Liquid phase of PIV test; (b) solid phase of PIV test; (c) CFD result.
Table 2 shows the comparison of the average flow velocity at different Reynolds numbers. It can be seen from the table that the average flow velocity of the three tests is consistent with the CFD results at the same Reynolds number, and the maximum deviation between the two results is 3.72%. Therefore, it can be concluded that the PIV test results are valid.

Table 2.
Comparison of average velocity (x = −50 mm).
3.2. Key Flow Zones
The leading edge of the guide vane is the key abrasion zones in the Francis turbine, so this paper focuses on the two-phase flow in the flow domain near the leading edge. As shown in Figure 5, the coordinate system is also established, with the cascade leading edge points as the origin. Taking x = −0.8 mm as the cut-off point, the flow near the foil is divided into the upstream zone and near-wall zone; corresponding interval ranges are as follows: the upstream zone is in the range of (−8.0 mm, −0.8 mm) and the near-wall zone is in the range of (−0.8 mm, 0.8 mm).
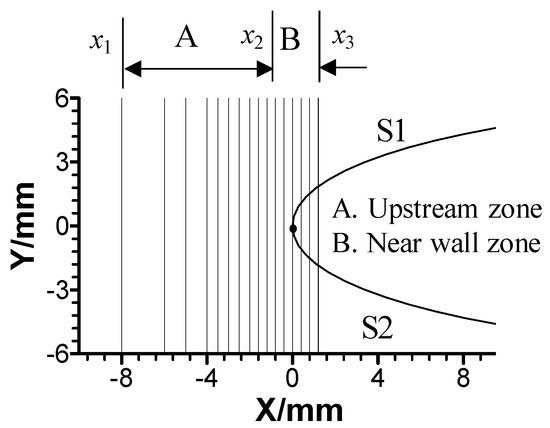
Figure 5.
Flow zones near the leading edge of NACA0012 foil.
3.3. Flow in the Upstream Zone
In the upstream zone, the distribution curves of the solid–liquid velocity along the Y-axis are made at x of −10 mm, −8 mm, −5 mm, −3.2 mm, −1.6 mm, and 0.8 mm. Figure 6 shows the curves of 200 mesh(+) sediment under the Reynolds numbers of 8.0 × 10⁵ and 5.0 × 10⁴. The curves of different X coordinates in the figure are distinguished by the curve’s color. The velocity curves of the solid phase and liquid phase are represented by a marked solid line and dashed line, and marked by s and f, respectively. It can be seen from the figure that:
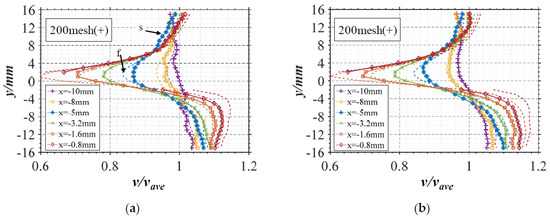
Figure 6.
Velocity distribution in upstream zone (quartz 200 mesh+). (a) Re = 5.0 × 10⁴; (b) Re = 8.0 × 10⁵.
- (1)
- The velocity shrinks from both sides to the middle along the Y-axis, and the curve of velocity amplitude shows a concave shape. The velocity amplitude changes sharply in the middle (y = 0), but slows down at the two endpoints (y = ±15 mm).
- (2)
- The relative velocity in the main flow area is about 0.96 to 1.02 on the +Y side and about 1.04 to 1.16 on the −Y side. The velocity distribution near S1 and S2 surfaces is asymmetric, which is due to the asymmetric impact of the incoming flow on the foil at an impact angle of 10°.
- (3)
- At the same point, the velocity curves between solid and liquid phases do not coincide, indicating that there is a deviation between the velocities of solid and liquid phases.
3.4. Flow in the Near-Wall Zone
In the near-wall zone, the distribution curves of the solid–liquid velocity along the Y-axis are made at x points of −0.8 mm, −0.4 mm, 0 mm, 0.4 mm, and 0.8 mm. Figure 7 shows the curves of 200 mesh(+) sediment under the Reynolds numbers of 8.0 × 10⁵ and 5.0 × 10⁴. The definition of the curve in the figure is the same as Section 3.3. It can be seen from the figure that:
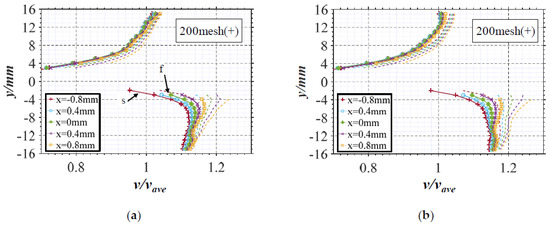
Figure 7.
Velocity distribution in the near-wall zone (quartz 200 mesh+). (a) Re = 5.0 × 10⁴; (b) Re = 8.0 × 10⁵.
- (1)
- On the S1 side of the foil (y > 0), the velocity of the solid phase obviously deviates from that of the liquid phase at the position of y = 15 mm, with a relative velocity difference of 0.05. The relative velocity of the solid phase is about 1.0, which shrinks along the −Y direction to the foil surface. All velocity curves are relatively concentrated at the position of y = 3 mm, with a relative velocity of about 0.7 to 0.8.
- (2)
- On the S2 side of the foil (y < 0), the relative velocity of the solid phase is about 1.0 at the position of y = −15 mm, which shrinks along the −Y direction to the foil surface. All velocity curves are relatively concentrated at the position of y = −3 mm, with a relative velocity of about 0.98 to 1.08.
4. Analysis and Discussion
4.1. Velocity Deviation between Solid and Liquid Phases
It can be seen from the velocity distribution curve that there is a velocity deviation between the solid and liquid phases near the wall of the cascade. The relative velocity deviation and flow angle deviation are defined as:
where θs and θf are the flow angle of the solid phase and liquid phase, respectively, which defines the +X direction as 0°.
Figure 8 shows the velocity deviation and angle deviation distribution curves of 200 mesh(+) quartz under the condition of Reynolds number Re = 8.0 × 10⁵. Some characteristics of the velocity deviation between the two phases can be seen from the figure.
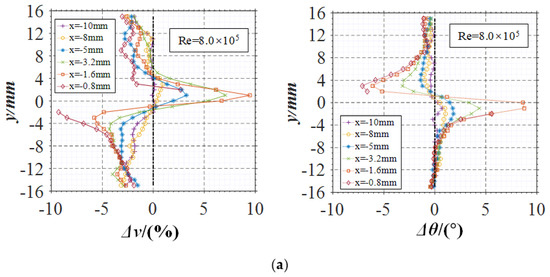
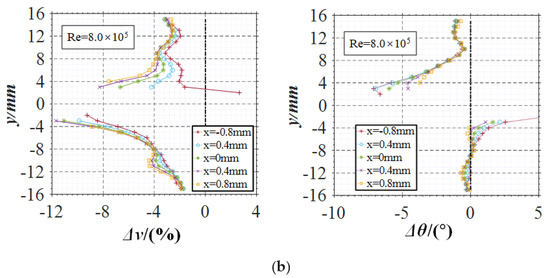
Figure 8.
Velocity deviation and angle deviation between solid and liquid phases (quartz 200 mesh+). (a) Upstream zone; (b) near-wall zone.
4.1.1. Upstream Zone
The asymmetry of the flow can be seen from the velocity deviation curve of the upstream zone in Figure 8a. The velocity deviation between the solid and liquid phases is as follows:
- (1)
- Points with the maximum velocity deviation and angle deviation exist on both S1 and S2 sides, respectively, and the deviation value increases as it approaches the leading edge point. The asymmetry of the deviation is obvious; that is, the position of the maximum velocity deviation is in the range of y = 2.0 mm to 4.0 mm on the S1 side, while in the range of y = −2.0 mm to −8.0 mm on the S2 side.
- (2)
- The maximum velocity deviation on the S1 side is about 10%, and the angle deviation is negative, indicating that the solid velocity decreases more slowly than the liquid velocity in the process of deceleration approaching the leading edge point, and the velocity direction is toward the foil surface.
- (3)
- The maximum velocity deviation on the S2 side is about −8.0%, and the angle deviation is also negative. According to the velocity distribution curve, velocity in this region increases along the +X direction; that is, the velocity of the solid phase increases slower than that of the liquid phase, but the velocity direction is also toward the foil surface.
By comparison, it can be concluded that the solid phase responds to the flow condition changes less timely than the liquid phase, resulting in the velocity direction being more inclined to the foil surface. Therefore, the impact angle of the solid phase is larger than that of the liquid phase in the process of approaching the wall surface.
4.1.2. Near-Wall Zone
The asymmetry of the flow can be seen from the velocity deviation curve of the near-wall zone in Figure 8b. The velocity deviation between the solid and liquid phases is as follows:
- (1)
- The velocity deviation is less than 0 in the near-wall zone, indicating that the velocity of the solid phase is less than that of the liquid phase. At the position of y = ±15 mm, the velocity deviation of different curves is very close. When it is close to the S1 wall (y = 3 mm), the deviation on different curves decreases to about −8.0% along the +X direction. When it is close to the S2 wall (y = −3 mm), the maximum relative velocity difference reaches about −12%.
- (2)
- The angle deviation in this zone is less than 0, indicating that the velocity angle of the solid phase is more inclined to the cascade. At the position near the S1 wall (y = 3 mm), the angle deviation increases along the +X direction, and its absolute value decreases. On the contrary, at the position near the S2 wall (y = −3 mm), the angle deviation is positive and decreases along the +X direction. Under asymmetry conditions, the maximum angle deviation on the S1 side is about −7°, while that on the S2 side is about 8.0°.
4.2. Effect of Sediment Characteristics on Velocity Slip
Velocity slip is defined as the velocity deviation between the solid and liquid phases. The inertia of particles strongly correlated with particle size has a great influence on the velocity slip. Figure 9 shows the variation in the maximum velocity deviation and angle deviation of the three quartz samples with distance from the leading edge under the Reynolds number Re = 8.0 × 10⁵. In the figure, abscissa d represents the distance from the wall, and the curve colors represent sediment types. The solid line indicates that the position is above surface S1, while the dotted line indicates that the position is below surface S2.
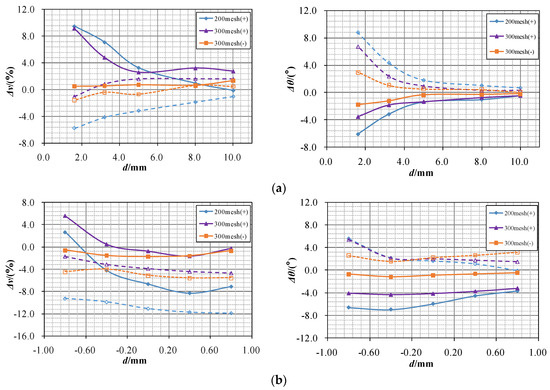
Figure 9.
Effect of sediment characteristics on velocity slip (Re = 8.0 × 10⁵). (a) Upstream zone; (b) near-wall zone.
4.2.1. Upstream Zone
Figure 9a shows the velocity deviation curves of different types of sediment, which are between 1.6 mm and 10 mm away from the leading edge point. The influence of particle characteristics on velocity slip is as follows:
- (1)
- The deviation decreases from 200 mesh(+) to 300 mesh(–) except for two points of 200 mesh(+) quartz. The velocity deviation of sand sample 300 mesh(–) on both sides of S1 and S2 is very close to 0, indicating that the sediment with a small particle size has a small velocity slip.
- (2)
- The maximum velocity deviations of 200 mesh(+), 300 mesh(+), and 300 mesh(–) particles are 9.47%, 9.14%, and 2.0%, and the maximum angle deviations are 8.77°, 6.74°, and 3.0°, respectively. Therefore, under the same Reynolds number condition, the velocity and angle deviation decrease with the decrease in sediment particle size. Sediment particles with small particle sizes have a better flow-following ability.
4.2.2. Near-Wall Zone
Figure 9b shows the velocity deviation curves of different types of sediment in the near-wall zone (y = ±3 mm). Due to the deceleration process in the upstream zone, sediments have different velocity decline values due to the influence of particle size. Therefore, the velocity deviation of three types of quartz particles are very different:
- (1)
- The velocity deviation of sediment 200 mesh(+) and 300 mesh(+) decreases obviously with the increase in distance d, while that of finest sediment 300 mesh(-) remains at a relatively low level. The absolute value of angle deviation also increases with the particle size. It can be determined from the figure that the deviation in large sediment is higher.
- (2)
- The maximum velocity deviation of 200 mesh(+), 300 mesh(+), and 300 mesh(–) of quartz sand is −11.88%, −4.73%, and −5.58%, and the maximum angle deviation is −3.72°, −3.21°, and −0.49°, respectively. The data show that velocity slip increases with the particle inertia. This result verifies the influence of particle size on wear as follows. When tracking the particle size trajectory in the runner or impeller [26,32,33], it is found that the particle trajectory deviates from that of the fluid particle, and compared with the small-sized particles, the large particles usually contact the blade pressure surface at a further distance from the inlet edge.
4.3. Effect of the Reynolds Number on Velocity Slip
Comparing the effect of the Reynolds number on the velocity slip between solid and liquid phases, Figure 10 shows the variation in the maximum velocity deviation and maximum angle deviation of quartz 200 mesh(+) under different Reynolds number conditions. In the figure, the curve colors represent sediment types. The solid line indicates that the position is above surface S1, while the dotted line indicates that the position is below surface S2.
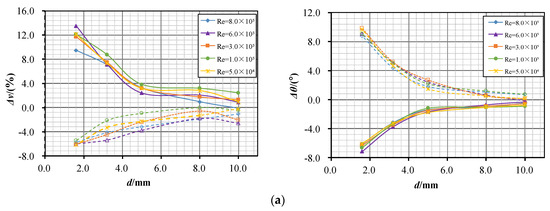
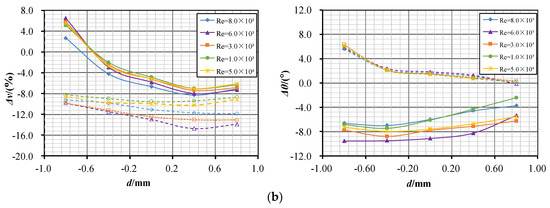
Figure 10.
Effect of Re on velocity slip. (a) Upstream zone; (b) near-wall zone.
4.3.1. Upstream Zone
Figure 10a shows the variation curve of the maximum velocity deviation with a distance ranging from 1.6 mm to 10 mm. As can be seen from the figure:
- (1)
- The deviation in the velocity and angle increases significantly with the decrease in the distance. When the distance d decreases from 10 mm to 1.6 mm, the maximum velocity deviation increases from 2% to about 12%, and the maximum angle deviation increases from 0.8° to about 9.6°.
- (2)
- Under the five Reynolds number conditions, the curves of velocity deviation and angle deviation have basically the same trend with respect to distance; the velocity deviation value varies within the range of 2.0% to 4.0%, and the angle variation is about 2.5°.
4.3.2. Near-Wall Zone
Figure 10b shows the variation curve of the maximum velocity deviation with the x position ranging from −0.8 mm to 0.8 mm. As can be seen from the figure:
- (1)
- The velocity deviation on the upper side of S1 decreases from positive to negative from 6.4% to about −7.2% along the +X direction, while that on the lower side of S2 decreases from −9.0% to about −12.0% along the +X direction. Considering that this process is a process of increasing velocity, it can be determined that the velocity growth rate of the solid phase is not as fast as that of the liquid phase.
- (2)
- From the angle deviation point of view, the angle deviation on the S1 side decreases from 6.0° to about 0°, while that on the S2 side increases from −8.0° to about −5.0°. The absolute value of the angle deviation decreases with the velocity.
- (3)
- Under different Reynolds number conditions, all velocity deviation curves on the S1 side are very close, and the variation is about 2.0%, while those on the S2 side are slightly different, and the variation is about 5.0%.
5. Conclusions
In this paper, the motion characteristics of an asymmetric solid–liquid two-phase flow in a sediment-laden flow around NACA0012 cascades are studied, and the effects of the Reynolds number and particle size on velocity slip are analyzed. With the test and analysis above, we can come to the following conclusions:
- (1)
- Before contact with the cascade, the sediment particles undergo a velocity change process of deceleration before acceleration. In this process, velocity slip occurs between the solid and liquid phases. In the deceleration stage, the solid velocity is greater than the liquid velocity, and vice versa in the acceleration stage. In the process of approaching the leading edge point, the velocity deviation increases by about 10%, and the angle deviation increases by about 8.8°.
- (2)
- The particle characteristics have a great influence on the velocity slip between solid and liquid phases. Under the same Reynolds number condition, the particles with high inertia have a large velocity deviation. Under the condition of a Reynolds number of 8.0 × 10⁵, according to the order of particle sizes from large to small, the velocity deviation of quartz in the deceleration stage is 9.47%, 9.14%, and 2.5%, respectively, and that in the acceleration stage is −11.88%, −4.73%, and −5.58%, respectively.
- (3)
- The Reynolds number also has an important influence on the velocity slip between the two phases. Under the conditions of Re = 5.0 × 10⁴ to 8.0 × 10⁵, the velocity deviation caused by the change in Reynolds number is about 5.0%.
Author Contributions
Conceptualization, L.Z. and L.L.; methodology, L.Z. and H.Z.; writing—original draft preparation, L.Z.; writing—review and editing, Y.C. and H.Z.; supervision, L.L.; project administration, X.M. All authors have read and agreed to the published version of the manuscript.
Funding
This work was supported by the Major National Scientific Instrument and Equipment Development Project (Project No. 2011YQ07004901) and the IWHR Research & Development Support Program (HM0163A012018).
Institutional Review Board Statement
Not applicable.
Informed Consent Statement
Not applicable.
Data Availability Statement
Not applicable.
Conflicts of Interest
The authors declare no conflict of interest.
References
- Cruzatty, C.; Jimenez, D.; Valencia, E.; Zambrano, I.; Mora, C.; Luo, X.W. A case study: Sediment erosion in francis turbines operated at the san francisco hydropower plant in Ecuador. Energies 2021, 15, 8. [Google Scholar] [CrossRef]
- Sharma, S.; Gandhi, B.K.; Pandey, L. Measurement and analysis of sediment erosion of a high head francis turbine: A field study of bhilangana-iii hydropower plant, India. Eng. Fail. Anal. 2021, 122, 105249. [Google Scholar] [CrossRef]
- Gautam, S.; Acharya, N.; Lama, R.; Chitrakar, S.; Neopane, H.P.; Zhu, B.S.; Dahlhaug, O.G. Numerical and experimental investigation of erosive wear in Francis runner blade optimized for sediment laden hydropower projects in Nepal. Sustain. Energy Technol. Assess. 2022, 51, 101954. [Google Scholar] [CrossRef]
- Shen, Z.; Chu, W.; Li, X.; Dong, W. Sediment erosion in the impeller of a double-suction centrifugal pump—A case study of the Jingtai Yellow River Irrigation Project, China. Wear 2019, 422–423, 269–279. [Google Scholar] [CrossRef]
- Prashar, G.; Vasudev, H.; Thakur, L. Performance of different coating materials against slurry erosion failure in hydrodynamic turbines: A review. Eng. Fail. Anal. 2020, 115, 104622. [Google Scholar] [CrossRef]
- Chen, Y.; Li, R.N.; Han, W.; Guo, T.; Su, M.; Wei, S.Z. Sediment erosion characteristics and mechanism on guide vane end-clearance of hydro turbine. Appl. Sci. 2019, 9, 4137. [Google Scholar] [CrossRef] [Green Version]
- Aponte, R.D.; Teran, L.A.; Grande, J.F.; Coronado, J.J.; Ladino, J.A.; Larrahondo, F.J. Minimizing erosive wear through a CFD multi-objective optimization methodology for different operating points of a Francis turbine. Renew. Energy 2020, 145, 2217–2232. [Google Scholar] [CrossRef]
- Jing, D.; Qian, Z.D.; Thapa, B.S.; Thapa, B.; Guo, Z.W. Alternative design of double-suction centrifugal pump to reduce the effects of silt erosion. Energies 2019, 12, 158. [Google Scholar]
- Yu, J.C. Investigation on Wear Characteristics and anti-wear technology of Francis turbine distributor. In Proceedings of the 17th Symposium on China Hydropower Equipment; China Water&Power Press: Chun’an, China, 2009; pp. 328–336. (In Chinese). [Google Scholar]
- Brekke, H.; Wu, Y.L.; Cai, B.Y. Design of Hydraulic Machinery Working in Sand Laden Water. In Abrasive Erosion and Corrosion of Hydraulic Machinery; Imperial College Press: London, UK, 2003; pp. 176–177. [Google Scholar]
- Thapa, B.S.; Dahlhaug, O.G.; Thapa, B. Sediment erosion in hydro turbines and its effect on the flow around guide vanes of Francis turbine. Renew. Sustain. Energy Rev. 2015, 49, 1100–1113. [Google Scholar] [CrossRef]
- Chitrakar, S.; Neopane, H.P.; Dahlhaug, O.G. Study of the simultaneous effects of secondary flow and sediment erosion in Francis turbines. Renew. Energy 2016, 97, 881–891. [Google Scholar] [CrossRef]
- Roberts, J.; Jepsen, R.; Gotthard, D.; Lick, W. Effects of particle size and bulk density on erosion of quartz particles. J. Hydraul. Eng. 1998, 124, 1261–1267. [Google Scholar] [CrossRef]
- Wong, C.Y.; Solnardal, C.; Swallow, A.; Wu, J. Experimental and computational modelling of solid particle erosion in a pipe annular cavity. Wear 2013, 303, 109–129. [Google Scholar] [CrossRef]
- Thapa, B.; Brekke, H. Effect of sand particle size and surface curvature in erosion of hydraulic turbine. In Proceedings of the 22nd IAHR Symposium on Hydraulic Machinery and Systems, Stockholm, Sweden, 29 June–2 July 2004. [Google Scholar]
- Arabnejad, H.; Uddin, H.; Panda, K.; Talya, H.; Shirazi, S.A. Testing and modeling of particle size effect on erosion of steel and cobalt-based alloys. Powder Technol. 2021, 394, 1186–1194. [Google Scholar] [CrossRef]
- Tang, C.; Yang, Y.C.; Liu, P.Z.; Kim, Y.J. Prediction of abrasive and impact wear due to multi-shaped particles in a centrifugal pump via CFD-DEM coupling method. Energies 2021, 14, 2391. [Google Scholar] [CrossRef]
- Wu, W.Z.; Wu, Y.L.; Ren, J.; Tang, X.L. Numerical Simulation on Silt Abrasion in a Hydraulic Turbine Runner. J. Eng. Thermophys. 2000, 21, 709–712. [Google Scholar]
- Pang, J.; Zhang, H.; Yang, J.; Chen, Y.; Liu, X.B. Numerical and experimental study on sediment erosion of Francis turbine runner for hydropower stations. Chin. J. Hydrodyn. (Ser. A) 2020, 35, 436–443. (In Chinese) [Google Scholar]
- Gao, Z.X.; Zhou, X.J.; Zhang, S.X.; Lu, L. Numerical prediction on silt wearing of turbine runner by means of two-phase turbulent flow simulation. J. Hydraul. Eng. 2002, 33, 14–22. [Google Scholar]
- Peng, W.; Cao, X. Numerical simulation of solid particle erosion in pipe bends for liquid–solid flow. Powder Technol. 2016, 294, 266–279. [Google Scholar] [CrossRef]
- Peng, G.; Wang, Z.W.; Xiao, Y.X. Abrasion predictions for Francis turbines based on liquid–solid two-phase fluid simulations. Eng. Fail. Anal. 2013, 33, 327–335. [Google Scholar]
- Zhang, R.; Zhao, X.; Zhao, G.H.; Sheng, D.; Liu, H. Analysis of solid particle erosion in direct impact tests using the discrete element method. Powder Technol. 2021, 383, 256–269. [Google Scholar] [CrossRef]
- Gao, X.; Shi, W.; Shi, Y.; Chang, H.; Zhao, T. DEM-CFD simulation and experiments on the flow characteristics of particles in vortex pumps. Water 2020, 12, 2444. [Google Scholar] [CrossRef]
- Song, X.; Qi, D.; Xu, L.; Shen, Y.; Wang, W.; Wang, Z.W.; Liu, Y. Numerical Simulation Prediction of Erosion Characteristics in a Double-Suction Centrifugal Pump. Processes 2021, 9, 1483. [Google Scholar] [CrossRef]
- Liu, J.; Xu, H.Y.; Tang, S.; Lu, L. Experimental research on the movement rule of solid particles in centrifugal pump. J. Hydroelectr. Eng. 2008, 27, 168–172. (In Chinese) [Google Scholar]
- Dong, L.; Wang, Y.Y.; Wang, Y.Z. Research of liquid-solid two phase flow in centrifugal pump with crystallization phenomenon. Int. J. Fluid Mach. Syst. 2014, 7, 54–59. [Google Scholar]
- Su, K.P.; Wu, J.H.; Xia, D.K. Dual role of microparticles in synergistic cavitation–particle erosion: Modeling and experiments. Wear 2021, 470–471, 203633. [Google Scholar] [CrossRef]
- Cando, E.H.; Luo, X.W.; Hidalgo, V.H.; Zhu, L. Experimental study of liquid-solid two phase flow over a step using PIV. IOP Conf. Ser. Mater. Sci. Eng. 2016, 129, 012054. [Google Scholar] [CrossRef] [Green Version]
- Kazunori, N.; Iehisa, N. Particle–turbulence interaction and local particle concentration in sediment-laden open-channel flows. J. Hydro-Environ. Res. 2010, 3, 54–68. [Google Scholar]
- ANSYS Fluent. Fluent 18.1 User’s Guide; ANSYS Inc.: Canonsburg, PA, USA, 2017. [Google Scholar]
- Tang, X.L.; Tang, H.F.; Wu, Y.L. Simulating and erosion prediction of 3d two phases flow through a turbine runner. J. Eng. Thermophys. 2001, 22, 51–54. (In Chinese) [Google Scholar]
- Huang, X.; Yang, S.; Liu, Z.; Yang, W.; Li, Y. Numerical simulation of erosion prediction in centrifugal pump based on particle track model. Trans. Chin. Soc. Agric. Mach. 2016, 47, 35–41. (In Chinese) [Google Scholar]
Publisher’s Note: MDPI stays neutral with regard to jurisdictional claims in published maps and institutional affiliations. |
© 2022 by the authors. Licensee MDPI, Basel, Switzerland. This article is an open access article distributed under the terms and conditions of the Creative Commons Attribution (CC BY) license (https://creativecommons.org/licenses/by/4.0/).