Article

Bubbling, Bistable Limit Cycles and Quasi-Periodic Oscillations in Queues with Delayed Information

by
Juancho A. Collera
Department of Mathematics and Computer Science, University of the Philippines Baguio, Governor Pack Road, Baguio City 2600, Philippines
Symmetry 2022, 14(2), 376; https://doi.org/10.3390/sym14020376
Submission received: 8 January 2022 / Revised: 7 February 2022 / Accepted: 8 February 2022 / Published: 14 February 2022
(This article belongs to the Section Mathematics)

Abstract

:
We consider a model describing the length of two queues that incorporates customer choice behavior based on delayed queue length information. The symmetric case, where the values of the time-delay parameter in each queue are the same, was recently studied. It was shown that under some conditions, the stable equilibrium solution becomes unstable as the common time delay passes a threshold value. This one-time stability switch occurs only at a symmetry-breaking Hopf bifurcation where a family of stable asynchronous limit-cycle solutions arise. In this paper, we examine the non-symmetric case, wherein the values of the time-delay parameter in each queue are different. We show that, in contrast to the symmetric case, the non-symmetric case allows bubbling, multiple stability switches and coexistence of distinct families of stable limit cycles. An investigation of the dynamical behavior of the non-symmetric system in a neighborhood of a double-Hopf bifurcation using numerical continuation explains the occurrence of the bistable limit cycles. Quasi-periodic oscillations were also observed due to the presence of torus bifurcations near the double-Hopf bifurcation. These identifications of the underlying mechanisms that cause unwanted oscillations in the system give a better understanding of the effects of providing delayed information and consequently help in better management of queues.
MSC:
37C81; 37G15; 37G40; 37N99

1. Introduction

Companies often publish the wait time of the services they provide. Frequently, this information is neither up-to-date, nor real-time. Instead, customers are provided with delayed queue length information. That is, the information that the customers receive is the queue length some time in the past. Wait times in hospital emergency rooms, call centers, and amusement park rides are some examples of delayed information divulged by companies to their customers. In [1], the impact of delay announcements on the coordination within hospital networks was investigated. They showed that patients take delay information into account when choosing a provider of emergency services. This consequently leads to improvements in performance of the network due to the increased coordination. In [2], call centers where customers are informed of their anticipated delays were analyzed. They concluded that, for such system, balking and reneging are a function of the delay announcement. Hence, call center performance can be optimized through the choice of announcements made. In [3], the impact of rounding waiting time and delayed app information in amusement park rides were studied. The authors showed that these factors cause oscillations in the queues and such oscillatory behavior mimics the observed data dynamics. All these examples point to the hypothesis that providing delayed information impacts the system dynamics of the queues and in turn affects customer choice.
A deterministic model of queues that incorporates customer choice behavior based on delayed queue length information was recently introduced and analyzed by Pender et al. [4,5]. This queues-with-choice model is composed of two delay differential equations with a single discrete time delay and is the first of its kind in the queueing literature. Here, the authors assumed that the arrival rate in each queue is based on delayed information and that the sum of these arrival rates is constant. It was shown that when the value of the time delay increases beyond a threshold which depends on the constant total arrival rate and the service parameter, the system exhibits oscillations due to a Hopf bifurcation. In [6], this Hopf bifurcation was shown to be supercritical and the amplitude of the limit cycles yielded from this Hopf bifurcation can be approximated using the Lindstedt and the slope function methods. Furthermore, a classification of codimension-one bifurcations using symmetry techniques showed that only symmetry-breaking Hopf bifurcations can occur in the model [7]. This rules out the possibility of having synchronous cycles and explains the observed asynchronous behavior in the queues.
Several generalizations of the queues-with-choice model have also been studied, including a version with time-varying arrival rates [8] and those that use velocity information in the delay announcement [9]. The queues-with-choice model can also be obtained as a functional law of large numbers’ limit of a stochastic queueing process [10]. A version where the corresponding coefficients in the equations are different but with a single time delay has likewise been investigated [11]. Extensions into the more general model involving an arbitrary but finitely many queues were also considered. Several characteristics of the queues-with-choice model extend to this generalized model, including conditions for the absolute stability of the equilibrium and occurrence of symmetry-breaking Hopf bifurcations [12]. Branches of limit cycles with different oscillatory patterns can bifurcate from the symmetry-breaking Hopf bifurcations in this generalized model. However, it was proven using the method of multiple scales that the phase-locked oscillations is the only stable mode when the time delay is beyond the threshold value [13].
In this paper, we consider a generalization of the queues-with-choice model in [4,5] where the values of the time-delay parameter in each queue are not identical. Our proposed model is given by the following system of delay differential equations
d d t x ( t ) = a exp ( x ( t σ ) ) exp ( x ( t σ ) ) + exp ( y ( t τ ) ) b x ( t ) , d d t y ( t ) = a exp ( y ( t τ ) ) exp ( x ( t σ ) ) + exp ( y ( t τ ) ) b y ( t ) ,
with initial history φ 1 ( t ) , φ 2 ( t ) for t [ ρ , 0 ] where ρ = max { σ , τ } and the functions φ 1 ( t ) and φ 2 ( t ) are continuous and non-negative. Our goal is to study the dynamics of the system (1) when the delay in the information in each queue is different, i.e., when σ τ . We derive rigorously the conditions for absolute stability and conditions that allow switches on the stability of the equilibrium of the system (1). We also show that this non-symmetric case, i.e., the system (1) with σ τ , particularly allows bubbling, multiple stability switches and the coexistence of distinct families of stable limit cycles. We explain the occurrence of bistable limit cycles by examining the dynamical behavior of the system (1) in a neighborhood of a double-Hopf bifurcation obtained using numerical continuation. Transient quasi-periodic oscillations were also observed due to the presence of subcritical torus bifurcations near the double-Hopf bifurcation. These identifications of the underlying mechanisms that cause unwanted oscillations in the system allow a better understanding of the effects of providing delayed information and therefore help in better management of queues.
The remaining part of this paper is organized as follows. In Section 2, we revisit the results on the queues-with-choice model and identify its characteristics that extend to the general model involving an arbitrary but finitely many queues. We then utilize the general model to illustrate the capabilities of the numerical continuation and bifurcation tool that we are using. In Section 3, we provide our main results on the non-symmetric case. In Section 4, we perform numerical simulations to illustrate the main results, as well as to give a broader perspective on these results. Finally, Section 5 presents the conclusions and future directions of the paper.

2. Preliminaries

In this section, we revisit the results on the symmetric case, i.e., the system (1) with σ = τ , from references [4,5,7]. We also provide a discussion of these results to achieve a better understanding of their meanings, and to highlights the main characteristics that extend to the more general symmetric case involving an arbitrary but finitely many queues [12].

2.1. The Symmetric Case

When the time delays in the system (1) are equal, we obtain the following symmetric system
d d t x ( t ) = a exp ( x ( t τ ) ) exp ( x ( t τ ) ) + exp ( y ( t τ ) ) b x ( t ) , d d t y ( t ) = a exp ( y ( t τ ) ) exp ( x ( t τ ) ) + exp ( y ( t τ ) ) b y ( t ) .
The system (2) is based on a multinomial logit model and was first formulated and analyzed by Pender, Rand and Wesson in [4,5]. The state variables x ( t ) and y ( t ) represent the length of the first and second queues, respectively. Here, it is assumed that the queue length information reported to customers is delayed by a constant τ > 0 . The first term in the right-hand side of both equations in the system (2) is the rate at which customers join that particular queue. Notice that these arrival rates are based on delayed information, and their sum is the constant parameter a > 0 . Meanwhile, the service rate of both queues is given by the parameter b > 0 . It was shown that if the history functions φ 1 ( t ) and φ 2 ( t ) for t [ τ , 0 ] with φ 1 ( t ) = φ 2 ( t ) were used, then x ( t ) and y ( t ) remain identical for all time and the trajectory ( x ( t ) , y ( t ) ) converges the equilibrium. In contrast, if history functions with φ 1 ( t ) φ 2 ( t ) were used, then x ( t ) and y ( t ) are asynchronous.
An analysis of the system (2) using symmetry techniques was given in [7]. In the following, we briefly summarize a few of these results which are obtained from a symmetry perspective. We refer the reader to the texts [14,15] and articles [16,17,18,19] for discussions and examples of symmetric systems or the so-called equivariant dynamical systems. The system (2) was shown to be Γ -equivariant where the action of the symmetry group Γ Z 2 = γ to the state variables is given as follows:
γ · x ( t ) y ( t ) = y ( t ) x ( t ) .
An equilibrium solution ( x * , y * ) of the system (2) that is fixed by this symmetry group must satisfy the condition given in Equation (3), i.e., we must have x * = y * . This additional condition leads to the equilibrium
E * : = a 2 b , a 2 b .
In [7], E * was referred to as the (fully) symmetric equilibrium of the system (2) because the symmetry of this equilibrium solution is the same as the symmetry of the system. Observe that E * always exists since the parameters a and b are both positive. Moreover, the positive equilibrium E * given in Equation (4) is also an equilibrium of the system (1). Thus, throughout this paper, we shall refer to E * simply as the equilibrium.
The symmetry structure of the system (2) was also used to provide a classification of codimension-one bifurcations of the equilibrium into regular and symmetry-breaking. In particular, it was shown that only symmetry-breaking Hopf bifurcations can occur in system (2). The non-occurrence of a regular Hopf bifurcation rules out synchronous periodic solutions in the system (2). The following results and example on the local stability and bifurcation of the equilibrium E * of the system (2) were taken from [4,5,7].
Theorem 1.
Consider the equilibrium E * of the system (2) given in Equation (4).
A. 
If a / b < 2 , then the equilibrium E * is locally asymptotically stable for all τ > 0 .
B. 
If a / b > 2 , then the critical time-delay value
τ c : = 2 cos 1 2 b / a a 2 4 b 2 .
exists, and the equilibrium E * is locally asymptotically stable for all τ ( 0 , τ c ) and is unstable for τ > τ c . At τ = τ c , the system (2) undergoes a symmetry-breaking Hopf bifurcation at the equilibrium E * .
We now provide an explanation of the results listed in Theorem 1. Particularly, we elaborate on what we mean by absolute stability and spontaneous symmetry breaking. An equilibrium of a system of delay differential equations is said to be absolutely stable if it is asymptotically stable for all time delays [20]. Hence, from Theorem 1A, a requirement for the absolute stability of the equilibrium E * of the system (2) is the condition that
a b < 2 .
That is, E * is absolutely stable provided that the ratio of the total arrival rate a to the service coefficient b is strictly less than the number of queues. In other words, to make the two queues behave the same eventually, we need to either decrease the total rate of arrivals or make the service faster. Theorem 1B, on the other hand, presents the possibility of a change of stability of the equilibrium due to a Hopf bifurcation. We now illustrate this scenario in the following example and further explain what we mean by a Hopf bifurcation that is symmetry-breaking.
Example 1.
The system (2) with parameters a = 10 and b = 1 yields the equilibrium E * = ( 5 , 5 ) and the critical time delay τ c 0.361739 . Since a / b > 2 in this case, following Theorem 1, as the value of the time delay parameter τ passes through the threshold value τ c , the stable equilibrium E * becomes unstable and its stability is passed on to the limit cycle that emerged from the Hopf bifurcation at τ = τ c . Figure 1 shows this change of stability of E * . The Hopf bifurcation at τ = τ c gave rise to a solution ( x ¯ ( t ) , y ¯ ( t ) ) where x ¯ ( t ) and y ¯ ( t ) are both periodic and are oscillating completely out of phase.
The phenomenon called ’spontaneous symmetry breaking’ occurs in an equivariant dynamical system when the symmetry of a solution of a system is smaller than the symmetry of the system itself [14,21]. As shown in the top row of Figure 1, when τ < τ c , the system (2) has the stable equilibrium solution E * = ( 5 , 5 ) whose symmetry group is Γ Z 2 because it satisfies the condition given in Equation (3). In this case, the symmetry of the solution is the same as the symmetry of the system. However, when τ > τ c , the system (2) has the stable limit-cycle solution x ¯ ( t ) , y ¯ ( t ) , as shown in the bottom row of Figure 1. Here, x ¯ ( t ) and y ¯ ( t ) are oscillating completely out of phase and do not satisfy the condition given in Equation (3). In this case, the symmetry of the solution is no longer the same as the symmetry of the system. The Hopf bifurcation here breaks the symmetry and the solution that bifurcates has spatial symmetry that is smaller than the symmetry of the system. Periodic solutions that are fixed by the symmetry group Γ Z 2 are solutions x ( t ) , y ( t ) where x ( t ) and y ( t ) are both periodic with x ( t ) = y ( t ) . However, the non-occurrence of a regular Hopf bifurcation at E * rules out such synchronous periodic solutions [7]. Apparently, the only periodic solutions that the system (2) permits are those of the asynchronous type such as the one shown in the bottom row of Figure 1 when τ > τ c .

2.2. The General Symmetric System

We now identify the properties of the system (2) that extend to the more general symmetric system involving N number of queues given by the following equations
d d t x k ( t ) = a exp ( x k ( t τ ) ) n = 1 N exp ( x n ( t τ ) ) b x k ( t ) ,
with k = 1 , 2 , , N . For the system (7), a similar condition for absolute stability of its corresponding fully symmetric equilibrium was presented in [12] which requires the ratio
a b < N .
That is, if we are allowed to vary N, which is the number of queues, we have to make this number large enough to satisfy condition (8) in order to make the queues behave eventually the same.
It was shown similarly in [12] that only symmetry-breaking Hopf bifurcation can occur for the general symmetric system (7). It is well-known that several branches of limit-cycle solutions can emerge from this kind of Hopf bifurcation [22]. To obtain these branches of limit cycles, we utilize DDE-Biftool, which is a numerical continuation and numerical bifurcation analysis tool for systems of delay differential equations [23,24,25,26,27].
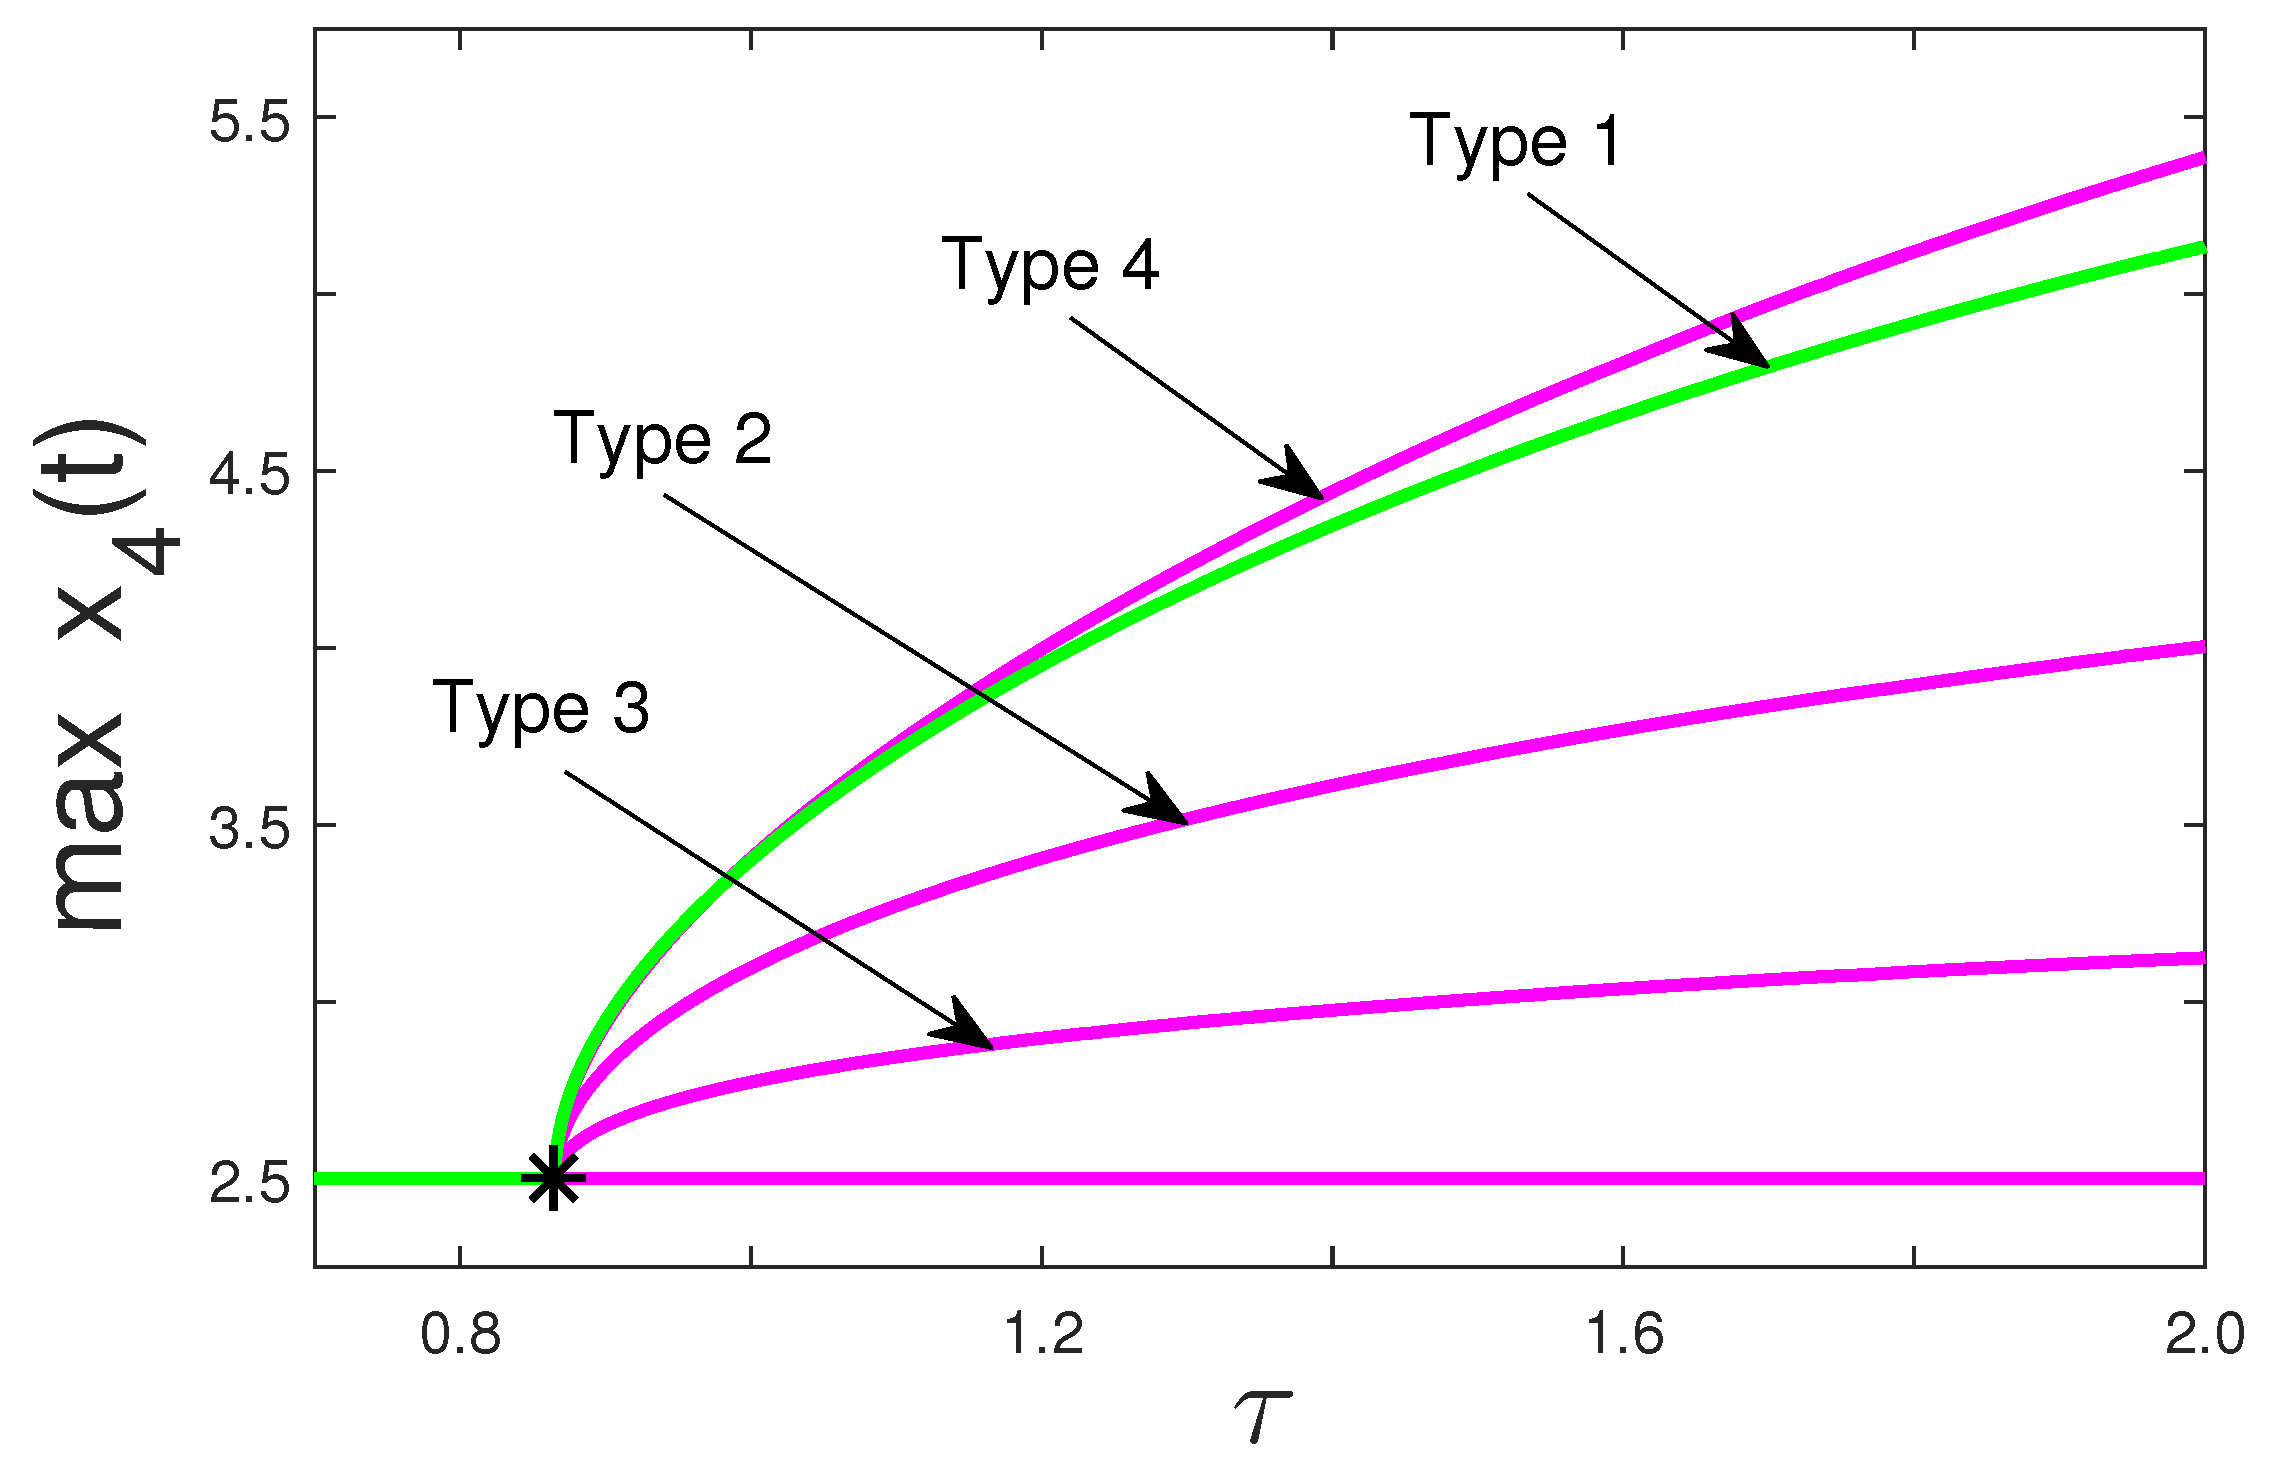
Figure 2 shows four different branches of limit cycles obtained using DDE-Biftool that emerged from the symmetry-breaking Hopf bifurcation of the system (7) with a = 10 , b = 1 and N = 4 . Of the four types of limit-cycle solutions, only one is asymptotically stable (Type 1) and the rest are unstable (Types 2–4). The profile plot of these limit-cycle solutions are shown in Figure 3. Since the only stable limit cycles are those of Type 1, the dominant dynamics when the time delay is above the critical value is that of the phase-locked oscillations, as shown in Figure 3a. This result is also corroborated in [13] where it was proven using the method of multiple scales [28] that the phase-locked oscillations is the only stable mode when the time-delay parameter is beyond the threshold value.
The bifurcation diagram in Figure 2 and the oscillatory patterns of the unstable limit cycles in Figure 3 are produced here for the first time, and they complement the example given in [12] on the generalized system (7) when N = 4 . A more exhaustive classification of the bifurcating limit cycles from the symmetry-breaking Hopf bifurcation in Figure 2 can be achieved using the methods and techniques in [17,22]. The branches of limit cycles shown in Figure 2 are limited to only those that we obtained numerically using DDE-Biftool.

3. Main Results

In this section, we present our results on the non-symmetric case, i.e., the system (1) with σ τ . To simplify the discussion, we divide our analysis into two cases. The first case is when one of the time delays is zero, while the second case is when both time delays are positive. Conditions for absolute stability of the equilibrium and conditions that allow stability switches to occur will be provided. We will also highlight the differences in the dynamics between the non-symmetric system (1) and the symmetric system (2).
We first examine the local stability of the equilibrium E * of the system (1). If we let X ( t ) = x ( t ) , y ( t ) , then the linearized system corresponding to the system (1) about E * is given by
X ˙ ( t ) = M 0 X ( t ) + M 1 X ( t σ ) + M 2 X ( t τ )
where the 2 × 2 matrices M 0 , M 1 , and M 2 are as follows
M 0 | M 1 | M 2 =         0 b       b     0 |   0 0       a / 4       a / 4 |         a / 4 a / 4       0 0 .
The characteristic equation corresponding to the linear system in Equation (9) is
det Δ ( λ ) = 0
where Δ ( λ ) = λ I 2 M 0 M 1 e λ σ M 2 e λ τ and I 2 denotes the 2 × 2 identity matrix, and M 0 , M 1 and M 2 are given in Equation (10). When simplified, the characteristic Equation (11) takes the following form
λ + b λ + b + 1 4 a e λ σ + 1 4 a e λ τ = 0 .
Clearly, λ = b < 0 is a root of Equation (12). Hence, the stability of the equilibrium E * of the system (1) now only depends on the distribution of the roots of the following equation
P ( λ ) : = λ + b + 1 4 a e λ σ + 1 4 a e λ τ = 0
on the complex plane. If all roots of Equation (13) are inside the open left half of the complex plane, that is, if all roots of Equation (13) have a negative real part, then the equilibrium E * is locally asymptotically stable. On the other hand, if at least one root of Equation (13) lies in the open right half of the complex plane, that is, if at least one root of Equation (13) has a positive real part, then E * is unstable. Note that Equation (13) is a transcendental equation. Transcendental equations often arise in systems of delay differential equations and are known to have possibly infinitely many roots. We refer the readers to the texts [29,30,31,32,33,34] for background on the theory of delay differential equations.
The following results will be useful in the discussion of the local stability of the equilibrium E * of the system (1). The proofs follow immediately from Equation (13).
Lemma 1.
The equilibrium E * of the system (1) with σ = 0 and τ = 0 is locally asymptotically stable.
Lemma 2.
Since the parameters a and b are positive, then λ = 0 is not a root of Equation (13).

3.1. Case 1: σ = 0 and τ > 0

If we fixed σ = 0 , then Equation (13) simplifies to
λ + b + 1 4 a + 1 4 a e λ τ = 0 .
From Lemma 1, we know that at τ = 0 , the equilibrium E * is locally asymptotically stable. That is, all roots of Equation (14) lie in the open left half of the complex plane when τ = 0 . We show that as we increase the value of τ , the roots of Equation (14) will not cross the imaginary axis and will remain in the open left half of the complex plane. According to Corollary 2.3 in [35], as τ continuously varies, the sum of the order of the zeros of Equation (14) in the open right half of the complex plane can change only if a zero appears on or crosses the imaginary axis. By Lemma 2, λ = 0 is not a root of Equation (14). That is, a root of Equation (14) cannot cross the imaginary axis along the real axis. Hence, we only need to check if a root of Equation (14) will cross the imaginary axis as a complex conjugate pair. In other words, we need to check if Equation (14) can have a root of the form λ = ± i ω with ω > 0 . Suppose now that λ = i ω with ω > 0 is a root of Equation (14). Then, λ = i ω satisfies Equation (14), i.e., i ω + b + 1 4 a + 1 4 a e i ω τ = 0 or, equivalently, using Euler’s formula, we have
i ω + b + 1 4 a + 1 4 a cos τ ω i sin τ ω = 0 .
Matching real parts and imaginary parts of both sides of Equation (15) yields
b + 1 4 a = 1 4 a cos τ ω
and
ω = 1 4 a sin τ ω .
By squaring each side of Equations (16) and (17) and then adding corresponding sides, we can eliminate τ to obtain the following quadratic polynomial equation in ω
ω 2 + b 2 + 1 2 a b = 0 .
Since both a and b are positive, Equation (18) does not have any real solutions. Consequently, Equation (14) cannot have purely imaginary roots. This means that the roots of Equation (14) that are in the open left half of the complex plane remain in the open left half of the complex plane as τ is varied, since they cannot cross the imaginary axis. Consequently, the equilibrium E * is locally asymptotically stable for all τ > 0 . The same result is obtained if instead of the case σ = 0 and τ > 0 , we consider the case τ = 0 and σ > 0 .
Theorem 2.
The equilibrium E * of the system (1) with σ = 0 (resp., with τ = 0 ) is absolutely stable.

3.2. Case 2: σ > 0 and τ > 0 with σ τ

We now consider the case where both time delays σ and τ are positive and are unequal. Our strategy for this case is to initially choose the time delays to be equal, and then use Theorem 1 to check the stability of the equilibrium E * . Since we want unequal values for the time delays, we can fix the value of one of the time delays and vary the other, and then check whether the stability of E * remains unchanged or whether the stability of E * switches.
In the following discussion, we start with equal values of the time delays σ and τ , choosing them using Theorem 1 so that the equilibrium E * is locally asymptotically stable. In this case, since E * is locally asymptotically stable, we know that all roots of Equation (13) lie in the open left half of the complex plane. By fixing the value of σ and then varying the value of τ , the roots of Equation (13) may remain in the open left half of the complex plane or may cross the imaginary axis and move towards the open right half of the complex plane. In the former case, E * remains locally asymptotically stable for all values of τ . Meanwhile, in the latter case, a change of stability of equilibrium E * occurs at some critical value of τ . Note that a similar process can be conducted if the equilibrium E * is unstable for the chosen initial common time-delay values.
To investigate the possibility or impossibility of switches on the stability of E * , we first need to check if the roots of Equation (13) will cross the imaginary axis as τ is varied. By Lemma 2, λ = 0 is not a root of Equation (13). Thus, a root of Equation (13) cannot cross the imaginary axis along the real axis. Next, we check whether a root of Equation (13) will cross the imaginary axis as a complex conjugate pair, i.e., if Equation (13) has a root of the form λ = ± i ω with ω > 0 . Suppose now that λ = i ω with ω > 0 is a root of Equation (13). Since λ = i ω satisfies Equation (13), we obtain that i ω + b + 1 4 a e i ω σ + 1 4 a e i ω τ = 0 or equivalently,
i ω + b + 1 4 a cos σ ω i sin σ ω + 1 4 a cos τ ω i sin τ ω = 0
using Euler’s formula. The following two equations were obtained by matching the real and imaginary components of each side of Equation (19)
b + 1 4 a cos σ ω = 1 4 a cos τ ω
and
ω 1 4 a sin σ ω = 1 4 a sin τ ω .
Notice that τ can be eliminated in Equations (20) and (21) by squaring each side of the two equations and then adding corresponding sides. We obtain
ω 2 + b 2 + 1 2 a b cos σ ω 1 2 a ω sin σ ω + 1 16 a 2 = 1 16 a 2
or equivalently, F ( ω ) = 0 where
F ( ω ) : = ω 2 + b 2 + 1 2 a b cos σ ω 1 2 a ω sin σ ω .
Notice that F is an even function. This means that if ω > 0 is a root of F ( ω ) = 0 , then so is ω . Hence, it suffices to only consider positive roots. The dynamical behavior of the system (1) depends on the number of positive roots of the equation F ( ω ) = 0 .
If the equation F ( ω ) = 0 has no positive root, then λ = i ω is not a root of Equation (13). In this case, the roots of Equation (13) will remain in the open left half of the complex plane for all τ > 0 . Consequently, the equilibrium E * is absolutely stable. Observe that if, in the previous discussion, we start with equal values of σ and τ where the equilibrium E * is instead unstable, then, similarly, E * remains unstable for all τ > 0 , provided the equation F ( ω ) = 0 has no positive root. We have the following results.
Theorem 3.
Let σ > 0 be fixed so that the equilibrium E * of the system (1) is locally asymptotically stable (resp., unstable) when τ = σ . If the equation F ( ω ) = 0 with the function F given in Equation (23) does not have positive roots, then the equilibrium E * remains locally asymptotically stable (resp., unstable) for all τ > 0 .
Example 2.
Let a = 10 , b = 1 , σ = 0.300 and τ = 0.300 in the system (1). By Theorem 1, the equilibrium E * is locally asymptotically stable since σ = τ < τ c 0.361739 , as computed in Example 1. Moreover, in this case, the graph of the function F ( ω ) as shown in the left panel of Figure 4 has no positive roots. Therefore, by Theorem 3, the equilibrium E * of the system (1) with σ = 0.300 is locally asymptotically stable for all τ > 0 .
We next derive the conditions that will allow switches on the stability of the equilibrium. Suppose now that λ = i ω * with ω * > 0 is a root of Equation (13). That is, ω * is a positive root of the equation F ( ω ) = 0 . Corresponding to this positive root, ω * is the following sequence of time delay values
τ k * : = 1 ω * cos 1 4 b a cos σ ω * + 2 π k for k = 0 , 1 , 2 ,
obtained from Equation (20). That is, when the time delay τ = τ k * ( k = 0 , 1 , 2 , ) , Equation (13) has a complex conjugate pair of roots on the imaginary axis given by λ = ± i ω * . From Equation (20), we have 4 b / a cos σ ω * = cos τ ω * . This means that the quantity ( 4 b / a cos σ ω * ) [ 1 , 1 ] , and thus the increasing sequence of values given Equation (24) are well-defined. The following results tell us how the roots λ = ± i ω * of Equation (13) at τ = τ k * ( k = 0 , 1 , 2 , ) will traverse the imaginary axis.
Lemma 3.
Let λ ( τ ) be a root of Equation (13) satisfying λ ( τ k * ) = i ω * . Then
sign d d τ Re λ ( τ ) τ = τ k * = sign F ( ω * ) .
Moreover, the root λ = i ω * of Equation (13) when τ = τ k * is simple.
Proof. 
Note that
sign d d τ Re λ ( τ ) τ = τ k * = sign Re d λ d τ 1 λ = i ω * .
Therefore, we first need to compute for the quantity ( d λ / d τ ) 1 . Differentiating with respect to τ in Equation (13), we get
1 + 1 4 a e λ σ ( σ ) + 1 4 a e λ τ ( τ ) d λ d τ + 1 4 a e λ τ ( λ ) = 0 .
This gives
d λ d τ 1 = 1 1 4 a σ e λ σ 1 4 a τ e λ τ 1 4 a λ e λ τ = 1 + σ 1 4 a e λ σ 1 4 a e λ τ + ( σ τ ) 1 4 a e λ τ λ 1 4 a e λ τ = 1 + σ λ + b λ λ b 1 4 a e λ σ + σ τ λ
since λ + b + 1 4 a e λ σ + 1 4 a e λ τ = 0 from Equation (13). Evaluating at λ = i ω * , we obtain
d λ d τ 1 λ = i ω * = λ σ + b σ + 1 λ 2 b λ 1 4 a λ e λ σ + σ τ λ λ = i ω * = ( i ω * ) σ + b σ + 1 ( i ω * ) 2 b ( i ω * ) 1 4 a ( i ω * ) e i ω * σ + σ τ i ω * = ( b σ + 1 ) + i ( σ ω * ) ( ω * 2 1 4 a ω * sin σ ω * ) i ( b ω * + 1 4 a ω * cos σ ω * ) i σ τ ω * ,
and hence the real part
Re d λ d τ 1 λ = i ω * = ( b σ + 1 ) ( ω * 2 1 4 a ω * sin σ ω * ) ( σ ω * ) ( b ω * + 1 4 a ω * cos σ ω * ) ( ω * 2 1 4 a ω * sin σ ω * ) 2 + ( b ω * + 1 4 a ω * cos σ ω * ) 2 = ω * 2 1 4 a b σ ω * sin σ ω * 1 4 a ω * sin σ ω * 1 4 a σ ω * 2 cos σ ω * ω * 2 ( ω * 2 + b 2 + 1 2 a b cos σ ω * 1 2 a ω * sin σ ω * + 1 16 a 2 ) = ω * 2 1 4 a b σ ω * sin σ ω * 1 4 a ω * sin σ ω * 1 4 a σ ω * 2 cos σ ω * ω * 2 ( 1 16 a 2 )
using Equation (22) in the denominator. Consequently,
Re d λ d τ 1 λ = i ω * = 8 a 2 ω * · 2 ω * 1 2 a b σ sin σ ω * 1 2 a sin σ ω * 1 2 a σ ω * cos σ ω * = 8 a 2 ω * F ( ω * )
since F ( ω ) = d d ω F ( ω ) = 2 ω 1 2 a b σ sin σ ω 1 2 a sin σ ω 1 2 a σ ω cos σ ω from Equation (23). Using Equation (26) and the fact that ω * > 0 completes the proof of the first assertion.
Now, note that we can rewrite Equation (27) into the following form
d d λ P ( λ ) · d λ d τ = 1 4 a λ e λ τ
using the expression for P ( λ ) given in Equation (13). At λ = i ω * , the right-hand side of Equation (28) is non-zero since both a and ω * are positive. Consequently, each factor on the left-hand side of Equation (28) evaluated at λ = i ω * are both non-zero. In particular,
d d λ P ( λ ) λ = i ω * 0 .
Condition (29) implies that the root λ = i ω * of Equation (13) when τ = τ k * is simple, and this completes the proof. ☐
In view of the Hopf bifurcation theorem, we see from Lemma 3 that the transversality condition is F ( ω * ) 0 . If F ( ω * ) > 0 , then the conjugate pair of simple roots of Equation (13) that are on the imaginary axis when τ = τ * move towards the open right-half of the complex plane. In contrast, if F ( ω * ) < 0 , then the movement is towards the open left half of the complex plane. The form given in Equation (25) is useful since the above conditions can be checked just by inspecting whether the graph of F ( ω ) is increasing or decreasing at ω = ω * .
The number of real roots of the equation F ( ω ) = 0 is finite. Note that for large | ω | , the quadratic term in the expression for F given in Equation (23) will dominate the rest of the terms, and thus the number of real roots of F ( ω ) = 0 cannot be infinite. Let us suppose then that the equation F ( ω ) = 0 has m positive roots, say, ω 1 , ω 2 , , ω m with corresponding sequences { τ k ( 1 ) } , { τ k ( 2 ) } , , { τ k ( m ) } given in Equation (24). Now, denote by ± i ω * the purely imaginary roots of Equation (13) when τ = τ * where
τ * : = min { τ k ( n ) | τ k ( n ) > 0 } .
That is, the value τ * given in Equation (30) is the least positive value amongst all values in the sequences { τ k ( 1 ) } , { τ k ( 2 ) } , , { τ k ( m ) } . The theorem that follows provides conditions for stability switch to occur.
Theorem 4.
Let σ > 0 be fixed so that the equilibrium E * of the system (1) is locally asymptotically stable when τ = σ . Suppose further that the equation F ( ω ) = 0 with the function F given in Equation (23) has at least one positive root and that ω * is the positive root when τ = τ * with τ * given in Equation (30). If F ( ω * ) > 0 , then a change of stability of E * occurs at τ = τ * where the system (1) undergoes a Hopf bifurcation at E * .
Example 3.
If we let a = 10 , b = 1 and σ = 0.345 , then we obtain the graph of the function F ( ω ) , as shown in the right panel of Figure 4. Here, the equation F ( ω ) = 0 has two positive roots ω 2.862919 and ω + 4.878345 . Corresponding to these ω values are the sequences { τ k } and { τ k + } of critical time delays. Listed in Table 1 are the first few values of these sequences, and the least positive value τ * = τ 0 + 0.381879 . Thus, we take ω * = ω + . As shown in the right panel of Figure 4, the graph of F ( ω ) is increasing at ω = ω + , i.e., F ( ω * ) = F ( ω + ) > 0 . Therefore, by Theorem 4, a change of stability of E * occurs at τ = τ * where a Hopf bifurcation occurs.
Theorem 4 stipulates that a switch towards instability of a stable equilibrium requires that F ( ω * ) > 0 , i.e., the conjugate pair of simple roots of Equation (13) that are on the imaginary axis when τ = τ * must move towards the open right half of the complex plane. In Example 3, we saw that this switch towards instability occurred at τ = τ 0 + 0.381879 since F ( ω + ) > 0 . However, also from Example 3, observe that F ( ω ) < 0 since the graph of F ( ω ) as shown in the right panel of Figure 4 is decreasing at the value ω = ω . This implies the possibility of the equilibrium reverting to stability at τ = τ 0 0.987096 , provided all roots of Equation (13) are in the open left half of the complex plane for values of τ immediately to the right of τ 0 . In the next section, we illustrate this phenomenon of multiple stability switches using numerical continuation.

4. Numerical Simulations

In this section, we use numerical continuation to illustrate the theoretical results from the previous section and to also reveal further dynamical behavior of the non-symmetric system (1). Specifically, we show the following: (i) the equilibrium E * of the system (1) can switch stability multiple times; (ii) occurrence the so-called bubbling phenomenon and coexistence of different stable limit-cycle solutions of the system (1); and (iii) quasi-periodic oscillations can occur in the system (1).

4.1. Multiple Stability Switches

In Example 3, the stable equilibrium E * of the system (1) becomes unstable at τ = τ 0 + 0.381879 since F ( ω + ) > 0 . We also conjectured the possibility of E * becoming stable again at τ = τ 0 0.987096 since F ( ω ) < 0 . Apparently, this can be verified numerically and we can check if E * is stable or unstable for the intervals between the critical time delays whose values are listed in Table 1.
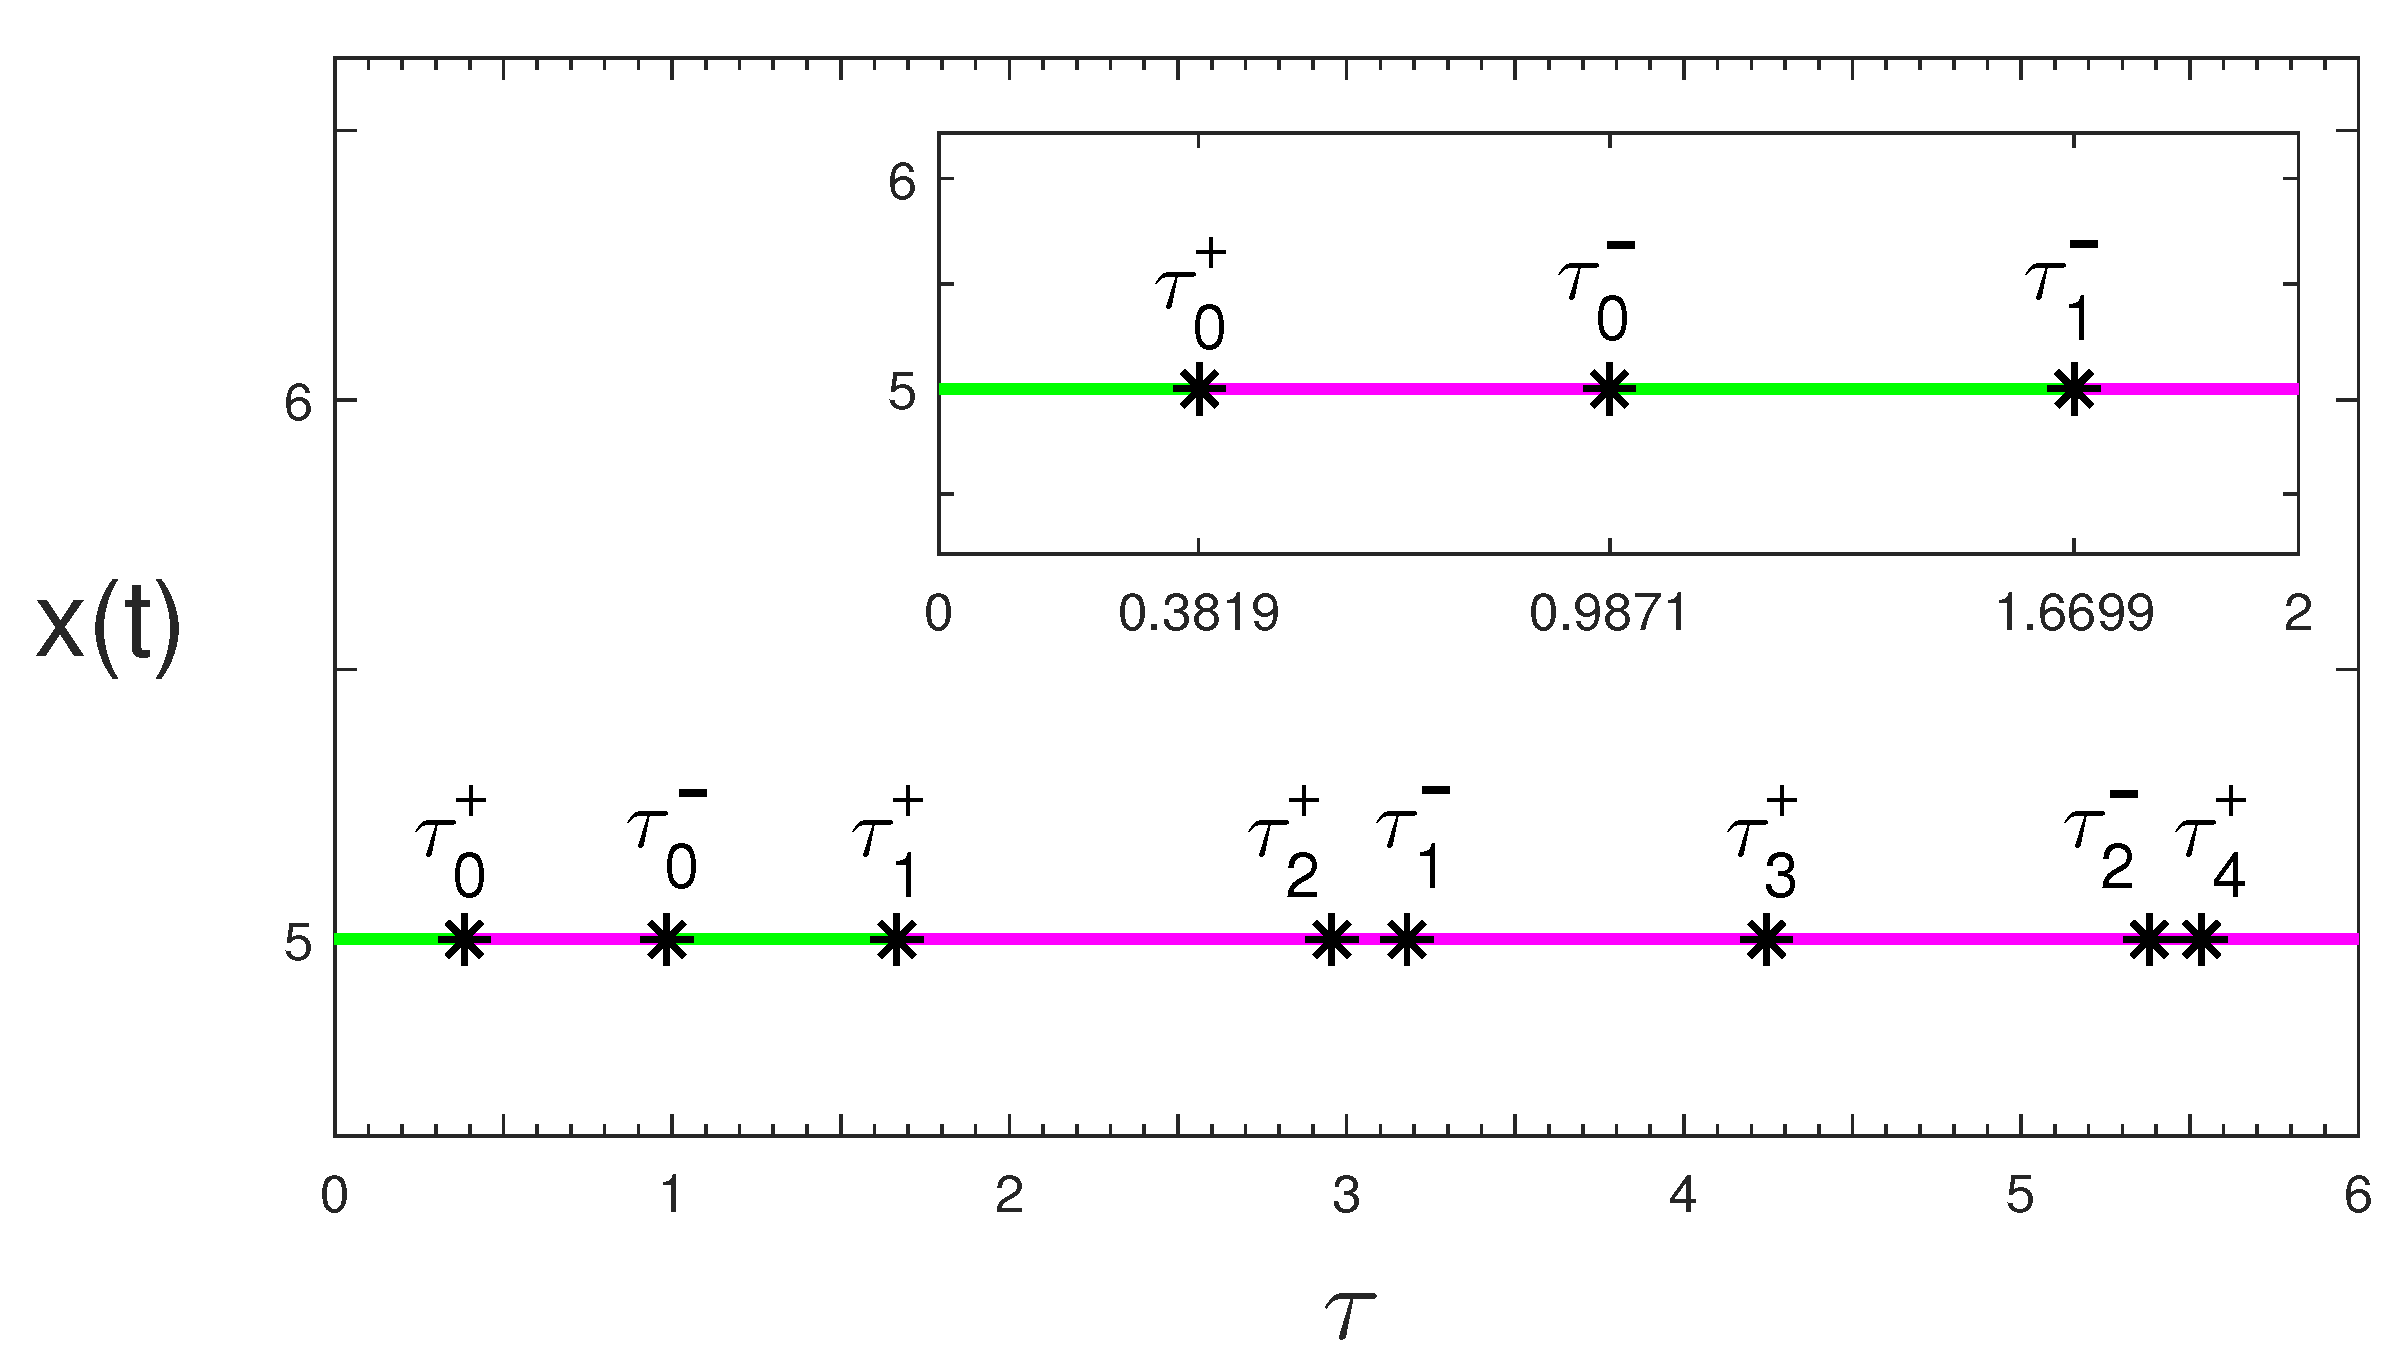
Figure 5 shows a branch of equilibria obtained by continuing the equilibrium E * of the system (1) with a = 10 , b = 1 and σ = 0.345 , and varying the time delay parameter τ . Stable and unstable parts of this branch are in green and magenta, respectively. Hopf bifurcations along this branch are marked with asterisk (*). The approximate value of the time delay parameter τ where these Hopf bifurcations occur are listed in Table 1. The inset shows the first three Hopf bifurcations where the switches in the stability of the equilibrium E * occur.
This sequence of alternated stability switches does not occur in the symmetric system (2). As shown in [7], for the system (2), the characteristic roots that are on the imaginary axis at some critical delay value can only move towards the open right half of the complex plane. This explains why stability switches for the symmetric system (2) can only happen at most once. In contrast, for the non-symmetric system (1), the characteristic roots that are on the imaginary axis given by ± i ω * can move to either direction, depending on the sign of F ( ω * ) , as specified in Lemma 3. This allowed the occurrence of stability switches in the non-symmetric system (1).

4.2. Bubbling and Bistable Limit Cycles

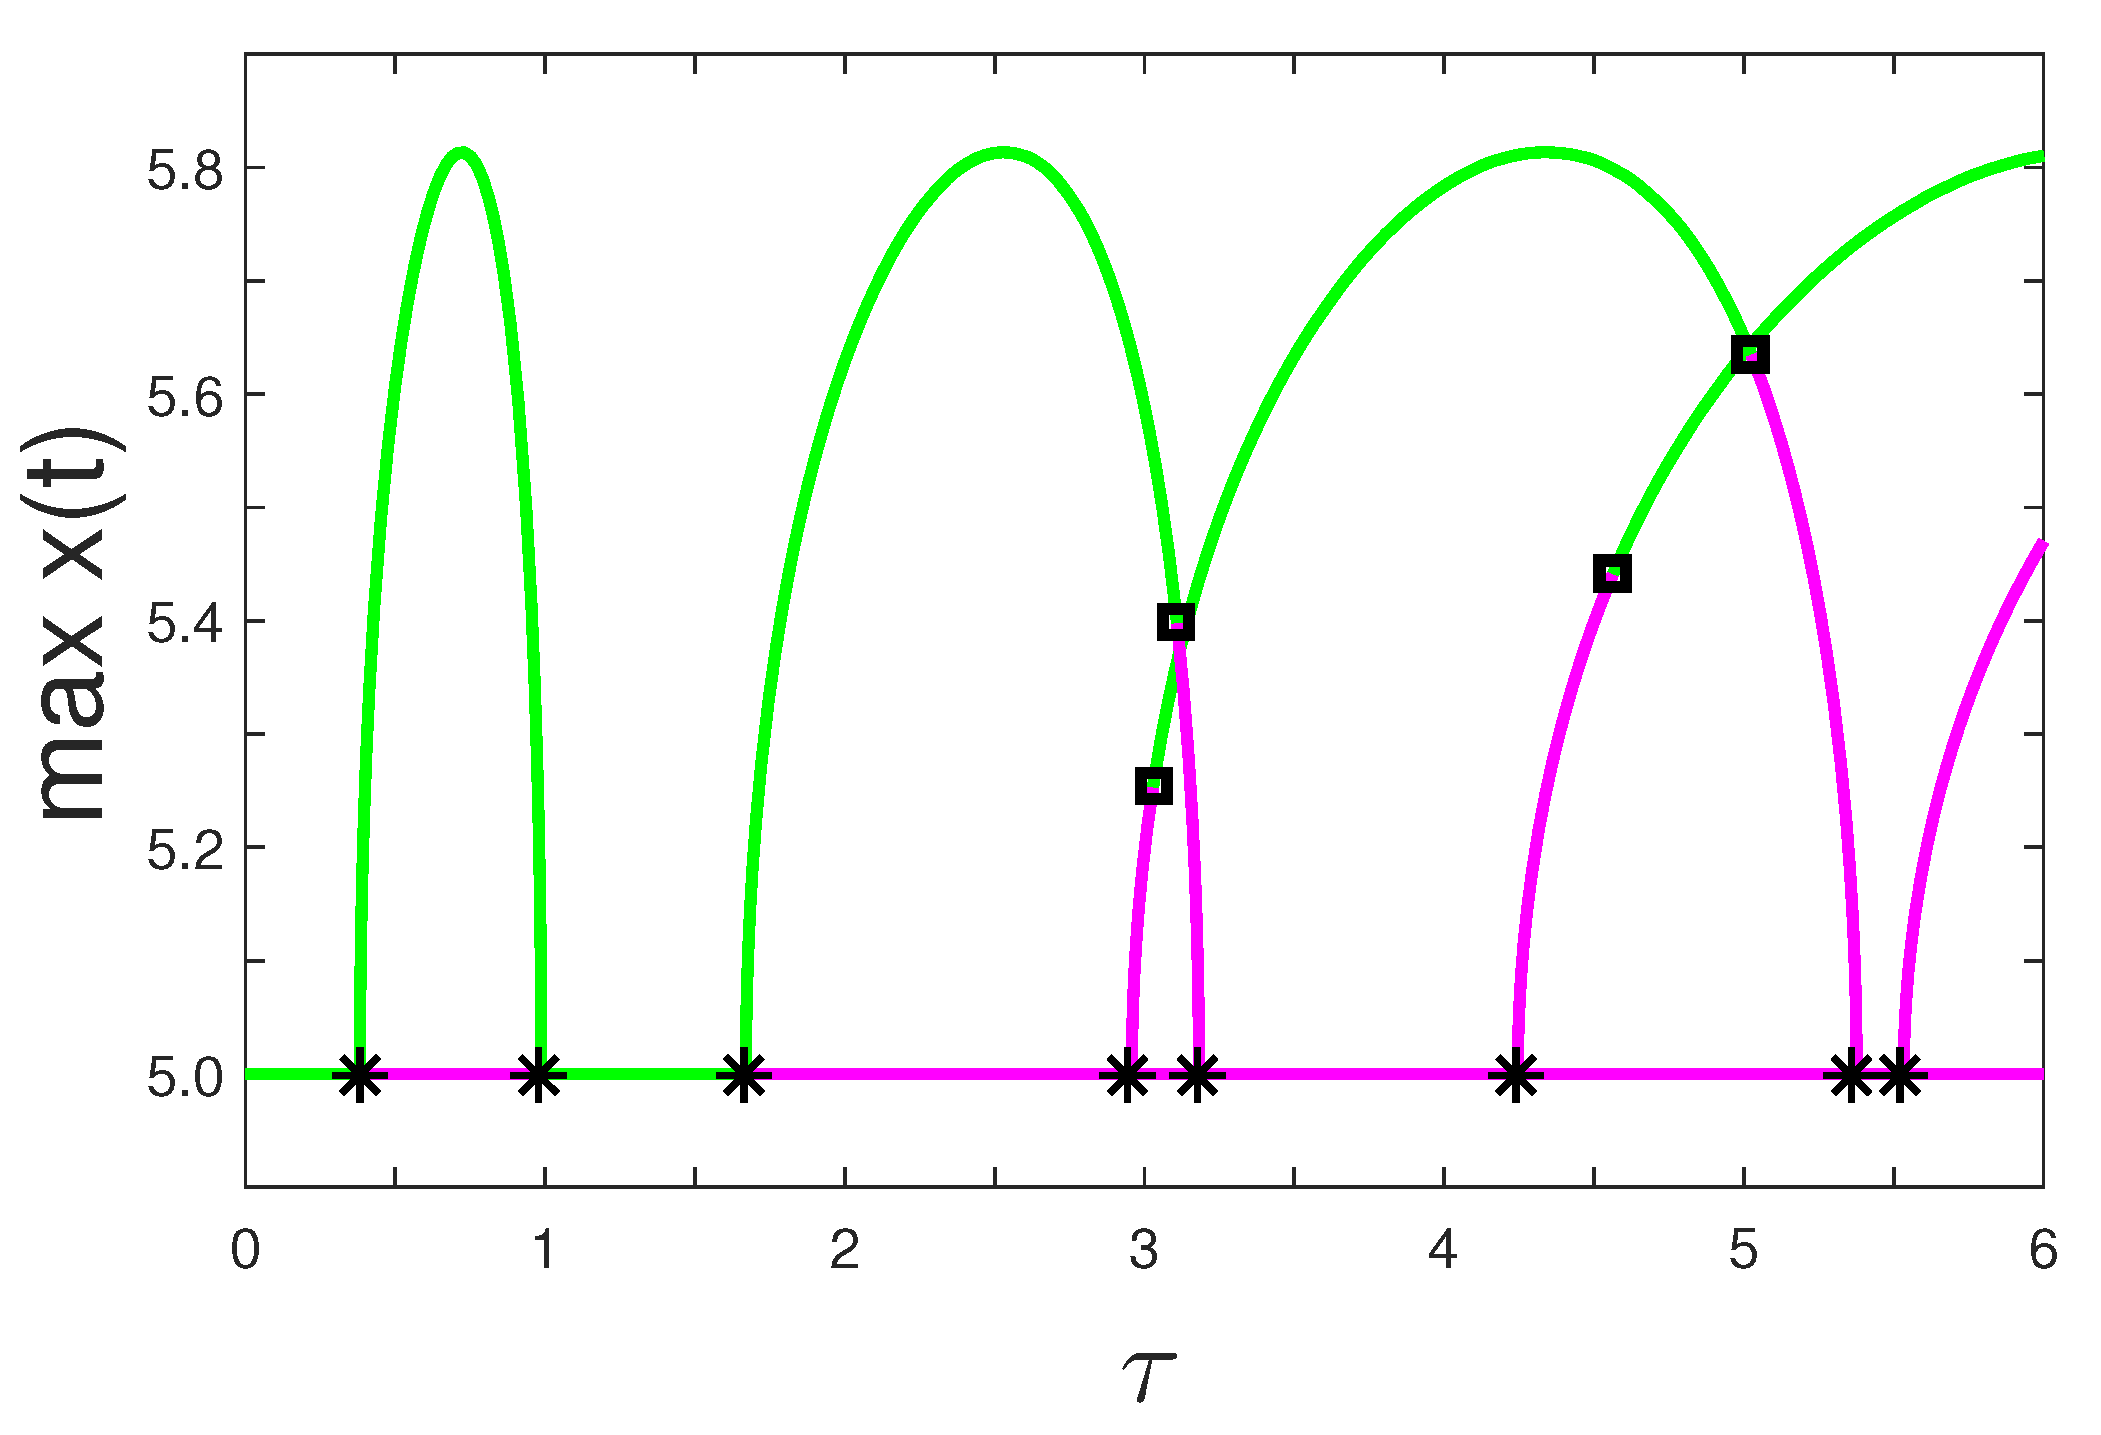
We now obtain the branches of limit-cycle solutions emerging from the Hopf bifurcations using numerical continuation in DDE-Biftool. This step gives us insights on the dynamics of the system (1) when the value of the delay τ is inside the intervals where E * is unstable. Figure 6 shows the same branch of equilibria from Figure 5 together with the branches of limit cycles that emerged from the Hopf bifurcations. Here, the vertical axis is the amplitude of the limit cycle. As before, the stable parts of the branch are in green and the unstable parts are in magenta. Torus bifurcations of limit cycles are indicated using square markers (☐).
Observe that the first branch of limit cycles connects the first two Hopf bifurcations and is stable throughout. Such dynamics or phenomena are referred to in the literature as bubbling, see, e.g., [36,37,38], where for values of delay parameter τ I = ( 0 , τ 1 + ) , the unique equilibrium E * is locally asymptotically stable for τ I \ [ τ 0 + , τ 0 ] and is unstable for τ ( τ 0 + , τ 0 ) . Here, the equilibrium E * loses its asymptotic stability in a supercritical Hopf bifurcation at τ = τ 0 + and becomes stable again after the second Hopf bifurcation at τ = τ 0 .
In contrast to the first limit-cycle branch, the rest of the branches of limit cycles have unstable parts. The second branch of limit cycles which connects the third and the fifth Hopf bifurcations is initially stable but then becomes unstable towards the end of the branch. This change of stability of the limit cycles from the second branch occurs at a torus bifurcation. The third branch of limit cycles which connects the fourth and the seventh Hopf bifurcations also shows stability switches at torus bifurcations. Figure 7 shows a magnification of Figure 6 where the second and third limit-cycle branches overlap.
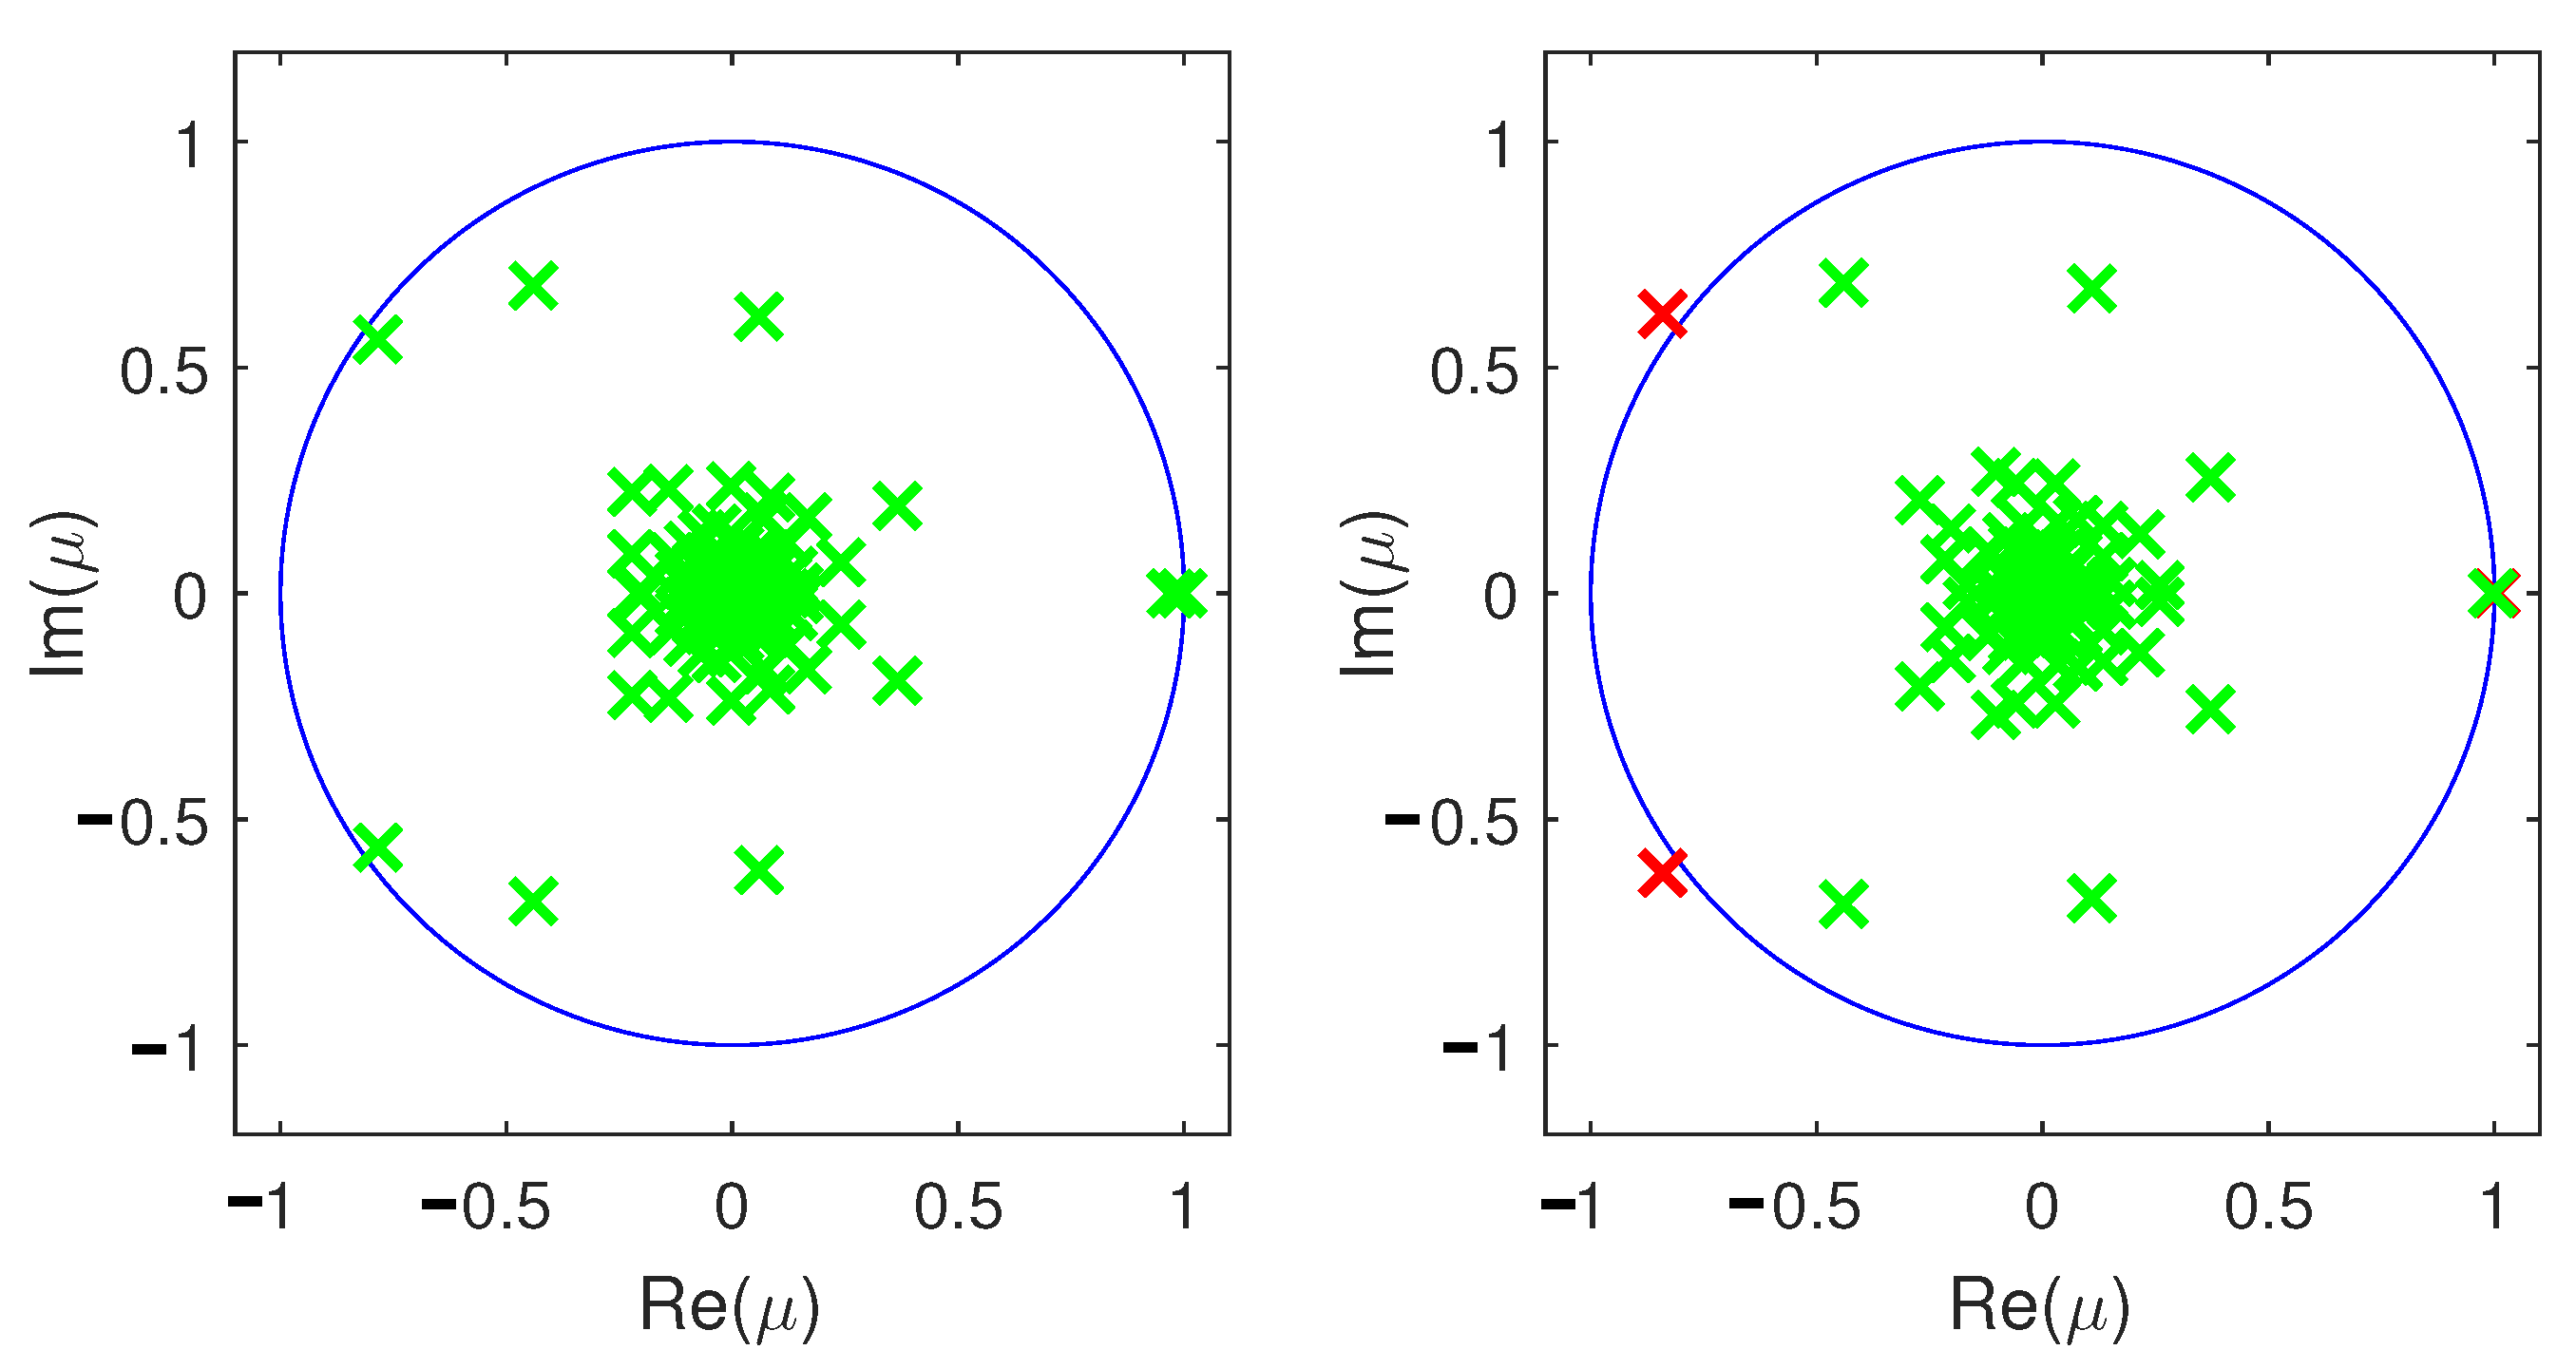
The change of stability of the limit cycles at the torus bifurcations can be explained further by examining the distribution of the corresponding Floquet multipliers μ on the complex plane. Figure 8 shows the Floquet multipliers before and after the first torus bifurcation at τ = τ 1 T B 3.028636 . Here, the complex conjugate pair of Floquet multipliers that are outside the unit circle, shown in red, move towards the interior of the unit circle as τ passes the value τ 1 T B . This corroborates the existence of the first torus bifurcation and the switch towards stability along the third limit-cycle branch.
Similarly, Figure 9 shows the Floquet multipliers before and after the second torus bifurcations. In this case, a complex conjugate pair of Floquet multipliers move from the interior to the exterior of the unit circle. This explains the existence of the second torus bifurcation and the switch towards instability along the second branch of limit cycles at τ = τ 2 T B 3.107698 .
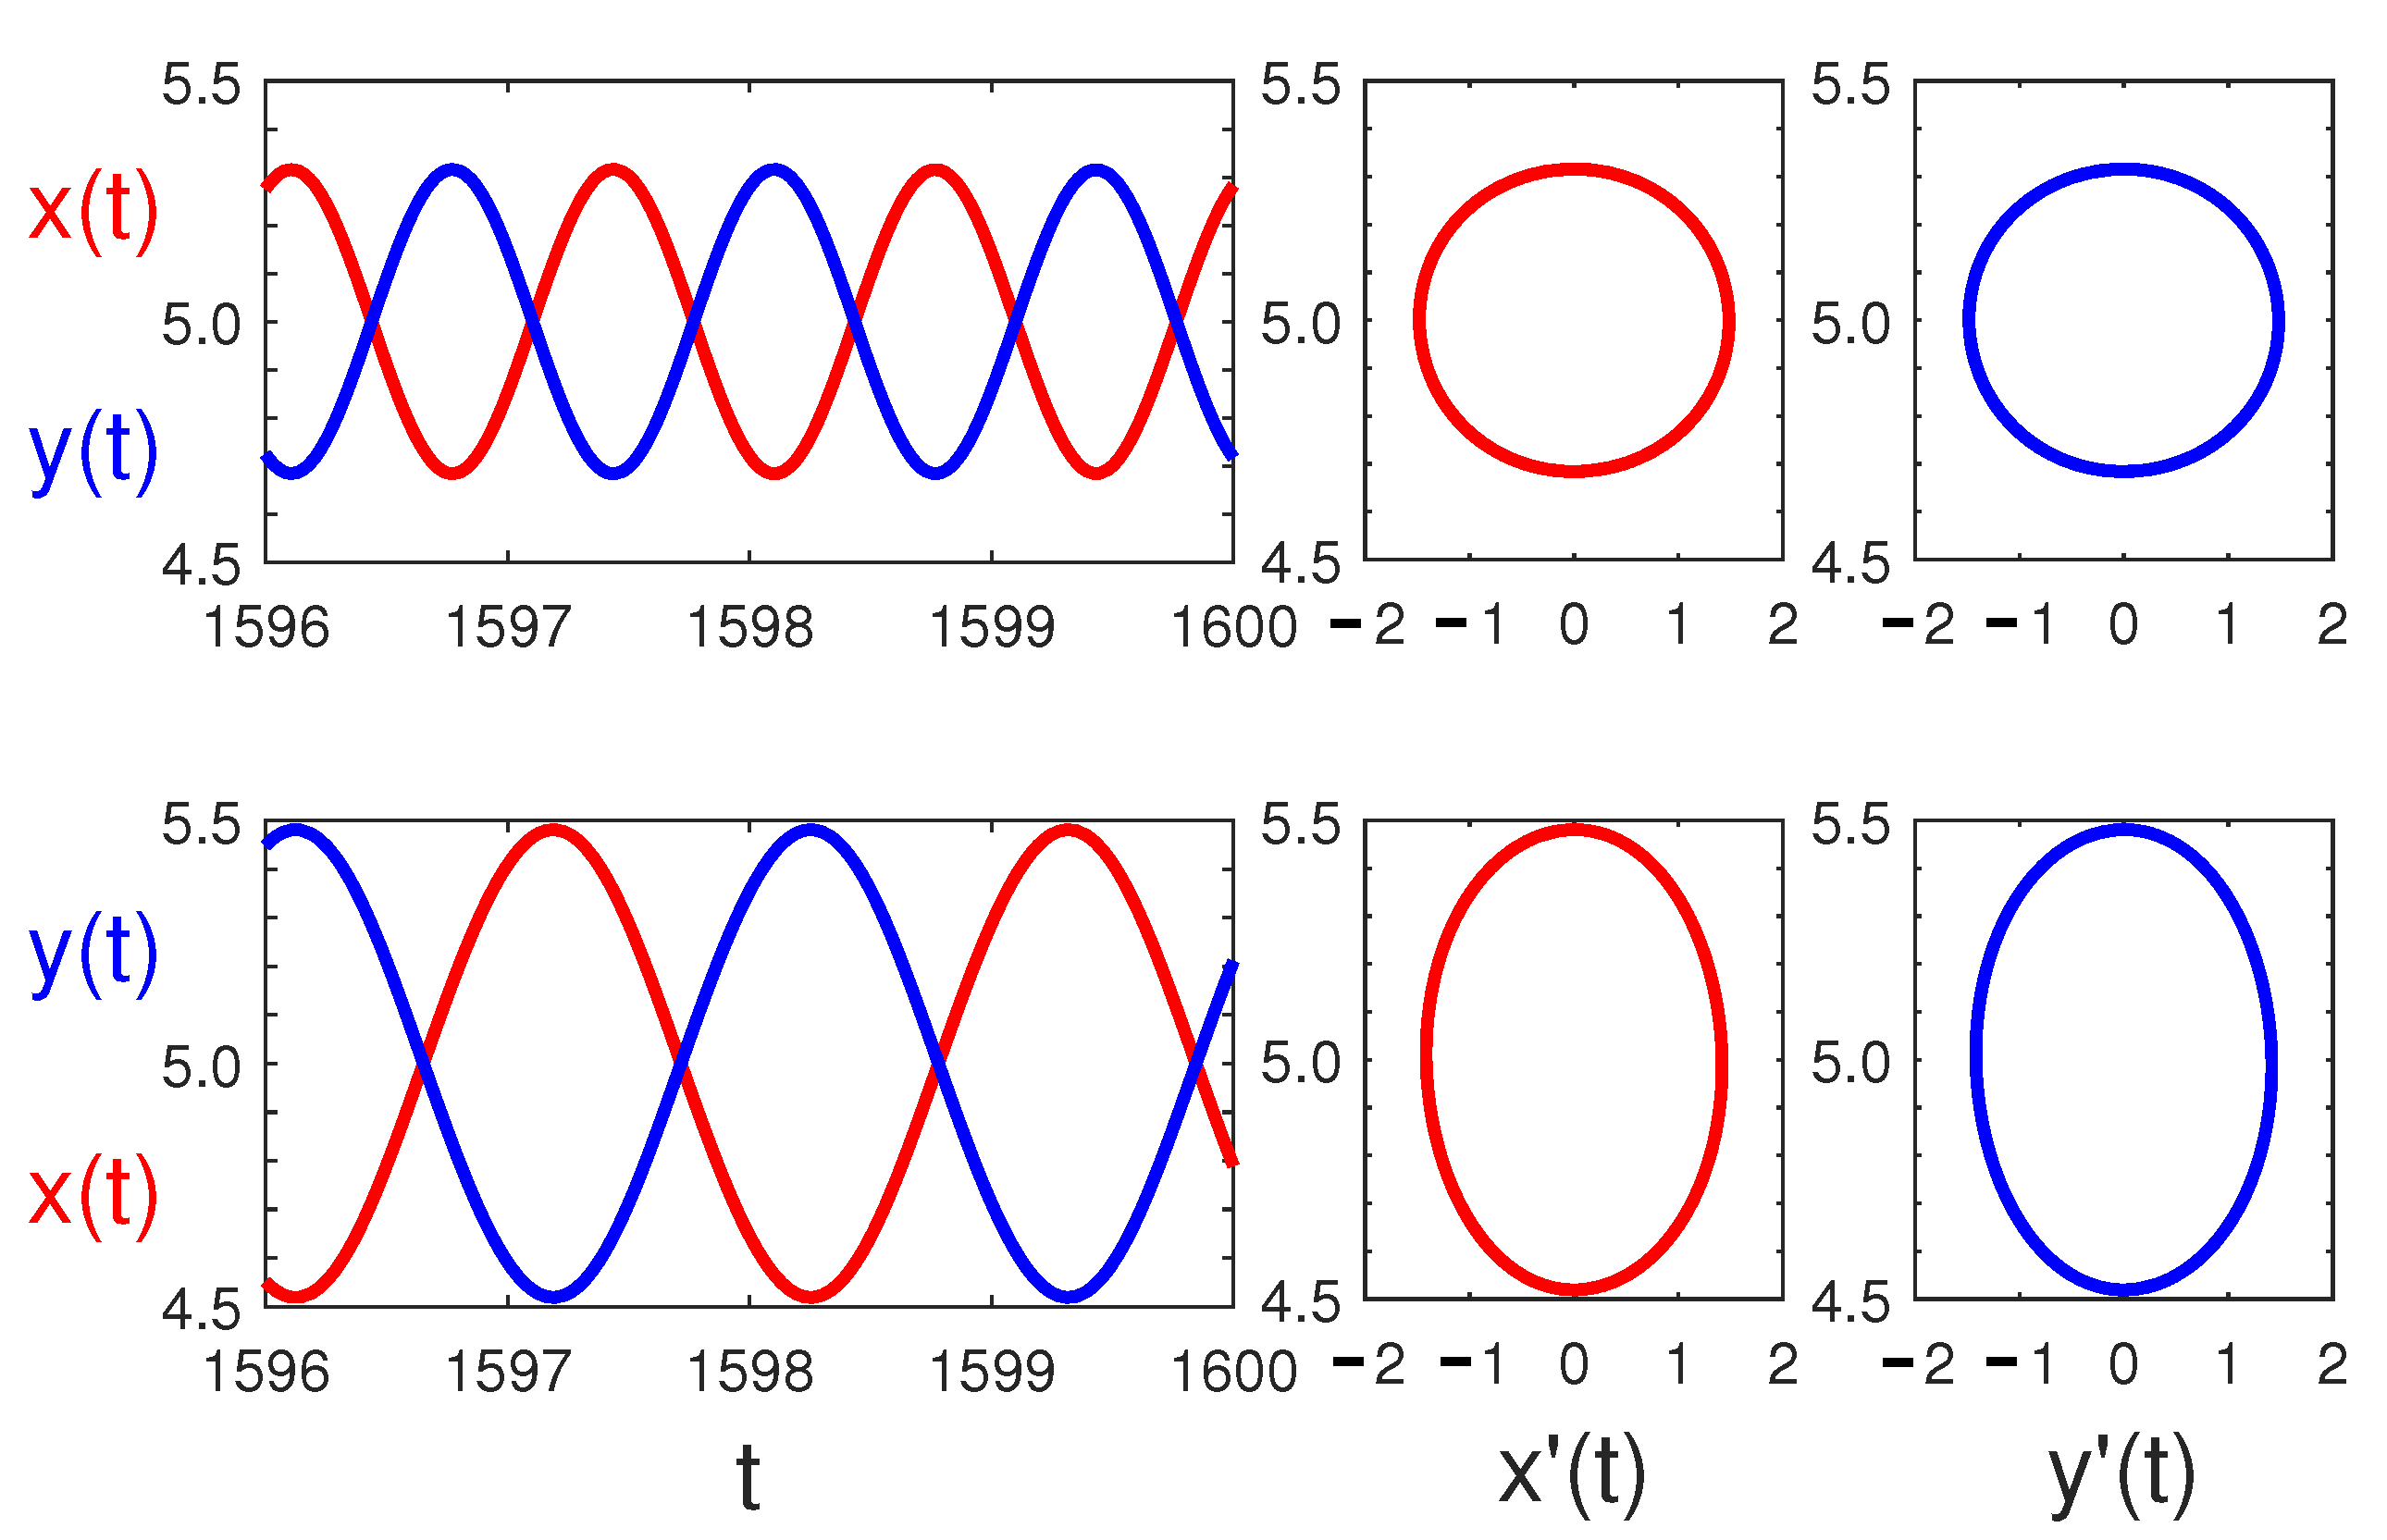
At τ = 3.07 , which is a value between the first two torus bifurcations, there are two stable limit cycles. Figure 10 shows the time series plot of the state variables x ( t ) and y ( t ) for the coexisting stable limit cycles occurring at τ = 3.07 , as well as the corresponding phase portraits. Note that both x ( t ) and y ( t ) are periodic and asynchronous in the two limit-cycle solutions. Moreover, the two limit cycles differ in terms of frequency and amplitude.
The two stable limit cycles in Figure 10 were obtained using two different sets of initial history ( ϕ 1 ( t ) , ϕ 2 ( t ) ) for t [ τ , 0 ] . In fact, we used initial history functions with ϕ 1 ( t ) = ϕ 2 ( t ) in generating the two distinct stable limit-cycle solutions. Recall that, if such initial history functions were used in the symmetric system (2), then according to [5], the state variables x ( t ) and y ( t ) remain identical for all time and the trajectory ( x ( t ) , y ( t ) ) converges to the equilibrium. Moreover, asynchronous behavior such as the one shown in Figure 10 can only be obtained using history functions with φ 1 ( t ) φ 2 ( t ) . That is, for the non-symmetric system (1), asynchronous solutions can be obtained even if symmetric history functions, i.e., with φ 1 ( t ) = φ 2 ( t ) , were used.

4.3. Two-Parameter Continuation

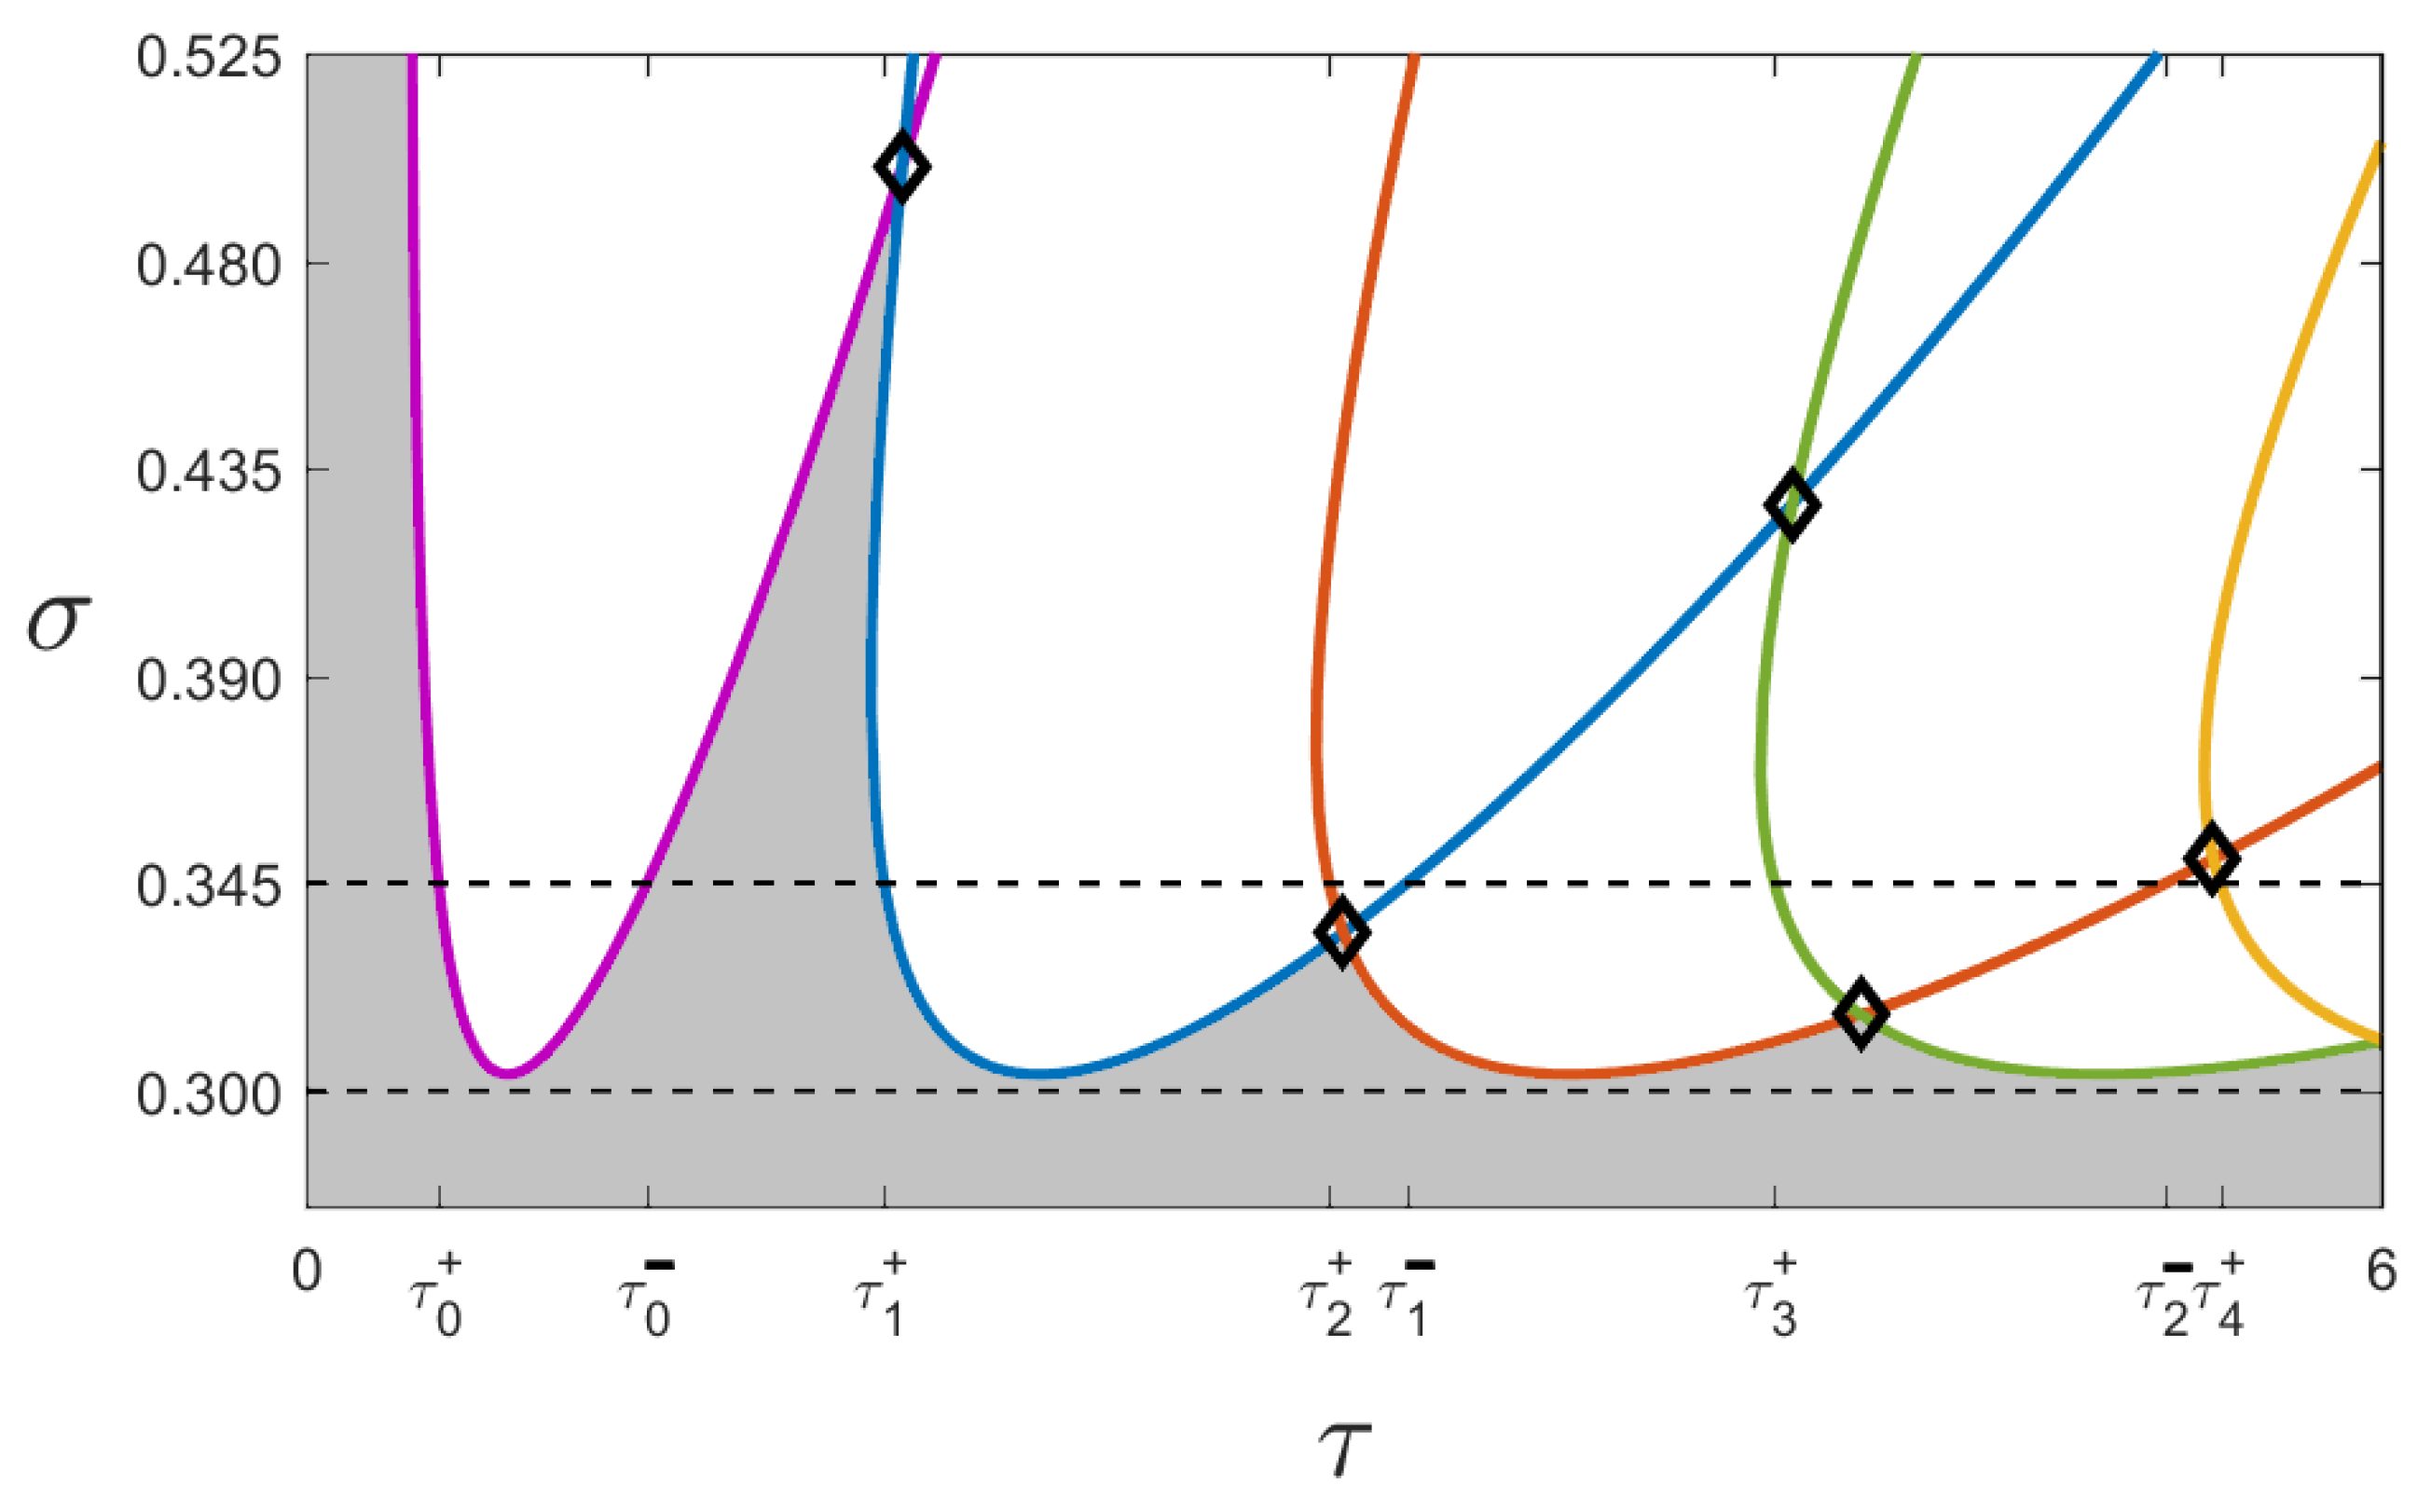
To provide a broader perspective on the previous results, we perform a two-parameter continuation in DDE-Biftool using the time delays τ and σ as bifurcation parameters. Figure 11 shows branches of Hopf bifurcations on the τ σ -plane. The points marked with diamond marker (⋄) where the curves intersect are the Hopf-Hopf bifurcations, also known as double-Hopf bifurcations, where Equation (13) has two pairs of purely imaginary roots [39]. The equilibrium E * of the system (1) is locally asymptotically stable when the values of τ and σ are chosen so that the point ( τ , σ ) is inside the gray-shaded region.
The dashed line in Figure 11 indicates the case where σ = τ . Notice that along this line, as the value of the common time delay increases, the equilibrium E * switches from being locally asymptotically stable to being unstable. The change of stability of E * occurred as the dashed line crosses the first Hopf curve (purple curve). This one-time stability switch is actually the case illustrated in Example 1 for the symmetric system (2) where the critical common time delay is τ c 0.361739 . The result on the absolute stability of the equilibrium of the non-symmetric system (1) with σ = 0 or τ = 0 given in Theorem 2 is also evident in Figure 11. The lines σ = 0 and τ = 0 do not cross the Hopf bifurcation curves. Hence, in these cases, the equilibrium retains its stability.
Figure 12 shows a magnification of Figure 11 around the values σ = 0.300 and σ = 0.345 in the vertical axis. Observe that the dashed line σ = 0.300 does not cross the Hopf bifurcation curves and is entirely inside the gray-shaded region. This means that if we fixed σ = 0.300 , then the equilibrium E * of the system (1) is locally asymptotically stable even if we vary the parameter τ . Recall that this particular case is the one illustrated in Example 2, and the absolute stability here of the equilibrium E * of the system (1) is guaranteed by Theorem 3.
In contrast, the dashed line σ = 0.345 crossed the Hopf bifurcation curves several times. This line lies inside the gray shaded region only in two instances, i.e., before crossing the first Hopf curve (purple curve), and after crossing the first Hopf curve for the second time and before crossing the second Hopf curve (blue curve) for the first time. The dashed line σ = 0.345 intersects the Hopf curves at values of τ listed in Table 1. Therefore, the equilibrium E * of the system (1), in this case, is locally asymptotically stable only when τ [ 0 , τ 0 + ) ( τ 0 , τ 1 + ) . The switch towards instability of the equilibrium at τ = τ 0 + is the case shown in Example 3, and according to Theorem 4, is caused by the occurrence of a Hopf bifurcation at τ = τ 0 + . The multiple stability switches here reflect exactly the scenario shown in Figure 5 when σ = 0.345 . In effect, Figure 12 provides the criteria on the occurrence of stability switches and absolute stability of the equilibrium E * of the system (1). That is, to choose the value of the delay parameter σ so that the horizontal dashed line in Figure 12 will either cross the Hopf bifurcation curves or not.

4.4. Neighborhood a Double-Hopf Bifurcation and Transient Quasi-Periodic Oscillations

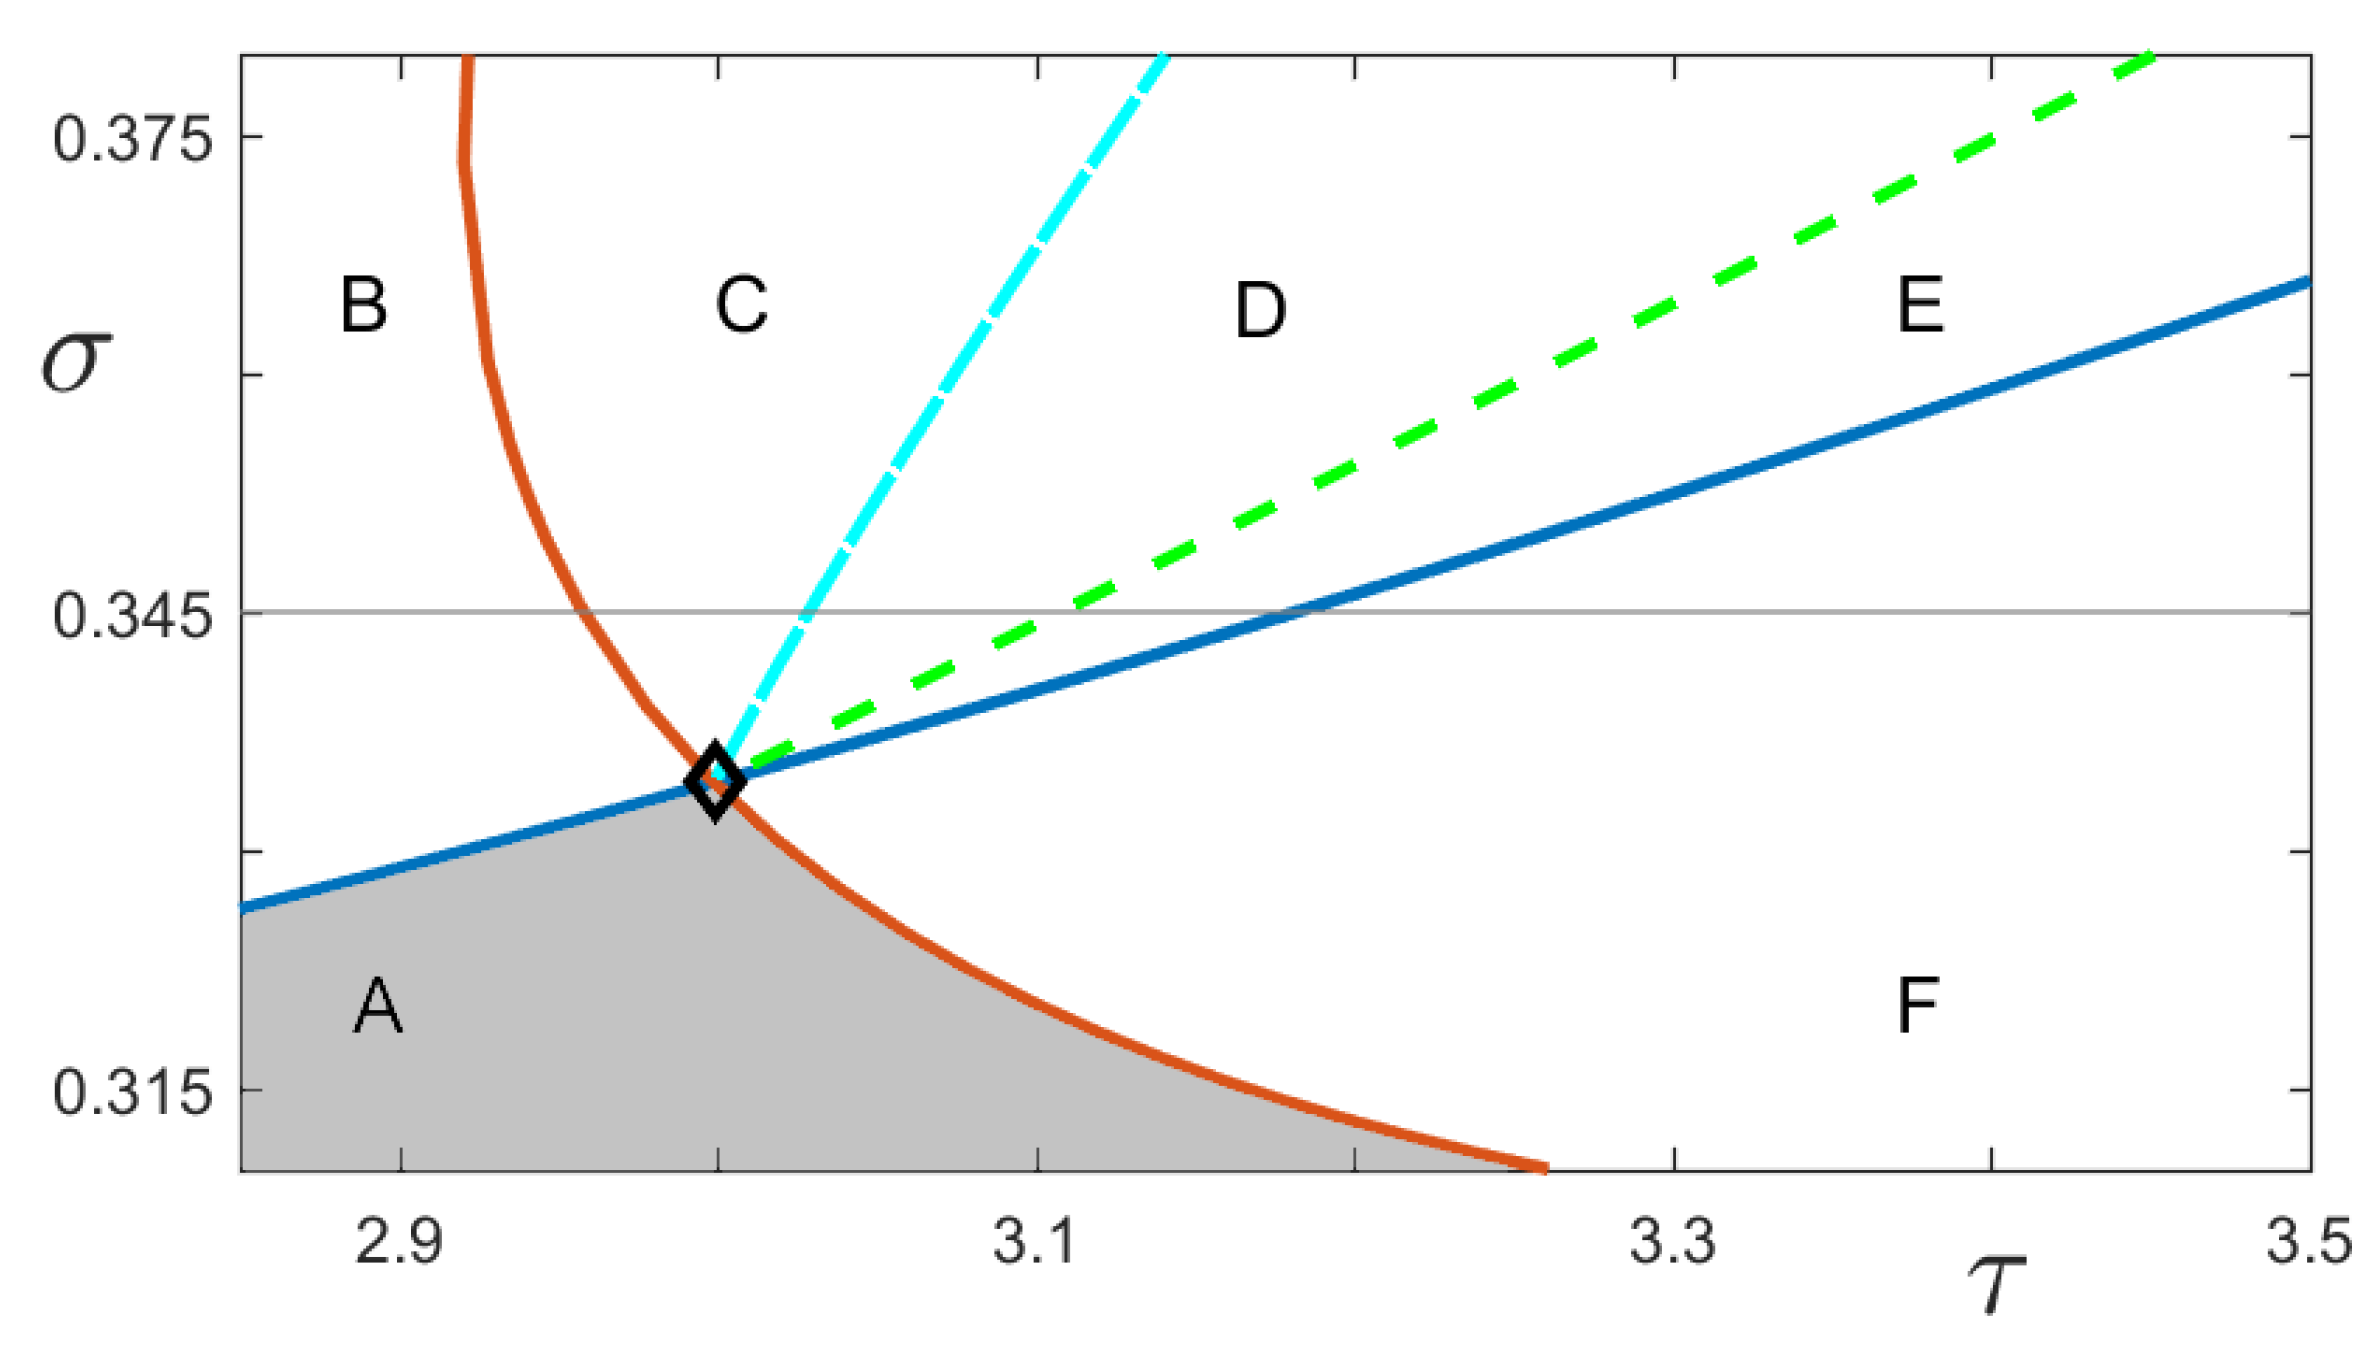
To further explain the presence of coexisting stable limit cycles in the system (1), as shown in Figure 10, we examine the dynamics of the system in a neighborhood with a double-Hopf bifurcation. Figure 13 shows one such double-Hopf bifurcation, marked with (⋄), from our previous plots. We choose this one since it is located near the point ( τ , σ ) = ( 3.07 , 0.345 ) where there are two stable limit-cycle solutions, as shown in Figure 7. It is well-known that a torus bifurcation [40] is always present near a double-Hopf bifurcation. In Figure 13, branches of torus bifurcations (dashed curves) obtained in DDE-Biftool are also shown in addition to the previously plotted branches of Hopf bifurcations (solid curves). These bifurcation curves partition the section of the plane presented in Figure 13 into six regions, namely, regions A, B, C, D, E and F. The dynamics around the double-Hopf bifurcation in Figure 13 is similar to the dynamics obtained by Tehrani and Razvan in [41] for their model of coupled FitzHugh–Nagumo neurons.
We now discuss the dynamical behavior of our model when ( τ , σ ) is inside one of these six regions. As previously discussed, the equilibrium is locally asymptotically stable when ( τ , σ ) is inside the gray shaded region. Hence, in region A, the equilibrium E * is locally asymptotically stable. Now recall, from Figure 12, that the second branch of Hopf bifurcations (blue curve) was obtained using numerical continuation from the supercritical Hopf bifurcation at τ = τ 1 + . Thus, going from region A to region B by crossing the second Hopf curve, the equilibrium E * becomes unstable and a stable limit cycle bifurcates.
To manage the discussion for the rest of the regions, we fixed σ = 0.345 . As shown in Figure 13, this line passes through the remaining regions B, C, D, E, and F. Going from region B to region C crosses the third Hopf-bifurcation branch (red curve). This Hopf bifurcation at τ = τ 2 + gives rise to another limit cycle that is unstable. That is, in region C we have two limit cycles: one stable, which is the same stable limit cycle in region B, and one unstable, which is the one created by the Hopf bifurcation at τ = τ 2 + 2.957828 (see Figure 7).
Now, moving from region C to region D crosses the first branch of torus bifurcations (cyan dashed curve). As shown in Figure 7, this torus bifurcation at τ = τ 1 T B 3.028636 causes the unstable limit cycle in region C to become stable. That is, in region D, we have two distinct stable limit cycles. The example shown in Figure 10 falls in this case since the point ( τ , σ ) = ( 3.07 , 0.345 ) lies inside region D. The torus bifurcation at τ = τ 1 T B is subcritical, which means that an unstable torus exists in region C. That is, we can observe transient quasi-periodic oscillations in the system when the values of time delay parameters are in region C.
Going from region D to region E crosses the second branch of torus bifurcation (green dashed curve). As shown in Figure 7, the torus bifurcation at τ = τ 2 T B 3.107698 causes one of the stable limit cycles in region D to become unstable. This torus bifurcation is subcritical, and thus, an unstable torus exists in region E. Finally, moving from region E to region F, the second Hopf-bifurcation branch (blue curve) is crossed for the second time. The Hopf bifurcation at τ = τ 1 causes the unstable limit cycle in region E to disappear.

5. Conclusions and Future Directions

In this paper, we analyzed a generalization of the queues-with-choice model, wherein the values of the time-delay parameter in each queue are different. We showed that this model exhibits richer dynamics compared to the symmetric model with identical time delay. In particular, our non-symmetric model allows bubbling, multiple stability switches of the equilibrium, and coexistence of distinct families of stable limit cycles. We also performed numerical continuation using the two time delays as bifurcation parameters. These simulations corroborate our derived theoretical results on the occurrence of stability switches and absolute stability of the equilibrium. An investigation of the dynamical behavior in a neighborhood of a double-Hopf bifurcation was also conducted which explains the coexistence of distinct stable limit-cycle solutions and the observed transient quasi-periodic oscillations. These identifications of the underlying mechanisms that cause unwanted oscillations in the system give a better understanding of the effects of providing delayed information and consequently help in better management of queues.
As for possible directions of this research, it would be interesting to investigate the amplitude of the oscillations in the non-symmetric system (1) in terms of the two time-delay parameters σ and τ . Previous works in [6] and in [13] have studied the amplitude of the oscillations arising in the symmetric systems (2) and (7), respectively. It was shown that for these systems with a single time delay, the amplitude of the oscillations is increasing with increasing time delay. This result, however, is not true for the non-symmetric system (1), as illustrated in Figure 6. We will address this research question in our future works.

Funding

This work was funded by the University of the Philippines System Enhanced Creative Work and Research Grant (ECWRG 2018-1-001).

Data Availability Statement

Not applicable.

Acknowledgments

The author is grateful to the reviewers for their valuable comments and suggestions that greatly improved the paper’s clarity. The author also acknowledges the support of the University of the Philippines Baguio through RLCs during the First Semester of A.Y. 2021–2022.

Conflicts of Interest

The author declares no conflict of interest.

References

  1. Dong, J.; Yom-Tov, E.; Yom-Tov, G.B. The impact of delay announcements on hospital network coordination and waiting times. Manag. Sci. 2018, 65, 1969–1994. [Google Scholar] [CrossRef] [Green Version]
  2. Jouini, O.; Akşin, Z.; Dallery, Y. Call centers with delay information: Models and insights. Manuf. Serv. Oper. Manag. 2011, 13, 534–548. [Google Scholar] [CrossRef]
  3. Nirenberg, S.; Daw, A.; Pender, J. The impact of queue length rounding and delayed app information on Disney world queues. In Proceedings of the 2018 Winter Simulation Conference (WSC), Gothenburg, Sweden, 9–12 December 2018; pp. 3849–3860. [Google Scholar] [CrossRef]
  4. Pender, J.; Rand, R.H.; Wesson, E. Delay-differential equations applied to queueing theory. In Proceedings of the 9th European Nonlinear Dynamics Conference (ENOC 2017), Budapest, Hungary, 25–30 June 2017. [Google Scholar]
  5. Pender, J.; Rand, R.H.; Wesson, E. Queues with choice via delay differential equations. Int. J. Bifurcat. Chaos 2017, 27, 1730016. [Google Scholar] [CrossRef]
  6. Novitzky, S.; Pender, J.; Rand, R.H.; Wesson, E. Nonlinear dynamics in queueing theory: Determining the size of oscillations in queues with delay. SIAM J. Appl. Dyn. Syst. 2019, 18, 279–311. [Google Scholar] [CrossRef]
  7. Collera, J.A. Queues with choice from a symmetry perspective. In Progress in Industrial Mathematics at ECMI 2018. Mathematics in Industry; Faragó, I., Izsák, F., Simon, P., Eds.; Springer: Cham, Switzerland, 2019; Volume 30, pp. 537–542. [Google Scholar] [CrossRef]
  8. Pender, J.; Rand, R.H.; Wesson, E. An analysis of queues with delayed information and time-varying arrival rates. Nonlinear Dynam. 2018, 91, 2411–2427. [Google Scholar] [CrossRef]
  9. Novitzky, S.; Pender, J.; Rand, R.H.; Wesson, E. Limiting the oscillations in queues with delayed information through a novel type of delay announcement. Queueing Syst. 2020, 95, 281–330. [Google Scholar] [CrossRef]
  10. Pender, J.; Rand, R.H.; Wesson, E. A stochastic analysis of queues with customer choice and delayed information. Math. Oper. Res. 2020, 45, 1104–1126. [Google Scholar] [CrossRef]
  11. Doldo, P.; Pender, J.; Rand, R.H. Breaking the symmetry in queues with delayed information. Int. J. Bifurcat. Chaos 2021, 31, 2130027. [Google Scholar] [CrossRef]
  12. Collera, J.A. Spontaneous symmetry-breaking in deterministic queueing models with delayed information. In Recent Developments in Mathematical, Statistical and Computational Sciences. AMMCS 2019. Springer Proceedings in Mathematics & Statistics; Kilgour, D.M., Kunze, H., Makarov, R., Melnik, R., Wang, X., Eds.; Springer: Cham, Switzerland, 2021; Volume 343, pp. 15–25. [Google Scholar] [CrossRef]
  13. Lakrad, F.; Pender, J.; Rand, R. Queues with delayed information: A dynamical systems perspective. SIAM J. Appl. Dyn. Syst. 2022; in press. [Google Scholar]
  14. Golubitsky, M.; Stewart, I.; Schaeffer, D.G. Singularities and Groups in Bifurcation Theory II; Springer: New York, NY, USA, 1988. [Google Scholar]
  15. Golubitsky, M.; Stewart, I. The Symmetry Perspective: From Equilibrium to Chaos in Phase Space and Physical Space; Birkhauser Verlag: Basel, Switzerland, 2003. [Google Scholar]
  16. Buono, P.-L.; Collera, J.A. Symmetry-breaking bifurcations in rings of delay-coupled semiconductor lasers. SIAM J. Appl. Dyn. Syst. 2015, 14, 1868–1898. [Google Scholar] [CrossRef]
  17. Campbell, S.A.; Yuan, Y.; Bungay, S.D. Equivariant Hopf bifurcation in a ring of identical cells with delayed coupling. Nonlinearity 2005, 18, 2827–2846. [Google Scholar] [CrossRef]
  18. Collera, J.A. Symmetry-breaking bifurcations in two mutually delay-coupled lasers. Phil. Sci. Tech. 2015, 8, 17–21. [Google Scholar] [CrossRef] [Green Version]
  19. Palacios, A. Synchronization in asymmetrically coupled networks with homogeneous oscillators. Phys. Rev. E 2021, 103, 022206. [Google Scholar] [CrossRef]
  20. Brauer, F. Absolute stability in delay equations. J. Differ. Equ. 1987, 69, 185–191. [Google Scholar] [CrossRef] [Green Version]
  21. Stewart, I. Spontaneous symmetry-breaking in a network model for quadruped locomotion. Int. J. Bifurcat. Chaos 2017, 27, 1730049. [Google Scholar] [CrossRef]
  22. Wu, J. Symmetric functional differential equations and neural networks with memory. Trans. Am. Math. Soc. 1998, 350, 4799–4838. [Google Scholar] [CrossRef]
  23. Collera, J.A. Numerical continuation and bifurcation analysis in a harvested predator-prey model with time delay using DDE-Biftool. In Dynamical Systems, Bifurcation Analysis and Applications. DySBA 2018. Springer Proceedings in Mathematics & Statistics; Mohd, M., Abdul Rahman, N., Abd Hamid, N., Mohd Yatim, Y., Eds.; Springer: Singapore, 2019; Volume 295, pp. 225–241. [Google Scholar] [CrossRef]
  24. Engelborghs, K.; Luzyanina, T.; Samaey, G. DDE-BIFTOOL v. 2.00: A Matlab Package for Bifurcation Analysis of Delay Differential Equations; Department of Computer Science, K. U. Leuven: Leuven, Belgium, 2001. [Google Scholar]
  25. Engelborghs, K.; Luzyanina, T.; Roose, D. Numerical bifurcation analysis of delay differential equations using DDE-Biftool. ACM Trans. Math. Softw. 2002, 28, 1–21. [Google Scholar] [CrossRef]
  26. Luzyanina, T.; Sieber, J.; Engelborghs, K.; Samaey, G.; Roose, D. Numerical bifurcation analysis of mathematical models with time delays with the package DDE-BIFTOOL. Mat. Biolog. Bioinform. 2017, 12, 496–520. [Google Scholar] [CrossRef]
  27. Sieber, J.; Engelborghs, K.; Luzyanina, T.; Samaey, G.; Roose, D. DDE-BIFTOOL v.3.1.1 Manual—Bifurcation analysis of delay differential equations. arXiv 2014, arXiv:1406.7144v4. [Google Scholar]
  28. Rand, R. Differential-delay equations. In Complex Systems: Fractionality, Time-delay and Synchronization; Luo, A.C.J., Sun, J.-Q., Eds.; Springer: Berlin/Heidelberg, Germany, 2011. [Google Scholar] [CrossRef]
  29. Bellman, R.; Cooke, K.L. Differential-Difference Equations; Academic Press: New York, NY, USA, 1963. [Google Scholar]
  30. Diekmann, O.; van Gils, S.A.; Lunel, S.M.V.; Walther, H.-O. Delay Equations: Functional-, Complex-, and Nonlinear Analysis; Springer: New York, NY, USA, 1995. [Google Scholar]
  31. Hale, J.K.; Verduyn Lunel, S.M. Introduction to Functional Differential Equations; Springer: New York, NY, USA, 1993. [Google Scholar]
  32. Smith, H. An Introduction to Delay Differential Equations with Applications to the Life Sciences; Springer: New York, NY, USA, 2011. [Google Scholar]
  33. Kuang, Y. Delay Differential Equations with Applications in Population Dynamics; Academic Press: San Diego, CA, USA, 1993. [Google Scholar]
  34. Rihan, F.A. Delay Differential Equations and Applications to Biology; Springer: Singapore, 2021. [Google Scholar]
  35. Ruan, S.; Wei, J. On the zeros of transcendental functions with applications to stability of delay differential equations with two delays. Dynam. Cont. Dis. Ser. A 2003, 10, 863–874. [Google Scholar]
  36. Krisztin, T.; Liz, E. Bubbles for a class of delay differential equations. Qual. Theory Dyn. Syst. 2011, 10, 169–196. [Google Scholar] [CrossRef]
  37. Liu, M.; Liz, E.; Röst, G. Endemic bubbles generated by delayed behavioral response: Global stability and bifurcation switches in an SIS model. SIAM J. Appl. Math. 2015, 75, 75–91. [Google Scholar] [CrossRef] [Green Version]
  38. LeBlanc, V.G. A degenerate Hopf bifurcation in retarded functional differential equations, and applications to endemic bubbles. J. Nonlinear Sci. 2016, 26, 1–25. [Google Scholar] [CrossRef] [Green Version]
  39. Guo, S.; Wu, J. Bifurcation Theory of Functional Differential Equations; Springer: New York, NY, USA, 2013. [Google Scholar]
  40. Kuznetsov, Y.A. Elements of Applied Bifurcation Theory; Springer: New York, NY, USA, 2004. [Google Scholar]
  41. Tehrani, N.F.; Razvan, M. Bifurcation structure of two coupled FHN neurons with delay. Math. Biosci. 2015, 270, 41–56. [Google Scholar] [CrossRef] [PubMed] [Green Version]
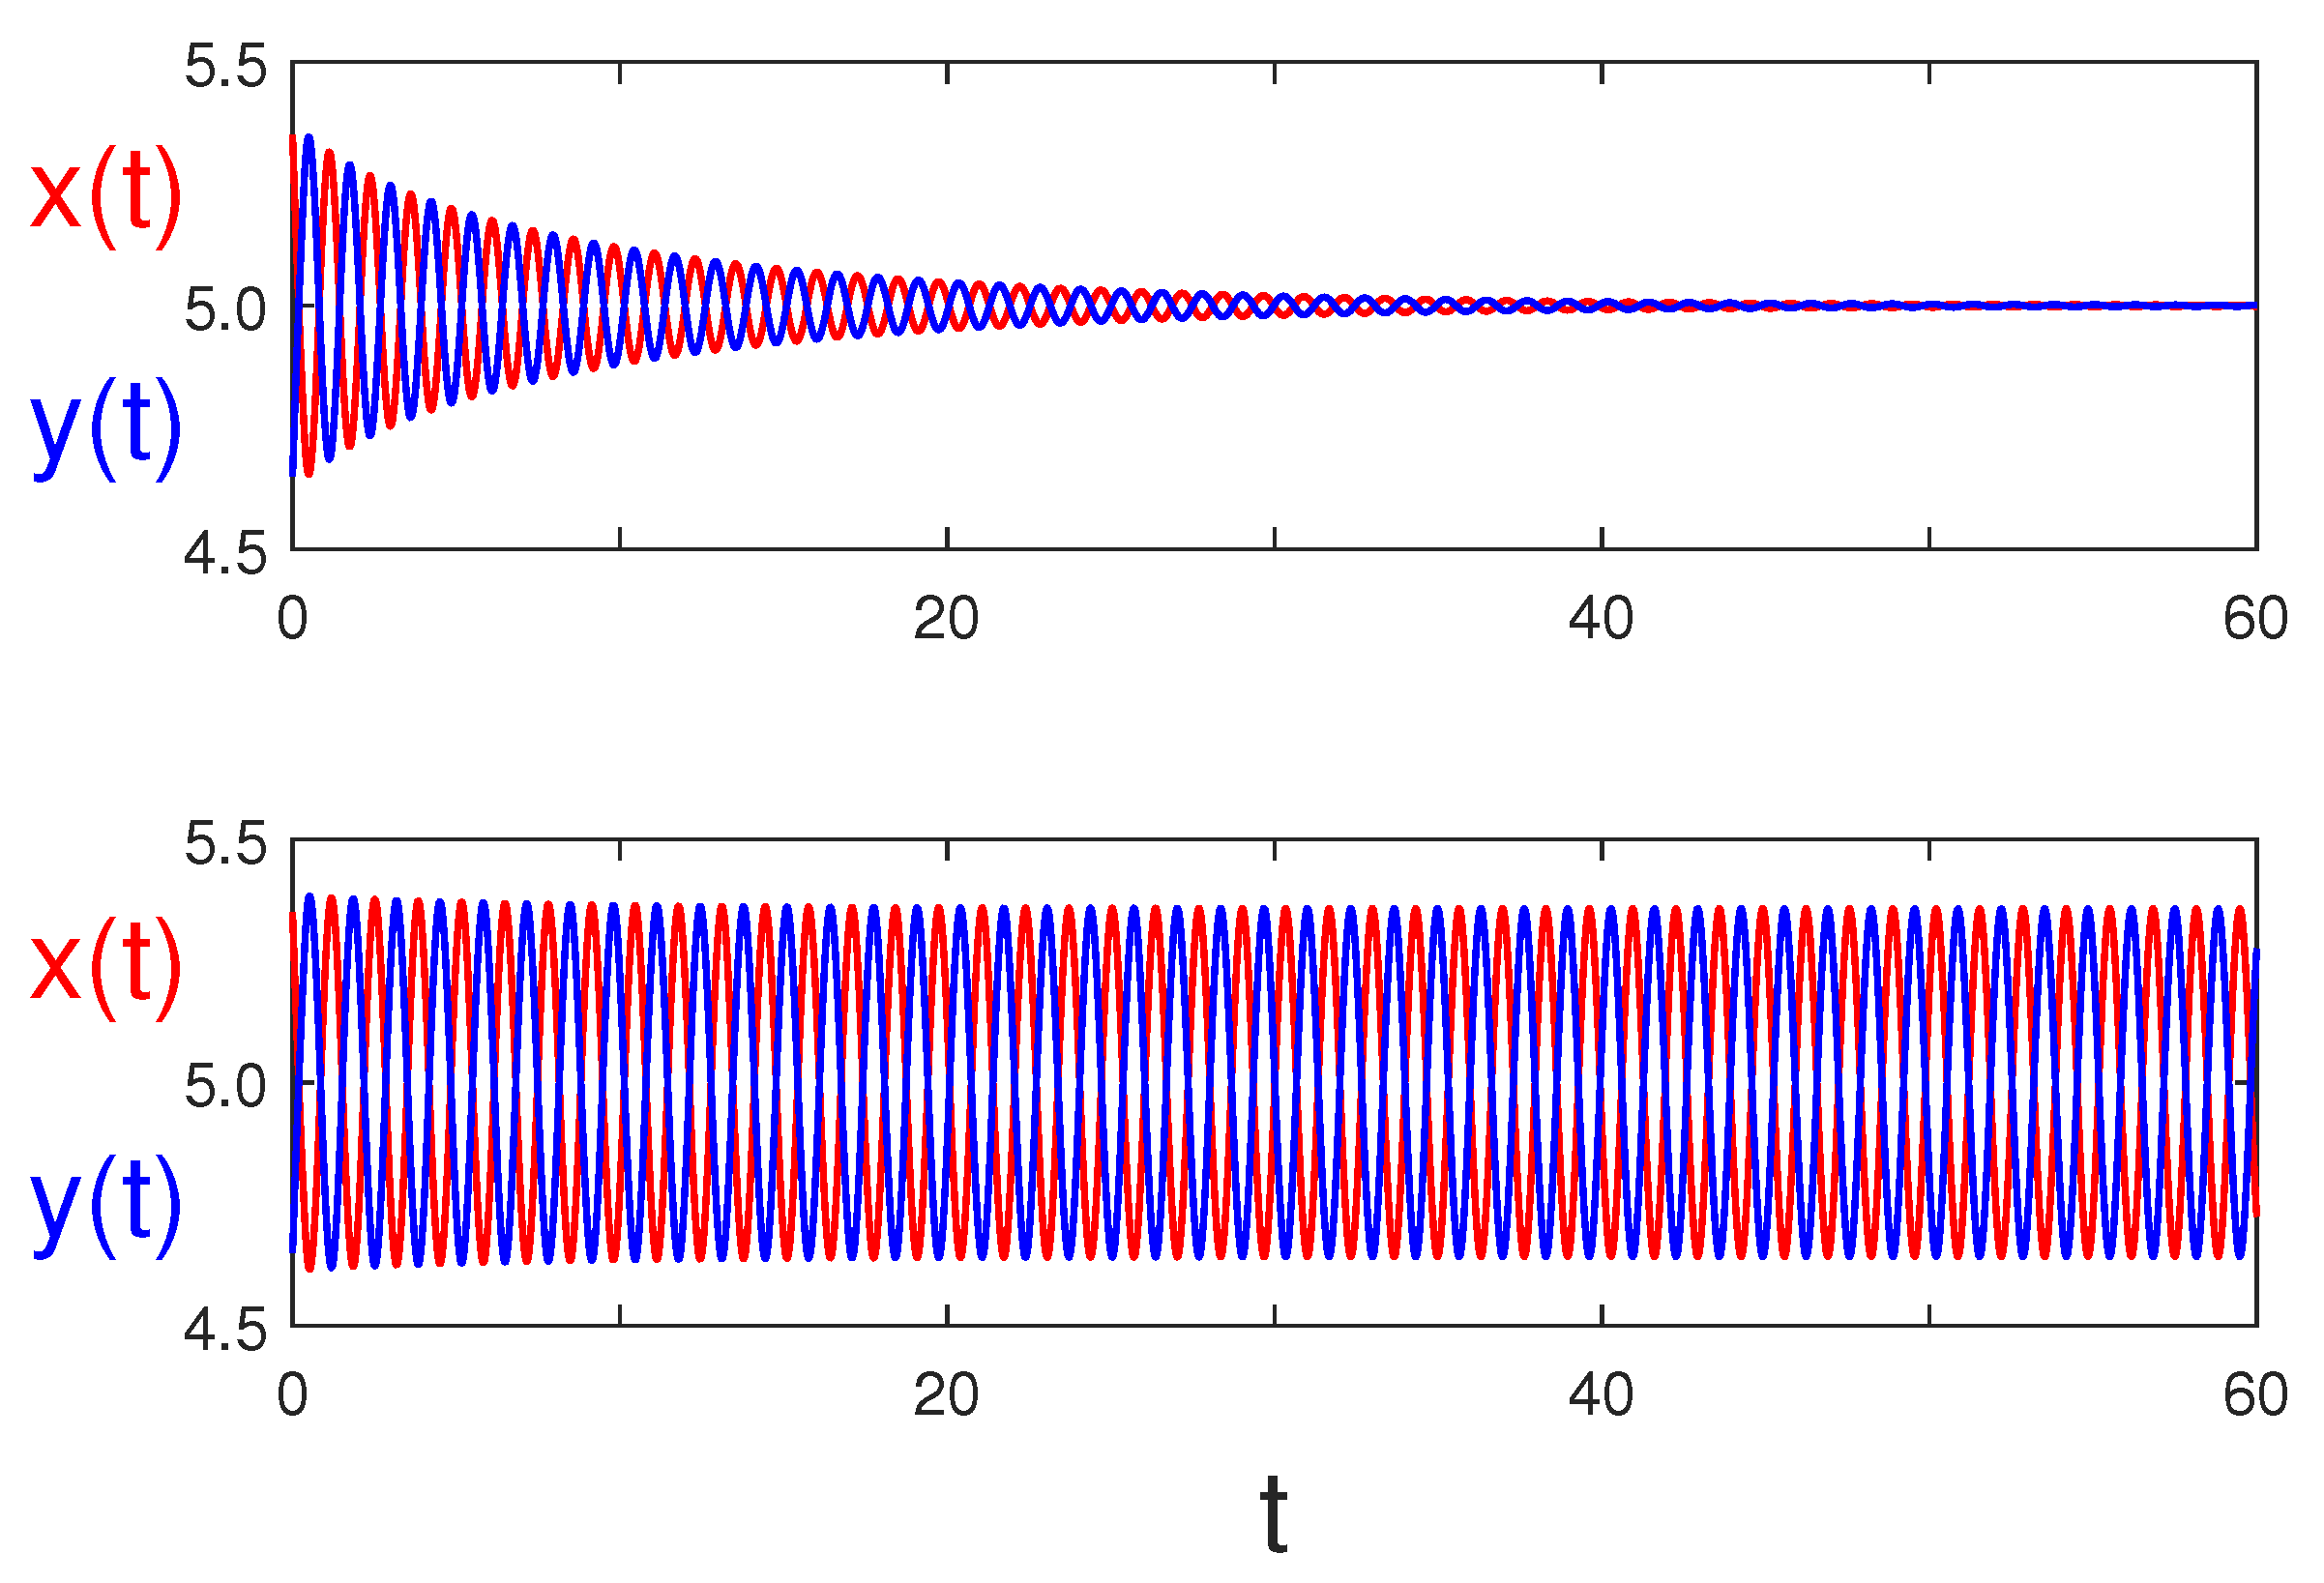
Figure 1. Time series plots of x ( t ) in red and y ( t ) in blue for τ = 0.345 (top row) and τ = 0.375 (bottom row), showing the change of stability of the equilibrium E * = ( 5 , 5 ) of the system (2) with a = 10 and b = 1 at τ = τ c 0.361739 where a Hopf bifurcation occurred.
Symmetry 14 00376 g001
Figure 2. Branches of limit-cycle solutions to the system (7) with a = 10 , b = 1 and N = 4 emerging from the symmetry-breaking Hopf bifurcation marked with asterisk (*). Limit cycles from the green branch (Type 1) are asymptotically stable while limit cycles from the magenta branches (Types 2–4) are unstable.
Symmetry 14 00376 g002
Figure 3. Profile plot of the four different types of limit-cycle solutions that emerged from the symmetry-breaking Hopf bifurcation. (a) Type 1. (b) Type 2. (c) Type 3. (d) Type 4.
Symmetry 14 00376 g003
Figure 4. Graph of the even function F ( ω ) given in Equation (23) with coefficients a = 10 and b = 1 . For σ = 0.300 , F does not have any positive roots (left). For σ = 0.345 , F has two positive roots denoted by ω 2.862919 and ω + 4.878345 (right).
Symmetry 14 00376 g004
Figure 5. Branch of equilibria obtained by fixing σ = 0.345 and varying the time delay parameter τ in the system (1) with a = 10 and b = 1 . Hopf bifurcations at values of τ listed in Table 1 are marked with (*). Stable parts of the branch are in green, while unstable parts are in magenta.
Symmetry 14 00376 g005
Figure 6. Branches of limit cycles that emerged from the Hopf bifurcations marked with (*). Stability switches along these limit-cycle branches occur at torus bifurcations marked with (☐).
Symmetry 14 00376 g006
Figure 7. A magnification of Figure 6 around the first two torus bifurcations at τ = τ 1 T B 3.028636 and τ = τ 2 T B 3.107698 . Two stable limit cycles coexist for values of τ in the interval ( τ 1 T B , τ 2 T B ) .
Symmetry 14 00376 g007
Figure 8. Floquet multipliers before and after the first torus bifurcation at τ = τ 1 T B 3.028636 on the third limit-cycle branch showing the switch towards stability along this branch at τ = τ 1 T B . Floquet multipliers outside the unit circle are shown in red.
Symmetry 14 00376 g008
Figure 9. Floquet multipliers before and after the second torus bifurcation at τ = τ 2 T B 3.107698 on the second limit-cycle branch showing the switch towards instability along this branch at τ = τ 2 T B . Floquet multipliers outside the unit circle are shown in red.
Symmetry 14 00376 g009
Figure 10. Time series plots and phase portraits of the two stable limit-cycle solutions to the system (1) with a = 10 , b = 1 , σ = 0.345 and τ = 3.07 . The limit cycles were generated using two different sets of initial history. The top row was obtained using ( ϕ 1 ( t ) , ϕ 2 ( t ) ) = ( 5.25 , 5.25 ) for t [ τ , 0 ] , while for the bottom row ( ϕ 1 ( t ) , ϕ 2 ( t ) ) = ( 5.50 , 5.50 ) for t [ τ , 0 ] was used.
Symmetry 14 00376 g010
Figure 11. Plots of Hopf bifurcation curves in τ σ -plane. These curves intersect at double Hopf bifurcations marked with (⋄). The equilibrium E * is locally asymptotically stable for values of time delays σ and τ where ( τ , σ ) is inside the gray-shaded region. The dashed line shows the curve where σ = τ .
Symmetry 14 00376 g011
Figure 12. A magnification of Figure 11, and showing the horizontal dashed lines σ = 0.300 and σ = 0.345 .
Symmetry 14 00376 g012
Figure 13. Neighborhood of the second double-Hopf bifurcation (⋄) in τ σ -plane showing regions A, B, C, D, E and F. These regions are separated by branches of Hopf bifurcations (red and blue solid curves) and branches of torus bifurcations (green and cyan dashed curves). The horizontal line σ = 0.345 passes through regions B, C, D, E and F.
Symmetry 14 00376 g013
Table 1. Critical time delays.
k τ k + τ k
00.3818790.987096
11.6698543.181774
22.9578285.376453
34.2458037.571131
45.5337789.765809
56.82175211.960487
Publisher’s Note: MDPI stays neutral with regard to jurisdictional claims in published maps and institutional affiliations.