
Fair Outlier Detection Based on Adversarial Representation Learning


Abstract
:1. Introduction
- We discuss the fairness of outlier detection and characteristic the four properties of fair outlier detection. Further, we propose three metrics for measuring the fairness of outlier detection from three different perspectives (statistical parity, equality of opportunity, and conditional use accuracy equality).
- We combine the density-based LOF method with fair representation learning to optimize the effectiveness and group fairness of outlier detection by learning fairness representations of the original data through adversarial training.
- We use local outlier factors to represent the outlier scores of data and assign lower weight values to data with higher outlier scores by adjusting the dynamic weights to mitigate the impact of outliers on representation learning.
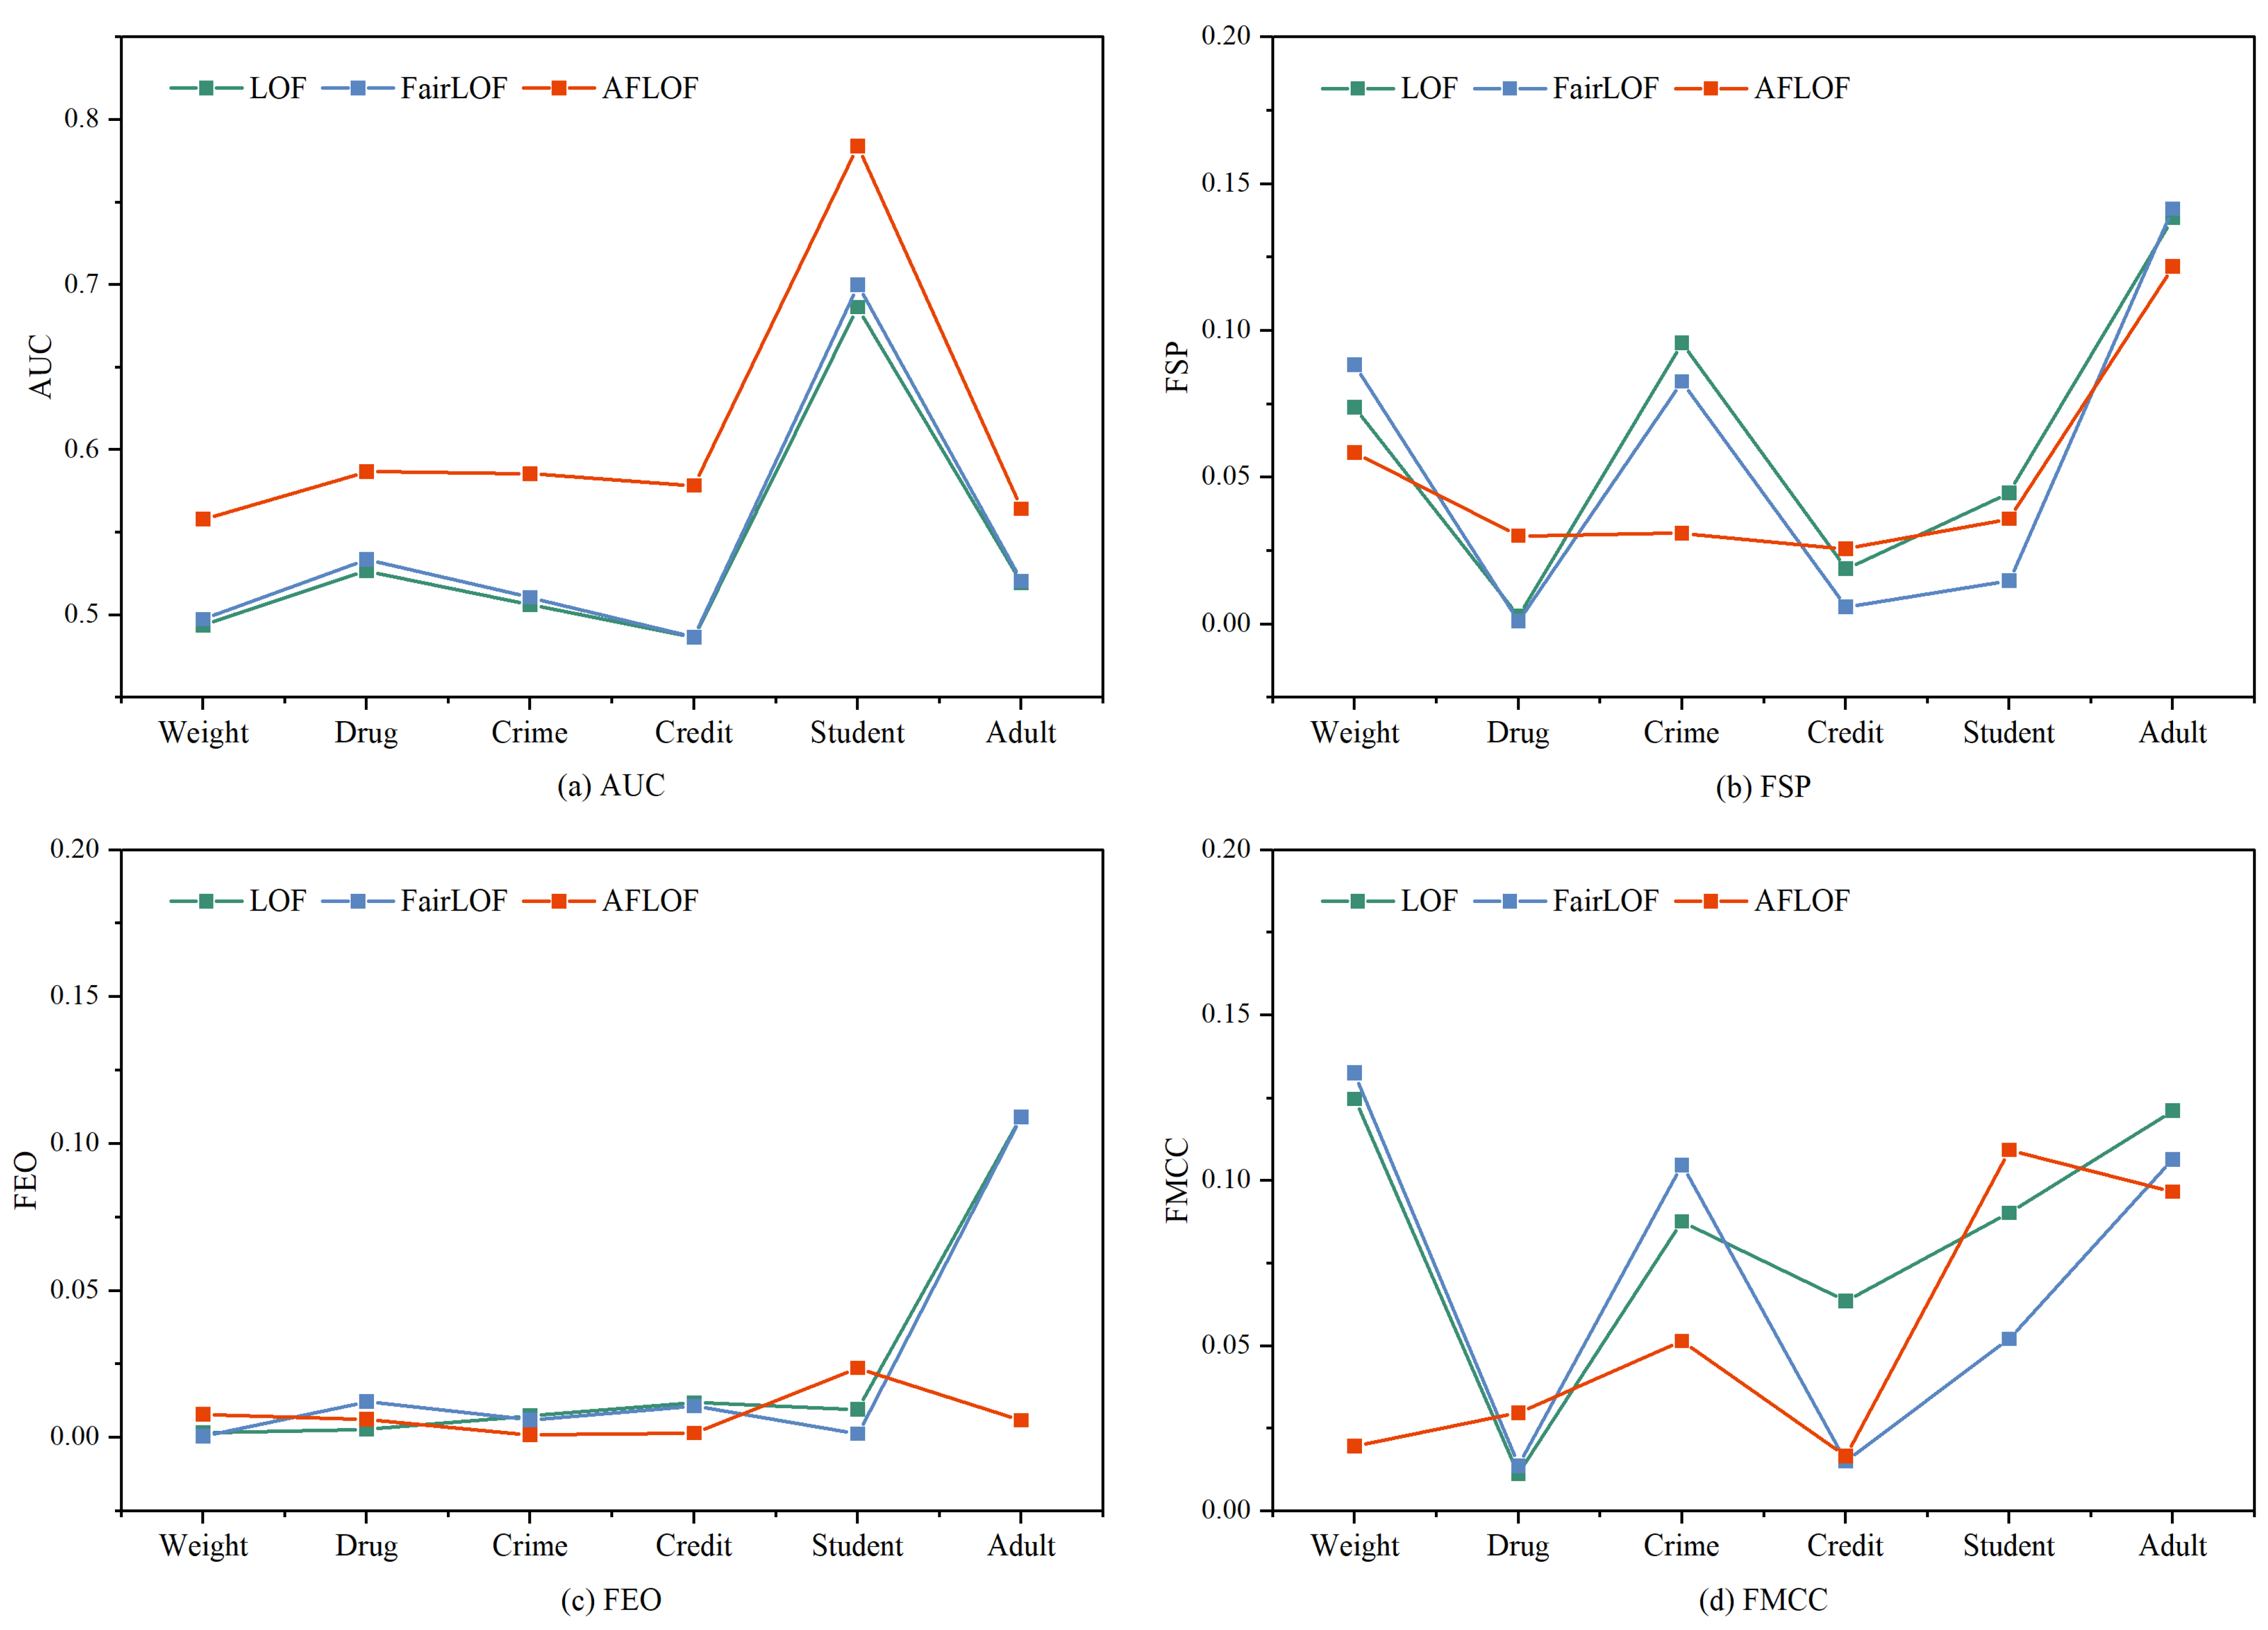
- We conduct several experiments on six public datasets from different real-world domains. The results demonstrate the significant advantages of our proposed AFLOF method over the LOF method and the FairLOF method in terms of fairness and performance.
2. Materials and Methods
2.1. Datasets
2.2. Preliminary
2.2.1. Notion of Fair Outlier Detection
- Effective detection. The primary task of outlier detection methods is to ensure detection performance. It makes sense to consider fairness only if the outlier detection methods can accurately and efficiently identify outliers. The fair outlier detection model needs to meet the following condition (see Equation (1)) to ensure effectiveness.
- Statistical parity [19]. Statistical parity means that outlier detection is independent of sensitive attributes; that is, outlier detection performance among sensitive attribute subgroups should be consistent. The fair outlier detection model needs to meet the following condition (see Equation (2)) to ensure statistical parity.
- Equality of opportunity [20]. Equality of opportunity requires fairness in the target group. In outlier detection, equal opportunity means that outliers should be given higher scores and flagged regardless of the sensitive genus subgroup they belong to. The fair outlier detection model needs to meet the following condition (see Equation (3)) to ensure equality of opportunity.
- Conditional use accuracy equality [27]. In outlier detection, conditional use accuracy equality implies that the probability of true positive and true negative rates among sensitive attribute subgroups should be the same. The fair outlier detection model needs to meet the following condition (see Equation (4)) to ensure conditional use accuracy equality.
2.2.2. Evaluation Metrics
- Outlier detection performance. The Receiver Operating Characteristic Curve (ROC) is used to measure the classification performance [28]. The x-axis of the ROC curve is the false positive rate (TP/(TP + FN)), and the y-axis is the true positive rate (FP/(FP + TN)). Area Under Receiver Operating Characteristic Curve (AUC) is the area under the ROC curve, where a higher value means better outlier detection performance. AUC represents the diagnostic ability of outlier detection at each scoring threshold. Therefore, we will use the AUC score to measure the outlier detection performance. AUC is defined as follows (see Equation (5)).
- Fairness performance.
- We will measure whether the outlier detection algorithm achieves statistical parity by comparing the difference in detection effectiveness on each sensitive attribute subgroup. Specifically, we calculate the AUC score for every sensitive attribute subgroup and assign Fair Statistical Parity (FSP) with the value of the most significant gap among AUC scores. We represent the number of sensitive attribute subgroups as M and denote FSP as follows (see Equation (6)).
- We will measure the equality of opportunity of the outlier detection methods by comparing the distribution of sensitive attribute subgroups over the outlier candidates and the entire dataset. We use P to represent the sensitive attribute subgroup distribution in the dataset and Q to describe the distribution of sensitive attribute subgroup in the top 5% outlier candidates. To be specific, we sort the data in descending order by local outlier factors and use relative entropy (also known as Kullback Leibler (KL) divergence) to calculate the difference between P and Q. Then, we assign Fair Equality of Opportunity the most apparent distribution difference value. The definition of FEO is as follows (see Equation (7)).
- The Matthews Correlation Coefficient (MCC) [29] is a metric used to measure binary classification performance, considering true positive, true negative, false positive, and false negative. MCC applies to unbalanced datasets and is one of the most appropriate evaluation metrics when considering the misclassification of detection results [30]. We will measure whether the algorithm achieves the conditional use accuracy equality by comparing MCC scores among sensitive attribute subgroups. To be specific, we calculate the MCC score for every sensitive attribute subgroup and assign Fair Matthews Correlation Coefficient (FMCC) with the value of the most significant gap among MCC scores. We denote FMCC as follows (see Equation (8)).The MCC is calculated based on the confusion matrix, which is calculated as follows (see Equation (9)).
FSP, FEO, and FMCC provide a more comprehensive measure of the fairness performance of outlier detection algorithms from three different perspectives. All three metrics are negative measurements, where a smaller value suggests higher fairness.
2.3. Methods
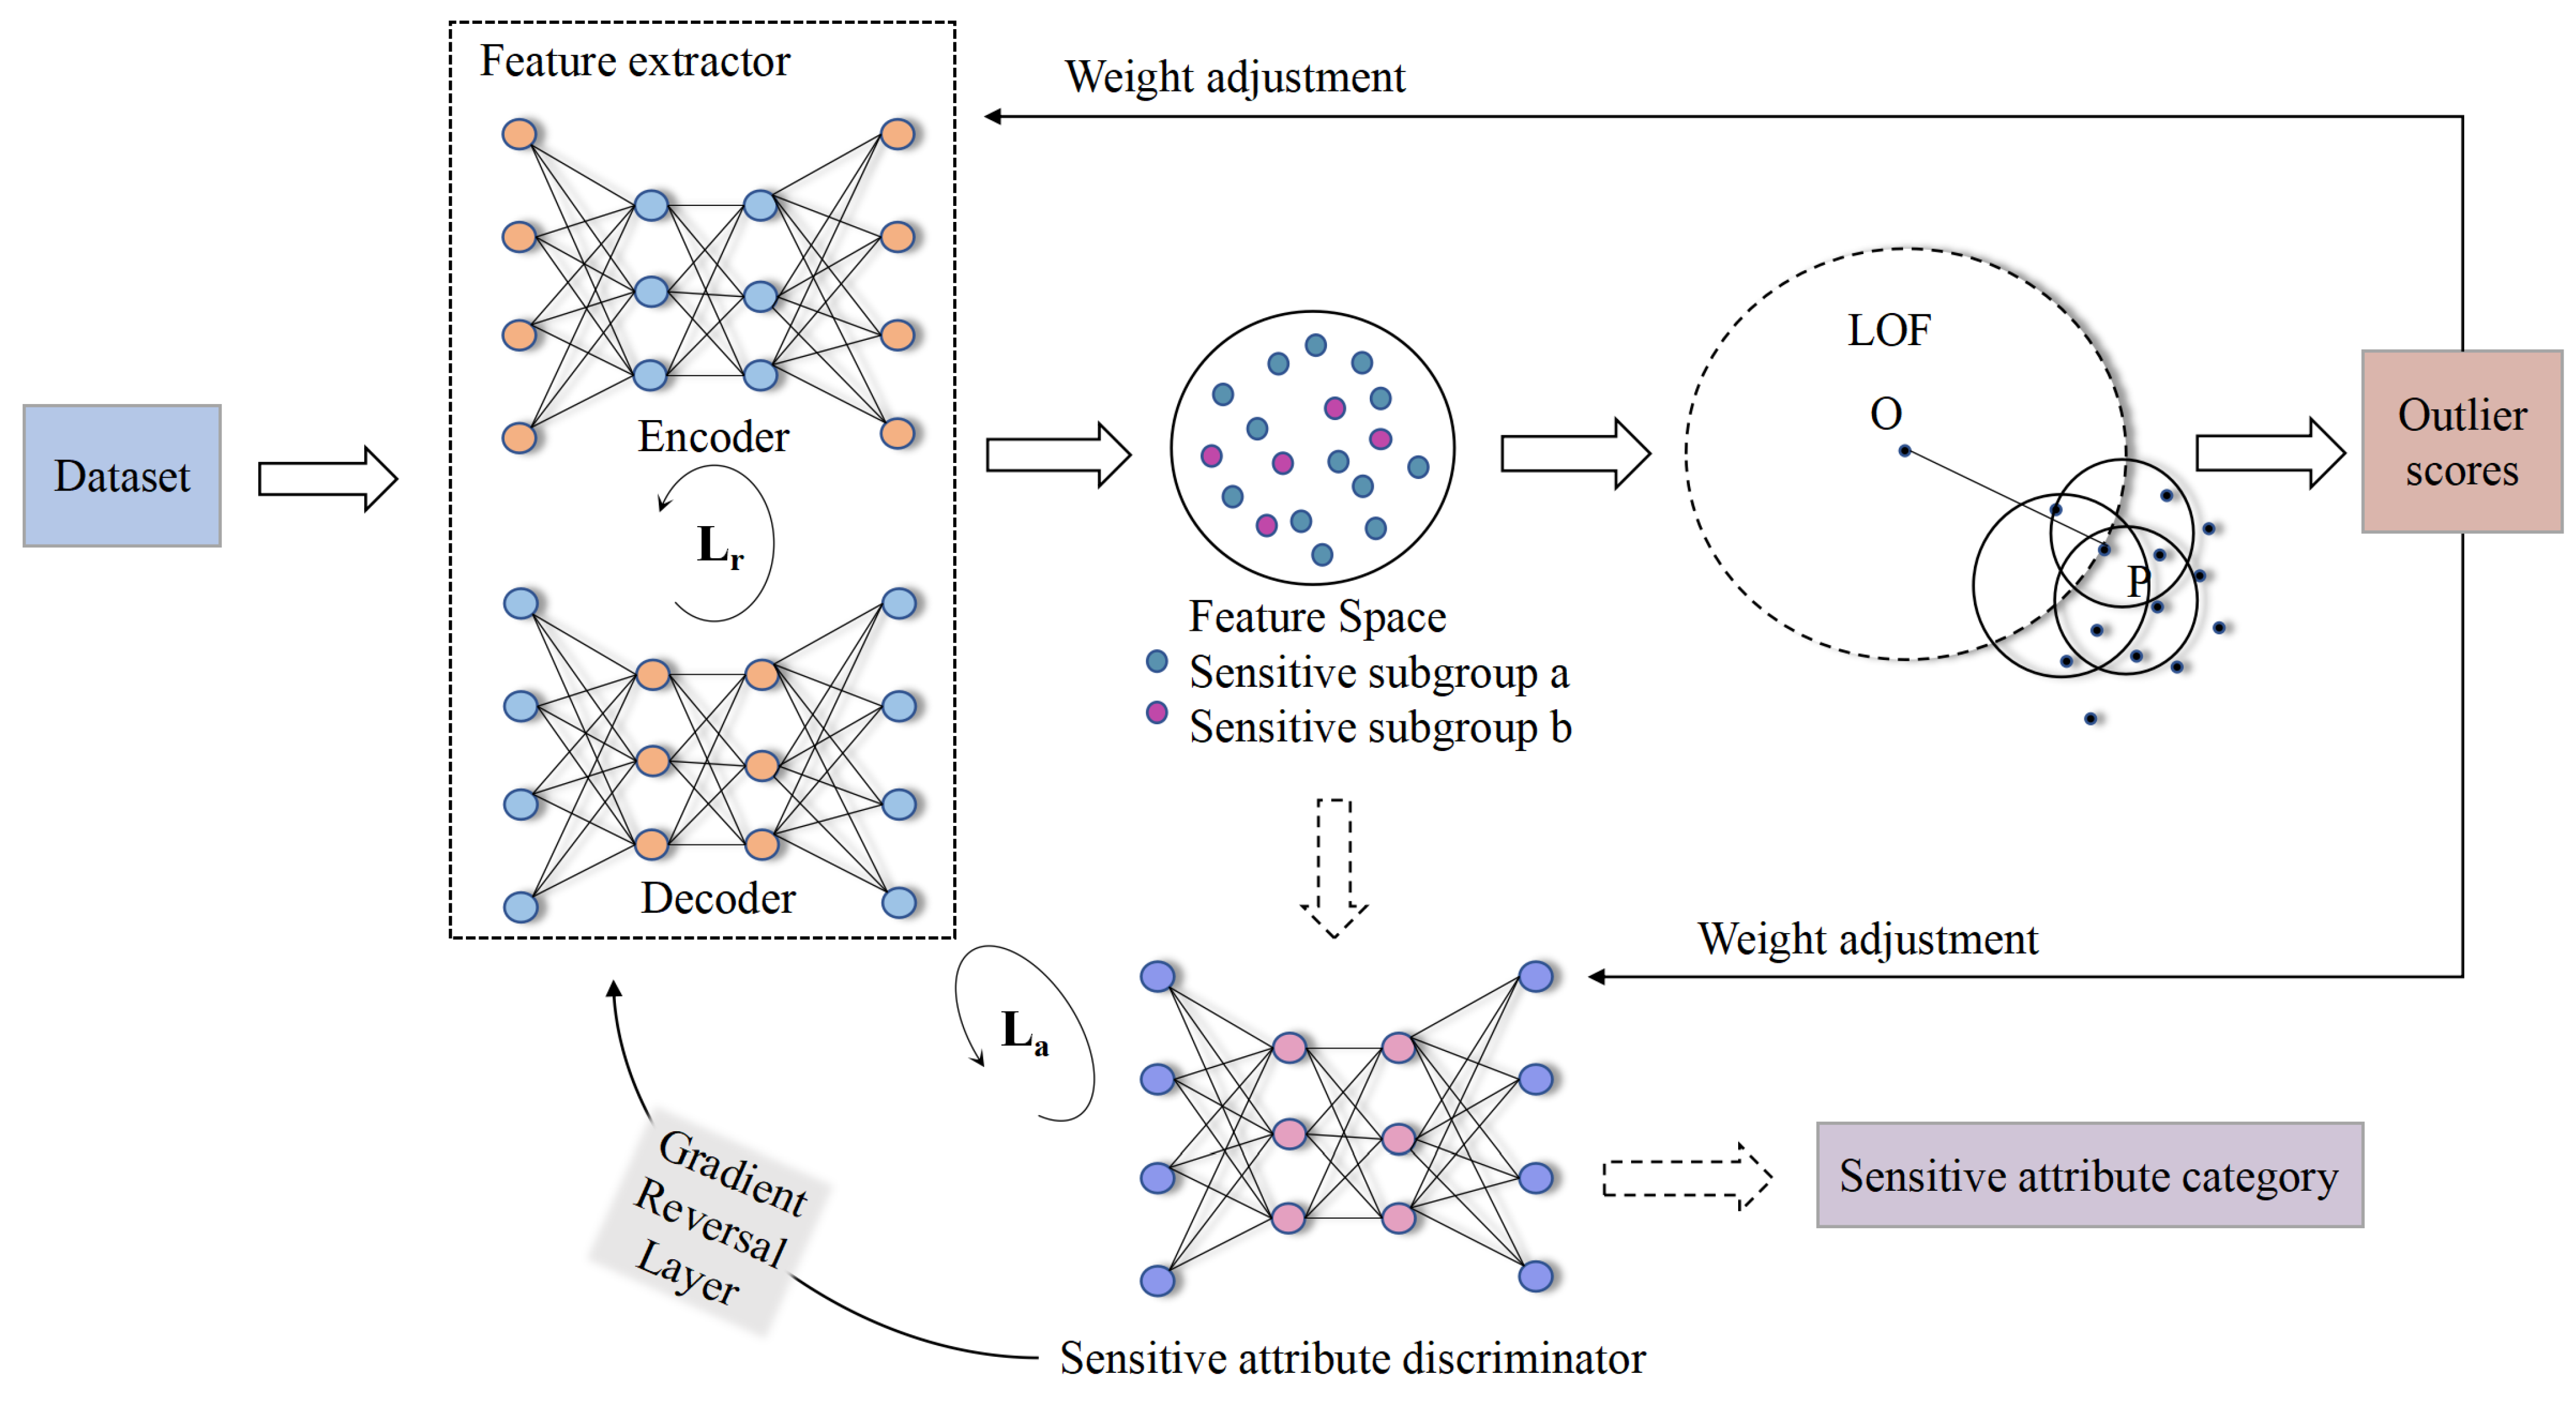
2.3.1. Model Overview
2.3.2. The Feature Extractor and the Sensitive Attribute Discriminator
2.3.3. The Outlier Detector
- K-distance. Let be the distance between and p. represents the set of k nearest neighbors of . For any data object , the of is defined as the furthest distance from to . The of a data object is defined as follows (see Equation (10)).
- Reachability Distance. If a data object is within the k neighborhood of p, the reachability distance between and p is the of p; otherwise, the reachability distance between and p is the real distance of x and p. The reachability distance of a data object is defined as follows (see Equation (11)).
- Local Reachability Density. For any data object , the local reachability density is the inverse of the average reachability distance from all data within the k neighborhood of to . The lower the local reachability density, the more likely it is to be an outlier. The local reachability density of a data object is defined as follows (see Equation (12)).
- Local Outlier Factor. The local outlier factor is the average ratio of the local reachability density of all data in the k neighborhood of to the local reachability density of , which indicates the degree of outliers of the data object . The larger the value, the more likely it is to be an outlier. The local outlier factor of a data object is defined as follows (see Equation (13)).
2.3.4. Dynamic Weights
2.3.5. Adversarially Fair Representation Learning
| Algorithm 1 AFLOF |
|
2.4. Implementation
3. Results
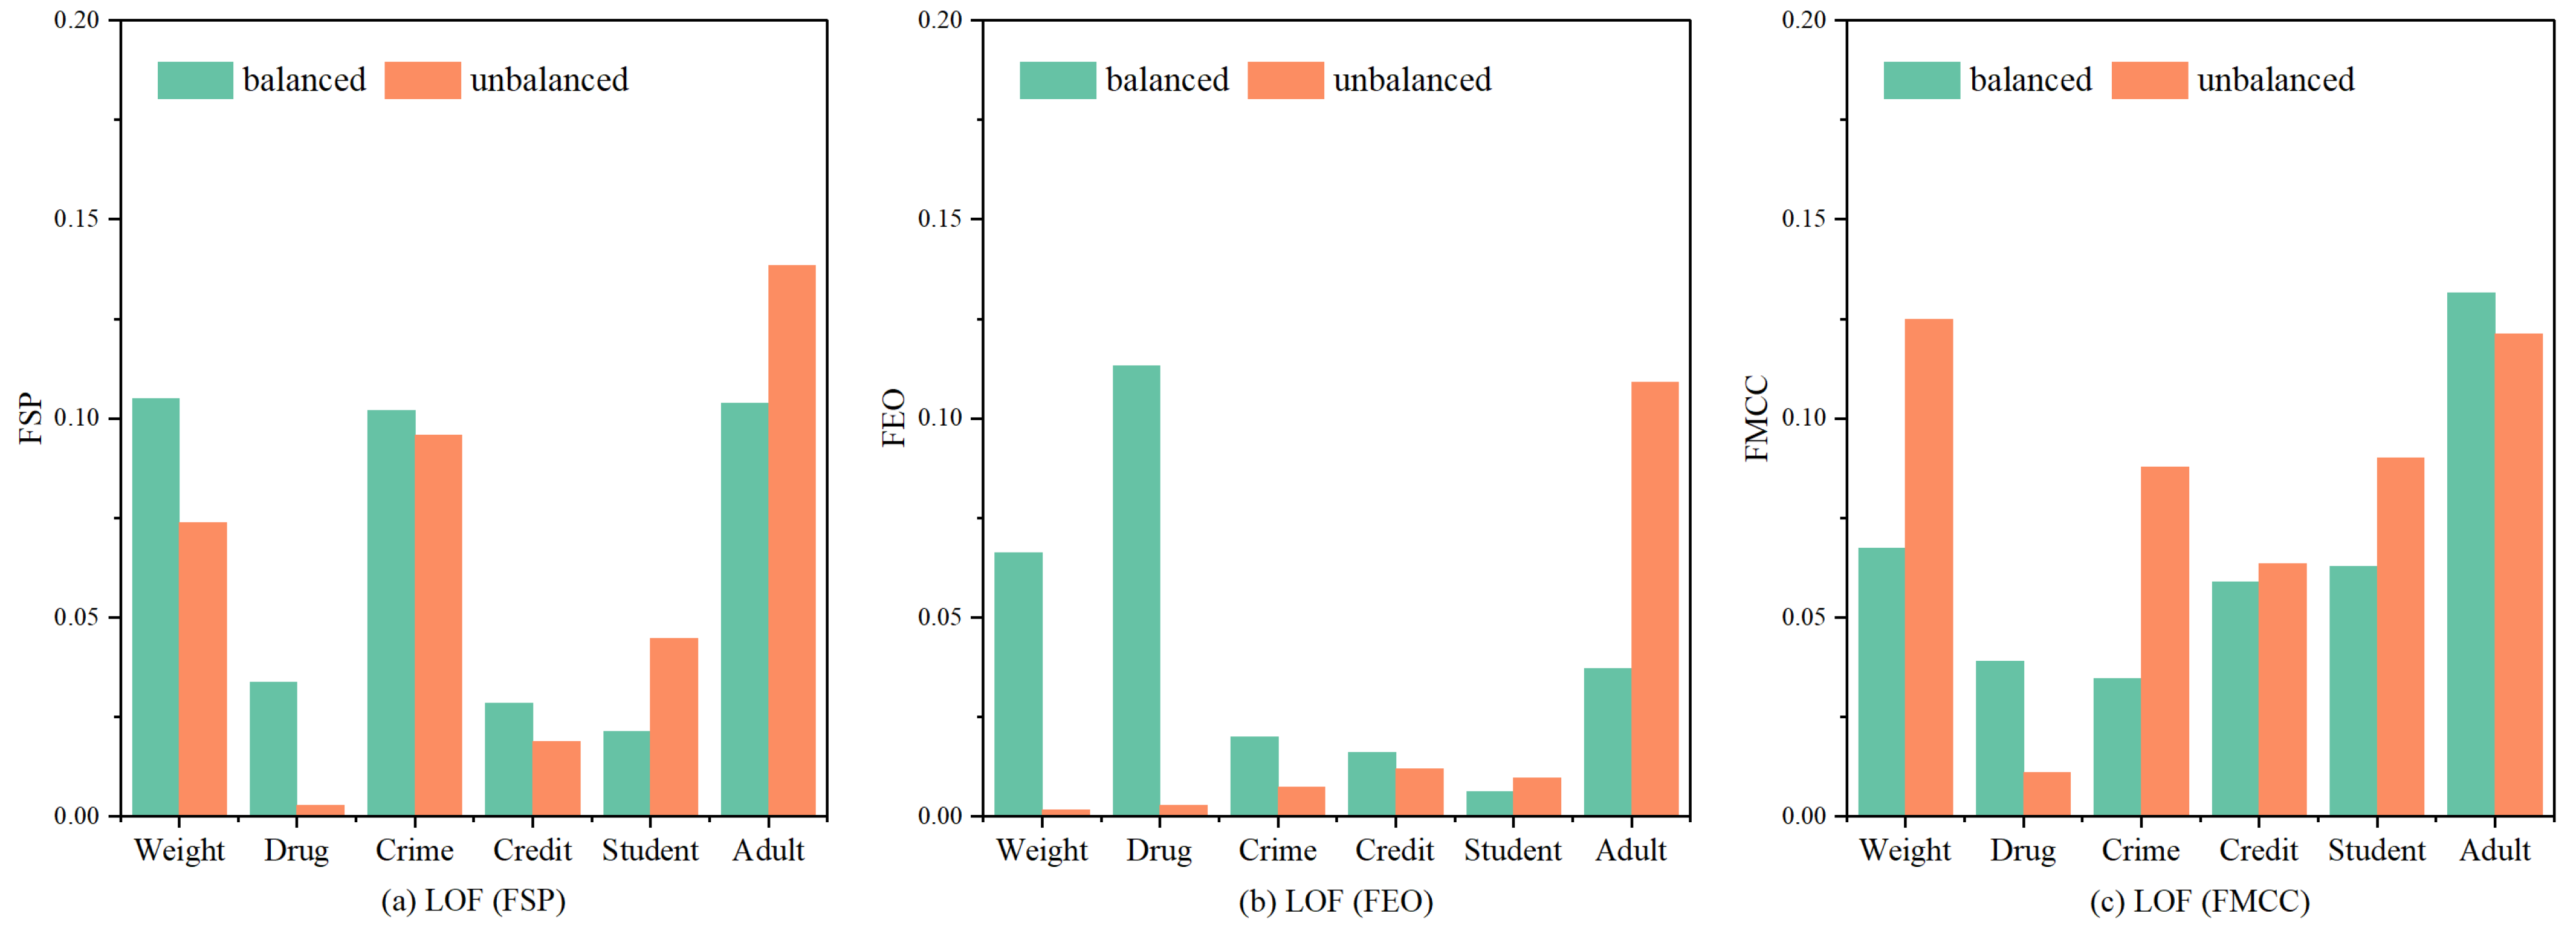
3.1. The Unfairness of LOF Algorithm
3.2. Evaluation
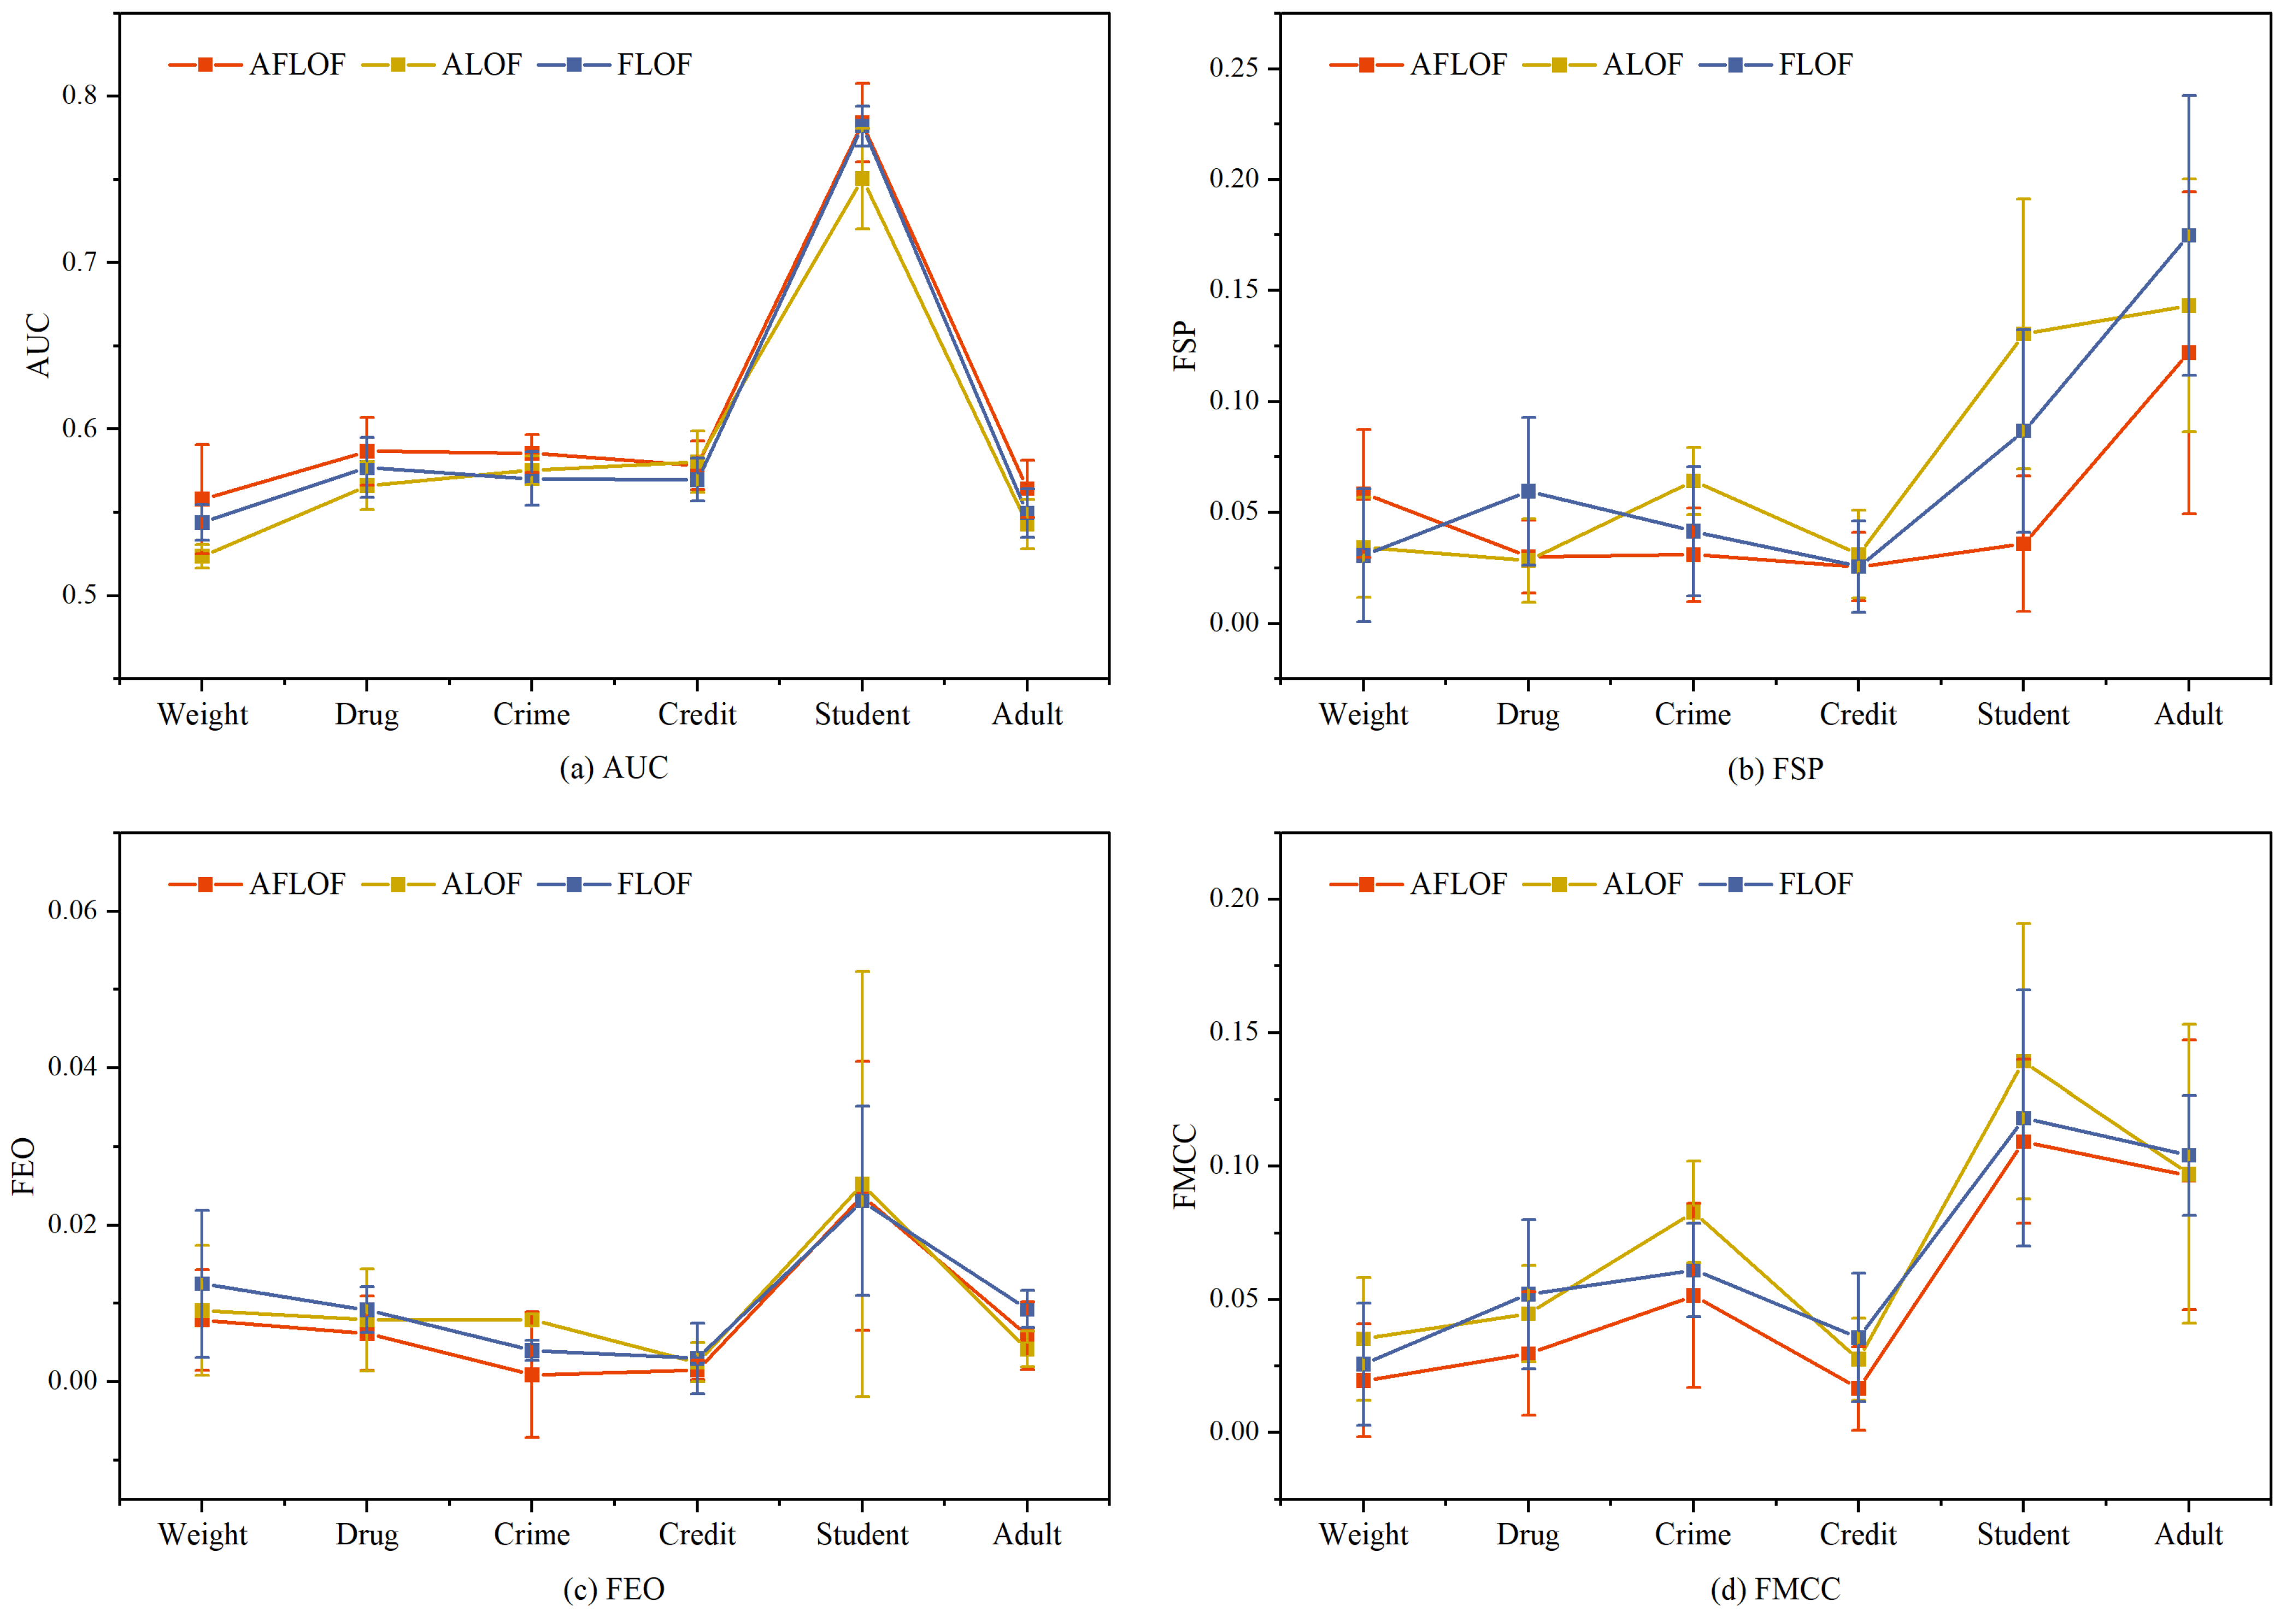
3.3. Ablation Study
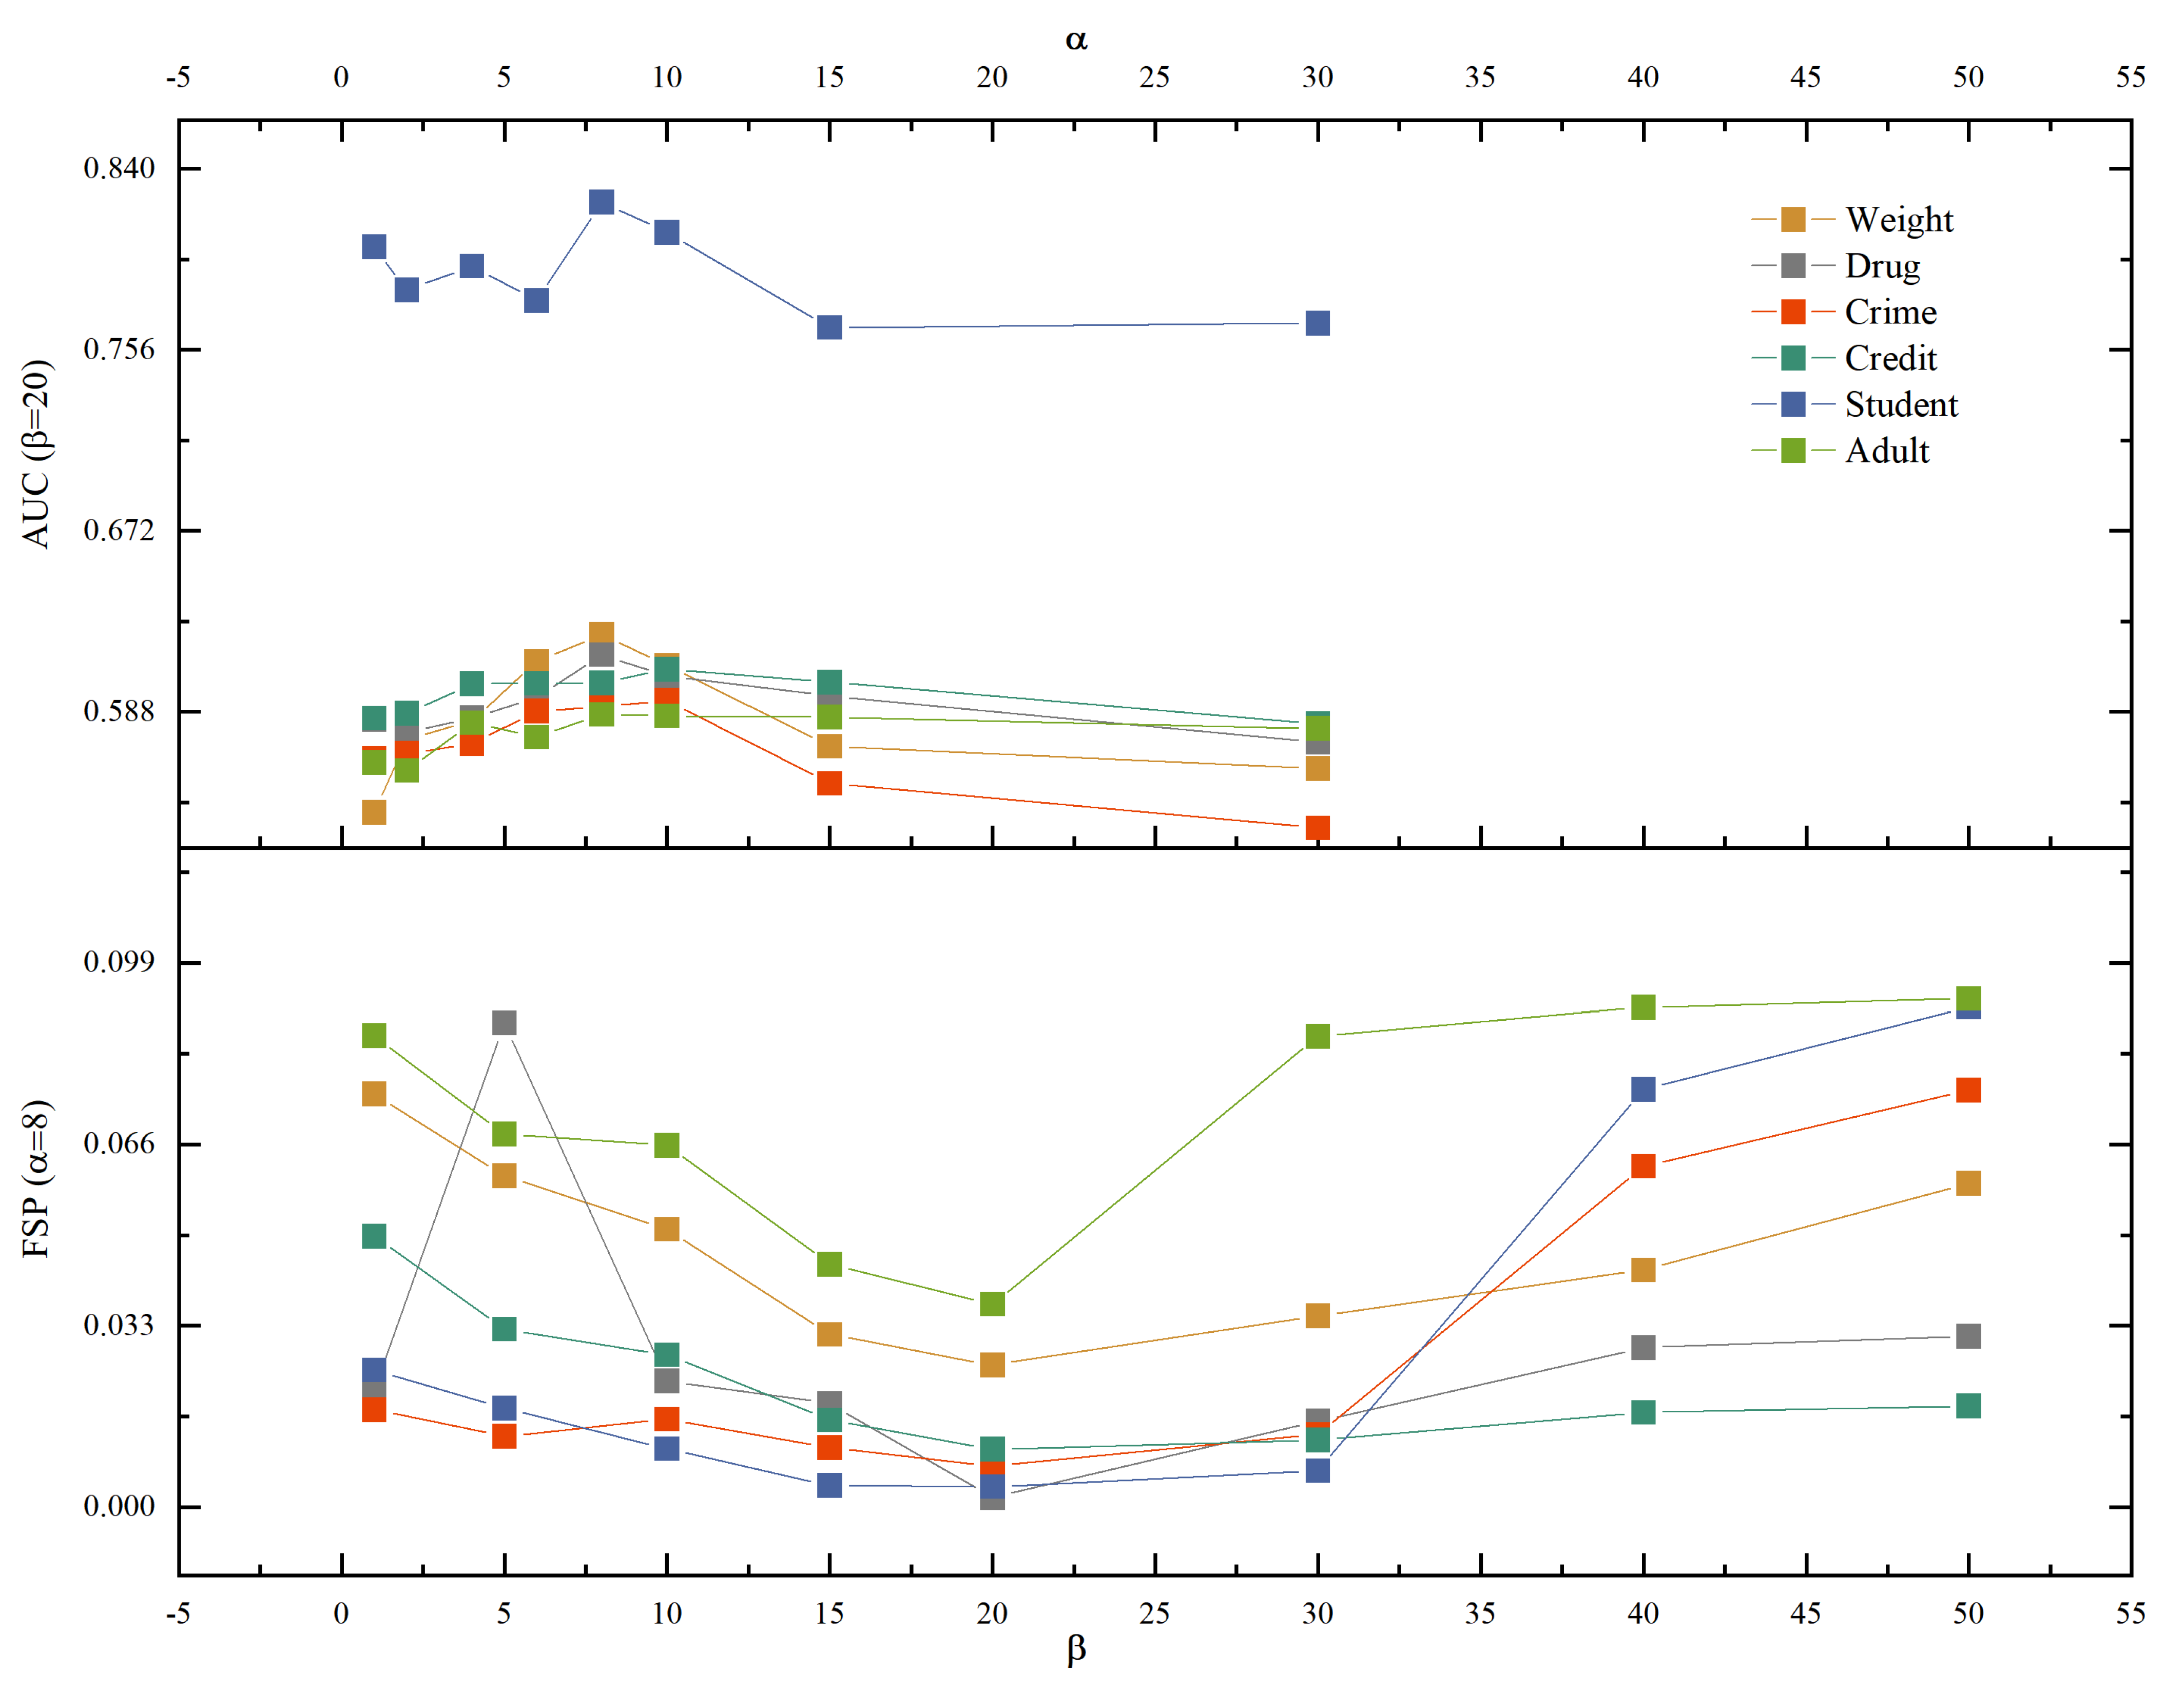
3.4. Trade-Off between Fairness Performance and Outlier Detection Performance
4. Discussion
- Our model eliminates redundant attribute information by mapping the original data to a feature space, which facilitates the detection of outliers by the LOF method.
- The outliers are further emphasized by the dynamic assignment of weights, which mitigates the negative impact of outliers on feature representation learning and enables the feature extractor to learn a better representation of the original data.
- The adversarial training between the encoder and the sensitive attribute discriminator enables the model to learn the optimized representation of the original data while hiding the sensitive attributes in the data.
- The dynamic assignment of weights further emphasizes outliers and enhances the fair representation of outliers in adversarial representation learning.
Author Contributions
Funding
Institutional Review Board Statement
Informed Consent Statement
Data Availability Statement
Acknowledgments
Conflicts of Interest
References
- Barocas, S.; Selbst, A.D. Big data’s disparate impact. Calif. Law Rev. 2016, 104, 671. [Google Scholar] [CrossRef]
- Bacchini, F.; Lorusso, L. Race, again: How face recognition technology reinforces racial discrimination. J. Inf. Commun. Ethics Soc. 2019, 17, 321–335. [Google Scholar] [CrossRef]
- Bolukbasi, T.; Chang, K.W.; Zou, J.Y.; Saligrama, V.; Kalai, A.T. Man is to computer programmer as woman is to homemaker? Debiasing word embeddings. In Proceedings of the 30th Annual Conference on Neural Information Processing Systems, Barcelona, Spain, 5–10 December 2016; pp. 4349–4357. [Google Scholar]
- Schnabel, T.; Swaminathan, A.; Singh, A.; Chandak, N.; Joachims, T. Recommendations as treatments: Debiasing learning and evaluation. In Proceedings of the 33rd International Conference on Machine Learning, New York, NY, USA, 19–24 June 2016; pp. 1670–1679. [Google Scholar]
- Huang, L.; Vishnoi, N. Stable and fair classification. In Proceedings of the 36th International Conference on Machine Learning, Long Beach, CA, USA, 9–15 June 2019; pp. 2879–2890. [Google Scholar]
- Zafar, M.B.; Valera, I.; Rogriguez, M.G.; Gummadi, K.P. Fairness constraints: Mechanisms for fair classification. In Proceedings of the 20th International Conference on Artificial Intelligence and Statistic, Fort Lauderdale, FL, USA, 20–22 April 2017; pp. 962–970. [Google Scholar]
- Li, P.; Zhao, H.; Liu, H. Deep fair clustering for visual learning. In Proceedings of the 2020 IEEE/CVF Conference on Computer Vision and Pattern Recognition, Seattle, WA, USA, 14–19 June 2020; pp. 9067–9076. [Google Scholar]
- Lambrecht, A.; Tucker, C. Algorithmic bias? An empirical study of apparent gender-based discrimination in the display of STEM career ads. Manag. Sci. 2019, 65, 2966–2981. [Google Scholar] [CrossRef]
- Kang, J.; He, J.; Maciejewski, R.; Tong, H. InFoRM: Individual fairness on graph mining. In Proceedings of the 26th ACM SIGKDD International Conference on Knowledge Discovery & Data Mining, New York, NY, USA, 6–10 July 2020; pp. 379–389. [Google Scholar]
- Li, B.; Li, L.; Sun, A.; Wang, C.; Wang, Y. Approximate group fairness for clustering. In Proceedings of the 38th International Conference on Machine Learning, Long Beach, CA, USA, 18–24 July 2021; pp. 6381–6391. [Google Scholar]
- Kearns, M.; Neel, S.; Roth, A.; Wu, Z.S. An empirical study of rich subgroup fairness for machine learning. In Proceedings of the Conference on Fairness, Accountability, and Transparency, Atlanta, GA, USA, 29–31 January 2019; pp. 100–109. [Google Scholar]
- Chiappa, S. Path-specific counterfactual fairness. In Proceedings of the 33rd AAAI Conference on Artificial Intelligence, Honolulu, HI, USA, 27 January–1 February 2019; pp. 7801–7808. [Google Scholar]
- Beutel, A.; Chen, J.; Doshi, T.; Qian, H.; Wei, L.; Wu, Y.; Heldt, L.; Zhao, Z.; Hong, L.; Chi, E.H.; et al. Fairness in recommendation ranking through pairwise comparisons. In Proceedings of the 25th ACM SIGKDD International Conference on Knowledge Discovery & Data Mining, Anchorage, AK, USA, 4–8 August 2019; pp. 2212–2220. [Google Scholar]
- Goodfellow, I.; Pouget-Abadie, J.; Mirza, M.; Xu, B.; Warde-Farley, D.; Ozair, S.; Courville, A.; Bengio, Y. Generative adversarial nets. In Proceedings of the 28th Annual Conference on Neural Information Processing Systems, Montreal, QC, Canada, 8–13 December 2014. [Google Scholar]
- Zhang, B.H.; Lemoine, B.; Mitchell, M. Mitigating unwanted biases with adversarial learning. In Proceedings of the 2018 AAAI/ACM Conference on AI, Ethics, and Society, New Orleans, LA, USA, 2–3 February 2018; pp. 335–340. [Google Scholar]
- Madras, D.; Creager, E.; Pitassi, T.; Zemel, R. Learning adversarially fair and transferable representations. In Proceedings of the 35th International Conference on Machine Learning, Stockholmsmässan, Stockholm, Sweden, 10–15 July 2018; pp. 3384–3393. [Google Scholar]
- Davidson, I.; Ravi, S.S. A framework for determining the fairness of outlier detection. In Proceedings of the 24th European Conference on Artificial Intelligence, Online and Santiago de Compostela, Spain, 29 August–8 September 2020; pp. 2465–2472. [Google Scholar]
- Deepak, P.; Abraham, S.S. Fair outlier detection. In Proceedings of the 21st International Conference on Web Information Systems Engineering, Leiden, South Holland, Nederland, 20–24 October 2020; pp. 447–462. [Google Scholar]
- Garg, P.; Villasenor, J.; Foggo, V. Fairness metrics: A comparative analysis. In Proceedings of the 2020 IEEE International Conference on Big Data, Atlanta, GA, USA, 10–13 December 2020; pp. 3662–3666. [Google Scholar]
- Hardt, M.; Price, E.; Srebro, N. Equality of opportunity in supervised learning. In Proceedings of the 30th Annual Conference on Neural Information Processing Systems, Barcelona, Spain, 5–10 December 2016; pp. 3315–3323. [Google Scholar]
- Palechor, F.M.; de la Hoz Manotas, A. Dataset for estimation of obesity levels based on eating habits and physical condition in individuals from Colombia, Peru and Mexico. Data Brief 2019, 25, 104344. [Google Scholar] [CrossRef] [PubMed]
- Fehrman, E.; Muhammad, A.K.; Mirkes, E.M.; Egan, V.; Gorban, A.N. The five factor model of personality and evaluation of drug consumption risk. In Data Science; Springer International Publishing: Cham, Switzerland, 2017; pp. 231–242. [Google Scholar]
- Angwin, J.; Larson, J.; Mattu, S.; Kirchner, L. Machine Bias. Risk Assessments in Criminal Sentencing. 2020. Available online: https://www.propublica.org/article/machine-bias-risk-assessments-in-criminal-sentencing (accessed on 10 September 2021).
- Yeh, I.C.; Lien, C. The comparisons of data mining techniques for the predictive accuracy of probability of default of credit card clients. Expert Syst. Appl. 2009, 36, 2473–2480. [Google Scholar] [CrossRef]
- Cortez, P.; Silva, A. Using data mining to predict secondary school student performance. In Proceedings of the 5th Future Business Technology Conference, Porto, Portugal, 9–13 April 2008; pp. 5–12. [Google Scholar]
- Dua, D.; Graff, C. UCI Machine Learning Repository. 2017. Available online: http://archive.ics.uci.edu/ml (accessed on 10 September 2021).
- Berk, R.; Heidari, H.; Jabbari, S.; Kearns, M.; Roth, A. Fairness in criminal justice risk assessments: The state of the art. Sociol. Methods Res. 2021, 50, 3–44. [Google Scholar] [CrossRef]
- Fawcett, T. An introduction to ROC analysis. Pattern Recognit. Lett. 2006, 27, 861–874. [Google Scholar] [CrossRef]
- Boughorbel, S.; Jarray, F.; El-Anbari, M. Optimal classifier for imbalanced data using Matthews Correlation Coefficient metric. PLoS ONE 2017, 12, e0177678. [Google Scholar] [CrossRef] [PubMed]
- Xu, J.; Zhang, Y.; Miao, D. Three-way confusion matrix for classification: A measure driven view. Inf. Sci. 2020, 507, 772–794. [Google Scholar] [CrossRef]
- Ganin, Y.; Lempitsky, V. Unsupervised domain adaptation by backpropagation. In Proceedings of the 32nd International Conference on Machine Learning, Lille, France, 7–9 July 2015; pp. 1180–1189. [Google Scholar]
- Ren, S.; He, K.; Girshick, R.; Sun, J. Faster r-cnn: Towards real-time object detection with region proposal networks. In Proceedings of the 29th Annual Conference on Neural Information Processing Systems, Montreal, QC, Canada, 7–12 December 2015; pp. 91–99. [Google Scholar]
- Breunig, M.M.; Kriegel, H.P.; Ng, R.T.; Sander, J. LOF: Identifying Density-Based Local Outliers. In Proceedings of the 2000 ACM SIGMOD International Conference on Management of Data, Dallas, TX, USA, 16–18 May 2000; pp. 93–104. [Google Scholar]

| Dataset | Size | Number of Attributes | Sentitive Attribute | Outlier Definition |
|---|---|---|---|---|
| Weight | 1500 | 17 | gender | insufficient weight |
| Drug | 1190 | 32 | gender | used within last week |
| Crime | 4000 | 23 | gender | multiple crimes within two years |
| Credit | 6000 | 25 | age | delinquent |
| Student | 630 | 33 | gender | final score less than 7 |
| Adult | 9400 | 15 | race | income more than 50 K |
| Symbols | Descriptions |
|---|---|
| N | size of the dataset |
| M | number of the sensitive attribute categories |
| X | original dataset |
| D | dataset processed by the feature extractor |
| S | sensitive attribute |
| R | categories of the sensitive attribute |
| L | local outlier factors |
| Y | true labels of the data |
| O | detector-assigned labels to the data |
| Predicted Label | ||
|---|---|---|
| True Label | Positive | Negative |
| Positive | TP (True Positive) | FN (False Negative) |
| Negative | FP (False Positive) | TN (True Negative) |
| Weight | Drug | Crime | Credit | Student | Adult | |
|---|---|---|---|---|---|---|
| Balanced | 1000 (1:1) | 600 (1:1) | 2000 (1:1) | 2000 (1:1) | 180 (1:1) | 1000 (1:1) |
| Unbalanced | 1500 (1:2) | 1190 (1:3) | 4000 (1:4) | 6000 (1:5) | 630 (1:6) | 9400 (1:1:5:10:30) |
Publisher’s Note: MDPI stays neutral with regard to jurisdictional claims in published maps and institutional affiliations. |
© 2022 by the authors. Licensee MDPI, Basel, Switzerland. This article is an open access article distributed under the terms and conditions of the Creative Commons Attribution (CC BY) license (https://creativecommons.org/licenses/by/4.0/).
Share and Cite
Li, S.; Yu, J.; Du, X.; Lu, Y.; Qiu, R. Fair Outlier Detection Based on Adversarial Representation Learning. Symmetry 2022, 14, 347. https://doi.org/10.3390/sym14020347
Li S, Yu J, Du X, Lu Y, Qiu R. Fair Outlier Detection Based on Adversarial Representation Learning. Symmetry. 2022; 14(2):347. https://doi.org/10.3390/sym14020347
Chicago/Turabian StyleLi, Shu, Jiong Yu, Xusheng Du, Yi Lu, and Rui Qiu. 2022. "Fair Outlier Detection Based on Adversarial Representation Learning" Symmetry 14, no. 2: 347. https://doi.org/10.3390/sym14020347
APA StyleLi, S., Yu, J., Du, X., Lu, Y., & Qiu, R. (2022). Fair Outlier Detection Based on Adversarial Representation Learning. Symmetry, 14(2), 347. https://doi.org/10.3390/sym14020347