Abstract
This study presents the results of experimental observation of wind pressure on low-rise buildings in three typical mountain forms through wind tunnel experiments. This research focuses on the distribution change in fluctuating wind pressure coefficients with slope gradient. The variation of power spectra and wind pressure’s probability distribution at representative measuring points with the slope gradient were also included. No obvious variation trend for the fluctuating wind pressure coefficient was identified on the windward side. When the slope gradient was 90°, there was just a slight change in distribution or value of the fluctuating wind pressure coefficient on the left. However, the coefficient on the leeward decreased and then increased, while on the roof, it gradually decreased. Furthermore, the experiments showed that the fluctuating wind pressure’s distribution in the middle of windward eaves and at the leeward eaves was significantly affected by the slope gradient. At 0° wind angle, the wind pressure probability density distribution gradually changes from symmetric to asymmetric at the measuring points of windward eaves and side centers when the slope gradient increases, which shows that the wind pressure probability density distribution changes from non-Gaussian to Gaussian.
1. Introduction
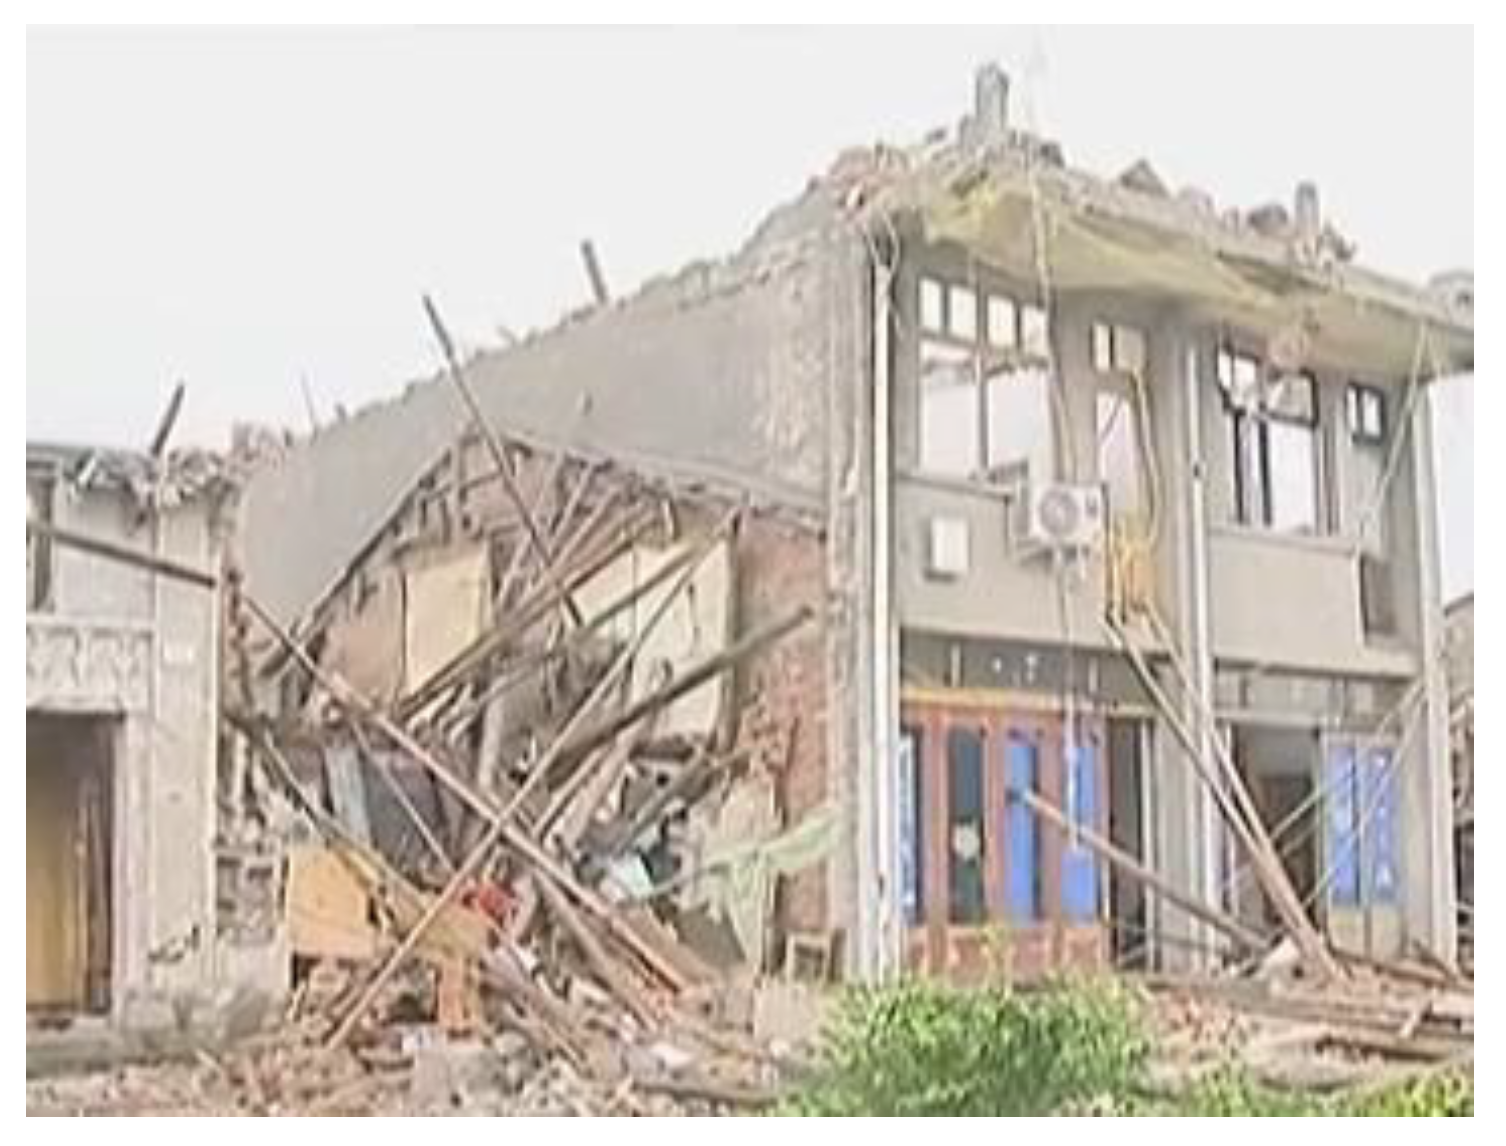
Hills and mountains are in high proportion in coastal area all over the world. There are lots of low-rise buildings located in the complex mountain terrain in China. Compared to the flat topography, due to the change caused by the complex topography, the damage ratio of low-rise buildings is much larger under strong winds [1]. Figure 1 shows a damaged low-rise building at the foot of a mountain. Unfortunately, little attention has been paid to studying the interference effect of low-rise buildings’ fluctuating wind pressure by mountain terrain.
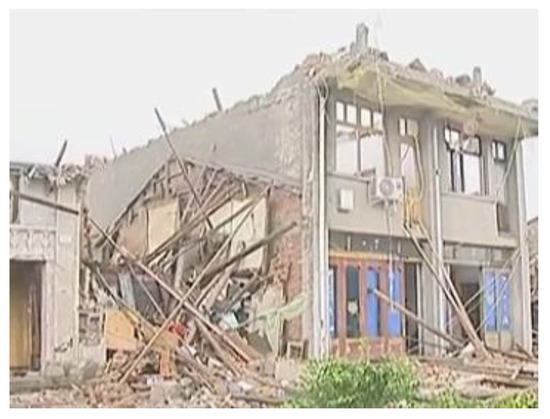
Figure 1.
Damaged low-rise buildings at the foot of the mountain.
At present, scholars have mainly studied the influence of different building plane dimensions, roof types and other factors on the surface wind pressure and surrounding flow field of low-rise buildings. Alrawashdeh [2] investigated the interaction between wind and buildings of such geometries. It is shown that the wind load on the roof is significantly affected by building size. Chen [3] investigated the interference effects on wind pressure affected by the roof slope and building spacing of low-rise gable-roofed buildings. Kwan [4] investigated generic low-rise building models by a series of wind tunnel tests.
In order to investigate the outdoor air quality around buildings influenced by building shape, Chahardoli [5] conducted PIV measurements of a simple building with a flat roof, and compared with low-rise buildings with eight different roof types. Liu [6] analyzed the mean and fluctuating velocity and time-averaged vorticity of three low-rise buildings in an atmospheric boundary layer by wind tunnel tests, and the interference effect of wind pressure on the surface of low-rise buildings by surrounding buildings (building height, spacing, etc.) was studied.
In order to investigate the wind loads influenced by distance between two buildings, Pindado [7] analyzed the wind pressure distribution on downstream building roofs affected by upstream ones, and the incident angle of wind. Kim [8] conducted systematic wind pressure measurements of a typical low-rise building affected by a large group of surrounding buildings. Li [9] investigated the mean wind-induced interference effects between the low-rise buildings by numerical simulations. Zhao [10] used a CFD simulation method to analyze the wind load distribution and wind flow characteristics on low-rise buildings influenced by different spacing ratio and height ratios of the multi/high-rise buildings. Kim [11] measured the wind pressures on a low-rise building in a large group to investigate the proximity effect influenced by surrounding buildings. Meddage [12] investigated the gable-roofed buildings’ wind pressure distribution compared with three other buildings without boundary walls.
Alok [13] investigated the effect of outer walls of buildings by wind tunnel experiments. Yong et al. [14] studied five large groups of low-rise buildings with different building arrangement densities in the suburban wind field by wind tunnel test. Chen et al. [15] studied the disturbance effect of two low-rise buildings with flat roofs, with a particular focus on investigating their mean and fluctuating wind loads in different directions. Li [16,17] studied the mutual airflow interference between two buildings with the same gable roof shape, in which the effects of arrangement, spacing, and wind angle on roof wind-induced disturbance were considered. Similarly, Tang et al. [18] performed a comparison between the height of disturbed flat roof buildings, arrangement of buildings, and the disturbance effect of wind angle. They found that the disturbance effect of a one story flat roof was different from that of two to four story buildings.
Weng et al. [19] found that the wind speed acceleration ratio of complex terrain is lower than that of isolated hills; numerical simulation was carried out on a hill with a combination of parameters (mountain height Hm, shape factor R, section parameter L), and the wind field characteristics around the hill and the wind pressure distribution of low buildings after being affected by the hill were studied by S.L. [20]. Zhong [21,22] analyzed the wind pressure distribution of a low-rise building model in three typical mountain terrains along coastal areas by wind tunnel test.
The estimation of low-rise buildings’ peak wind pressure coefficient is also studied. Wei [23] compared different extreme wind pressure estimation methods and the estimation methods which were suitable for complex disturbance conditions were selected to study the disturbance effect of extreme wind pressure. Wang [24] analyzed wind velocities and wind induced pressures on the roof of a typical low-rise building during a typhoon and compared the nonstationary analysis with the stationary analysis to understand wind characteristics and wind pressures on typical low-rise buildings.
All these results indicated that the wind loads acting on low-rise buildings only considered the isolated low-rise building condition or architectural complex low-rise buildings group condition in a computer simulation situation. In this paper, wind tunnel tests are carried out to investigate the effect of a fluctuating wind pressure coefficient on low-rise buildings in the typical mountain terrain. A relationship of fluctuating wind pressure coefficient between different wind angles and mountain environment is found. The design consideration with the most unfavorable wind angle of wind load in low-rise building calculations is presented. The effect of mountain disturbance on the fluctuating wind pressure characteristics of low-rise buildings is rarely studied.
2. Wind Tunnel Tests Experiments
Wind tunnel experiments were carried out in the boundary layer wind tunnel tests equipment in the Department of Civil Engineering, Hunan University, China. The working section is 3.0 m wide, 2.5 m high and 10 m long.
2.1. Physical on Scale Model
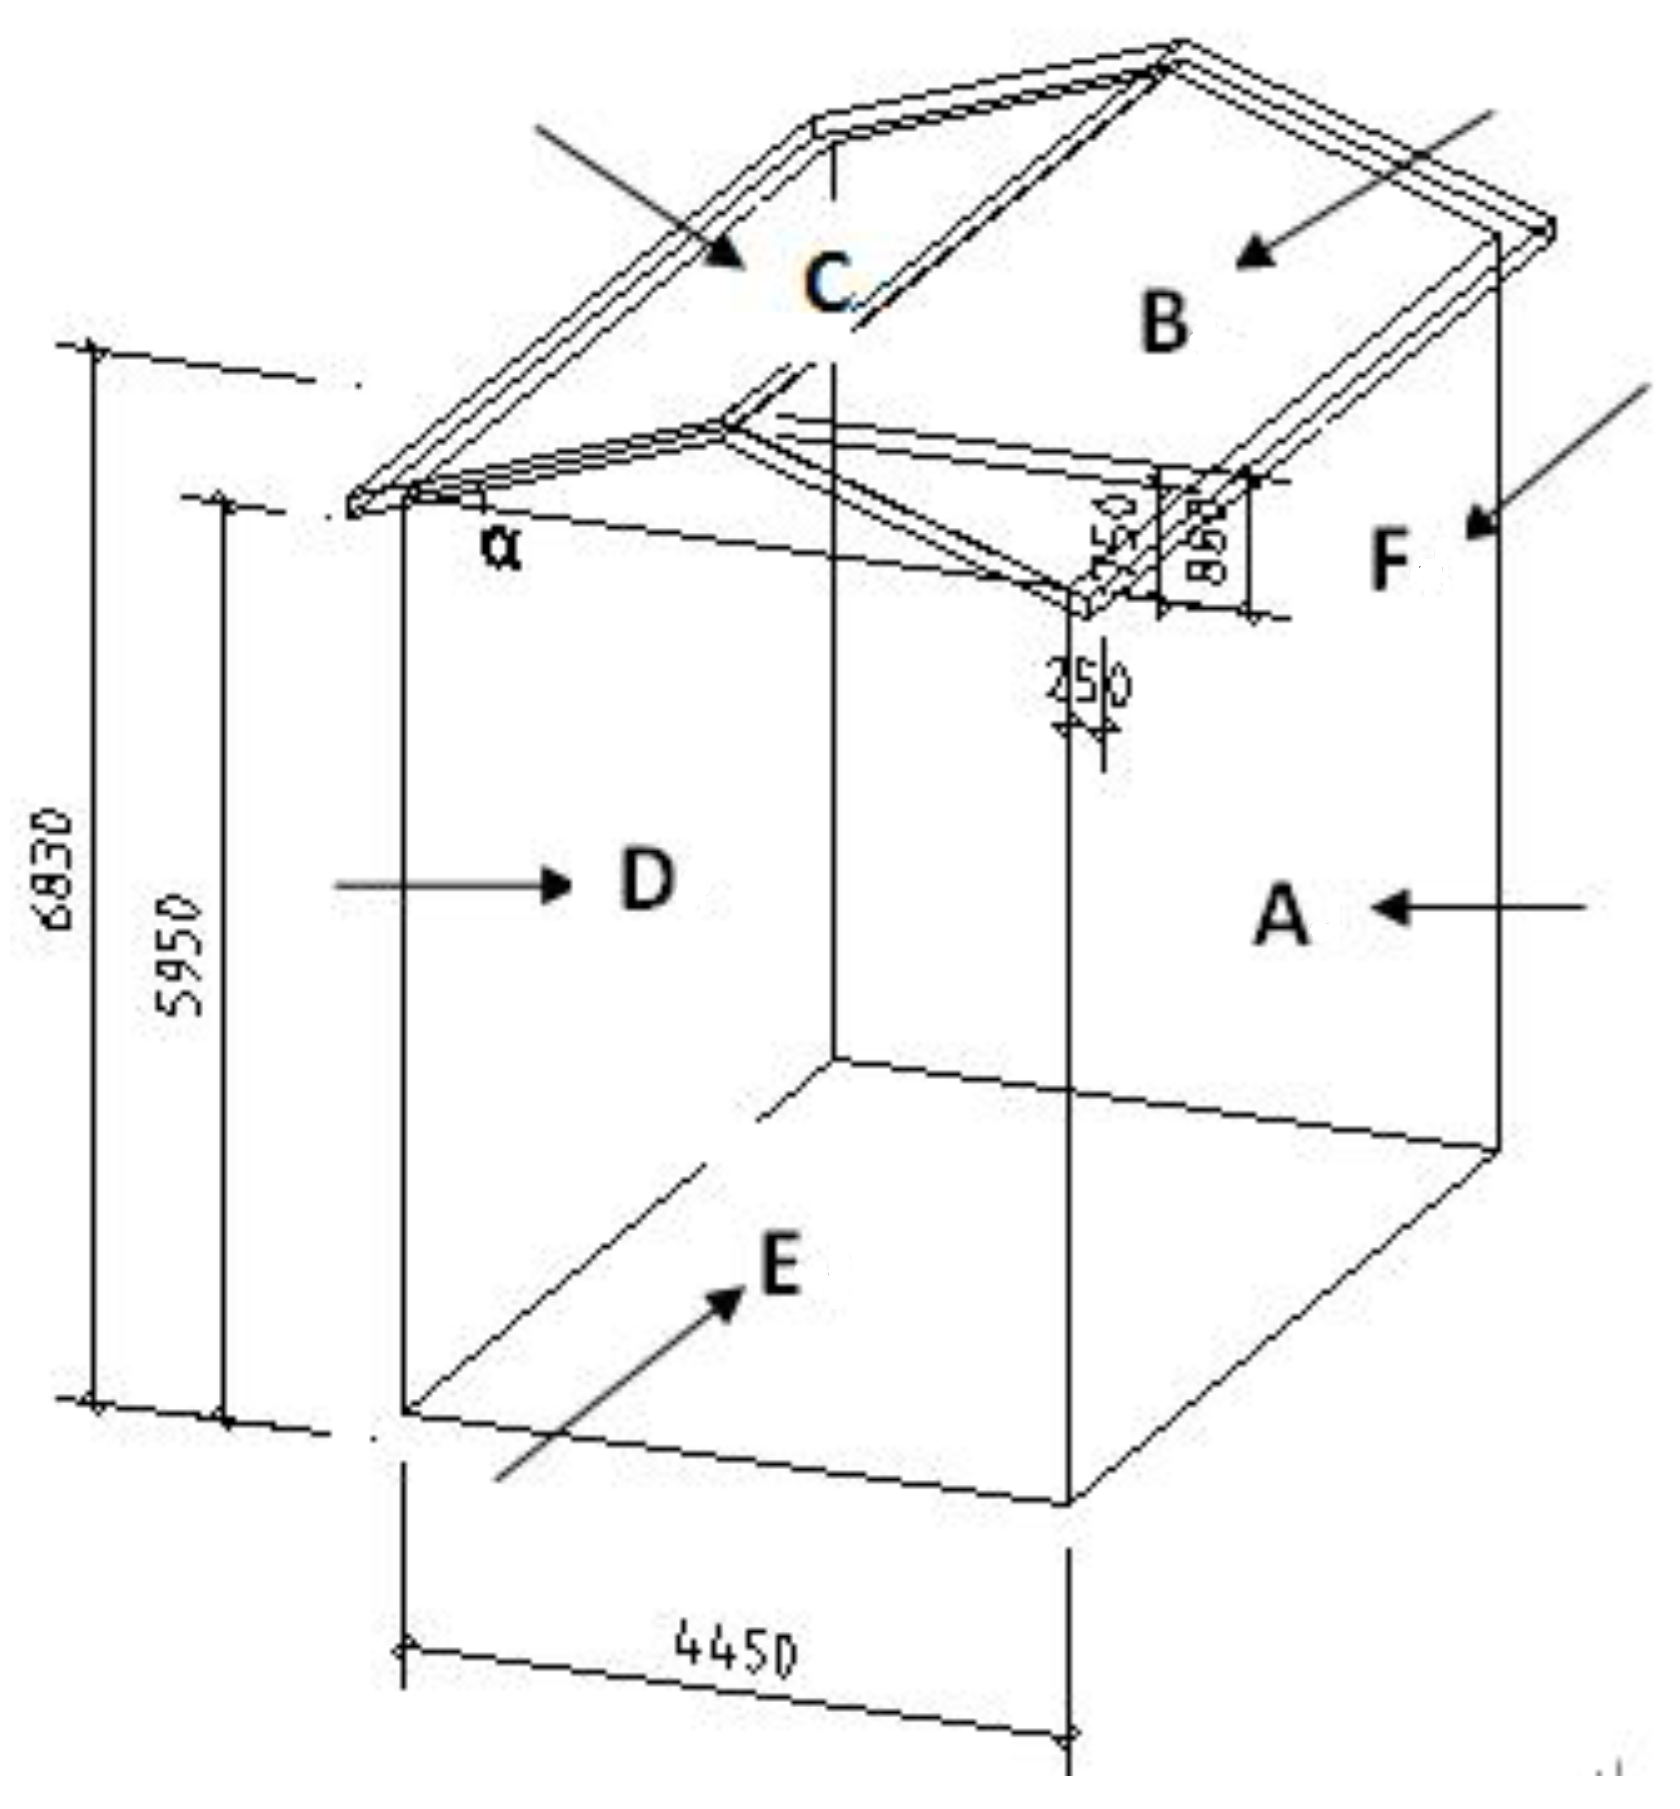
The atmospheric boundary layer is simulated at a geometrical scale of 1:40. As shown in Figure 2, the physical on scale model of the building is designed based on common low-rise buildings. The size of the physical on scale mountain model is based on “Load code for the design of building structure (GB50009-2012)” [25], which enclosed the design of gable roofs in low-rise buildings near mountains. Items 2 and 24 of Table 8.3.1 about wind load shape coefficient in “Load Code for the Design of Building Structures (GB50009-2012)” put forward the provisions on wind load shape coefficient of closed gable roofs and mountain leaning closed gable roofs. In order to facilitate the comparison between wind tunnel test results and specification values, the working conditions shall be consistent with the parameters in the specification as much as possible, and the provisions on slope gradient in the specification shall be referred to, so we select β = 30°, 60° and 90°.
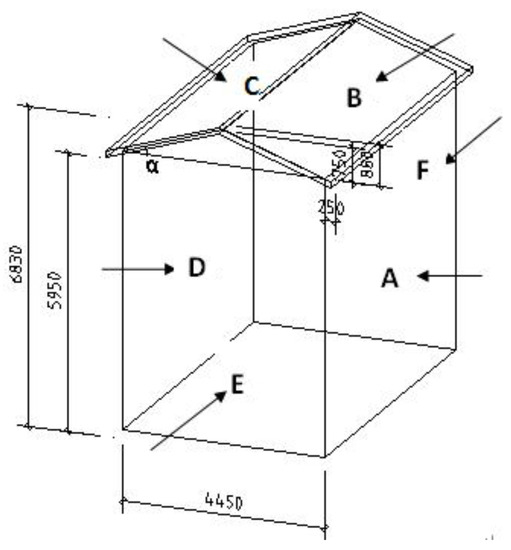
Figure 2.
Physical on scale low-rise building model (units: mm).
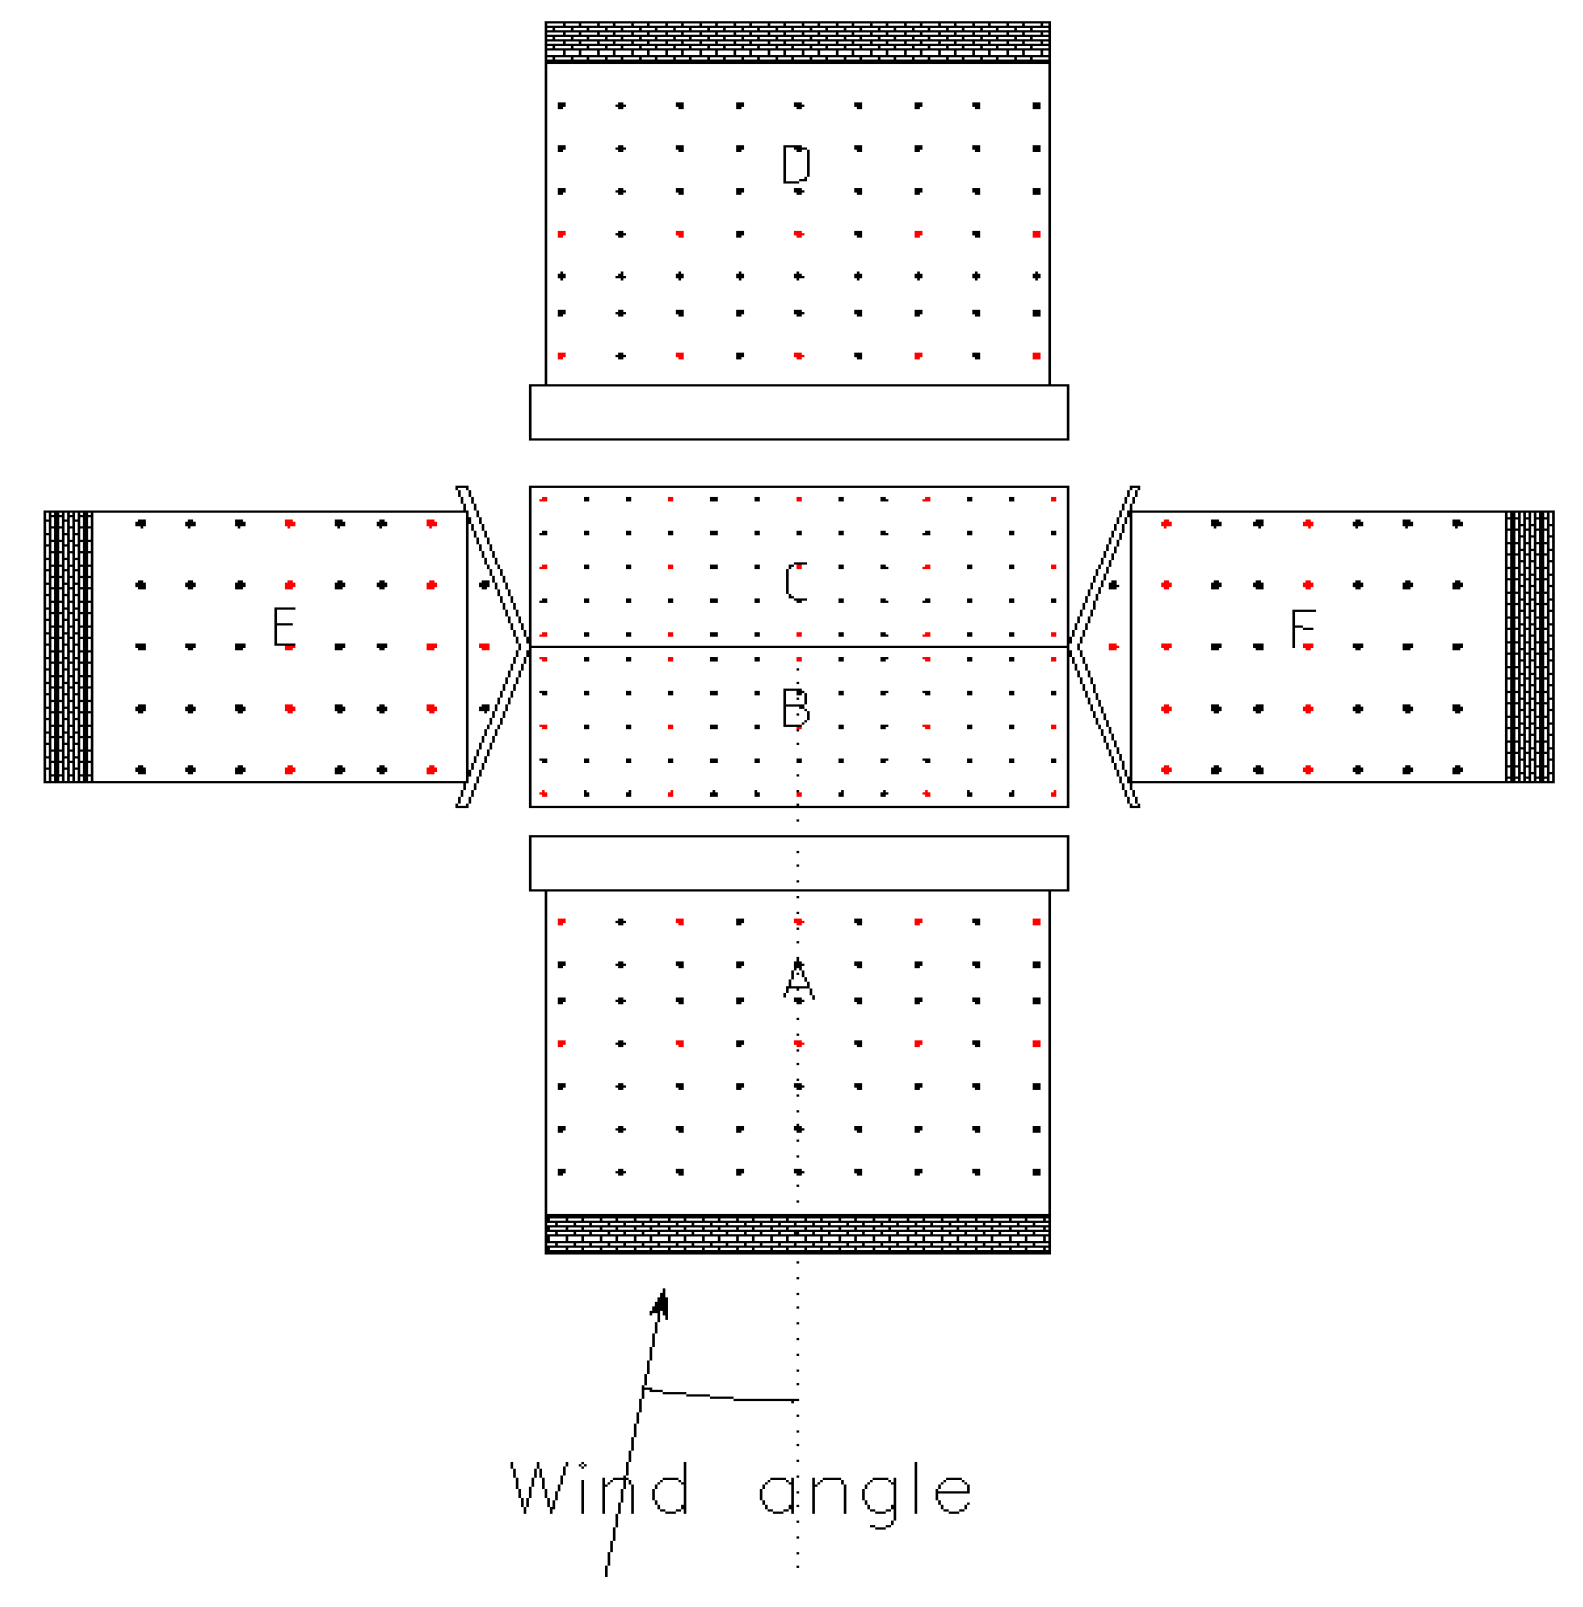
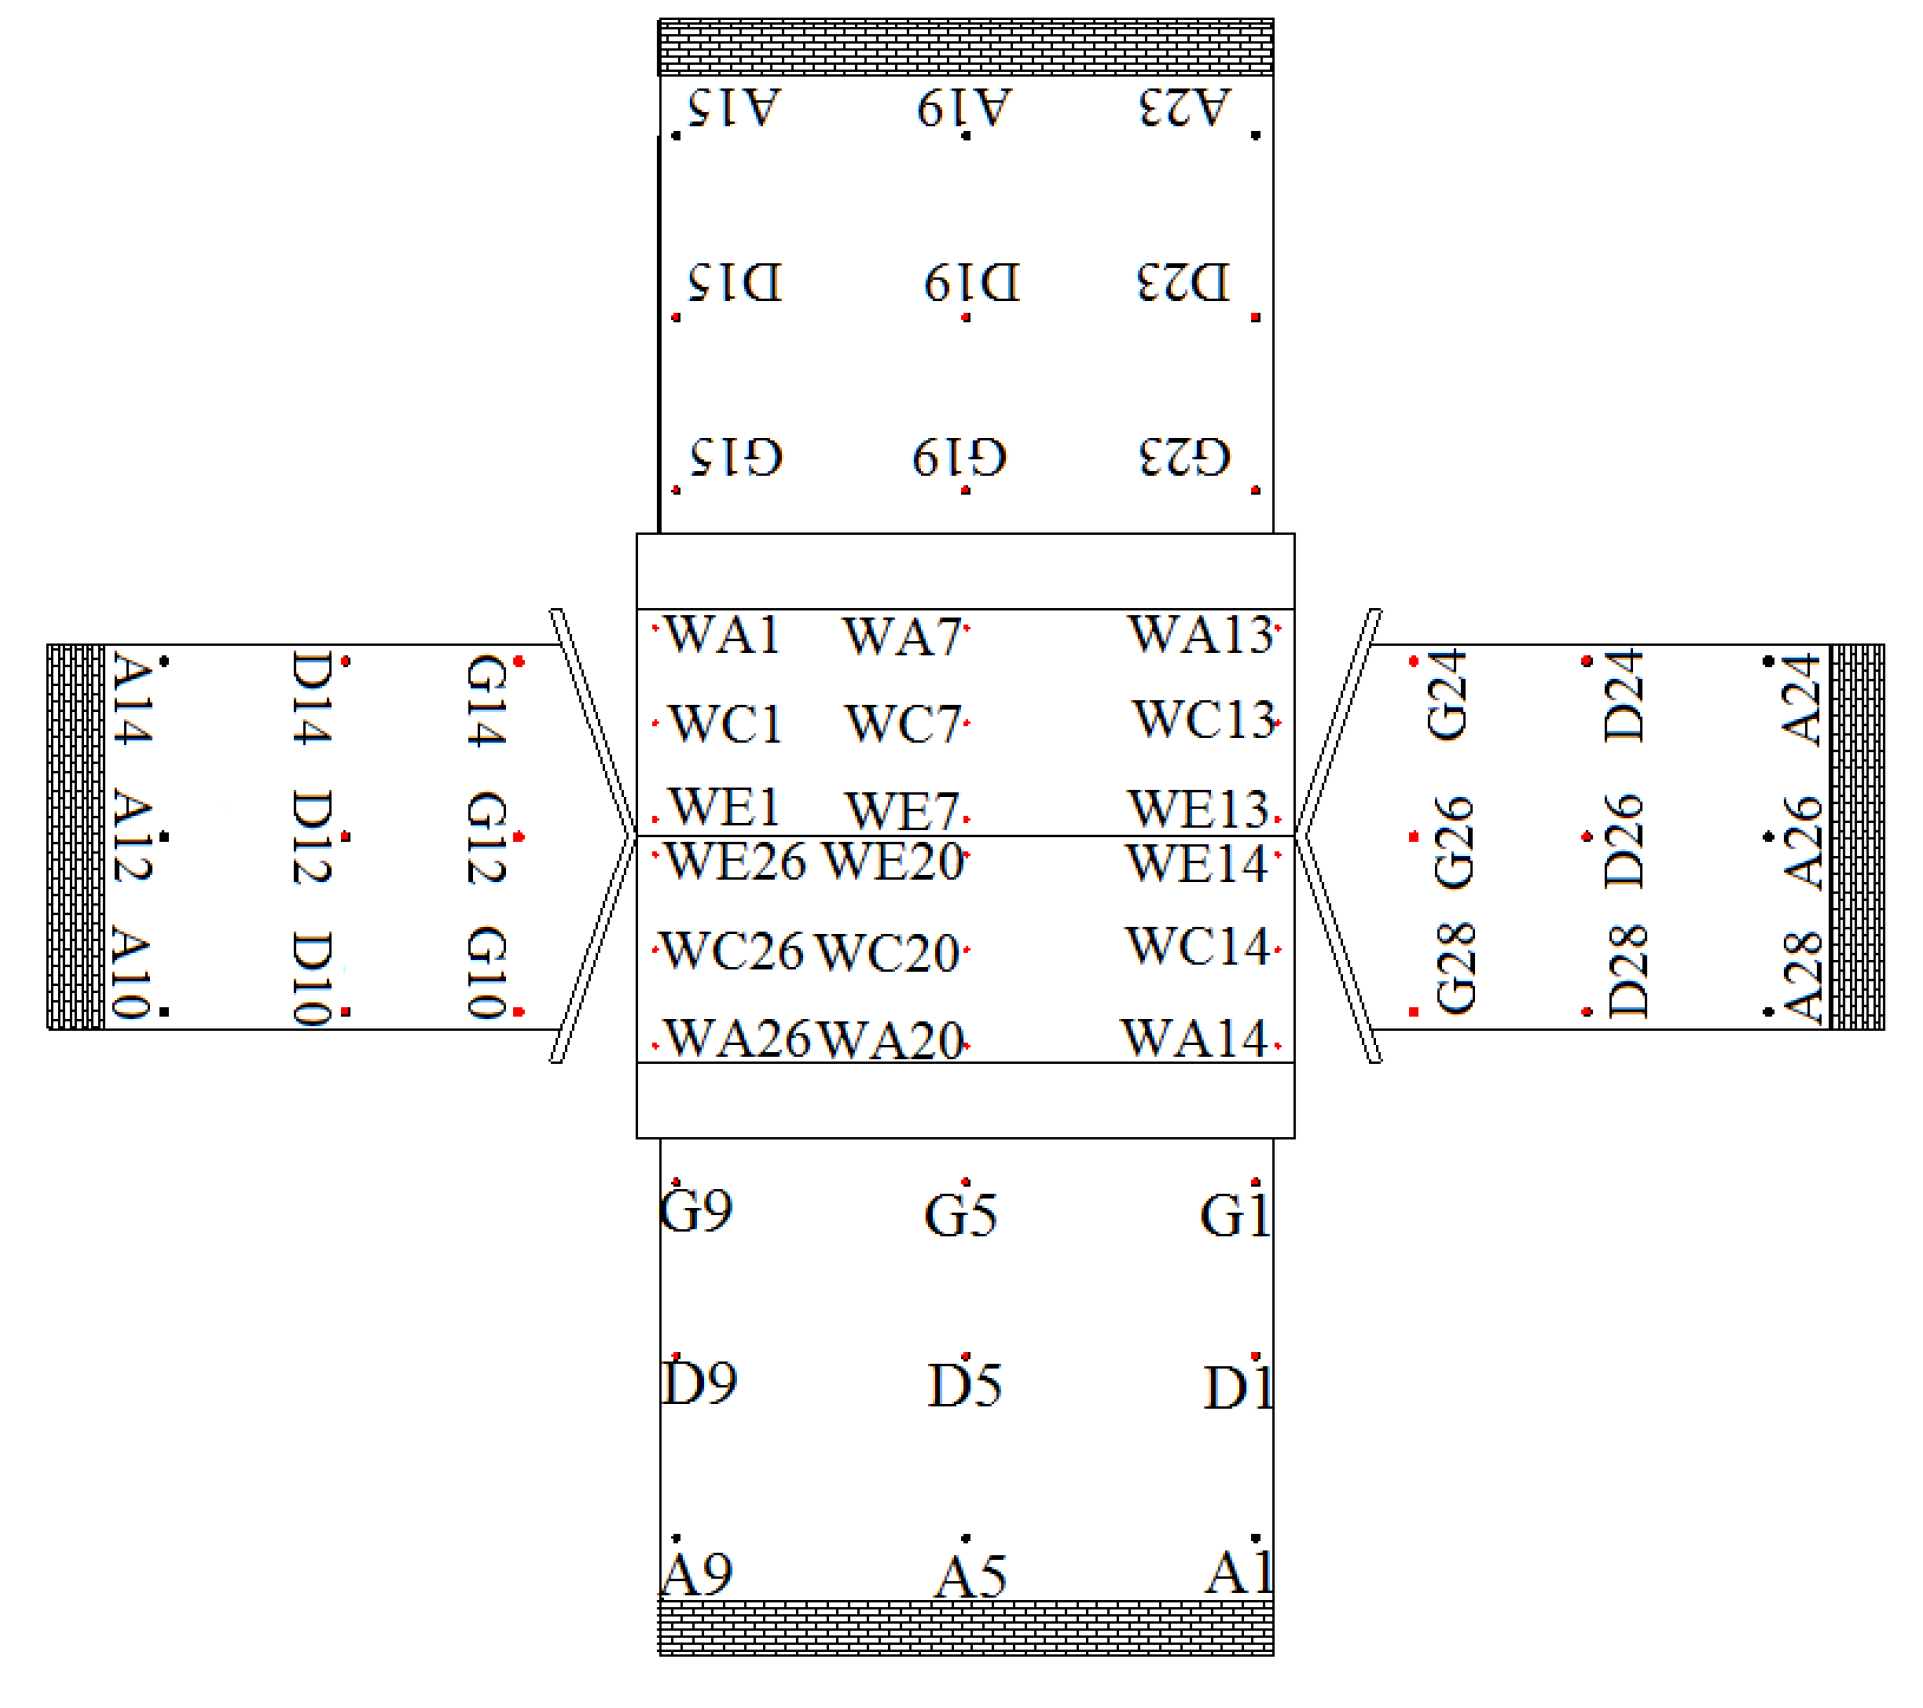
The physical on scale building model (geometric scale of 1:40) is fabricated representing a building with height (H) 6.83 m, width (W) 4.45 m and length (L) 7.5 m. The roof overhang extended up to 0.25 m from the building wall. A-F represents different building surfaces, of which A and D represent front elevation, E and F represent side, and B and C represent roof.The pressure taps testing points are located on all four external walls, roof and double sides of the eaves. There are 374 pressure testing points in total with 202 testing points on the walls, 130 testing points on the roof, and 42 testing points on the lower surface of the eaves. The detail arrangement of the pressure taps testing points are show in Figure 3.
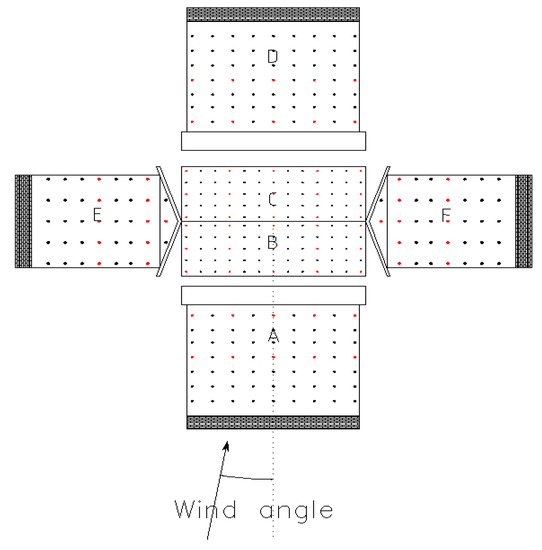
Figure 3.
Detail of pressure taps testing points.
2.2. Experimental Operating Condition
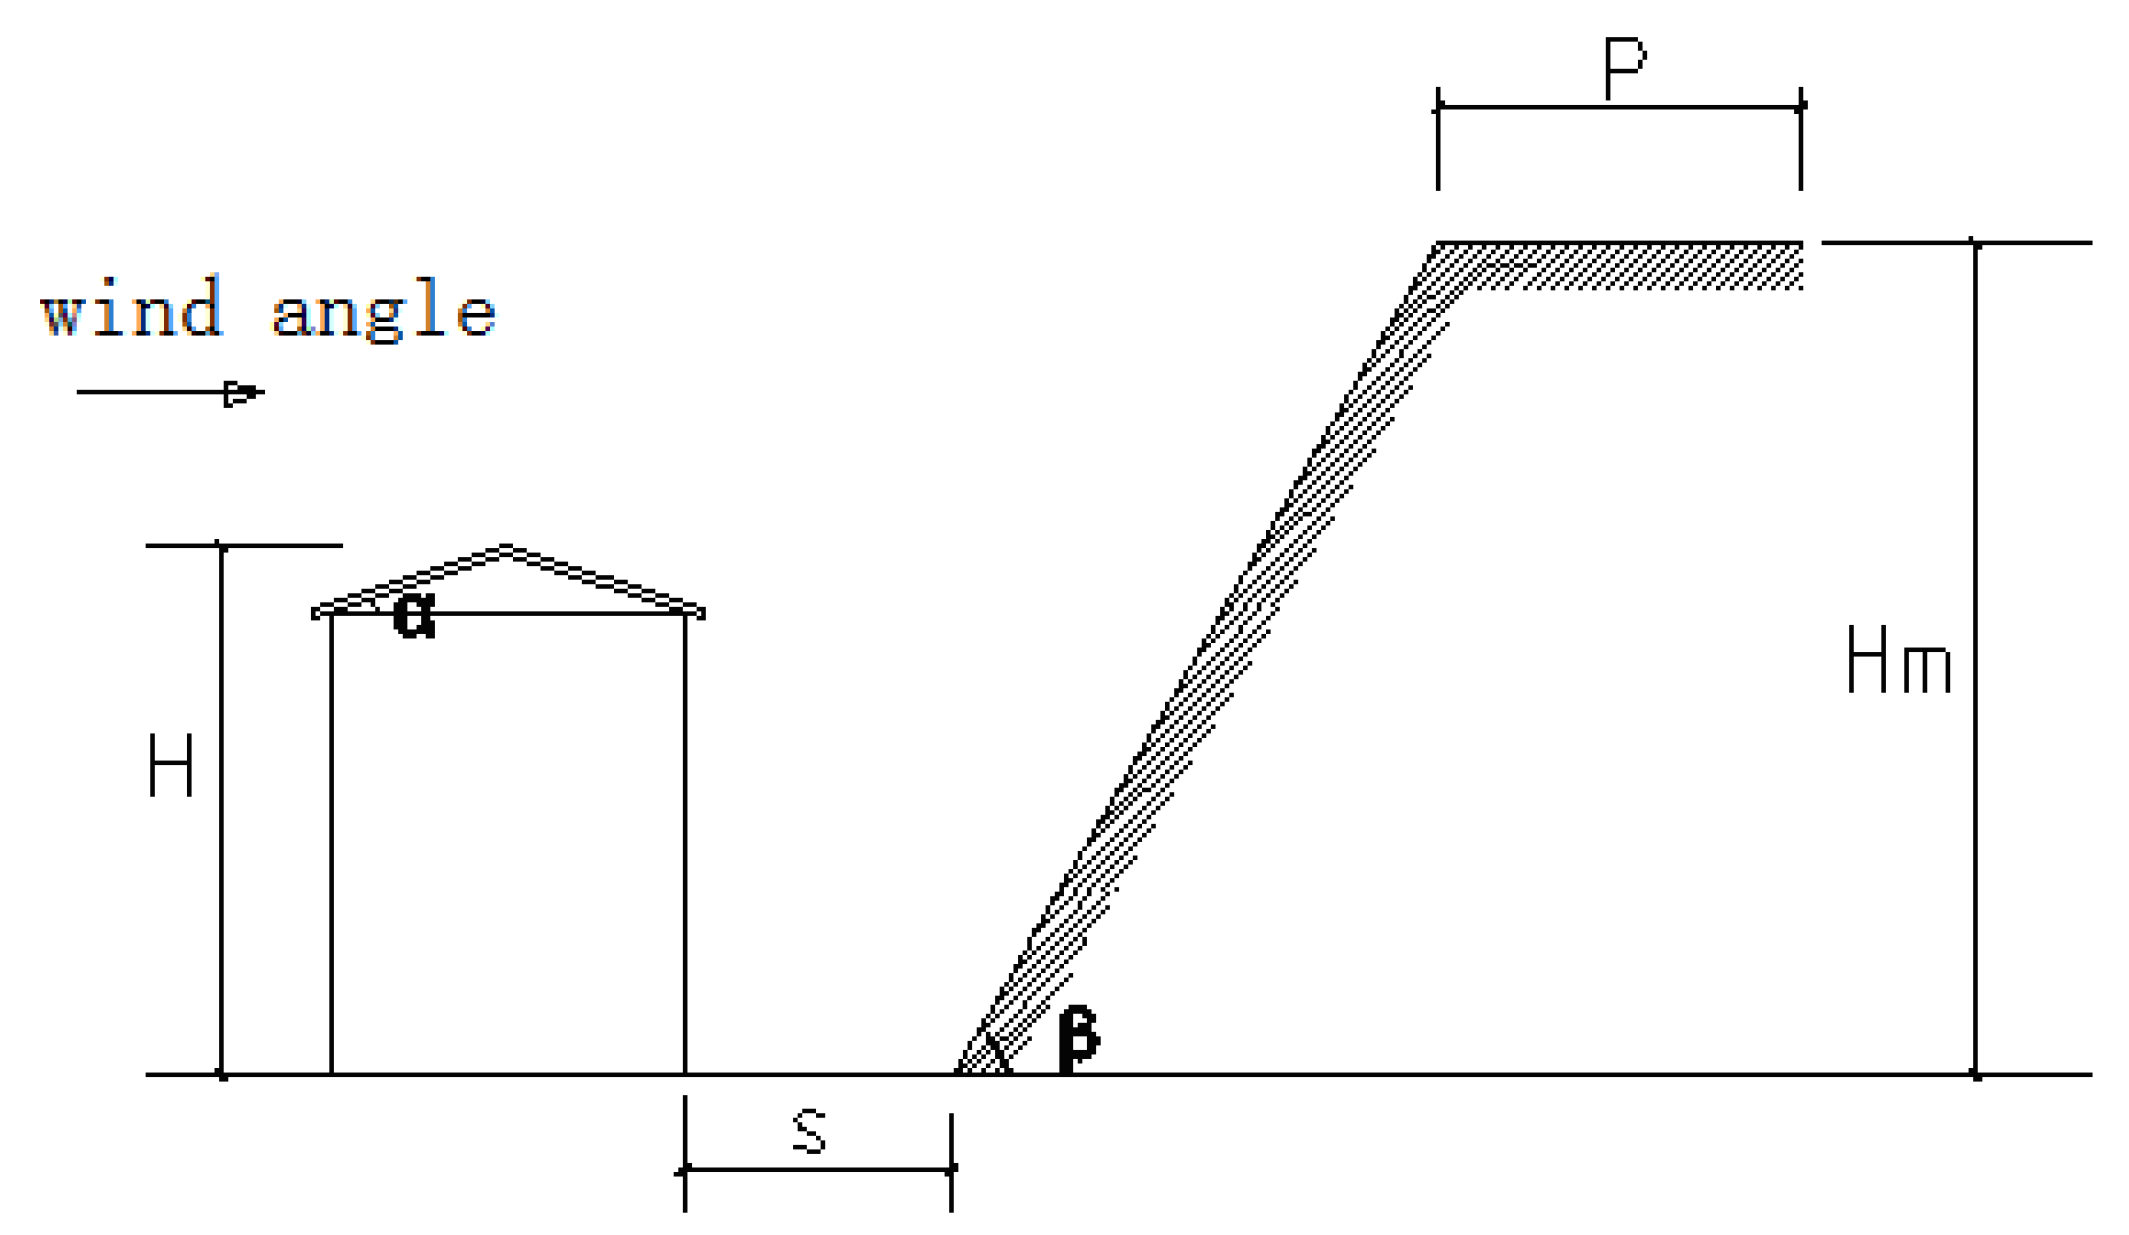
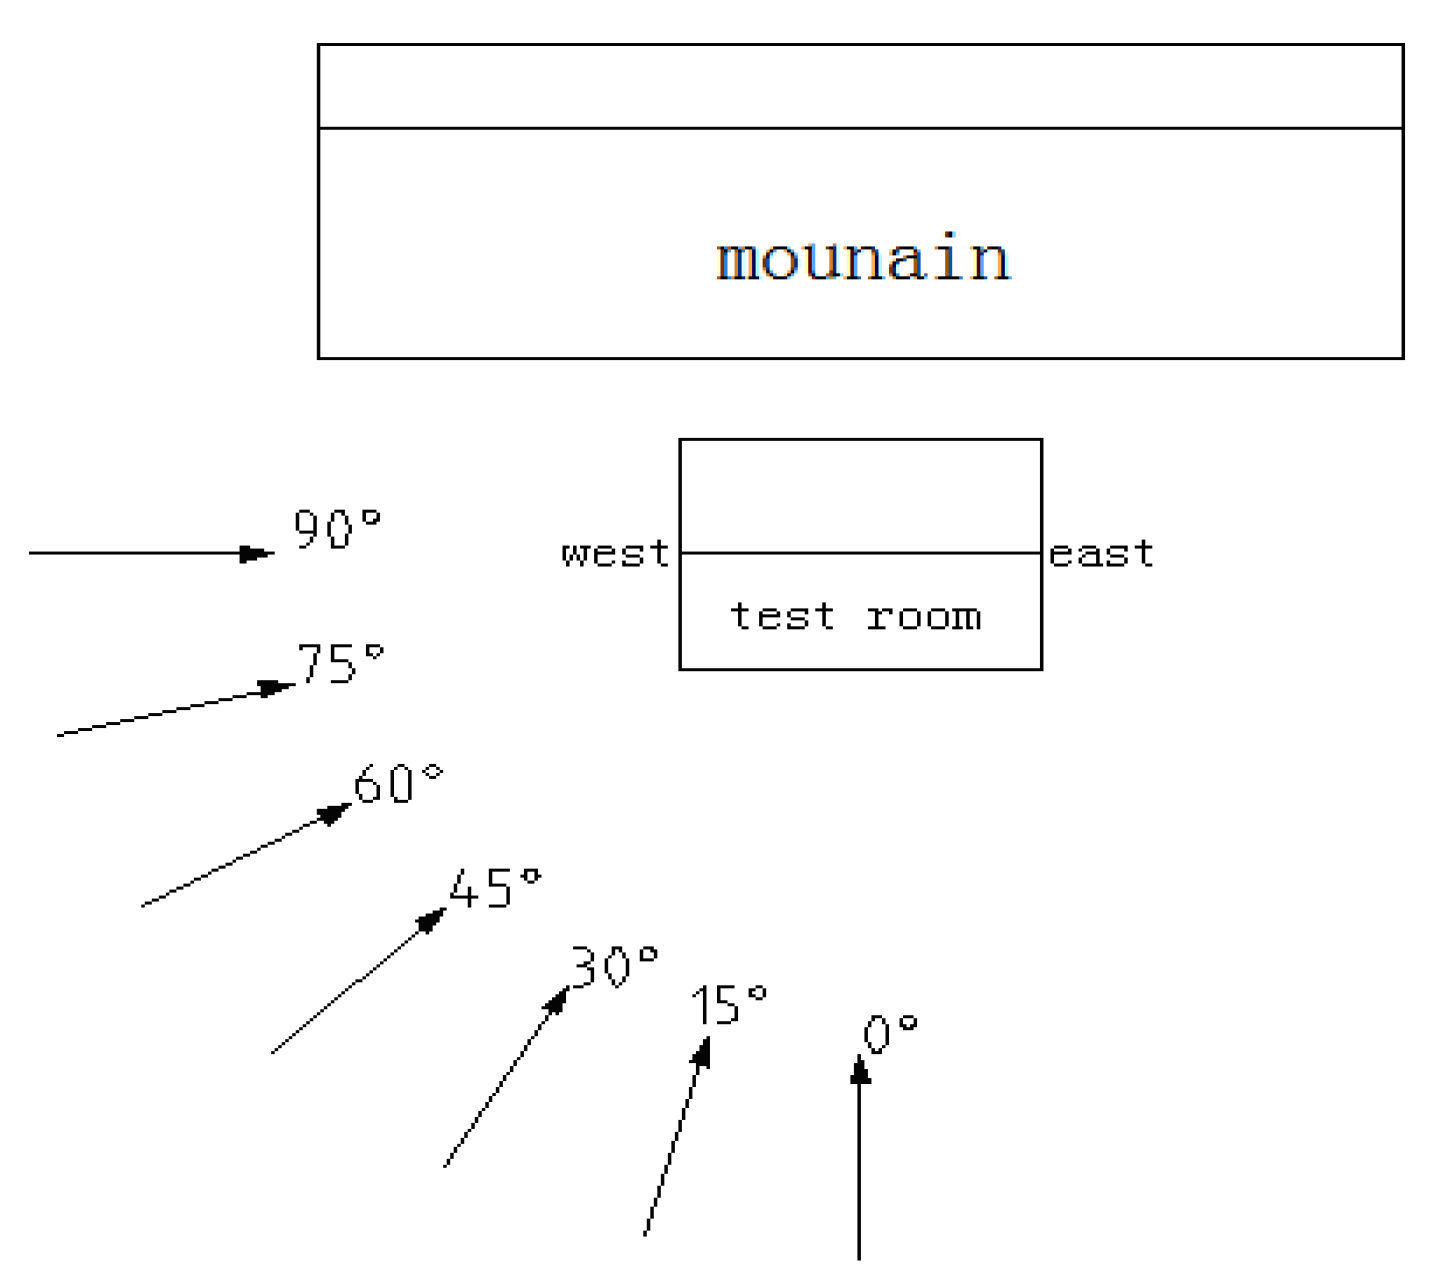
Figure 4 shows the location of low-rise buildings and the typical mountain terrain. H is the total height of the low-rise building; Hm is the hillside height; β is the angle ratio between the ground and hillside; α is the roof angle; S is the distance between the hillside and low-rise building; Figure 5 shows the wind attack angle from 0° to 90° with an interval of 5°. The physical on scale model of the building used for the Wind Tunnel Test is located in a northern direction as the wind direction = 0. In order to find out the wind pressure effect by the hill slope directly, hillside without surrounding area is set. A series of wind tunnel experiment parameters for hill slope are selected to be studied. Parameter details are shown in Table 1. The wind tunnel test conditions satisfy all the relevant requirements of the blocking probability.
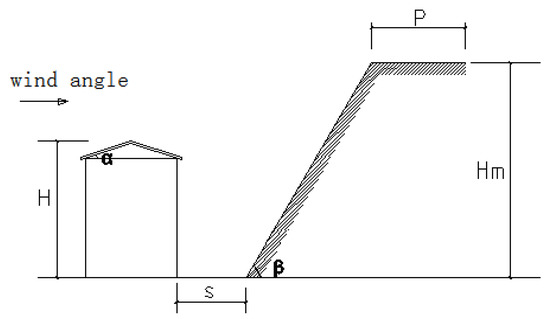
Figure 4.
Position of mountain.
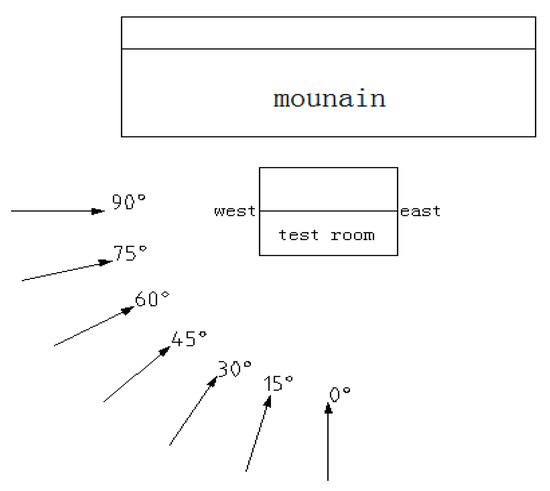
Figure 5.
Wind direction.

Table 1.
Experimental parameter studies details.
2.3. Simulation Test of Wind Field
The blocking rate of this test is less than 5%, which complies with the relevant provisions on the blocking rate. The reference point is at a position 50 cm above the ground, corresponding to the actual prototype wind field height of 20 m.
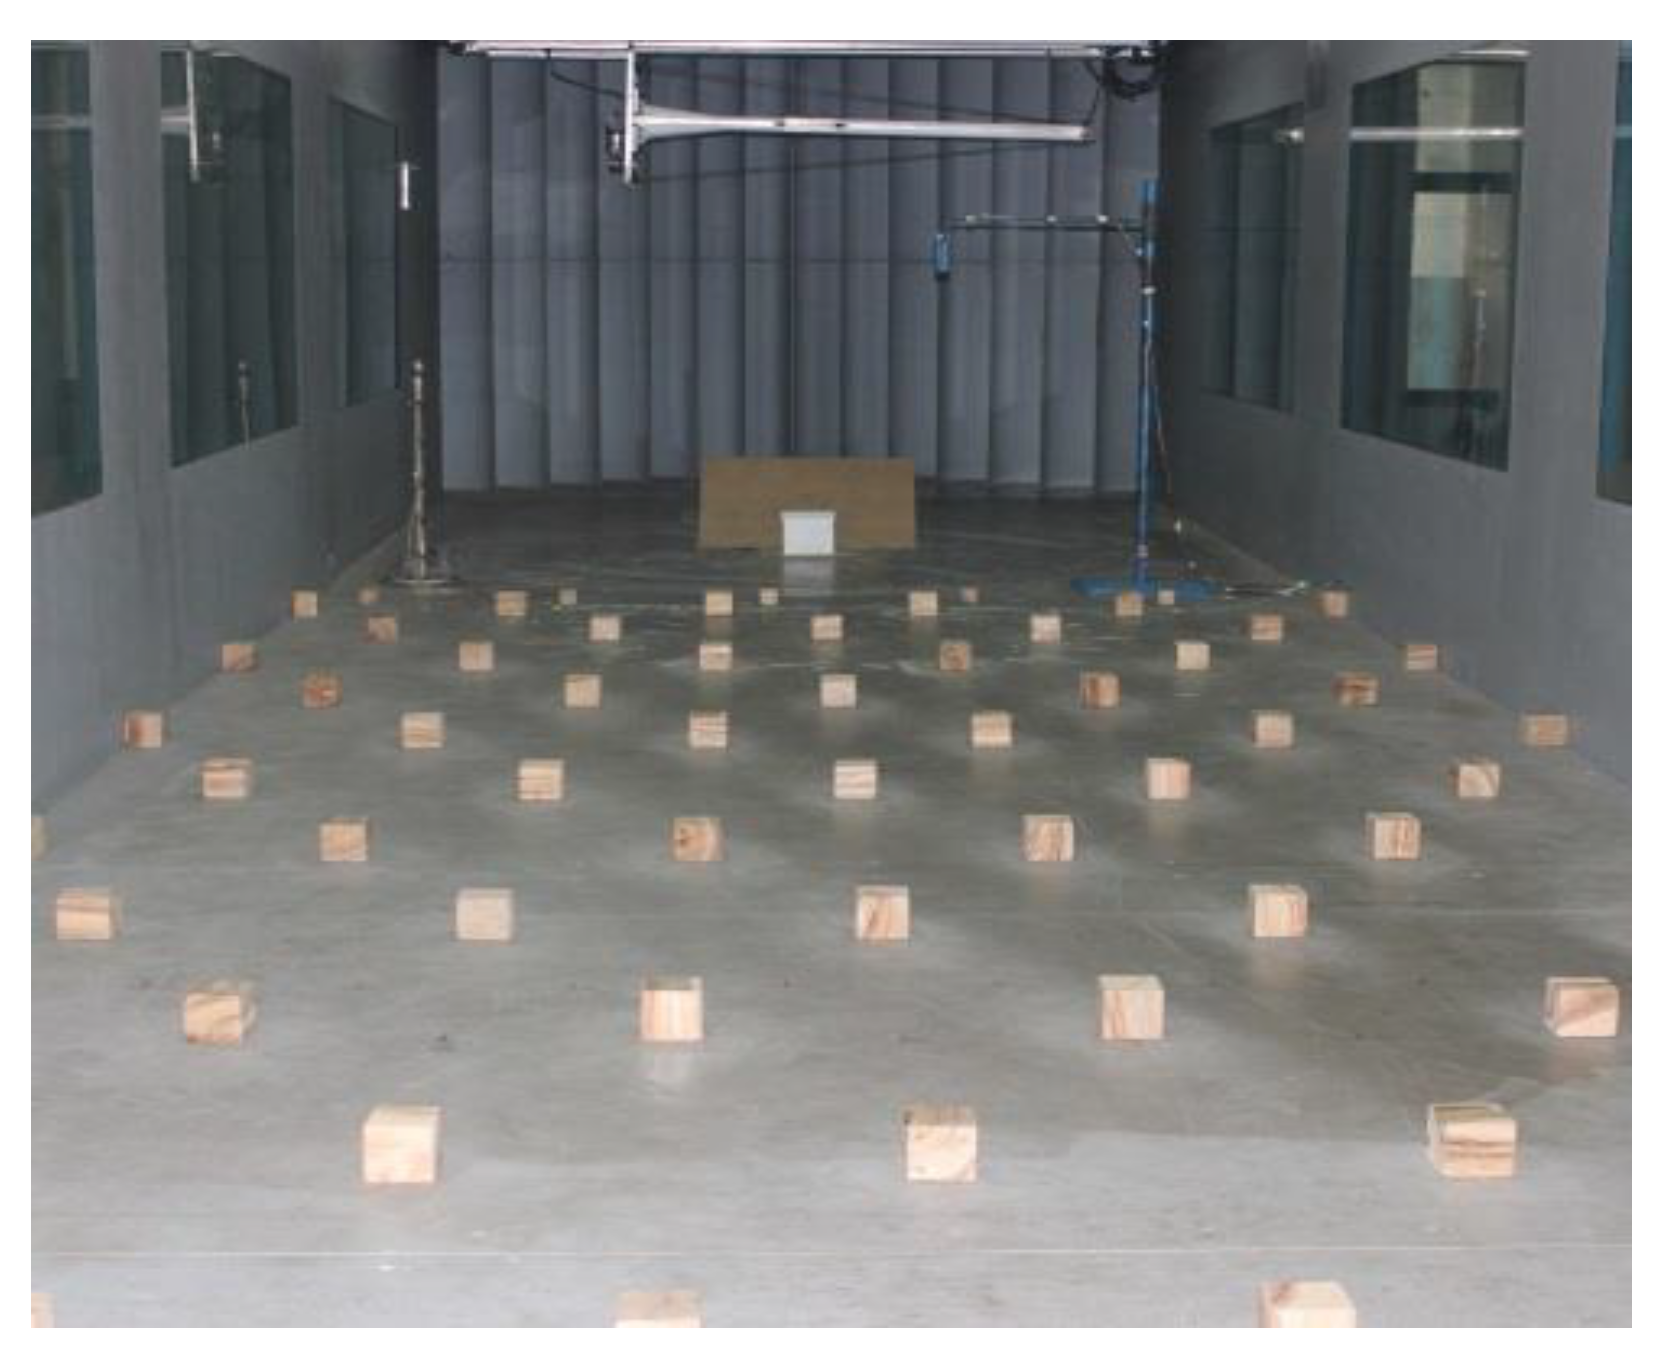
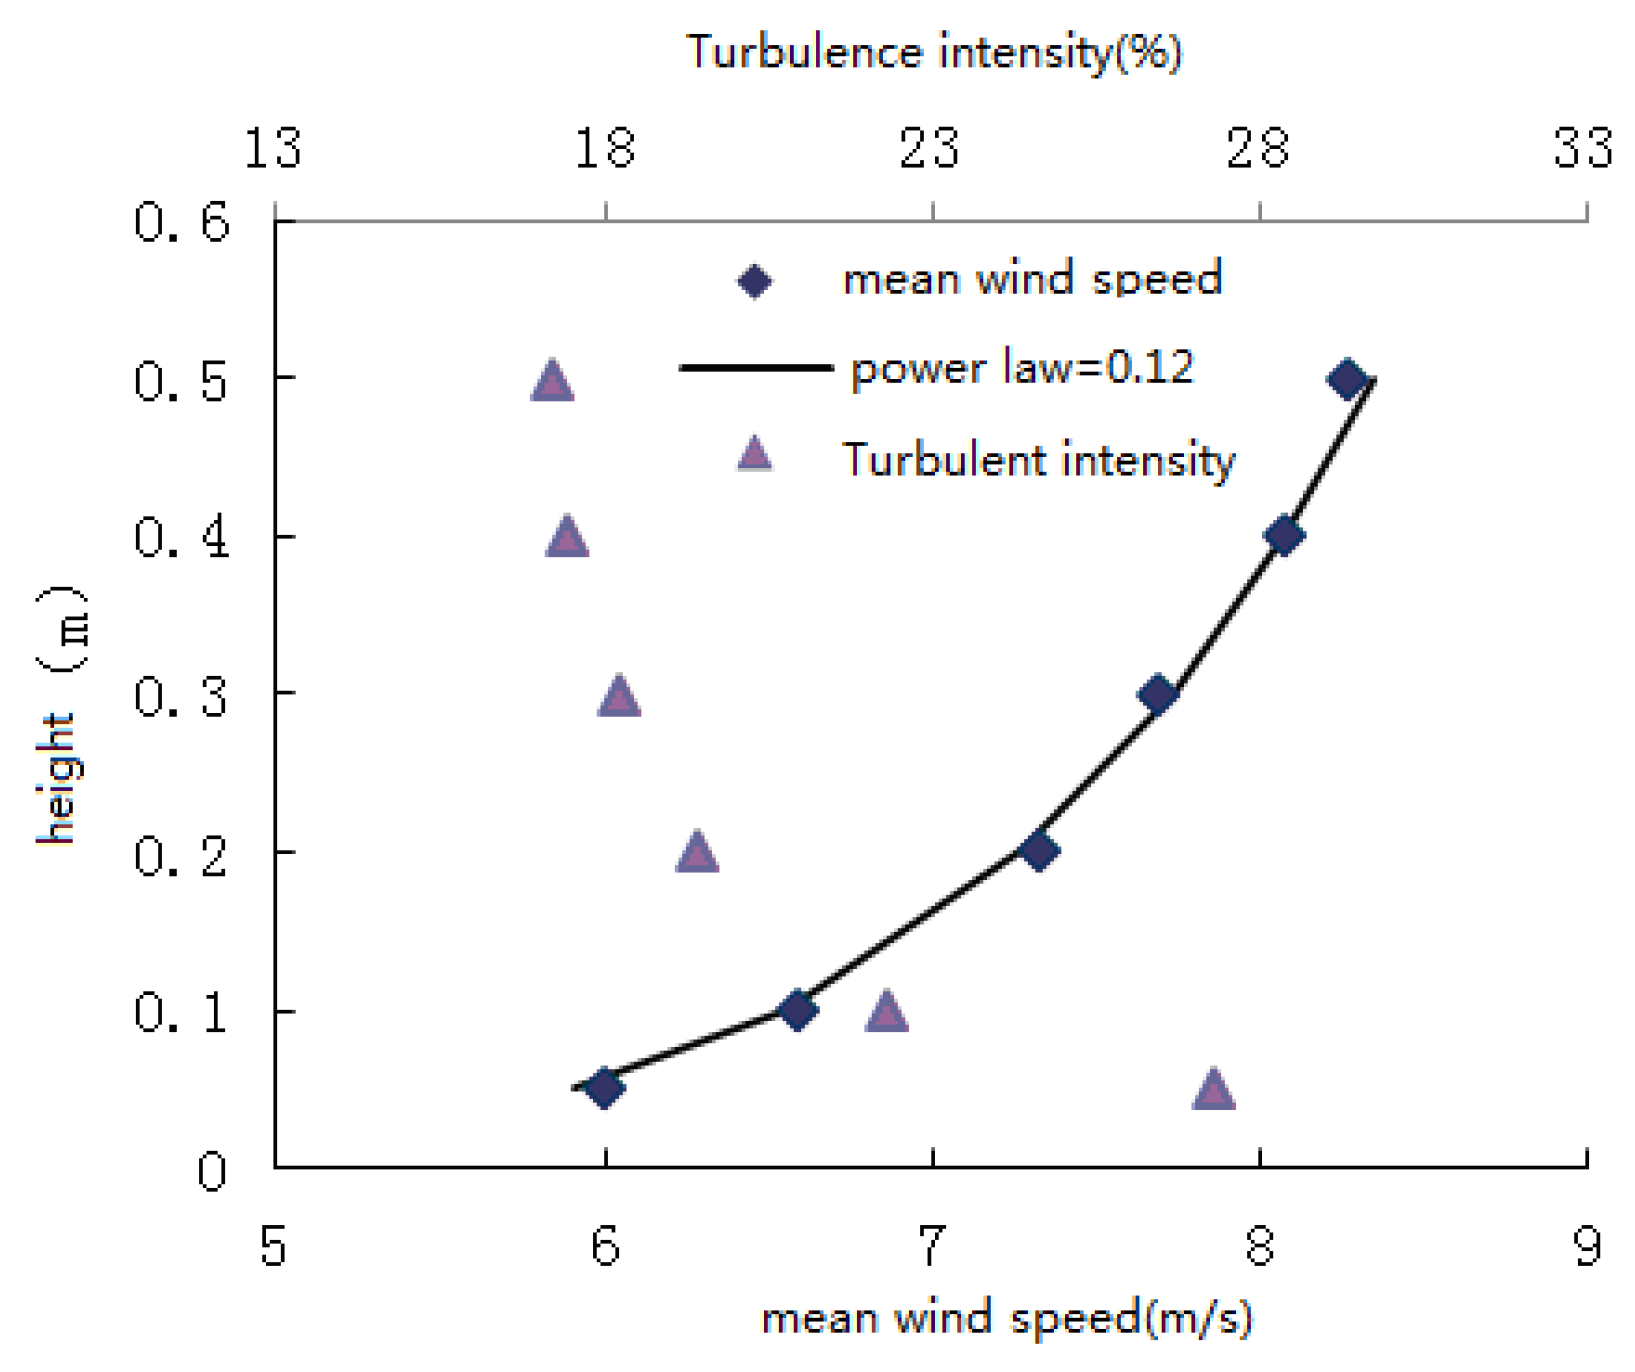
In order to achieve the similar environment in typical mountain terrain, the wind speed is 12 m/s and it can be achieved in the wind tunnel simulation of natural wind using spires and floor roughness elements. The power exponent of incident wind is 0.12. The simulation wind tunnel tests setup and experimental models are shown in Figure 6. The mean–velocity and turbulence intensity profiles obtained from wind speed in the wind tunnel are illustrated in Figure 7.
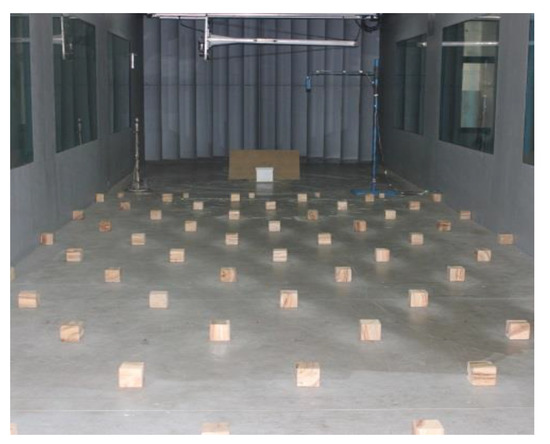
Figure 6.
Experimental model installed in wind tunnel profiles.
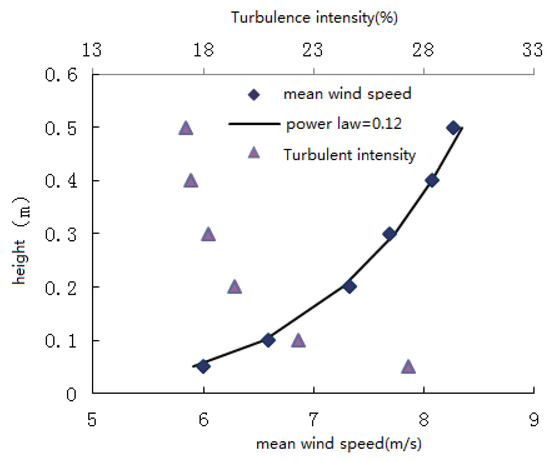
Figure 7.
Mean velocity and turbulence intensity.
2.4. Data Analysis Method
Local Mean Pressure Coefficient
Local mean pressure coefficient measured from the physical on scale building models is expressed in the form of a non-dimensional pressure coefficient defined as follows:
where p0 is static reference pressure, which is measured from the reference height at 0.4 m in the wind tunnel test and the reference height at 0.4 m is equivalent to the actual height of 40 m above the ground; pi is instantaneous surface pressure; ρ is air density; and Ur is mean velocity measured at reference height of the model.
Fluctuating wind pressure coefficient is defined as follows:
where is mean wind pressure coefficients, and is defined as follows:
3. Study on the Disturbance Effect of Fluctuating Wind Pressure Coefficient with Slope Gradient
Four working conditions with different slope gradients under the same slope height and position of the slope relative to the building were selected for relevant analysis, as shown in Table 2 below:

Table 2.
Slope gradient working conditions.
3.1. Analysis on the Variation of Fluctuating Wind Pressure Coefficient with Slope Gradient
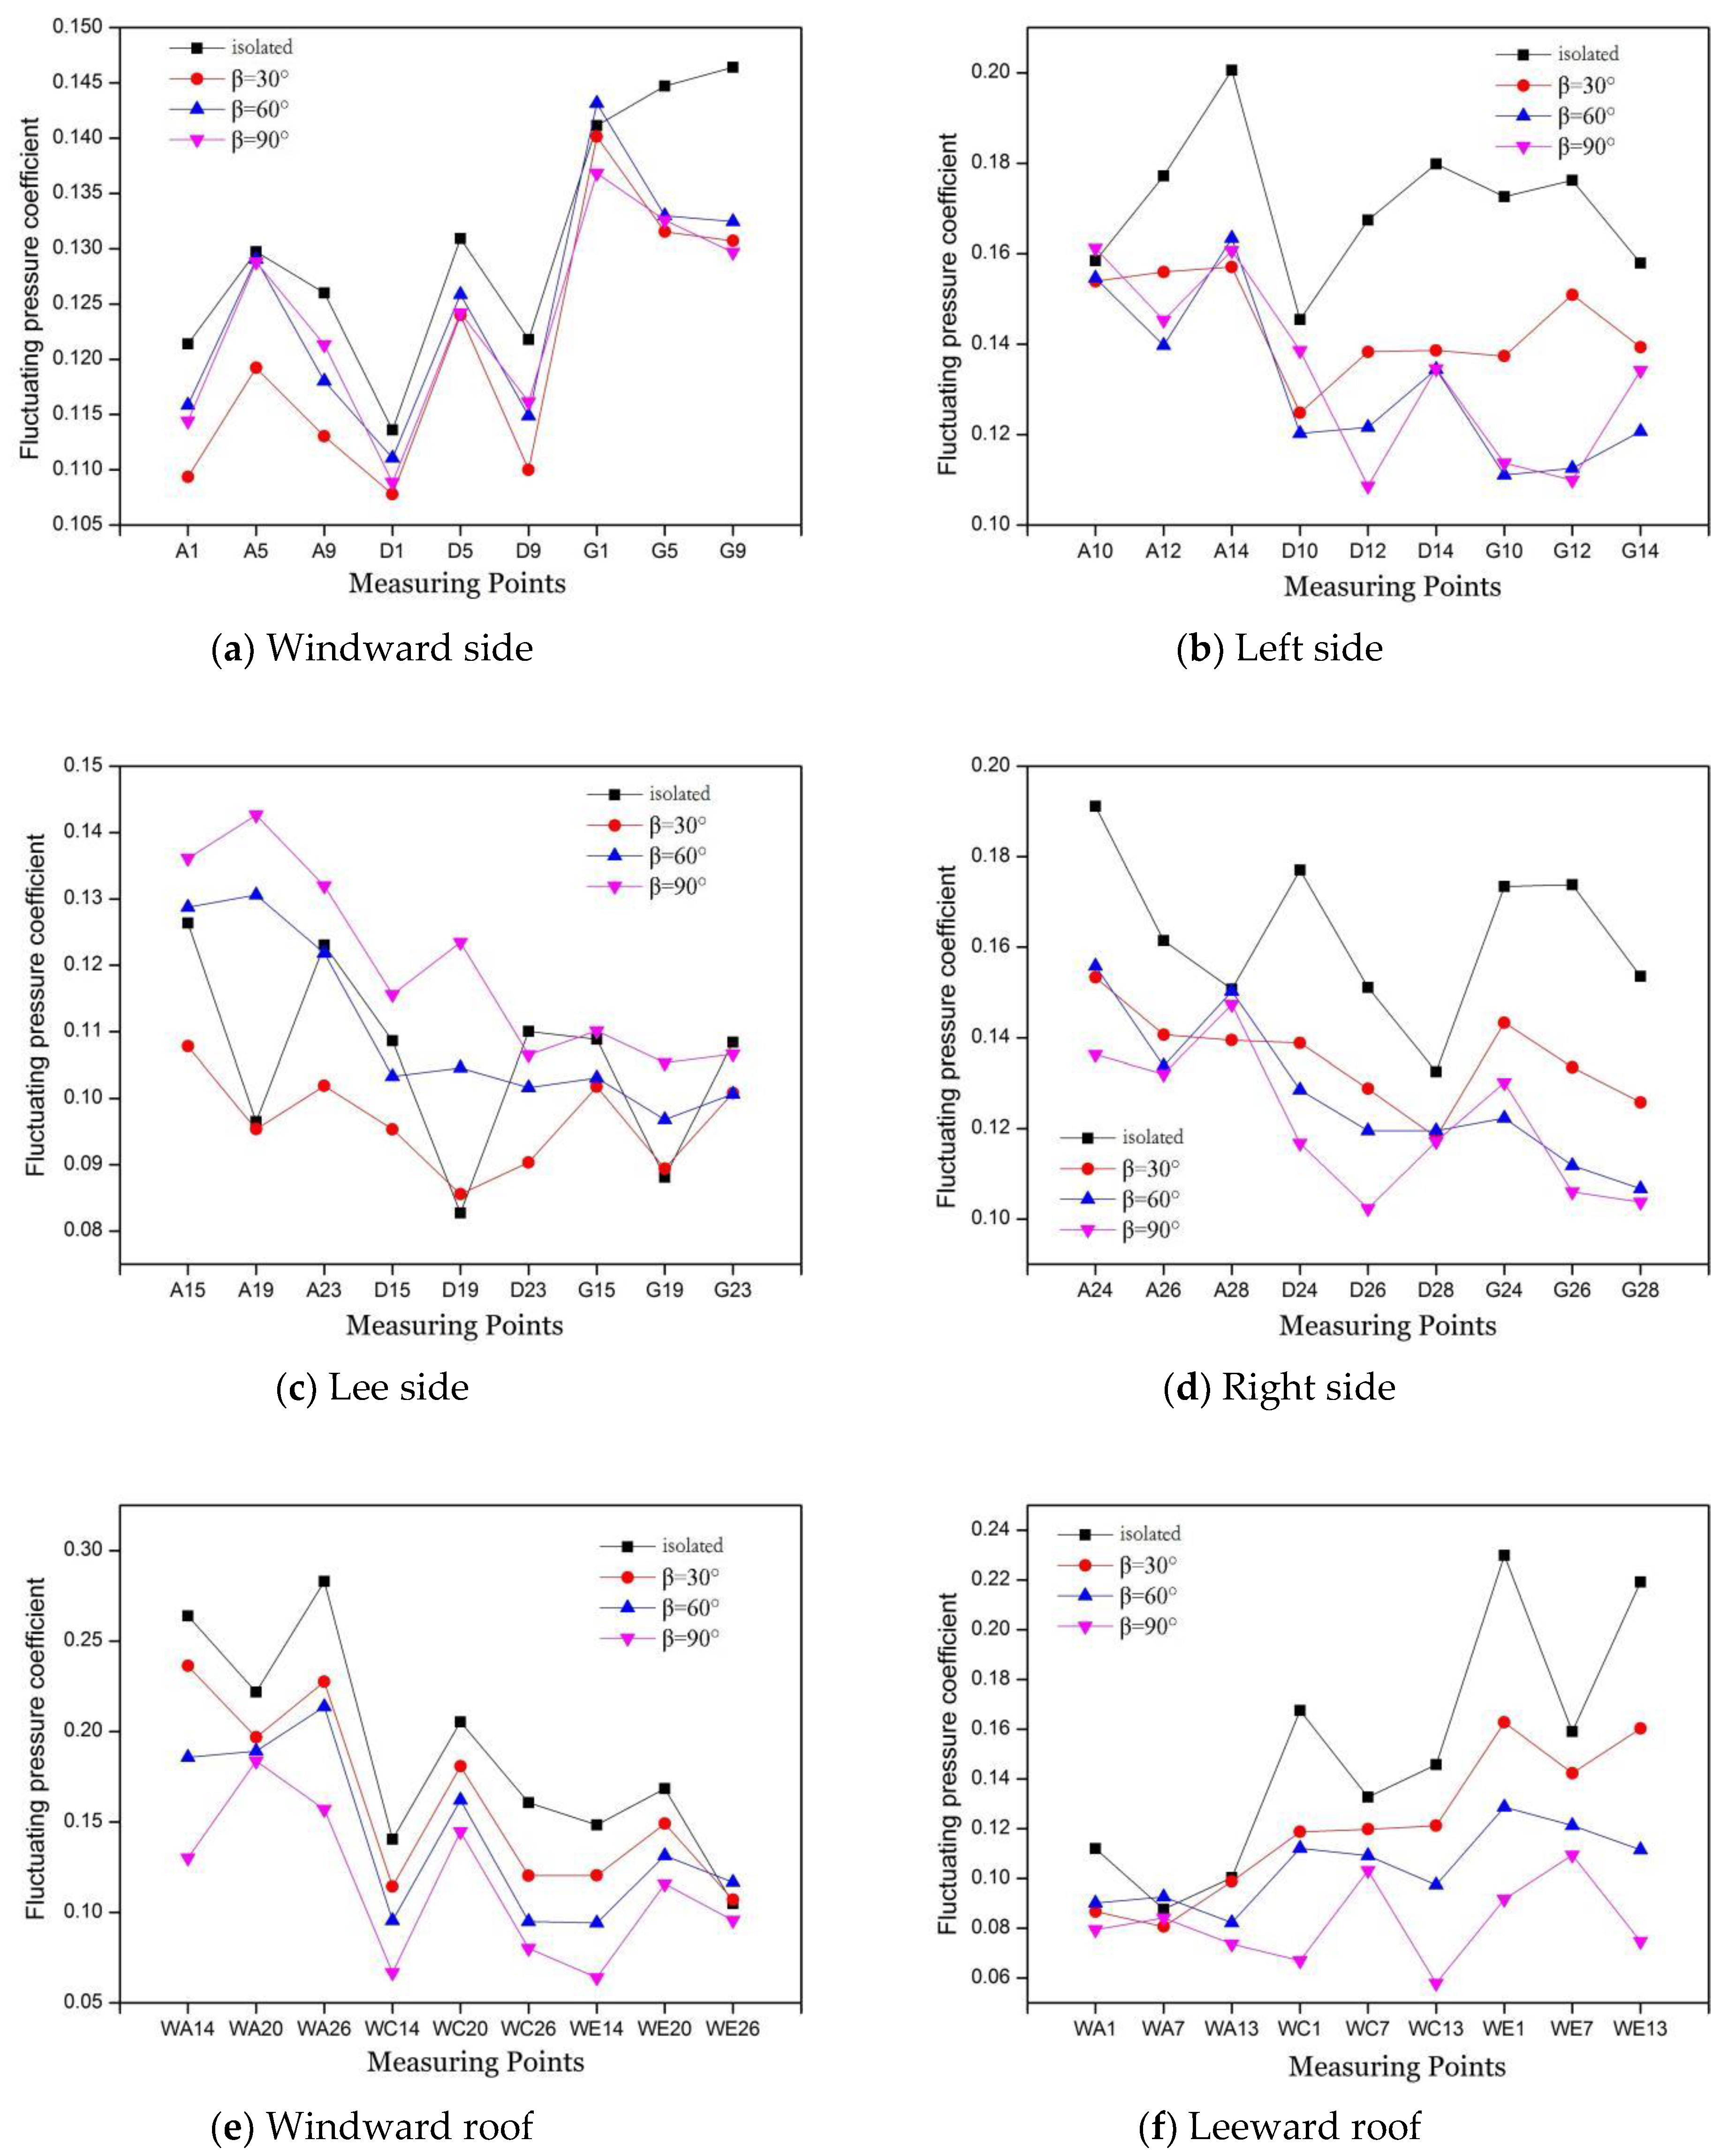
In order to analyze the change in average wind pressure coefficient of the measuring points with slope height in detail, the measuring points at the center line and the left and right edges of the low-rise building model were selected (as shown in Figure 8). We select representative measuring points from Figure 3. For example, A1, A5 and A9 measuring points are selected from the inside. Column A1 represents the center line measuring point, and A5 and A9 represent the two edge measuring points. Other surfaces are similar.
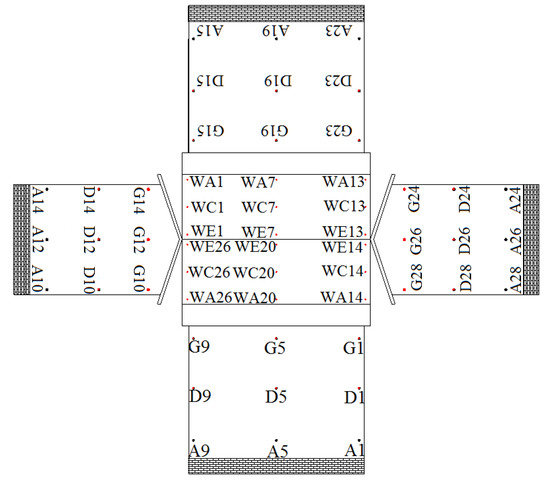
Figure 8.
Layout of key measuring points.
Figure 9a shows that for the windward side, midline points A5 and D5, in the absence of surroundings and under the three mountain forms with different slopes, had significant fluctuating wind pressure coefficients compared with the edges. In row G, the edge measuring point G1 had a large fluctuating wind pressure coefficient compared with others. Without the influence of the surrounding environment, the coefficient at D1 decreased by 13.2% relative to that at D5. For the measuring points of row G, without the influence of the surrounding environment and in mountain forms with different slopes, the coefficients at G1, G5, and G9 gradually decreased.
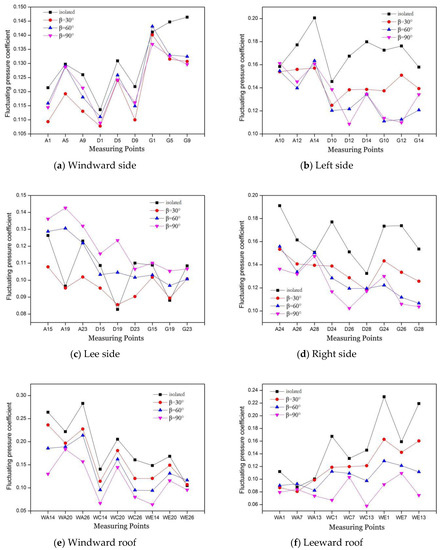
Figure 9.
Fluctuating wind pressure coefficients of representative measuring points.
According to Figure 9b, for the left side, without the influence of the surrounding environment and under working condition 5, in rows A and D, edge measuring points A14 and D14 had large fluctuating wind pressure coefficients compared with other measuring points. Without the influence of the surrounding environment, the coefficient of A14 increased by 13.2% compared with that of A12. In row A, under working conditions 14 and 23, the middle measuring point A12 had a small fluctuating wind pressure coefficient compared with the edge measuring points A10 and A14. In rows D and G, under working condition 14, D10 and G10 had the largest value among the measuring points. In contrast, under working condition 23, middle measuring points D12 and G12 had small values compared with the edge measuring points. The value of D10 increased by 27.6% compared with that of D12.
According to Figure 9c, for the leeward side, without the influence of the surrounding environment and under working condition 5, the fluctuating wind pressure coefficients of middle measuring points were smaller than those of edge measuring points. Under the same conditions, the values of middle and edge measuring points differed considerably, and the value of D23 increased by 32.9% compared with that of D19. Under working conditions 14 and 23, in rows A and B, the values of middle measuring points A19 and D19 were larger than that of edge measuring points. In row G the opposite was true, and the value of mid measuring point G19 was smaller than that of the edge measuring points.
According to Figure 9d, for the right side, without the influence of the surrounding environment, the fluctuating wind pressure coefficient was generally increased as compared with that under a mountain form, and the values of A24, D24, and G24 were larger than that of other measuring points in the same row. Under a mountain form of working condition 5, the fluctuating wind pressure coefficients of A26, D26, and G26 were also larger than that of other measuring points. Under working conditions 14 and 23, in rows A and D, the fluctuating wind pressure coefficient of A26 was larger than that of other measuring points but in row G, the fluctuating wind pressure coefficient of G28 was smaller.
Figure 9e,f show that for both windward and leeward roofs, the fluctuating wind pressure coefficient without the influence of the surrounding environment was larger than that under a mountain form of working conditions. As illustrated, the values of measuring points under different working conditions decreased significantly with the slope gradient increase except for WE26 of the windward roof and WA1 and WA7 of the leeward roof. The changes of middle measuring points WA20 for eaves, edge measuring points WE26 for the ridge, and middle measuring points WA7, WC7, and WE7 for the leeward roof were less obvious than those of other measuring points with the increase of slope gradient.
For the windward side, due to less interference by mountain, the value of the central line measuring point is larger than that of the edge measuring point, while for other parts, due to the influence of mountains and surrounding flow, the distribution law of the surface wind pressure coefficient is less obvious.
3.2. Analysis of the Influence of Mountain Form Slope Gradient on Fluctuating Wind Pressure Coefficient under Different Wind Angles
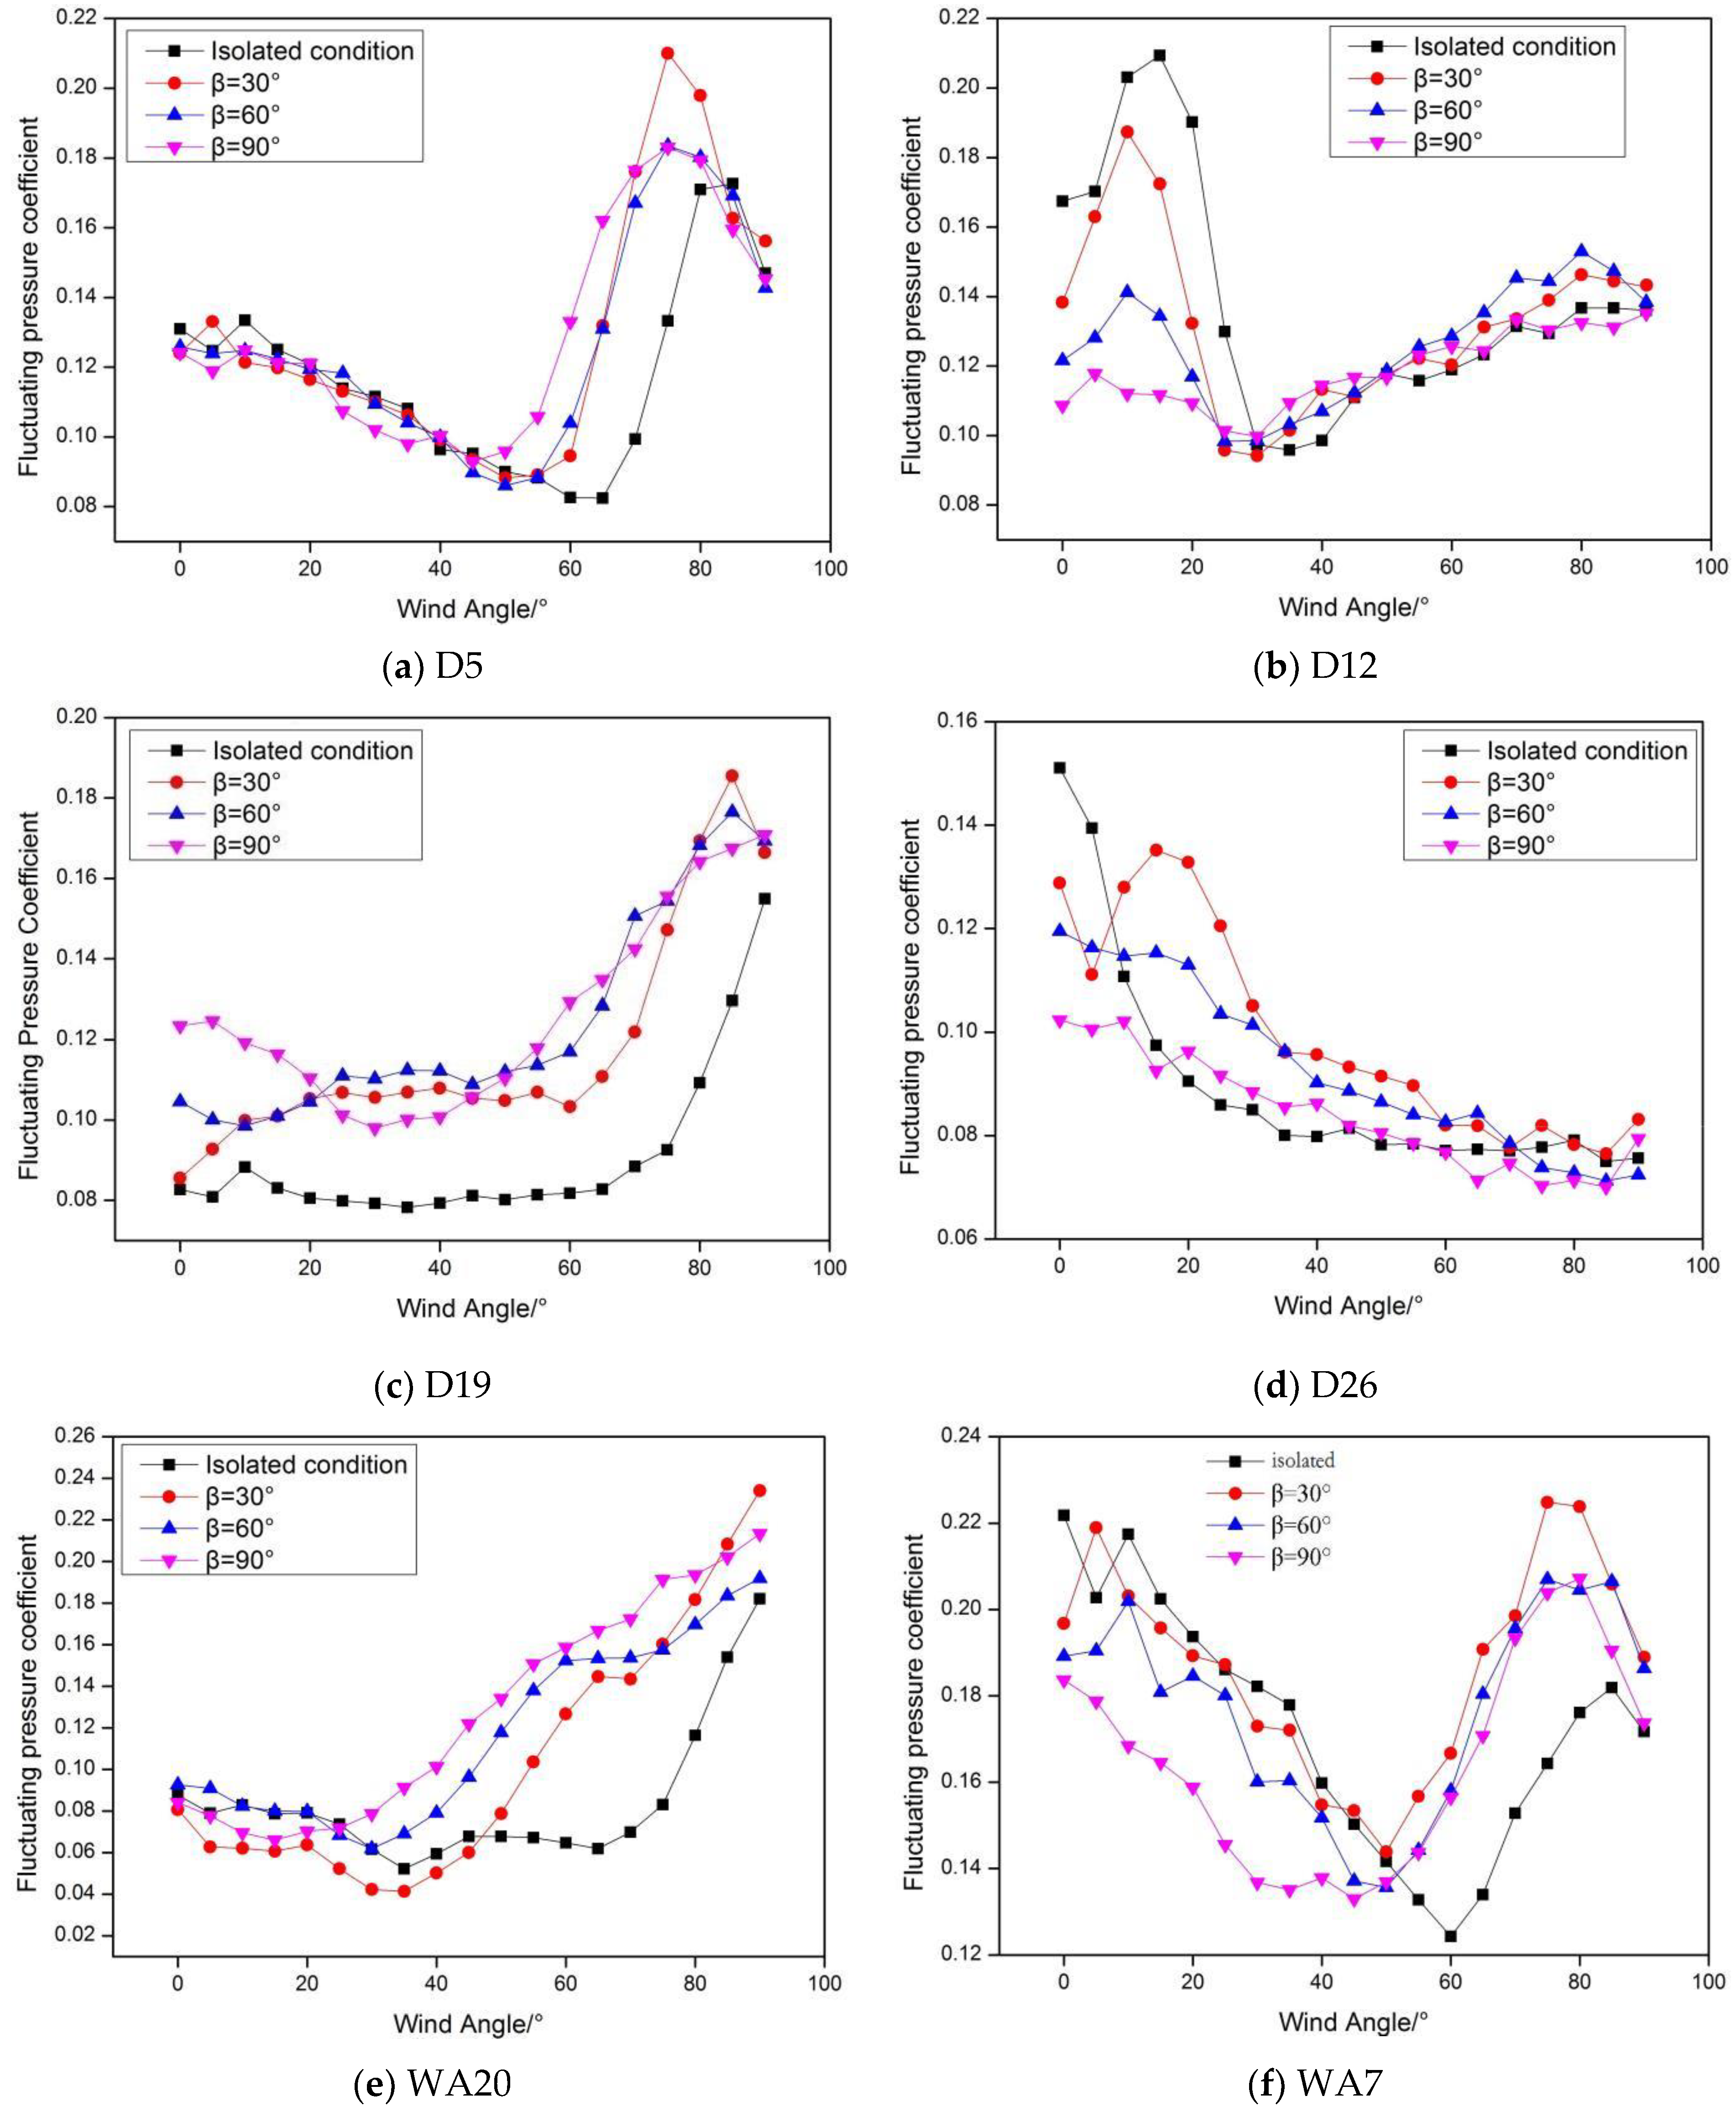
As shown in Figure 10a, with the increase of the wind angle, the fluctuating wind pressure coefficient of middle measuring point D5 for the windward side decreased first, then increased, and dropped again at last. When the wind angle was 0°~50°, there was little difference in the fluctuating wind pressure coefficient between various working conditions, and there was no apparent law for this phenomenon. As the wind angle continued to increase, the fluctuating wind pressure coefficient without the influence of the surrounding environment was smaller than that under a mountain form when the wind angle reached 60°~80°. If β = 30° with a wind angle of 75°, the maximum fluctuating wind pressure coefficient of 0.21 was achieved.
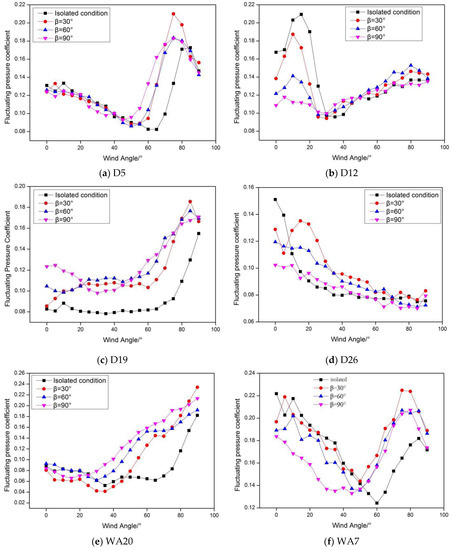
Figure 10.
Fluctuating wind pressure coefficients of representative measuring points with wind angle.
As illustrated in Figure 10b, with the increase of the wind angle, the fluctuating wind pressure coefficient of middle measuring point D12 on the left side first increased, then decreased, and dropped again at last. When the wind angle was between 0° and 30°, the fluctuating wind pressure coefficient was larger than that under a mountain form without the influence of the surrounding environment. Similarly, under a mountain form, with the surge of the slope gradient, the coefficient also increased. When the wind angle was 15°, the maximum fluctuating wind pressure coefficient without the influence of the surrounding environment was 0.21. When the wind angle was 35°~90°, there was little difference in the fluctuating wind pressure coefficient between the four working conditions, and there was no apparent law for this phenomenon.
According to Figure 10c, for leeside middle measuring point D19, the fluctuating wind pressure coefficient gradually increased the wind angle. When the wind angle was between 0° and 75°, without the influence of the surrounding environment, the fluctuating wind pressure coefficient changed by about 0.08. When the wind angle was 80°, the fluctuating wind pressure coefficient considerably changed, and under a mountain form, with the increase of the slope gradient, there was no noticeable difference in the pulsating wind pressure coefficient between different slopes. These results prove that the law behind these phenomena was not so obvious.
According to Figure 10d, the fluctuating wind pressure coefficient of middle measuring point D26 on the right side gradually decreased with the increase of the wind angle. When the wind angle was 0°, the maximum fluctuating wind pressure coefficient was 0.15.
As shown in Figure 10e, with the increase in wind angle, the fluctuating wind pressure coefficient of midline measuring point WA20 at the windward eaves dropped first and then increased. When the wind angle was between 0° and 45°, the fluctuating wind pressure coefficient at the slope gradient of 90° was smaller than under other conditions. Similarly, when the wind angle ranged between 55° and 90°, the fluctuating wind pressure coefficient without the influence of the surrounding environment was smaller than that under other conditions. Furthermore, when the wind angle was 80°, the maximum fluctuating wind pressure coefficient was 0.23.
According to Figure 10f, with the increase in the wind angle, the fluctuating wind pressure coefficient of the middle measuring point WA7 at the leeward eaves increased gradually. When the wind angle was between 0° and 75°, the fluctuating wind pressure coefficient ranged between 0.05 and 0.10. However, when the wind angle was between 80° and 90°, the fluctuating wind pressure coefficient considerably increased. Under a mountain form, when the wind angle was between 25° and 80°, the fluctuating wind pressure coefficient gradually increased with the slope gradient.
As different measuring points are affected by the wind direction angle, the fluctuating wind pressure coefficient changes differently. Among them, the fluctuating wind pressure coefficient on the windward side and the left side decreases first and then increases due to the gradual change of the air flow from the front to the slope, while the fluctuating wind pressure coefficient on other surfaces increases or decreases gradually due to the influence of the hillside because they are located on the back of the wind direction angle.
3.3. Analysis on the Isoline of Disturbance Factors of Fluctuating Wind Pressure Coefficient Varying with Slope Gradient
In order to analyze the impact of mountains on low-rise buildings, interference factors are introduced to quantitatively describe the impact of mountains on the fluctuating wind pressure coefficient of low-rise buildings. The expression of impact coefficient IF is shown in Formula (4):
where and are the shape coefficients of low-rise buildings after being affected by mountains and without surroundings, i = 1,2,3.
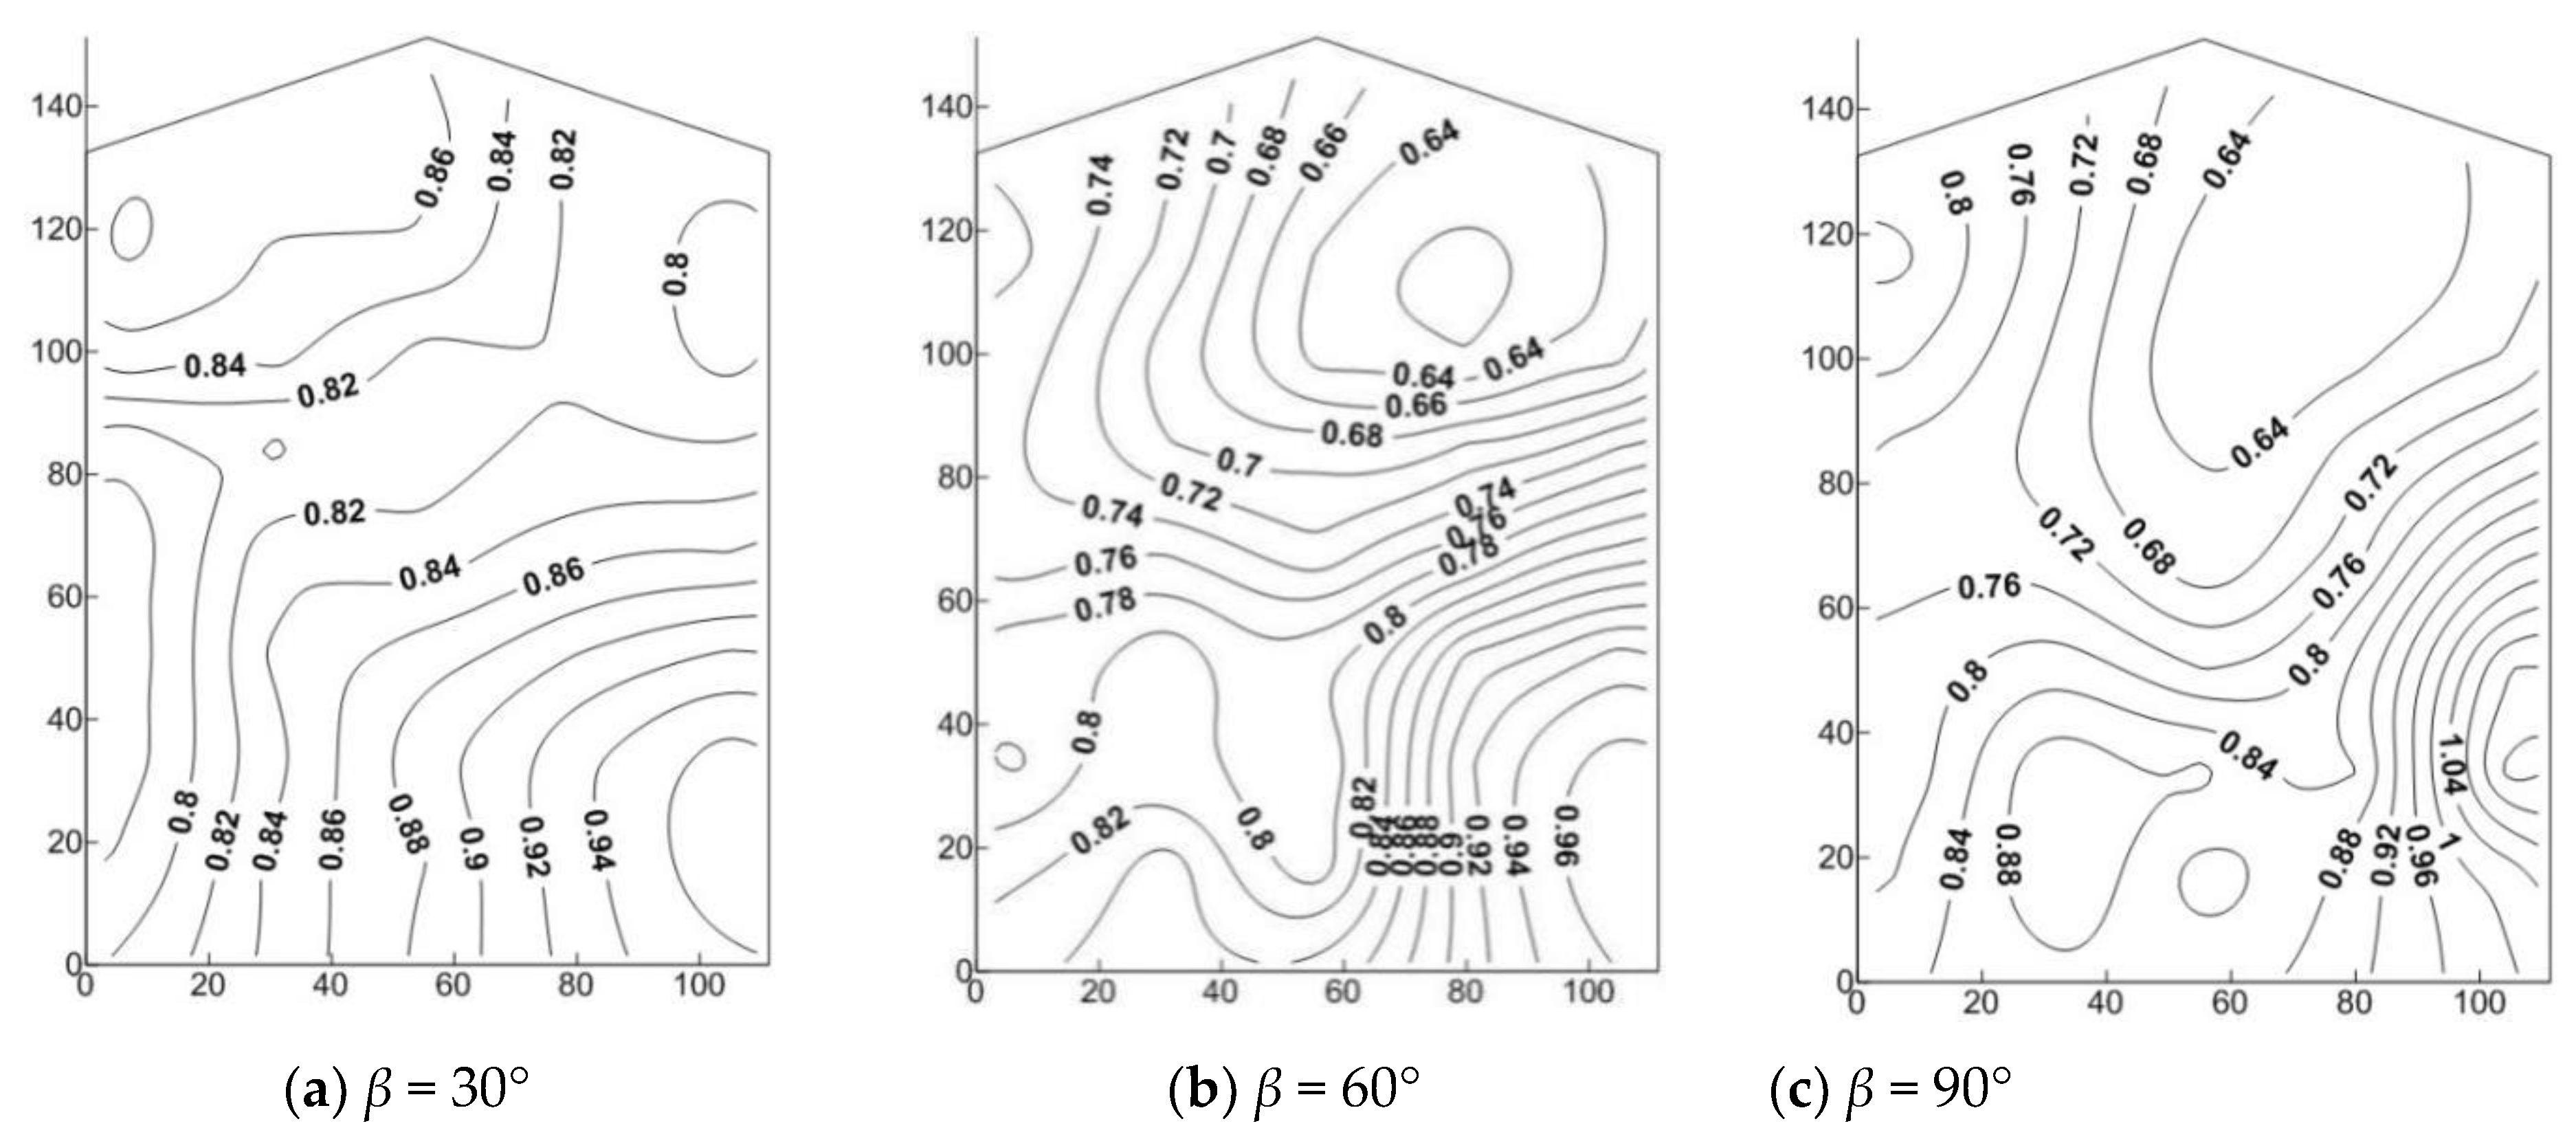
According to Figure 11, on the windward side, for a slope gradient β = 30°, the disturbance factors were all less than 1, varying from 0.91 to 0.96. These results indicate that on this side, the mountain form had a weakening effect on the fluctuating wind pressure coefficient as compared with the conditions without the influence of the surrounding environment. Furthermore, the largest disturbance factor (0.955) was found in the right center area of the windward side, and the smallest disturbance factor (0.905) was found in the area above the left edge. For a slope gradient β = 60°, the disturbance factor varied from 0.92 to 0.995, which increased as compared with that for slope gradient β = 30°, indicating that the influence of the mountain form weakened at this point. The maximum disturbance factor (0.99) was located in the bottom middle area of the windward side, and the minimum disturbance factor was in the upper left area. For a slope gradient β = 90°, the disturbance factors varied from 0.92 to 1.0, which had a change in distribution as compared with that for slope gradient β = 60°. The largest disturbance factor (1.0) was found in the left central area at the bottom, and the smallest disturbance factor (0.64) was in the upper left area.

Figure 11.
Isolines of disturbance factors on the windward side.
Since the windward side is far away from the hillside, the airflow flowing through the windward side is affected by the foot of the hillside, so the fluctuating wind pressure coefficient is less affected by the mountain.
According to Figure 12, for a slope gradient β = 30°, the disturbance factor on the left side varied from 0.8 to 0.94, with the maximum located below the right edge and the minimum above the right edge. For a slope gradient β = 60°, the disturbance factor on the left side varied from 0.64 to 1.04, with the maximum located below the right edge and the minimum at the upper right side. Finally, for a slope gradient β = 90°, the maximum disturbance factor increased or even exceeded one as compared with slope gradient β = 60°, indicating that with the increase of slope gradient, influenced by a mountain form, the fluctuating wind pressure coefficient in the area under the right edge on the right side increased. As the windward side is less affected by the slope, the change of interference factors is not obvious when the slope increases.
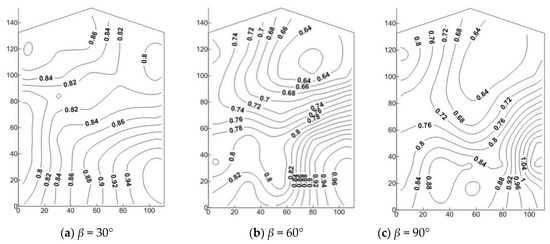
Figure 12.
Isolines of disturbance factors on the left side.
According to Figure 13, on the lee side, for a slope gradient β = 30°, the disturbance factor varied from 0.85 to 1.03, with the maximum of 1.03 located in the area above the center and the minimum of 0.85 located at the left and right edges of the leeward side. For a slope gradient β = 60°, the disturbance factors varied from 1.0 to 1.3, with the maximum of 1.3 located at the bottom central area and the minimum at the left and right edges of the lee side. Finally, for a slope gradient β = 90°, the disturbance factor varied from 1.09 to 1.44, which increased as compared with that for slope gradient β = 60°.

Figure 13.
Isolines of disturbance factors on the leeside.
As the leeward side is close to the mountain, the vortex formed by the mountain and buildings gradually moves down with the increase of the slope. When the wind direction angle is 90°, the wind speed on the leeward side is more disordered compared with 30°, and the overall fluctuating wind pressure coefficient also gradually increases.
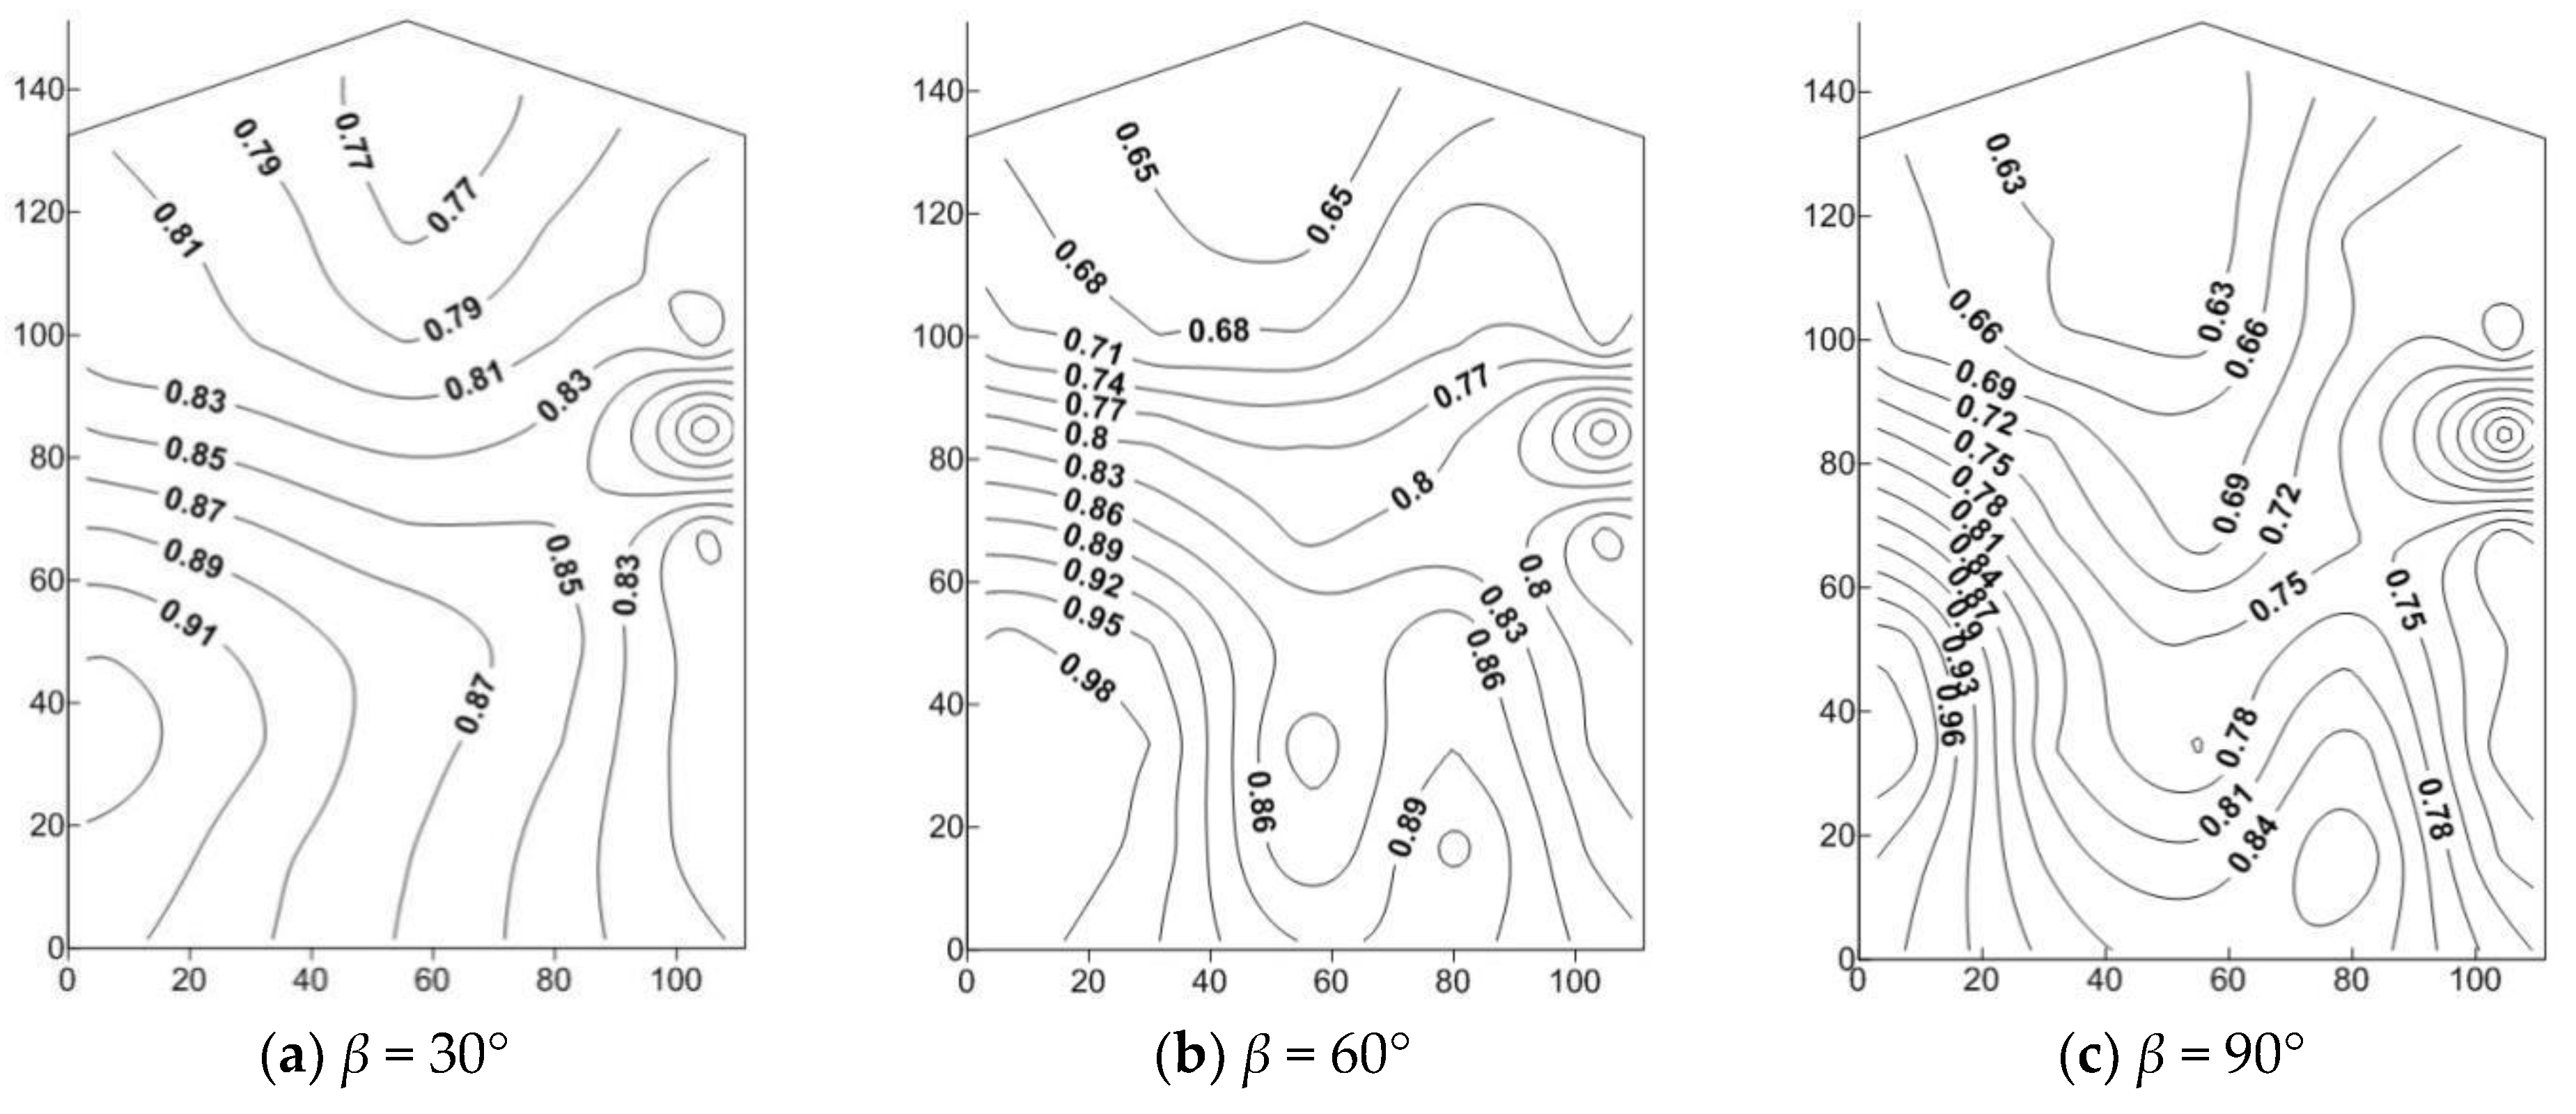
According to Figure 14, on the right side, for a slope gradient β = 30°, the fluctuating wind pressure coefficient varied from 0.77 to 0.91, with the maximum located in the area below the left edge and the minimum in the middle area above the side. For a slope gradient β = 60°, the fluctuating wind pressure coefficient varied from 0.65 to 0.98, with the same distribution as that for the slope gradient β = 30°. However, the maximum increased and the minimum decreased as compared with slope gradient β = 30°, indicating that with the surge of the slope gradient, the top middle area was more affected while the left edge area was less affected by mountain form. Finally, for a slope gradient β = 90°, the disturbance factor varied from 0.63 to 0.84, which decreased as compared with that for slope gradient β = 60°, indicating that with the increase of slope gradient, the mountain form had a weakening effect on the fluctuating wind pressure coefficient for the side. As the leeward side increases with the slope, the flow around the mountain gradually affects the fluctuating wind pressure coefficient on the leeward side, resulting in a gradual increase in the value.
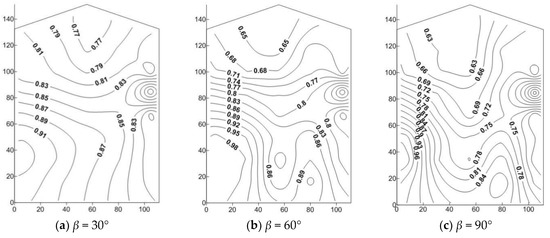
Figure 14.
Isolines of disturbance factors on the right side.
According to Figure 15, on the roof, for a slope gradient β = 30°, the disturbance factor varied from 0.84 to 0.92, with the maximum found at windward or leeward eaves. For a slope gradient β = 60°, the distribution of disturbance factors ranging from 0.7 to 0.9 considerably changed as compared with that for a slope gradient β = 30°, with the maximum located in the leeward eaves. Then, for a slope gradient β = 90°, the disturbance factor varied from 0.6 to 0.84, which decreased as compared with that for slope gradient β = 60°, with the maximum located in the middle area of the windward eaves and at the leeward eaves. With the increase of slope, the disturbance of airflow on the right side is smaller, leading to the gradual reduction of interference factors.

Figure 15.
Isolines of disturbance factors on the roof.
With the increase of the slope, the fluctuating wind pressure coefficient of the left and right sides and the roof decreases. This is mainly because with the increase of the slope, the airflow is more stable and the fluctuating wind pressure coefficient decreases. With the increase of mountain slope, the roof is gradually affected by the flow around the mountain slope, and the interference factors are gradually increased. After reaching a peak, the air flow area is stable, and the distribution map of interference factors tends to be stable.
4. Comparative Analysis on the Power Spectra of Representative Measuring Points with Slope Gradient
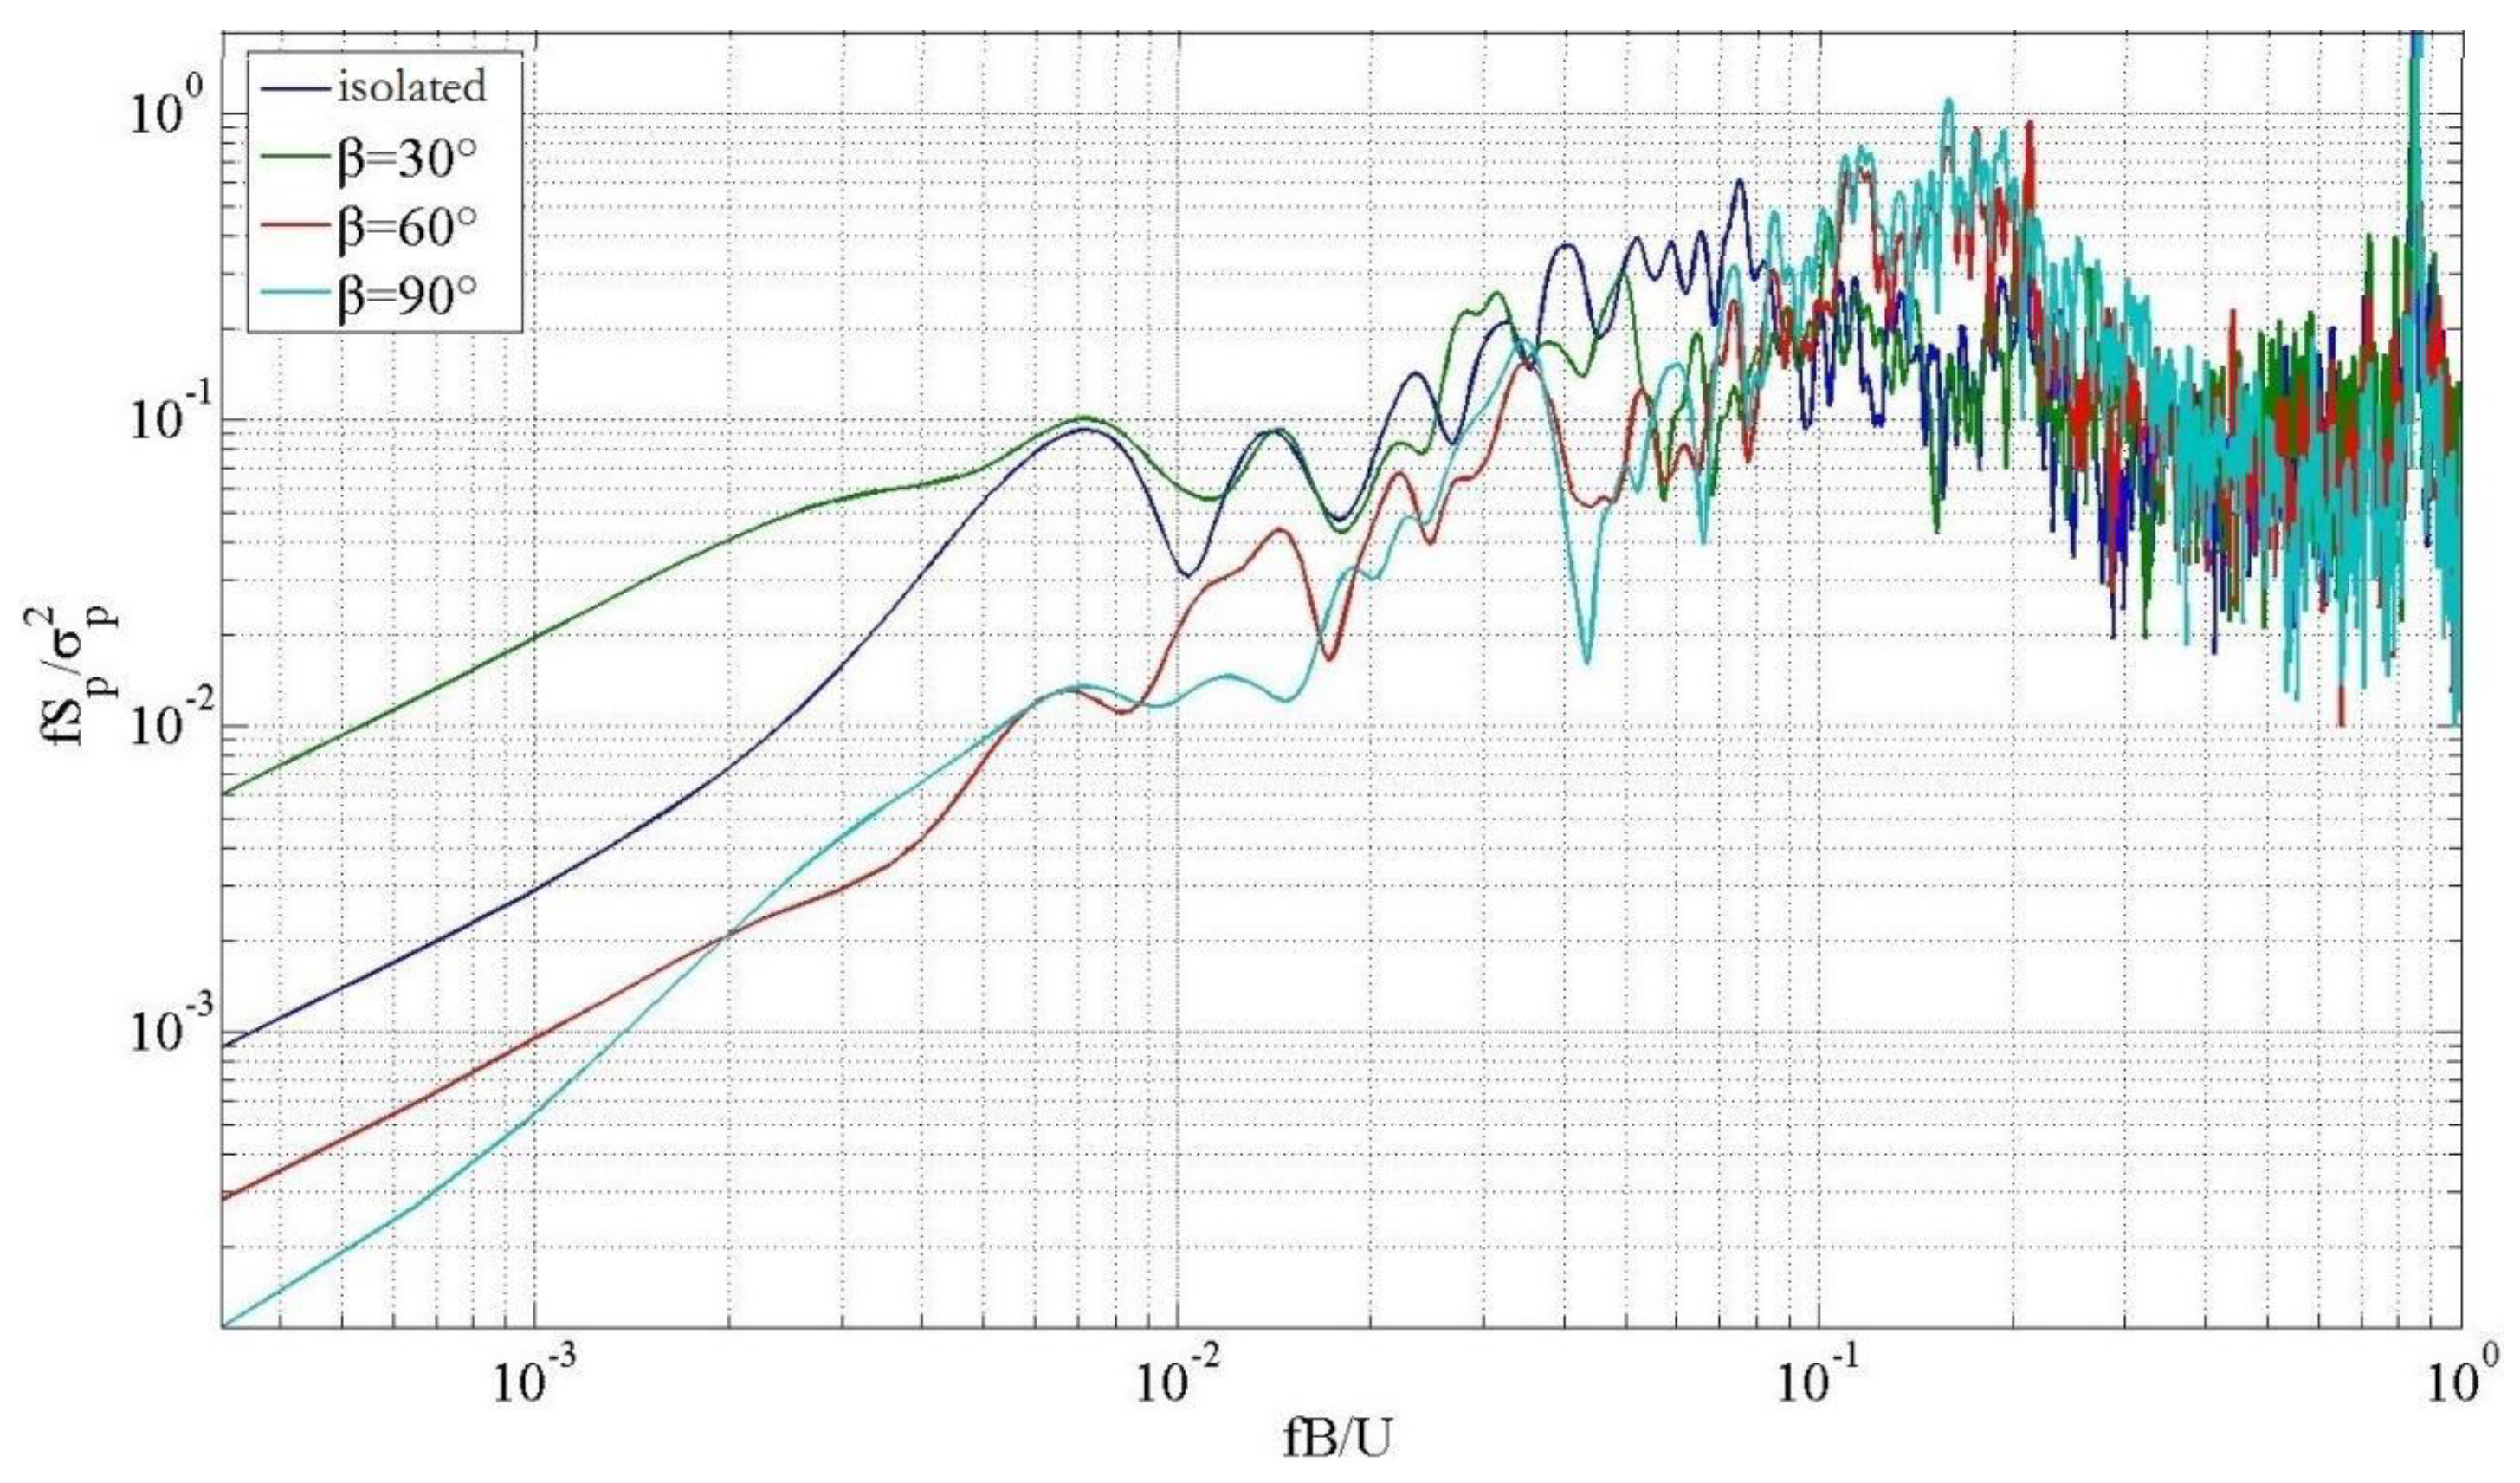
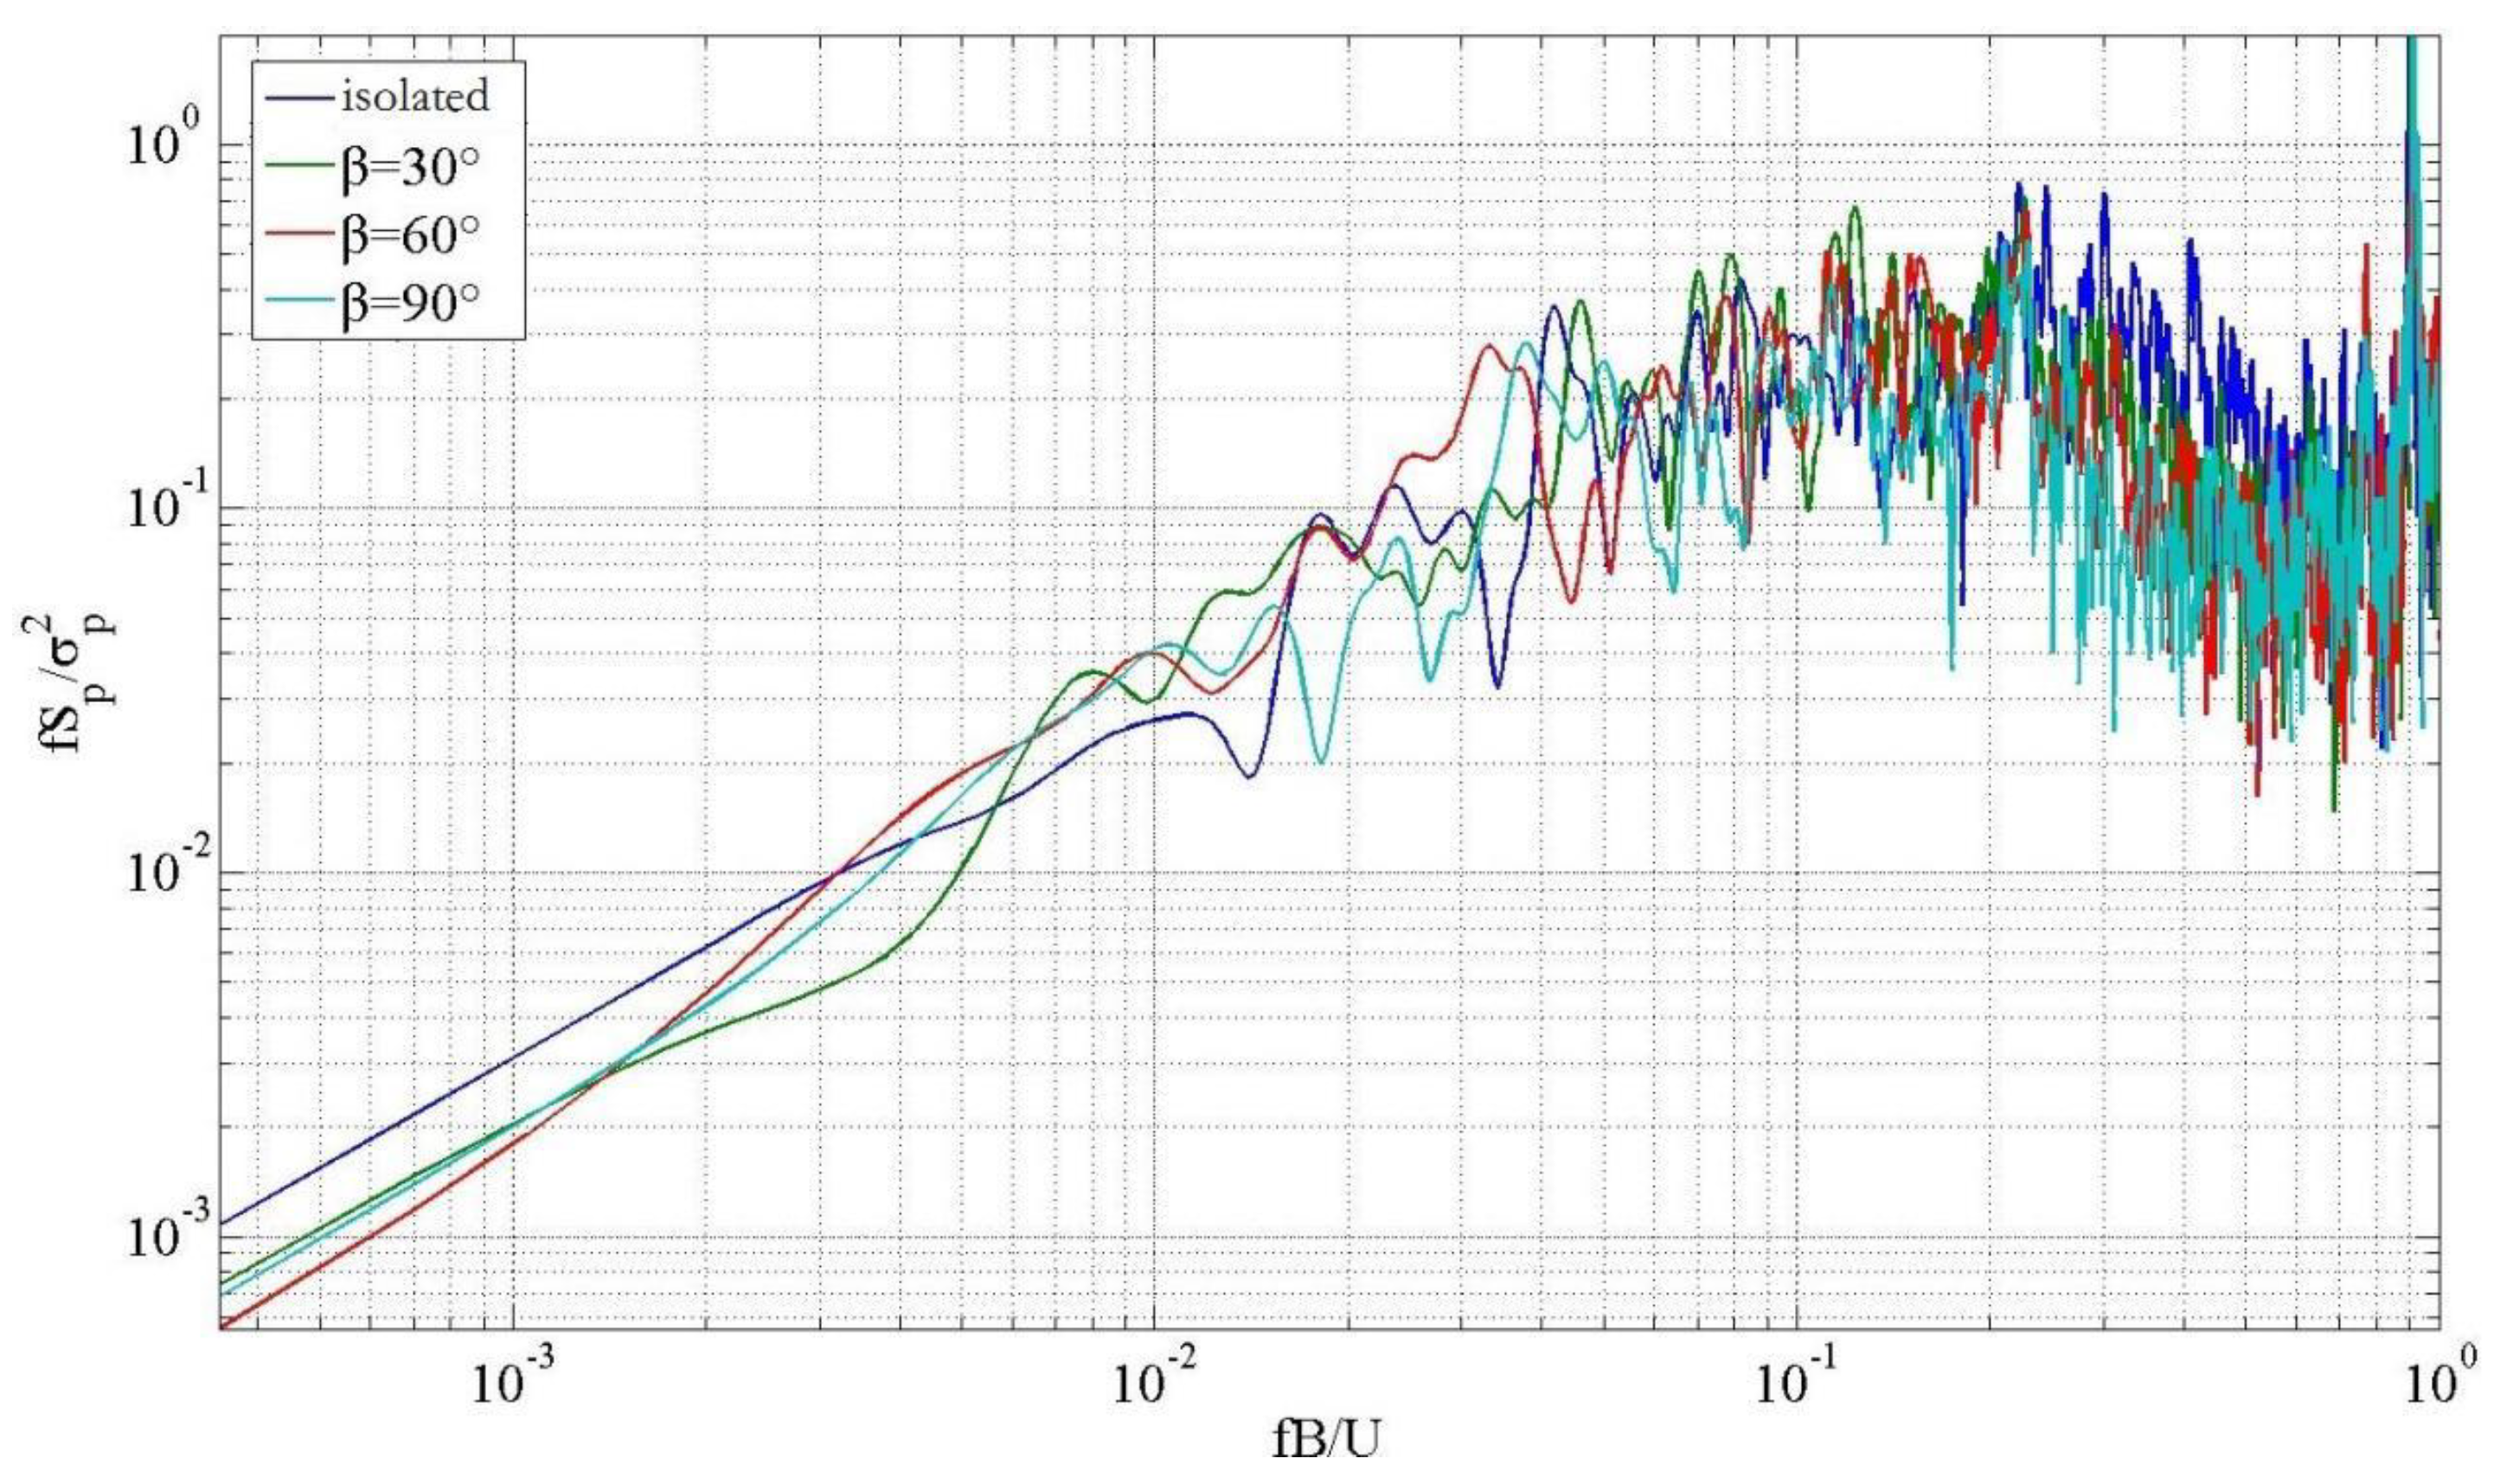
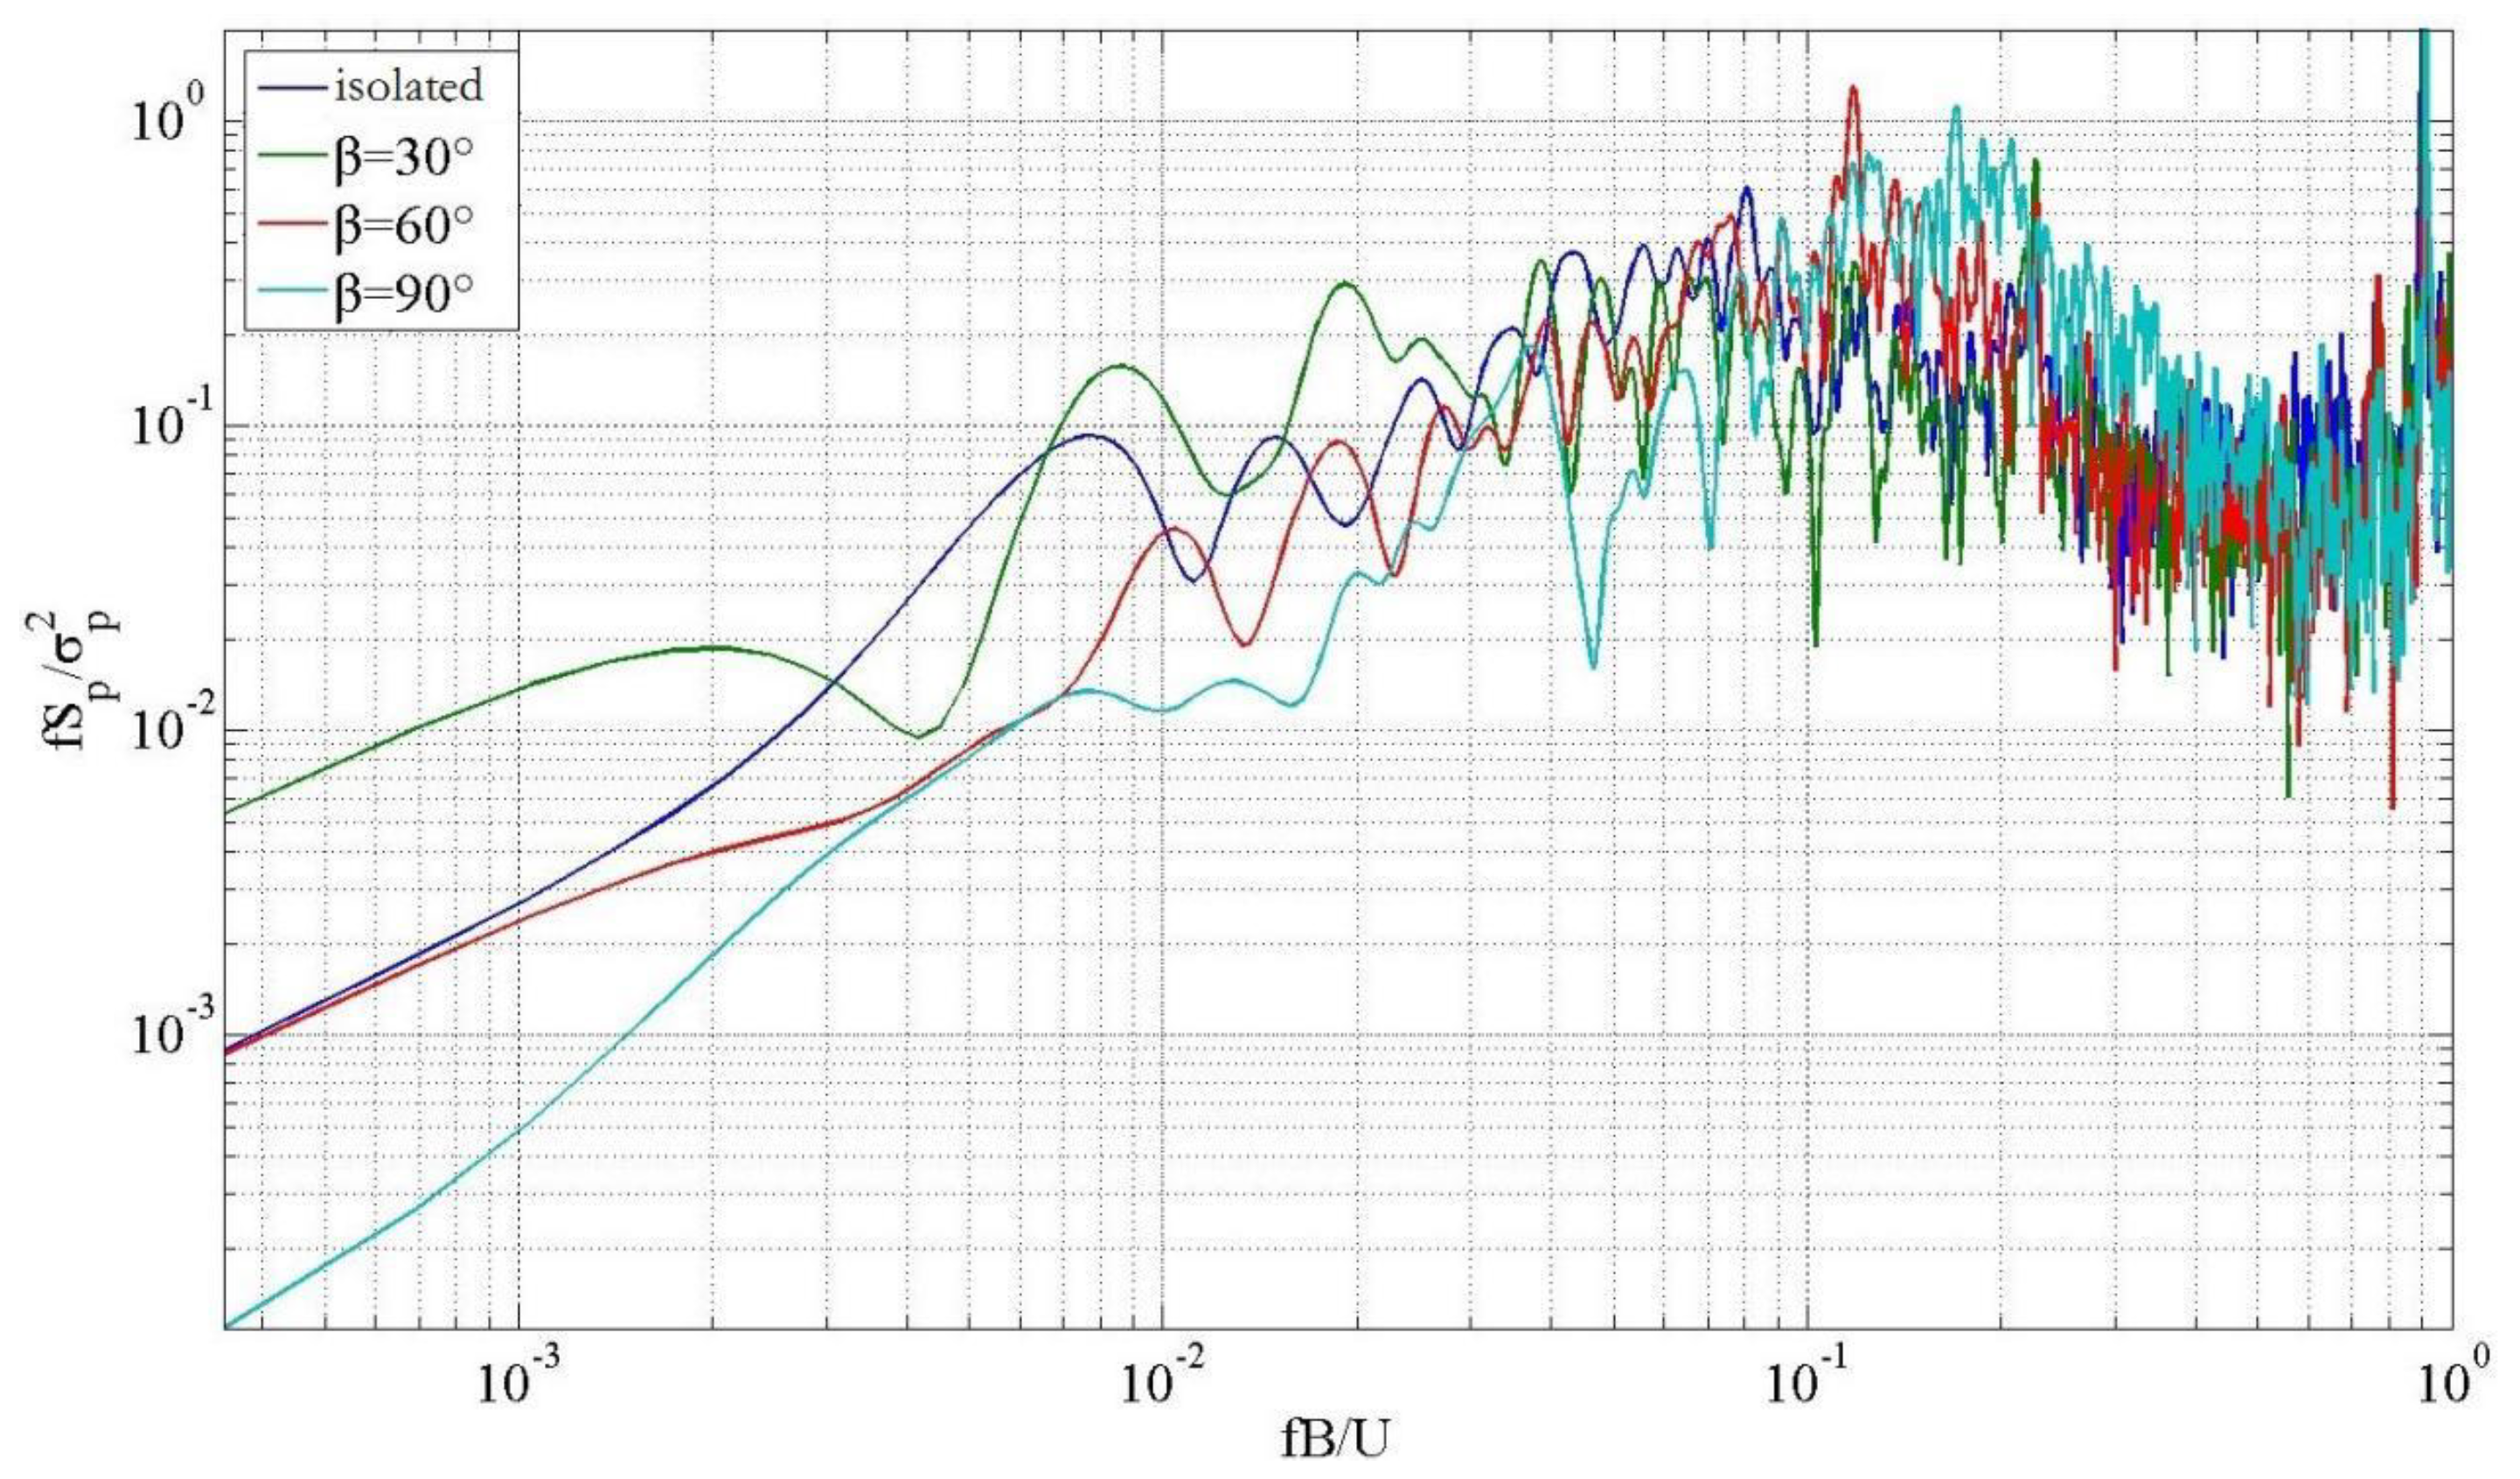
According to Figure 16, without the influence of the surrounding environment, when the wind angle was 0°, the reduction frequency of middle measuring point D5 on the windward side was about 0.05 at low frequencies, and the peak value was about 0.52, while the energy was relatively low at high frequencies. For a slope gradient β = 30°, the low-frequency peak moved to the right and increased slightly, and the high-frequency peak also increased relative to that without the influence of the surrounding environment. With the increase of slope gradient, at the slope gradient β = 60°, the high frequency peak increased continuously while the low-frequency peak remained unchanged relative to the slope gradient β = 30°. At a slope gradient β = 90°, both peaks (low frequency and high frequency) decreased.
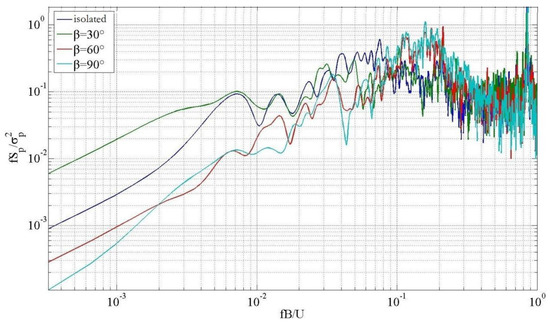
Figure 16.
Analysis of the power spectra of fluctuating wind pressure at measuring point D5 on the windward side with slope gradient.
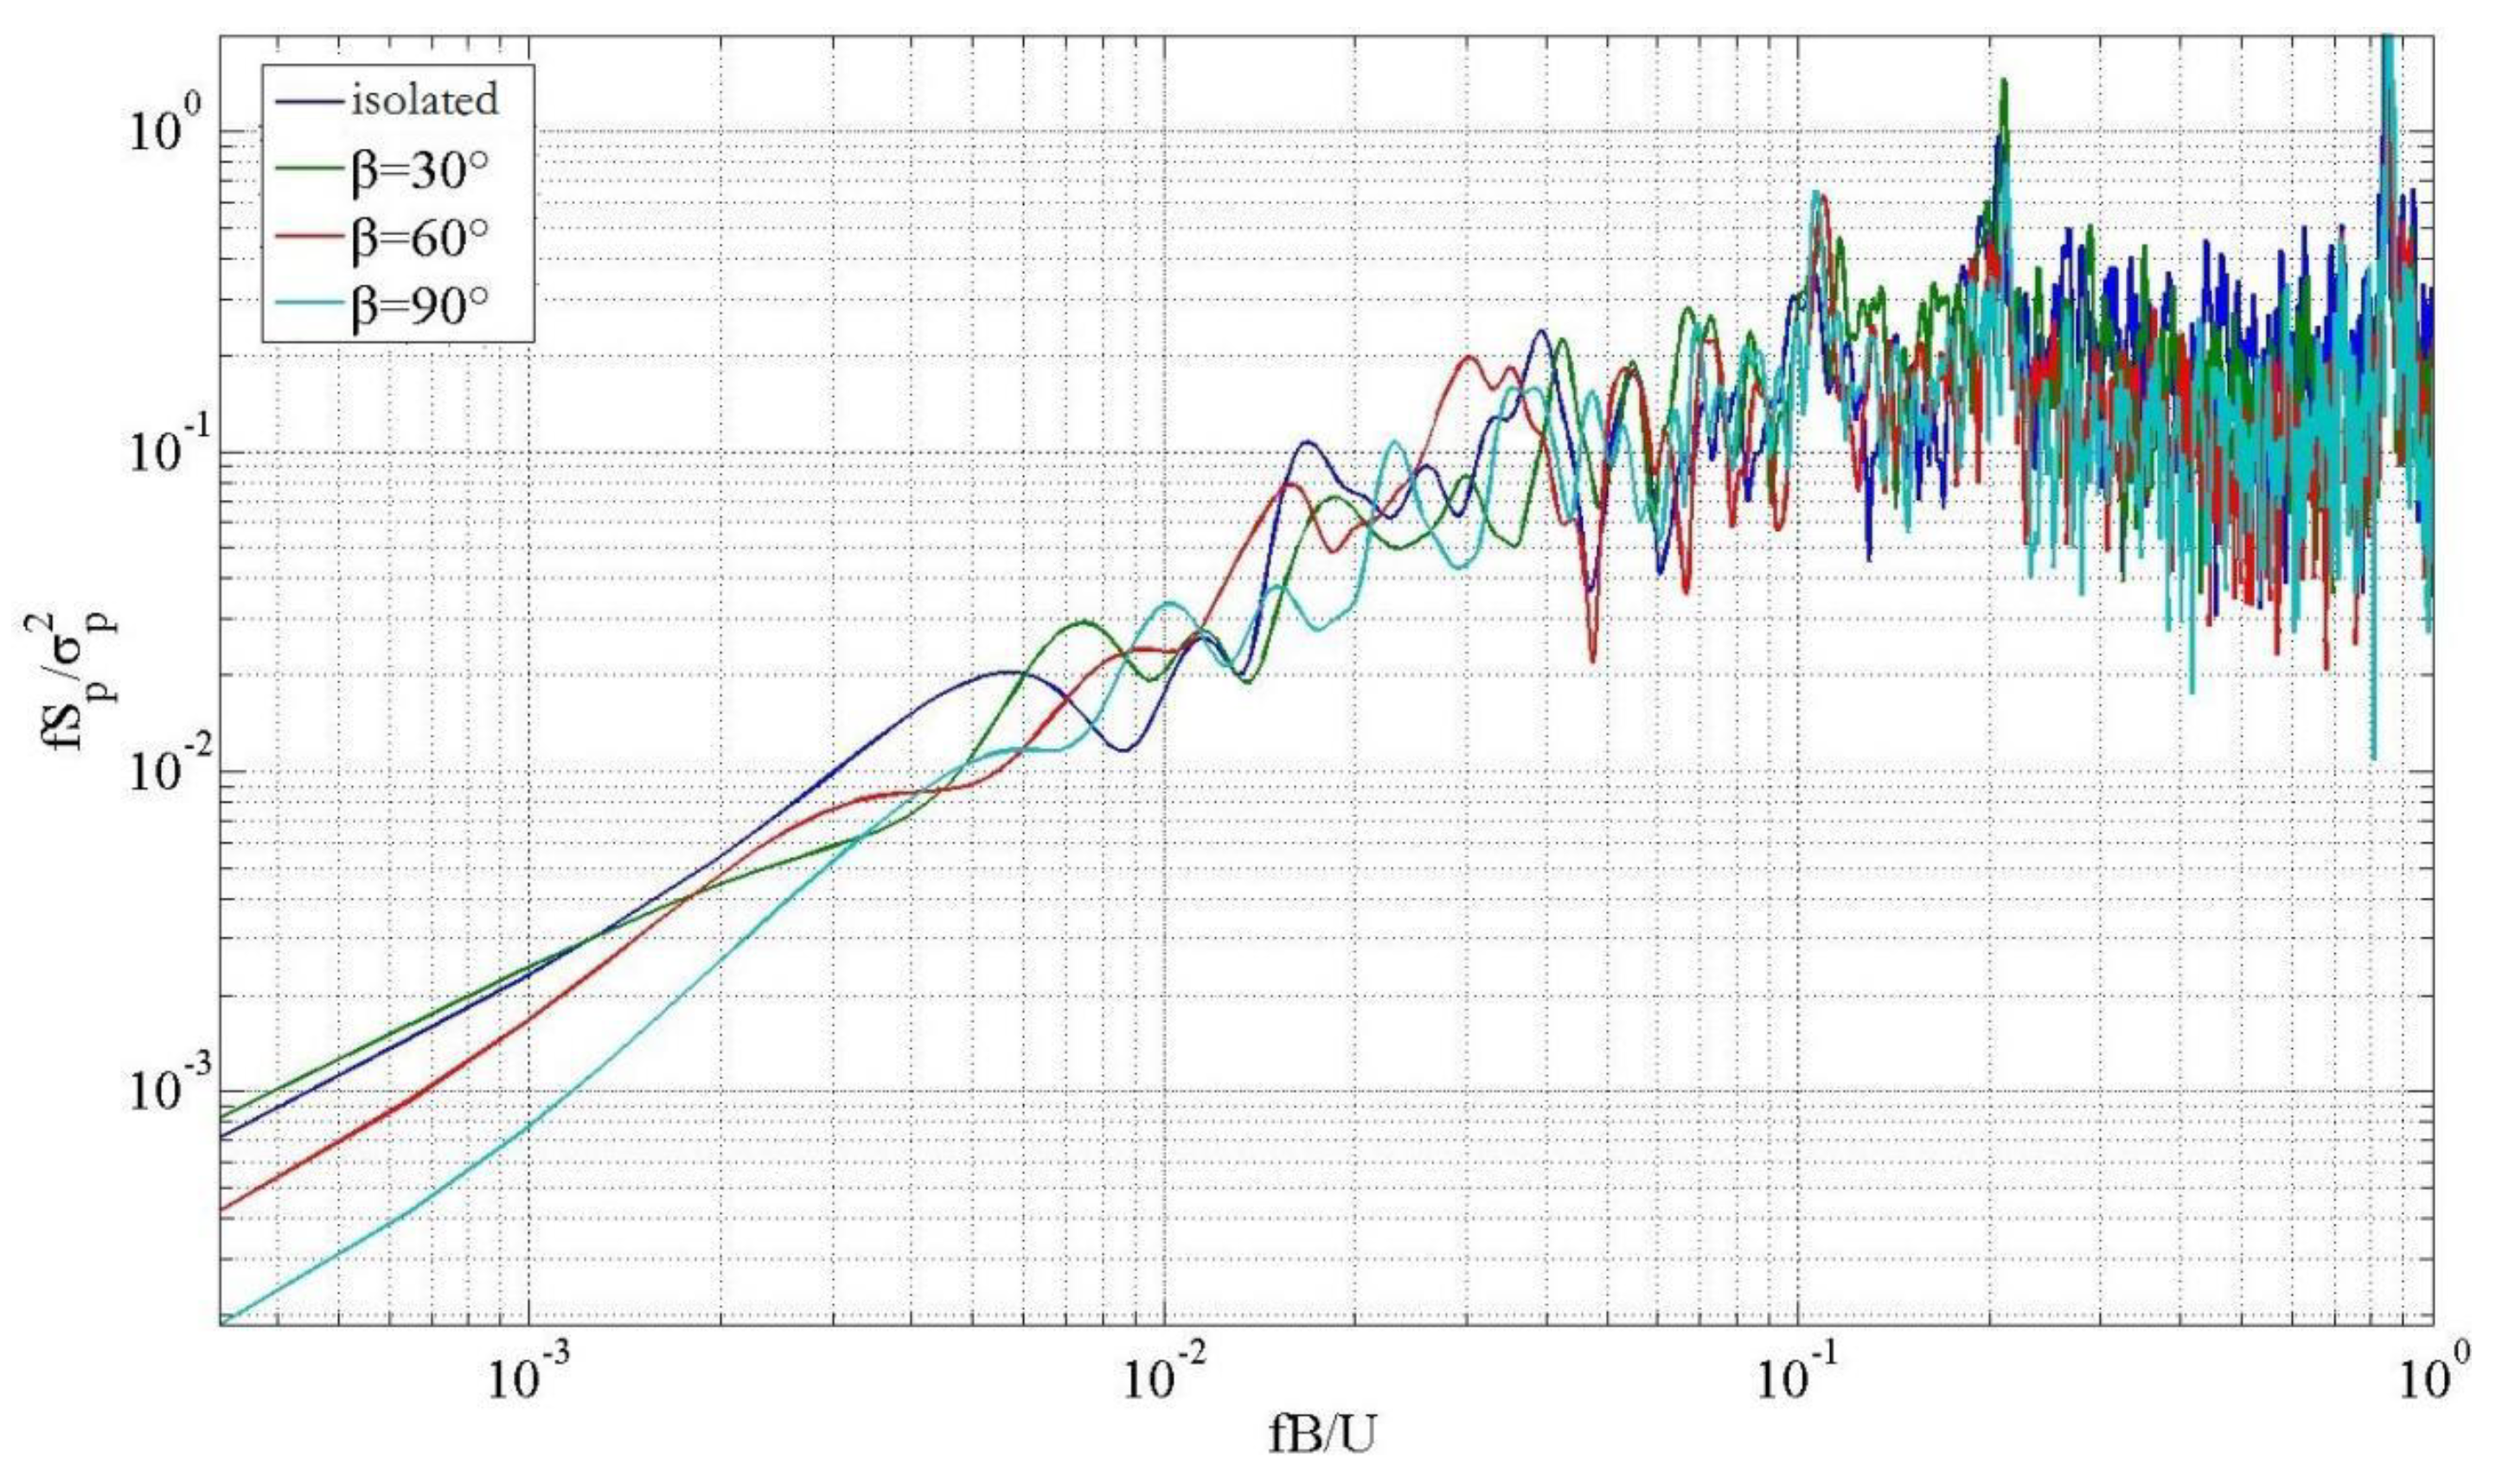
According to Figure 17, at wind angle 0°, middle measuring point D12 on the left side had a spike in the low frequency band, and also had an increasing trend in the high frequency band under a mountain form as compared with the condition without influence of surrounding environment. The main reason for this was a more significant influence in the turbulence property of the incoming wind itself, and the small-scale turbulence caused by the mountain form.
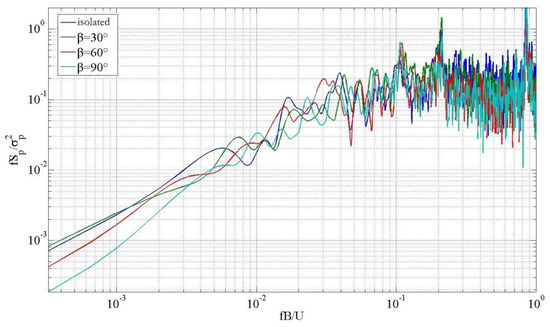
Figure 17.
Analysis of the power spectra of fluctuating wind pressure at measuring point D12 on the left side with slope gradient.
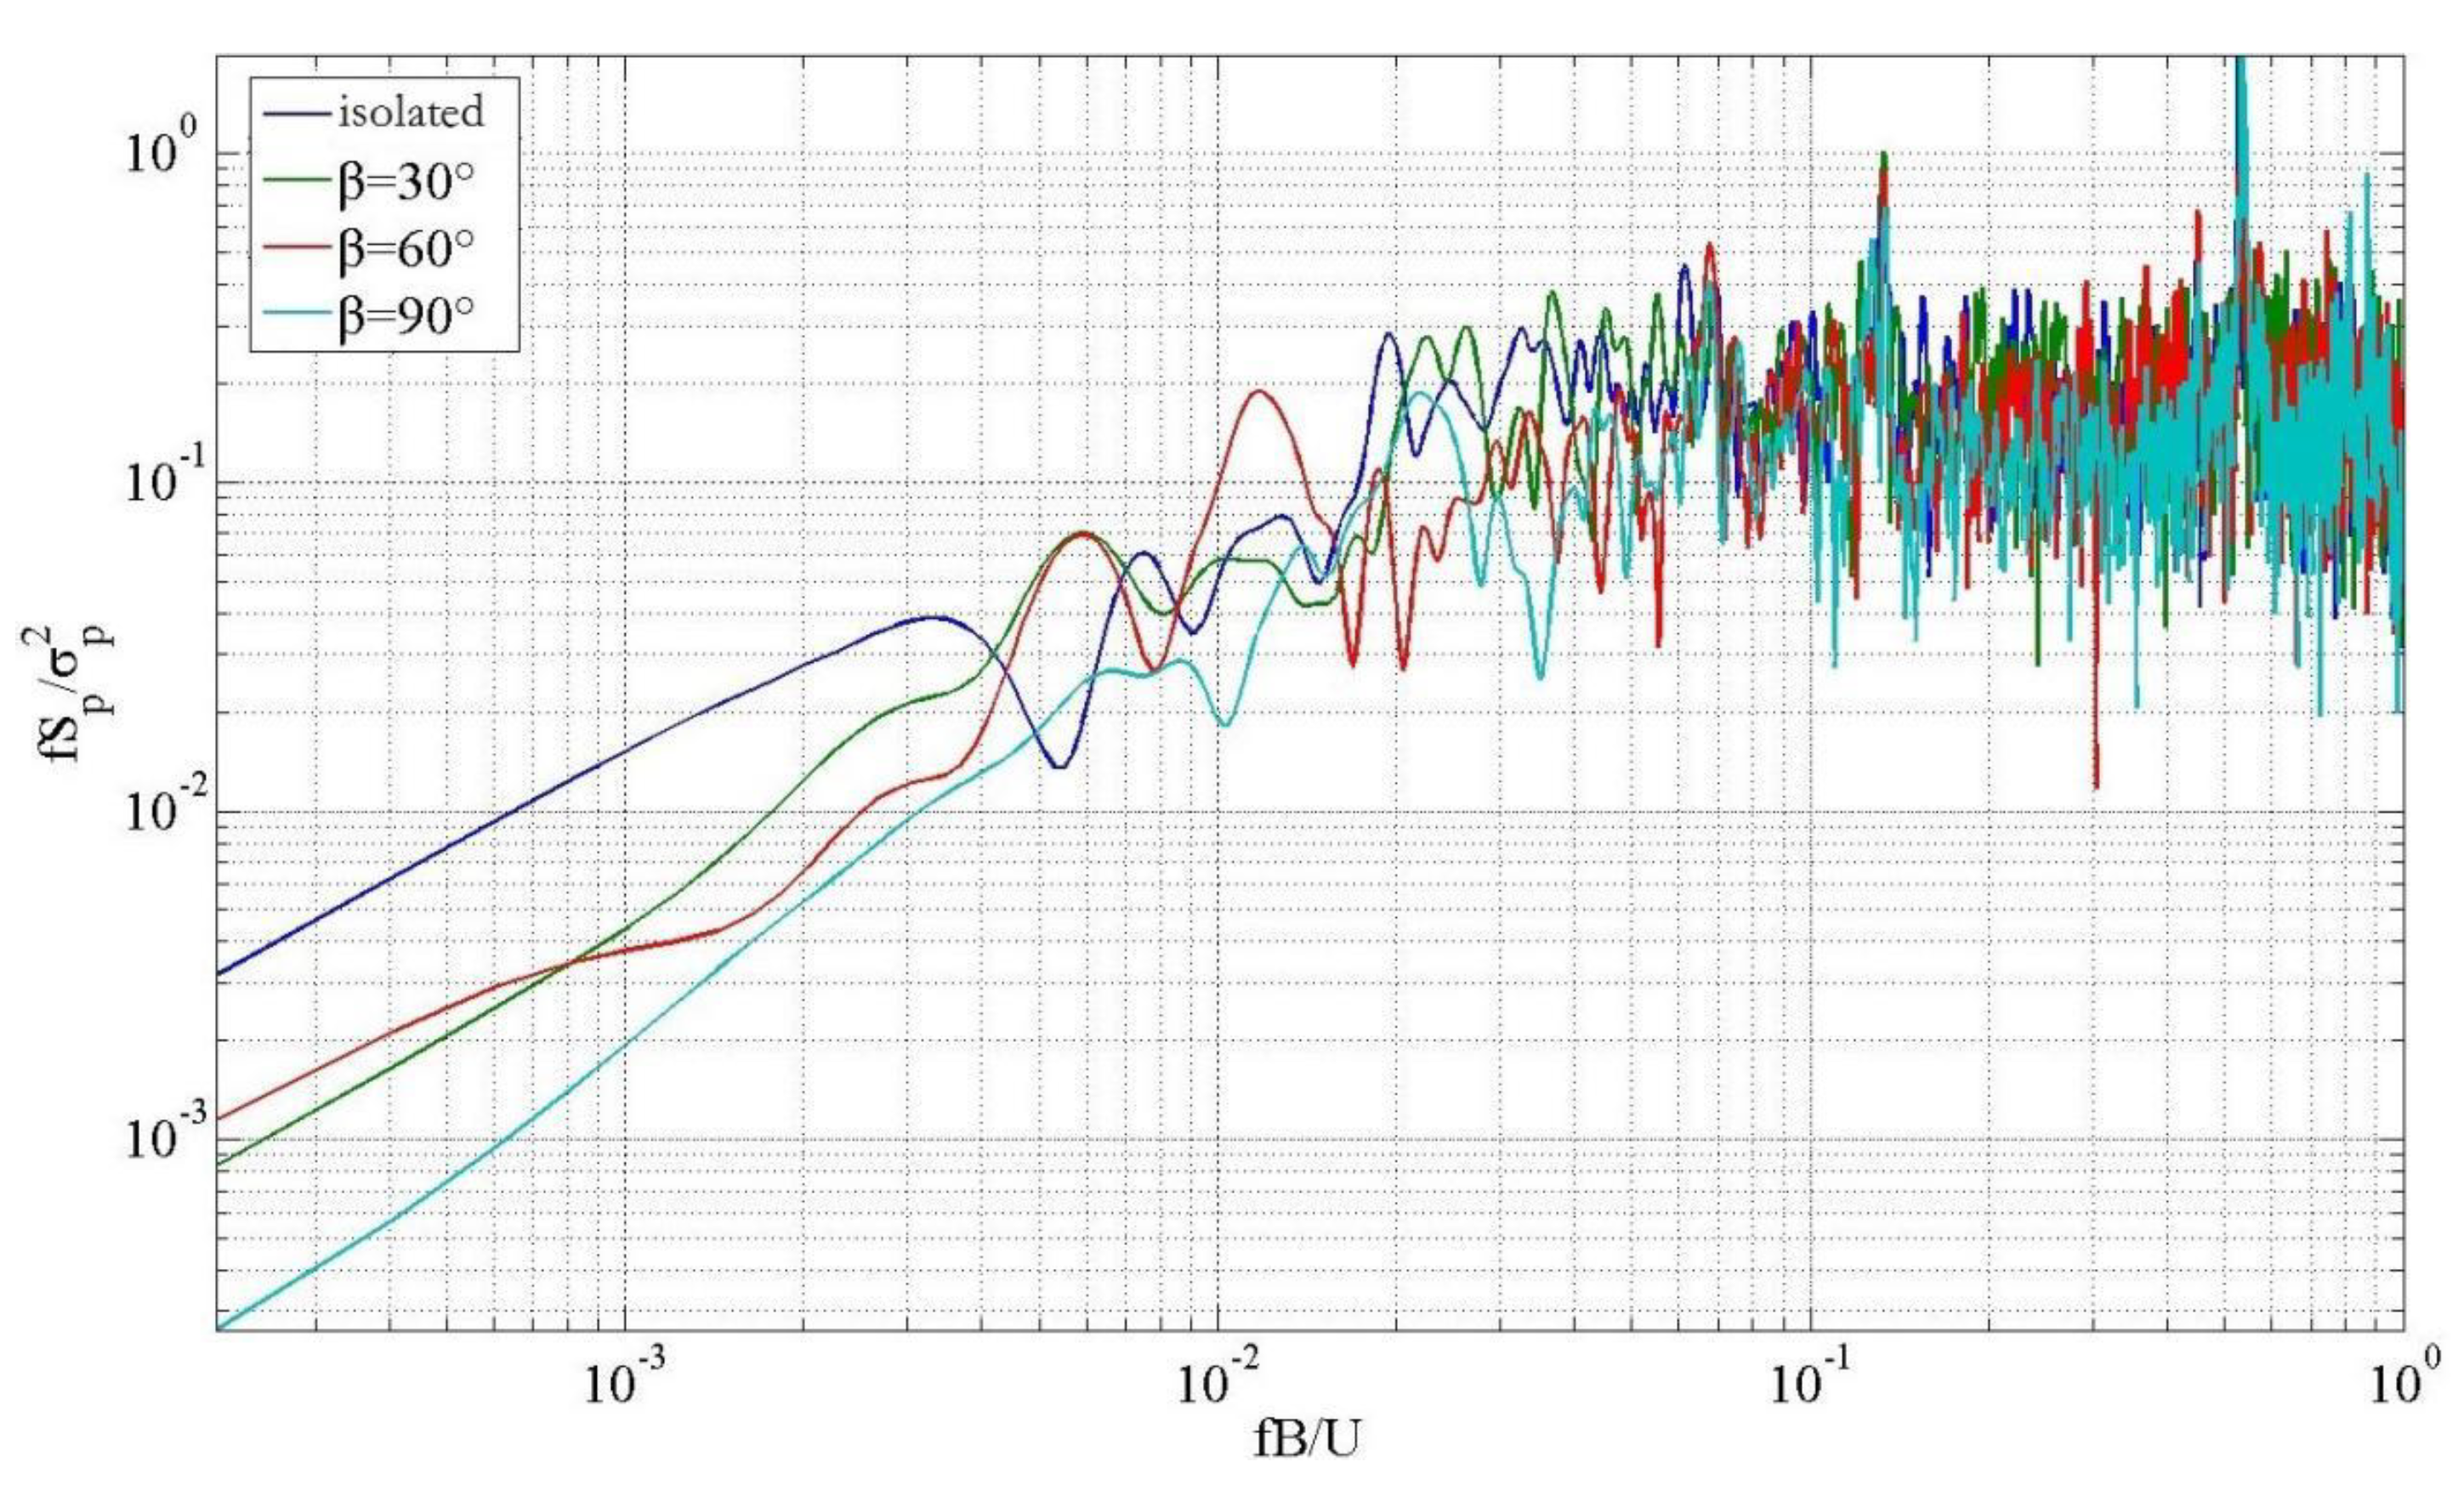
According to Figure 18, at wind angle 0°, for middle measuring point D19 on the lee side, when the slope gradient β = 30°, the peak value in the low-frequency band increased and in the high-frequency band remained unchanged as compared with that without the influence of the surrounding environment. With the increase in the slope gradient, at a slope gradient β = 60°, the peak value in the low-frequency band decreased and did the opposite in the high-frequency as compared with the peak values at slope gradient β = 30°. Then, at slope gradient β = 90°, both low frequency and high-frequency peak values decreased as compared with those at slope gradient β = 60°.
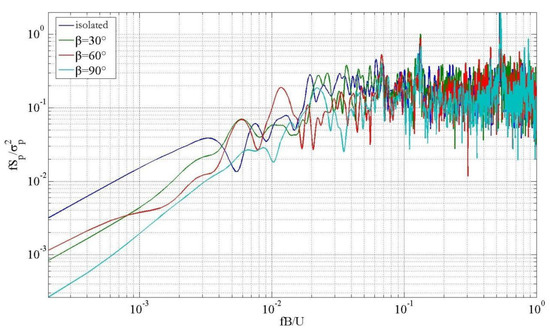
Figure 18.
Analysis of the power spectra of fluctuating wind pressure at measuring point D19 on the leeward side with slope gradient.
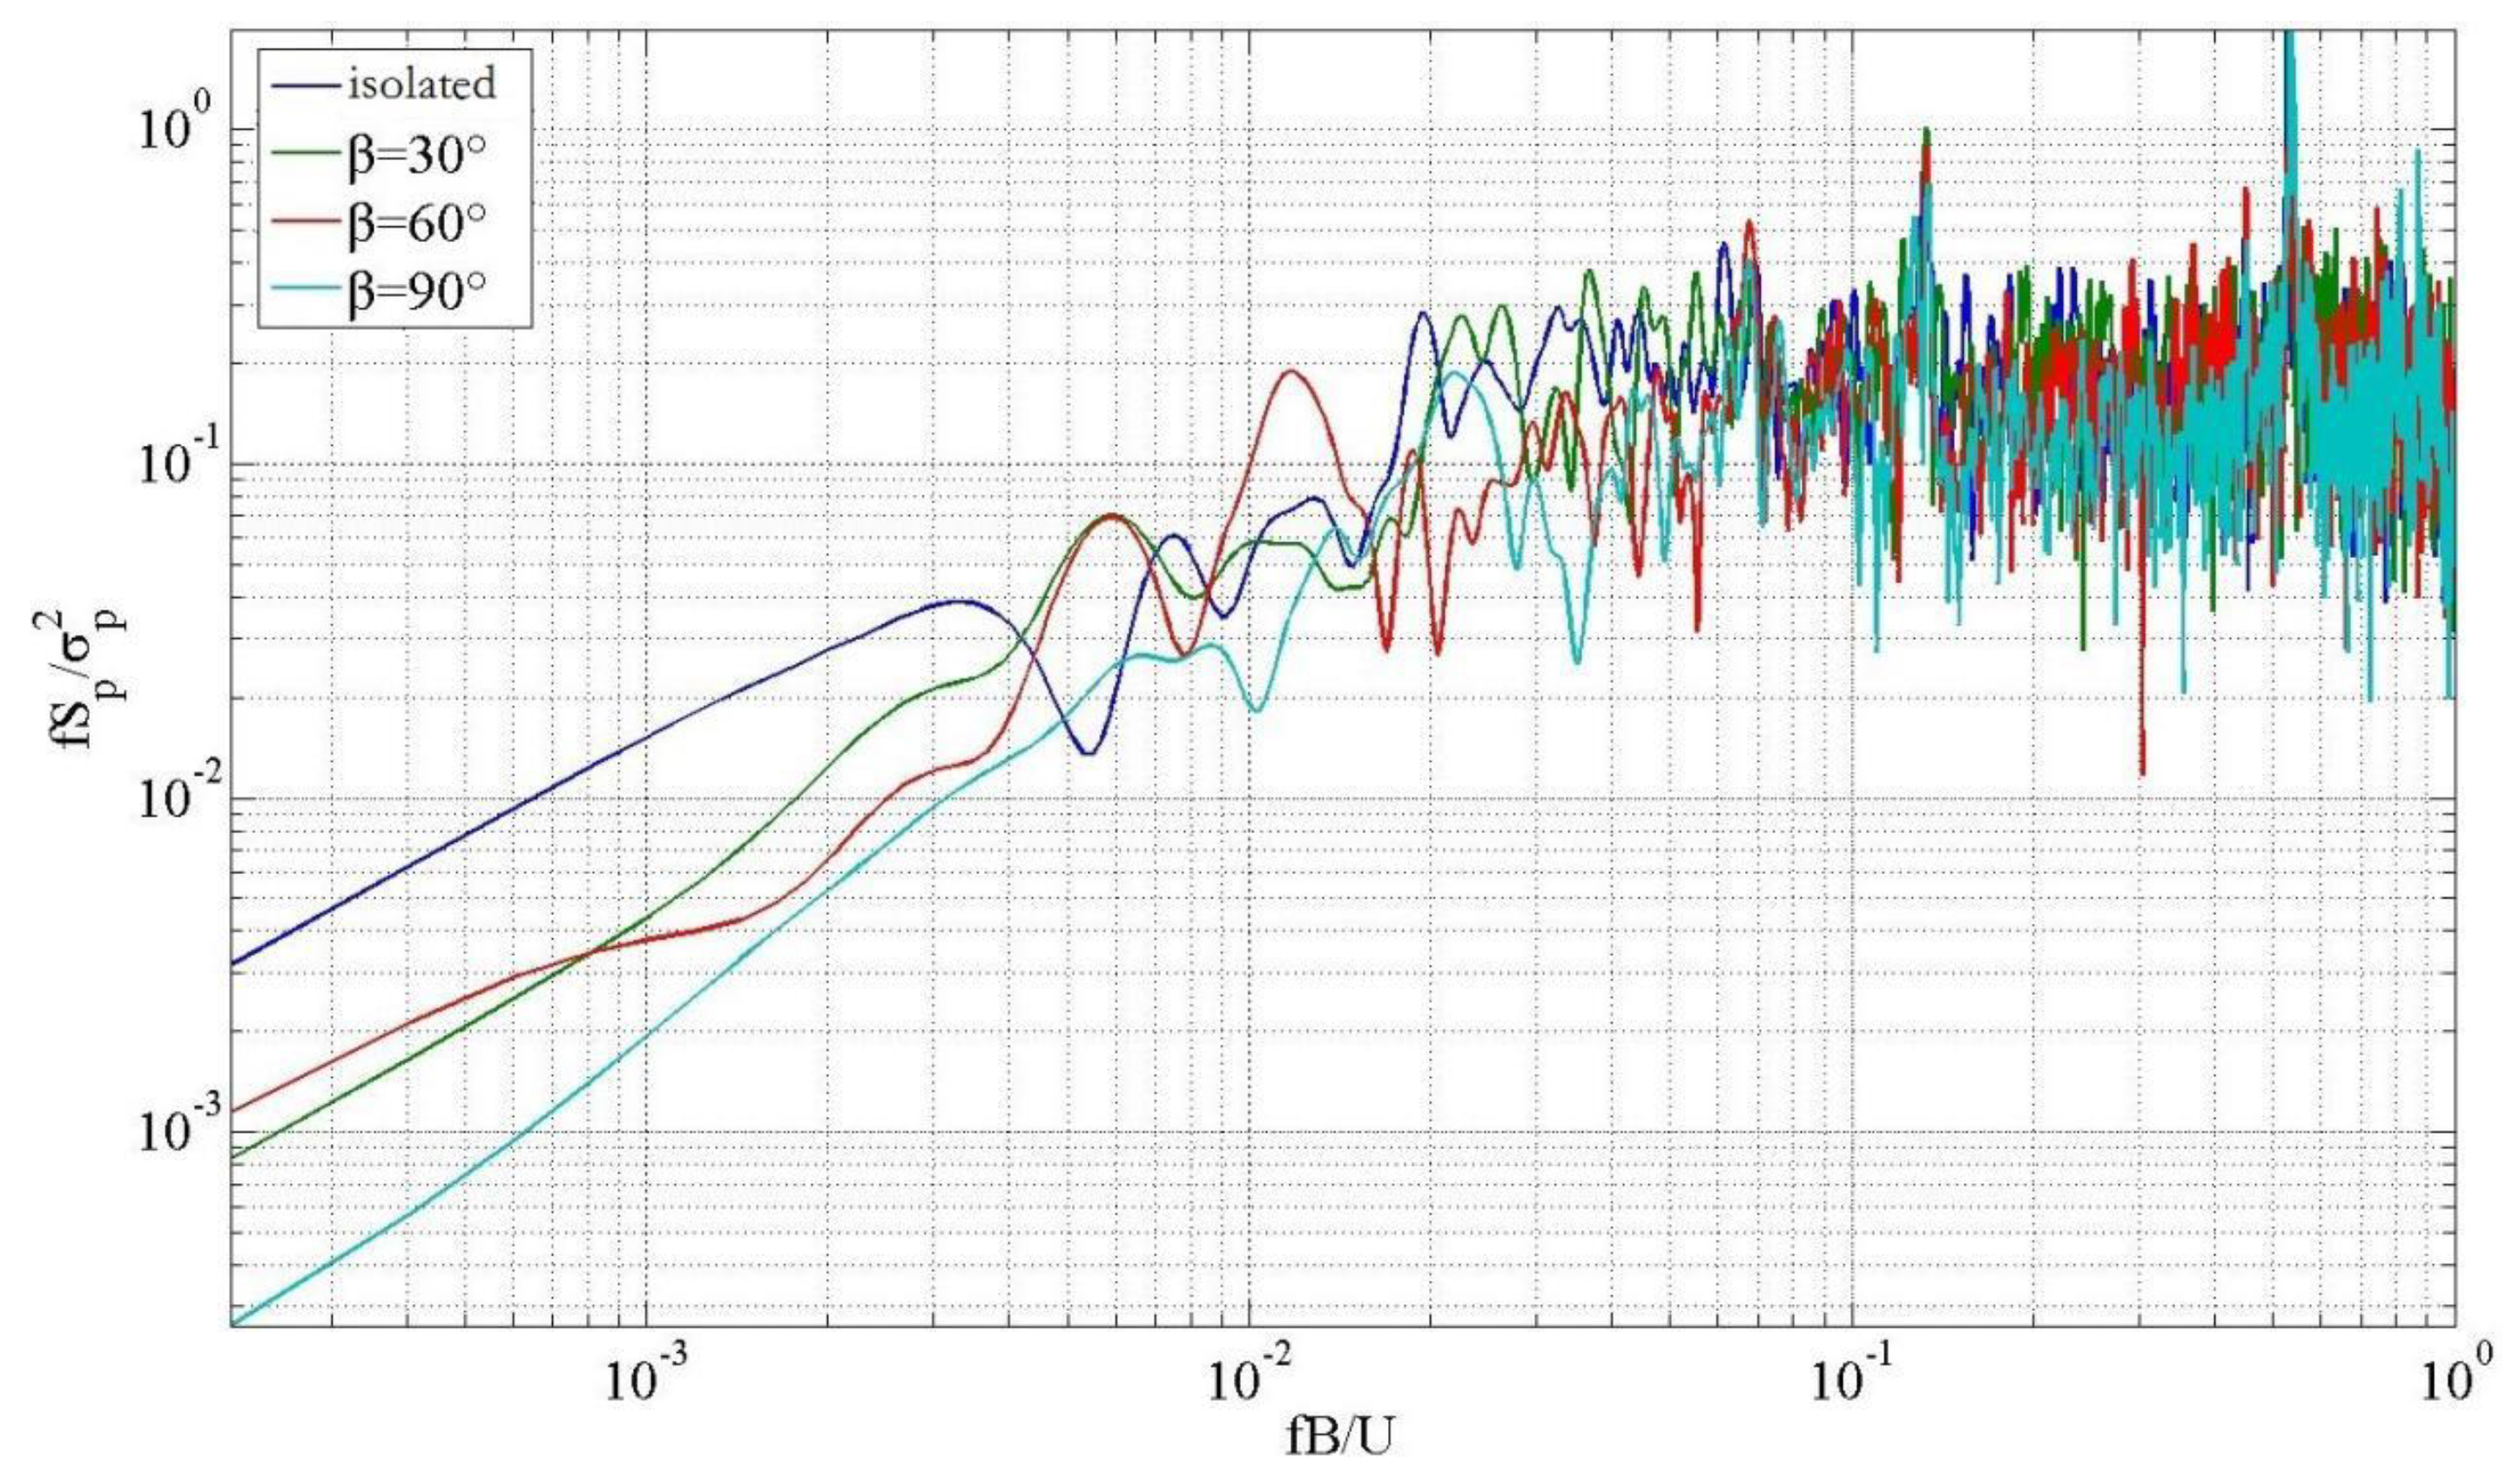
According to Figure 19, for middle measuring point D26 on the right side, at a slope gradient β = 30°, the peak values in both low-frequency and high-frequency bands remained unchanged compared with the condition without the influence of the surrounding environment. Conversely, at a slope gradient β = 60°, the peak value in the high-frequency band was increased to some extent, but it remained unchanged in the low-frequency. At a slope gradient β = 90°, the peak values of both low-frequency and high-frequency bands diminished.
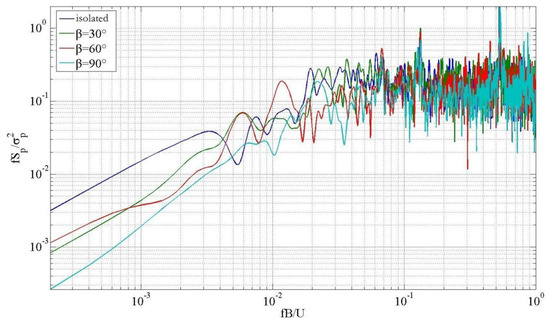
Figure 19.
Analysis of the power spectra of fluctuating wind pressure at measuring point D26 on the right side with slope gradient.
According to Figure 20, at wind angle 0°, for measuring point WA1 on the edge of the leeward eaves, the peak values in both the low-frequency and high-frequency bands decreased under a mountain form compared with the conditions without the influence of the surrounding environment. With the increase in slope gradient, the law for energy change was not evident in the low-frequency band, but the energy noticeably decreased in the high-frequency band. At this point, it was also noticeable that the influence of the small-scale vortex on the fluctuating wind pressure at the leeward eaves was weakened.
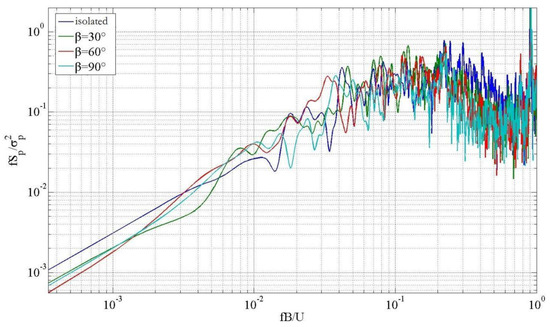
Figure 20.
Analysis on the power spectra of fluctuating wind pressure at measuring point WA1 of the leeward roof with slope gradient.
According to Figure 21, at wind angle 0°, at the middle measuring point WA20 on the windward eaves, the energy in the low-frequency band weakened with the increase of the slope gradient. However, in the high-frequency band, it increased gradually, indicating that the mountain form inhibited the inflow turbulence and strengthened the small-scale vortex.
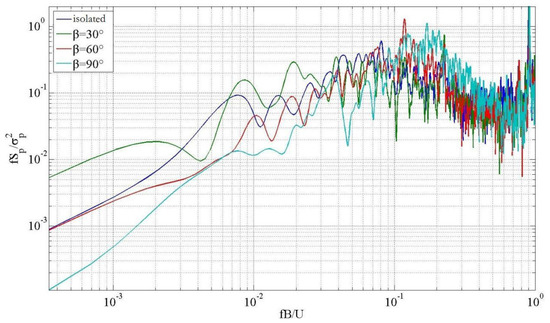
Figure 21.
Analysis of the power spectra of fluctuating wind pressure at the windward roof measuring point WA20 with slope gradient.
The fluctuating wind pressure at the bottom of the windward surface has more high-frequency components. The airflow splits at the edge and then attaches again. The vortex shedding is relatively rich, and there is greater energy in the high frequency band, which is related to the small-scale vortex caused by airflow separation. The energy of the middle measuring point on the leeward side at the high frequency band has been greatly improved relative to the edge, which is mainly related to the flow separation, shedding and reattachment.
At the 0° wind direction angle, the power spectrum of representative measuring points is analyzed as a function of parameters. The results show that when there is no surrounding environment, the energy in the low frequency band is weakened and the energy in the high frequency band is enhanced. This is because the existence of mountains inhibits the large-scale vortex structure in space, weakens the turbulence characteristics of incoming wind, and increases the small-scale vortex.
5. Analysis of the Probability of Fluctuating Wind Pressure of Low-Rise Buildings with Slope Gradient
Scholars found that when calculating the wind load of low-rise buildings, there is a large error in the results, especially in the airflow separation area and corner area based on the assumption of Gaussian distribution.
Kumar and Stathopoulos [26,27] studied large-span structures and high-rise buildings through wind tunnel experiments. The results show that there is a large negative pressure at the air flow separation. When calculating the extreme negative wind pressure, if the peak factor 2.5 specified by the Gaussian distribution is used to calculate the extreme negative wind pressure, the peak factor should be increased to 3.0~3.2.
The first order statistical moment (mathematical expectation) and the second order statistical moment (variance) are the most commonly used characteristic parameters to describe the probability density function characteristics of Gaussian signals. However, due to the complexity of non-Gaussian features, it is necessary to describe the characteristics of the probability density function using multi order moments [28,29] such as third-order skewness and fourth-order kurtosis.
The skewness of the third order statistics is used to describe the degree of deviation from the Gaussian distribution of the probability distribution of the wind pressure stochastic process, while the kurtosis of the fourth order statistics is used to describe the degree of the cusp of the probability distribution of the wind pressure stochastic process. See Formulas (4) and (5) for the calculation expression. The powerful means to distinguish non-Gaussian characteristics from Gaussian characteristics are skewness coefficient and kurtosis coefficient. For Gaussian distribution, CSk = 0, CKu = 3.
where CSk is skewness coefficient and CKu is kurtosis coefficient.
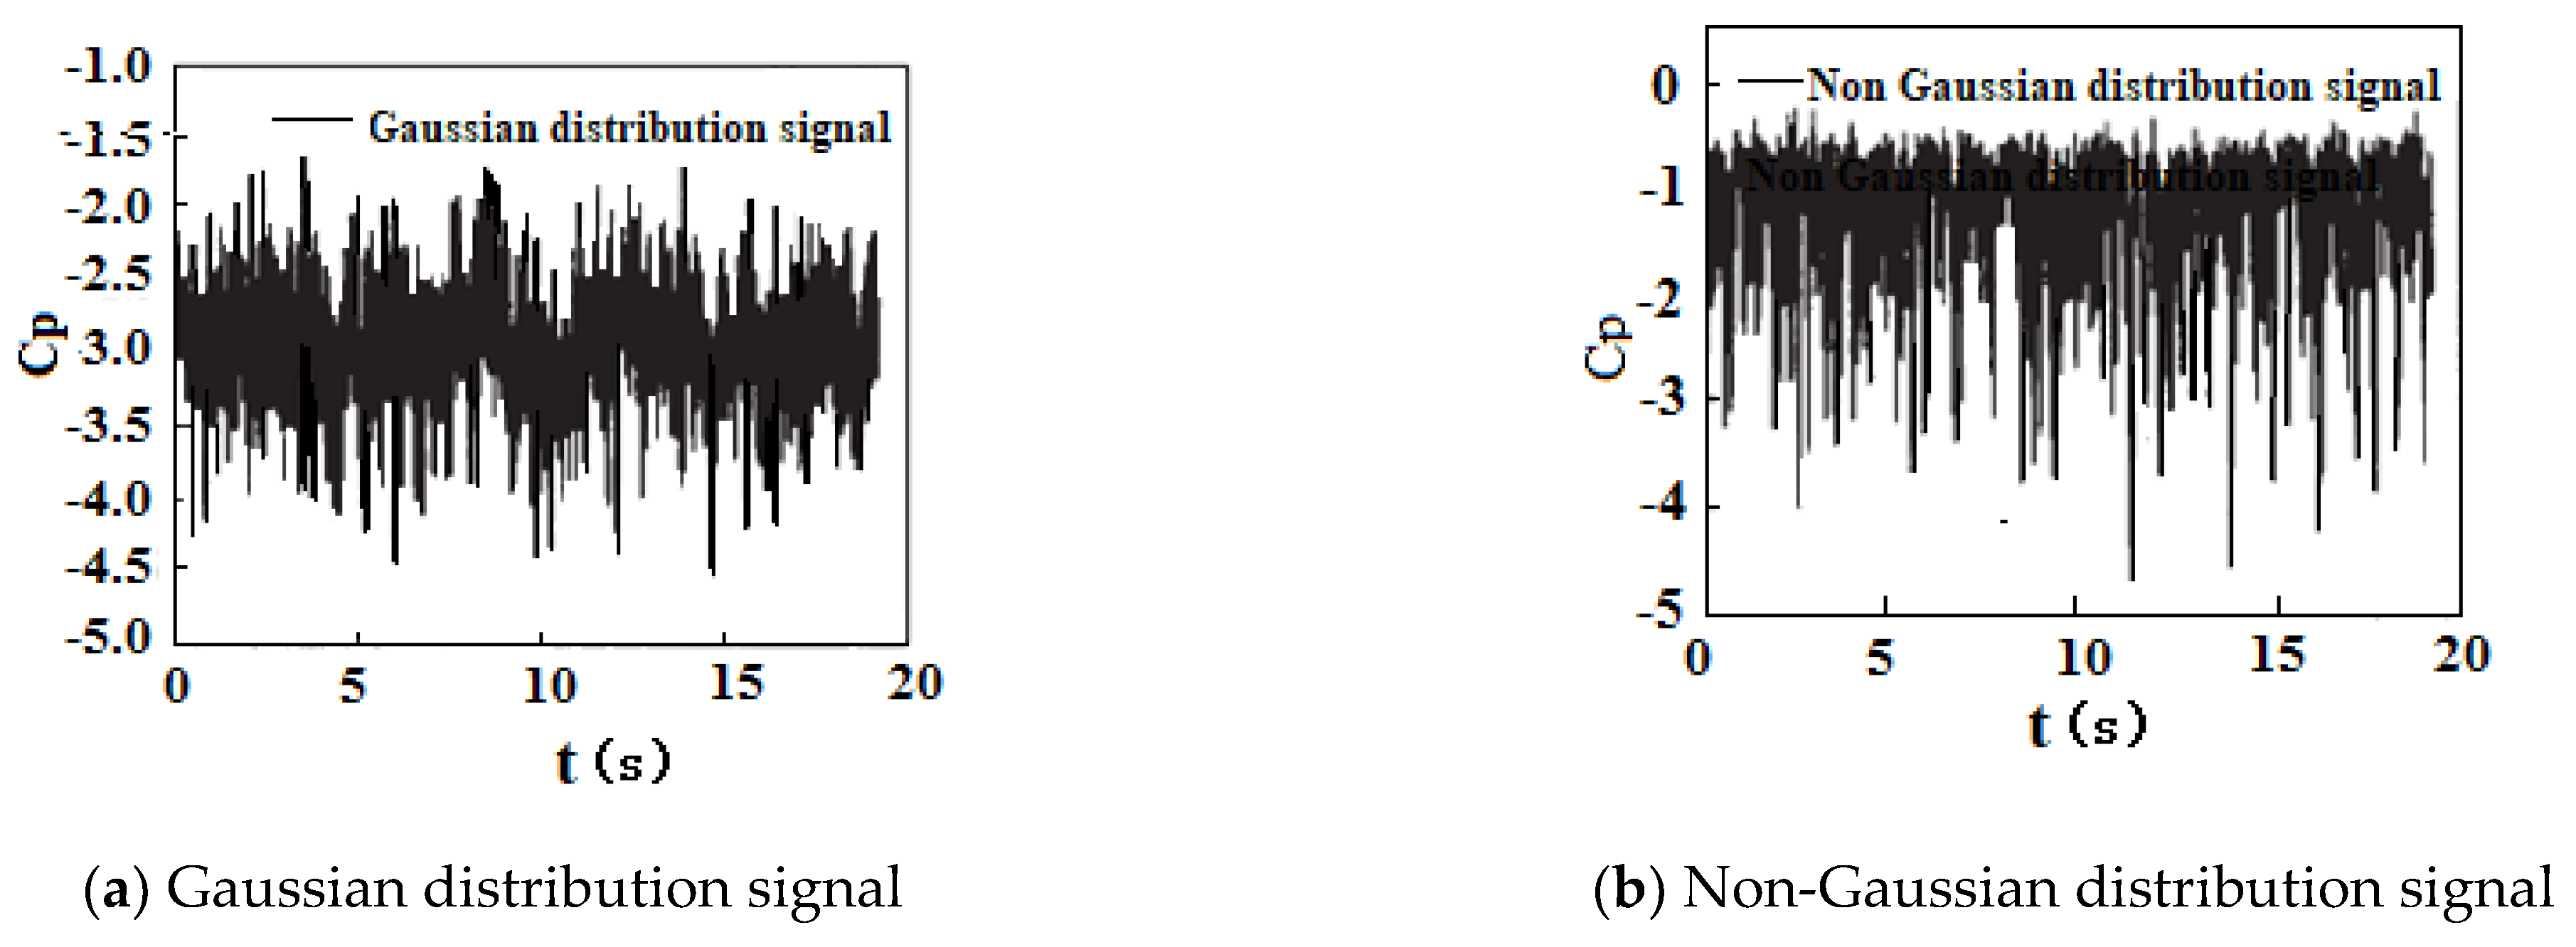
Kumar found that [26], when the wind pressure distribution is asymmetric and there are many impulse wind pressures, the measuring points tend to have non-Gaussian characteristics. Sun Ying [30] gave an example of typical Gaussian and non-Gaussian wind pressure time history curves, as shown in Figure 22a,b. The wind pressure time history curve in Figure 22a is symmetrical, and it can be considered that the wind pressure distribution at the measuring point has Gaussian characteristics, while the wind pressure time history curve in Figure 22b is extremely asymmetrical, and it can be considered that the wind pressure distribution at the measuring point does not have Gaussian characteristics.
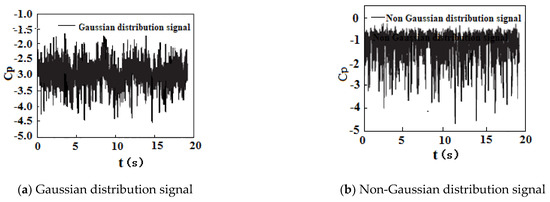
Figure 22.
Typical Gaussian and non-Gaussian wind pressure time history curves [27].
It is difficult to determine whether the wind pressure at the measuring point belongs to non-Gaussian distribution just from the wind pressure time history curve. The criteria for determining whether the wind pressure probability distribution conforms to the Gaussian distribution will also be different for different structure types. Kumar [27] set the judgment standard for low buildings to be greater than 0.5 and kurtosis greater than 3.5 as the boundary between Gaussian and non-Gaussian.
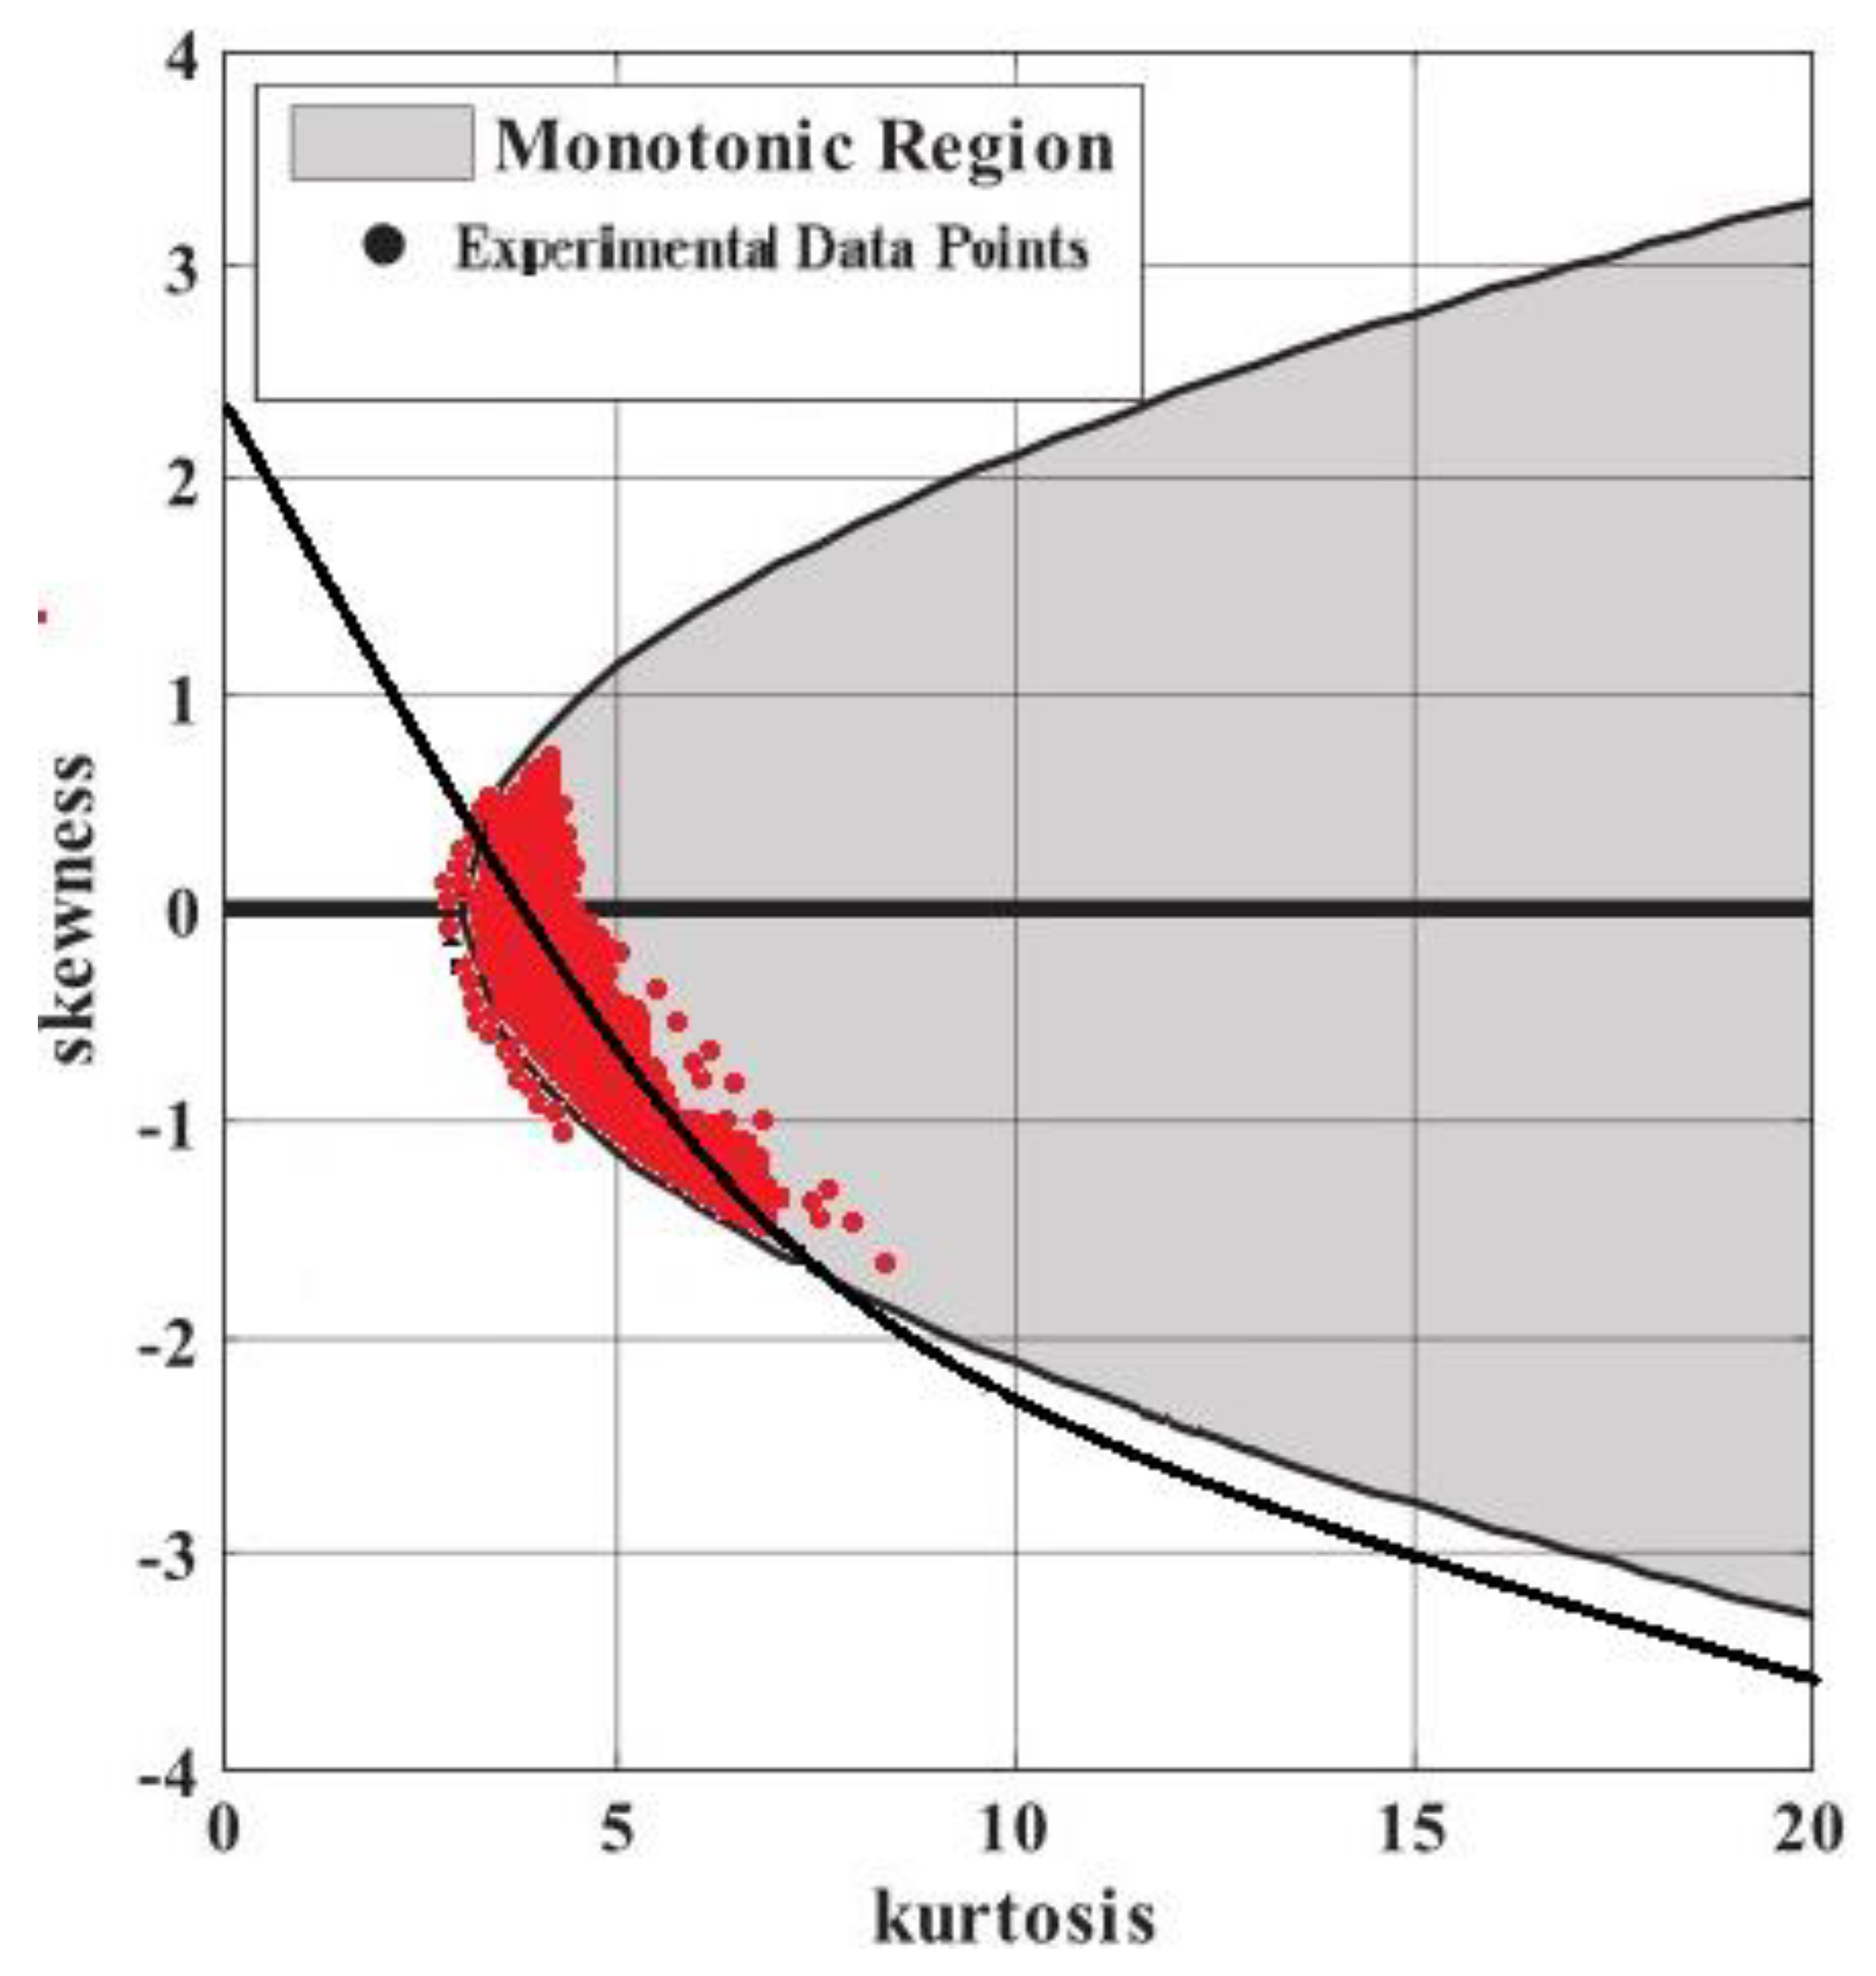
Sun Ying [30] proposed two criteria for determining the Gaussian zone and non-Gaussian zone: (1) Calculate the skewness and kurtosis values of all measuring points, and make the cumulative probability density curve of kurtosis and skewness. When a specific value is taken as the boundary value, the exceedance probability of the two is relatively close. (2) The scatter plot between skewness and kurtosis can fit a curve that approximately satisfies a certain functional relationship.
In order to verify the division standard of Gauss and non-Gauss areas on the roof of double slope low-rise buildings, this section is verified according to the two criteria proposed by Sun Ying.
Figure 23 shows the cumulative probability density function of the skewness and kurtosis of the measuring point.It can be seen from Figure 23 that the exceedance probabilities of wind pressure skewness > 0.5 and kurtosis > 3.5 are about 70%, meeting the division criteria in the previous article. In addition, Figure 24 shows a scatter plot with kurtosis as abscissa and skewness as ordinate. Through fitting, it is found that the kurtosis increases gradually with the decrease of skewness, and the relationship between them is a parabola, meeting the second division criterion. It can be seen that it is feasible to set the criteria for determining non-Gaussian areas of low buildings as >0.5 and >3.5.

Figure 23.
Wind pressure time history skewness and kurtosis cumulative probability density function (0° wind direction angle, no surrounding conditions).
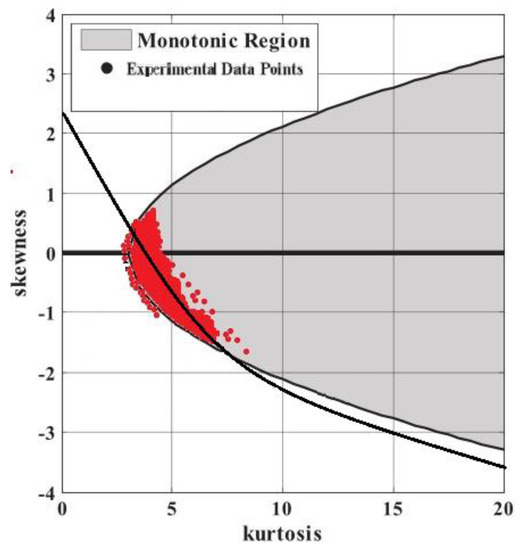
Figure 24.
Skewness and kurtosis scatter plot [31,32].
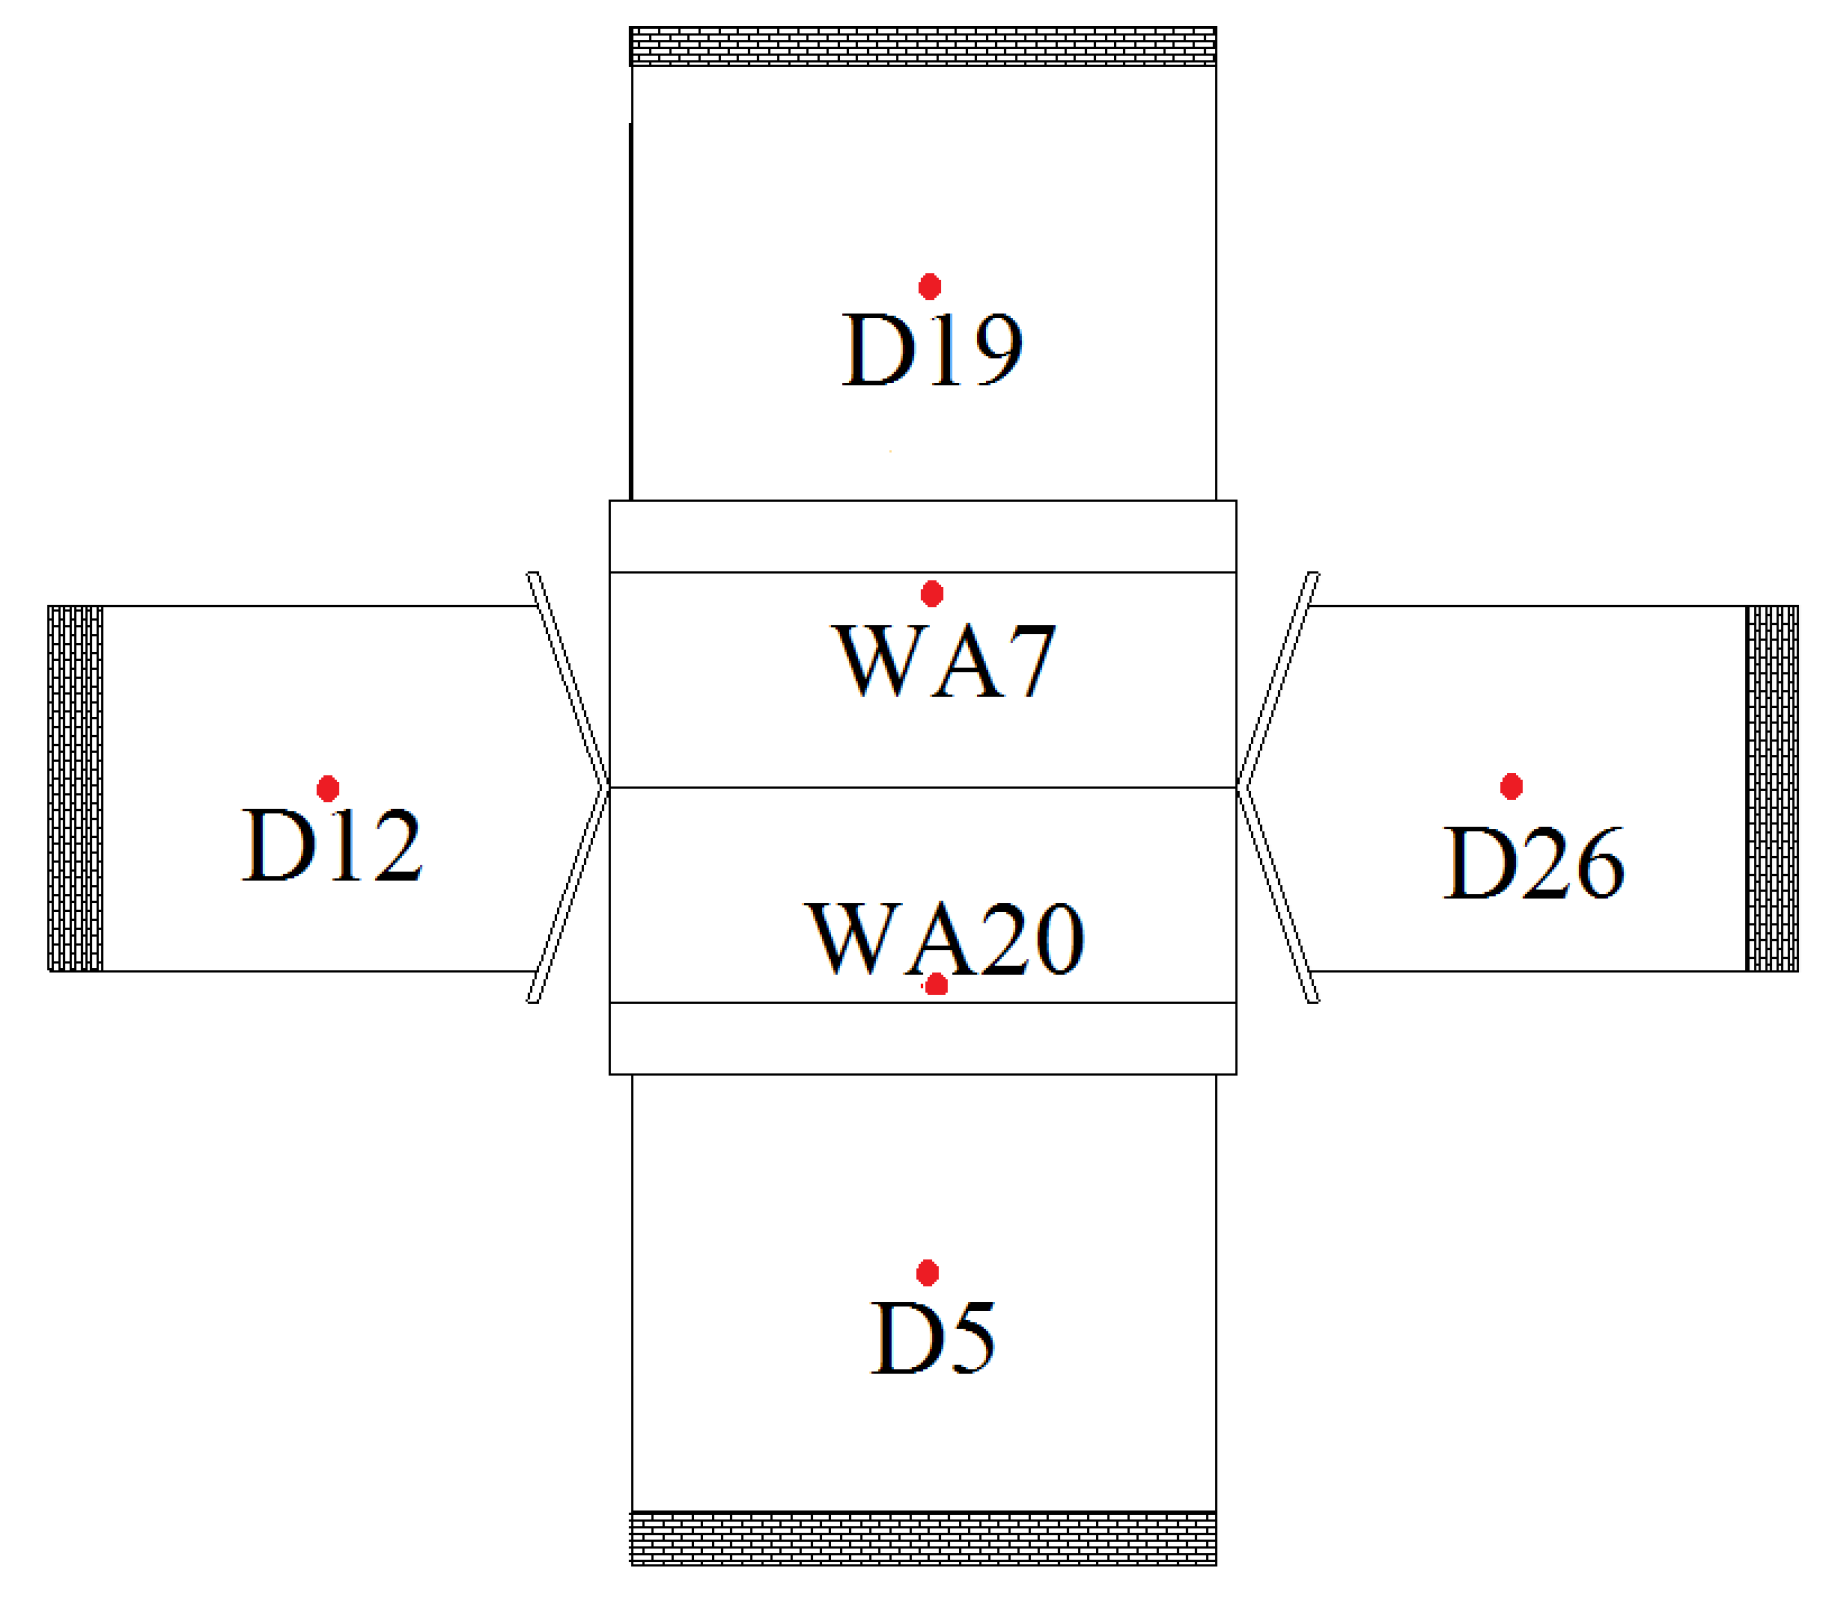
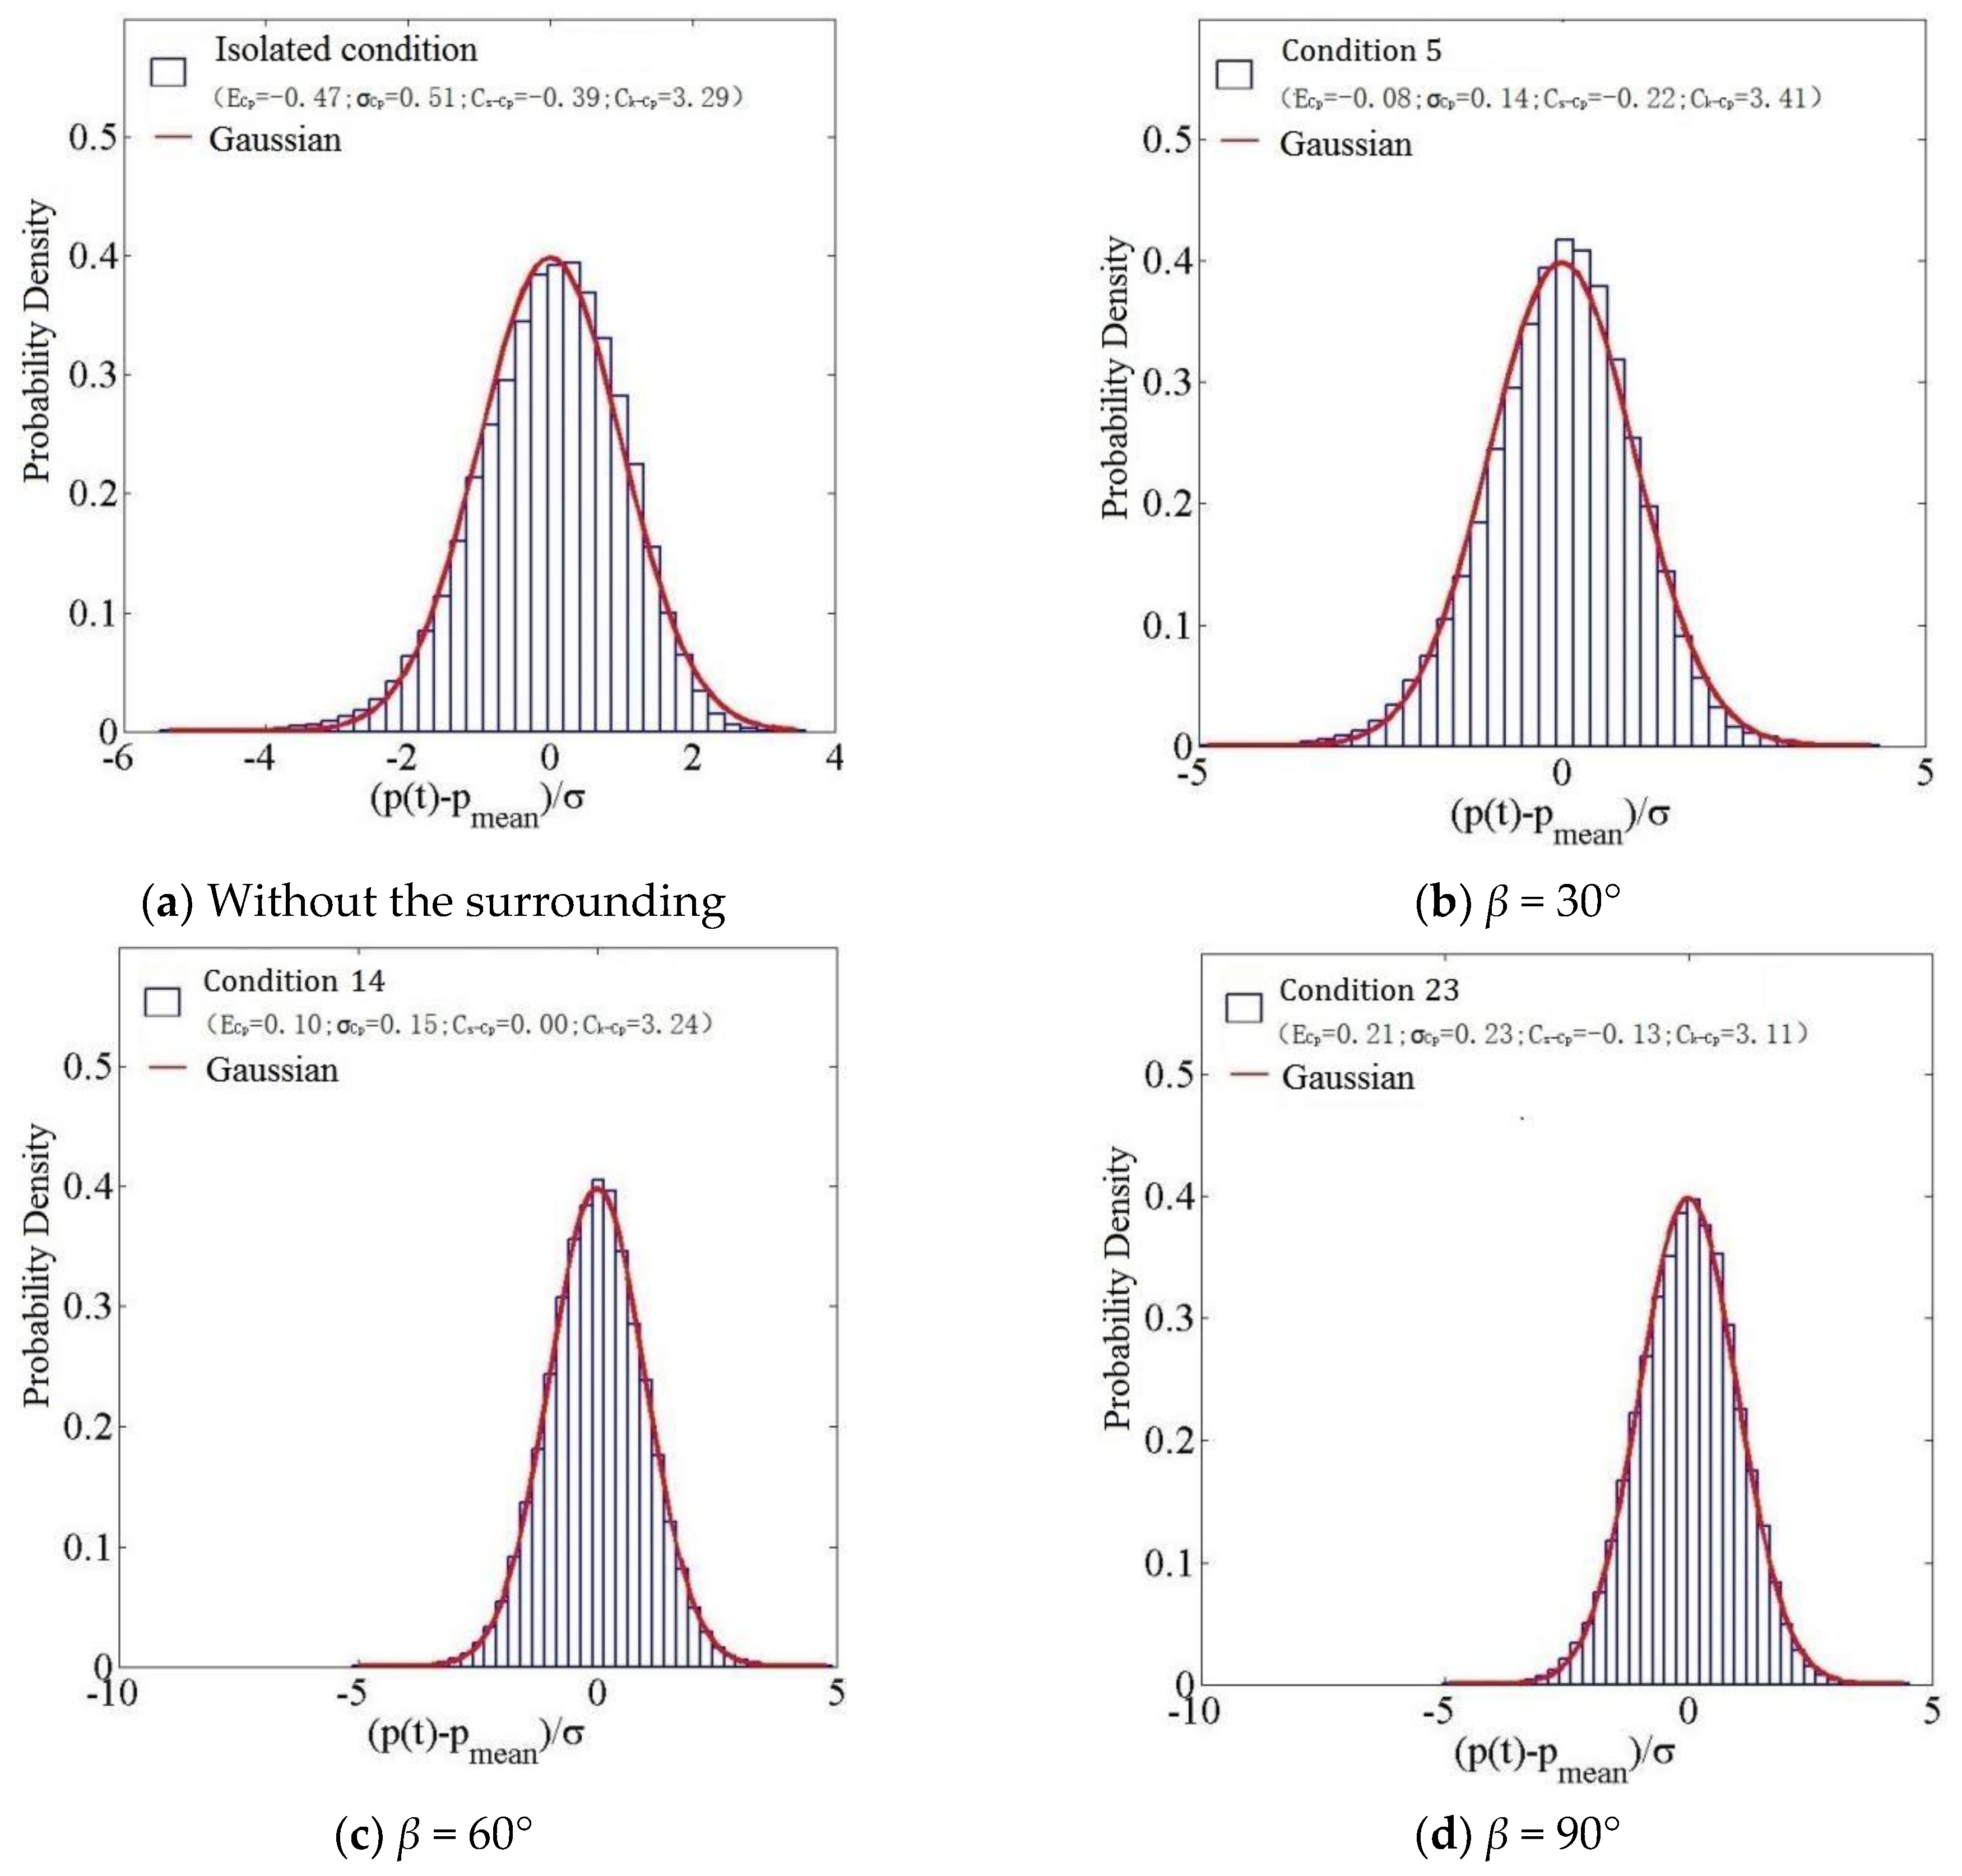
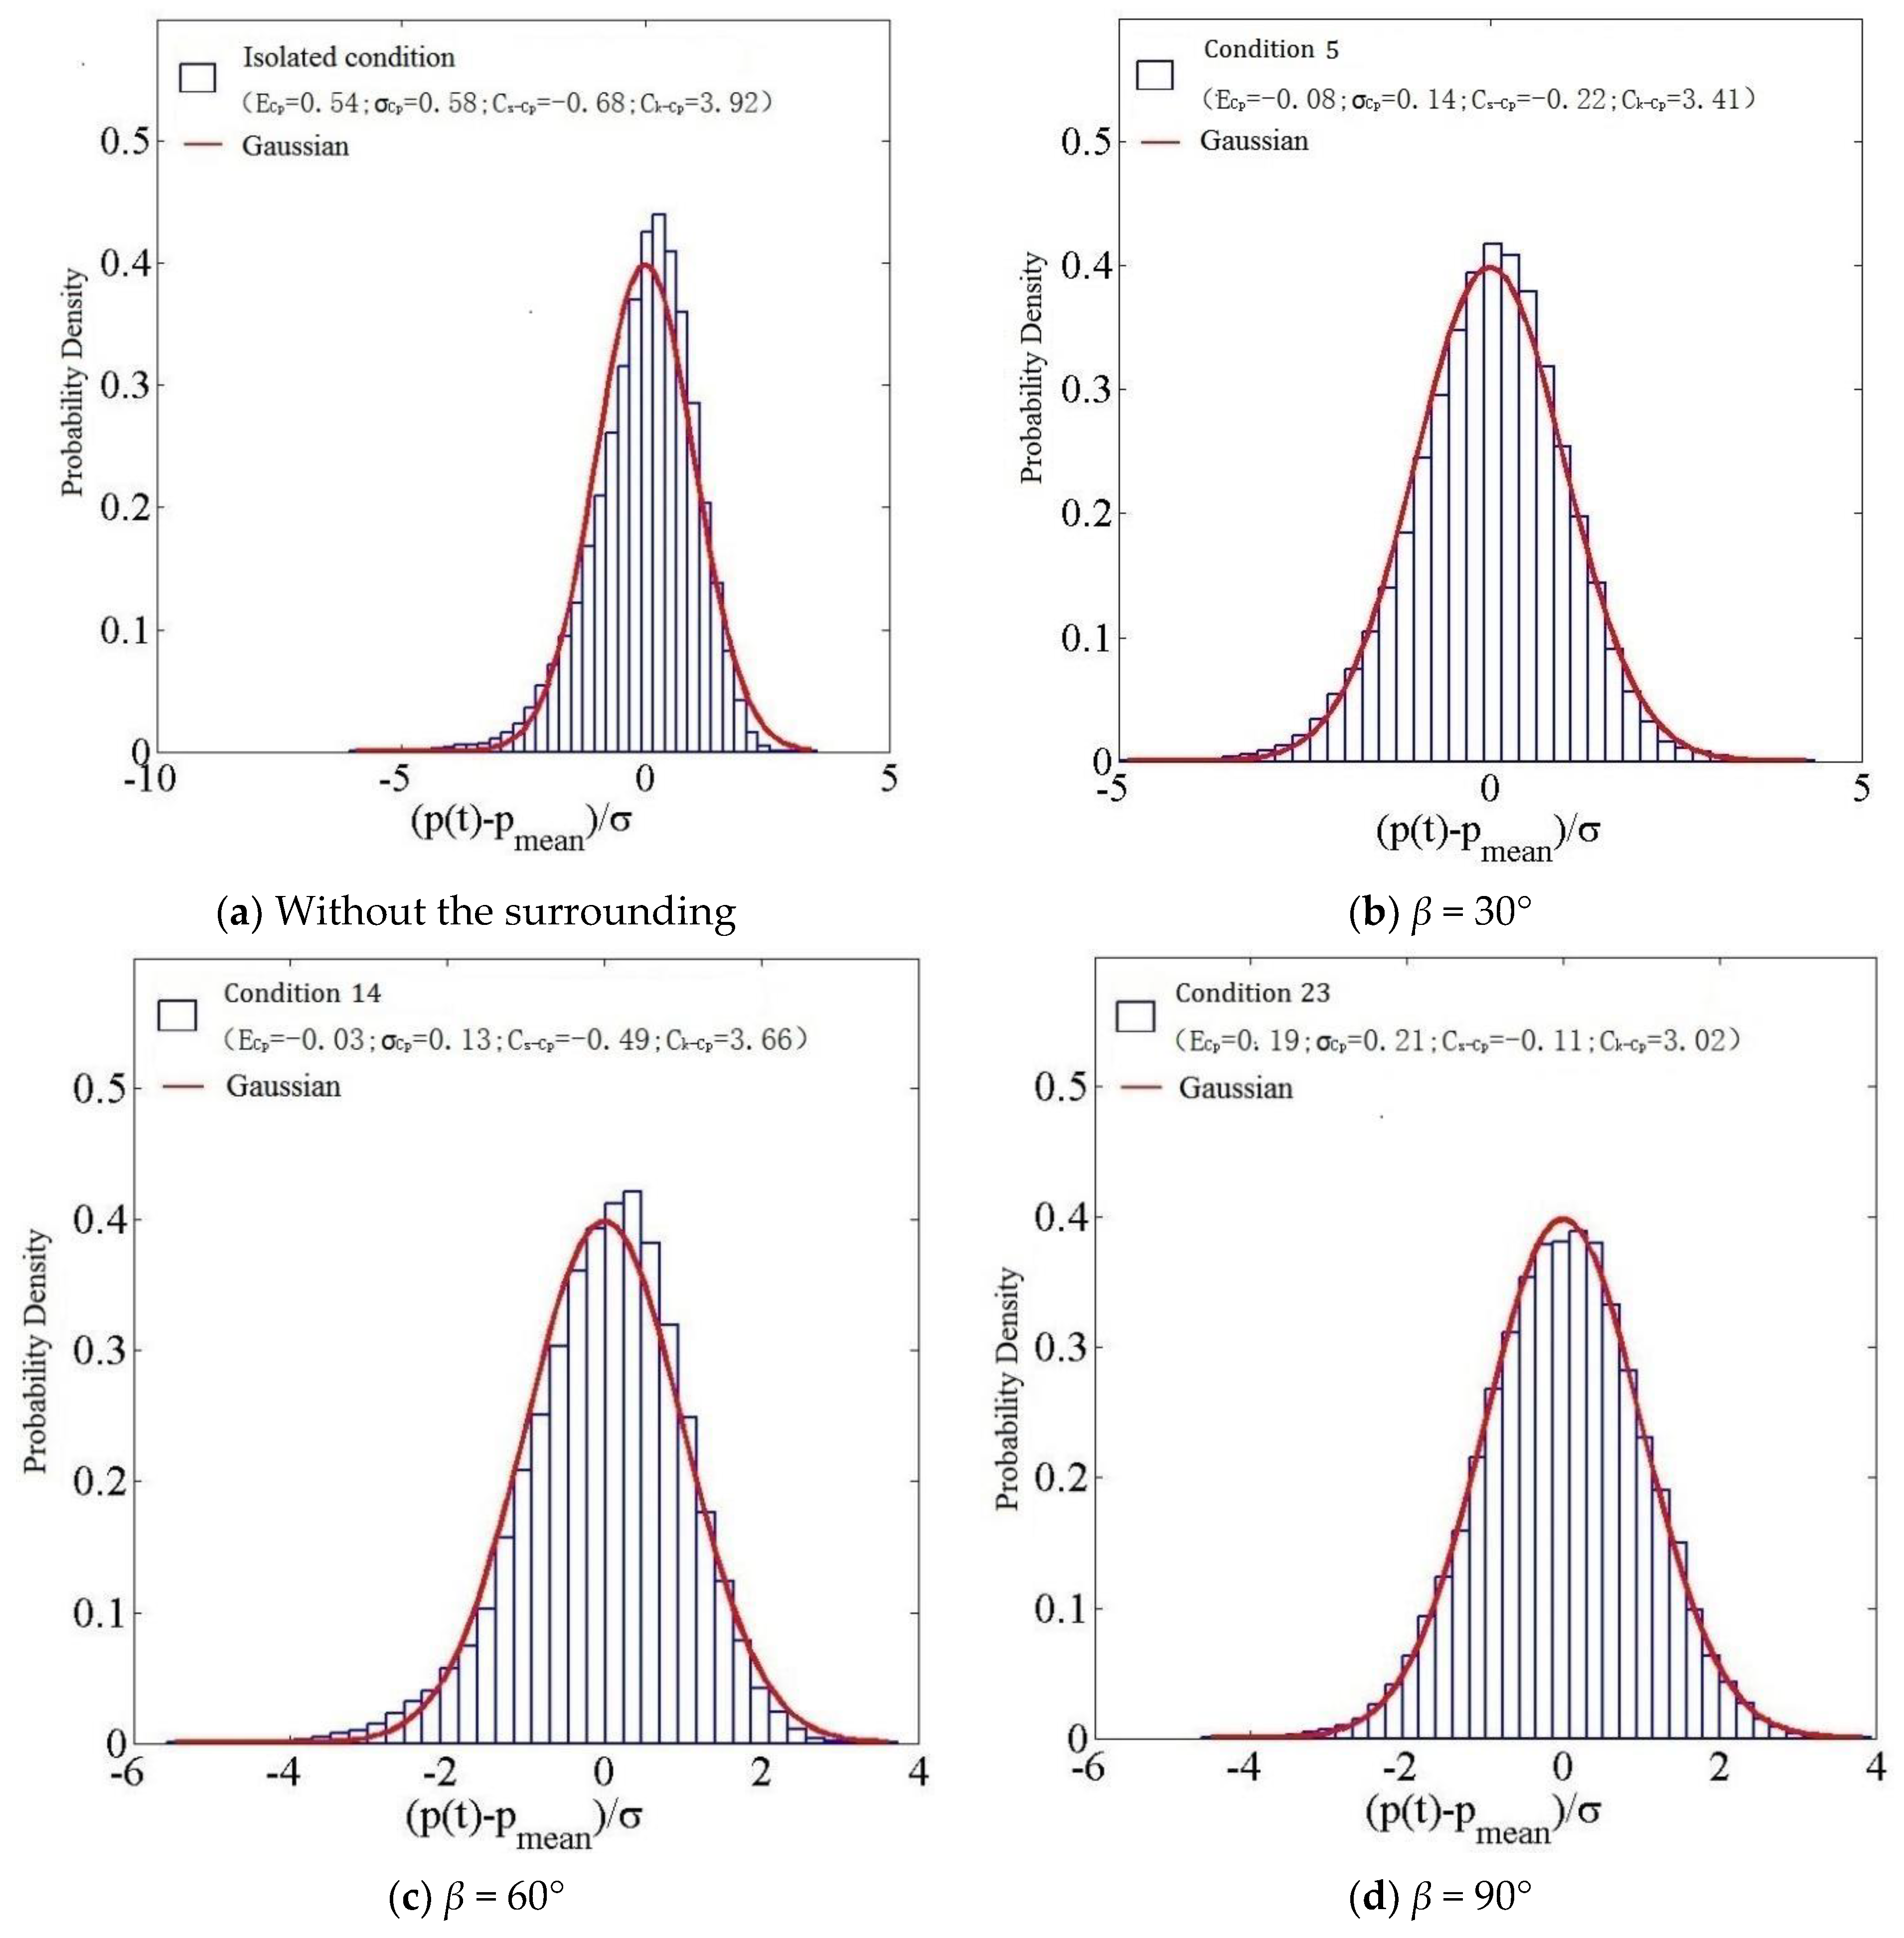
In order to further study the change rule of the probability distribution of wind pressure at the measuring point when the slope changes, we select a representative measuring point (as shown in Figure 25). The middle measuring points D5, D12, D19 and D26 are respectively selected for the four facades, and the middle measuring points D5 and D19 are respectively selected for the roof. Under the 0° wind direction angle, the mean value Ecp and root mean square value σcp, skewness Cs-cp and kurtosis Ck-cp of the wind pressure coefficient at the measuring point and Gaussian distribution were analyzed as shown in the figures below. Then, the probability density histograms of representative measuring points under different slope gradients were compared, as shown in Figure 26:
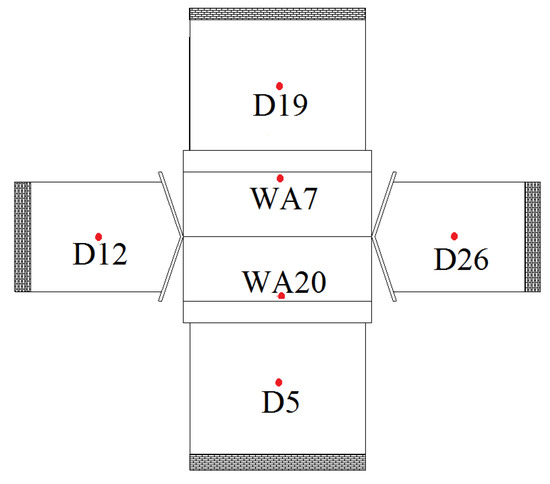
Figure 25.
Distribution map of representative measuring points.
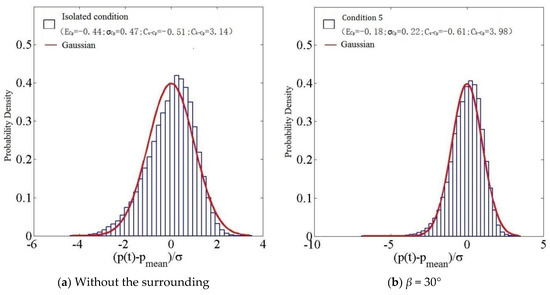
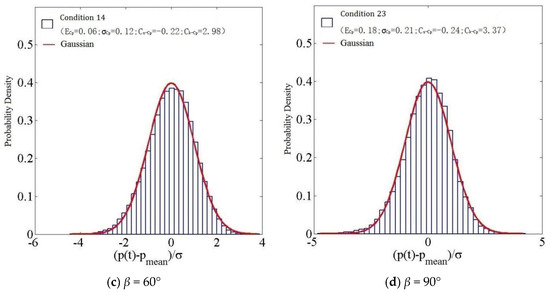
Figure 26.
Histogram of wind pressure probability density distribution at measuring point D5 with slope gradient.
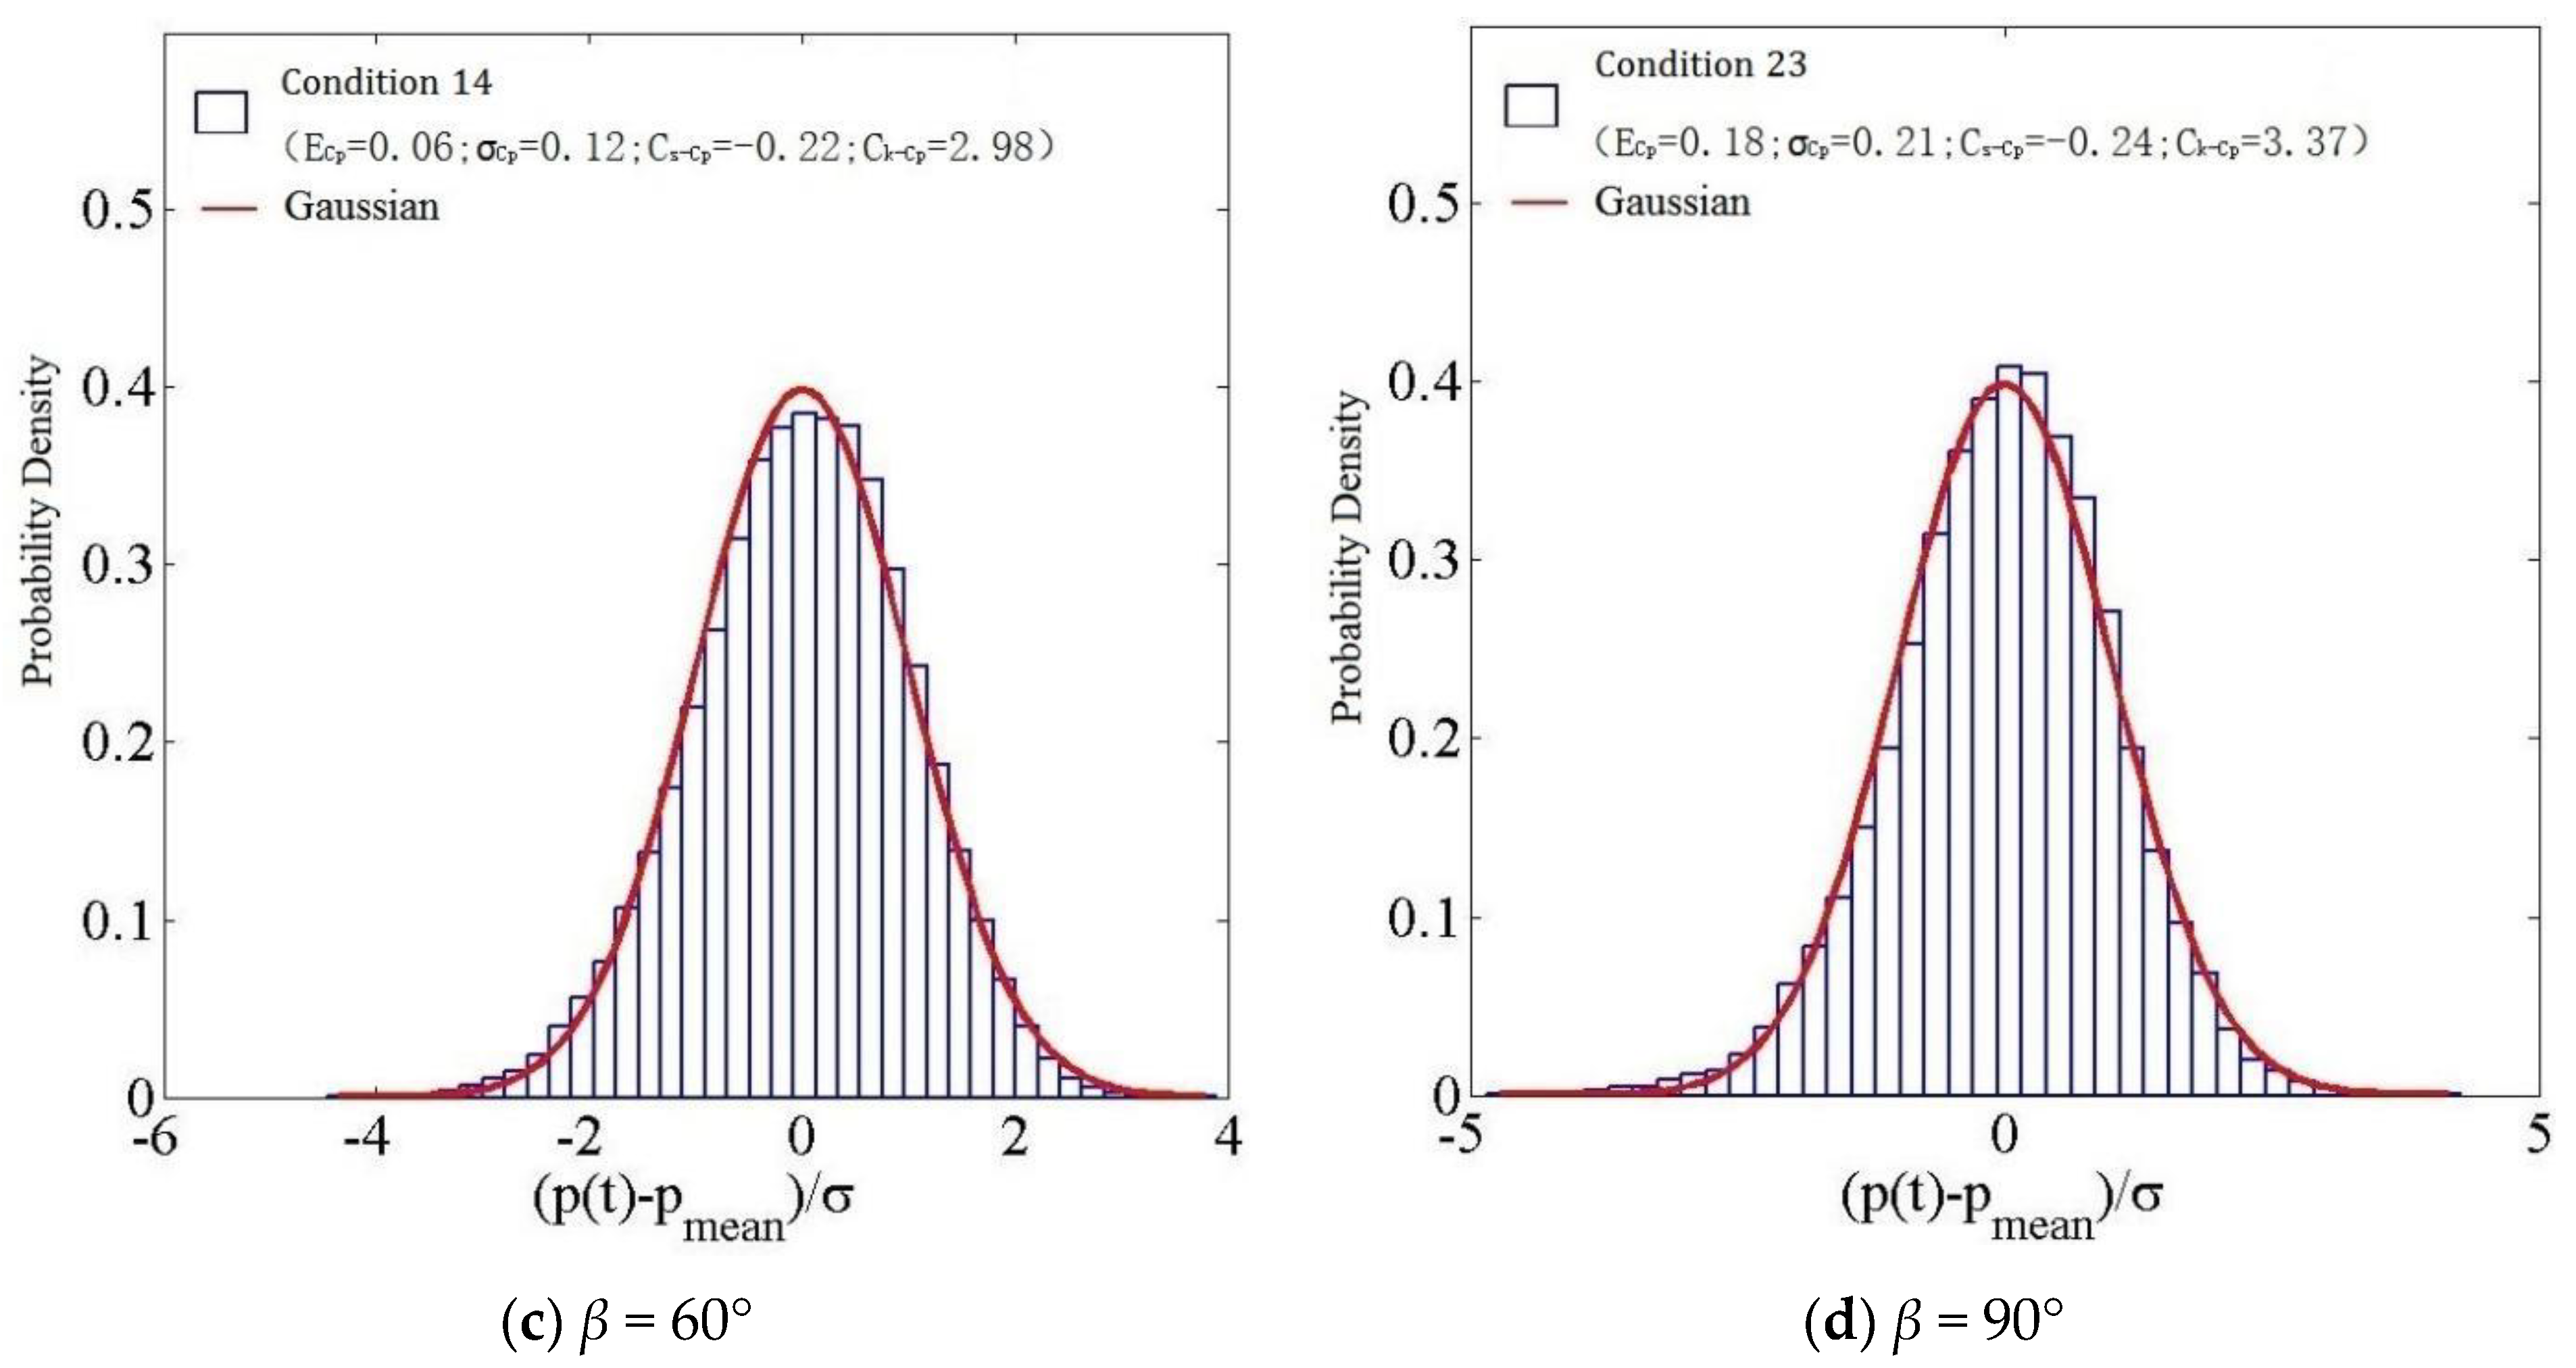
According to Figure 26, under wind angle 0°, with the increase in height for the middle measuring point D5 on the windward side at β = 30°, the mean absolute value and root mean square value of wind pressure coefficient decreased, skewness and kurtosis increased, and the wind pressure probability distribution was non-Gaussian. At β = 60°, the mean and root mean square values of the wind pressure coefficient were small, and the wind pressure probability distribution was Gaussian. Then, at β = 90°, all of the parameters increased as compared with β = 60°, but the wind pressure probability distribution remained Gaussian. With the increase of slope, the probability distribution of wind pressure at the middle measuring point on the windward side changes from non Gaussian to Gaussian, mainly due to the influence of mountains, and the airflow is more normal.
According to Figure 27, under wind angle 0°, with the increase of height for middle measuring point D12 on the left side at β = 30°, the mean absolute value and root mean square value of wind pressure coefficient, as well as the skewness and kurtosis, decreased. The wind pressure probability distribution under these conditions was non-Gaussian. Conversely, at β = 60°and β = 90°, the mean absolute value and root mean square value of the wind pressure coefficient and the total value of skewness and kurtosis decreased, and the wind pressure probability distribution was Gaussian. The middle area of the left side is less affected by the edge airflow separation, the airflow fluctuation is small, and the overall distribution is Gaussian.
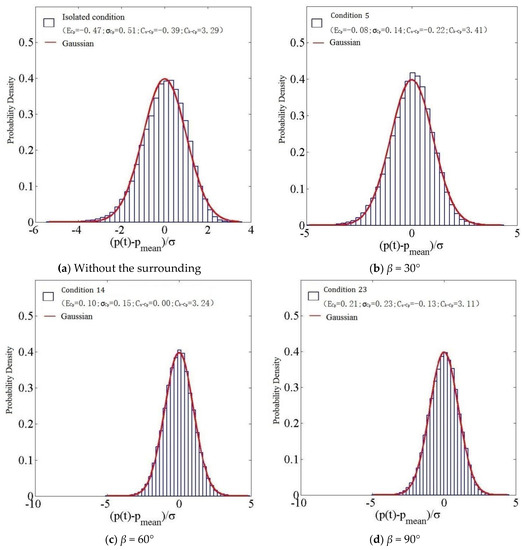
Figure 27.
Histogram of wind pressure probability density distribution at measuring point D12 with slope gradient.
According to Figure 28, under wind angle 0°, with the increase in height for middle measuring point D19 on the lee side at β = 30°, the mean absolute value and root mean square value of the wind pressure coefficient, as well as the absolute value of skewness and kurtosis, decreased. In this case, the wind pressure probability distribution was Gaussian, and the same condition was valid for β = 60°and β = 90°. The middle area of the leeward side is less affected by the edge airflow separation, the airflow fluctuation is small, and the overall distribution is Gaussian.
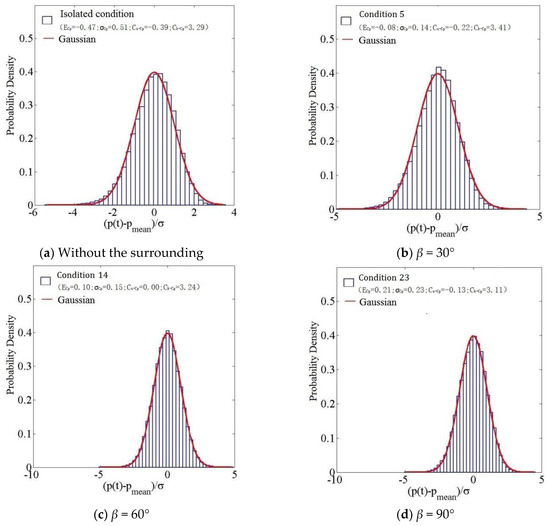
Figure 28.
Histogram of wind pressure probability density distribution at measuring point D19 with slope gradient.
Figure 29 shows that under wind angle 0°, for the middle measuring point D26 on the right side at β = 30°, the mean absolute value and root mean square value of the wind pressure coefficient decreased, the skewness and kurtosis increased, and the wind pressure probability distribution was non-Gaussian. At β = 60°, the mean value and root mean square value of the wind pressure coefficient and the skewness and kurtosis decreased, and the wind pressure probability distribution was Gaussian. The same results were identified at β = 90°. As the slope of the side measuring point increases, the influence of the mountain disturbance on the air flow gradually weakens, and the wind pressure time history gradually becomes more stable. When the slope reaches 90 °, it presents a Gaussian distribution.
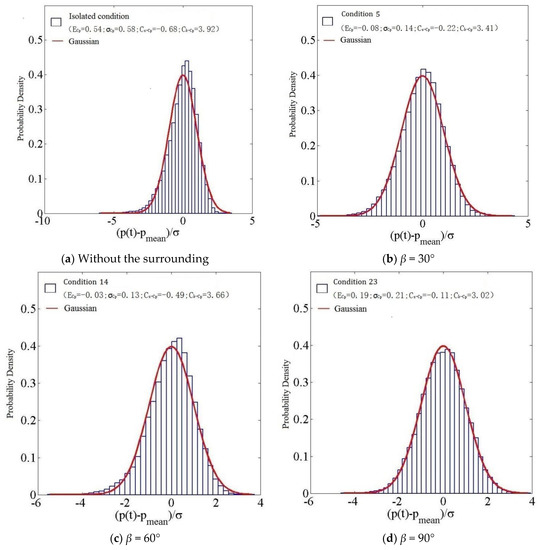
Figure 29.
Histogram of wind pressure probability density distribution at measuring point D26 with slope gradient.
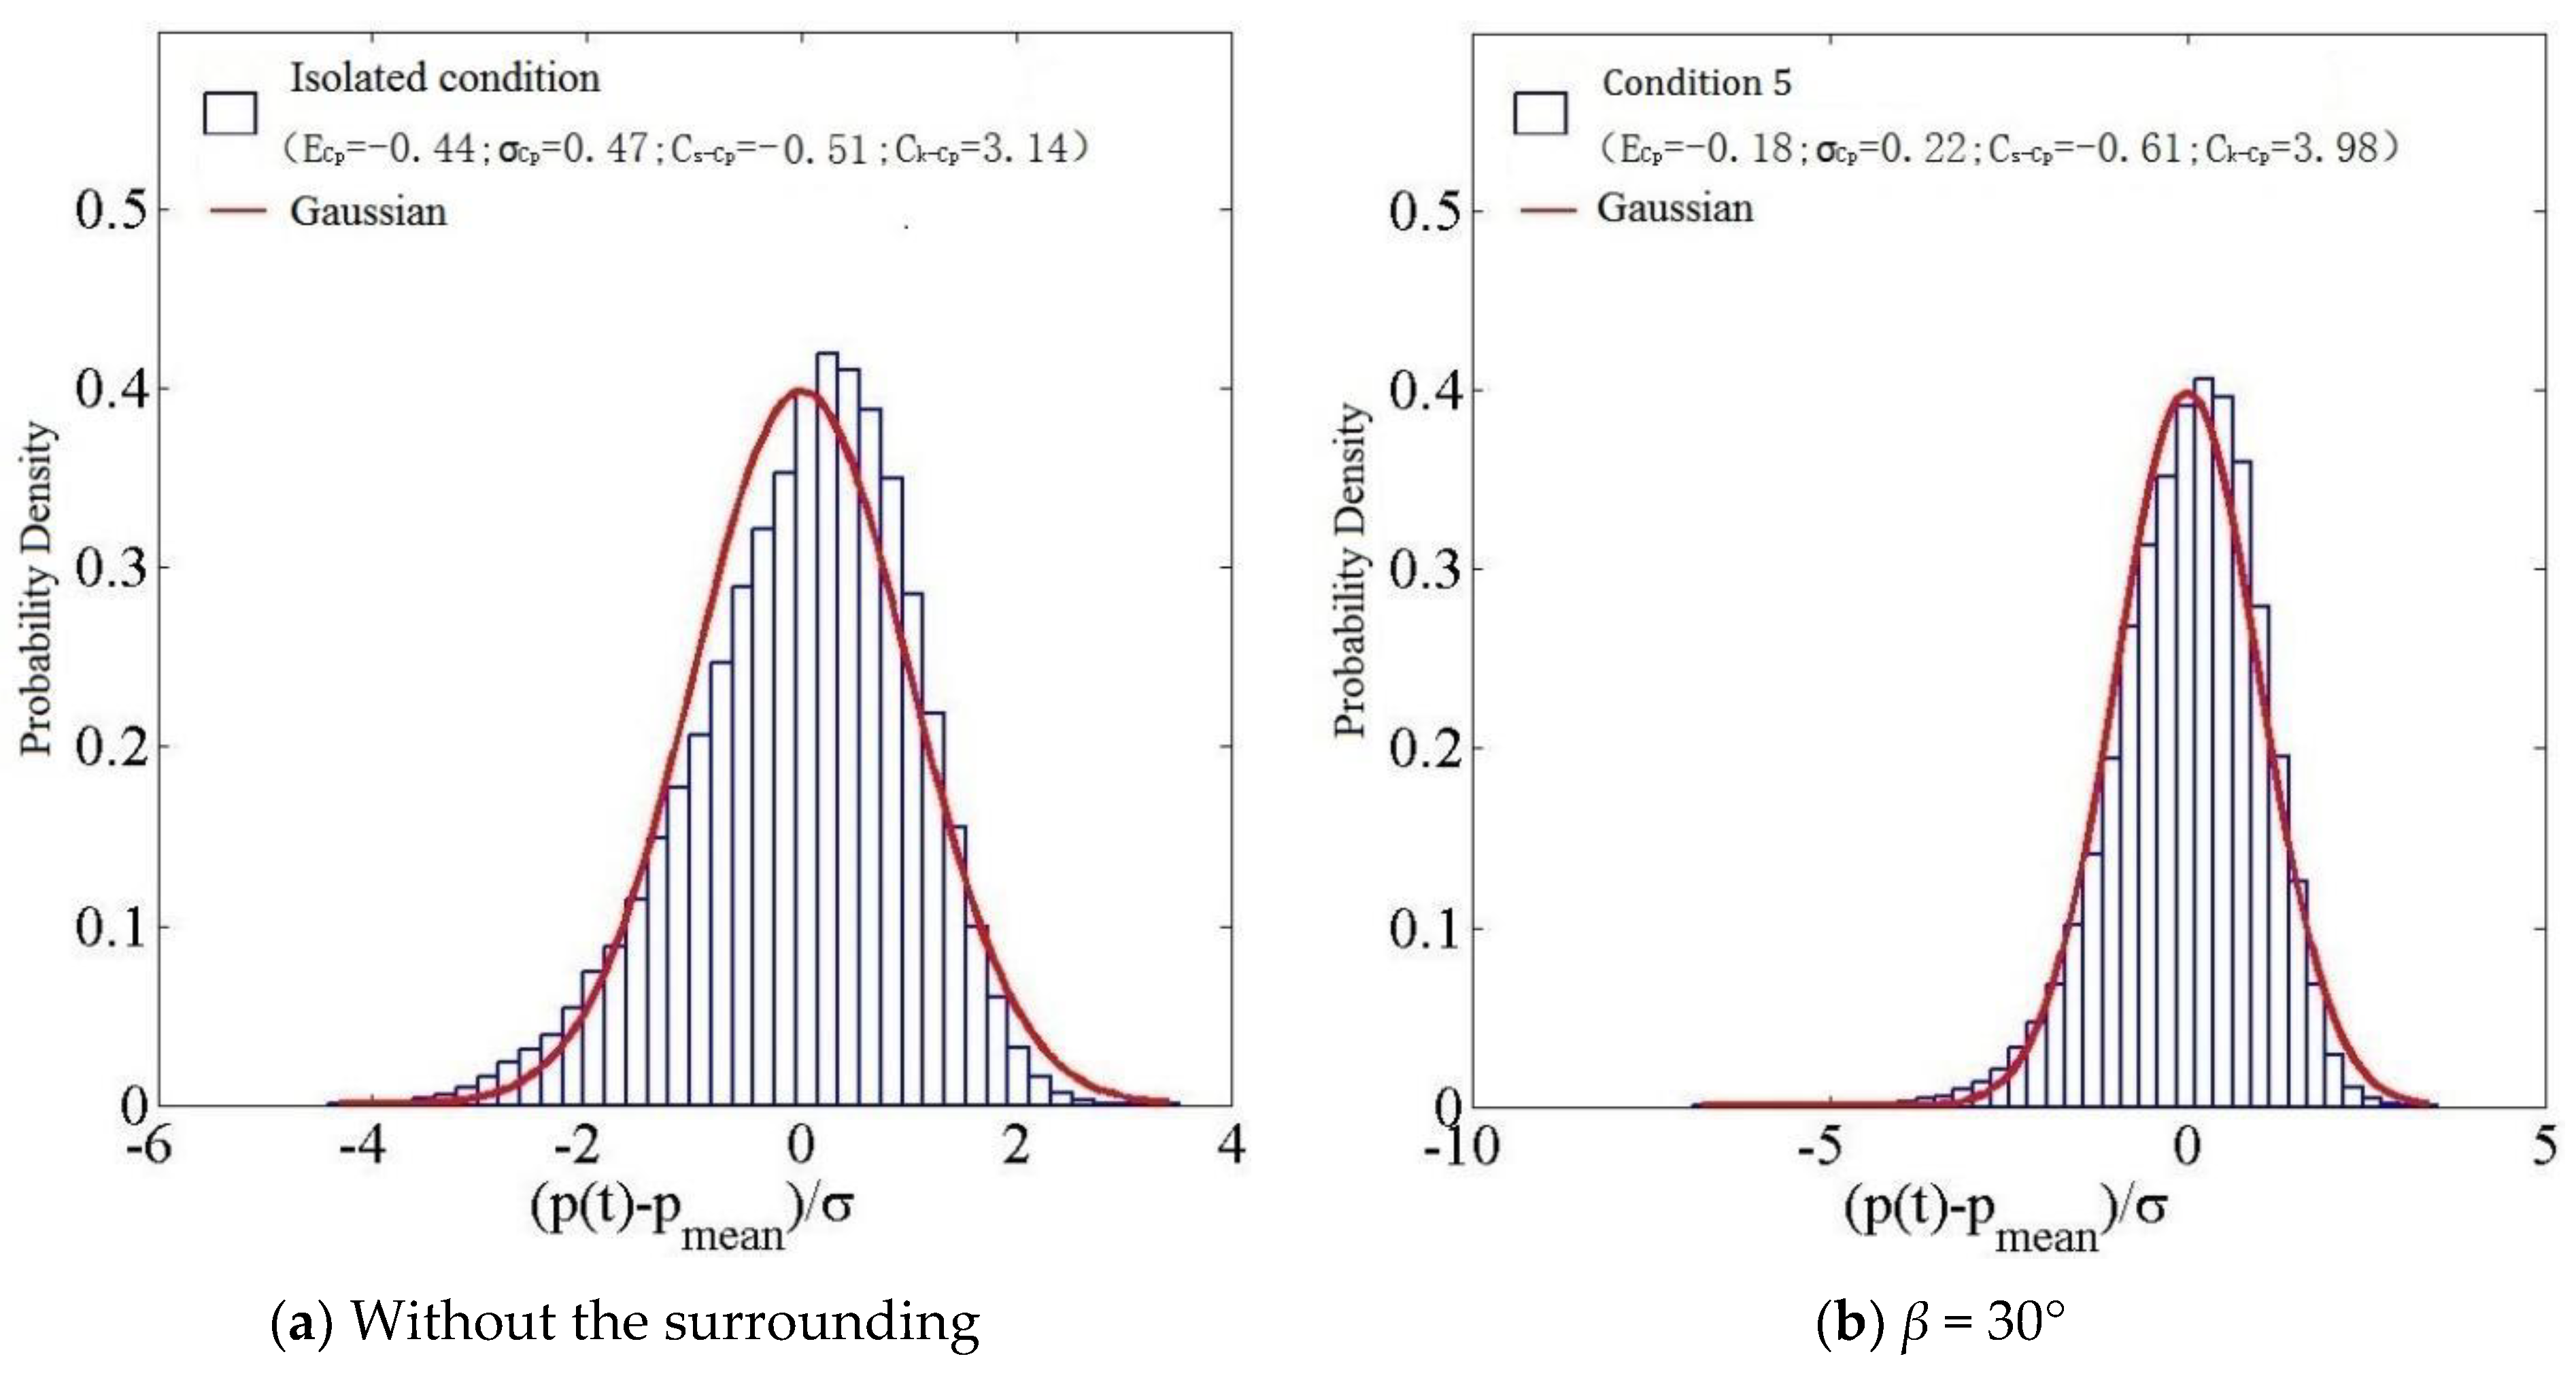
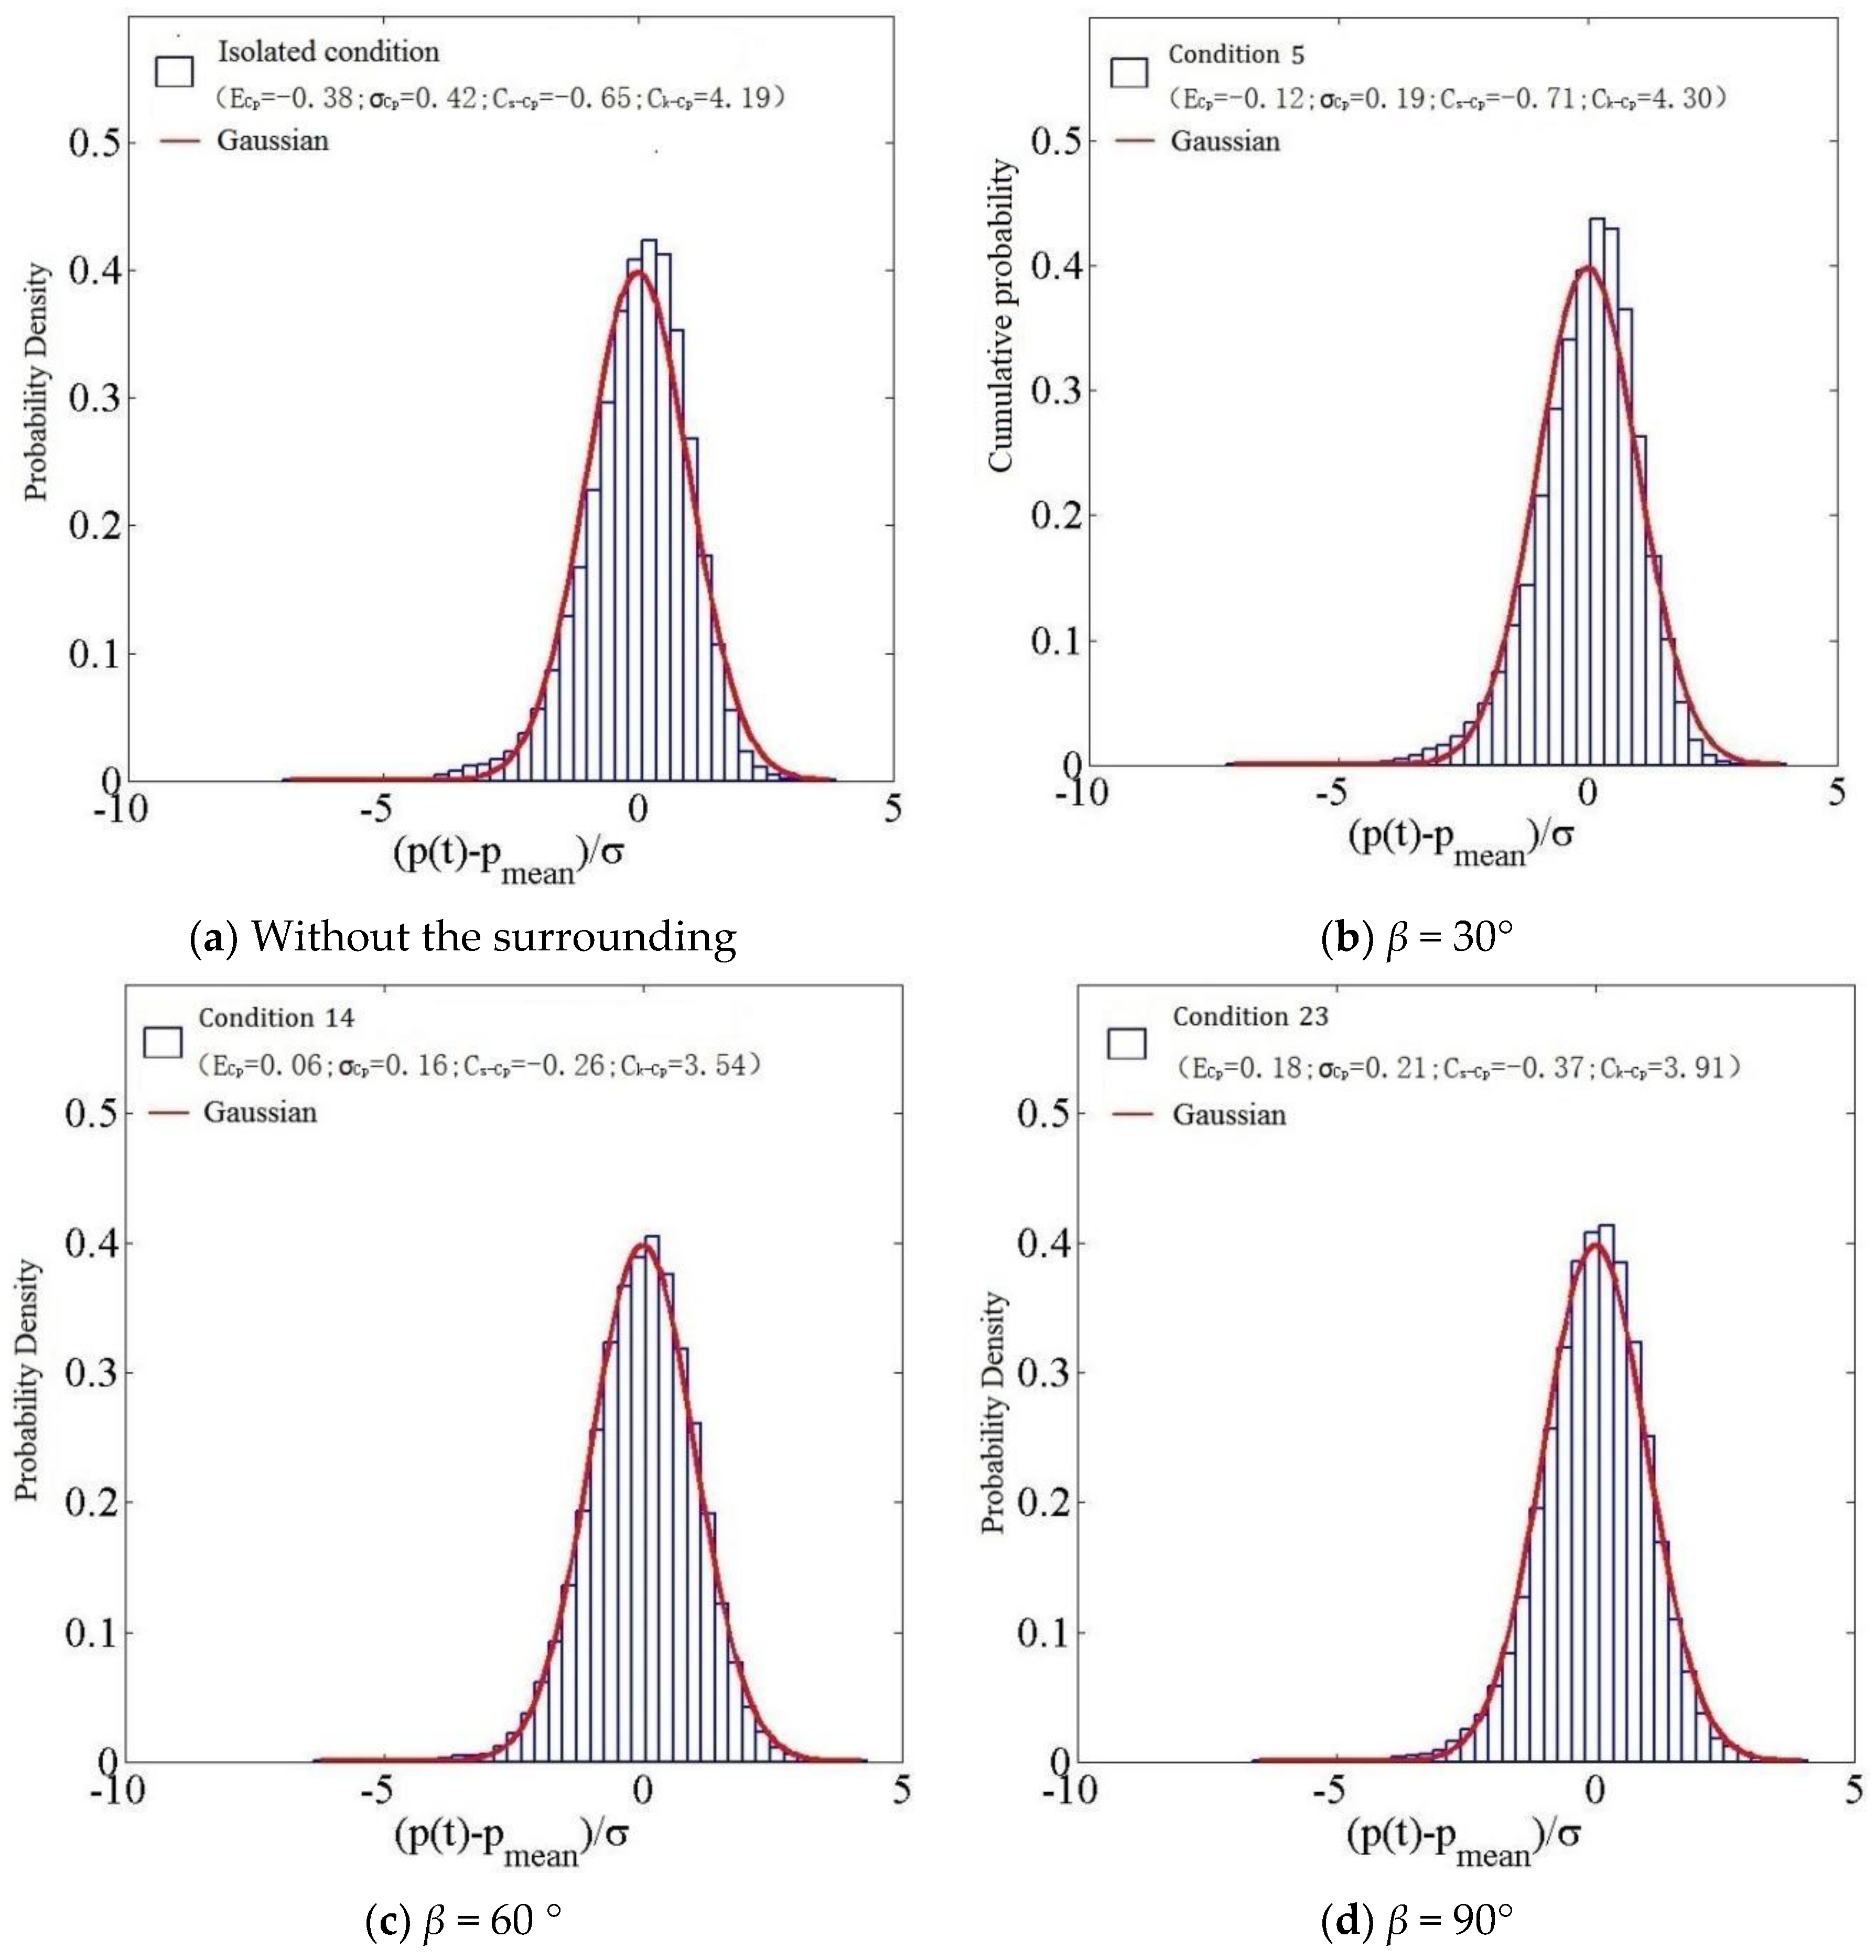
As illustrated in Figure 30, under wind angle 0°, for the middle measuring point WA7 on the leeward roof and without the influence of the surrounding environment, the mean value and root mean square value of the wind pressure coefficient were −0.38 and 0.42, respectively, the skewness and kurtosis were −0.65 and 4.19, and the wind pressure probability distribution was non-Gaussian. With the increase of slope gradient, at β = 30°, the mean absolute value and root mean square value of the wind pressure coefficient decreased. However, the absolute value of skewness and kurtosis increased, and the wind pressure probability distribution was still non-Gaussian. At β = 60°, the mean value and root mean square value of the wind pressure coefficient, as well as the skewness and kurtosis, decreased, and the wind pressure probability distribution was Gaussian. At β = 90°, the mean value and root mean square value of the wind pressure coefficient slightly increased, and the wind pressure probability distribution remained Gaussian. This is mainly due to the asymmetry of wind pressure time history distribution and the non normal distribution at the eaves due to the influence of air separation and hillside flow.
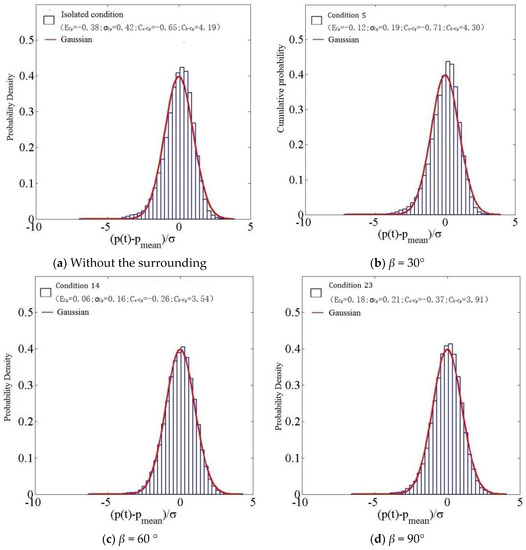
Figure 30.
Histogram of wind pressure probability density distribution at measuring point WA7 with slope gradient.
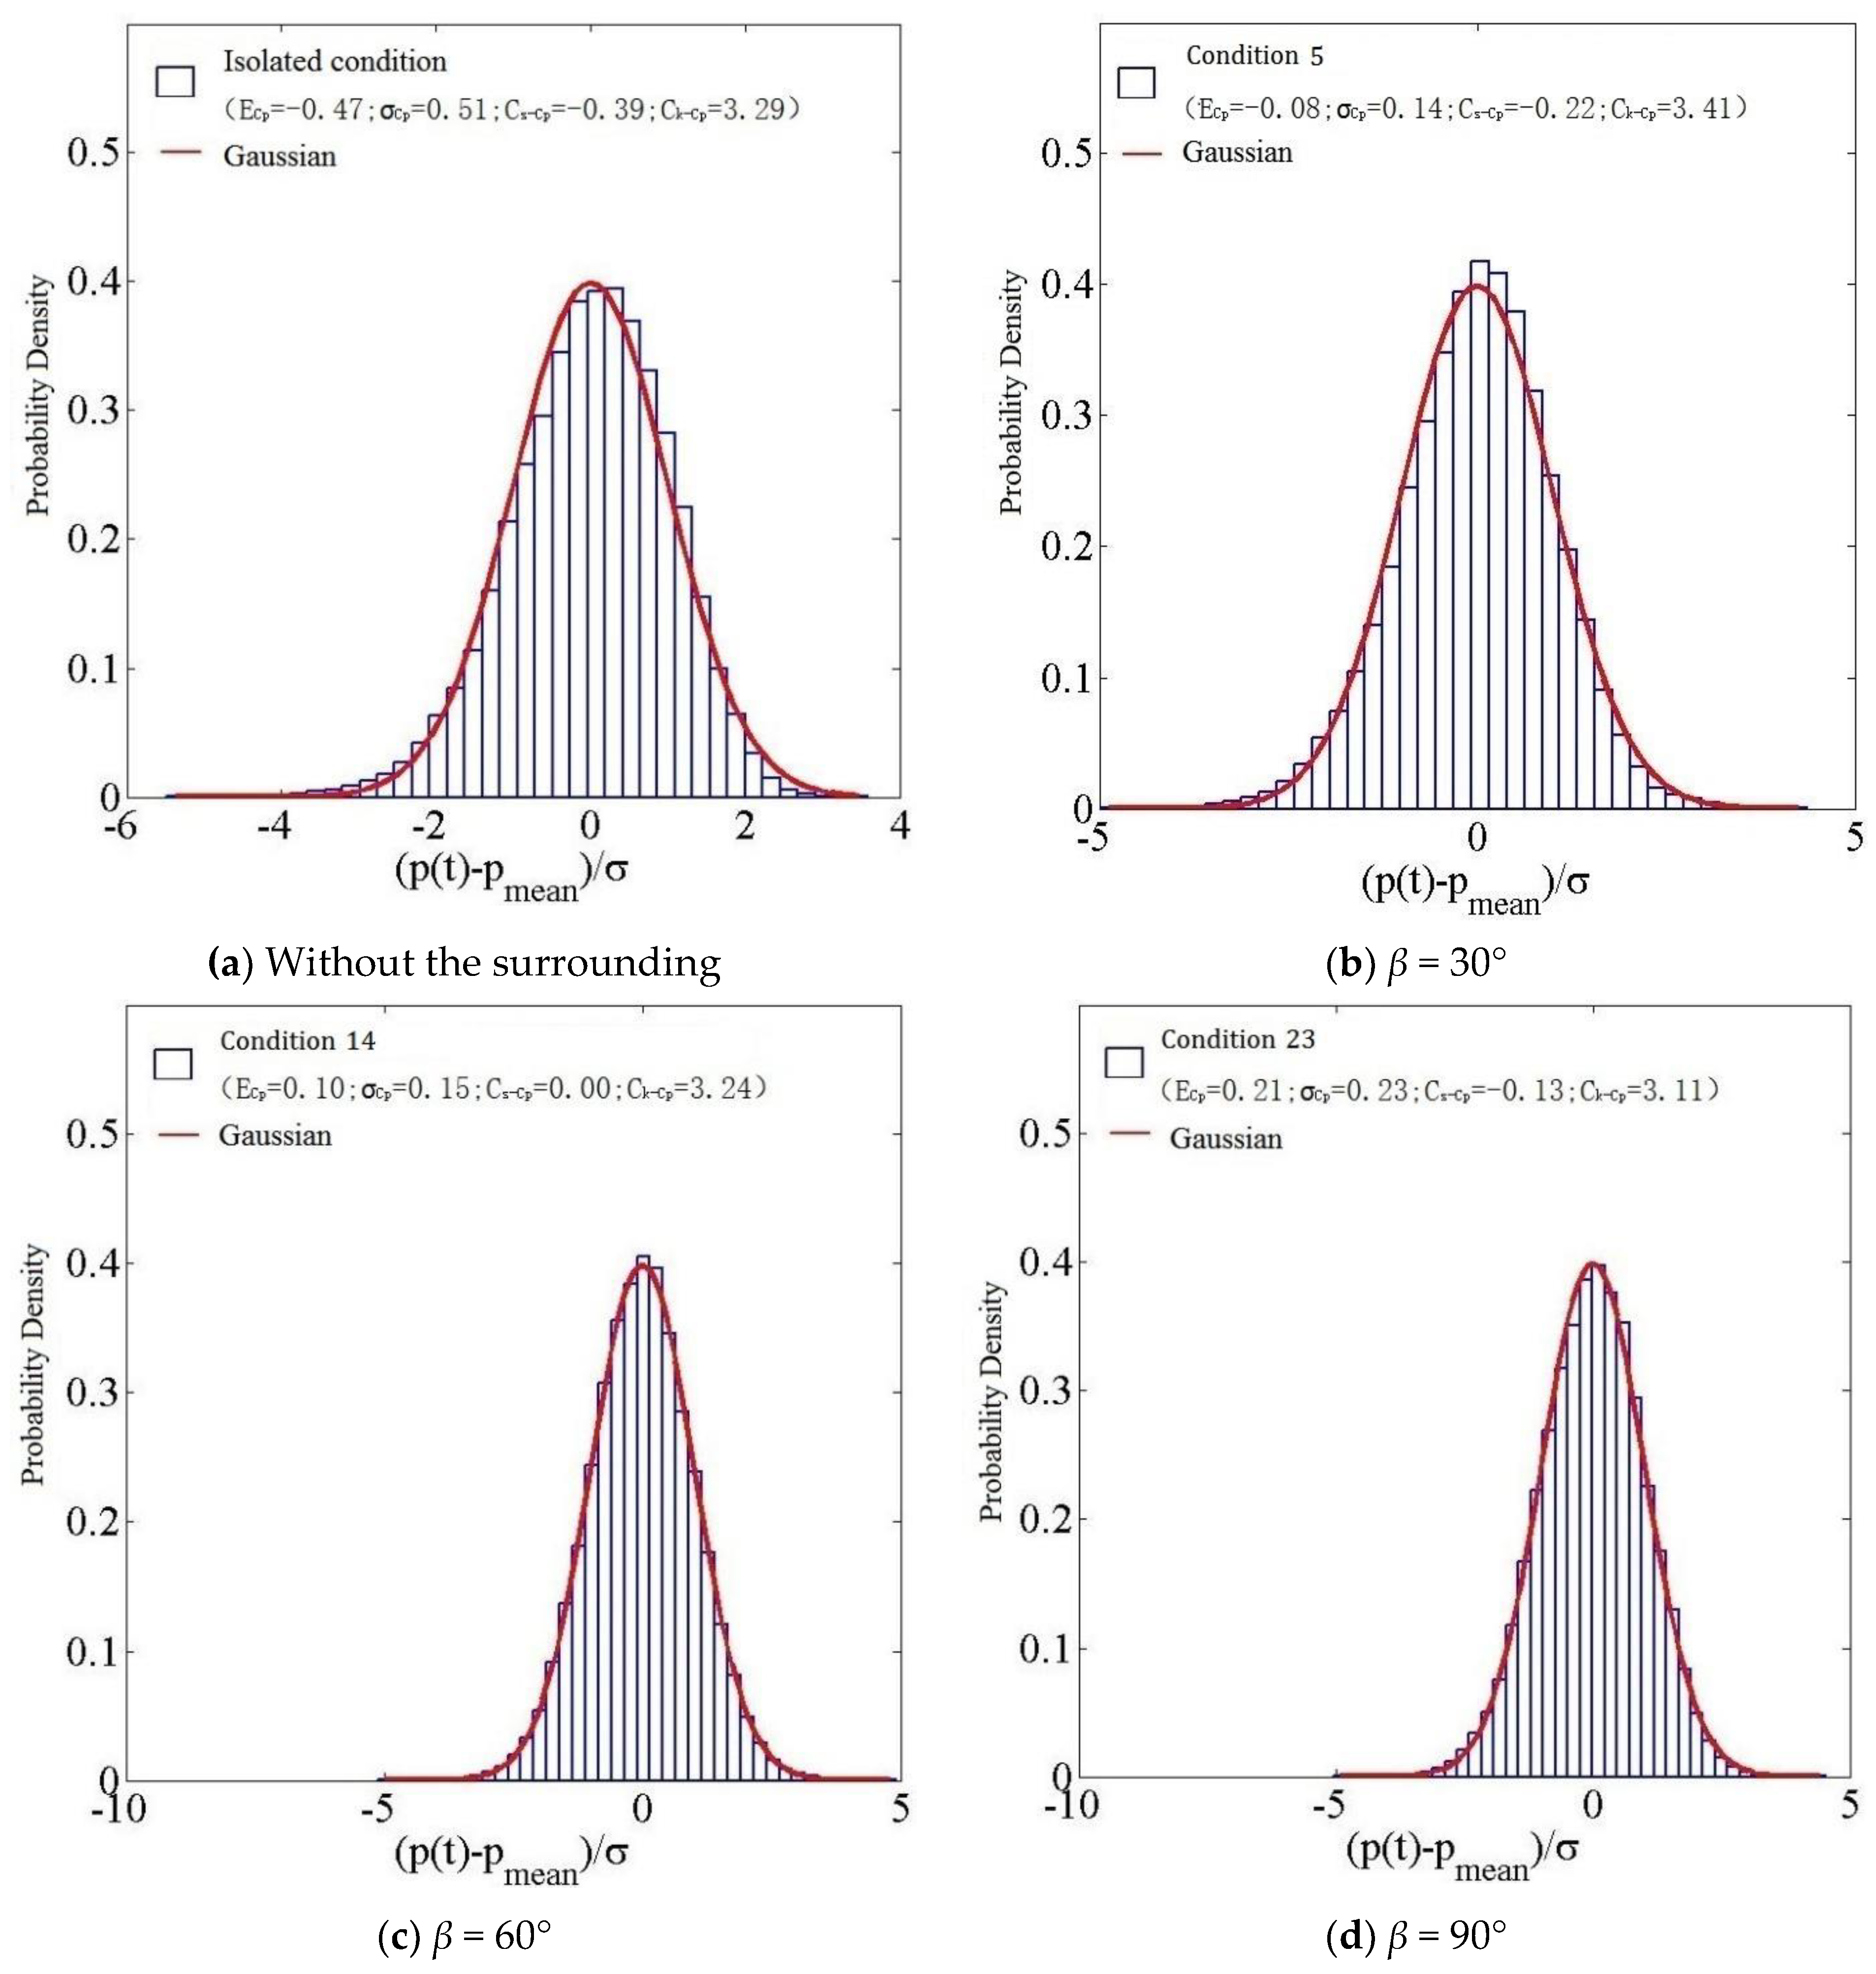
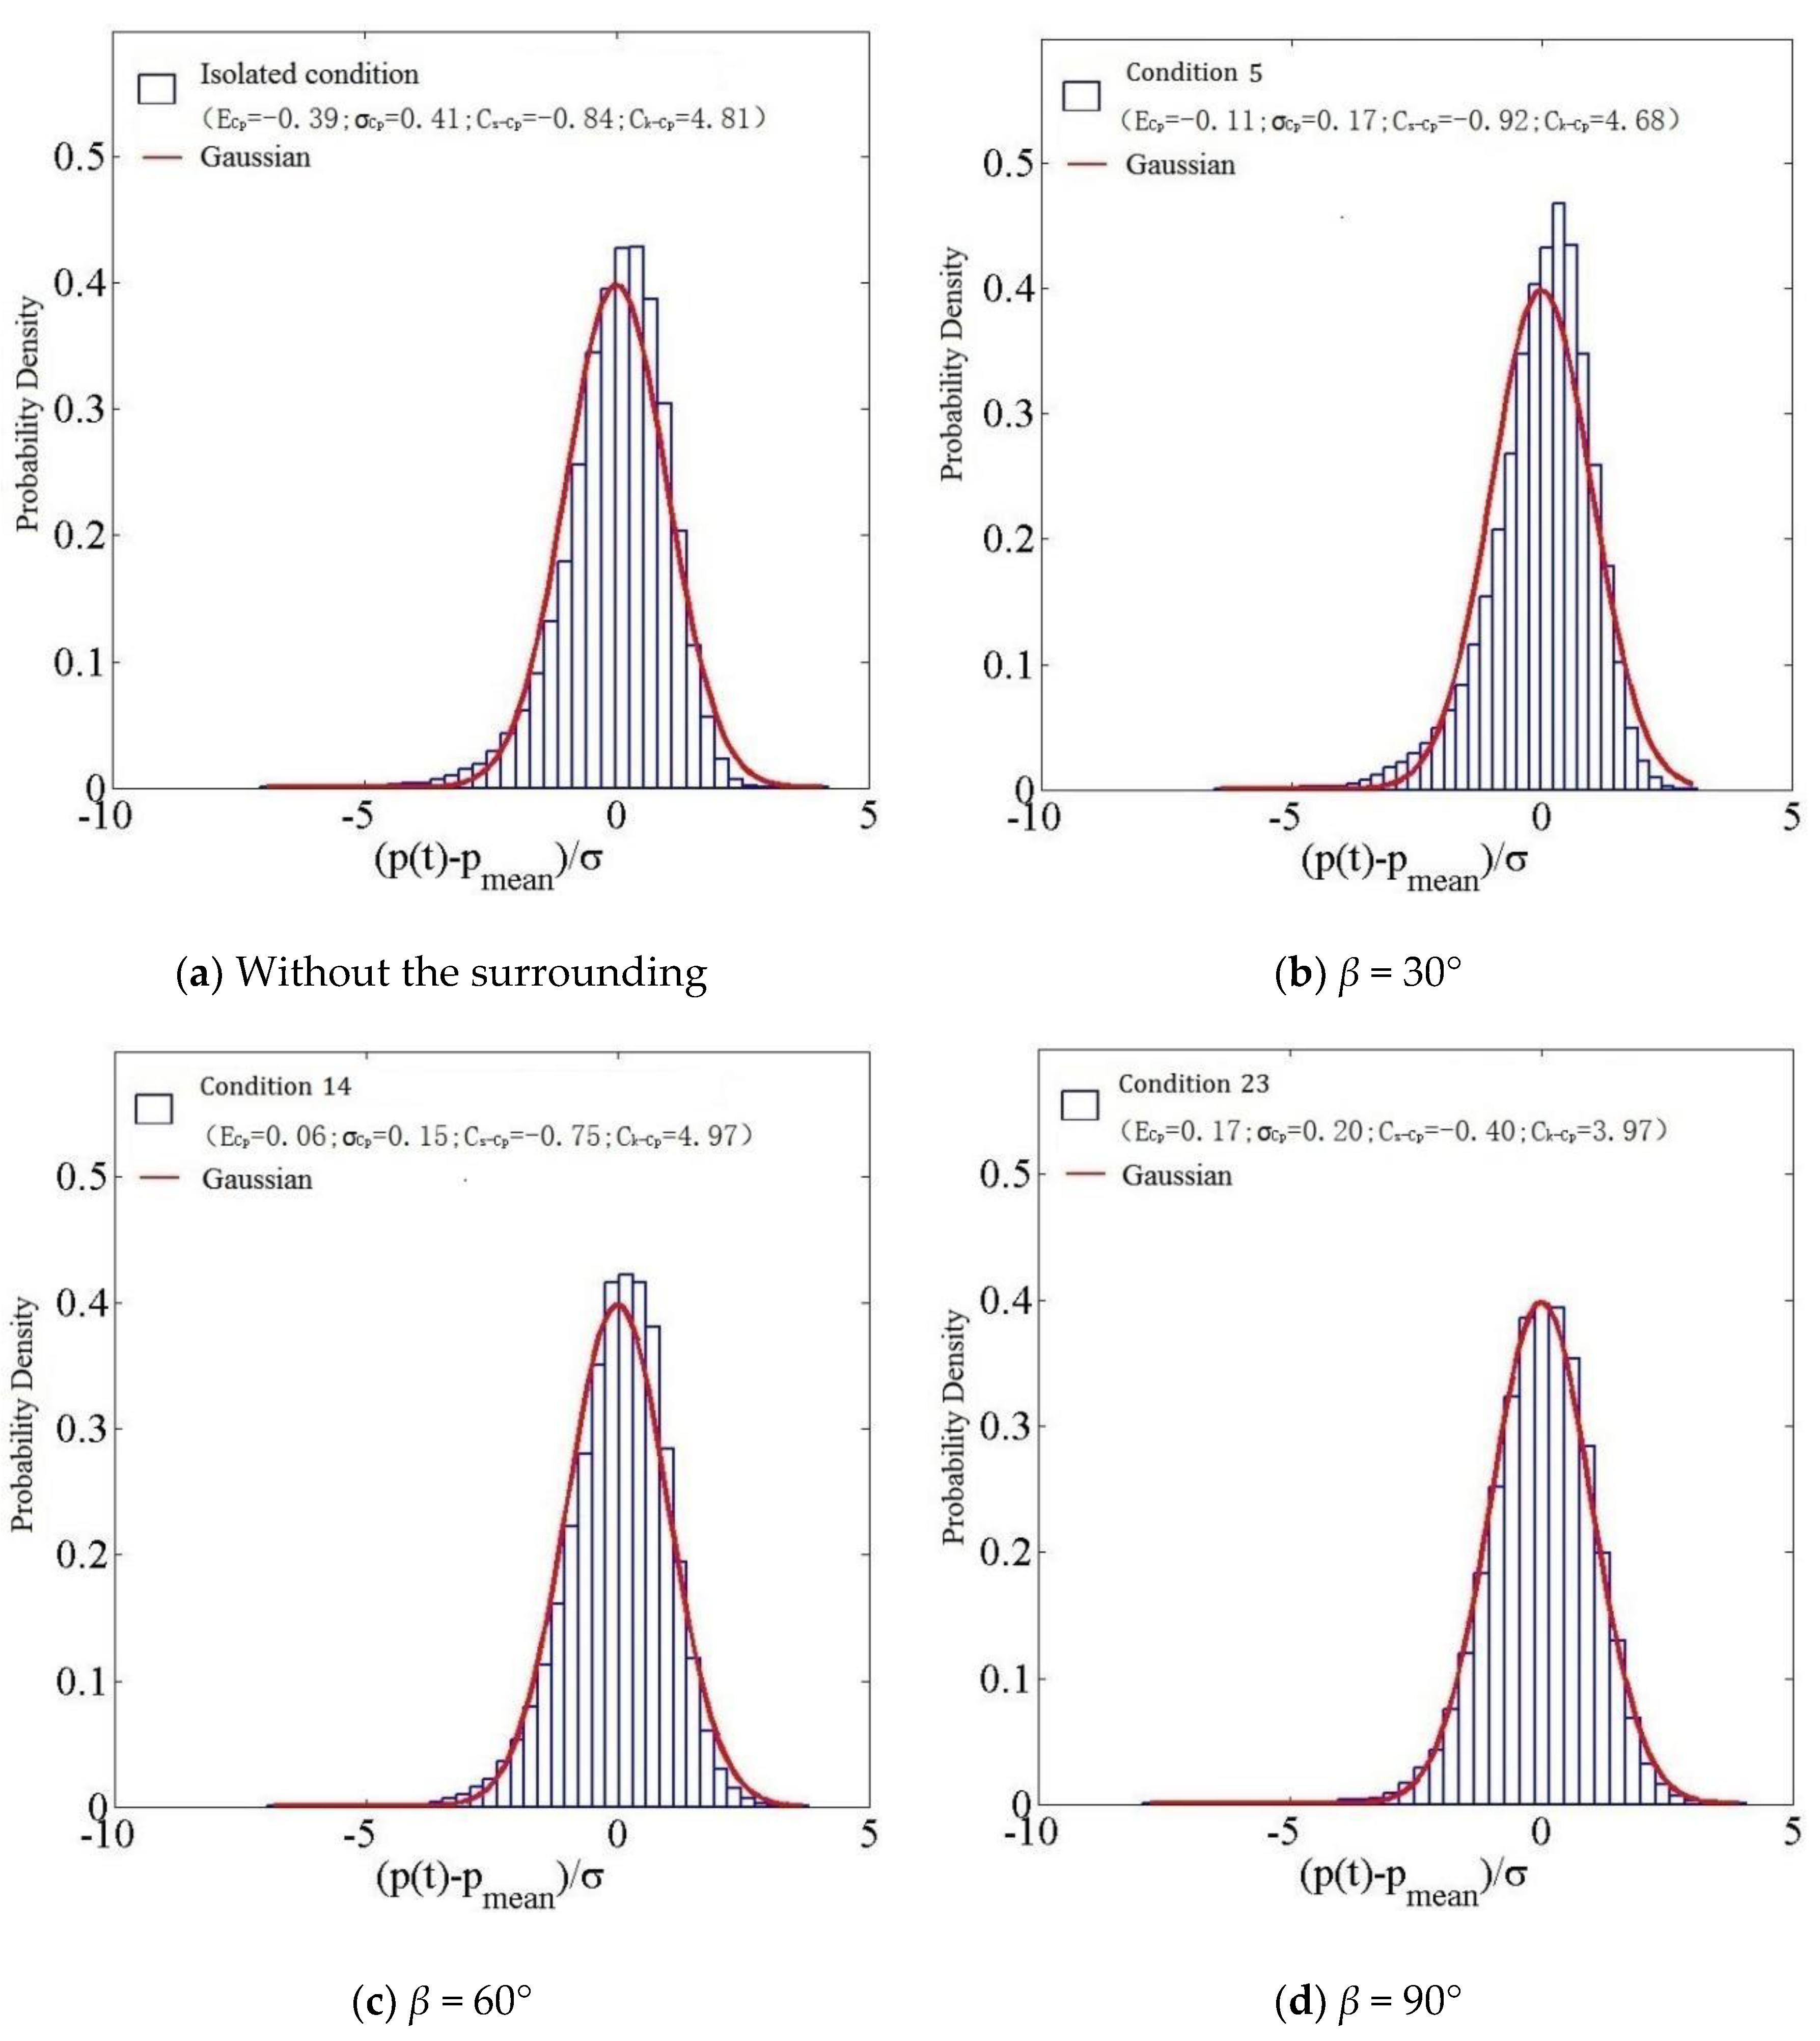
According to Figure 31, under wind angle 0°, with the increase of slope gradient for the middle measuring point WA20 on the windward roof at β = 30°, the mean absolute value and root mean square value of the wind pressure coefficient increased, together with the skewness and kurtosis. In this case, the wind pressure probability distribution was non-Gaussian. At β = 60°, the mean value and root mean square value of the wind pressure coefficient decreased, the skewness and kurtosis increased, and the wind pressure probability distribution was also non-Gaussian. Some features changed at β = 90°, and the mean value and root mean square value of the wind pressure coefficient remained unchanged. The skewness and kurtosis were decreased, and the wind pressure probability distribution was non-Gaussian. This is mainly due to the asymmetry of wind pressure time history distribution and the non normal distribution at the eaves due to the influence of air separation and hillside flow.
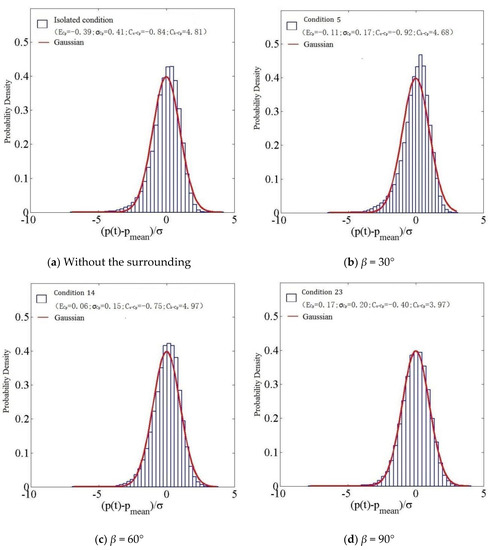
Figure 31.
Histogram of wind pressure probability density distribution at measuring point WA20 with slope gradient.
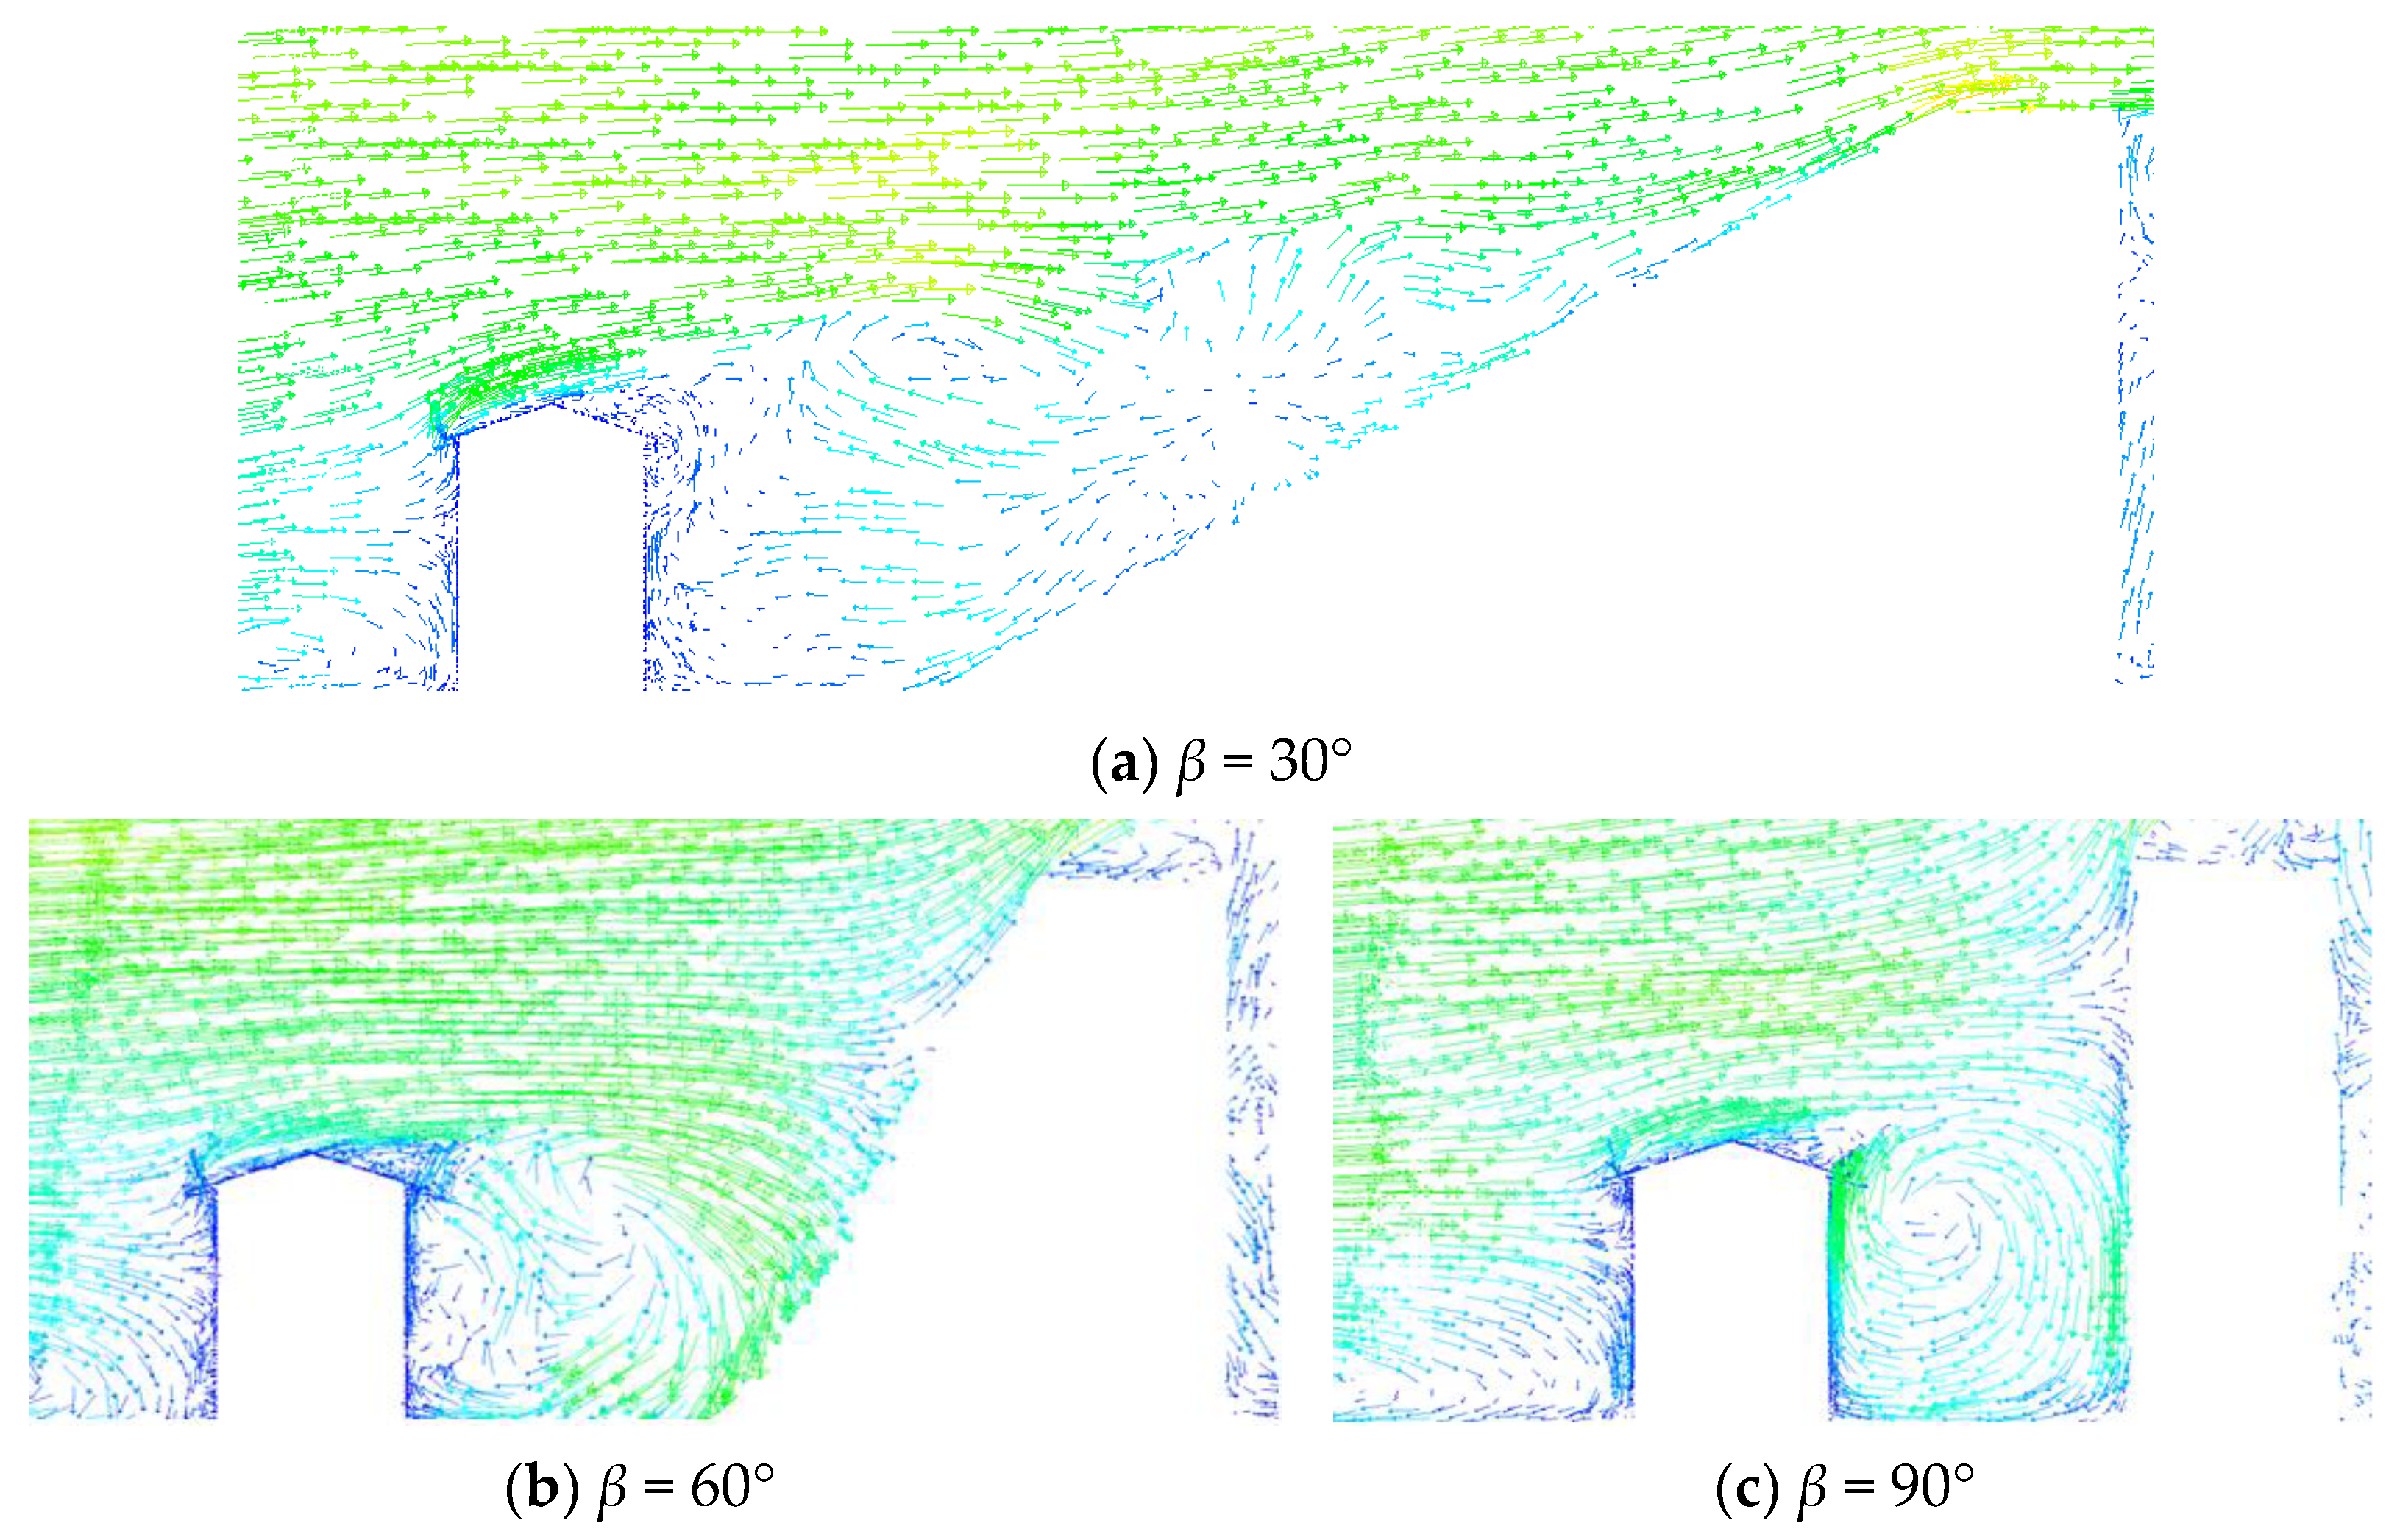
In order to better explain the change of the wind pressure probability density function of the building surface with the slope of the hillside, the average wind speed vector diagram by numerical simulation (CDF) at the middle line section of the building is taken as an example at the wind direction angle of 0°, as shown in Figure 32.
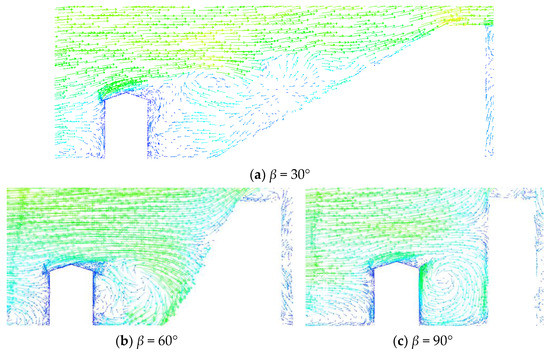
Figure 32.
Flow field varying with slope.
As can be seen in Figure 32, as the slope of the hill increases, the vortex formed by the mountain and the building gradually moves downward, and the air flow separates at the edge of the windward cornice and the wall, forming a separation bubble, resulting in a large reverse pressure gradient, which forms a high negative pressure. The separation bubble is then attached to the roof and forms a large pulsating pressure, and the probability density function of the pulsating wind pressure at the wind pressure measurement points located at these positions warps in the negative pressure region, showing obvious non-Gauss. The results of this study are the same as in other previous studies [33,34].
Comprehensive analysis of the trend of measurement points in different areas with slope is reflected in Figure 26, Figure 27, Figure 28, Figure 29, Figure 30 and Figure 31. With the increase of the slope, the wind pressure distribution characteristics of the windward eaves and the middle measuring points on the side gradually change from non-Gaussian characteristics to Gaussian characteristics, and the middle measuring points on the leeward surface have Gaussian characteristics under four working conditions. Among them, the non-Gauss of the roof measuring points WA7 and WA20 is more obvious, mainly because these measuring points are located in the airflow separation area at the front of the roof, and the pulsating energy of the pressure is not only affected by the turbulence degree of the incoming flow itself, but also mainly from the characteristic turbulence caused by the separation of the airflow. Due to the presence of longer negative pressure tails, it has a higher probability of high negative pressure than the Gaussian distribution. The probability distribution of wind pressure at other measurement points is very consistent with the Gaussian distribution, mainly because these measurement points are not in the airflow separation zone, and the pulsating energy of the wind pressure mainly comes from the contribution of the turbulence degree of the airflow itself.
6. Conclusions
- (1)
- The representative measurement points were observed for power spectrum variation with relevant parameters under 0° wind angle, and the results showed that the energy in the low-frequency band decreased, but it increased as the high-frequency band increased under a mountain form compared with the conditions without the influence of the surrounding environment. This discrepancy may be due to the presence of a mountain body that inhibited the spatial large-scale vortex structure, weakened the turbulence of the incoming wind, and strengthened the small-scale vortex. At the windward eaves, with the increase of slope gradient, the energy in the low-frequency band dropped, but it surged in the high-frequency band.
- (2)
- An analysis of the variation law of wind pressure probability distribution of middle measuring points in different areas at 0° wind angle showed that with the increase of the slope gradient, the wind pressure probability density distribution map gradually changes from symmetric to asymmetric at the measuring points of windward eaves and side centers, which show that the wind pressure probability density distribution changes from non-Gaussian to Gaussian. Furthermore, the lee side middle measuring points had a Gaussian wind pressure distribution under all of the four working conditions.
- (3)
- Compared with no surrounding environment, the energy in the low frequency band is weakened and the energy in the high frequency band is enhanced when there are mountains. This is mainly due to the existence of mountains, which restrain the large-scale vortex structures in space, weaken the turbulence characteristics of incoming wind and increase the small-scale vortex.
- (4)
- Among them, the non-Gauss of the roof measuring points WA7 and WA20 is more obvious, and it is mainly because these measuring points are located in the airflow separation area at the front of the roof, and the pulsating energy of the pressure is not only affected by the turbulence degree of the incoming flow itself, but also mainly from the characteristic turbulence caused by the separation of the airflow. Due to the presence of longer negative pressure tails, it has a higher probability of high negative pressure than the Gaussian distribution. The probability distribution of wind pressure at other measurement points is very consistent with the Gaussian distribution, mainly because these measurement points are not in the airflow separation zone, and the pulsating energy of the wind pressure mainly comes from the contribution of the turbulence degree of the airflow itself. The non-Gaussian characteristics of the wind pressure probability distribution at the measuring points on the structure surface are mainly caused by the effects of air separation, vortex shedding and vortex reattachment.
Author Contributions
Conceptualization, Z.L. (Zhengnong Li); methodology, M.Z. and Z.L. (Zhengnong Li); software, M.Z. and B.H.; validation, M.Z. and Z.L. (Zhengnong Li); formal analysis, M.Z. and B.H.; investigation, M.Z. and B.H.; resources, Z.L. (Zhongyang Liu); data curation, M.Z.; writing—original draft preparation, M.Z.; writing—review and editing, M.Z. and B.H.; visualization, Z.Z.; supervision, M.Z. and Z.L. (Zhengnong Li); project administration, M.Z.; funding acquisition, M.Z. and B.H. All authors have read and agreed to the published version of the manuscript.
Funding
The work described in this paper was supported by the National Natural Science Foundation of China [grant number 52068019]; and the Hainan Provincial Natural Science Foundation of China [grant numbers 522RC605 and 520QN231]; and the Youth Top Talent Project of Hebei Provincial Department of Education (No: BJ2020010).
Data Availability Statement
The study did not report any data.
Conflicts of Interest
The authors declare no conflict of interest.
References
- Dai, Y.M.; Li, Z.N. Wind loads on low-rise buildings: Study on variation of near ground wind profiles. Chin. Civ. Eng. J. 2009, 42, 42–48. [Google Scholar]
- Alrawashdeh, H.; Stathopoulos, T. Wind pressures on large roofs of low buildings and wind codes and standards. J. Wind Eng. Ind. Aerodyn 2015, 147, 212–225. [Google Scholar] [CrossRef]
- Chen, B.; Cheng, H. Interference effects on wind loads of gable-roof buildings with different roof slopes. J. Wind. Eng. Ind. Aerodyn. 2019, 189, 198–217. [Google Scholar] [CrossRef]
- Kwan, K.; Kopp, G.A. The effects of edge radius on wind tunnel tests of low-rise buildings. J. Wind Engin. Indust. Aerodynam. 2021, 214, 104668. [Google Scholar] [CrossRef]
- Chahardoli, S.; Khakzand, M.; Faizi, M.; Siavashi, M. Numerical analysis of the effect of roof types and porch on particle dispersion and deposition around a low-rise building. J. Build. Eng. 2022, 53, 104–125. [Google Scholar] [CrossRef]
- Liu, Z.X.; Yu, Z.X. An investigation on external airflow around low-rise building with various roof types: PIV measurements and LES simulations. Build. Environ. 2020, 169, 104533. [Google Scholar] [CrossRef]
- Pindado, S.; Meseguer, J.; Franchini, S. Influence of an upstream building on the wind-induced mean suction on the flat roof of a low-rise building. J. Wind Eng. Ind. Aerodyn. 2011, 99, 889–893. [Google Scholar] [CrossRef]
- Kim, Y.C.; Tamura, Y. Shielding effects on wind force correlations and quasi-static wind load combinations for low-rise building in large group. J. Wind. Eng. Ind. Aerodyn. 2013, 112, 58–70. [Google Scholar] [CrossRef]
- Li, G.; Gan, S.; Li, Y.; Wang, L. Wind-induced interference effects on low-rise buildings with gable roof. J. Wind Eng. Ind. Aerodyn. 2017, 170, 94–106. [Google Scholar] [CrossRef]
- Li, Z.; Li, Y.X. The influence of muti/high-rise building on the surface wind load of low-rise building. Alex. Eng. J. 2022, 61, 11979–11991. [Google Scholar]
- Kim, Y.C.; Tamura, Y.k. Proximity effect on low-rise building surrounded by similar-sized buildings. J. Wind. Eng. Ind. Aerodyn. 2015, 146, 150–162. [Google Scholar] [CrossRef]
- Meddage, D.P.P.; Lewangamage, C.S. On the deviation of mean pressure coefficients in wind loading standards for a low-rise, gable-roofed building with boundary walls. Structures 2022, 36, 50–64. [Google Scholar]
- Alok, D.J.; Gaurv, S. Interference Effect on Wind Loads on Gable Roof Building. Procedia Eng. 2011, 14, 1776–1783. [Google Scholar]
- Yong, C.K.; Akihito, Y.; Yukio, T. Characteristics of surface wind pressures on low-rise building located among large group of surrounding buildings. Eng. Struct. 2012, 35, 18–28. [Google Scholar]
- Chen, B.; Luyu, J.; Kun, D. Interference Effects of Wind Loads of Two Low-rise Building with Flat Roof. In Proceedings of the 14th International Conference on Wind Engineering, Porto Alegre, Brazil, 21–26 June 2015; pp. 21–26. [Google Scholar]
- Li, G.; Gan, S.; Li, Y.; Wang, L. A study on the wind-induced disturbance effect of low-rise buildings. Coll. Disaster Prev. Mitig. Eng. 2017, 36, 1023–1029. [Google Scholar]
- Li, Y.X. A study on the Wind-Induced Disturbance Effect of Gable Roof Low-Rise Buildings. Doctoral Dissertation, Dalian University of Technology, Dalian, China, 2016. [Google Scholar]
- Tang, M. A Study on the Wind Load Disturbance Effect of Groups of Low-Rise Buildings. Doctoral Dissertation, Dalian University of Technology, Dalian, China, 2019. [Google Scholar]
- Weng, W.; Taylor, E.A.; Walmsley, J.L. Guidelines for air flow over complex terrain: Model developments. J. Wind. Eng. Ind. Aerodyn. 2000, 86, 169–186. [Google Scholar] [CrossRef]
- Shi, L.L. Analysis of Wind Load Effect of the Low-rise Housing in the Complicated Mountain Terrain. Doctoral Dissertation, Huaqiao University, Quanzhou, China, 2009. [Google Scholar]
- Zhong, M.; Li, Z.N.; Min, Q. Wind tunnel test on wind load of low-rise buildings in typical mountain landform:analysis of hillside slope effects. Acta Aerodyn. Sin. 2016, 34, 687–695. [Google Scholar]
- Li, Z.N.; Zhong, M.; Lamei, H.U. Wind tunnel test on low-rise buildings influenced by spacing between hillside and building in typical mountain terrain. J. Build. Struct. 2015, 36, 67–74. [Google Scholar]
- Wei, Q.X. Study on Estimation of Extreme Wind Pressure and Interference Effect of Typical Low Houses with Double Slopes. Doctoral Dissertation, Guangzhou University, Guangzhou, China, 2020. [Google Scholar]
- Wang, X.J.; Li, Q.S. Nonstationary near-ground wind characteristics and wind-induced pressures on the roof of a low-rise building during a typhoon. J. Build. Eng. 2022, 53, 1–22. [Google Scholar] [CrossRef]
- Ministry of Housing and Urban Rural Development of the People’s Republic of China. Load Code for Building Structures (GB50009-2012); China Construction Industry Press: Beijing, China, 2006; pp. 33–34. [Google Scholar]
- Kumar, K.S.; Stathopoulos, T. Power spectra of wind pressure on low building roofs. J. Wind Eng. Ind. Aerodyn. 1998, 74–76, 665–674. [Google Scholar] [CrossRef]
- Kumar, K.S.; Stathopoulos, T. Wind loads on low building roofs: A stochastic perspective. J. Struct. Eng. 2000, 126, 944–956. [Google Scholar] [CrossRef]
- Qiu, T.S. Statistical Signal Processing Non-Gaussian Signal Processing and Its Application; Electronic Industry Press: Beijing, China, 2005; pp. 45–49. [Google Scholar]
- Yue, W. Study on Wind Effect and Wind Resistance Design Theory of Long-Span Roof Structures. Postdoctoral Dissertation, Tongji University, Shanghai, China, 2006. [Google Scholar]
- Sun, Y. Characterisitics of Wind Loading on Long-Span Roofs. Doctoral Dissertation, Harbin University of Technology, Harbin, China, 2007. [Google Scholar]
- Peng, X.; Yang, L.; Gavanski, E. A comparison of methods to estimate peak wind loads on buildings. J. Wind. Eng. Ind. Aerodyn. 2014, 126, 11–23. [Google Scholar] [CrossRef]
- Holmes, J.D. Non-Gaussian characteristics of wind pressure fluctuations. J. Wind Eng. Ind. Aerodyn. 1981, 7, 103–108. [Google Scholar] [CrossRef]
- Li, Q.S. Probability characteristics of pressure fluctuations in separated and reattaching flows for various free-stream turbulence. J. Wind Eng. Ind. Aerodyn. 1999, 82, 125–145. [Google Scholar] [CrossRef]
- Uematsu, Y. Peak gust pressure acting on the roof and wall edges of a low-rise building. J. Wind Eng. Ind. Aerodyn. 1998, 77, 217–231. [Google Scholar] [CrossRef]
Publisher’s Note: MDPI stays neutral with regard to jurisdictional claims in published maps and institutional affiliations. |
© 2022 by the authors. Licensee MDPI, Basel, Switzerland. This article is an open access article distributed under the terms and conditions of the Creative Commons Attribution (CC BY) license (https://creativecommons.org/licenses/by/4.0/).

