Article

Outlier Based Skimpy Regularization Fuzzy Clustering Algorithm for Diabetic Retinopathy Image Segmentation

by
Selvamani Hemamalini
* and
Visvam Devadoss Ambeth Kumar
*
Department of Computer Science and Engineering, Panimalar Engineering College, Anna University, Chennai 600123, India
*
Authors to whom correspondence should be addressed.
Symmetry 2022, 14(12), 2512; https://doi.org/10.3390/sym14122512
Submission received: 25 October 2022 / Revised: 4 November 2022 / Accepted: 10 November 2022 / Published: 28 November 2022
(This article belongs to the Section Computer)

Abstract

:
Blood vessels are harmed in diabetic retinopathy (DR), a condition that impairs vision. Using modern healthcare research and technology, artificial intelligence and processing units are used to aid in the diagnosis of this syndrome and the study of diagnostic procedures. The correct assessment of DR severity requires the segmentation of lesions from fundus pictures. The manual grading method becomes highly difficult and time-consuming due to the wide range of the morphologies, number, and sizes of lesions. For image segmentation, traditional fuzzy clustering techniques have two major drawbacks. First, fuzzy memberships based clustering are more susceptible to outliers. Second, because of the lack of local spatial information, these techniques often result in oversegmentation of images. In order to address these issues, this research study proposes an outlier-based skimpy regularization fuzzy clustering technique (OSR-FCA) for image segmentation. Clustering methods that use fuzzy membership with sparseness can be improved by incorporating a Gaussian metric regularisation into the objective function. The proposed study used the symmetry information contained in the image data to conduct the image segmentation using the fuzzy clustering technique while avoiding over segmenting relevant data. This resulted in a reduced proportion of noisy data and better clustering results. The classification was carried out by a deep learning technique called convolutional neural network (CNN). Two publicly available datasets were used for the validation process by using different metrics. The experimental results showed that the proposed segmentation technique achieved 97.16% and classification technique achieved 97.26% of accuracy on the MESSIDOR dataset.

1. Introduction

Data of human internal organs can be collected quantitatively using a variety of medical imaging techniques. In vivo or non-invasive data collection is possible using these methods [1,2,3]. When studying and diagnosing the disorders of living tissue, these procedures are preferred. Photographs with visible spectrum and multispectral imaging are the most commonly used modalities for imaging tissues in the human body, as they are capable of enhancing the spectral resolution and provide relevant information about its composition [4,5]. MRI and tomographic procedures are two examples of advanced mathematical techniques that can be utilised to study the internal parts of the body. Some of the numerous potential imaging patterns for collecting quantitative information about organs include the techniques outlined above [6]. Despite the large variety of imaging methods, the number of image processing methods is greater than the number of imaging approaches. With reference to medical pictures’ structural segmentation and characterization [7], this is a very relevant and wide-ranging field [8]. The segmentation of anatomical structures such as blood veins and organs is implied in the medical environment. Methods to describe an object’s properties are designed to provide a set of measures that may be used to emphasise its characteristics. As a result of these measurements, tissues, diseased and healthy states, and so on can be identified [9,10].
Ophthalmological and cardiovascular illnesses such as glaucoma and diabetes can be quickly identified by quantitatively analysing the retinal fundus pictures which have been extensively used [11,12]. This is a critical part of the quantitative analysis of retinal fundus pictures, which entails extracting clinically important parameters such as the length, density, and so on, from the segmented vascular tree that has been analysed. Another application is to create mosaic images of the retina using the segmented vascular tree. Other examples were given in [13]. Human error and processing time are two of the many drawbacks of segmenting the vascular tree manually in retinal pictures. In circumstances where the vessels are complicated and the quantity of photos is large, human error is more likely to occur, affecting the early diagnosis and treatment assessment of retinal illnesses [14].
There are many different types of vessels in the retina, and recognising and localising them are essential to distinguishing them from other retinal anatomical components, such as aberrant lesions, the macula, and the optic disc. Non-invasive fundus imaging techniques and the valuable information provided by the vasculature structure allow the detection and diagnosis of a wide variety of retinal pathologies. Fuzzy clustering methods, which are currently popular, face two problems when used for image segmentation. The first problem is that fuzzy memberships are non-sparse, which makes these algorithms vulnerable to outliers. This also makes them vulnerable to oversegmentation. We used a unique regularisation to obtain sparse fuzzy memberships and then propose the OSR-FCA for image segmentation to address these issues. As a result, non-homogenous interference, may effectively be decreased. The structure of this report is as follows: Section 2 begins with a discussion of the research works that are directly linked to our topic. In Section 3, we go over the proposed algorithm and its benefits. In addition, in Section 4, we perform experiments and analyse the outcomes. Section 5, our final section, concludes this report.

2. Related Works

Ali Hatamizadeh et al. [15] presented trainable deep active contours (TDACs) to be implemented in the image segmentation framework to solve the accuracy issue using the Vaihingen and Bing hut datasets. In addition, a modern hybrid method was proposed, but we noticed some points that could limit its applicability, such as the dependence on pre-trained convolutional neural networks. Moreover, they left the area open for further enhancement in the accuracy of CNN-based image segmentation. Eventually, the studies presented in this section mostly focused on enhancing the accuracy of the segmented retinal images. As a result, this paper focuses on the trainable filter algorithm, which was adapted to very powerful and common datasets, DRIVE and HRF, to achieve the highest accuracy results of up to 99.12% and 98.78%, respectively.
A new segmentation algorithm was developed by Jin et al. [16] and consisted of three major stages: Hessian feature edges are used to extract all black linear outlines in a retinal fundus image, and this approach was used for parameter initialization. Second, the images were divided into (N) localization areas (R), and the impact of each pixel was used to create an image of the retina fundus, which was then used to build the snake energy function on the image representation, so that the snake’s location could be identified between the vicinity of vessel edges and real ones. Third, the DRIVE dataset was used to validate the suggested approach, and the findings demonstrated that the proposed methodology performed exceptionally well, with an accuracy of up to 95.21%, a sensitivity of 75.08%, and a specificity of 96.56%.
For the segmentation and localisation of the optic disc (OD) and fovea centres, Hasan [17], offered an end-to-end encoder-decoder model called DRNet. To account for the loss of spatial information due to the encoder pooling, a skip connection was suggested, which was called the residual skip connection. Instead of concatenating, the suggested skip connection does not directly concatenate the features. A variety of public datasets, DRISHTI-GS and DRIVE for OD segmentation and HRF for OD centre location, were used to test DRNet’s ability to correctly segment the OD. In this case, only a small amount of data was used for training and testing.
With the adapted U-Net architecture of [18,19], which is based on residual networks and initialised based on the resizing of convolution nearest neighbour, it provides an alternative to the standard U-Net design. The suggested architecture for microaneurysm and hard exudate segmentation was trained and tested on two publicly available datasets, IDRiD and e-ophtha, yielding a dice score of 0.9998 for each. For microaneurysm segmentation, the network performed flawlessly on the e-ophtha dataset with a 99.98% accuracy rating, 99.88% sensitivity, and 99.8% specificity.
Segmentation and classification of DR may be aided by machine learning (ML). This investigation used 2D retinal fundus images. For the study, a total of 2500 RF datasets (size 256 × 256) were generated by the five DR phases, which totalled 500 RF datasets each. Research presented here presents the concept of “region-growing automation”, a new way of automatically creating regions based on clustering. The classification accuracy rates for texture analysis employing histogram (H) and run-length matrix (RLM) features were 77.67%, 80%, 89.87%, and 96.33% for various ML classifiers. Data fusion was employed to build a hybrid-feature dataset that was more accurate in classifying. Four feature selection procedures were used to select the 13 best features from the 245 pieces of hybrid feature data in each image. We used these classifiers to sort out features that had been fine-tuned using a 10-fold cross-validation approach, and their classification accuracy ranged from 98.53% to 99.73% for SMO, 99.66% to 99.73% for LMT, and 99.73% to 99.73% for SLg.
Segmentation of lesions was improved by Wan [20]. It is called EAD-Net because it is constructed on a CNN and can be broken down into encoder, attention, and decoder modules. After normalisation, the fundus pictures were subjected to automated feature extraction and pixel-by-pixel label prediction. Based on AUPR (area under precision-recall curve) scores comparable to those on the IDRiD dataset, our technique attained a sensitivity of 92.77%, a specificity of 99.98%, and an accuracy of 99.97% on the e-ophtha EX dataset. Most characteristics, including sensitivity and F1-Score, have improved by around 10% in our EAD-Net, which is superior to the original U-net.
By employing a multi-level set segmentation method, SVM with selective characteristics, and genetic algorithm, Kandhasamy [21] developed a novel diagnostic approach for determining the DR severity. The suggested system used mathematical morphological processes in order to cluster data. This was followed by segmenting the clusters using a multi-level set segmentation technique that used terms such as mean, median, etc., to detect the primary regions of the retina. The support vector machine classifier used the retrieved features to determine the severity of the condition. Sensitivity and specificity were used to evaluate and compare this method. They showed 97.14% of sensitivity, 100% of specificity, and 99.3% of accuracy on average. The results showed that the suggested approach was well-suited for early detection of diabetic retinopathy.
The author of [22] presented the viewpoint-based weighted kernel fuzzy clustering (VWKFC) method. For starters, they introduced the kernel-based hypersphere density initialization (KHDI) approach, which used the kernel distance instead of the Euclidean distance. An original density radius was also proposed. Second, they defined the weight information granule, which has two sub-components. To lessen the impact of irrelevant features, a feature weight matrix was supplied. Additionally, by giving each data point a weight based on its representation in the sample, the impact of noise and outliers on clustering may be mitigated. Third, the density perspective was the KHDI data point with the highest local density. Then, VWKFC method was built, proving its convergence, by combining the kernel mechanism, density perspectives, weight information granules, and a maximum entropy regularisation.
The author of [23] created two new clustering techniques by including sparsity into the standard fuzzy framework. Departure-sparse fuzzy c-means was the name of the first method (DSFCM). The second technique, deviation-sparse fuzzy c-means with neighbour information constraint (DSFCM N), was presented for use in cases when spatial correlation is present. This article made three main contributions. At first, the clustering procedure used theoretical values of data, which were derived from the measured values. The resulting cluster centres could be more precise than those obtained using the standard fuzzy c-means method. Second, DSFCM and DSFCM N were able to detect noise and outliers by imposing sparsity on the discrepancies between observed and predicted values. Finally, the estimation of the variances between measured values and theoretical values of data would be more trustworthy with the constraint of neighbour knowledge than only examining the data itself.

3. Proposed Methodology

The proposed study avoided oversegmenting important data by utilising the symmetry information present in the image data to conduct image segmentation using the fuzzy clustering technique. The research work contains of three major steps such as preprocessing, segmentation, and classification, where these steps are briefly explained in the following sections. Figure 1 shows the working flow of the proposed methodology.

3.1. Pre-Processing

Using computer-aided segmentation of retinal pictures and visual assessment, preprocessing techniques aims to improve disease detection probability. Colour fundus images from the two datasets are scaled to 128 by 128 pixels in the first step of the process. These images are made up of a red, green, and blue fundus pictures. Because of the high contrast between the blood vessels and the backdrop and the best contrast between the optic disc and the retinal tissue, the green channel of the RGB image is employed for preprocessing. The veins of the choroid are clearly visible in the red channel. The retinal vesicles are clearly apparent, although the green channel has less contrast. Then, the images are changed to greyscale to speed up processing. Localization of the optic disc will be completed using the greyscale image. Noise and lack of retinal morphological information make the blue channel unsuitable for detection.
For better contrast and uniformity, histogram equalisation is applied after the greyscale conversion. Image enhancement techniques are used to transform a greyscale image into a histogram equalised image. It is used to increase the contrast in images. Instead of working on complete vision, it focuses on specific sections of the eye, which are referred to as “tiles”. Using bilinear interpolation, the side-by-side tiles are blended to erase any borders. As a result of these components, a picture can be divided into dark, bright, or low-contrast images. For the grey level image (0–255) and the histogram (0–255), the axis is located at the sum of pixels in the image, and the horizontal range is from 0 to 1.
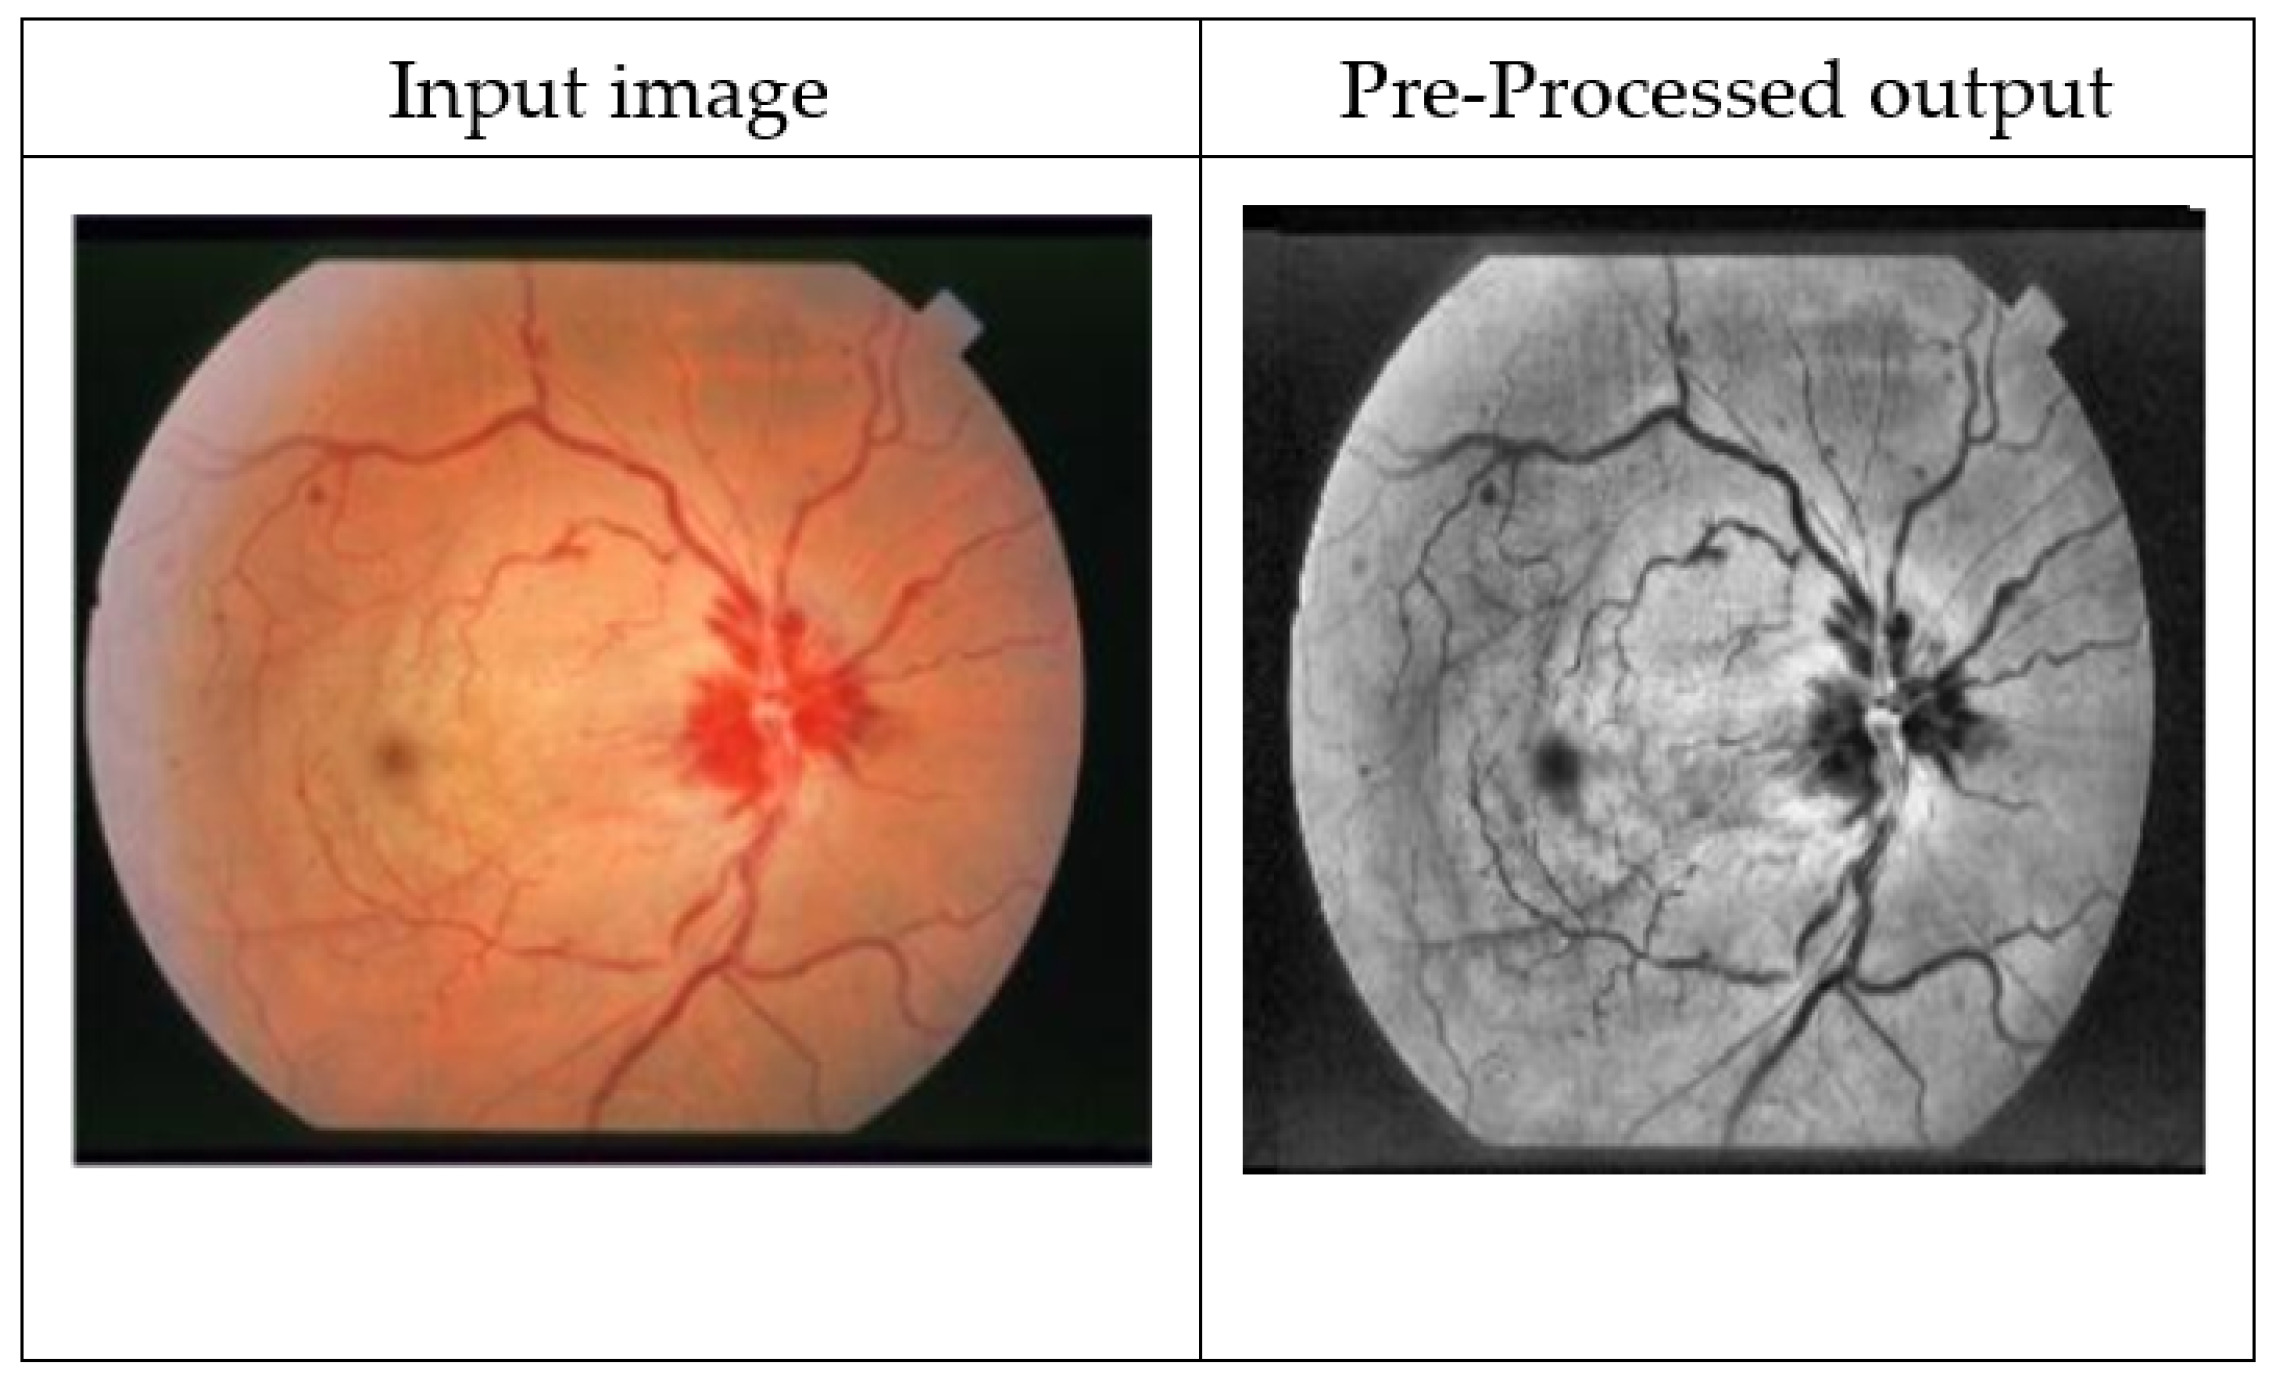
Every image processing equipment has the ability to do picture filtering. They remove noise of images by retaining their fine details. Filter behaviour and data type influence the selection of a filter. In order to eliminate noise from an image, an algorithm is used to either remove or reduce the noise in the image. Smoothing near-contrast portions of an image reduces or eliminates noise, a process known as noise reduction. However, these methods can provide fine contrasts in dark data. Applying the average filter globally removes the background from the entire image, which has been treated with increased contrast. Using this filter to obtain a subtracted image, the model subtracts the greyscale module’s output from the average filter’s processed image. Figure 2 demonstrates the results of reducing and enhancing photos with noise reduction.

3.2. Segmentation

Accordingly, we present a new version of the OSR-FCA in this work. Over-segmentation and outlier sensitivity can be efficiently overcome with the OSR-FCA suggested and segmentation outcomes improved as a result.

Brief Description of OSR-FCA

It is not possible to produce fuzzy memberships with a small number of members using the existing FCM algorithms such as DSFCM [23], MalFCM [24], and MEFC [25]. New regularisation methods are introduced to deal with this problem by incorporating u i j 2 as an additional penalty term. It is our goal to define the objective function of the OSR-FCA
J ˜ = i = 1 c j = 1 n u i j Φ ( x j | v i i ) + γ i = 1 c j = 1 n u i j 2
where Φ ( x j | v i i ) in order to control the sparsity of membership, the distance function reflects the distance between x j i and v i j . The goal function’s resilience to outliers and noise can be varied by varying the value of γ .
The first term of J will therefore be modest in Equation (1), whereas the second term will be enormous. As a result, the OSR-FCA takes additional iterations than k-means but less iterations than FCM to reach the optimal computation. Goal function J is a suitable compromise between k-means and FCM. The obtained fuzzy membership is far less significant than that of FCM. Fuzzy membership values, in contrast to k-means, are not invariably 0 or 1. In addition to that, Φ ( x j | v i , i )
Φ ( x j | v i i ) = ln ( ρ ( x j | v i , i ) )
where ρ ( x j | v i i ) is the Gaussian density distinct as:
ρ ( x j | v i i ) = e x p ( 1 2 ( x j v i ) T i 1 ( x j v i ) ) ( 2 π ) D 2 | i | 1 2
I is the covariance matrix describing intraclass dispersion for the ith class in D, where (D) is the dimension of the input data. When we replace Equation (2) with Equation (3), we obtain:
Φ ( x j | v i i ) = 1 2 ( ( x j v i ) T i 1 ( x j v i ) + ln | i | + D ln ( 2 π ) )
For densely distributed data, the variable ln | i | may have a high negative value, making the distance metric in Equation (4) diverse from the Mahalanobis distance. Due to the influence of ln | i | , the constraint of non-negative values may not be satisfied by the Φ ( x j | v i , i ) . Increasingly negative covariance values lead to substantial problems in distance measurement and misclassification as the value decreases. This problem can be solved.
Φ ( x j | v i , i ) = Φ m i n ( Φ ) m i n ( Φ ) < 0 Φ O t h e r w i s e
where Φ ( x j | v i i ) contents the non-negative restraint of distance. Relieving Φ ( x j | v i i ) into Equation (1), the final impartial function is distinct as
J ˜ = i = 1 c j = 1 n u i j Φ ( x j | v i , i ) + γ i = 1 c j = 1 n u i j 2
For each example x j , the J ˜ can be unglued into c subproblems with restraint circumstances 0 u i j 1 a n d ( i = 1 ) c u i j m = 1 . Then we obtain
J ˜ j = m i n i = 1 c ( u i j Φ ( x j | v i i ) + γ u i j 2
Through simplification, J ˜ j can be rewritten as:
J ˜ j = m i n u i j h i j 2
where h i j = Φ ( x j | v i i ) / 2 γ . To solve Equation (8), we use the optimization approach presented in [26] to achieve different levels of sparsity by adjusting.
To find the clustering centre for the J ˜ i similar sub-problems can be identified by solving J ˜ i v i = 0
J ˜ i v i = j = 1 n u i j ( x j v i ) T i 1 ( x j v i ) + ln | i | + D ln ( 2 π ) v i
j = 1 n u i j ( x j v i ) = 0
We obtain
v i = j = 1 n u i j x j j = 1 n u i j
Furthermore, the solving J ˜ i i = 0
J ˜ i i = j = 1 n u i j ( x j v i ) T i 1 ( x j v i ) + ln | i | + D ln ( 2 π ) i
j = 1 n u i j ( x j v i ) T i 2 ( x j v i ) + i 1 = 0
The solution yields
i = j = 1 n u i j ( x j v i ) T ( x j v i ) j = 1 n u i j
When the FCM technique is used to initialise, the number of iterations is decreased. Our proposed OSR-FCA procedure can be summarised as follows:
(1)
Set the number of clusters c, regularization parameter γ , convergence threshold η , and maximum iteration number T.
(2)
Initialize the membership U ( 0 ) , the clustering centres V ( 0 ) , and the covariance matrix ( 0 ) using the FCM algorithm.
(3)
Set the loop counter t = 1 .
(4)
Update U ( t ) , V ( t ) , ( t ) using Equations (8), (11), and (14) respectively.
(5)
Update the objective function J ˜ ( t ) using Equation (6).
(6)
If max | J ˜ ( t ) J ˜ ( t 1 ) | η o r t T stop; otherwise, update t = t + 1 and go to step 4.
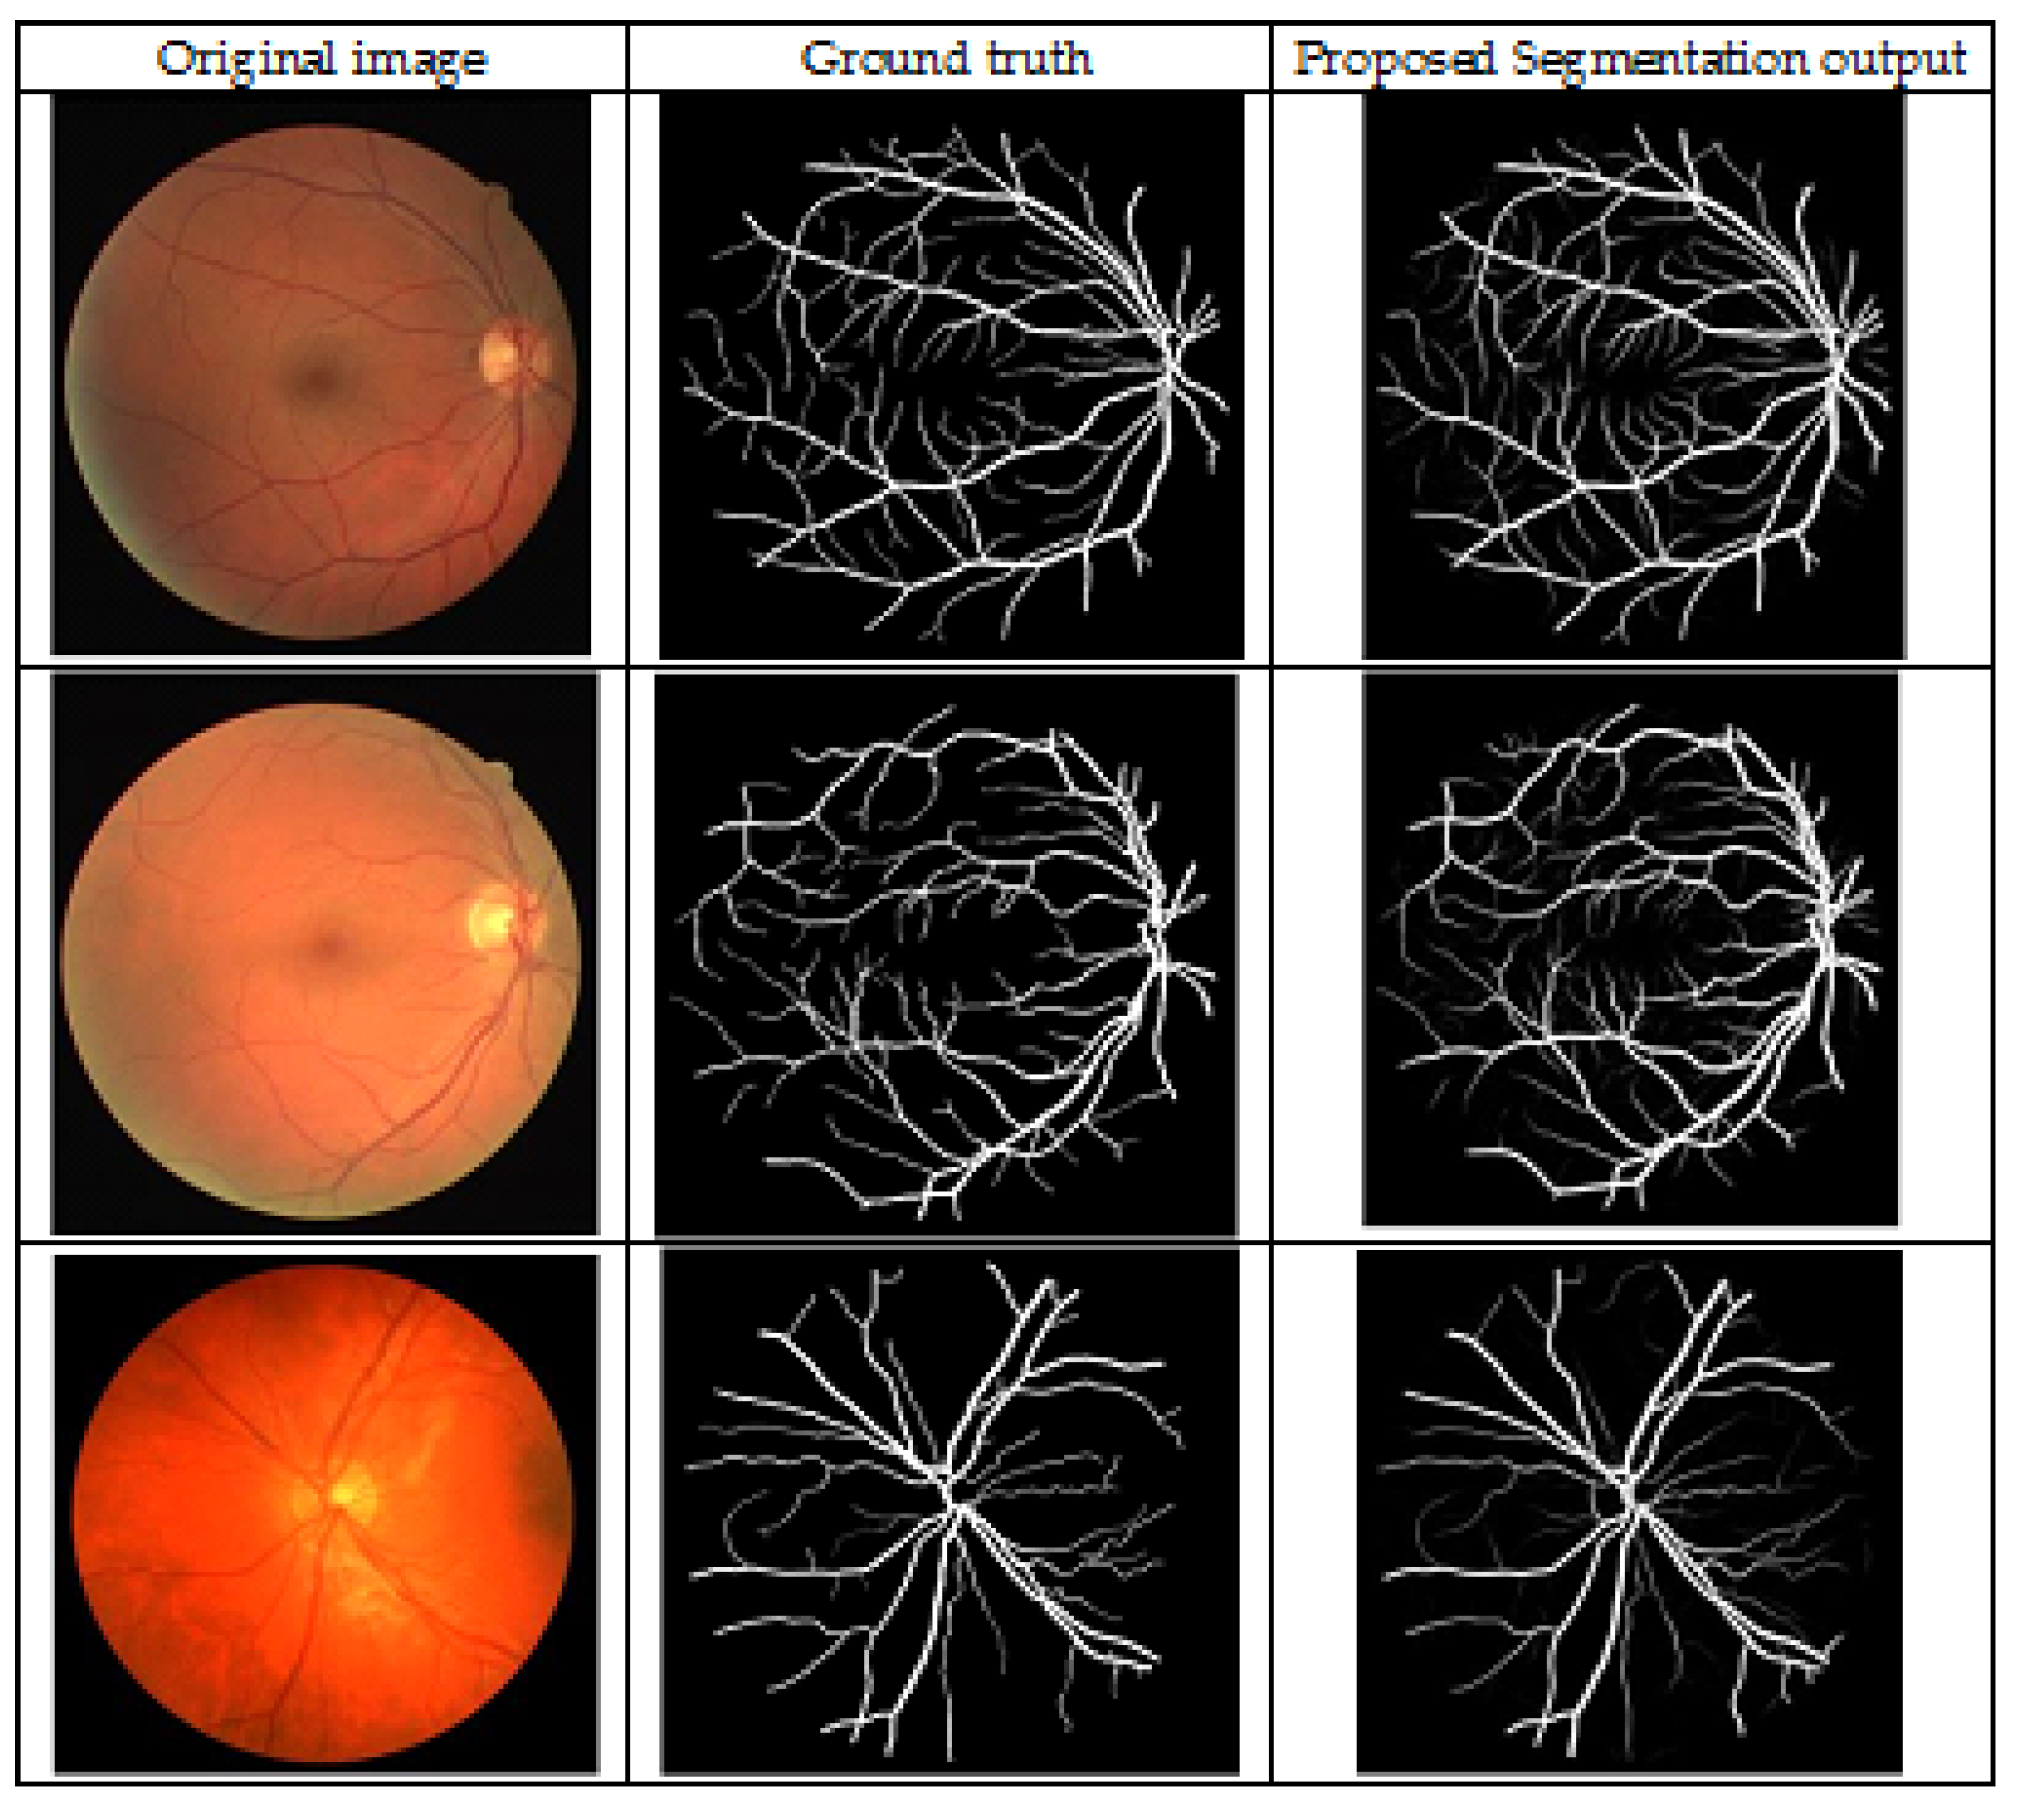
Figure 3 shows the sample input images, ground truth, and segmented output images.

3.3. Classification Using Deep Learning Network

In a convolutional neural network (CNNs), each processing unit features numerous weighted inputs and one output, which are combined to perform the convolution of the input signals with weights and convert result to a type of nonlinearity. Pixel in the input image corresponds to a specific location in the rectangular layers (grids) where the units are grouped. CNNs are ideally suited for visual information processing because of their spatial arrangement of units, as well as their local connectivity of hidden units.
(1)
Local Connectivity: For example, the first layer of units receives data solely from the pixels in their receptive field (RF), which is a narrow rectangle of picture pixels (for the subsequent layers). Units in a layer are normally spaced apart by a stride. The layer’s dimensions are determined by the combined effects of image size, RF size, and stride. Because the image is 5 × 5 monochromatic (a single-channel image), just 9 units are needed to cover the entire area of the image with a layer of 3 × 3 units with one-pixel strides. Smaller layers result from greater strides and larger RFs. Comparing fully-connected traditional networks to those with local connectivity, the number of weights is drastically reduced. The spatial nature of visual information is also consistent, and several elements of natural visual systems are mimicked by this method [27].
(2)
Parameter Sharing: In which weights are shared across units in the same tier. It is possible to create a feature map when the units in a given layer all have the same vector of weights, but each calculates a separate local feature from the image. As a result, the derived features are equivariant, significantly reducing the number of parameters. For example, regardless of the number of units, a layer of units with three three RFs coupled to single-channel image requires just 10 parameters.
(3)
Pooling: Convolution is not the only way to combine the outputs of many units, but it is the most common one. Most commonly, max-pooling aggregates data so that each aggregating unit can return its RF’s full potential. Translational invariance is provided through pooling, which degrades resolution in relation to the prior layer.
(4)
Slide RFs across an input image by the number of pixels defined in stride makes subsequent layers to be smaller, therefore the final grid sent into the fully-connected is frequently considerably smaller than the initial image. It is common to see multiple feature maps running in tandem, each extracting a different feature. Several dozens of feature maps may be required for large networks [28]. If an image has more than one channel, such as RGB, then distinct feature maps are used to connect the various channels of information. It is possible to mix data from various maps in the previous layer in the succeeding layers. If a unit has numerous RFs with different weight vectors, the composed constitute the excitation of that unit.

3.4. Network Training

An example (picture) is propagated across a network and its weights (signed random values) are modified in an iterative manner. Batches are used to break up the presentation of all training instances into smaller units, which are called epochs (256 image patches in our approach). When a batch is finished, the back-propagated errors made by specific units are tallied and converted into weight updates. There are a variety of training methods in DL, and we use the error backpropagation algorithm with dropout as an extension [29]. Dropout is a somewhat new and less popular algorithm, so we’ll go through it in the following paragraphs. At least half of the network units are randomly selected and temporarily “switched off” during training with a dropout. For example, when an example is shown, those units do not propagate signals (their out-puts are constrained to zero) or participate in the error backpropagation process. Each batch’s m is drawn from a new collection of disabled units, resulting in a different network structure. Using this technique, a large network of units can be reduced to a smaller subnetwork. For the training process to succeed with each ’handicapped’ sub-network, this presents an extra challenge. Networks need several alternative data flows to enable decision-making in specific cases in order to achieve this goal. Increased generalizability can be achieved by making it more robust.

4. Results and Discussion

4.1. Dataset Description

The benchmark MESSIDOR dataset, as the first dataset, is used to identify DR [30]. About 1200 colour fundus photos with suitable annotations are included herein. There are four types of photos in this dataset. The images are graded based on the presence or absence of microaneurysms and haemorrhages. The healthy retina can be seen in a picture that does not show any signs of damage. Stage 1 is depicted in the figure with some micro-aneurysms. Haemorrhages and small-calibre blood vessels are classified as stage 2, whereas larger-calibre blood vessels, such as those found in the brain, are classified as stage 3. A second dataset, the Indian Diabetic Retinopathy Image Dataset (IDRiD), as a second dataset, was also employed in this study [31]. At a 50-degree FOV, this freely available dataset contains 516 fundus images labelled with five DR phases. A 10-fold cross-validation technique is used for experimentation.

4.2. Segmentation Analysis

In this section, the validation for proposed segmentation is discussed along with the evaluation metrics, which is described as follows:

4.2.1. Evaluation Metrics

An F1 score, accuracy, sensitivity, and specificity, as well as an area under the ROC curve (AUC) are used to measure performance (AUC). The best model is one in which all of these indicators are equal to 1. A variety of measures are calculated in this manner:
A c c u r a c y = T P + T N T P + T N + F P + F N
S e n s i t i v i t y = T P T P + F N
S p e c i f i c i t y = T N T N + F P
P r e c i s i o n = T P T P + F P
R e c a l l = T P T P + F N
F 1 = 2 × P r e c i s i o n × R e c a l l P r e c i s i o n + R e c a l l
where TP is the blood vessel pixel that has been accurately identified. TN is the pixel in the background that has been accurately identified. FP is the mislabelled pixel in the background. An incorrectly identified blood vessel pixel goes by the designation of FN.

4.2.2. Discussion

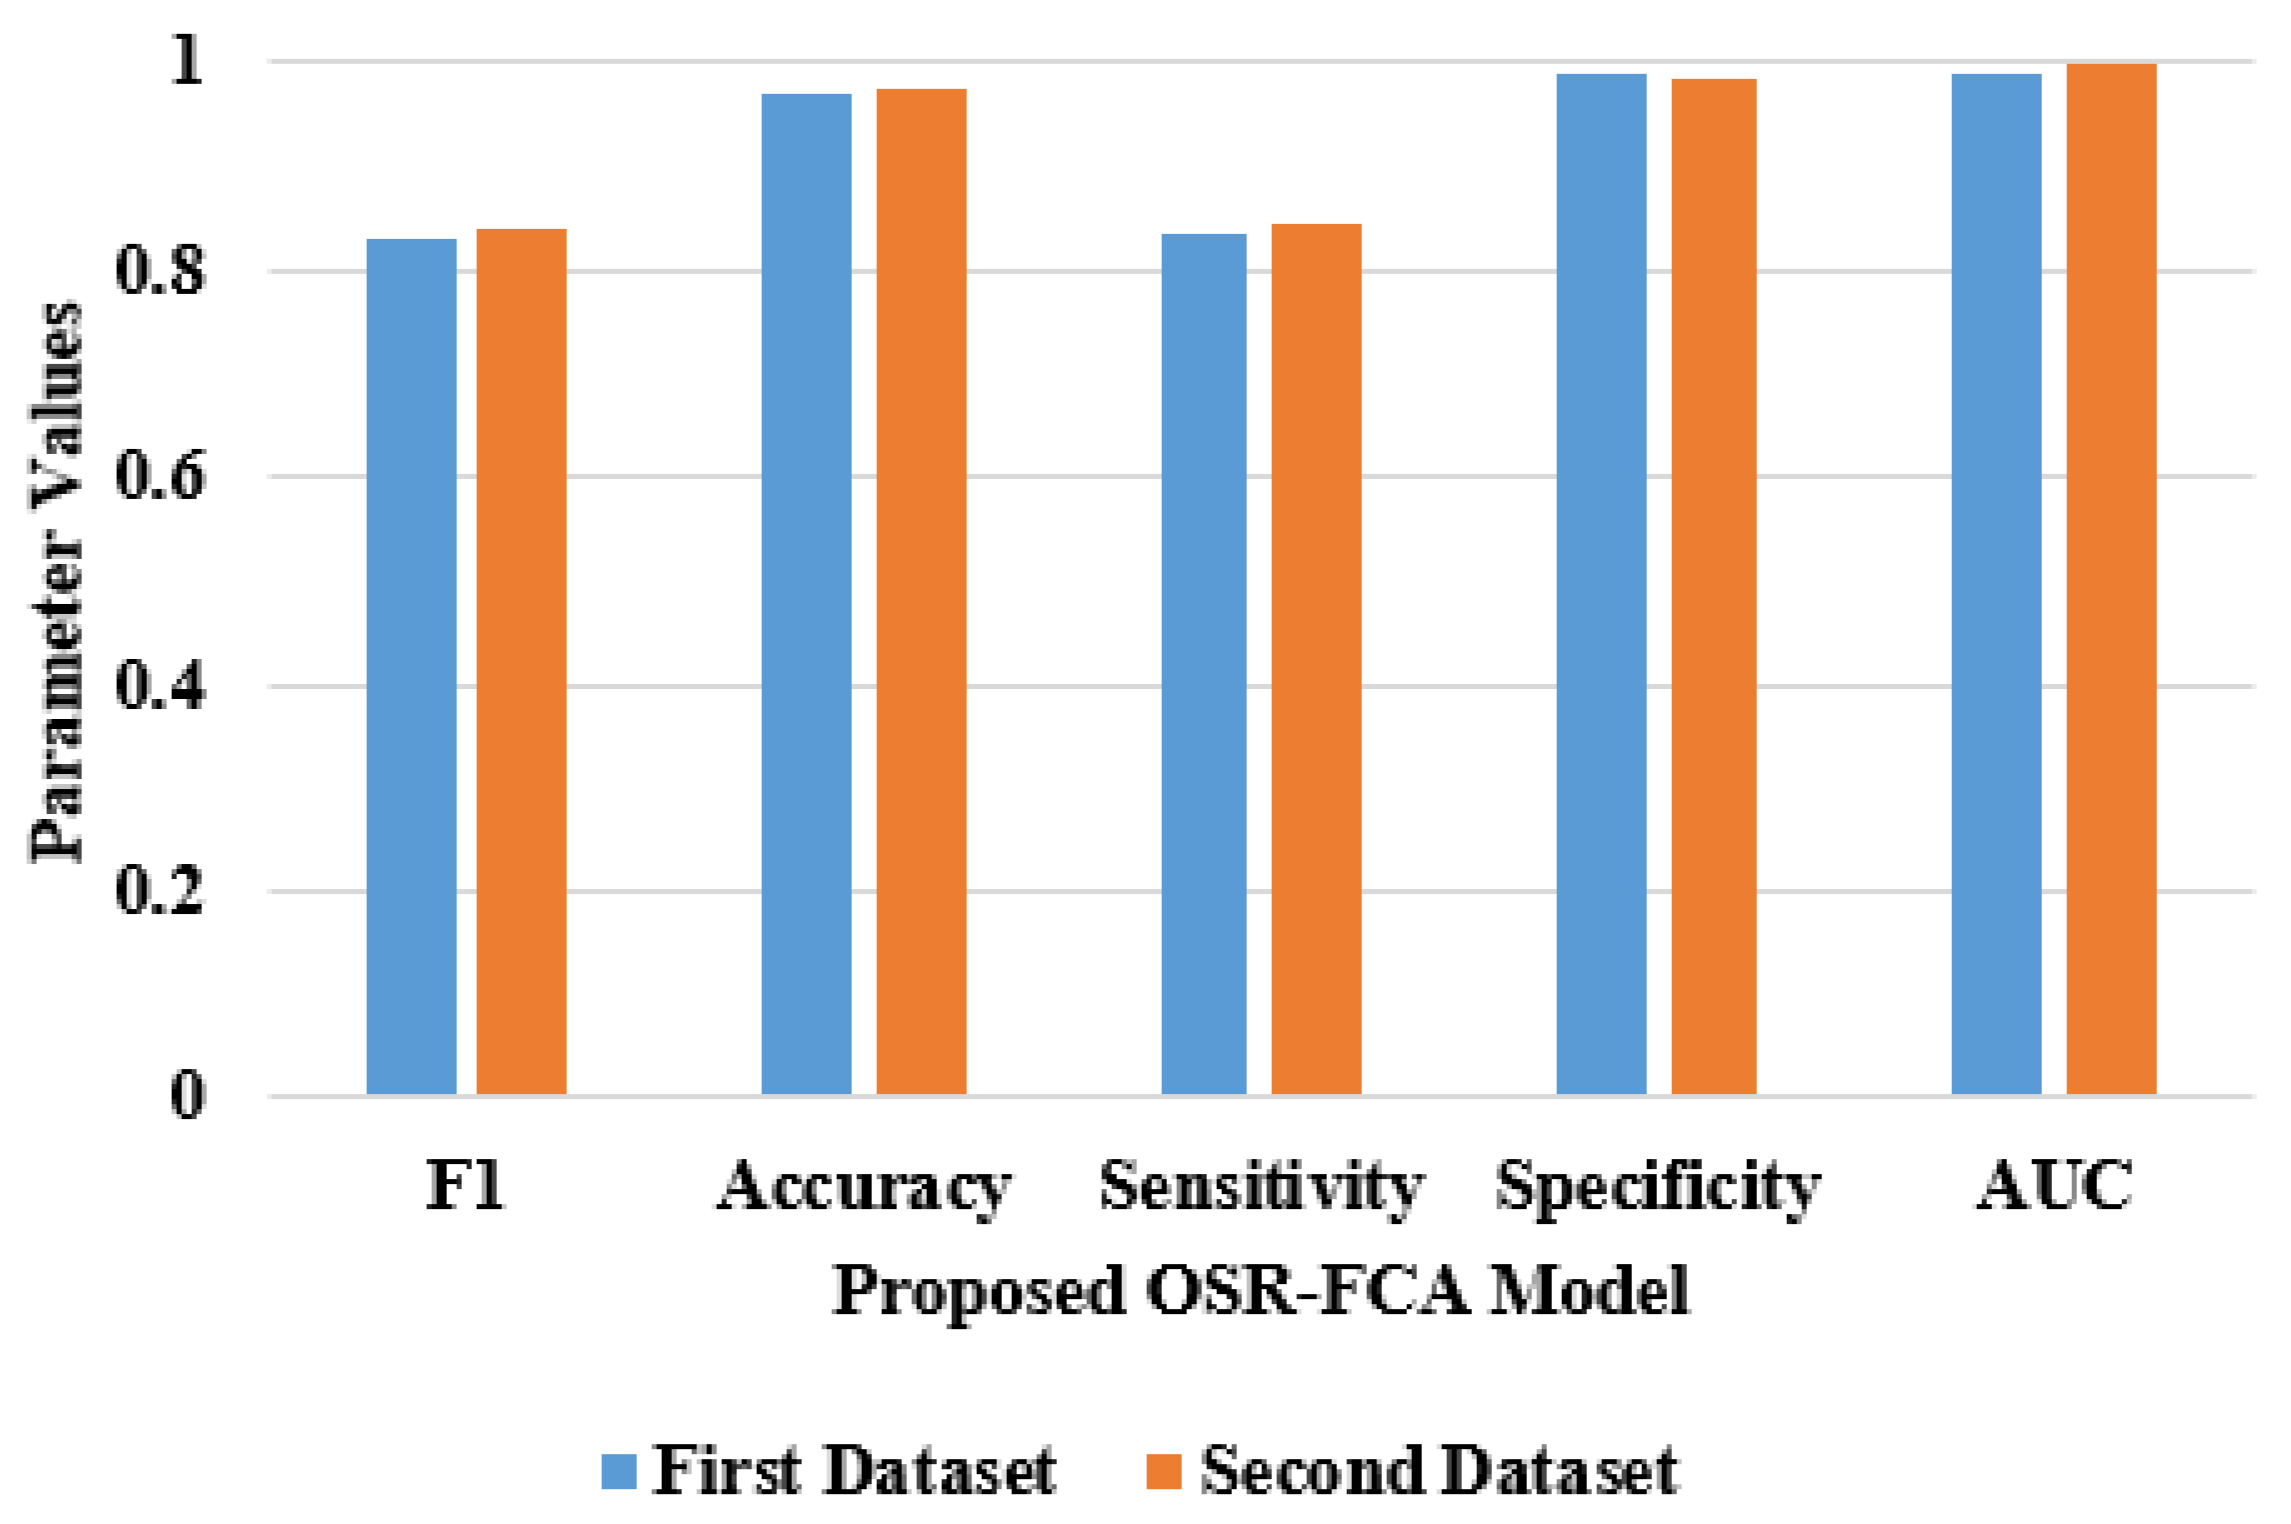
There are two datasets are used for experimentation. Initially, Table 1 presents the validated analysis of projected perfect in terms of various metrics on MESSIDOR dataset.
In the analysis of accuracy, the existing FCM such as multi-scale, multi-path, and multi-output fusion achieved nearly 97% where proposed segmentation model achieved 97.16%. However, the existing FCM techniques achieved low sensitivity, i.e., 81% to 82% and proposed model achieved 83.70% of sensitivity. The reason for better performance is that outliers are effectively removed by using the proposed model, where existing FCM are unable to handle the outliers due to non-sparsity fuzzy memberships. By using this process, the OSR-FCA model achieved 98.70% of specificity, 83.21% of F-Measure, and 98.80% of AUC on first dataset. Table 2 shows the comparative analysis on second dataset called IDRiD dataset.
The existing FCM such as basic model, multi-scale, and multi-path achieved 97% of accuracy, multipath, multi-scale, and multi-output fusion FCM achieved 96% of accuracy and finally the proposed model achieved 97.26% of accuracy. In the analysis of AUC, all the existing FCM techniques achieved 98%, where the proposed model achieved 99.90% of AUC. The specificity of proposed model is 98.52%, sensitivity is 84.28%, and F1-measure of OSR-FCA model is 84.20% on second dataset. Figure 4 presents the graphical representation of proposed model in terms of various metrics on two publicly available dataset.

4.3. Classification Analysis

Performance Measure

An accurate, sensitive, precise, and high-kappa-index performance metric is one that measures results and outcomes on a regular basis in order to create trustworthy information on the effectiveness of an approach. Equations (17)–(20) provide the kappa index and the general formula for detecting retinal blood.
S e n s i t i v i t y = T P T P + F N × 100
S p e c i f i c i t y = T N T N + F P × 100
A c c u r a c y = T P + T N T P + T N + F P + F N × 100
K a p p a I n d e x = A c c u r a c y A c c u r a c y T 1 A c c u r a c y T
False positive (FP), true negative (TN), true positive (TP), and false negative (FN) are all denoted here. According to Table 3 and Table 4, a proposed classifier’s performance on two datasets is compared to existing methods in terms of metrics. Figure 5 provides the graphical representation of proposed model on first dataset.
In the first dataset, the proposed CNN model achieved 97.26% of accuracy, the auto-encoder, and LSTM models achieved nearly 91% to 95% of accuracy, but the RNN achieved very low performance, i.e., 75.03% of accuracy. The reason for the poor performance of RNN is that it is very slow and has complex training procedures. Moreover, it is difficult to process the longer DR sequences. In the analysis of the Kappa index, all existing techniques such as RNN, LSTM, and auto-encoder achieved nearly 81% to 88%, where the proposed CNN model achieved 90.07%. The auto-encoder achieved 92% of sensitivity and specificity, the RNN achieved nearly 78% of sensitivity and specificity, and the LSTM model achieved nearly 87% of sensitivity and specificity. However, the proposed CNN model achieved 98.04% sensitivity and 98.17% specificity. Figure 6 presents the graphical representation of the proposed CNN model on a second dataset called IDRiD in terms of various metrics.
In the second dataset called IDRiD, the RNN achieved 87.43% of sensitivity, 92.02% of accuracy, 78.14% of specificity, and 80.14% of Kappa index, where LSTM achieved 89.97% of sensitivity, 92.39% of accuracy, 85.90% of specificity, and 81.08% of Kappa index. The reason for the low performance of LSTM is that it requires more memory to train all the features for classification. The existing technique, called auto-encoder, achieved 95.16% of sensitivity, 94.18% of accuracy, 92.17% of specificity, and 86.44% of Kappa index. However, the proposed CNN model achieved 98.62% of sensitivity, 98.70% of accuracy, 98.83% of specificity, and 90.47% of Kappa index. The reason for this better performance is that outliers are removed during segmentation itself, which can cause overfitting to the classifier, and this is avoided in the proposed model. From all this experimental analyses, it is clearly proven that the proposed segmentation model and classifier achieved better performance than all existing models on two datasets.

5. Conclusions

This research study employs a series of preprocessing, segmentation, and classifying stages. The first step of the study is to correct and use all of the undesired noise, size variants, and colour variants in the process. The novelty of the work lies in the segmentation process, where a novel skimpy fuzzy c-means algorithm is projected in this research work. Current fuzzy clustering image segmentation techniques have a fundamental shortcoming, and the proposed OSR-FCA has been used to address this issue. With regard to the OSR-objective FCA’s function, it includes a regularisation term that helps it achieve scanty fuzzy clustering because it takes into account both the sparsity of membership and how fuzzy it is. Furthermore, the research model was able to efficiently merge small regions, which resulted in outstanding image segmentation. The experimental consequences proved that the projected OSR-FCA technique achieved 97.16% of accuracy on the first dataset and 97.26% of accuracy on the second dataset, where the proposed CNN model achieved 97.26% of accuracy on the first dataset and 98.70% of accuracy on the second dataset, but the existing models achieved nearly 92% to 95% of accuracy on both datasets. The proposed results will be improved in future work by developing a new model for DR image classification.

Author Contributions

Conceptualization, S.H. and V.D.A.K.; methodology, S.H. and V.D.A.K.; software, S.H.; validation, S.H. and V.D.A.K.; formal analysis, S.H. and V.D.A.K.; investigation, S.H.; resources, S.H.; data curation, S.H.; writing—original draft preparation, S.H.; writing—review and editing, S.H.; visualization, S.H.; supervision, S.H. and V.D.A.K. All authors have read and agreed to the published version of the manuscript.

Funding

This research received no external funding.

Data Availability Statement

This study used the fundus images from the MESSIDOR and IDRiD datasets.

Conflicts of Interest

The authors declare no conflict of interest.

References

  1. Aswini, S.; Suresh, A.; Priya, S.; Santhosh Krishna, B.V. Retinal vessel segmentation using morphological top hat approach on diabetic retinopathy images. In Proceedings of the 2018 Fourth International Conference on Advances in Electrical, Electronics, Information, Communication and Bio-Informatics (AEEICB), Chennai, India, 27–28 February 2018. [Google Scholar]
  2. Xue, J.; Yan, S.; Qu, J.; Qi, F.; Qiu, C.; Zhang, H.; Chen, M.; Liu, T.; Li, D.; Liu, X. Deep membrane systems for multitask segmentation in diabetic retinopathy. Knowl. Based Syst. 2019, 183, 104887. [Google Scholar] [CrossRef]
  3. Li, Q.; Fan, S.; Chen, C. An intelligent segmentation and diagnosis method for diabetic retinopathy based on improved U-NET network. J. Med. Syst. 2019, 43, 304. [Google Scholar] [CrossRef] [PubMed]
  4. Jebaseeli, T.J.; Deva Durai, C.A.; Peter, J.D. Retinal blood vessel segmentation from diabetic retinopathy images using tandem PCNN model and deep learning based SVM. Optik 2019, 199, 163328. [Google Scholar] [CrossRef]
  5. Jebaseeli, T.J.; Durai, C.A.D.; Peter, J.D. Segmentation of retinal blood vessels from ophthalmologic Diabetic Retinopathy images. Comput. Electr. Eng. 2019, 73, 245–258. [Google Scholar] [CrossRef]
  6. Gupta, A.; Chhikara, R. Diabetic retinopathy: Present and past. Procedia Comput. Sci. 2018, 132, 1432–1440. [Google Scholar] [CrossRef]
  7. Furtado, P.; Travassos, C.; Monteiro, R.; Oliveira, S.; Baptista, C.; Carrilho, F. Segmentation of Eye Fundus Images by density clustering in diabetic retinopathy. In Proceedings of the 2017 IEEE EMBS International Conference on Biomedical & Health Informatics (BHI), Orlando, FL, USA, 16–19 February 2017. [Google Scholar]
  8. Aujih, A.B.; Izhar, L.I.; Mériaudeau, F.; Shapiai, M.I. Analysis of retinal vessel segmentation with deep learning and its effect on diabetic retinopathy classification. In Proceedings of the 2018 International Conference on Intelligent and Advanced System (ICIAS), Kuala Lumpur, Malaysia, 13–14 August 2018. [Google Scholar]
  9. Cui, Y.; Zhu, Y.; Wang, J.C.; Lu, Y.; Zeng, R.; Katz, R.; Wu, D.M.; Vavvas, D.G.; Husain, D.; Miller, J.W.; et al. Imaging artifacts and segmentation errors with wide-field swept-source optical coherence tomography angiography in diabetic retinopathy. Transl. Vis. Sci. Technol. 2019, 8, 18. [Google Scholar] [CrossRef] [Green Version]
  10. Mann, K.S.; Kaur, S. Segmentation of retinal blood vessels using artificial neural networks for early detection of diabetic retinopathy. In AIP Conference Proceedings; AIP Publishing LLC: Melville, NY, USA, 2017; Volume 1836, p. 020026. [Google Scholar]
  11. Burewar, S.; Gonde, A.B.; Vipparthi, S.K. Diabetic Retinopathy Detection by Retinal segmentation with Region merging using CNN. In Proceedings of the 2018 IEEE 13th International Conference on Industrial and Information Systems (ICIIS), Rupnagar, India, 1–2 December 2018. [Google Scholar]
  12. Nur, N.; Tjandrasa, H. Exudate segmentation in retinal images of diabetic retinopathy using saliency method based on region. In Journal of Physics: Conference Series; IOP Publishing: Britol, UK, 2018; Volume 1108, p. 012110. [Google Scholar]
  13. Arsalan, M.; Owais, M.; Mahmood, T.; Cho, S.W.; Park, K.R. Aiding the diagnosis of diabetic and hypertensive retinopathy using artificial intelligence-based semantic segmentation. J. Clin. Med. 2019, 8, 1446. [Google Scholar] [CrossRef] [Green Version]
  14. He, Y.; Jiao, W.; Shi, Y.; Lian, J.; Zhao, B.; Zou, W.; Zhu, Y.; Zheng, Y. Segmenting diabetic retinopathy lesions in multispectral images using low-dimensional spatial-spectral matrix representation. IEEE J. Biomed. Health Inform. 2020, 24, 493–502. [Google Scholar] [CrossRef]
  15. Hatamizadeh, A.; Sengupta, D.; Terzopoulos, D. End-to-end trainable deep active contour models for automated image segmentation: Delineating buildings in aerial imagery. In Computer Vision—ECCV 2020; Springer International Publishing: Cham, Switzerland, 2020; pp. 730–746. [Google Scholar]
  16. Jin, Q.; Meng, Z.; Pham, T.D.; Chen, Q.; Wei, L.; Su, R. DUNet: A deformable network for retinal vessel segmentation. Knowl. Based Syst. 2019, 178, 149–162. [Google Scholar] [CrossRef] [Green Version]
  17. Hasan, M.K.; Alam, M.A.; Elahi, M.T.E.; Roy, S.; Martí, R. DRNet: Segmentation and localization of optic disc and Fovea from diabetic retinopathy image. Artif. Intell. Med. 2021, 111, 102001. [Google Scholar] [CrossRef]
  18. Sambyal, N.; Saini, P.; Syal, R.; Gupta, V. Modified U-Net architecture for semantic segmentation of diabetic retinopathy images. Biocybern. Biomed. Eng. 2020, 40, 1094–1109. [Google Scholar] [CrossRef]
  19. Ali, A.; Qadri, S.; Khan Mashwani, W.; Kumam, W.; Kumam, P.; Naeem, S.; Goktas, A.; Jamal, F.; Chesneau, C.; Anam, S.; et al. Machine learning based automated segmentation and hybrid feature analysis for diabetic retinopathy classification using fundus image. Entropy 2020, 22, 567. [Google Scholar] [CrossRef]
  20. Wan, C.; Chen, Y.; Li, H.; Zheng, B.; Chen, N.; Yang, W.; Wang, C.; Li, Y. EAD-net: A novel lesion segmentation method in diabetic retinopathy using neural networks. Dis. Markers 2021, 2021, 6482665. [Google Scholar] [CrossRef] [PubMed]
  21. Kandhasamy, J.P.; Balamurali, S.; Kadry, S.; Ramasamy, L.K. Diagnosis of diabetic retinopathy using multi level set segmentation algorithm with feature extraction using SVM with selective features. Multimed. Tools Appl. 2020, 79, 10581–10596. [Google Scholar] [CrossRef]
  22. Tang, Y.; Pan, Z.; Pedrycz, W.; Ren, F.; Song, X. Viewpoint-based kernel fuzzy clustering with weight information granules. IEEE Trans. Emerg. Top. Comput. Intell. 2022, 1–15. [Google Scholar] [CrossRef]
  23. Zhang, Y.; Bai, X.; Fan, R.; Wang, Z. Deviation-sparse fuzzy C-means with neighbor information constraint. IEEE Trans. Fuzzy Syst. 2019, 27, 185–199. [Google Scholar] [CrossRef]
  24. Guo, L.; Chen, L.; Lu, X.; Chen, C.L.P. Membership affinity lasso for fuzzy clustering. IEEE Trans. Fuzzy Syst. 2020, 28, 294–307. [Google Scholar] [CrossRef]
  25. Mukaidono, S.M.A. Fuzzy C-means as a regularization and maximum entropy approach. In Proceedings of the 7th International Fuzzy Systems Association World Congress (IFSA’97), Prague, Czech Republic, 25–29 June 1997; pp. 86–92. [Google Scholar]
  26. Huang, J.; Nie, F.; Huang, H. A New Simplex Sparse Learning Model to Measure Data Similarity for Clustering. Available online: https://www.ijcai.org/Proceedings/15/Papers/502.pdf (accessed on 20 October 2022).
  27. Fukushima, K. ImageNet Neocognition: A self-organizing neural network model for a mechanism of pattern recognition unaffected by shift in position Biol. Cybernet 1980, 36, 193–202. [Google Scholar]
  28. Krizhevsky, A.; Sutskever, I.; Hinton, G.E. ImageNet classification with deep convolutional neural networks. Commun. ACM 2017, 60, 84–90. [Google Scholar] [CrossRef] [Green Version]
  29. Hinton, G.E.; Srivastava, N.; Krizhevsky, A.; Sutskever, I.; Salakhutdinov, R.R. Improving Neural Networks by Preventing Co-Adaptation of Feature Detectors. arXiv 2012, arXiv:1207.0580. [Google Scholar]
  30. Patry, G.; Gauthier, G.; Bruno, L.A.Y.; Roger, J.; Elie, D.; Foltete, M.; Donjon, A.; Maffre, H. Messidor. 2019. Available online: http://www.adcis.net/en/third-party/messidor/ (accessed on 20 October 2022).
  31. Porwal, P.; Pachade, S.; Kamble, R.; Kokare, M.; Deshmukh, G.; Sahasrabuddhe, V.; Meriaudeau, F. Indian diabetic retinopathy image dataset (IDRiD): A database for diabetic retinopathy screening research. Data 2018, 3, 25. [Google Scholar] [CrossRef]
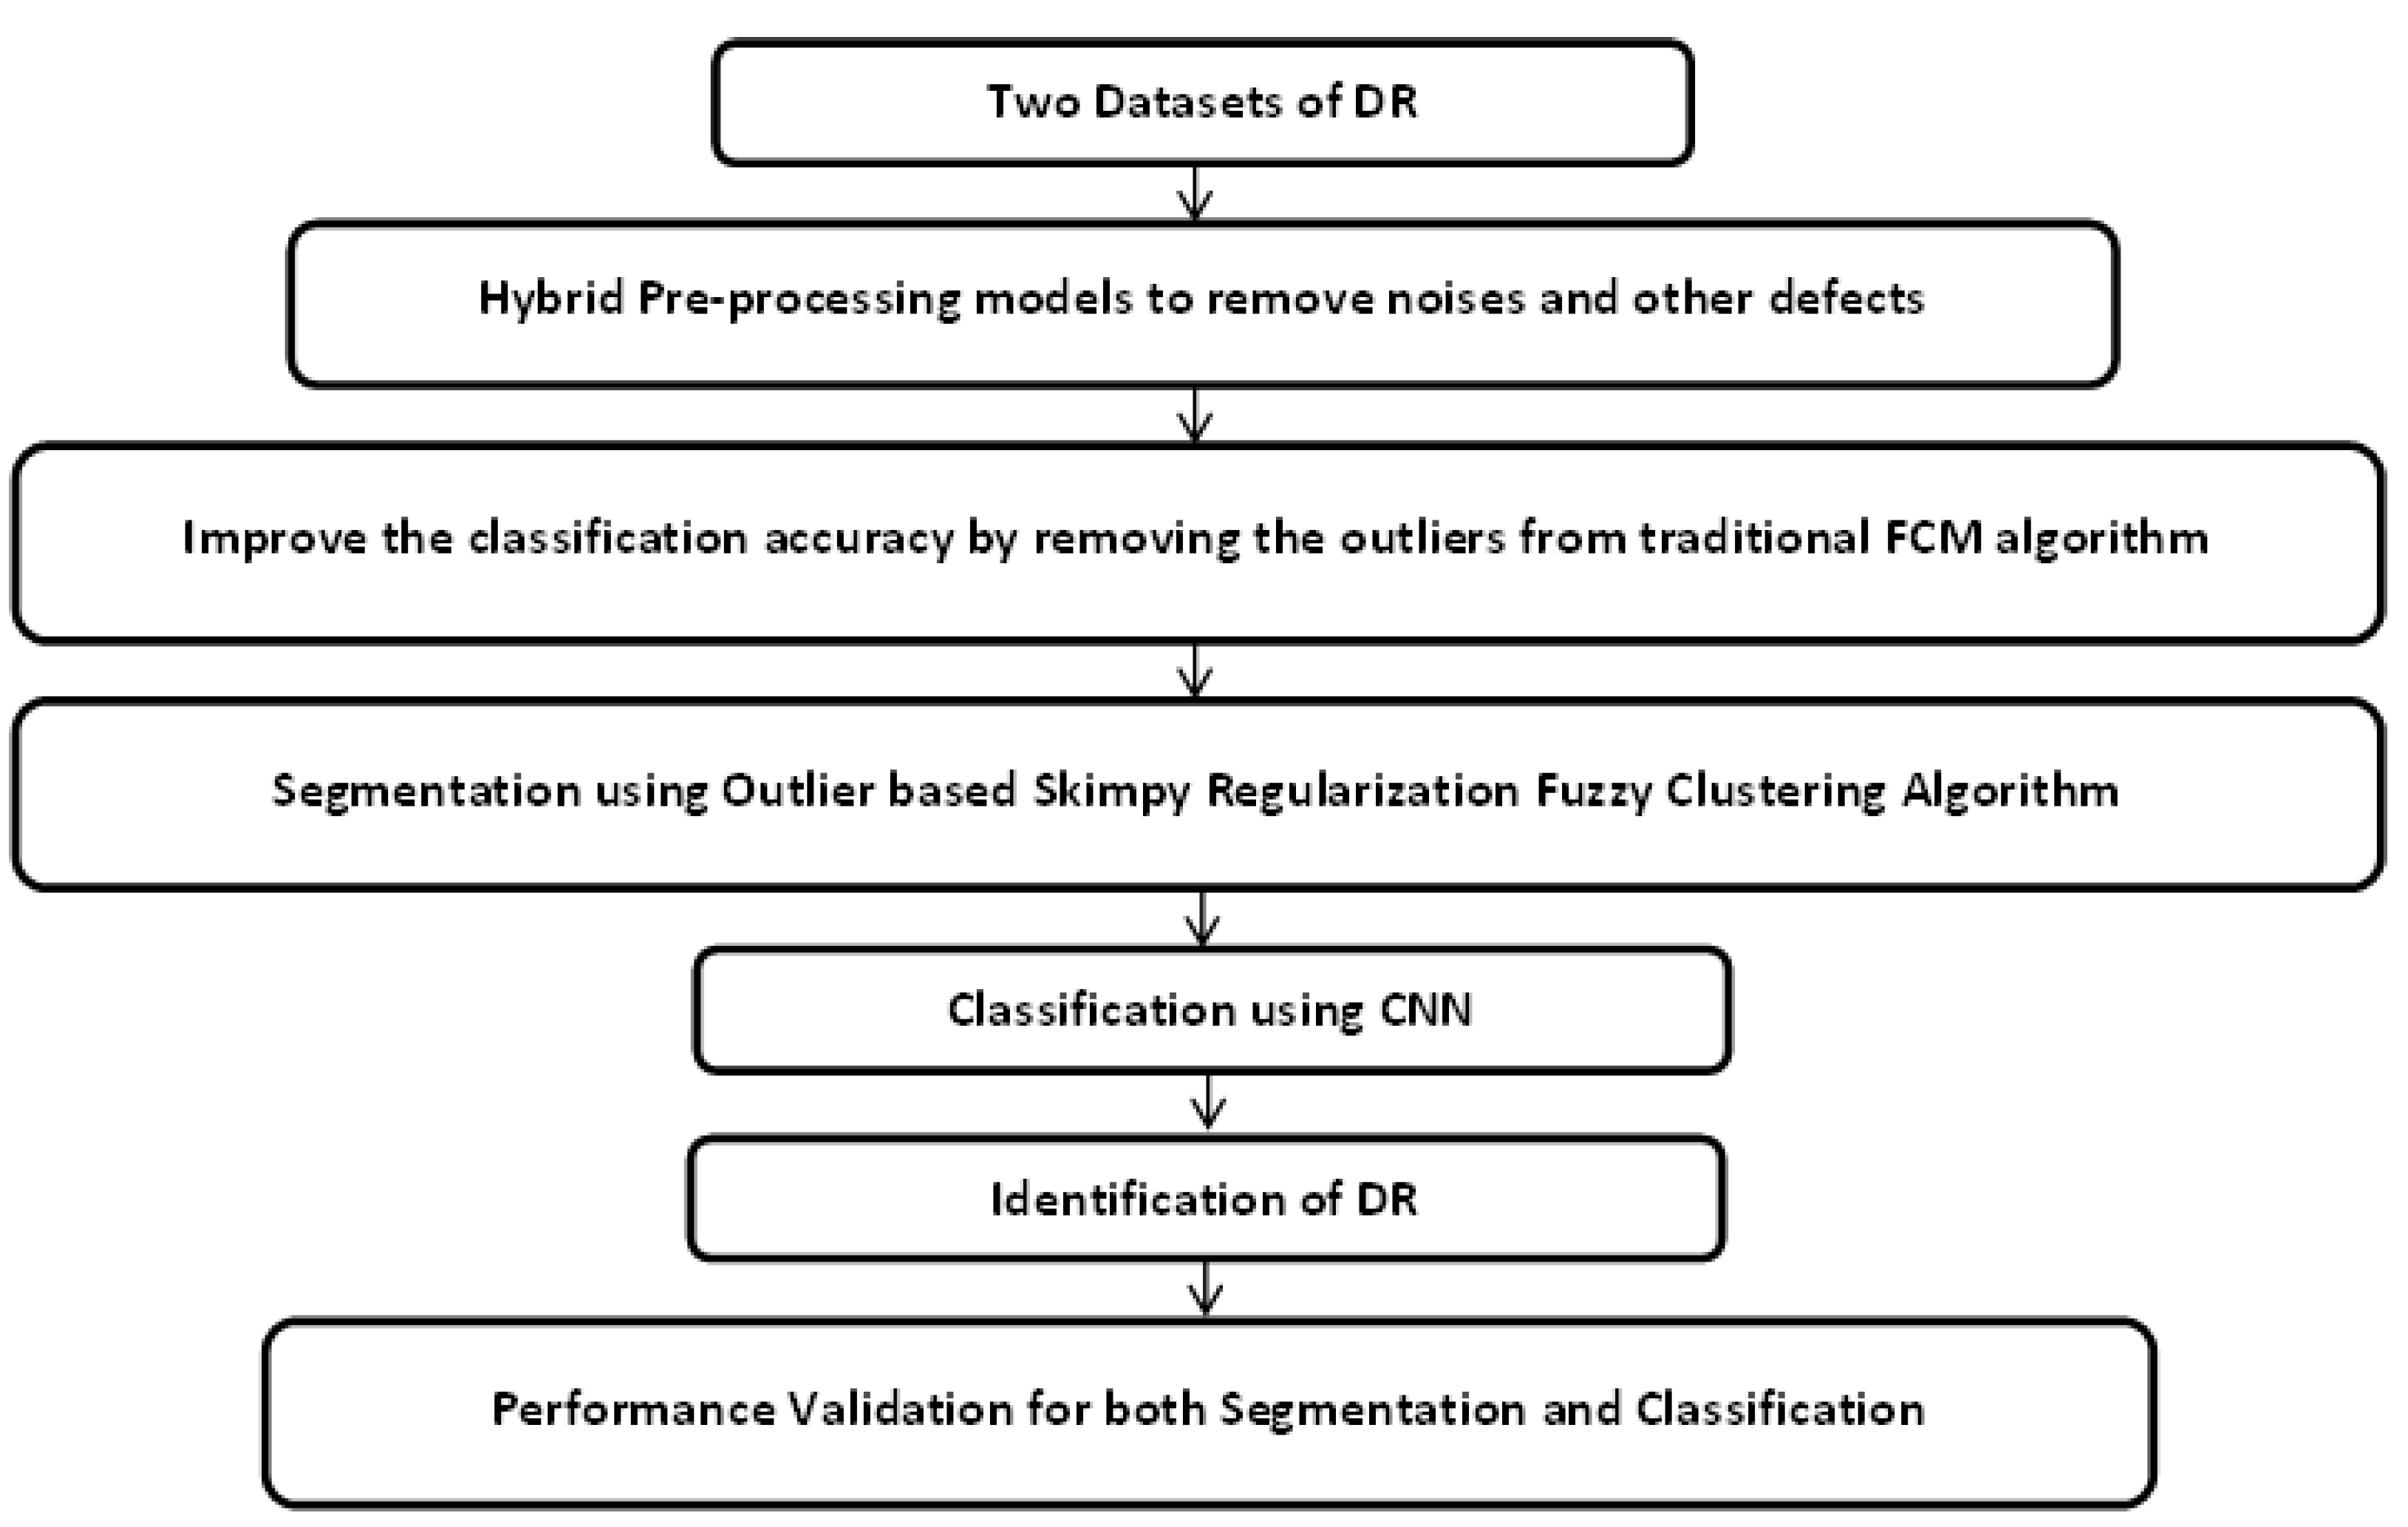
Figure 1. Overall workflow of the proposed segmentation model.
Symmetry 14 02512 g001
Figure 2. Output of the Pre-processed image.
Symmetry 14 02512 g002
Figure 3. Sample output images of the segmentation process.
Symmetry 14 02512 g003
Figure 4. Graphical representation of proposed segmentation model on two datasets.
Symmetry 14 02512 g004
Figure 5. Graphical representation of proposed CNN on first dataset.
Symmetry 14 02512 g005
Figure 6. Graphical Representation of Proposed CNN on second dataset.
Symmetry 14 02512 g006
Table 1. Comparative analysis of proposed segmentation model on MESSIDOR dataset.
Model NameSensitivitySpeficityF1AccuracyAUC
Multi-scale, multi-path FCM0.82590.98410.82950.97030.9870
Multi-scale, multi-output fusion FCM0.80630.98660.82860.97080.9871
Basic FCM0.81960.98480.82860.97030.9870
Multi-scale FCM0.81150.98600.82900.97070.9873
Multi-path FCM0.81180.98580.82870.97060.9871
Multi-output fusion FCM0.81920.98500.82930.97050.9870
Multi-path, multi-output fusion FCM0.83200.98280.83040.97010.9873
Proposed OSR-FCA system0.83700.98700.83210.97160.9880
Table 2. Validation Analysis of Proposed Segmentation model on IDRiD dataset.
Model NameF1AccuracySensitivitySpecificityAUC
Basic FCM0.82880.97030.81980.98480.9870
Multi-scale FCM0.82880.97030.81980.98480.9870
Multi-path FCM0.82990.97020.82980.98370.9873
Multi-output fusion FCM0.82940.97020.82690.98400.9873
Multi-scale, multi-path FCM0.82420.96970.81110.98490.9861
Multi-scale, multi-output fusion FCM0.82550.96890.83920.98140.9866
Multi-path, multi-output fusion FCM0.83210.97060.83250.98380.9880
Proposed OSR-FCA system0.84200.97260.84280.98520.9990
Table 3. Comparative analysis of proposed classifier with existing techniques on MESSIDOR dataset.
MethodologiesSensitivityAccuracySpecificityKappa Index
%%%%
RNN79.3375.0378.4587.60
LSTM88.9591.338681.86
Auto-encoder92.7795.1792.2488.45
Proposed CNN98.0497.2698.1790.07
Table 4. Comparative analysis of proposed classifier with existing techniques on IDRiD dataset.
MethodologiesSensitivityAccuracySpecificityKappa Index
%%%%
RNN87.4392.0278.1480.14
LSTM89.9792.3985.9081.08
Auto-encoder95.1694.1892.1786.44
Proposed CNN98.6298.7098.8390.47
Publisher’s Note: MDPI stays neutral with regard to jurisdictional claims in published maps and institutional affiliations.