Article

Co-Saliency Detection of RGBD Image Based on Superpixel and Hypergraph

Department of Computer Science and Engineering, Northwest Normal University, Lanzhou 730070, China
*
Author to whom correspondence should be addressed.
Symmetry 2022, 14(11), 2393; https://doi.org/10.3390/sym14112393
Submission received: 28 September 2022 / Revised: 3 November 2022 / Accepted: 9 November 2022 / Published: 12 November 2022

Abstract

:
For the co-saliency detection algorithm of an RGBD image that may have incomplete detection of common salient regions and unclear boundaries, we proposed an improved co-saliency detection method of RGBD images based on superpixels and hypergraphs. First, we optimized the depth map based on edge consistency, and introduced the optimized depth map into the SLIC algorithm to obtain the better superpixel segmentation results of RGBD images. Second, the color features, optimized depth features and global spatial features of superpixels were extracted to construct a weighted hypergraph model to generate saliency maps. Finally, we constructed a weighted hypergraph model for co-saliency detection based on the relationship of color features, global spatial features, optimized depth features and saliency features among images. In addition, in order to verify the impact of the symmetry of the optimized depth information on the co-saliency detection results, we compared the proposed method with two types of models, which included considering depth information and not considering depth information. The experimental results on Cosal150 and Coseg183 datasets showed that our improved algorithm had the advantages of suppressing the background and detecting the integrity of the common salient region, and outperformed other algorithms on the metrics of P-R curve, F-measure and MAE.

1. Introduction

The visual attention mechanism allows humans to automatically capture the most attractive part of a complex scene. Salient object detection, as a branch of computer vision, aims to enable computers to automatically detect salient objects. It has been widely used in vision applications, such as stereo matching [1], image segmentation [2,3], video detection [4,5] and image quality assessment [6].
In salient object detection methods, superpixel segmentation is generally taken as a part of image preprocessing in order to improve the efficiency of the algorithm. Generally speaking, superpixel segmentation methods can be divided into graph-based methods [7,8] and gradient ascent-based methods [9,10]. Felzenszwalb et al. [7] used the minimum spanning tree method to generate superpixels. However, the shape of the generated superpixels is uncontrollable and the compactness is low. In [8], the feature space constructed by contour features and texture features generates a feature-undirected graph, but this algorithm speed is slow. Thus, the Turbopixels algorithm [9] based on geometric flow is proposed. However, it cannot achieve high-quality segmentation for high resolution images. On the basis of the merits of the Turbopixels algorithm, Achanta et al. [10] proposed the Simple Linear Iterative Clustering (SLIC) algorithm; this algorithm used five-dimensional space for feature extraction, and used a distance metric that incorporated color information and spatial location information to improve the edge fit of the superpixel segmentation. Agoes [11] used only depth information for superpixel segmentation, which solved the problem of inaccurate superpixel segmentation using color information in very dark scenes, and also proved the important role of depth information in superpixel segmentation. Subsequently, Li et al. [12] introduced depth information into the SLIC algorithm (SLIC-D). However, in the above method, for images with a complex background or similar foreground colors to the background, the result of superpixel segmentation does not fit the image edge due to the existence of high-quality depth information in the edge consistency region between the depth map and RGB map. Therefore, we used the edge consistency map to optimize the depth map, and introduced the optimized depth map information into the SLIC algorithm to achieve superpixel segmentation.
In recent years, there have been an increasing number of methods for the saliency detection [13,14] of RGB images. Li et al. [13] proposed a novel hierarchical feature fusion network and used the edge information extracted by the Laplace operator [15] for supervised saliency detection. In addition, many researchers have also introduced graph models into saliency detection methods. The basic idea is to first perform superpixel segmentation on the input image, and then take the segmented superpixel blocks as the nodes of the graph, and the similarity [16] between the superpixel blocks as the edges of the graph; some nodes in the graph are marked according to different prior knowledge, and finally, the saliency of the image is determined through the propagation of the graph model. Common transmission mechanisms include markov, cellular automata [17] and label propagation [18]. Saliency detection methods for simple graph models [19,20] can only connect any two regions in the image, and it is difficult to capture higher-level relationships among multiple regions, which makes saliency detection results inaccurate. To overcome the disadvantages of the simple graph model, the hypergraph model [21,22,23] is proposed and introduced into the saliency detection method. In addition, it is proved that depth information helps to improve the recognition of salient objects [24,25,26,27]. Wang et al. [28] proposed a multi-scale method to evaluate the quality of a depth map, and then combined the quality evaluation results with saliency cues to guide the selective fusion of RGBD images. In this paper, we introduce the optimized depth features to construct a weighted hypergraph model for saliency detection.
The difference between the saliency detection method and the co-saliency detection method is that co-saliency detection is the extraction of the common salient region in multiple images. Two necessary conditions must be met in co-saliency detection: the object is salient in a single image, and the object co-exists in a group of images. Saliency detection is generally a preprocessing step of co-saliency detection, and the co-saliency detection method is more challenging than the saliency detection method. In recent years, many researchers have begun to study more challenging co-saliency detection methods [29,30,31,32,33]. In [29], a co-saliency model for image pairs is proposed. Jiang et al. [30] realized the saliency detection of the deep neural network by using the continuous Markov random field multi-layer model, so that the input image could achieve the saliency result map without supervision.
However, what is described above is for the co-saliency detection of RGB images; ignoring depth information has an important role in improving the recognition of co-salient objects. Fu et al. [34] proposed a cluster-based co-saliency (CBCS) detection method. In [35], a new deep descriptor is obtained by using the depth information, and an iterative co-saliency framework (ICFS) is proposed. Cong et al. [36] proposed a co-saliency detection method based on multi-constraint feature matching and cross label propagation (MCL). Liu et al. [37] proposed a co-saliency method based on sample selection (BSS).
Although the above RGBD co-saliency detection model has achieved certain results, in scenes with complex backgrounds or scenes with similar foreground and background colors, there are problems such as the incomplete extraction of co-saliency regions, and unclear boundaries. Therefore, an improved co-saliency detection algorithm for RGBD images is proposed. Firstly, a fusion depth–quality RGBD image superpixel segmentation is proposed to segment RGBD images into non-overlapping blocks. Secondly, the color features, depth features after optimization and global spatial features of superpixels are extracted to construct a weighted hypergraph model to generate saliency maps. Finally, a novel weighted hypergraph model is constructed according to the color feature, optimized depth feature, global spatial feature and saliency feature relationship among images to generate a co-saliency map. The main contributions are summarized as follows:
(1)
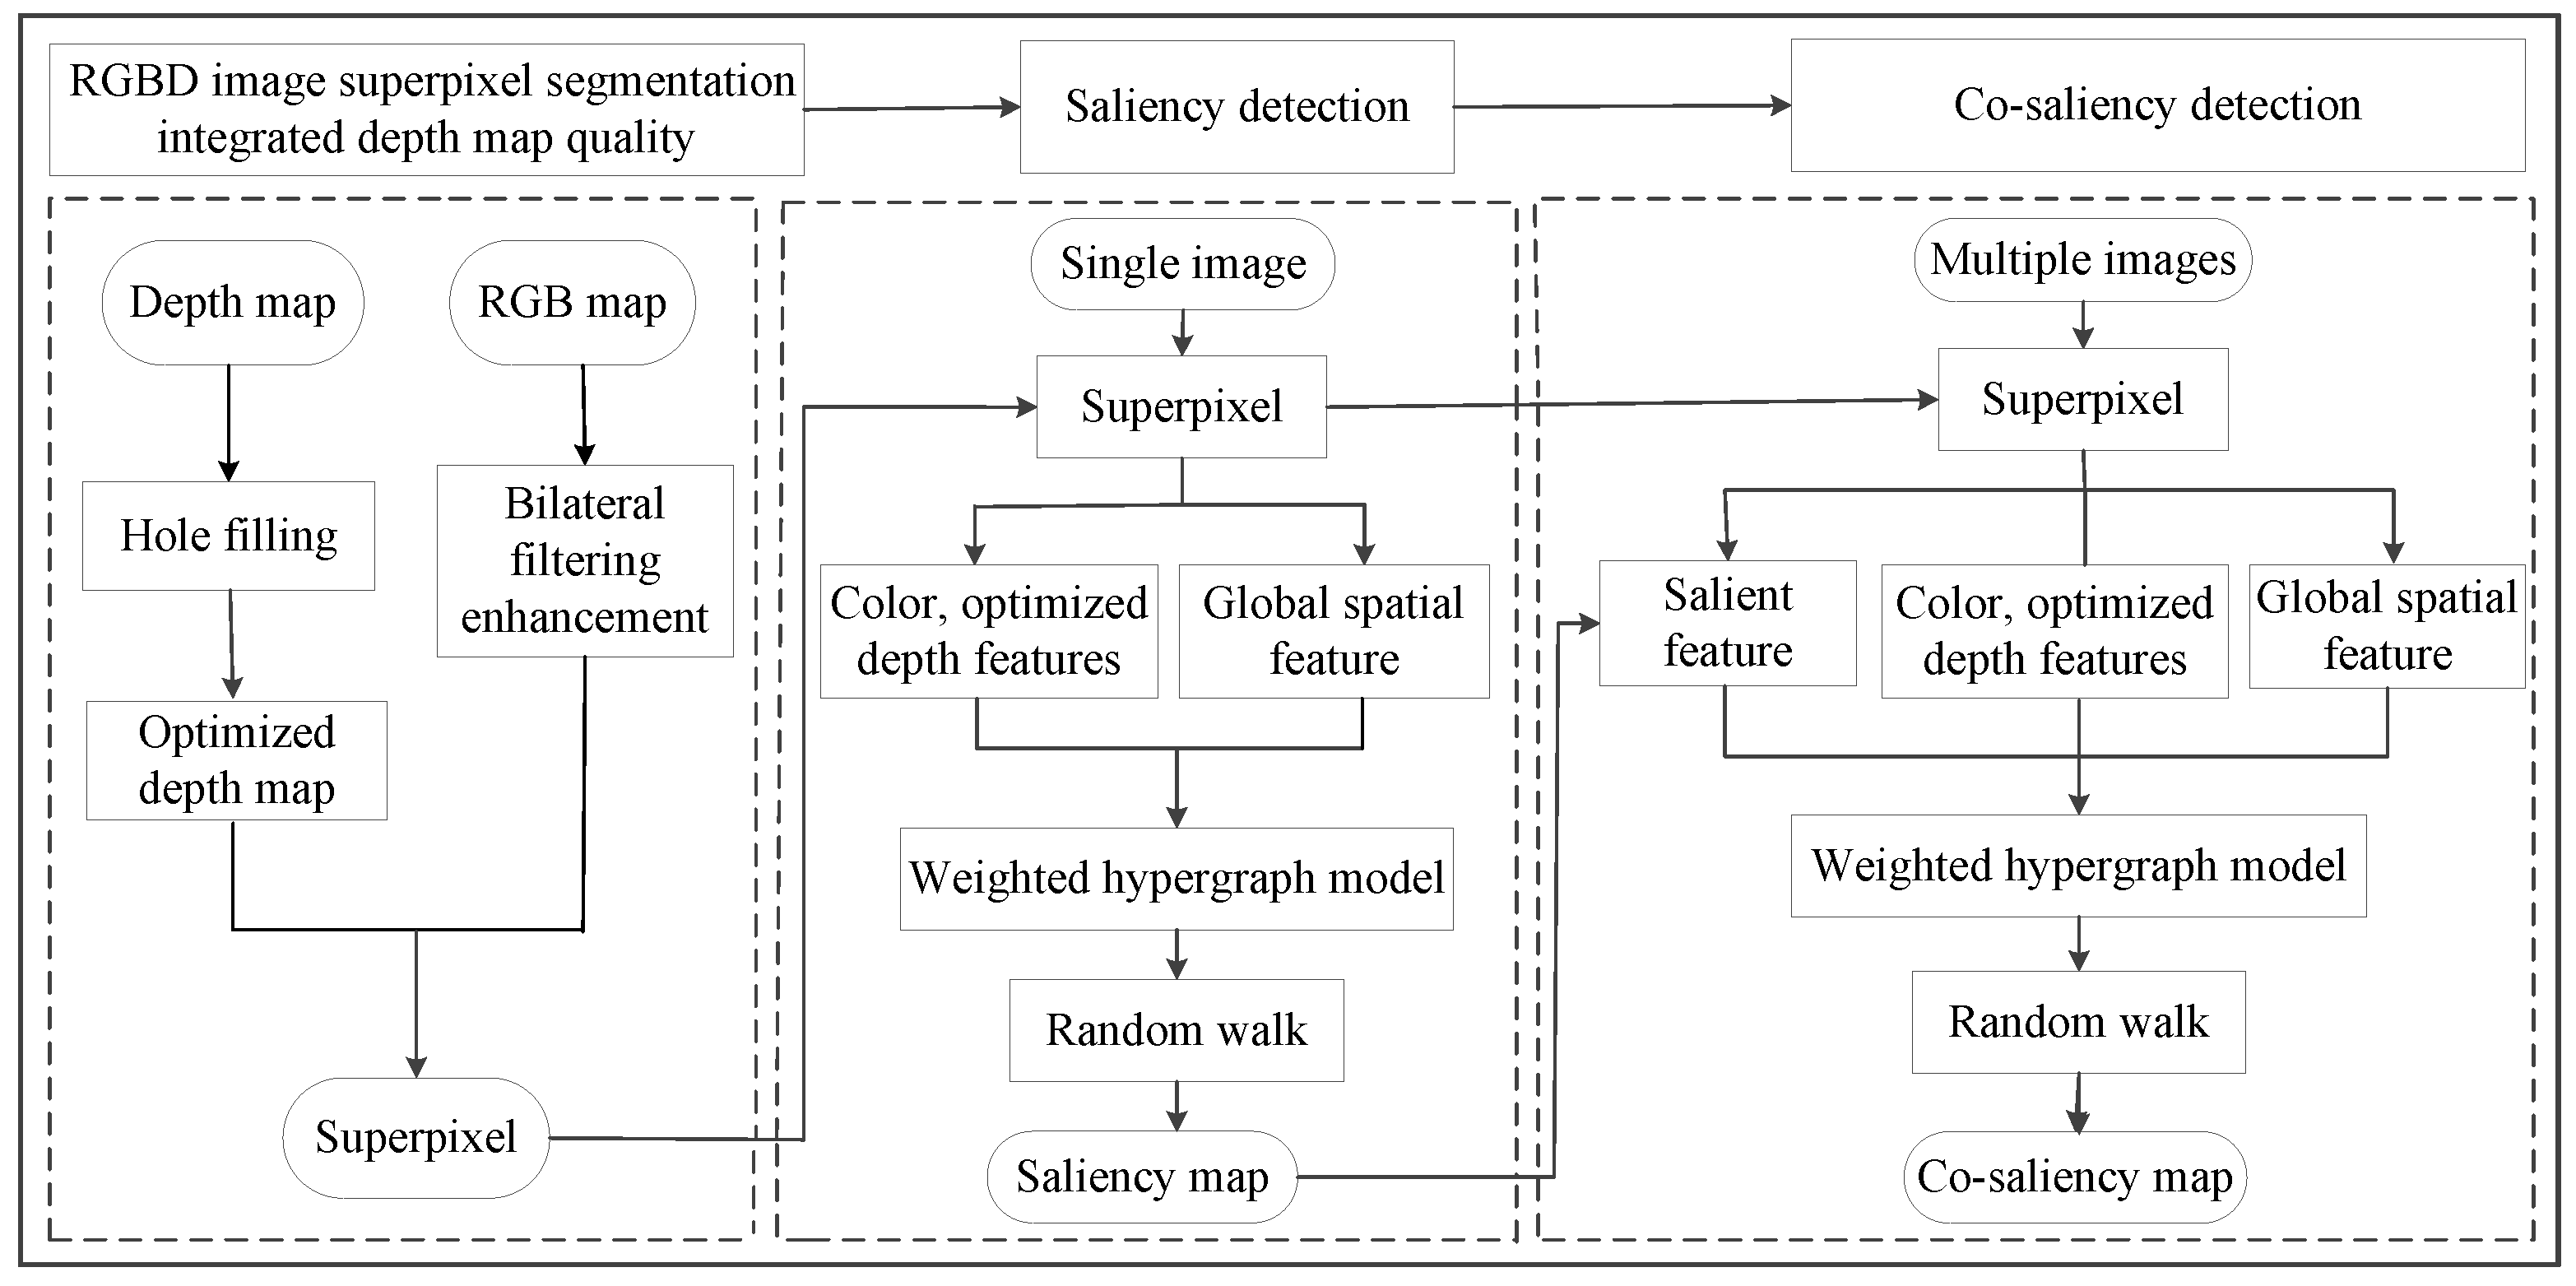
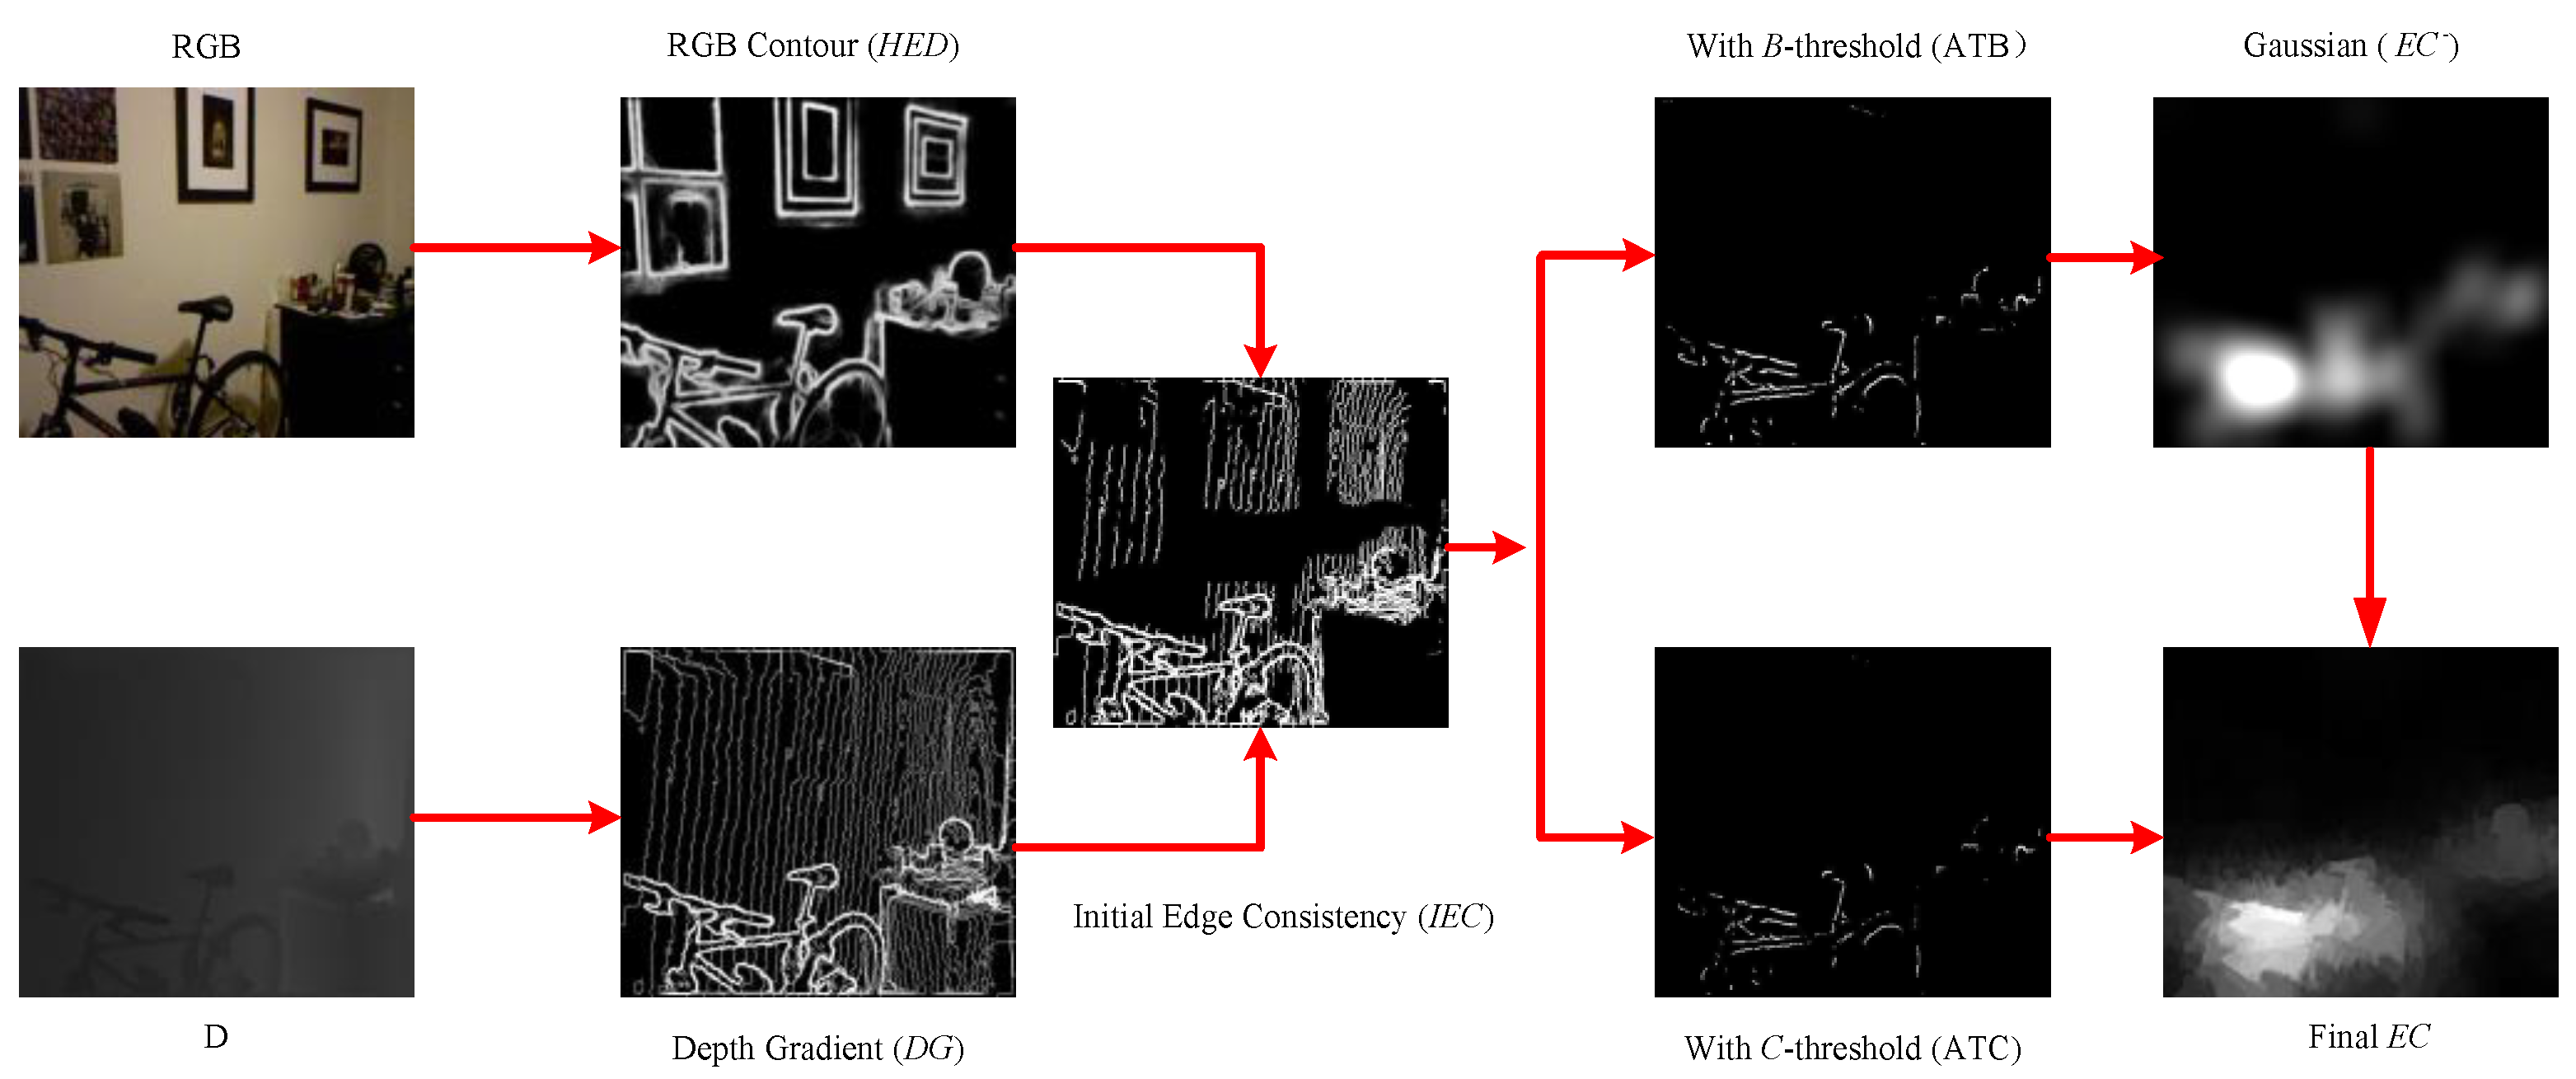
A fusion depth–quality RGBD image superpixel segmentation was proposed. We optimized the depth map based on the edge consistency between the RGB contour map and the depth gradient map, and clustered adjacent pixels to generate superpixels by integrating the color information, pixel position information and optimized depth information.
(2)
A weighted hypergraph model for saliency detection was proposed. The general hypergraph model was established by using a Fuzzy C-Means (FCM) clustering algorithm. The number of categories in the clustering result was the edge of the hypergraph, and the number of superpixels in each category was the vertex of the hypergraph. Then, the weighted hypergraph model was constructed by using global spatial feature similarity, color feature similarity and optimized depth feature similarity.
(3)
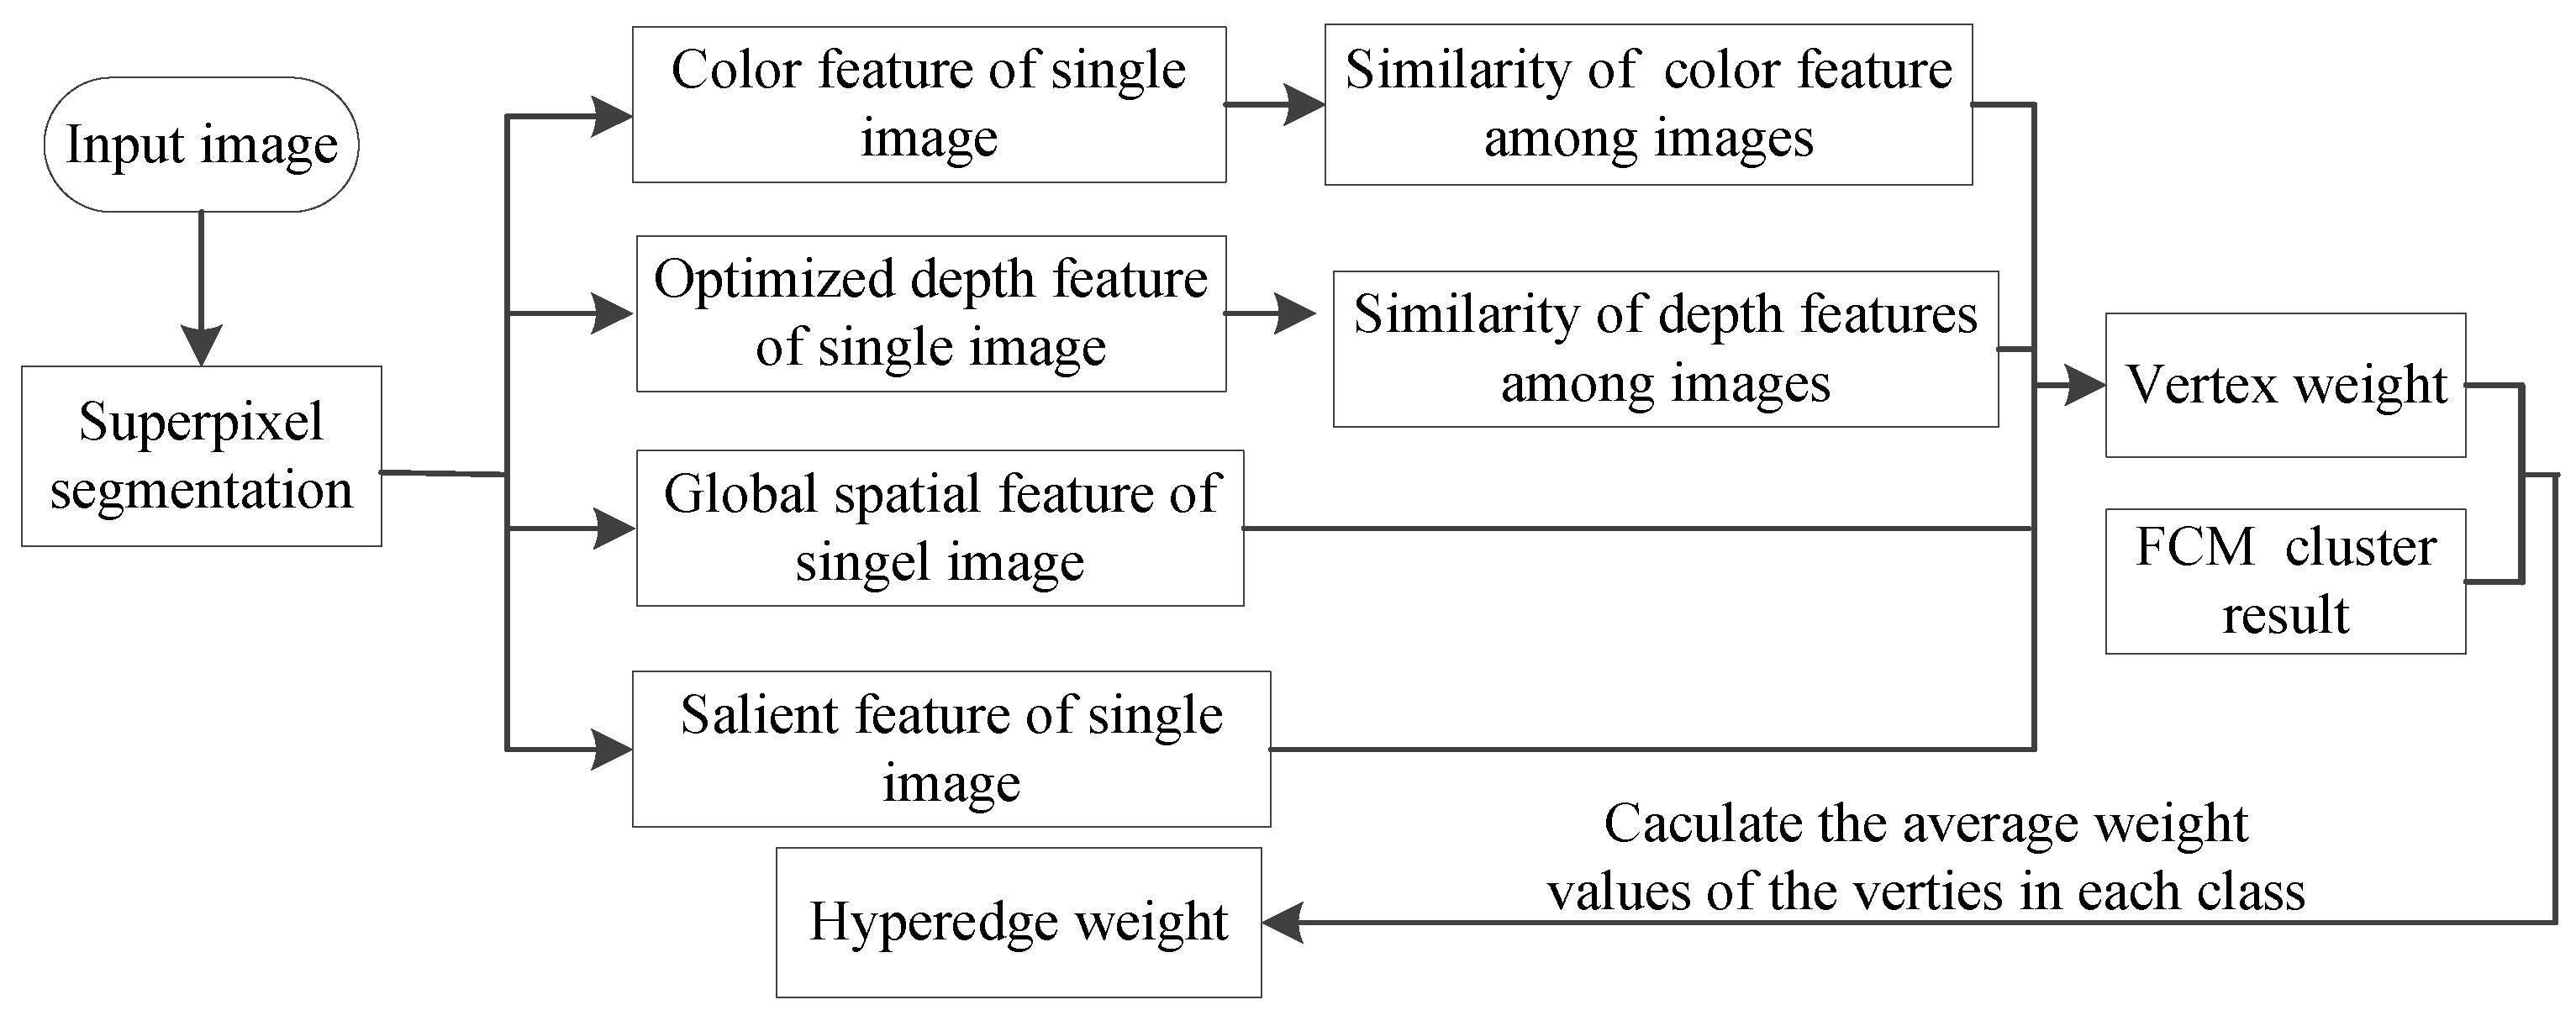
We proposed a novel weighted hypergraph model for co-saliency detection. The general hypergraph model was established by using the FCM clustering algorithm, and then the weighted hypergraph model was constructed by using the relationships of color features, global spatial features, optimized depth features and saliency features among images.

2. Materials and Methods

In this paper, firstly the edge consistency map was used to optimize the depth map, and the adjacent pixels were clustered by integrating Lab color space features, optimized depth features and pixel position features to obtain superpixel blocks. Secondly, the color features, global spatial features and optimized depth features of superpixels were extracted to construct a weighted hypergraph model, and saliency maps were generated by a random walk algorithm on the weighted hypergraph model. Finally, a weighted hypergraph model was constructed based on the relationships of color features, global spatial features, optimized depth features and saliency features among images, and a random walk on the weighted hypergraph model to obtain the co-saliency map. The algorithm flow is shown in Figure 1.

2.1. Fusion Depth–Quality RGBD Image Superpixel Segmentation

Firstly, the RGB map is enhanced by using a bilateral filtering method, and the holes in the depth map are filled by using a joint bilateral filtering method [38]. Then, the depth map is optimized based on the depth quality evaluation method of edge consistency [28]. Finally, the superpixel block is obtained by clustering the color feature, pixel position feature and optimized depth feature of the image.
In our method, the depth quality feature map is divided into two parts for analysis, namely the edge area and the area not close to the edge of the image. At the edge area of the image, the convolutional neural network-based holistically-nested edge detection (HED) [28,39] method is used to generate the RGB contour map. Compared to other methods of generating contour maps, the HED method can suppress the uncorrelated edges inside the object to generate clear contour edges. To generate the initial edge consistency (IEC) map [28] with the obtained RGB contour map (HED) and depth gradient map (DG), the IEC is calculated as follows:
I E C = H E D D G ,
where denotes the Hadamard product operation, and the result of the IEC is shown in Figure 2.
High-quality depth areas often exist where edge consistency value is high; we determine a subgroup of anchored pixels (ATB in Figure 2) by using defined thresholds (Tb). The approximate high quality depth region ( E C ) [28] is determined by these anchor pixels, and the E C is calculated as follows:
E C = G ( p o s ( I E C T b × m e a n ( I E C ) ) ) ,
where G denotes Gaussian operation [40], pos is a function that assigns zero to its negative input and 1 to the remaining positive values, mean returns a matrix of the same size matrix as IEC, with each row containing the average of all the elements in each column, Tb denotes threshold of 20.
To generate the complete D quality map, space-weighted operations [28] are used to determine the regions that are not close to the edges, which include feature similarity measure (exp) and spatial weighting range ( ϕ ) [28]. Among them, the common thread [41] is used to measure the feature similarity. The spatial weighting range (4) is adaptively determined by a subgroup of anchored pixels (ATC in Figure 2), in which these pixels are determined by using a threshold (Tc). Specifically, in order to improve the computational efficiency, we conduct the spatial-weighting over superpixel [10].
E C ( s p j ) s p i ϕ E C ( s p i ) exp ( w | | v ( s p j ) , v ( s p i ) | | 2 ) s p i ϕ exp ( w | | v ( s p j ) , v ( s p i ) | | 2 ) ,
ϕ = s p i : | | p ( s p j ) , p ( s p i ) | | 2 min ( | | s p j , p o s ( I E C T c m e a n ( I E C ) | | ) ,
where s p i denotes the i-th superpixel, s p j denotes the j-th superpixel, Tc denotes threshold of 30, w denotes strength parameter, | | . | | 2 denotes Euclidean distance, v(.) and p(.) represent the average value and center position of superpixels on RGB map.
Generate optimized depth maps based on weighted fusion of the complete edge consistency map with the depth map in Equation (5).
h ( x ) = ( 1 α ) f 0 ( x ) + α f 1 ( x ) ,
where α denotes the weight 0.6, f0 (x) and f1 (x), respectively, represent the depth map and the corresponding edge consistency map, h(x) denotes optimized depth map. The process of optimizing the depth map is shown in Figure 3.
Since pixel depth provides depth information for objects, when processing images with complex backgrounds or similar foreground and background colors, the combination of depth information and color information can obtain relatively compact segmentation regions in the clustering process. Therefore, the optimized depth value of pixels is introduced into the superpixel segmentation in this paper, which increases the traditional SLIC [10] superpixel segmentation algorithm to 6 dimensions. We want to obtain superpixels of size r × r , but if we restrict the search range of seed points to 2 r × 2 r , this can accelerate the convergence of the algorithm. For each searched pixel, the distance between it and the neighboring pixel is calculated. The normalized distance based on color feature, optimized depth feature and spatial location feature is calculated as follows:
D i , k = | | c i c k | | N c 2 + | | d i d k | | N d 2 + | | l i l k | | N l 2 ,
r = N / K ,
where vector c denotes the three-dimensional color feature vector, vector d denotes the optimized depth feature vector, vector l denotes the two-dimensional spatial position coordinates. k denotes the cluster center, i is each pixel in the 2 r × 2 r neighborhood pixel of the cluster center. N c , N d and N l are the distance-normalized constants of the color, depth and space, respectively. N denotes the number of pixels; K is the number of superpixels.
In our study, the number of superpixels is set to 300; we compare the proposed method with two representative methods, which include SLIC [10] and SLIC-D [12]. As in Figure 4, it can be seen from the part of the yellow rectangular frame that the proposed superpixel segmentation method not only suppresses irrelevant edges inside the object, but also improves the object edge fit.

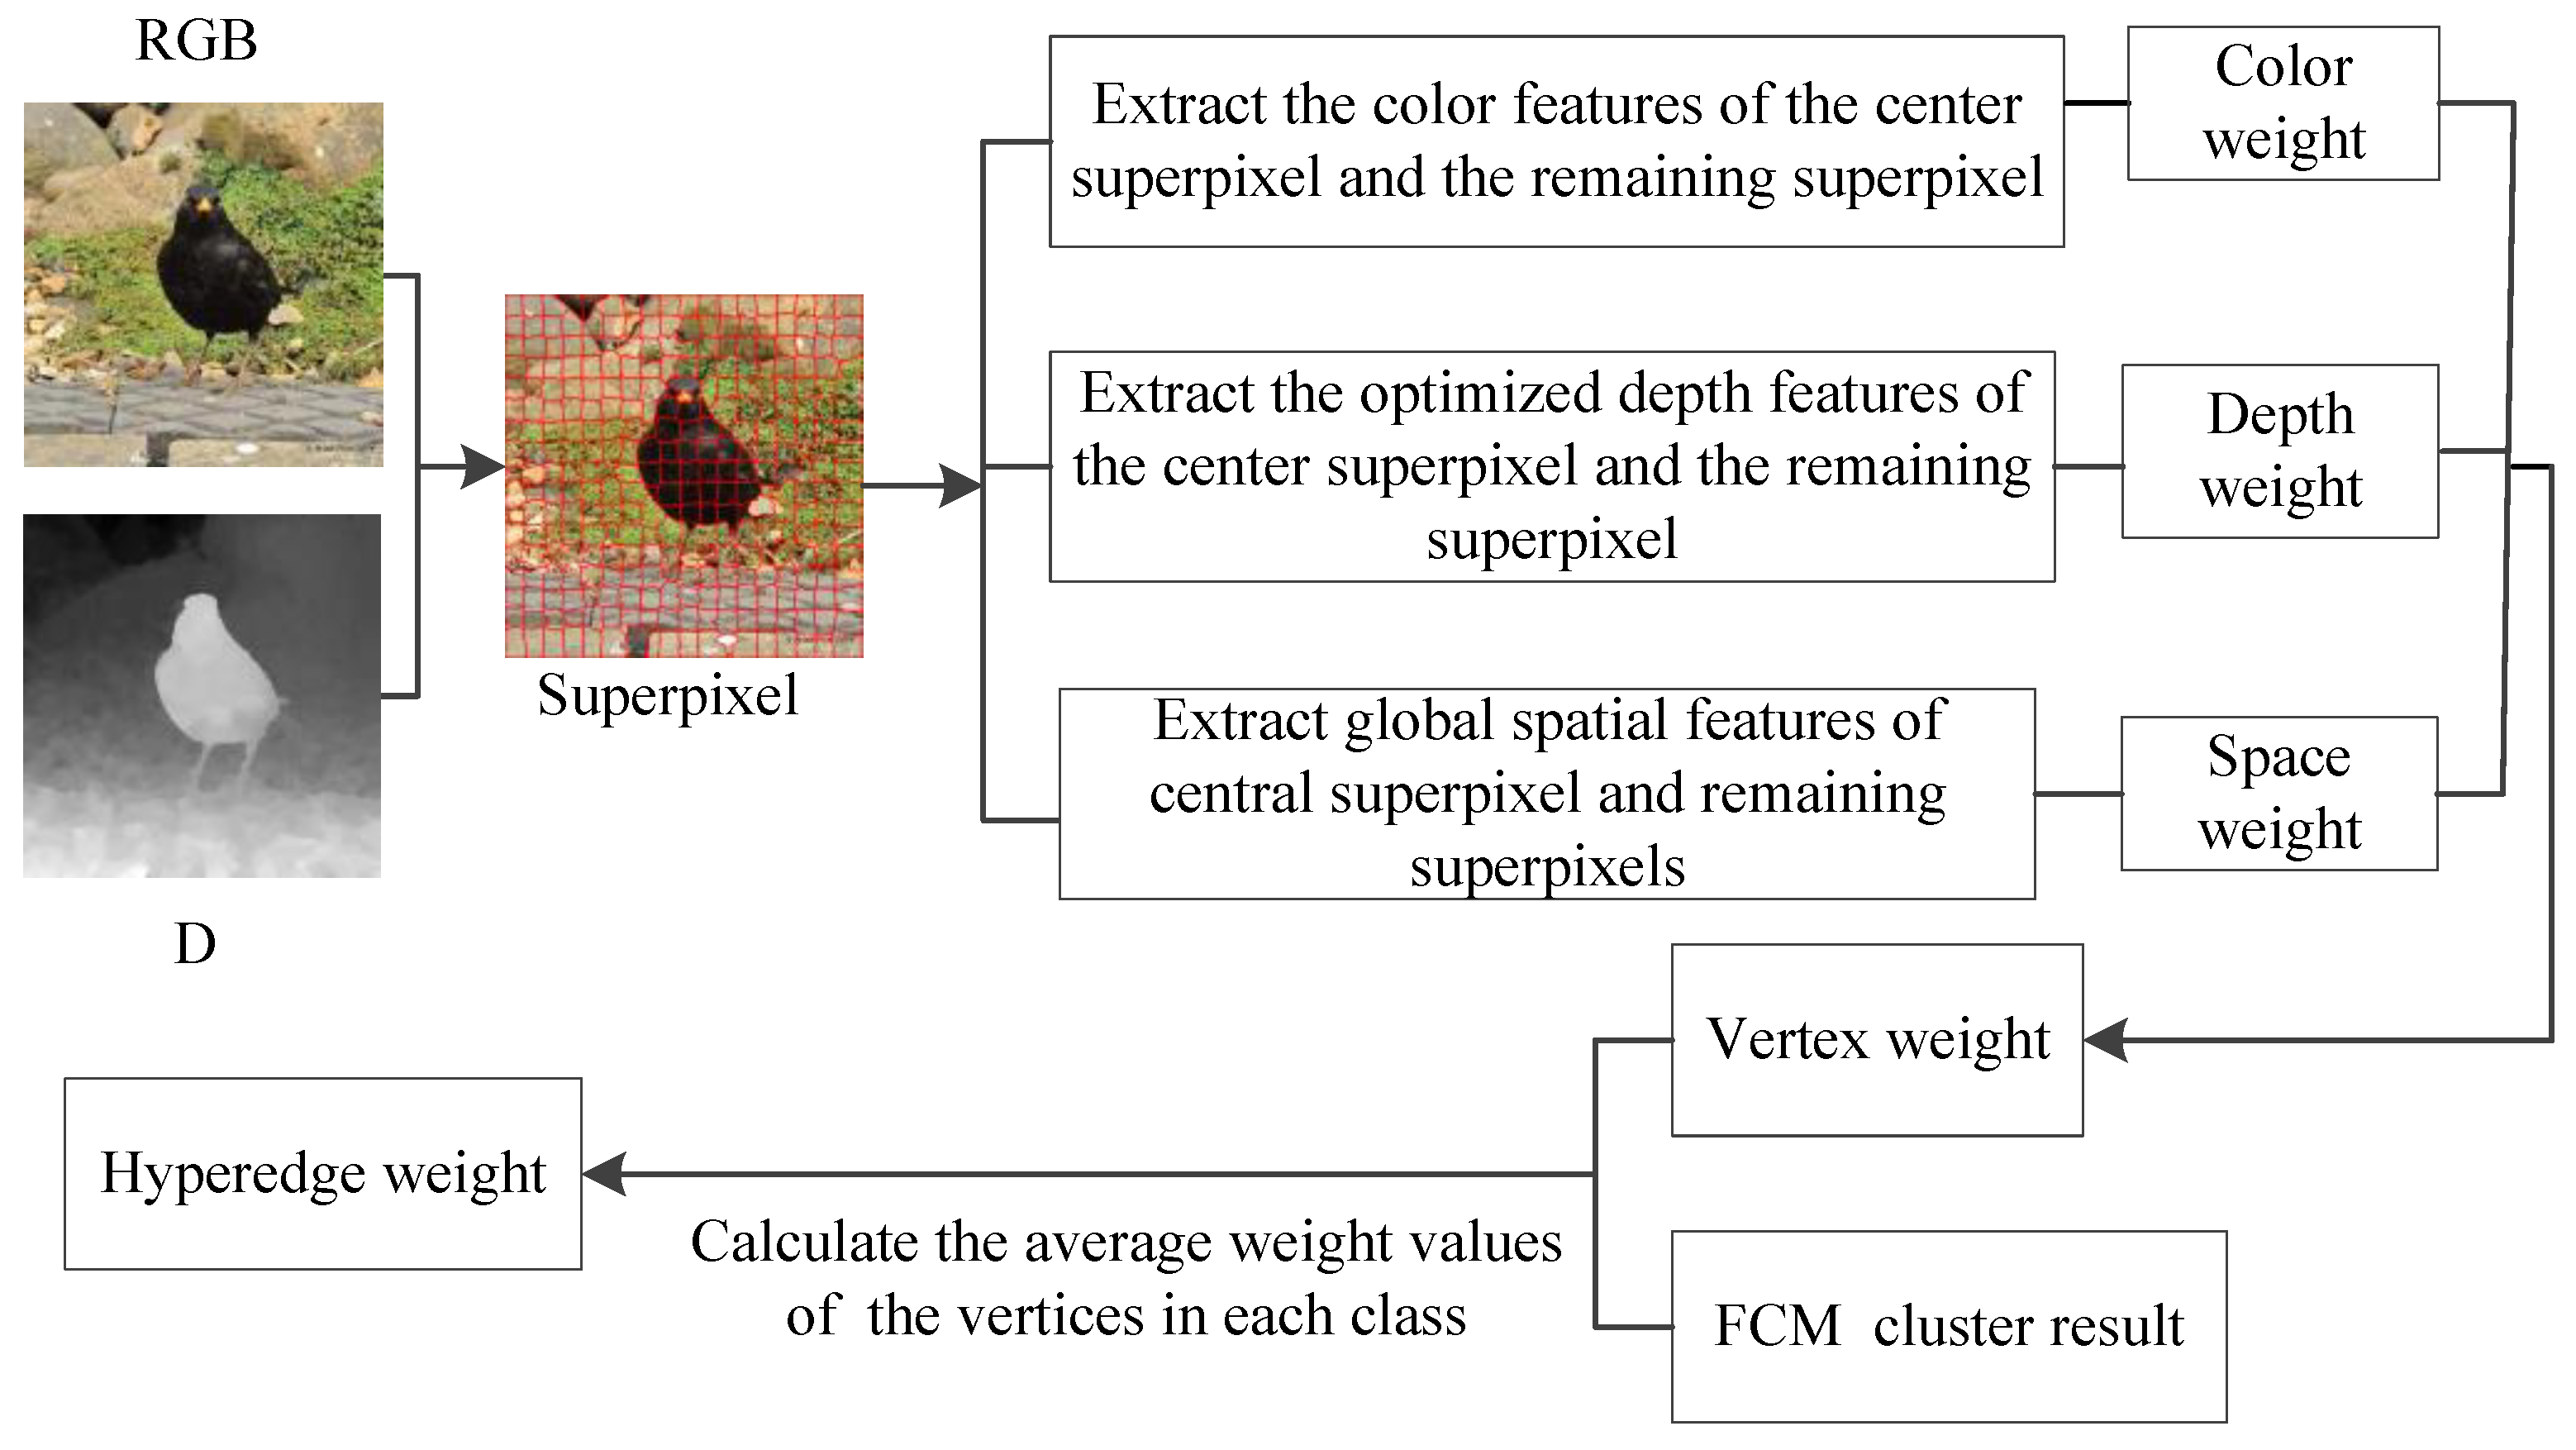
2.2. RGBD Image Saliency Detection Based on Superpixel and Hypergraph

Firstly, the RGBD image is divided into superpixel blocks. Secondly, we use the FCM clustering algorithm to construct a general hypergraph model. The number of categories of the clustering results is taken as the edges of the hypergraph, and the number of superpixels in each category is taken as the vertices of the hypergraph. Finally, the global spatial feature similarity, color feature similarity and optimized depth feature similarity are used to construct the weighted hypergraph model. The vertex and hyperedge weighting process in saliency detection method is shown in Figure 5.

2.2.1. Similarity of Color Feature

According to prior knowledge, the color of the salient object is significantly different from that of other regions. We calculated the Euclidean distance [42] between the central superpixel and remaining superpixel color features to represent the similarity of the color features. The formula is as follows:
F c = ( 1 / e ) | | C i C k | | 2 ,
where Ck and Ci denote the center superpixel and the rest of the superpixel color features, and Fc is the normalized color feature similarity.

2.2.2. Similarity of Depth Feature

Considering that the depth values of salient objects are significantly different compared with other regions, we calculated the Euclidean distance between the central superpixel and remaining superpixel to denote the similarity of the depth features in Equation (9).
F d = ( 1 / e ) | | D i D k | | 2 ,
where Dk and Di denote the center superpixel and the rest of the superpixel depth features, Fd is the normalized depth feature similarity.

2.2.3. Global Spatial Feature Similarity

Considering that the center of the image is usually the salient, we calculated the Euclidean distance between the central superpixel and the remaining superpixels to denote the spatial position relationship of the image. The formula is as follows:
F L = 1 | | L i L k | | 2 L i L k 1 o t h e r w i s e ,

2.2.4. A Weighted Hypergraph Model Was Constructed for Saliency Detection

The weight value of vertices is calculated by integrating the color features of the superpixels, the optimized depth features and the spatial position relation. The average weight value of all the vertices contained in a hyperedge is used as the weight of the hyperedge to construct the weighted hypergraph model. The vertex and hyperedge weighting process is used in the saliency detection method, as in Equations (11) and (12).
W V = ( β F c 2 + δ F d 2 + γ F l 2 ) ,
W E = η W V m ,
where β , δ and γ are the weight of color feature, optimized depth feature and spatial position feature, their values, respectively, set to 1/3, W V is the vertex weight value, η is the FCM cluster result, m is the number of vertices contained in a hyperedge, W E is the hyperedge weight value.
We first use the random walk algorithm to rank the importance of superpixels in the weighted hypergraph model to obtain the saliency map, and then map the superpixel-level saliency map to the pixel-level saliency map. A comparison of the saliency detection results of different algorithms is shown in Figure 6. We compared the proposed method with CBCS [34], ICFS [35] and MCL [36]. The results show that the CBCS [34] mistakenly detects some complex backgrounds as salient objects, ICFS [35] and MCL [36] do not detect salient objects completely, for example, the beak and claws of the bird are not detected. However, the RGBD image saliency detection based on the superpixel and hypergraph models not only displays the beak and feet of the bird, but also detects the detailed part of the bird’s eye.

2.3. RGBD Image Co-Saliency Detection Based on Superpixel and Hypergraph

In order to detect the common salient object in the image group, it is necessary to consider not only the color features, global spatial features and optimized depth features of a single image, but also the features and relations of salient objects among images. Although the spatial location relationship of co-salient objects is dissimilarity, the color features and depth features are often very similar. Therefore, when constructing the weighted hypergraph model with co-saliency detection, not only the color features in single image, optimized depth features, global spatial features and saliency features, but also the color similarity and optimized depth feature similarity among images should be taken into account. The weighted process of vertex and hyperedge in co-saliency detection is shown in Figure 7. Finally, we used the random walk algorithm to rank the importance of superpixels in the weighted hypergraph model to obtain the co-saliency map, and then map the superpixel-level co-saliency map to the pixel-level co-saliency map.

2.3.1. Vertex Weight

When constructing the weighted hypergraph model for co-saliency detection, all input images should be divided into two groups; the first group is any pair of RGBD images, and the second group is all the remaining image pairs. When co-saliency detection is carried out to construct the weighted hypergraph model, the vertex weight value is calculated as follows:
W V ( j ) = F L 1 ( j ) . j = 1 M exp ( μ | | C j 1 C j 2 | | 2 + | | D j 1 D j 2 | | 2 ) s 0 2 ( j ) j = 1 M exp ( μ ( | | C j 1 C j 2 | | 2 + | | D j 1 D j 2 | | 2 ) ) ,
where F L 1 ( j ) denotes the spatial position feature in the first group of images, C j 1 and   D j 1 , respectively, denote the Lab color space feature and the optimized depth feature of superpixel j in the first group of images, C j 2 and D j 2 , respectively, denote Lab color space features and optimized depth features of superpixel j′ in the second group of images, s 0 2 ( j ) denotes the salient feature of superpixel j′ in the second group of images. μ is set to 20.

2.3.2. Hyperedge Weight

When constructing the weighted hypergraph model for co-saliency detection, the hyperedge weight value is calculated based on the vertex weight value as shown in the following Equation (14):
W E = η W v m ,
where η is FCM clustering result, m is the number of vertices contained in a hyperedge, and W E is the weight value of the hyperedge for co-saliency detection.

3. Experimental Results

3.1. Dataset and Evaluation Metrics

We chose the Coseg183 dataset and Cosal150 dataset to test our method. The Cosal150 dataset contains a total of 150 images and consists of 21 image groups. The Coseg183 dataset contains a total of 183 images and consists of 16 image groups.
The precision-recall (P-R) curve, F-measure and mean absolute error (MAE) are used to evaluate the performance of our method. Firstly, the co-saliency map is transformed into a binary map, and then the transformed binary map is compared with the ground truth to obtain precision (P) and recall (R). Finally, the P-R curve is characterized by the relationship between the P value and the R value under different thresholds. The F-measure [35] is defined as the weighted average of the P value and the R value, which is calculated using the following formula:
F - m e a s u r e = ( 1 + λ 2 ) P R λ 2 P + R ,
where the value of λ 2 is set to 0.3 to put more emphasis on precision.
The MAE [36] measures the difference between the saliency map and ground truth, which is calculated using the following formula:
M A E = 1 W H x = 1 W y = 1 H | S ( x , y ) G ( x , y ) | ,
where W and H denote the width and height of the input image, S is to obtain the co-saliency map using the proposed method and convert the co-saliency map into a binary map, G is the ground truth in the dataset.

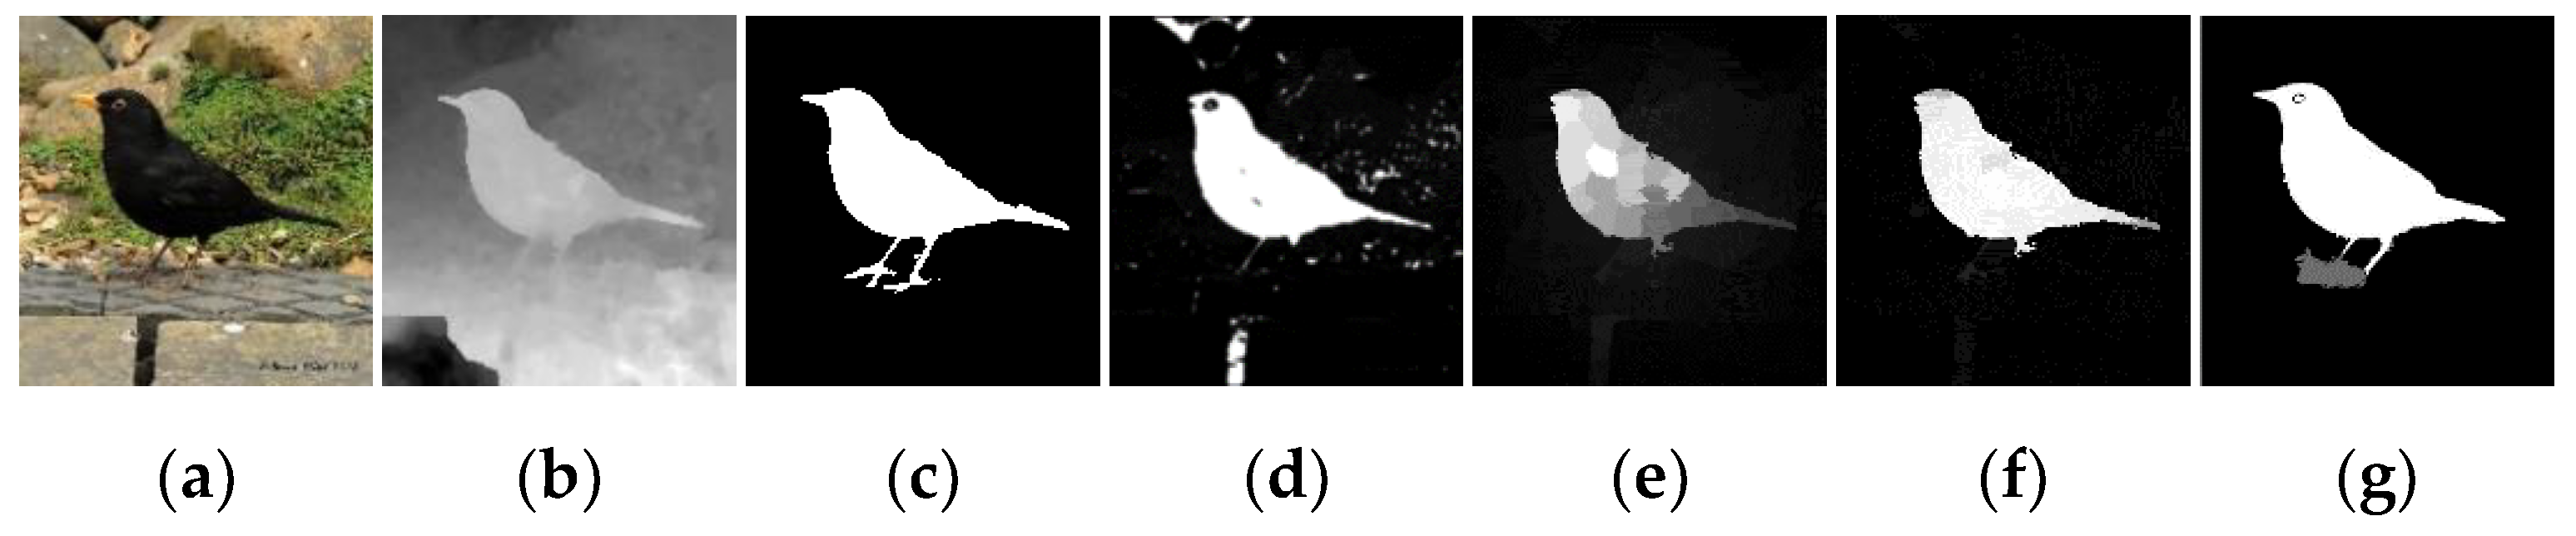
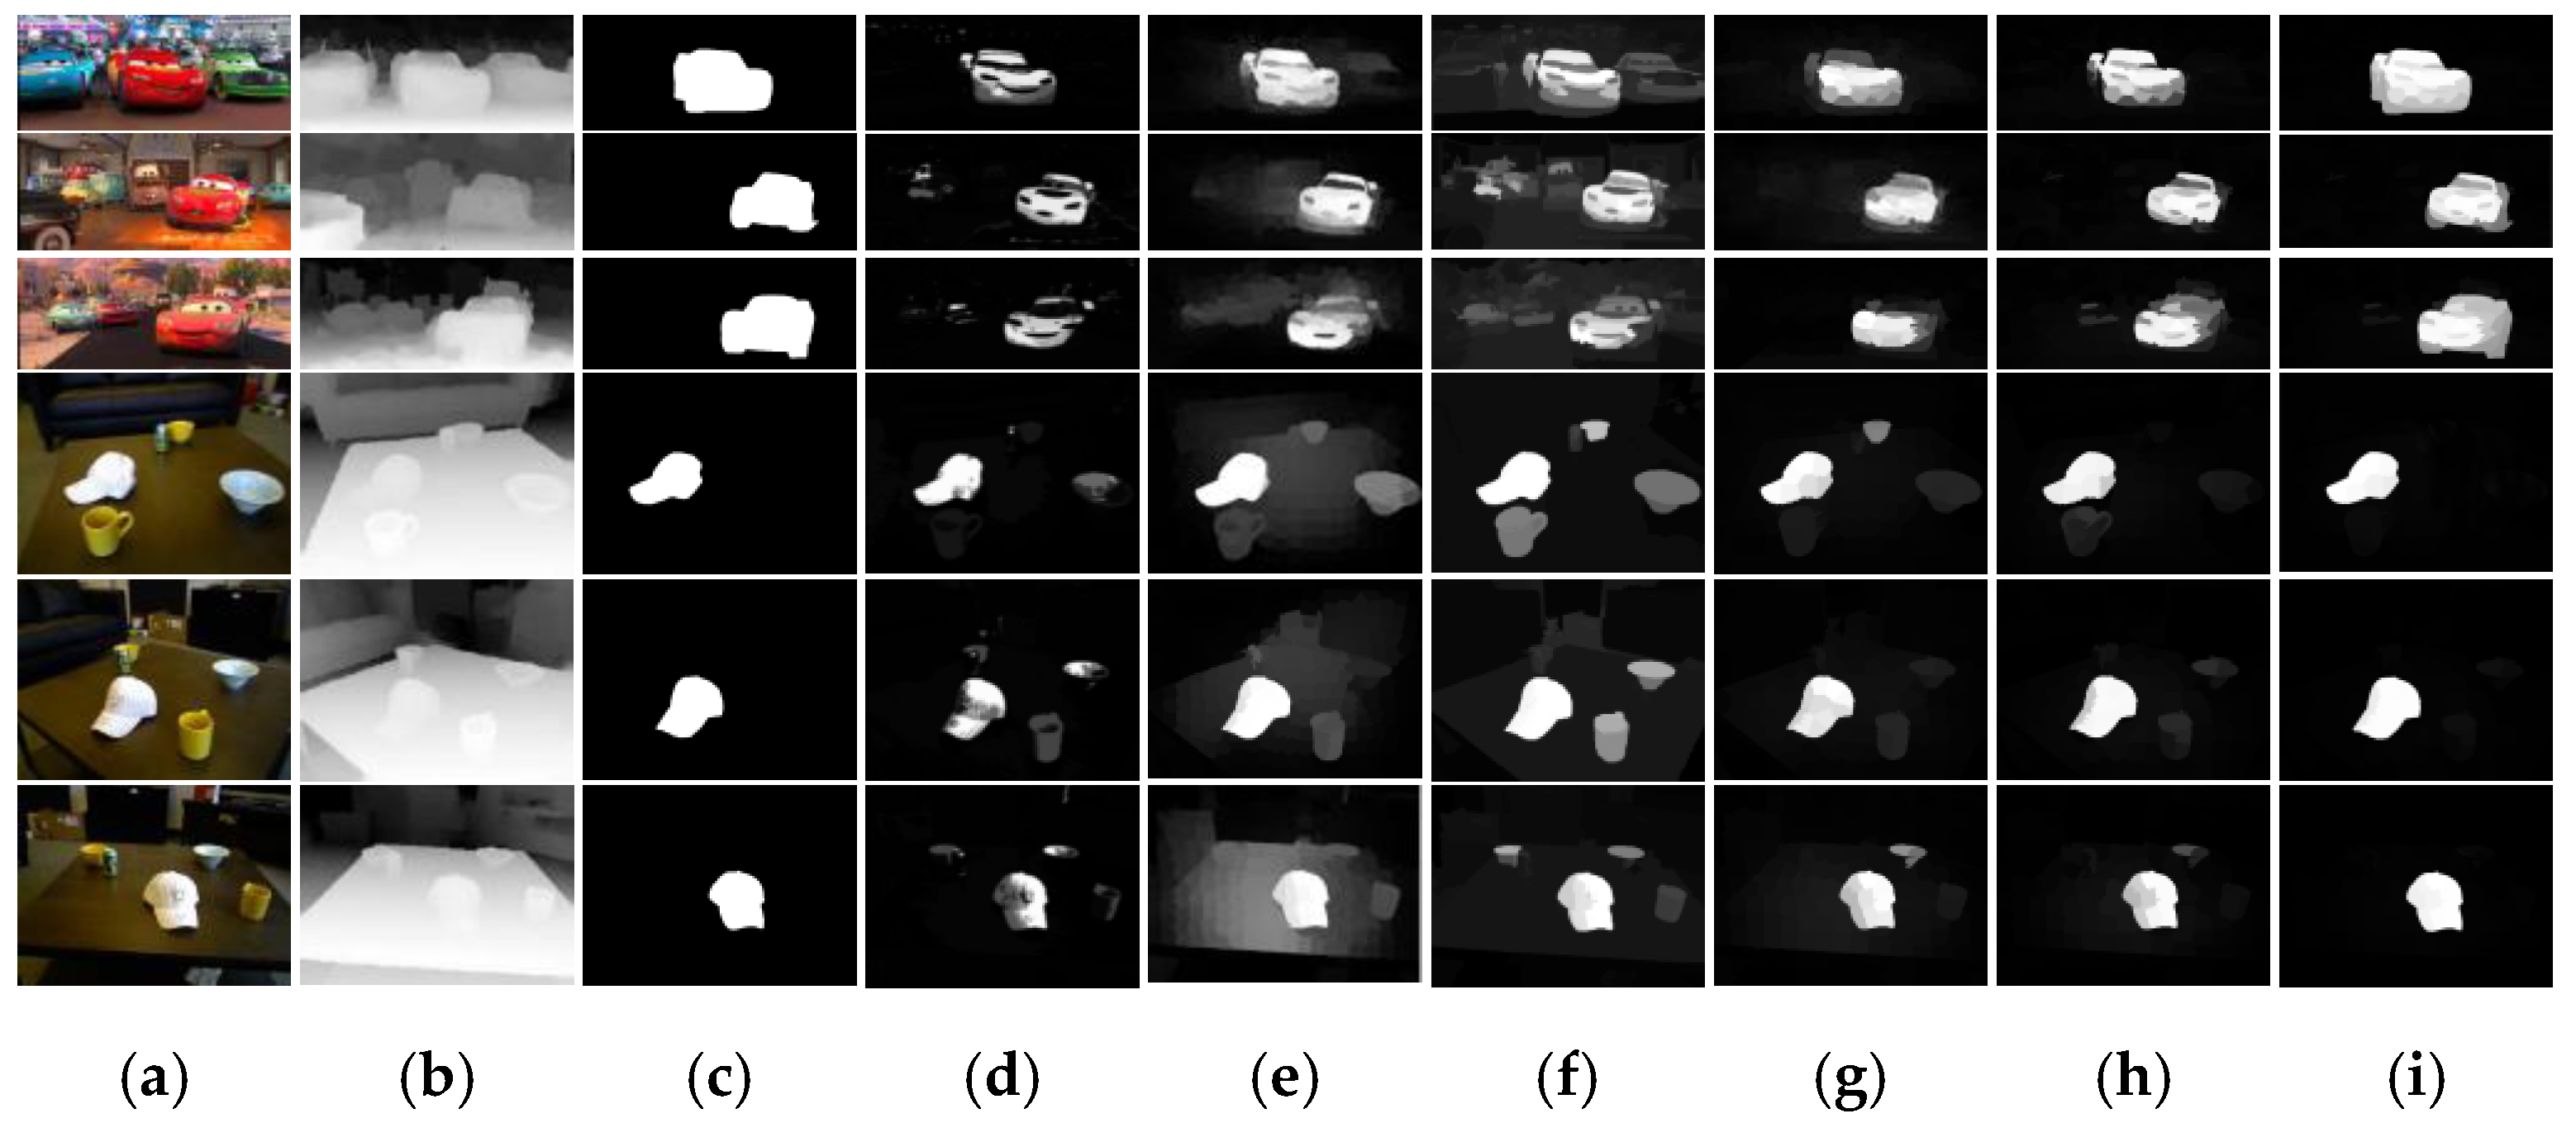
3.2. Visual Comparison with Different Methods

We compared the proposed method with CBCS [34], BSCA [17], HS [13], ICFS [35], MCL [36] and BSS [37]. Figure 8 is a comparison of the co-saliency detection results of the different methods; from the red car image group and white cap image group, it can be seen that the HS and BSCA for a single image cannot detect the co-saliency object accurately. In the red car image group, the common salient object is the red car, but some non-common salient objects such as blue cars and green cars are detected as common salient objects. In the white cap image group, the common salient object is the white cap, but some non-common salient objects such as cups and bowls are detected as common salient objects. In addition, the background of the two groups of images is also not effectively suppressed. Compared with other methods, our method can suppress the background more effectively, and the co-saliency object detection is more complete. This is because the color information, pixel position information and optimized depth information are taken into account when generating superpixels, and the color feature, the optimized depth feature and the global space feature of the image are taken into account comprehensively when constructing the weighted hypergraph model.

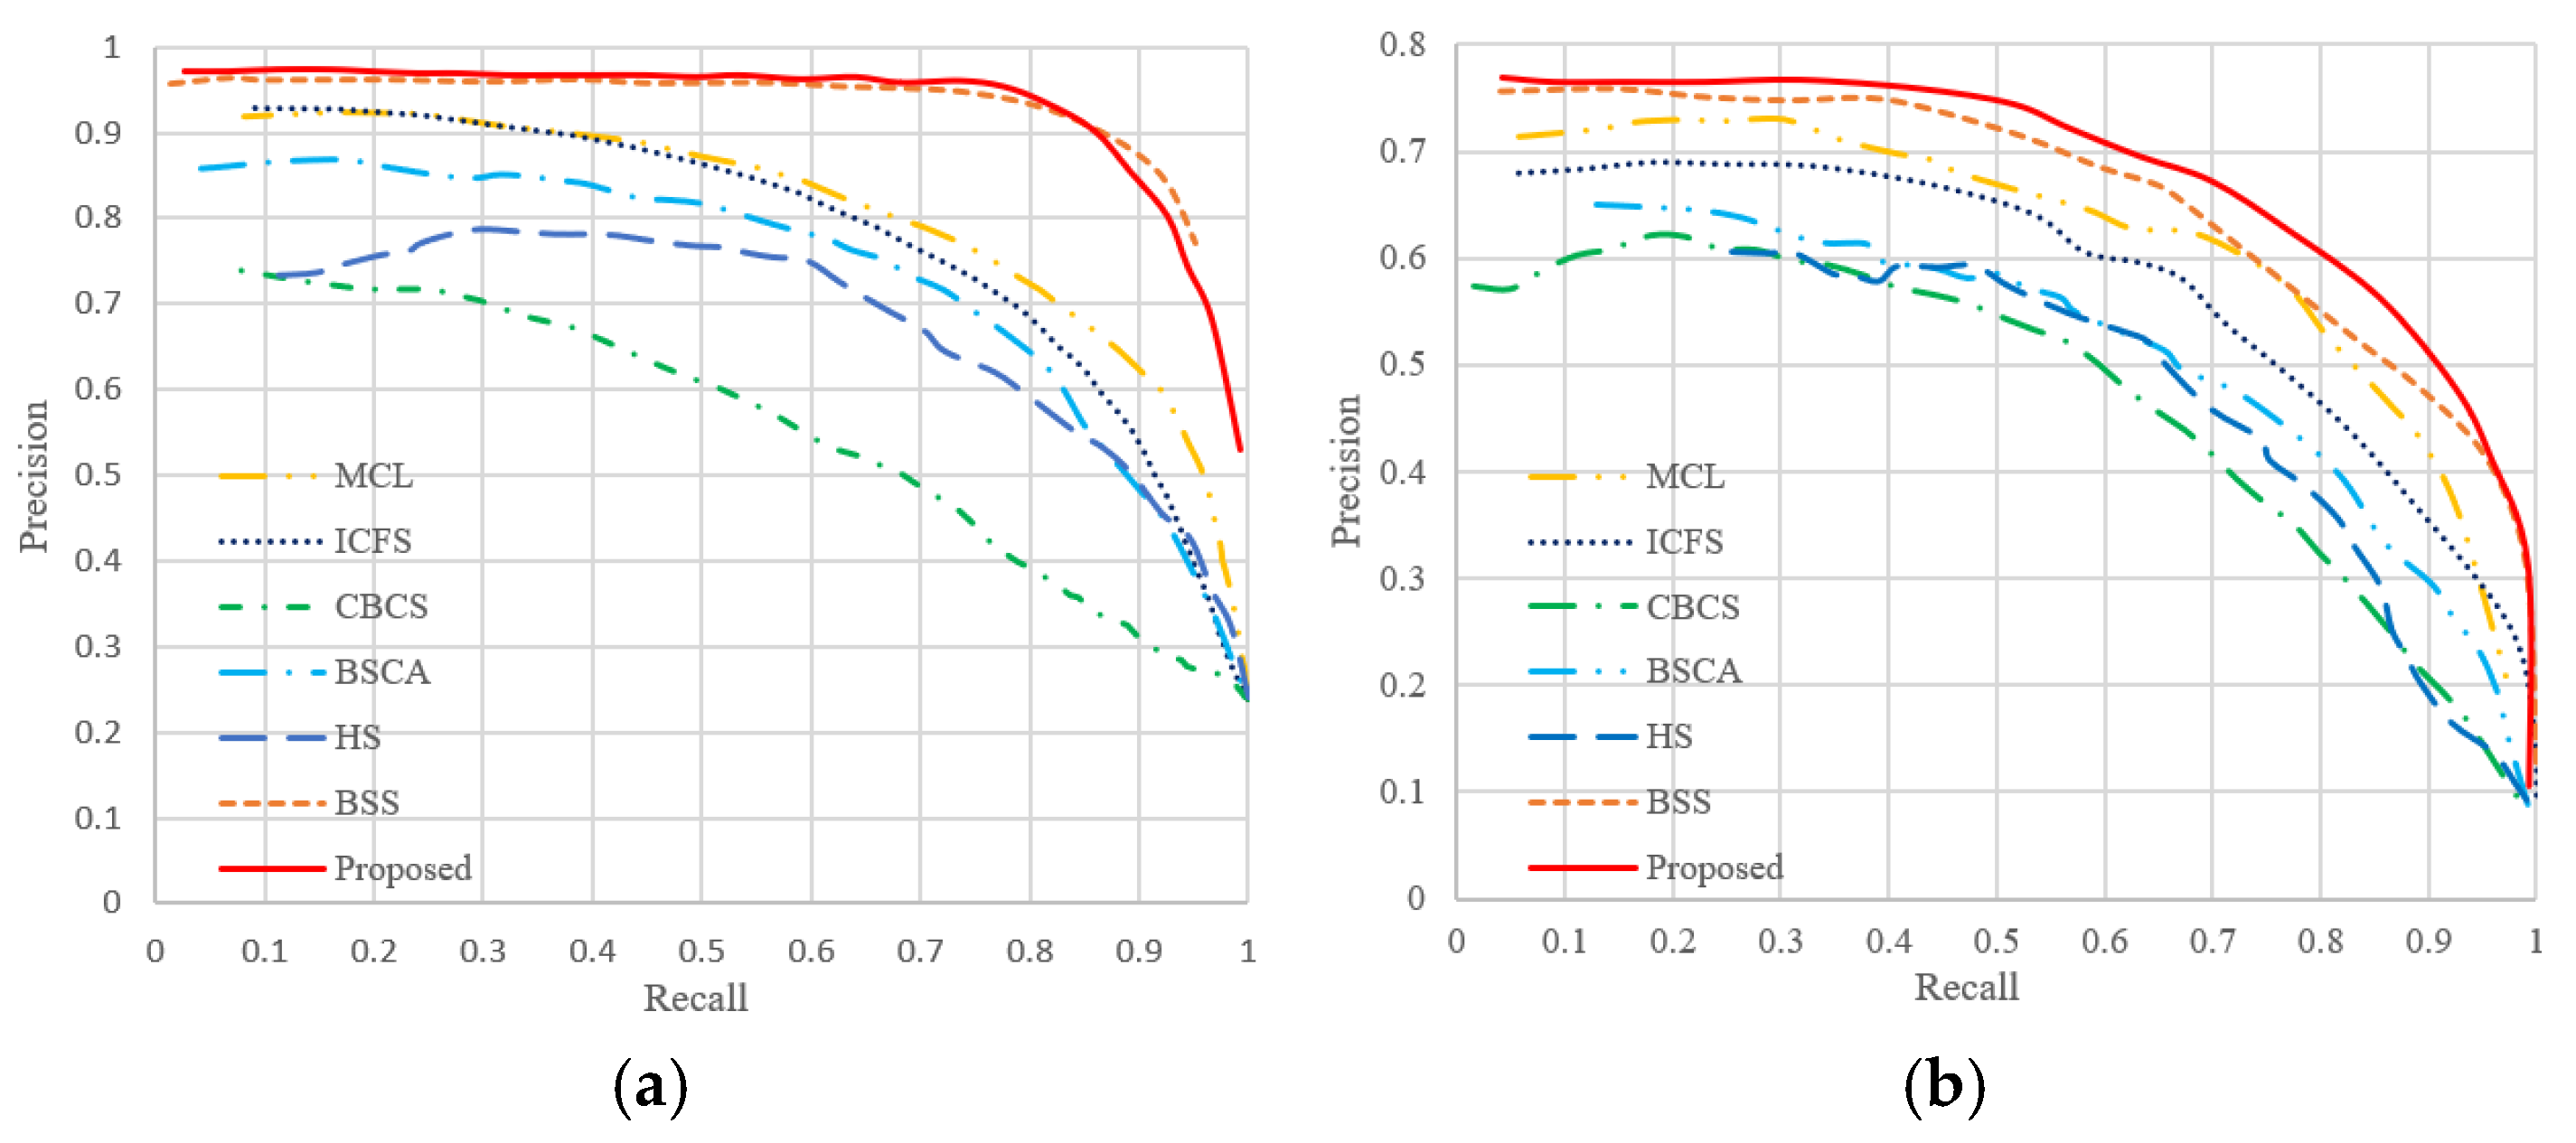
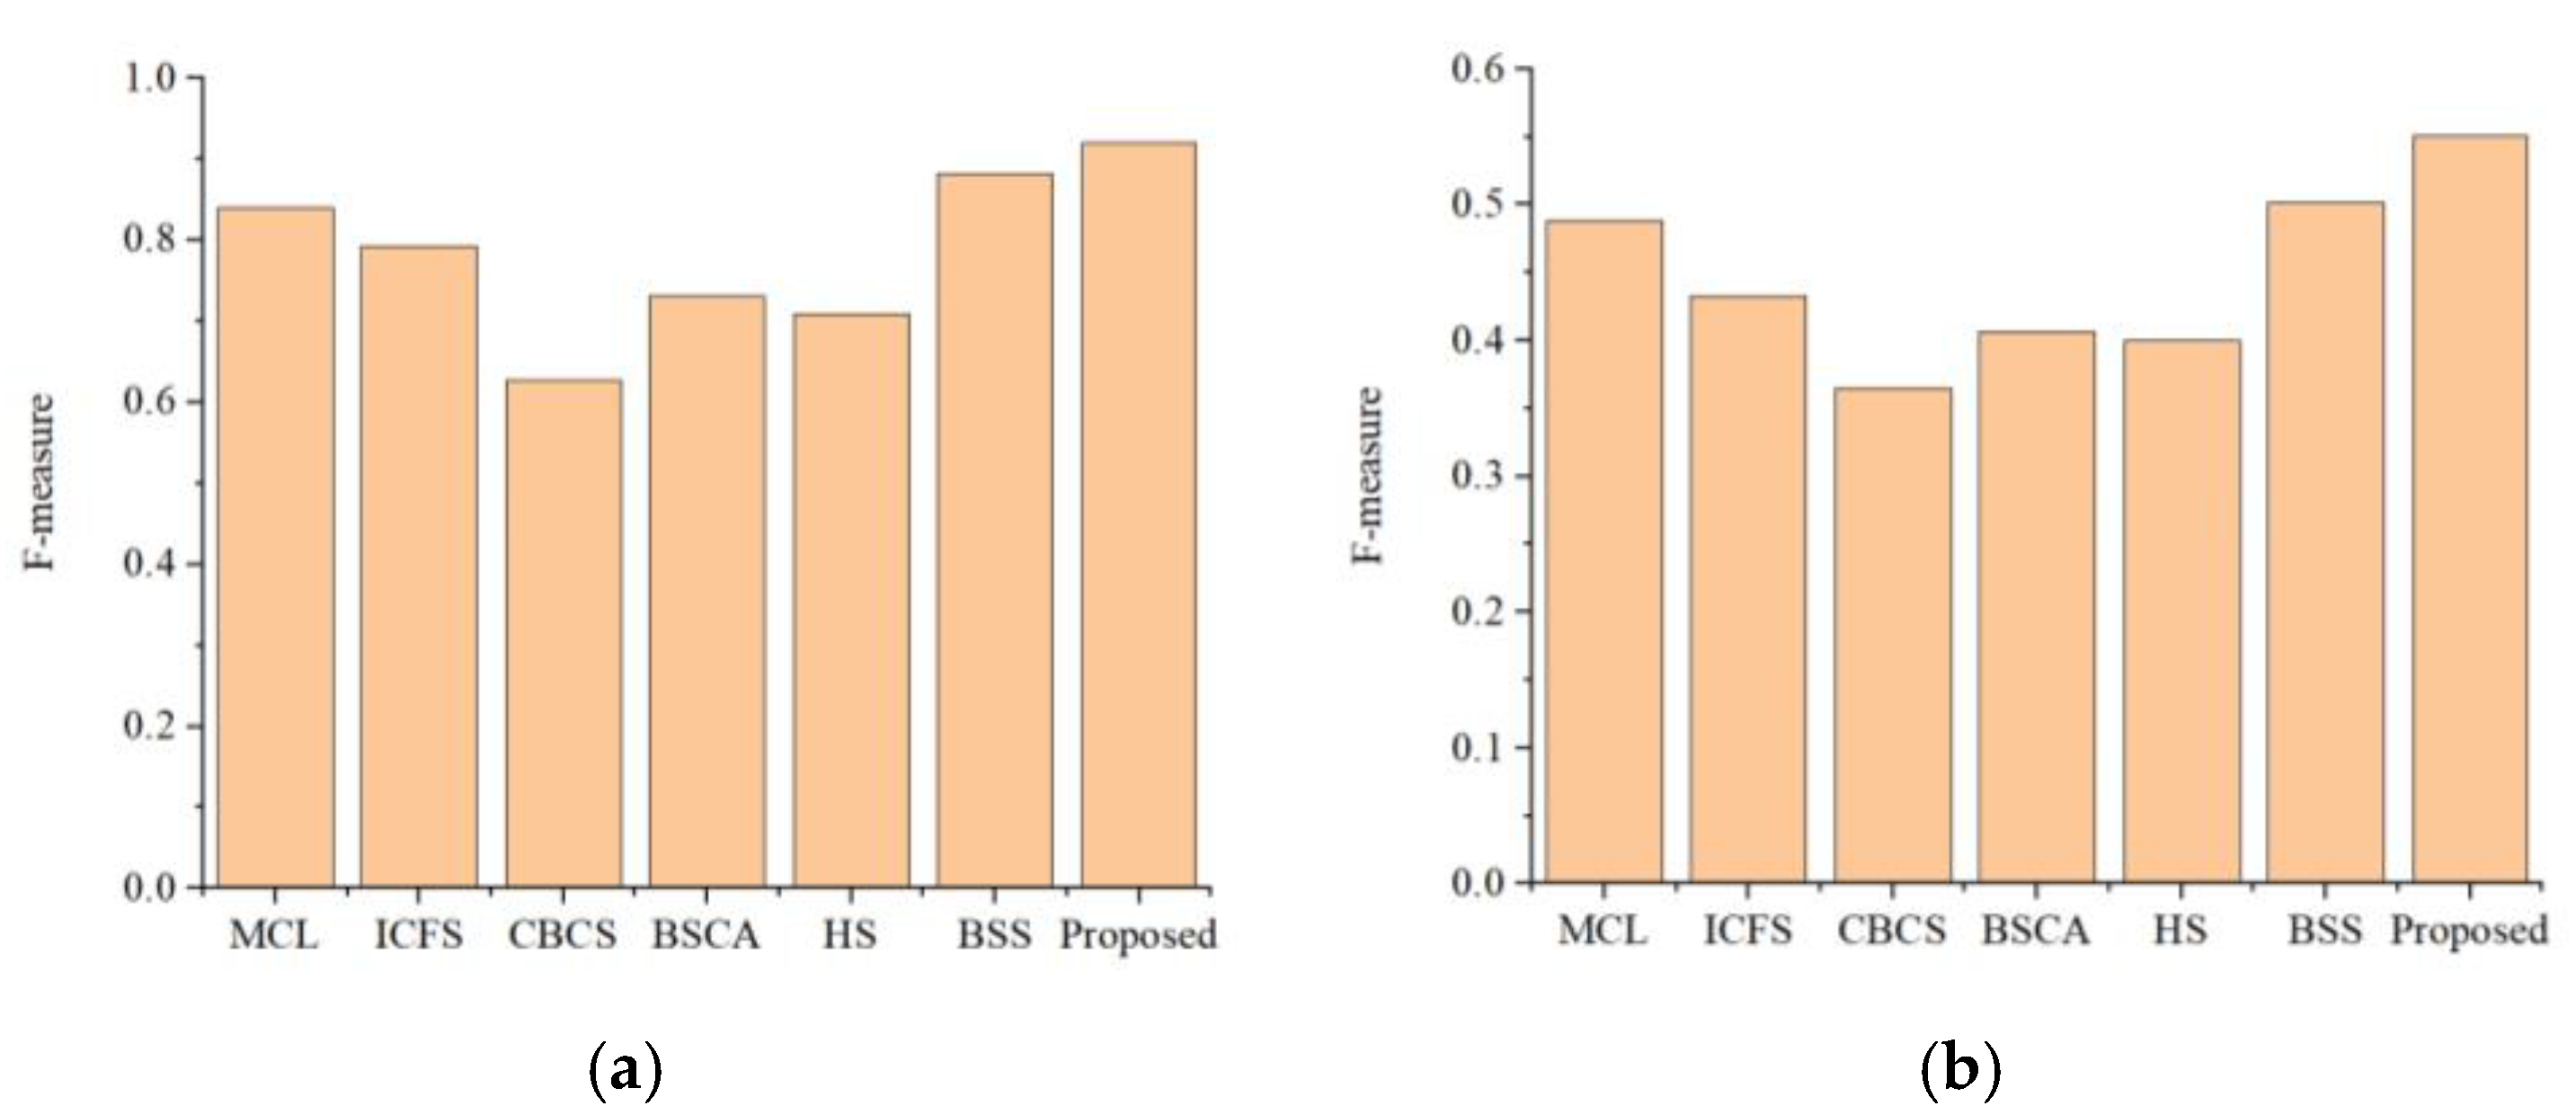
3.3. Quantitative Comparison with Different Methods

Figure 9 is the P-R curve of the different methods on the two datasets. On the Cosal150 dataset, our method has high accuracy in general, but there are a few that fall faster than the MCLS algorithm. On the Coseg183 dataset, the P-R curve of our method is in the upper right of the other algorithms, which denotes that our method has higher accuracy than the other methods. Figure 10 is the Comparison of the F-measure values of the different methods on the two datasets. On the Cosal150 dataset, it can be seen that our method performs the best, with an F-measure value of 0.921. Meanwhile, our method achieved the best performance on the Coseg183 dataset.
Table 1 is the comparison of the MAE values of the different methods on the two datasets. On the Cosal150 dataset, the results show that the proposed method outperforms other algorithms except for the BSS algorithm. On the Coseg183 dataset, the MAE value of the proposed method is the minimum, which means that the results of the proposed method are closer to the ground truth than other methods.

4. Conclusions

Co-saliency detection of an RGBD image based on superpixels and hypergraphs is proposed, because it is obvious that is achieved in this paper. Our work is focused on integrating the optimized depth cue to construct a weighted hypergraph model and mining the similarity relationship among multiple images. On the one hand, the proposed superpixel segmentation method uses six-dimensional space (three-dimensional Lab color space, two-dimensional XY coordinate space and optimized depth space) for feature extraction. On the other hand, based on the segmentation results of RGBD image superpixels, a novel weighted hypergraph model is constructed for co-saliency detection, which extracts the color features, optimized depth features, spatial location features and saliency features of superpixels. The random walk algorithm is used to generate the co-saliency map on the weighted hypergraph model. Through experimental validation on the Coseg183 dataset and the Cosal150 dataset, the results show that the proposed method outperforms other state-of-the-art saliency methods and co-saliency methods.

Author Contributions

Conceptualization, W.W. and W.C.; methodology, W.W. and W.C.; software, W.C.; validation, W.W.; resources, W.W.; Writing—original draft preparation, W.C.; writing—review and editing, M.X. and W.W.; supervision, W.W.; visualization, W.C.; funding acquisition, W.W. All authors have read and agreed to the published version of the manuscript.

Funding

This research was funded by the Science and Technology Plan-natural Science Foundation Project of Gansu, grant number 20JR5RA518, and the Cultivation Plan of Major Scientific Research Projects of Northwest Normal University, grant number NWNU-LKZD2021-06.

Data Availability Statement

Not applicable.

Acknowledgments

We sincerely thank the reviewers for their helpful comments and suggestions about our manuscript.

Conflicts of Interest

The authors declare no conflict of interest.

References

  1. Nie, G.Y.; Cheng, M.M.; Liu, Y.; Liang, Z.; Fan, D.P.; Liu, Y.; Wang, Y. Multi-level context ultra-aggregation for stereo matching. In Proceedings of the IEEE/CVF Conference on Computer Vision and Pattern Recognition, Long Beach, CA, USA, 15–20 June 2019; pp. 3283–3291. [Google Scholar]
  2. Zeng, Y.; Zhuge, Y.; Lu, H.; Zhang, L. Joint learning of saliency detection and weakly supervised semantic segmentation. In Proceedings of the IEEE/CVF International Conference on Computer Vision, Seoul, Republic of Korea, 27–28 October 2019; pp. 7223–7233. [Google Scholar]
  3. Fan, D.P.; Ji, G.P.; Zhou, T.; Chen, G.; Fu, H.; Shen, J.; Shao, L. Pranet: Parallel reverse attention network for polyp segmentation. In Proceedings of the International Conference on Medical Image Computing and Computer-Assisted Intervention; Springer: Berlin/Heidelberg, Germany, 2020; pp. 263–273. [Google Scholar]
  4. Fan, D.P.; Wang, W.; Cheng, M.M.; Shen, J. Shifting more attention to video salient object detection. In Proceedings of the IEEE/CVF Conference on Computer Vision and Pattern Recognition, Long Beach, CA, USA, 15–20 June 2019; pp. 8554–8564. [Google Scholar]
  5. Song, H.; Wang, W.; Zhao, S.; Shen, J.; Lam, K.M. Pyramid dilated deeper convlstm for video salient object detection. In Proceedings of the European Conference on Computer Vision (ECCV), Munich, Germany, 8–14 September 2018; pp. 715–731. [Google Scholar]
  6. Gu, K.; Wang, S.; Yang, H.; Lin, W.; Zhai, G.; Yang, X.; Zhang, W. Saliency-guided quality assessment of screen content images. IEEE Trans. Multimed. 2016, 18, 1098–1110. [Google Scholar] [CrossRef]
  7. Felzenszwalb, P.F.; Huttenlocher, D.P. Efficient graph-based image segmentation. Int. J. Comput. Vis. 2004, 59, 167–181. [Google Scholar] [CrossRef]
  8. Shi, J.; Malik, J. Normalized cuts and image segmentation. IEEE Trans. Pattern Anal. Mach. Intell. 2000, 22, 888–905. [Google Scholar]
  9. Levinshtein, A.; Stere, A.; Kutulakos, K.N.; Fleet, D.J.; Dickinson, S.J.; Siddiqi, K. Turbopixels: Fast superpixels using geometric flows. IEEE Trans. Pattern Anal. Mach. Intell. 2009, 31, 2290–2297. [Google Scholar] [CrossRef] [PubMed] [Green Version]
  10. Achanta, R.; Shaji, A.; Smith, K.; Lucchi, A.; Fua, P.; Süsstrunk, S. SLIC superpixels compared to state-of-the-art superpixel methods. IEEE Trans. Pattern Anal. Mach. Intell. 2012, 34, 2274–2282. [Google Scholar] [CrossRef] [Green Version]
  11. Agoes, A.S.; Hu, Z.; Matsunaga, N. DSLIC: A superpixel based segmentation algorithm for depth image. In Proceedings of the Asian Conference on Computer Vision; Springer: Berlin/Heidelberg, Germany, 2016; pp. 77–87. [Google Scholar]
  12. Li, X.; Wan, L.; Li, H.; Wang, S. RGBD image co-segmentation via saliency detection and graph cut. J. Syst. Simul. 2018, 30, 2558. [Google Scholar]
  13. Shi, J.; Yan, Q.; Xu, L.; Jia, J. Hierarchical image saliency detection on extended CSSD. IEEE Trans. Pattern Anal. Mach. Intell. 2015, 38, 717–729. [Google Scholar] [CrossRef]
  14. Li, X.; Song, D.; Dong, Y. Hierarchical feature fusion network for salient object detection. IEEE Trans. Image Process. 2020, 29, 9165–9175. [Google Scholar] [CrossRef]
  15. Abouelregal, A.E.; Marin, M. The size-dependent thermoelastic vibrations of nanobeams subjected to harmonic excitation and rectified sine wave heating. Mathematics 2020, 8, 1128. [Google Scholar] [CrossRef]
  16. Zhang, L.; Bhatti, M.; Michaelides, E.E.; Marin, M.; Ellahi, R. Hybrid nanofluid flow towards an elastic surface with tantalum and nickel nanoparticles, under the influence of an induced magnetic field. Eur. Phys. J. Spec. Top. 2022, 231, 521–533. [Google Scholar] [CrossRef]
  17. Qin, Y.; Lu, H.; Xu, Y.; Wang, H. Saliency detection via cellular automata. In Proceedings of the IEEE Conference on Computer Vision and Pattern Recognition, Boston, MA, USA, 7–12 June 2015; pp. 110–119. [Google Scholar]
  18. Li, H.; Lu, H.; Lin, Z.; Shen, X.; Price, B. Inner and inter label propagation: Salient object detection in the wild. IEEE Trans. Image Process. 2015, 24, 3176–3186. [Google Scholar] [CrossRef] [Green Version]
  19. Ji, Y.; Zhang, H.; Tseng, K.K.; Chow, T.W.; Wu, Q.J. Graph model-based salient object detection using objectness and multiple saliency cues. Neurocomputing 2019, 323, 188–202. [Google Scholar] [CrossRef]
  20. Lu, Y.; Zhou, K.; Wu, X.; Gong, P. A novel multi-graph framework for salient object detection. Vis. Comput. 2019, 35, 1683–1699. [Google Scholar] [CrossRef]
  21. Li, X.; Li, Y.; Shen, C.; Dick, A.; Van Den Hengel, A. Contextual hypergraph modeling for salient object detection. In Proceedings of the IEEE International Conference on Computer Vision, Sydney, Australia, 1–8 December 2013; pp. 3328–3335. [Google Scholar]
  22. Han, F.; Han, A.; Hao, J. Saliency detection method using hypergraphs on adaptive multiscales. IEEE Access 2018, 6, 29444–29451. [Google Scholar] [CrossRef]
  23. Zhang, J.; Fang, S.; Ehinger, K.A.; Wei, H.; Yang, W.; Zhang, K.; Yang, J. Hypergraph optimization for salient region detection based on foreground and background queries. IEEE Access 2018, 6, 26729–26741. [Google Scholar] [CrossRef]
  24. Chen, B.; Yang, J.; Jeon, B.; Zhang, X. Kernel quaternion principal component analysis and its application in RGB-D object recognition. Neurocomputing 2017, 266, 293–303. [Google Scholar] [CrossRef]
  25. Huang, R.; Xing, Y.; Zou, Y. Triple-complementary network for RGB-D salient object detection. IEEE Signal Process. Lett. 2020, 27, 775–779. [Google Scholar] [CrossRef]
  26. Chen, C.; Wei, J.; Peng, C.; Zhang, W.; Qin, H. Improved saliency detection in RGB-D images using two-phase depth estimation and selective deep fusion. IEEE Trans. Image Process. 2020, 29, 4296–4307. [Google Scholar] [CrossRef]
  27. Huang, Z.; Chen, H.X.; Zhou, T.; Yang, Y.Z.; Liu, B.Y. Multi-level cross-modal interaction network for RGB-D salient object detection. Neurocomputing 2021, 452, 200–211. [Google Scholar] [CrossRef]
  28. Wang, X.; Li, S.; Chen, C.; Hao, A.; Qin, H. Depth quality-aware selective saliency fusion for RGB-D image salient object detection. Neurocomputing 2021, 432, 44–56. [Google Scholar] [CrossRef]
  29. Liu, Z.; Zou, W.; Li, L.; Shen, L.; Le Meur, O. Co-saliency detection based on hierarchical segmentation. IEEE Signal Process. Lett. 2013, 21, 88–92. [Google Scholar] [CrossRef] [Green Version]
  30. Jiang, R.; Crookes, D. Deep salience: Visual salience modeling via deep belief propagation. In Proceedings of the AAAI Conference on Artificial Intelligence, Québec City, QC, Canada, 27–31 July 2014; Volume 28. [Google Scholar]
  31. Lee, M.; Park, C.; Cho, S.; Lee, S. Superpixel Group-Correlation Network for Co-Saliency Detection. In Proceedings of the 2022 IEEE International Conference on Image Processing (ICIP), IEEE, Bordeaux, France, 16–19 October 2022; pp. 806–810. [Google Scholar]
  32. Tan, Z.; Gu, X. Co-saliency detection with intra-group two-stage group semantics propagation and inter-group contrastive learning. Knowl.-Based Syst. 2022, 252, 109356. [Google Scholar] [CrossRef]
  33. Zhang, D.; Han, J.; Li, C.; Wang, J. Co-saliency detection via looking deep and wide. In Proceedings of the IEEE Conference on Computer Vision and Pattern Recognition, Boston, MA, USA, 7–12 June 2015; pp. 2994–3002. [Google Scholar]
  34. Fu, H.; Cao, X.; Tu, Z. Cluster-based co-saliency detection. IEEE Trans. Image Process. 2013, 22, 3766–3778. [Google Scholar] [CrossRef] [Green Version]
  35. Cong, R.; Lei, J.; Fu, H.; Lin, W.; Huang, Q.; Cao, X.; Hou, C. An iterative co-saliency framework for RGBD images. IEEE Trans. Cybern. 2017, 49, 233–246. [Google Scholar] [CrossRef] [Green Version]
  36. Cong, R.; Lei, J.; Fu, H.; Huang, Q.; Cao, X.; Hou, C. Co-saliency detection for RGBD images based on multi-constraint feature matching and cross label propagation. IEEE Trans. Image Process. 2017, 27, 568–579. [Google Scholar] [CrossRef] [PubMed] [Green Version]
  37. Liu, Z.; Liu, J.; Zhao, P. RGBD Image Co-saliency Object Detection Based on Sample Selection. Electron. Inf. Technol. 2020, 42, 2277–2284. [Google Scholar]
  38. Zhang, Y.; Ding, L.; Sharma, G. Local-linear-fitting-based matting for joint hole filling and depth upsampling of RGB-D images. J. Electron. Imaging 2019, 28, 033019. [Google Scholar] [CrossRef]
  39. Xie, S.; Tu, Z. Holistically-nested edge detection. In Proceedings of the IEEE International Conference on Computer Vision, Santiago, Chile, 7–13 December 2015; pp. 1395–1403. [Google Scholar]
  40. Sasaki, T.; Fukushima, N.; Maeda, Y.; Sugimoto, K.; Kamata, S.I. Constant-time gaussian filtering for acceleration of structure similarity. In Proceedings of the 2020 International Conference on Image Processing and Robotics (ICIP), IEEE, Negombo, Sri Lanka, 6–8 March 2020; pp. 1–6. [Google Scholar]
  41. Chen, C.; Li, S.; Wang, Y.; Qin, H.; Hao, A. Video saliency detection via spatial-temporal fusion and low-rank coherency diffusion. IEEE Trans. Image Process. 2017, 26, 3156–3170. [Google Scholar] [CrossRef]
  42. Wei, W.; Chen, H. Salient object detection based on weighted hypergraph and random walk. Math. Probl. Eng. 2020, 2020, 2073140. [Google Scholar] [CrossRef]
Figure 1. The algorithm flow of the proposed co-saliency detection.
Symmetry 14 02393 g001
Figure 2. The process of generating edge consistency map.
Symmetry 14 02393 g002
Figure 3. The process of optimizing depth map. (a) RGB map; (b) Depth map; (c) Final EC; (d) Optimized depth map.
Symmetry 14 02393 g003
Figure 4. Comparison of superpixel segmentation results of different algorithms (K = 300). (a) RGB map; (b) SLIC; (c) SLIC-D; (d) Proposed.
Symmetry 14 02393 g004
Figure 5. Vertex and hyperedge weighting process in saliency detection method.
Symmetry 14 02393 g005
Figure 6. Comparison of saliency detection results of different methods. (a) RGB map; (b) Depth map; (c) Ground truth; (d) CBCS; (e) ICFS; (f) MCL; (g) Proposed.
Symmetry 14 02393 g006
Figure 7. Vertex and hyperedge weighting process in co-saliency detection method.
Symmetry 14 02393 g007
Figure 8. Visual comparison of co-saliency detection results of different methods. (a) RGB map; (b) Depth map; (c) Ground truth; (d) CBCS; (e) BSCA; (f) HS; (g) ICFS; (h) MCL; (i) Proposed.
Symmetry 14 02393 g008
Figure 9. Comparison of P-R curves of different methods. (a) Cosal150 dataset; (b) Coseg183 dataset.
Symmetry 14 02393 g009
Figure 10. Comparison of F-measure values of different methods. (a) Cosal150 dataset; (b) Coseg183 dataset.
Symmetry 14 02393 g010
Table 1. Comparison of MAE values of different methods on two datasets.
Cosal150 DatasetCoseg183 Dataset
MCL0.1370.098
ICFS0.1790.163
CBCS0.2150.116
BSS0.0890.081
Proposed0.1470.079
Publisher’s Note: MDPI stays neutral with regard to jurisdictional claims in published maps and institutional affiliations.

