Article

Emulating Epileptic Seizures on Coupled Chua’s Circuit Networks

by
Rafailia-Eleni Karamani
,
Karolos-Alexandros Tsakalos
and
Georgios Ch. Sirakoulis
*,†
Department of Electrical & Computer Engineering, Democritus University of Thrace, 671 00 Xanthi, Greece
*
Author to whom correspondence should be addressed.
These authors contributed equally to this work.
Symmetry 2022, 14(11), 2325; https://doi.org/10.3390/sym14112325
Submission received: 2 September 2022 / Revised: 25 October 2022 / Accepted: 31 October 2022 / Published: 5 November 2022
(This article belongs to the Special Issue Mechanics of Heterogeneous Solids and Structures)

Abstract

:
Irregular brain activity is of interest to researchers and scientists who are trying to understand, model, compare, and provide novel solutions to existing and challenging issues. Neurological disorders such as epilepsy, Alzheimer’s disease, Parkinson’s disease, and schizophrenia have been extensively studied. Among those diseases, epileptic seizures are the most commonly occurring ones. In this work, as a simplification of the complete biological operations of the brain, it was viewed as a system that consists of coupled oscillators. This allowed us to examine epilepsy as a pathological manifestation of the system. Emerging behaviors that arise from the spatiotemporal interactions of simple oscillators, namely, Chua’s Circuit, allowed us to observe how irregularities and changes to the coupling parameters of a neuromorphic network affect their synchronization and result in the emergence of epileptic activity. To achieve this, the characteristics of novel nanoelectronic devices, namely, memristors, have been exploited through their integration into two-dimensional crossbar arrays that offer the advantages of reprogrammability, low area, and low power consumption.

1. Introduction

Chua’s Circuit (CC) is among the most widely used electrical circuits for performing chaotic dynamics with a nonlinear element, and despite its simplicity, the associated system of nonlinear differential equations is particularly rich in dynamical states; it is able to perform a wide range of intriguing transitions from regular to chaotic dynamics. Chua’s Circuit is the simplest electronic circuit that meets the criteria to be defined as an autonomous circuit that displays chaotic behavior. The combination of its easy experimental implementation and the ease and accuracy of its theoretical modeling have resulted in its extensive use in chaos theory applications in the literature. In the chaotic domain, the attractor’s trajectory oscillates around two distinct points, and the transitions between them are highly sensitive to the initial conditions of the system, resulting in the well-known double-scroll chaotic attractors in the phase plane. Networks of coupled CCs have been extensively studied to achieve either full chaotic synchronization [1,2] or the formation of richer synchronization regimes, such as chimera states [3,4]. Brain-mapping projects are gaining popularity around the world, including the Brain Research through Advancing Innovative Neurotechnologies (BRAIN) initiative in the United States [5], the Human Brain Project (HBP) in Europe [6], and the Brain Mapping by Integrated Neurotechnologies for Disease Studies (Brain/MINDS) project in Japan [7]. These projects aim to model the structure and function of neural circuits in order to better comprehend the human brain’s massive complexity. This is a clear demonstration of the research community’s growing interest in understanding the brain’s functionality.
The presence of chaotic dynamics in neural networks and brain-inspired phenomena has received a lot of attention recently [8,9], and this has advanced insights into the relationship between single-neuron dynamics and recurrent connectivities, which is a major step towards the description of more bio-plausible neuromorphic networks [10]. In particular, various neuroscience-based studies have observed that a variety of dynamical phenomena are directly associated with brain functionality during simple tasks and in many neurological disorders, including epileptic seizures, Parkinson’s disease, Alzheimer’s disease, and schizophrenia [11,12,13]. Therefore, incorporating more complex dynamics in brain-inspired networks paves the way for a more robust and bio-plausible approach for emulation of epileptic seizures. Chaotic behavior is ubiquitous in real-world nonlinear dynamical systems and the hallmark of the collective brain activity. Researchers have proposed a neuron model with chaotic dynamics in [14] that is capable of qualitatively reproducing the experimentally observed alternating periodic–chaotic sequences of neuronal responses. Bifurcation phenomena and chaos are present in various biological systems, such as neural networks, cells, and membranes [15]; and these are also considered for the equations that describe neurons, such as the FitzHugh–Nagumo equations [16] and the Hindmarsh–Rose equations [17]. Keeping in mind that chaos and stochasticity are two different phenomena, we take advantage of the unpredictability of these phenomena and utilize the intrinsic chaotic properties of chaotic oscillators to model the collective chaotic phenomena that emerge through the spatial and temporal interaction of neuronal cells in the brain. Even though we consider that a single neuronal cell’s behavior is not intrinsically chaotic, considering coupled chaotic oscillators as a means to mimic the interactions among neurons has been extensively studied for modeling and emulating efforts in the literature [18,19].
Recently, epileptic mechanisms have been uncovered and have been related to several neurotransmitters, such as astrocytes, which possess a variety of complex dynamical modes, including chaos and multistability, and can further provide different modulations of neuron models and circuits. The brain’s oscillatory functionality, as described in [20,21], is characterized by chaotic behavior during the normal state, whereas its behavior is synchronized during abnormal epileptic behavior. Further studies have demonstrated the emergence of complicated oscillations of calcium concentration, enabling the simulation of neuron–astrocytic networks [22]. As a result, the motivation behind the use of chaotic circuits as neurons lies in the fact that they are capable of exhibiting irregular chaotic synchronization, depending on the initial conditions, and imposing unpredictability over time, which can be considered for modeling epileptic seizures. This approximation is experimentally acceptable, and it can also reproduce excitatory and inhibitory spiking activity, as in the Fitzhugh–Nagumo neuron model. Ring-based networks of CCs coupled on memristor crossbar arrays have already been employed in synchronization-based studies, revealing a variety of complex spatiotemporal patterns, including chaotic synchronization and the emergence of chimera states [23]. In this work, we explore the synchronization phenomena that emerge due to the presence of an abnormality in the connectivity of the oscillators. A network of simple, coupled oscillatory units was exploited, and the simulation results are presented in order to compare the behavior of a healthy (no unwanted connections) and an epileptic network—random, long-range connections determine its chaotic behavior.
Initially, in Section 2, the basic concepts and simulation efforts concerning epileptic phenomena are discussed. Section 3 describes a novel nanoelectronic circuit element—the memristor, whose characteristics are utilized to serve as the coupling medium between the oscillators in a crossbar array configuration. The proposed Chua’s Circuit network configuration is described in Section 4. Section 5 presents the resolution of the proposed coupled oscillators system. Lastly, the results are discussed in Section 6, and Section 7 concludes the paper.

2. Epilepsy

Epilepsy is the most common and one of the oldest known chronic, neurological disorders occurring in humankind, and it is estimated that approximately 50 million people worldwide are affected [24]. Traditionally, epilepsy has been characterized as a disorder rather than a disease, in an effort to emphasize the various diseases and conditions that epilepsy involves. As reported in the 2005 Report on the Conceptual Definition of Seizure and Epilepsy [25], it is a brain disorder characterized by the occurrence of epileptic seizures and the neuronal, biological, cognitive, psychological, and social consequences that it causes for the patients. Diagnosing epilepsy in a patient requires the occurrence of at least one epileptic seizure in his lifetime. An epileptic seizure is defined as the transient occurrence of signs and/or symptoms caused by abnormally excessive or synchronous neuronal brain activity. Compared to healthy individuals, it has been demonstrated that the brains of epilepsy patients have a pathological tendency for seizures, described as a lower seizure threshold. It has to be noted that to diagnose a patient with epilepsy, the seizure must have been unprovoked, meaning that the seizure was not caused by an external, temporary, or reversible factor that affected the person at that point. Therefore, seizures resulting from incidents such as a concussions, fever, or alcohol-withdrawal effects can not be categorized by default as epileptic seizures without further, more in-depth research. These seizures are the results of malfunctions in the electrophysiological system of the brain, causing excessive electrical discharges by the affected brain cells (neurons).
Epilepsy is a chronic neurological disorder that is also characterized by recurring irregular seizures of varying complexity and chaos [20,21]. There are several compelling arguments concerning the occurrence of chaotic behavior in many biological systems, including the human brain [26,27,28,29]. The human brain, as a chaotic system, does not establish equilibrium after a transient time, but rather alternates between different states in which neural activity can shift from chaos to synchronization. A bifurcation occurs when the brain operates in a normal state (chaotic state) and suddenly experiences a seizure (synchronized state) [30,31]. A control parameter adjustment of a chaotic dynamical system may lead it to bifurcate to a synchronized state, and a further adjustment can restore the system back to chaos. Likewise, the healthy brain has chaotic activity, but epileptic seizures caused by excessive harmonic synchronization of vast neural populations can cause a hyper-synchronous state, leading the brain to bifurcate and switch from a chaotic (normal) to a synchronized (abnormal) state.

2.1. Previous Scientific Efforts

Researchers have long focused their interests on several aspects of epilepsy, starting with medical experts who work on recognizing its symptoms and diagnosing it [32,33] in order to understand its characteristics and help provide possible solutions and treatments. Accounting for epilepsy’s neurological nature, research around it has attracted the interest of non-medical scientists and experts as well. Their work focuses on developing novel techniques and technologies for clearer understanding, diagnosis, and treatment of epileptic seizures. One widely used test for the detection and analysis of epileptic seizures is the electroencephalogram (EEG). It is used for the measurement and recording of the brain’s electrical activity and helps determine the seizure type and epilepsy syndrome of patients, which, in turn, defines the appropriate course of treatment [34]. Efforts have been presented in the literature, such as the one in [35], for the improvement of EEG results and automation of the diagnosis and classification processes. Among the widely used techniques that have been explored and deliver promising results is the use of artificial neural networks to model epileptic behavior [21] and perform epilepsy detection [36]. The authors of [37] have also exploited memristors to propose a convolutional neural network capable of seizure detection and prediction. Classification of patients depending on their symptoms into one of the several forms of epilepsy to help choose the appropriate treatment using ANNs is described in [38], and it was implemented by using FPGA boards. Changes in bifurcation parameters are also detected in EEGs [39], and when abnormality or disease (e.g., epilepsy) is induced, chaotic features are retrieved [40]. Recently, epileptic mechanisms have been discovered and linked to many neurotransmitters, such as astrocytes, which have a range of complicated dynamical modes, including chaos and multistability, and can further modulate neuron models and circuits [22].
Other efforts include the utilization of nonlinear systems’ networks for the extraction of EEG features and their further analysis. The architecture of cellular automata was considered as a promising candidate for the simulation of epileptic brain activity in [41], which inspired the authors of [42] to later propose a circuit implementation of this system using memristive devices. Furthermore, cellular nonlinear networks, originally proposed by Chua in [43], are networks of locally coupled systems that interact and have been proven to be capable of universal and high-speed computing. They exhibit several nonlinear phenomena, such as wave propagation, oscillating or chaotic behavior, and partially differential equation solutions. The CNN’s promising characteristics have resulted in a plethora of publications in the literature that exploit this architecture for several aspects of research around epilepsy, such as the detection of patterns in long EEG recordings to enable the recognition of early signs of an epileptic seizure [44], improved analysis of EEG signals for feature extraction [45], and reproducibility of synchronization phenomena that characterize epileptic seizures [46]. Hardware implementations have also been proposed, such as the ones presented in [47], where FPGA boards were used for EEG signal processing using CNN.

2.2. Epilepsy Modeling with Coupled Oscillators

Taking into consideration all the above, it is clear that research around epilepsy is a continuously growing field that scientists from various fields choose to examine. Among the various paths presented, a network of oscillators whose spatial and temporal interactions result in the manifestation of epileptic seizures will be examined here. Oscillations are considered to be the hallmark of brain activity where, as described in [48], the brain regions are not considered to be isolated from each other. The interactions generate complex behaviors, and external stimuli can lead the system into oscillatory regimes, increasing its frequency compared to its quiescent state. Further studies presented in [49] have also concluded that the coordination of neuronal spiking relies heavily on brain oscillations for the functionalities of human cognition. To achieve this, the authors analyzed the temporal relationship between neuronal activity and brain oscillations to observe that specific phases of brain oscillations lead to increased neuronal activity. As stated by the authors of [50], advances in computation methods have facilitated the study of oscillatory behaviors and advances in EEG that have enabled recording signals from small brain regions that demonstrate oscillations, thereby spurring the interest of researchers toward human brain rhythms. The extensive research and the promising results that have been observed have therefore led to extended use of oscillatory networks as the means of mimicking, emulating, and evaluating several brain conditions.
This approach was presented in [51], where the authors described a review of the findings in computer modeling of epilepsy, which is considered as a pathological manifestation of a multistate network consisting of coupled oscillatory units. Although this is a simplification of the biological functionality of the brain, it helps to pave the way towards exploring and understanding the emergent phenomena that arise from the interaction of the coupled oscillators. A similar approach was also presented in [52], where a coupled oscillator model for epilepsy prediction simulated EEG-like signals to measure synchrony. A heterogeneously coupled oscillator model was also proposed in [53] as a means to reproduce the dynamic mechanisms of state transitions during an epileptic seizure. Two-dimensional equations capable of reproducing the transition between low and high amplitude oscillations were appropriately selected, so they provided evidence that epileptic dynamics are caused by the coupling of heterogeneous systems that can exhibit chaotic behavior.

3. Memristive Devices

3.1. Memristor Characteristics

The memristive device is a novel, two-terminal nanoelectronic device. Although it was theoretically postulated 50 years ago by circuit theorist L. Chua [54], advances in technology and materials that allowed the miniaturization of circuits and enabled the development of elements in nanoscale dimensions paved the way towards its practical realization. Its attractive characteristic is its ability to adjust its internal resistance state (called memristance) according to an external stimulus applied at its terminals and maintain this state when this stimulus is removed. The applied stimuli can be either voltage (voltage-controlled devices) or current (current-controlled devices). This stimulation is applied across the device’s terminals, usually referred to as the TOP terminal and the BOTTOM terminal. Depending on the device’s internal structure, its resistance state changes. In the most common case, when two distinct resistive states are possible, there is a high resistive state (HRS) and a low resistive state (LRS). The transition from HRS to LRS is called the SET process, and the contrary is called the RESET process. Devices are also being developed that are capable of storing more than two states, to enable multi-state storage, such as the ones presented in [55,56].

3.2. Memristive Devices: Fabrication and Modeling

A variety of devices have been fabricated and presented in the literature, initially from various research groups, and lately, memristive devices have also been industrially fabricated and sold by companies. Several different fabrication methods and switching mechanisms have been developed, resulting in memristive devices with varying characteristics and behaviors. Metal–insulator–metal (MIM) device structures have been widely developed. They use a large variety of materials to achieve the resistive switching mechanism. The insulator is usually an appropriately selected metal oxide that exhibits semiconductor properties. Commonly, MIM devices’ behavior is considered to consist of the formation and rupturing of conductive paths (called filaments) that connect the TOP and the BOTTOM terminals. When an appropriate stimulus is applied, the filament is constructed, thereby lowering its memristance and current flows across the device. When this stimulus is removed or its polarity changes, depending on the specific device’s functionality, the filament ruptures and the device’s memristance resets. The prevalent resistive switching mechanisms that govern the filament’s formation are the valence change memory (VCM) and the electrochemical metallization memory (ECM). The former depends on the induced anion migration inside the insulator layer, and the latter relies on the oxidation of an active metal electrode that produces cation migration within the insulator [57]. As described earlier, the SET and RESET processes can be induced in different ways, depending on the device’s physics. More specifically, in the case of voltage-controlled devices, in bipolar memristive devices, usually a positive applied voltage causes the SET process and a negative voltage resets the device’s memristance. This is not the case for unipolar memristive devices, where both the SET and RESET voltages have different absolute values but same polarities.
Therefore, it is evident that it is not easy to apply the same methods to simulate the behavior of all the available memristive devices. This explains the presence of various memristor models that have been developed in an effort to provide researchers with the appropriate tools to be able to use memristors when simulating circuits. These models are divided into two broad subcategories. The first type is the behavioral memristor models. As indicated by their name, these models simulate the behavior of a memristive device depending on the expected outcomes utilizing equations inspired by nature and natural processes, or the ideally expected outcomes. On the contrary, physics-based models are developed so as to accurately simulate memristive devices, according to corresponding physical phenomena that have been fabricated. These models are developed by analyzing the (electro)chemical properties of the selected materials and the resistive switching mechanism that governs their behavior. The model parameters and equations are properly adjusted to fit real data acquired by measurements from the fabricated devices.

3.3. Applications

In this work, memristors were selected to act as switching elements. We exploited one of the most promising memory architectures that is currently available, the crossbar architecture. Crossbars are arrays consisting of horizontal and vertical perpendicular metal wires that include a memristor at each intersection. This architecture offers a plethora of advantages and promising applications. Large arrays of 3D stacking techniques enable high-density storage and great parallelism, and could potentially eliminate the need for analog-to-digital or digital-to-analog (ADC/DAC) conversions during analog computing. Applying appropriate voltage pulses to a selected horizontal and vertical wire allows the programming of the device at their intersection, serving as a storage element. The information is stored in the form of a conductance value and can later be used to perform operations such as vector-matrix multiplication (VMM), a demanding but important computing task for traditional computing systems. This task takes advantage of Kirchhoff’s current law, computing the current at each column of the crossbar as the sum of the input voltage multiplied by the memristor’s conductance value [58]. Among the various applications where memristor crossbar arrays have been successfully utilized, artificial neural networks have proven to attract a lot of interest, such as deep neural networks in [59] and convolution neural networks in [60,61], just to name a few. Other applications that have benefited from the use of a memristive crossbar include, but are not limited to, the implementations of quantum algorithms in [62], image processing [63], and data storage [64].

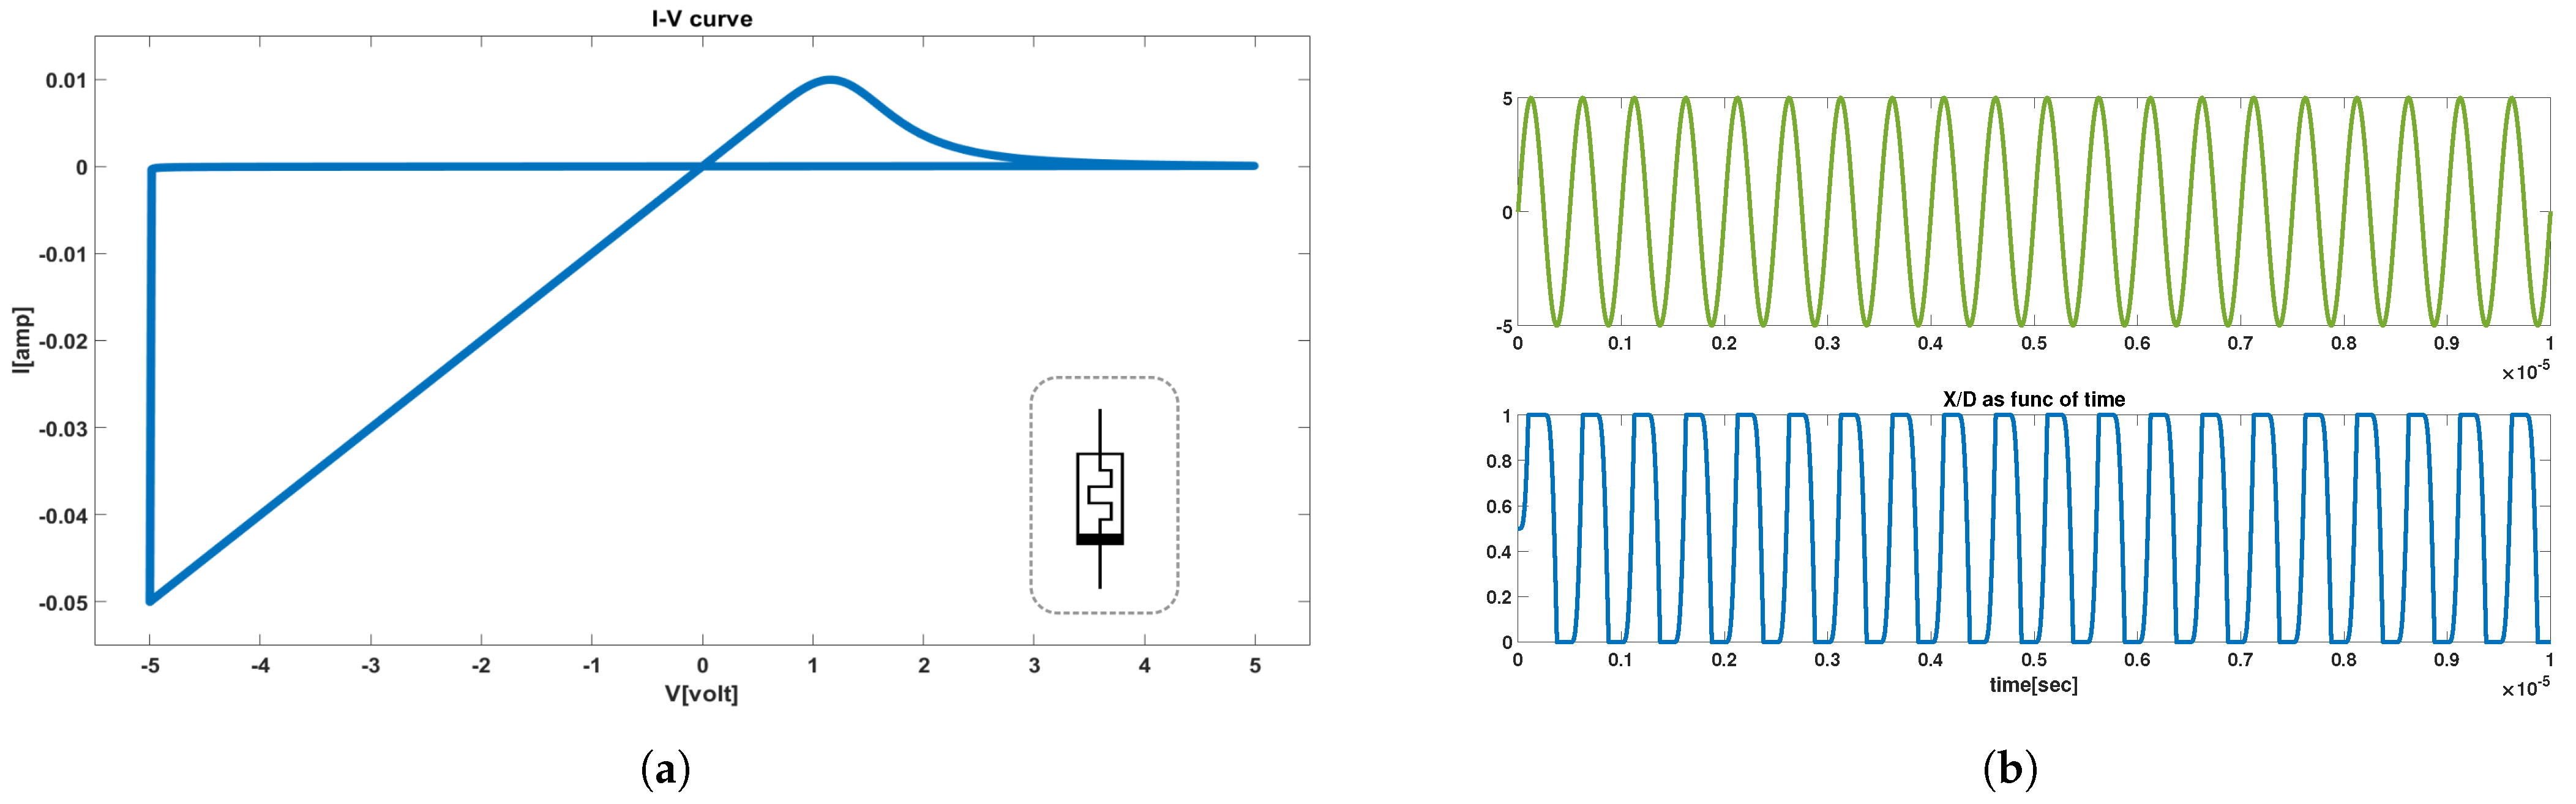
3.4. VTEAM Memristor Model

There is a wide variety of memristor models available in the literature, and circuit designers and theorists have to take their characteristics into consideration before choosing the optimal model for their application. The oscillators are coupled by connecting their X 1 and X 2 variables, which represent the voltages across the CC’s capacitors C 1 and C 2 , as shown in Figure 1, which correspond to the voltages at nodes V 1 and V 2 , respectively. Therefore, a voltage-controlled memristive device was selected for this application to enable the connectivity among the oscillators and to allow further research and extension of the currently proposed network in the direction of studying the network’s behavior when the connectivity among the CCs can be altered during the simulation or it can be affected by the CCs. A crossbar configuration was selected to act as the coupling medium among the CCs. The read and write processes were performed by applying appropriate voltage pulses across the desired memristor devices. Utilizing memristive devices with a threshold voltage resulted in a fixed voltage being applied across the device, and the RESET process was not affected by variations in the resistance, thereby avoiding performance and reliability issues.
Among them, a commonly used memristor model owing to its attractive characteristics of being a general, simple, and sufficiently accurate model, is the Voltage Threshold Adaptive Memristor Model (VTEAM Model) presented in [65]. This model has been developed based on the Threshold Adaptive Memristor Model (TEAM Model), as described in detail in [66], which has become quite popular due to the same characteristics. The difference between these two models lies in the switching behavior of the devices they describe. The TEAM model describes current-controlled memristors, and VTEAM describes the behavior of voltage-controlled devices. The VTEAM’s behavior is dependent on an expression of the internal state’s variable derivative, and its characteristic current–voltage relationship can be freely chosen to adapt to any current–voltage characteristics. This means that VTEAM is a general model whose inherent generality and robustness allow it to be properly adapted to numerous experimental data and model different fabricated devices. Due to the differences between the VTEAM and TEAM models, the VTEAM was selected to act as the coupling memristive device, as it fits the requirements more appropriately.
In this work, we explored the VTEAM’s ability to exhibit the necessary voltage threshold values and an appropriate R o n / R o f f ratio so that it can be used to construct the memristor crossbar array that was to serve as the coupling among the CCs. Figure 2a demonstrates the model’s I-V characteristic curve that corresponds to the selected parameters, whereas Figure 2b depicts the memristance changes of the device (bottom plot), in response to the voltage applied at its terminals (top plot).

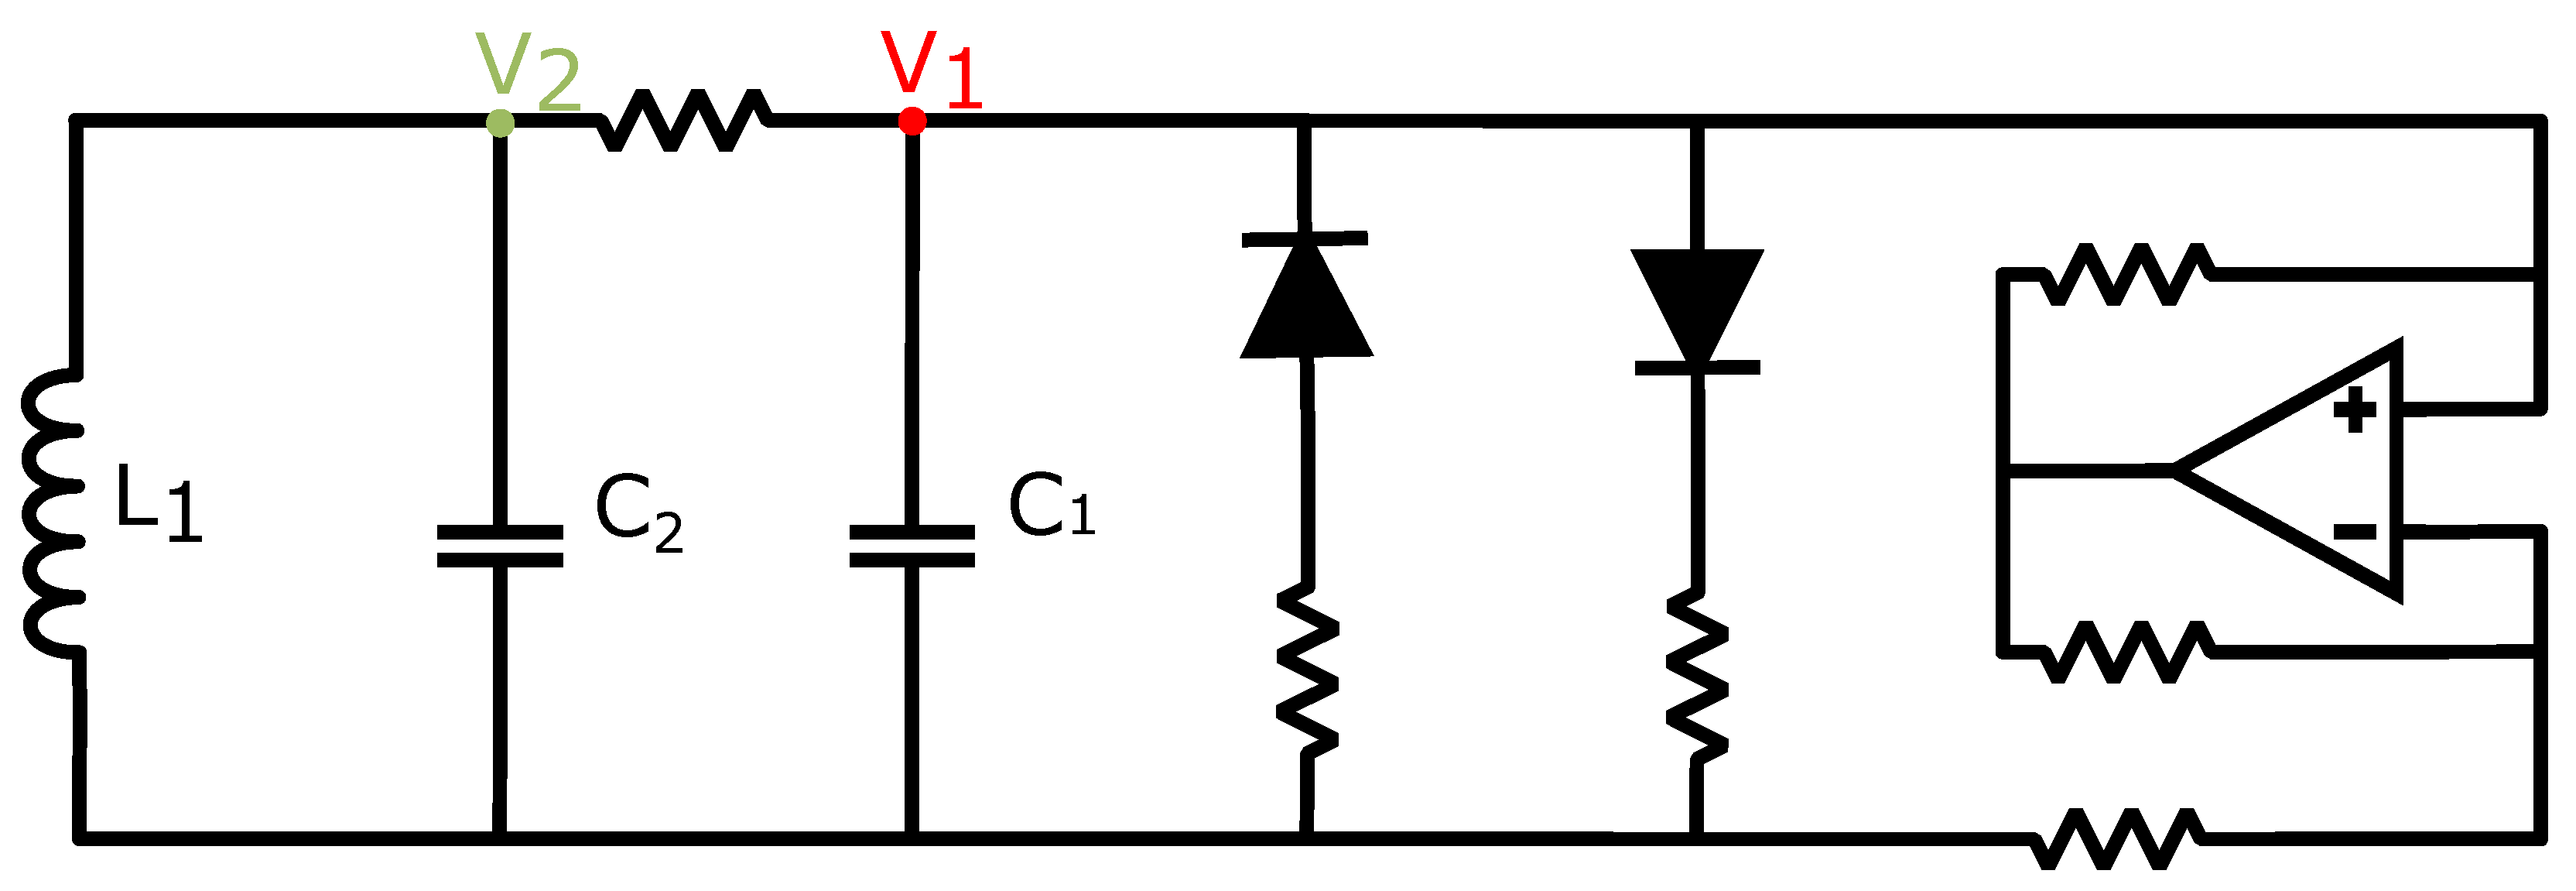
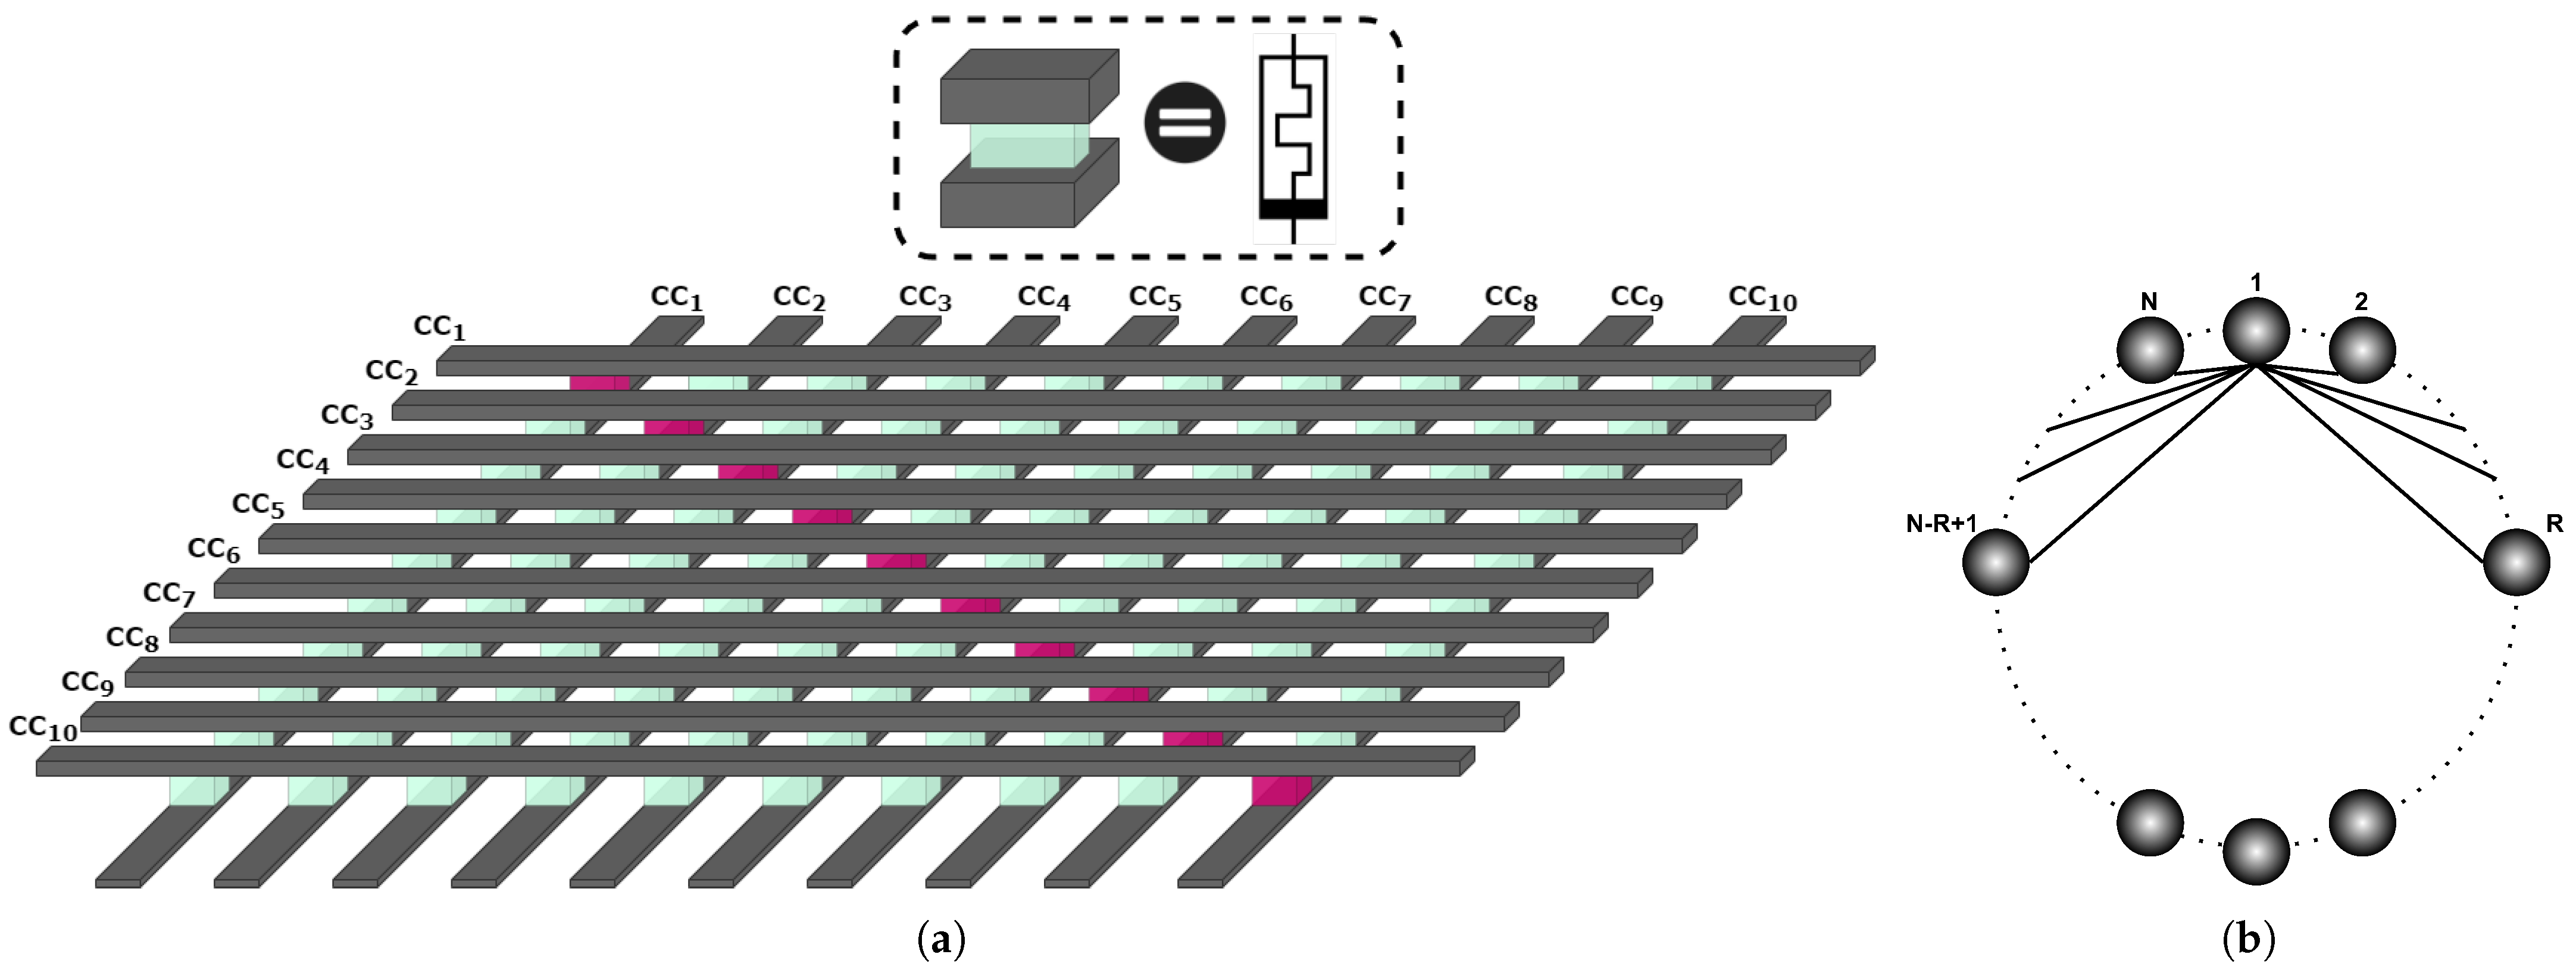
4. Proposed Coupled Chua’s Circuit Configuration

A ring-oriented network of N nonlinear chaotic oscillators with nonlocal topology, as shown in Figure 3b, was utilized as the proposed coupled Chua’s Circuit (CC) configuration. Each node of the proposed network was regarded as a CC chaotic oscillator connected to its R = ρ N nearest nodes from the left and right sides, where N is the number of CCs and ρ the percentage of the grid that forms the radius of the neighborhood, and its dynamics are given by the following dimensionless equations:
x ˙ 1 = α c x 2 x 1 f x 1 x ˙ 2 = x 1 x 2 + x 3 + I c x ˙ 3 = β c x 2 f ( x ) = B x + 1 2 ( A B ) ( | x + E | | x E | ) I c = k j C ( x 1 x 1 , j )
where x 1 = V 1 / E , x 2 = V 2 / E , x 3 = i L / ( R c h u a E ) are the normalized state variables [23], E is a threshold voltage of Chua’s Diode that functions as a positive or negative resistance, I c is the coupling current on X 2 state variable, and k = σ / 2 R = 2 R c h u a / R o n is the coupling coefficient that is adjusted by the C C ’s resistance R c h u a and the low resistance state of the memristor R o n . The parameters provided below are appropriate for setting the behavior of the attractor in the double-scroll chaotic domain: α c = 9.4 , β c = 14.28   A = 1.143 , B = 0.714 , and E = 0.2   V .
A crossbar architecture was realized as a coupling medium between C C oscillators by using two perpendicular groups of parallel nanowires, denoted as columns and rows, that coupled C C oscillators through crosspoints located symmetrically with respect to the diagonal of the crossbar array, under which memristor devices were placed, and column/row nanowires correspond accordingly to top/bottom electrodes. Figure 3a shows a basic illustration of the connectivity between 10 C C oscillators using the memristor crossbar. The memristor devices placed in the diagonal of the crossbar array (purple memristors) were considered as short circuits because both their top and bottom electrodes were connected to the same state variable, whereas the other memristor devices could be programmed to describe the network topology shown in Figure 3b. Anti-parallel coupling between pairs of C C oscillators can be represented by pairs of operational memristors symmetrically placed on the diagonal.
The network’s synchronization was measured by using the time-dependent Kuramoto order parameter R s y n introduced in [67], which is computed by the following equation:
R s y n = 1 N j = 1 N e i 2 π Φ j ( t )
where N is the total number of CC oscillators. R ( t ) is bounded in the range of [ 0 , 1 ] and obtained by computing the phases of oscillators Φ j ( t ) considering the positive zero-crossings of X 2 state variable as the CCs period of oscillation.

5. Resolution of the Coupled Oscillators Model

Two distinct configurations were examined in order to evaluate the behavior of the coupled oscillators model and observed the formation of phase synchronization phenomena. N total CCs were simulated using the normalized equations provided in Section 4, and their coupling was realized by employing the elements of a connectivity matrix, which correspond to the memristive crossbar configuration. Simulating the state variables’ evolution of CCs’ requires the modeling of all the conceivable connections between them. The available connections in the case of N N CCs are N × N ; therefore, the size of the connectivity matrix is N × N . Furthermore, the coupling strength of the connections must be considered in order to investigate its significance in the emergence of the synchronization phenomena. A 1 D ring network of N coupled CCs using a memristive crossbar emulates epileptic brain activity. More specifically, two cases will be considered, the healthy state and the epileptic state.
Each CC in the healthy state is connected with neighboring CCs in a radius of R N around it. These connections are regular, and there are no unwanted longer-range connections in the network. As a result, the connectivity matrix A h used in the simulations is a diagonal matrix with non-zero elements in a R radius around the central diagonal, indicating the presence of a connection among the CCs; otherwise, no connection exists and the element’s value is zero. For the ring-based topology of the coupled oscillators’ network, the periodic boundary conditions were set to mimic a large (infinite) system. This design enabled us to observe that synchronization of oscillators demands a larger radius of coupled CCs or increased coupling strength between them. Lower values of these two parameters sustain the oscillators’ chaotic behavior.
The network of N CCs was also simulated, considering irregularities in its spatial connections, with the same coupling strength among the CCs and given the same initial conditions. More specifically, emulating the epileptic brain activity entailed introducing anomalies in CCs connectivity, such as long-range connections between CCs that are not coupled during the healthy state. Connections between neurons can be lost or generated as a result of malfunctions and unknown environmental or biological factors. Here, we examine the case where, due to some irregularities, certain neurons (here represented as CCs) are no longer connected only with their neighbors in radius R, but also with random connections with more distant CCs. To achieve this, we introduced an updated connectivity matrix A e , which includes the elements of A h and elements indicating the presence of the irregular connections under the same conditions and using the same representation (1 for coupled CCs and 0 for uncoupled). The goal was to determine how the coupling irregularities affect the chaotic synchronization of the oscillators. Under the same conditions, the onset of epileptic activity, consisting of CCs chaotic synchronization, is evident from the healthy and epileptic grids.

6. Results and Discussion

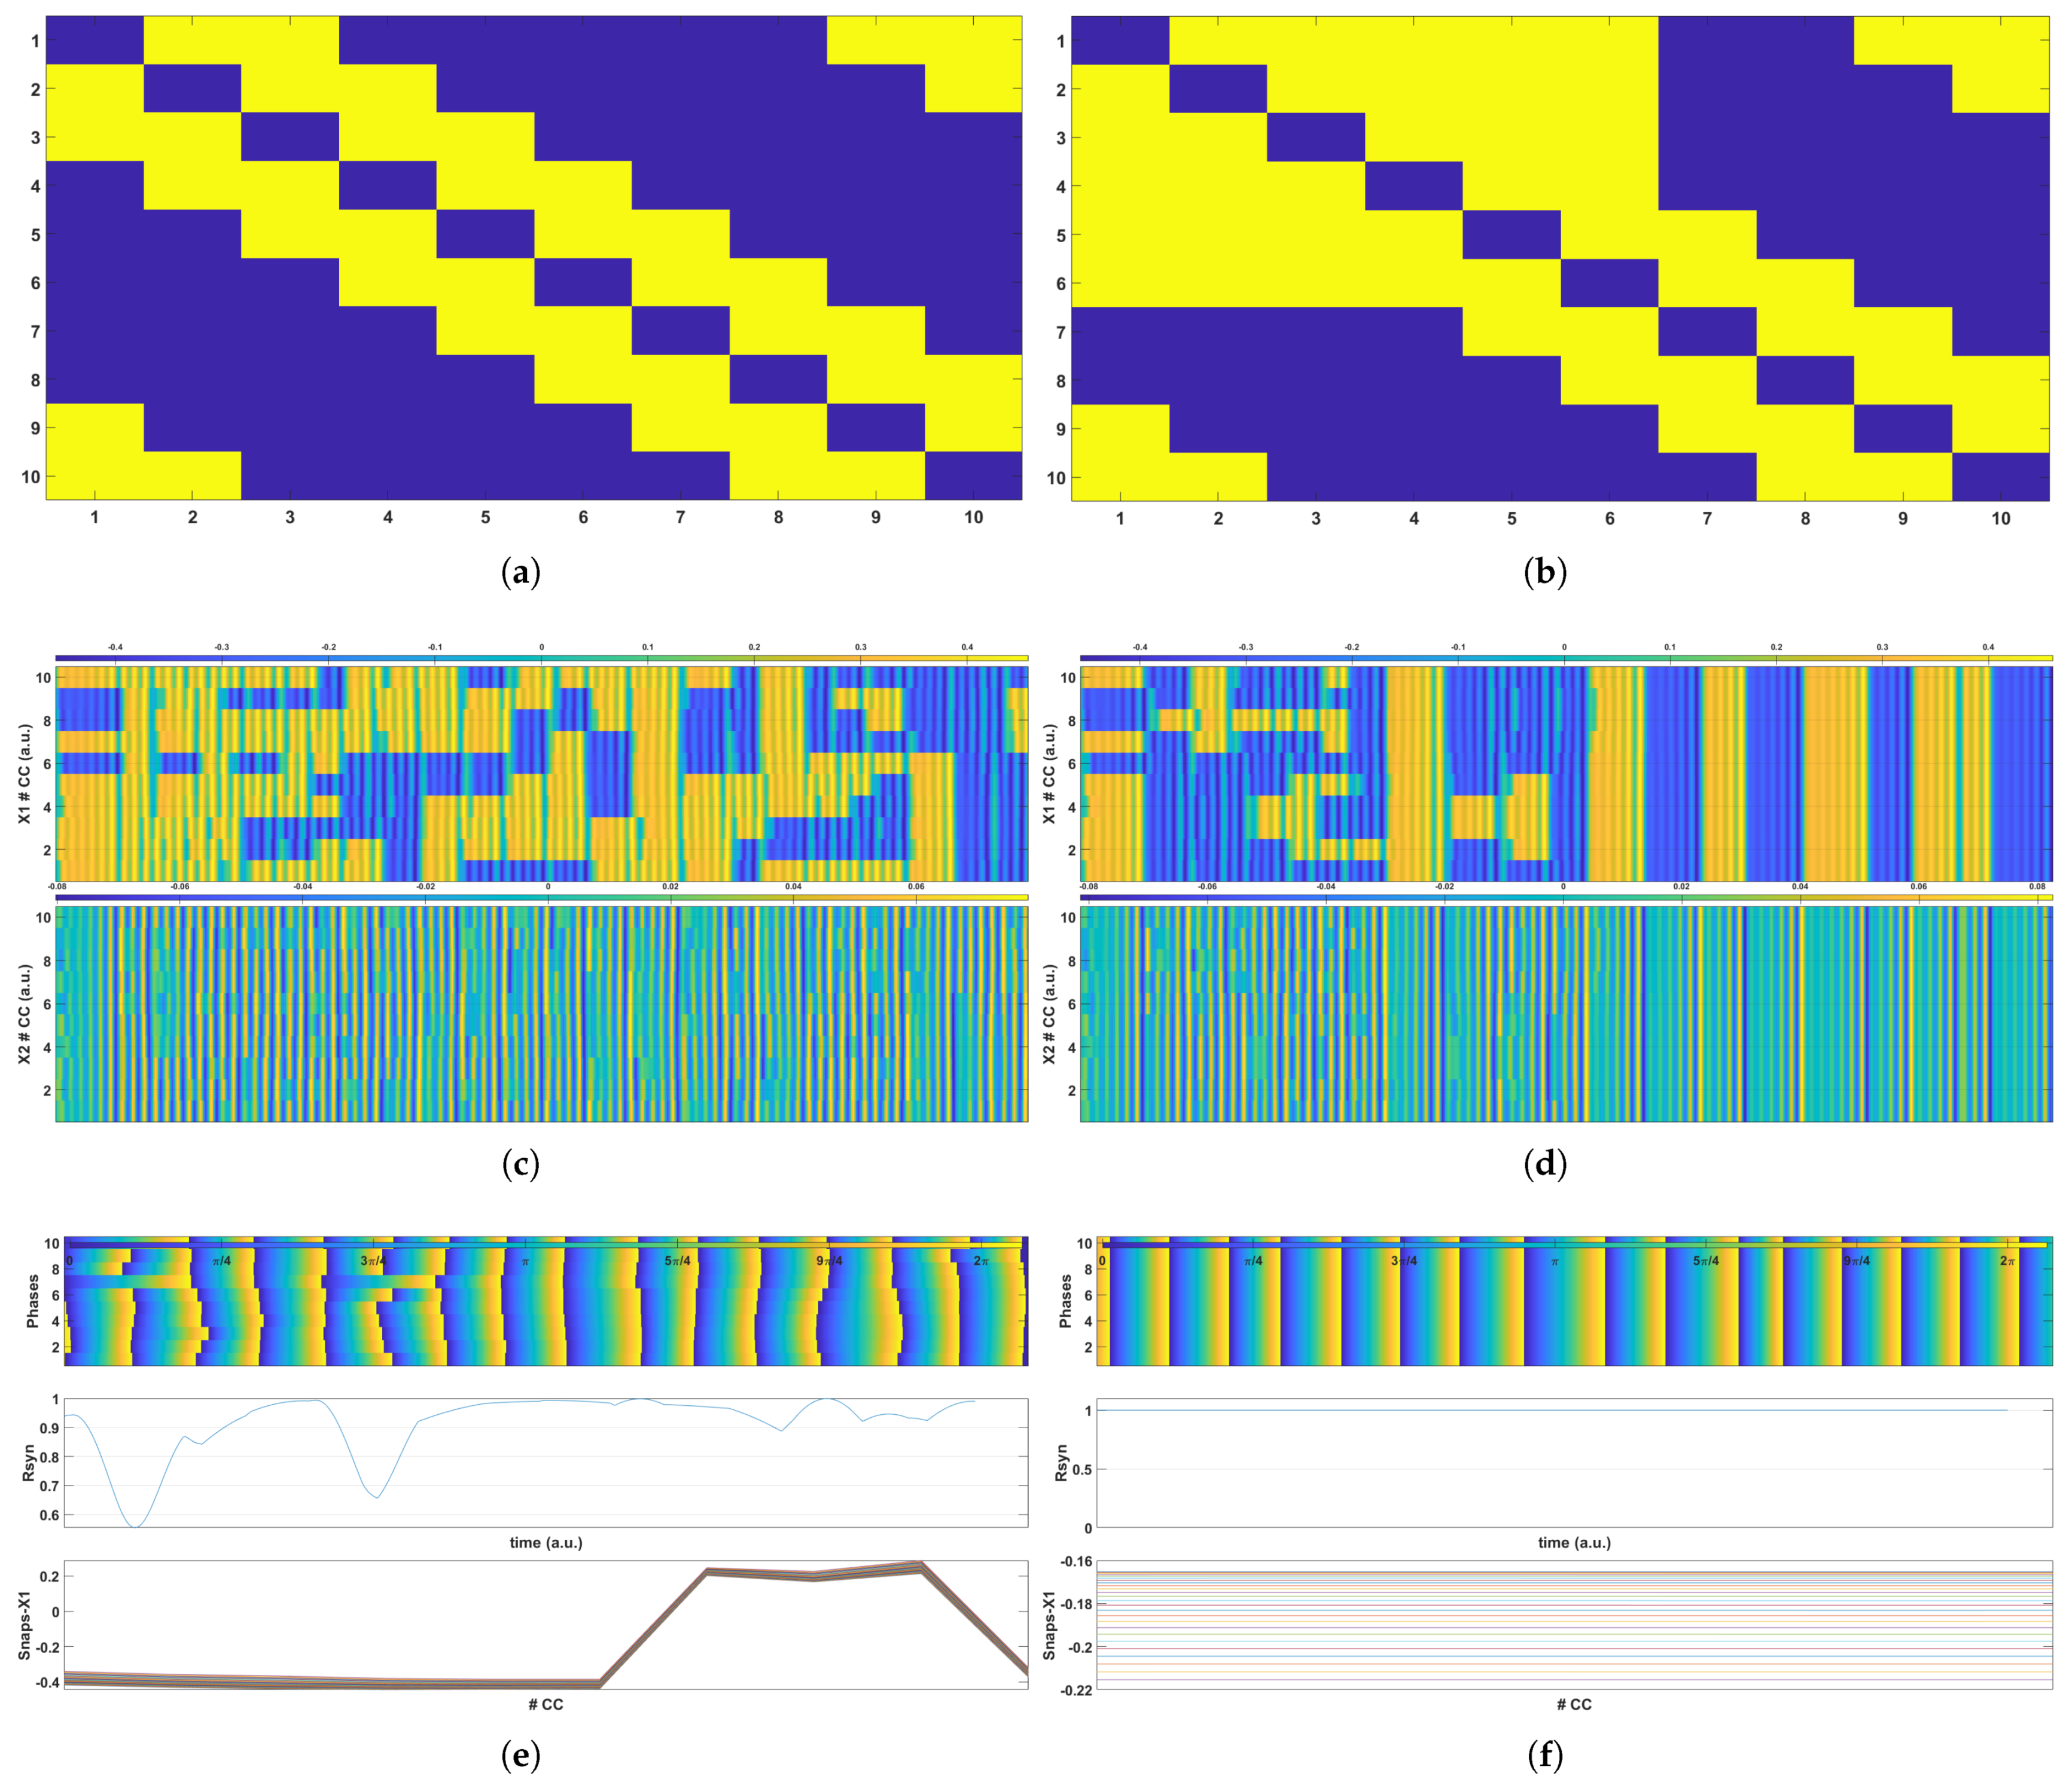
6.1. 10 Chua’s Circuits Network Example

To exemplify our approach, the behavior of a small network comprised of 10 CCs is initially presented by utilizing a 10 × 10 crossbar array as the connectivity between the CCs. More specifically, Figure 4a presents the connectivity matrix A h for the simulation of the healthy state, whereas Figure 4b shows the matrix A e , which represents the presence of irregularities in the CCs’ connectivity.
In the case presented here, the coupling radius was set to r = 0.2 , which means that each CC was coupled with 2 neighboring CCs on its left and 2 on its right side; the coupling strength was set to c s = 1.68 in both cases. The yellow elements of both matrices correspond to coupled CCs, whereas the blue elements represent uncoupled CCs. Both matrices are symmetric, which means that the connections among the CCs are anti-parallel and bidirectional, indicating that the coupling between the ith CC and jth CC, where 1 i , j 10 , allows them to affect each other’s behavior. The main diagonal elements were considered as short-circuits and were adjusted to blue in all cases, indicating the non-existence of self-feedback on each CC. Furthermore, as mentioned in Section 5, the CC network topology was a ring, as shown by matrices A h and A e . In the case of the epileptic network, the connections remained the same, as illustrated in Figure 4b, since the same coupling radius was used. The difference was that this network also included unwanted connections among the CCs in order to study the network’s phase synchronization. In the example provided here, elements ( 4 , 1 ) & ( 1 , 4 ) , ( 5 , 1 ) & ( 1 , 5 ) , ( 6 , 1 ) & ( 1 , 6 ) , ( 5 , 2 ) & ( 2 , 5 ) , ( 6 , 2 ) & ( 2 , 6 ) and ( 6 , 3 ) & ( 3 , 6 ) are highlighted in yellow, indicating that the 4th CC was also connected to the 1st CC; the 5th CC was also connected to the 1st and 2nd CCs; and the 6th CC was also connected to the 1st, 2nd, and 3rd CCs, which were not included in their r = 2 radius.
The results obtained for the simulation of both grids are presented in Figure 4c through Figure 4f. Figure 4c,d show the time evolution of the voltage at nodes X 1 (top plot) and X 2 (bottom plot) over the entire simulation duration, respectively. Darker shades (blue) correspond to lower negative X 1 and X 2 voltage levels, and lighter shades (yellow) to higher positive voltages. When Figure 4c,d are compared, it is evident that chaotic phase synchronization develops in the case of an epileptic network. This indicates the network’s vulnerability to epileptic seizures due to increased coupling among the CCs, since in the healthy network, the CCs’ time evolution remained unsynced, but in the epileptic network, the oscillators were abruptly synchronized. This synchronization is visible in both plots for X 1 and X 2 state variables, for which it is necessary to compare the respective values of X 1 and X 2 by taking horizontal frames of these two plots: observe that the color shades remain the same in the epileptic network (indicating synchronization), but this is not the case in the healthy network.
Lastly, Figure 4e,f demonstrate three different plots that provide evidence of the onset of epileptic events in the case of abnormalities. The top sub-figures of Figure 4e,f present the time evolution of each CC’s phase in the network. The X 2 state variable’s positive crossings are regarded as the oscillation periods of all CCs; hence, this is how each CC’s phase variables were derived. This variable determines whether or not all of the oscillators evolve in-sync. As is obvious, the emergence of the epileptic phenomena in the A e network is depicted in a comparable manner as the top plot of Figure 4c,d, where synchronization appears as identical colors of the variable in distinct horizontal frames of the plot. The R s y n index for each grid is an indicator metric of the degree of system synchrony and is shown at the center plot of Figure 4e,f. When the value of R s y n is computed to be maximal, and hence equal to 1, the system is under full chaotic synchronization, whereas the oscillators remained unsynced in all other cases ( R s y n < 1 ). As seen in Figure 4e,f, the healthy network’s index varied during the simulation period and did not settle on 1, but in the case of the epileptic behavior, the R s y n was permanently equal to 1. The bottom sub-figure shows 25 snapshots of voltage values at node X 1 at specific times for all CCs. This behavior is shown as a flat line, indicating that all of the oscillators’ X 1 voltage values were equal at that specific period. In the case of the healthy network, however, these snapshots clearly demonstrate that the X 1 variable had a different value for each CC at the same time, indicating that no chaotic synchronization was formed.

6.2. 300-Chua-Circuit Network Example

The results of the simulation of 300 CC grids are presented and discussed in this subsection. More specifically, two different cases are presented, in which the formation of epileptic states is evident as a result of the increased coupling among CCs in comparison to the healthy state. These two cases were created by varying the coupling radius and the coupling strength parameters; thus, the incidence of epileptic coupling differed in each case. In both cases, the synchronization of the oscillatory units was evident after the initiation phase in the case of the epileptic coupling, but the healthy grid remained chaotic, and no epileptic states arose. Following the 10-CCs example, Figure 5 and Figure 6 show the findings for two alternative cases of a 300-CC network. In both cases, Figure 5a and Figure 6a present the connectivity matrix A h for the healthy network structure, and Figure 5b and Figure 6b present the epileptic connectivity matrix A e , which includes the random, long-range connections that cause epileptic phenomena to emerge. For the case presented in Figure 5, the connectivity radius was set to r = 0.25 , which means that each CC was connected to R = 0.25 × 300 = 75 adjacent CCs on each side, with the coupling strength of c s = 1.72 . Additionally, the random connections in the epileptic connectivity matrix A e were constrained to a region around the central CC (150th) that spanned from the 105th CC ( 35 % of the entire grid) to the 195th CC ( 65 % of the entire grid). The results presented in Figure 6 examine the case of radius r = 0.3 , which corresponds to R = 0.3 × 300 = 90 coupled CCs on each side and coupling strength c s = 1.25 . The epileptic network’s random connections were constrained in this case to a region around the central CC (150th) that spanned from the 105th CC ( 35 % of the entire grid) to the 195th CC ( 65 % of the entire grid). Following the detailed example discussed in Section 6.1, the respective results for these two cases are presented in Figure 5 and Figure 6, showing that the epileptic network is driven to synchronization due to the configuration of the unwanted connections. It is evident in both examples that the emergence of synchronization phenomena can be observed through the comparison of the respective Figures, following the example of Figure 4. In the cases of an epileptic network, X 1 , X 2 , and the phases of all the CCs appear synchronized after a certain time, whereas in the healthy network, no synchronization occurs. This can also be verified by observing the time evolution of the R s y n metric and the snapshots of the X 1 variable.

6.3. Comparison Results

In this subsection, we present a comparison between two epileptic scenarios using both the number of irregularities and their ranges adjusted by the memristor crossbar as bifurcation parameters of the CC network. More specifically, Figure 7a,b present the time evolution of the R s y n metric to demonstrate the synchronization of various epileptic networks. The number of oscillators was stable and equal to 300 for all four cases considered in Figures, and the coupling radius was fixed to r = 0.3 for both scenarios. In the case of the epileptic networks, as seen in the preceding examples, a region of the oscillatory units network was selected as being prone to irregularities. These irregularities were interpreted by the presence of long-range connections of the cells in the affected region.
In the first scenario, as shown in Figure 7a,b, we had constant coupling parameters, r = 0.3 and c s = { 1.1 , 1.4 } ; and a variable number of irregularities in a constant range of the CC network. In particular, the corresponding number of affected connections was randomly generated by using a corresponding function as a fixed threshold variable that determined if the connections would be active or not. Four cases are presented for different values of this threshold variable that directly affected the number of irregularities in the specific affected range. According to Figure 7, for a fixed network, lower threshold values are more prone to cause chaotic synchronization, whereas higher threshold values have a less significant impact.
Figure 8 demonstrates the second scenario in which the time evolution of the R s y n metric of three different cases by varying the range of the irregularity area is presented. More specifically, the synchronization phenomena are more likely to occur as the range of the irregularity area increases. This is shown by the R s y n metric reaching the value of 1, indicating the emergence of synchronization. Three irregularity ranges are considered: 35–65%, 30–70%, and 25–75%. This translates to the available area surrounding the center CC (150th in this case), where long-range connections can appear. For these cases, the coupling strength was fixed to c s = 1.8 , and the threshold, which was selected as a variable in the first epileptic scenario, was equal to 0.5 .
Finally, Figure 9 presents the mean R s y n ranges obtained for 10 different random initial condition sets over a sufficient simulation period of 10 5 seconds. This comparison was used to demonstrate that the proposed configuration is immune to the networks’ initial conditions and chaotic synchronization can emerge under various properly adjusted memristor crossbar-diseased connectivities. A network of 300 CCs was deployed in both scenarios. Figure 9a shows to the mean values of R s y n for 11 cases of irregularity radius, displayed in increasing order, beginning with the irregular range of 45–55% around the center CC where irregularities can exist, with a step of 2 % up to the range of 25–75%. The threshold for determining an irregularity was set to 0.5 , and the coupling strength was set to c s = 1.75 . Similarly to the results in Figure 8, the value of the R s y n metric increases with increasing radius, regardless of the initial conditions. For each individual irregular radius value, the mean value of R s y n of 10 simulations with varied initial conditions is provided in this Figure, and the bars correspond to the minimum and maximum R s y n values determined in each case. The findings obtained in the scenario of a varying threshold, as described in Figure 7, are shown in Figure 9b. The irregularity radius was set to 25–75% range and the coupling strength is set at c s = 1.60 . The threshold values started from 0.2 and increased in 0.1 steps up to the value of 0.8 . It is also evident that when the threshold is raised, the mean R s y n value decreases, as the network becomes less irregular.
Our findings indicate that, while an increasing number of irregularities in the chaotic network causes full chaotic synchronization, when we have a fixed number of irregularities and a variable irregular range, the more we increase it, the more synchronization emerges, implying that global irregularities drive the network to synchronization more easily than local irregularities.

6.4. Comparison with Existing Works in the Literature

Several other efforts have been presented in the literature, aiming to exploit oscillatory units for the research towards understanding, modeling, and analyzing epileptic phenomena. Synchronization patterns that were generated in a network of coupled FitzHugh–Nagumo oscillators were studied in [68]. Several network structures were examined to compare the resulting oscillatory dynamics and conclude on which topology favors the characteristics of seizure-like synchronization phenomena. A small-world network with an intermediate rewiring probability that is balanced between randomness and regularity features was observed to deliver the optimal results. This work offers an extensive search of topologies that could be exploited in our research as well, in order to observe the differences in the utilization of different oscillatory systems. Utilizing a more simple oscillatory unit, such as Chua’s Circuit, would enable an easier circuit implementation of the described network. Rössler-like oscillators were selected in [69], whose parameters were appropriately selected to be in the chaotic regime. Diffusive coupling among the oscillators was realized so as to observe the synchronization patterns that emerged. The inclusion of internal feedback in the proposed networks led to the conclusion that they share many similarities with epileptic brain activity due to the network de-tuning caused by a pathological or environmental factor. Lastly, the Morris–Lecar model, which is capable of reproducing limit cycle oscillations for different parameter values, was explored in [70] in order to model a specific region of the hippocampus where the epileptic focus is usually located. The authors worked towards identifying a parameter whose abnormal alternation within the healthy tissue allows the spread of the seizure from the affected area to the whole brain. To make this observation, the aforementioned model was simulated using its mathematical description to study the system’s response to varying speeds and the ease of communication among neurons.
In comparison to previous works, our goal was to utilize the simplest known oscillatory unit capable of reproducing chaotic dynamics while also being easily implemented in hardware. Furthermore, our approach consisted of considering that networks of coupled oscillators are capable of emergent epileptic activity, and we aimed to compare the same network’s behavior during healthy and epileptic activities. Observing the degree of influence that even small perturbations of the brain’s topology and coupling can have on the emergence of synchronization phenomena was our main goal, rather than extensively searching for topologies and appropriate couplings.

7. Conclusions and Future Work

The emulation and modeling of epileptic seizures in networks of coupled oscillators considered as neurons, utilizing the promising capabilities of memristor crossbar arrays, were presented in this work. The behavior of large oscillator networks and the difference between healthy (symmetrical coupling) and epileptic (existence of random, long-range coupling) networks are presented. Our findings suggest that epileptic states can emerge by introducing long-range random connections in specific networks of CC oscillators under the same coupling radius and coupling strength. A variety of oscillatory network cases were simulated for different network sizes, coupling radii, and strengths, and it has been observed that, while considering all the coupling parameters stable, abnormal (epileptic) phenomena are more likely to emerge in an unhealthy network compared to its equivalent symmetrically coupled one. This conclusion was further verified by demonstrating different cases of parameter evolution analysis where the R s y n metric’s variations were monitored. While considering all the network’s characteristics to remain stable, we varied the irregularity determination threshold (case 1) and the irregularity existence area (case 2), and calculated the R s y n metric’s mean value for different initial conditions to further prove our initial hypothesis (case 3). From all the aforementioned results, we concluded that increasing the determination threshold or the irregularity area results in an increase in the synchronization of the oscillators, thereby making it more likely to cause the emergence of epileptic phenomena. This behavior remains unaffected by the initial conditions of the oscillatory units.
Exploring the network’s behavior for a wider variety of cases (e.g., loss of connections or various abnormalities in the connectivity matrix) as part of our future work is a promising direction. Furthermore, the proposed architecture’s circuit design could lead to the similar hardware implementations of the proposed system [23] in order to confirm the emergent epileptic states by taking the respective measurements. Lastly, more research should be realized to explore the crossbar’s effect on the system and experiment with its characteristics in order to enrich the proposed circuit’s capabilities.

Author Contributions

Conceptualization, R.-E.K., K.-A.T., and G.C.S.; methodology, R.-E.K., K.-A.T., and G.C.S.; software, R.-E.K., K.-A.T., and G.C.S.; validation, R.-E.K., K.-A.T., and G.C.S.; formal analysis, R.-E.K., K.-A.T., and G.C.S.; investigation, R.-E.K., K.-A.T., and G.C.S.; resources, R.-E.K., K.-A.T., and G.C.S.; data curation, R.-E.K., K.-A.T., and G.C.S.; writing—original draft preparation, R.-E.K., K.-A.T., and G.C.S.; writing—review and editing, R.-E.K., K.-A.T., and G.C.S.; visualization, R.-E.K., K.-A.T., and G.C.S.; supervision, G.C.S.; project administration, R.-E.K., K.-A.T., and G.C.S.; funding acquisition, R.-E.K., K.-A.T., and G.C.S. All authors have read and agreed to the published version of the manuscript.

Funding

The research of Rafailia-Eleni Karamani was supported by the Hellenic Foundation for Research and Innovation (HFRI) under the HFRI PhD Fellowship grant (Fellowship Number: 1333).

Conflicts of Interest

The authors declare no conflict of interest.

Abbreviations

The following abbreviations are used in this manuscript:
CCChua’s Circuit
ANNArtificial Neural Networks
CNNCellular Nonlinear Networks
ECMElectrochemical Metallization Memory
VCMValence Change Memory
FPGAField Programmable Gate Arrays

References

  1. Gambuzza, L.V.; Buscarino, A.; Fortuna, L.; Frasca, M. Memristor-based adaptive coupling for consensus and synchronization. IEEE Trans. Circuits Syst. I Regul. Pap. 2015, 62, 1175–1184. [Google Scholar] [CrossRef]
  2. Gambuzza, L.V.; Frasca, M.; Fortuna, L.; Ntinas, V.; Vourkas, I.; Sirakoulis, G.C. Memristor crossbar for adaptive synchronization. IEEE Trans. Circuits Syst. I Regul. Pap. 2017, 64, 2124–2133. [Google Scholar] [CrossRef]
  3. Shepelev, I.A.; Bukh, A.V.; Strelkova, G.I.; Vadivasova, T.E.; Anishchenko, V.S. Chimera states in ensembles of bistable elements with regular and chaotic dynamics. Nonlinear Dyn. 2017, 90, 2317–2330. [Google Scholar] [CrossRef]
  4. Muni, S.S.; Provata, A. Chimera states in ring—Star network of Chua circuits. Nonlinear Dyn. 2020, 101, 2509–2521. [Google Scholar] [CrossRef]
  5. Bargmann, C.I.; Newsome, W.T. The brain research through advancing innovative neurotechnologies (BRAIN) initiative and neurology. JAMA Neurol. 2014, 71, 675–676. [Google Scholar] [CrossRef] [PubMed] [Green Version]
  6. Amunts, K.; Ebell, C.; Muller, J.; Telefont, M.; Knoll, A.; Lippert, T. The human brain project: Creating a European research infrastructure to decode the human brain. Neuron 2016, 92, 574–581. [Google Scholar] [CrossRef] [Green Version]
  7. Okano, H. Brain Mapping by Integrated Neurotechnologies for Disease Studies. Nat. Neurosci. 2016, 19, 1121. [Google Scholar]
  8. Lin, H.; Wang, C.; Yao, W.; Tan, Y. Chaotic dynamics in a neural network with different types of external stimuli. Commun. Nonlinear Sci. Numer. Simul. 2020, 90, 105390. [Google Scholar] [CrossRef]
  9. Lin, H.; Wang, C.; Deng, Q.; Xu, C.; Deng, Z.; Zhou, C. Review on chaotic dynamics of memristive neuron and neural network. Nonlinear Dyn. 2021, 106, 959–973. [Google Scholar] [CrossRef]
  10. Muscinelli, S.P.; Gerstner, W.; Schwalger, T. How single neuron properties shape chaotic dynamics and signal transmission in random neural networks. PLoS Comput. Biol. 2019, 15, e1007122. [Google Scholar] [CrossRef]
  11. Schreiner, J.; Mardal, K.A. Simulating epileptic seizures using the bidomain model. Sci. Rep. 2022, 12, 10065. [Google Scholar] [CrossRef] [PubMed]
  12. Da Silva, F.L.; Blanes, W.; Kalitzin, S.N.; Parra, J.; Suffczynski, P.; Velis, D.N. Epilepsies as dynamical diseases of brain systems: Basic models of the transition between normal and epileptic activity. Epilepsia 2003, 44, 72–83. [Google Scholar] [CrossRef] [PubMed]
  13. Majhi, S.; Bera, B.K.; Ghosh, D.; Perc, M. Chimera states in neuronal networks: A review. Phys. Life Rev. 2019, 28, 100–121. [Google Scholar] [CrossRef] [PubMed]
  14. Aihara, K.; Takabe, T.; Toyoda, M. Chaotic neural networks. Phys. Lett. A 1990, 144, 333–340. [Google Scholar] [CrossRef]
  15. Korn, H.; Faure, P. Is there chaos in the brain? II. Experimental evidence and related models. Comptes Rendus Biol. 2003, 326, 787–840. [Google Scholar] [CrossRef]
  16. FitzHugh, R. Mathematical models of excitation and propagation in nerve. Biol. Eng. 1969, 1–85. [Google Scholar]
  17. Izhikevich, E.M. Dynamical Systems in Neuroscience; MIT Press: Cambridge, MA, USA, 2007. [Google Scholar]
  18. Shuai, J.W.; Durand, D.M. Phase synchronization in two coupled chaotic neurons. Phys. Lett. A 1999, 264, 289–297. [Google Scholar] [CrossRef]
  19. Elson, R.C.; Selverston, A.I.; Huerta, R.; Rulkov, N.F.; Rabinovich, M.I.; Abarbanel, H.D. Synchronous behavior of two coupled biological neurons. Phys. Rev. Lett. 1998, 81, 5692. [Google Scholar] [CrossRef] [Green Version]
  20. Panahi, S.; Shirzadian, T.; Jalili, M.; Jafari, S. A new chaotic network model for epilepsy. Appl. Math. Comput. 2019, 346, 395–407. [Google Scholar] [CrossRef]
  21. Panahi, S.; Aram, Z.; Jafari, S.; Ma, J.; Sprott, J. Modeling of epilepsy based on chaotic artificial neural network. Chaos Solitons Fractals 2017, 105, 150–156. [Google Scholar] [CrossRef]
  22. Pankratova, E.V.; Sinitsina, M.S.; Gordleeva, S.; Kazantsev, V.B. Bistability and Chaos Emergence in Spontaneous Dynamics of Astrocytic Calcium Concentration. Mathematics 2022, 10, 1337. [Google Scholar] [CrossRef]
  23. Tsakalos, K.A.; Ntinas, V.; Karamani, R.E.; Fyrigos, I.A.; Chatzinikolaou, T.P.; Vasileiadis, N.; Dimitrakis, P.; Provata, A.; Sirakoulis, G.C. Emergence of Chimera States with Re-programmable Memristor Crossbar Arrays. In Proceedings of the 2021 IEEE International Symposium on Circuits and Systems (ISCAS), Daegu, Republic of Korea, 22–28 May 2021; pp. 1–5. [Google Scholar]
  24. Banerjee, P.N.; Filippi, D.; Hauser, W.A. The descriptive epidemiology of epilepsy—A review. Epilepsy Res. 2009, 85, 31–45. [Google Scholar] [CrossRef] [PubMed]
  25. Fisher, R.S.; Acevedo, C.; Arzimanoglou, A.; Bogacz, A.; Cross, J.H.; Elger, C.E.; Engel, J., Jr.; Forsgren, L.; French, J.A.; Glynn, M.; et al. ILAE official report: A practical clinical definition of epilepsy. Epilepsia 2014, 55, 475–482. [Google Scholar] [CrossRef] [Green Version]
  26. Hodgkin, A.L.; Huxley, A.F. A quantitative description of membrane current and its application to conduction and excitation in nerve. J. Physiol. 1952, 117, 500. [Google Scholar] [CrossRef] [PubMed]
  27. Başar, E. Chaos in Brain Function: Containing Original Chapters by E. Basar and TH Bullock and Topical Articles Reprinted from the Springer Series in Brain Dynamics; Springer Science & Business Media: Berlin/Heidelberg, Germany, 2012. [Google Scholar]
  28. van Straaten, E.C.; Stam, C.J. Structure out of chaos: Functional brain network analysis with EEG, MEG, and functional MRI. Eur. Neuropsychopharmacol. 2013, 23, 7–18. [Google Scholar] [CrossRef] [Green Version]
  29. Díaz, M.H.; Córdova, F.M.; Cañete, L.; Palominos, F.; Cifuentes, F.; Sánchez, C.; Herrera, M. Order and chaos in the brain: Fractal time series analysis of the EEG activity during a cognitive problem solving task. Procedia Comput. Sci. 2015, 55, 1410–1419. [Google Scholar] [CrossRef] [Green Version]
  30. Karsai, M.; Kaski, K.; Barabási, A.L.; Kertész, J. Universal features of correlated bursty behaviour. Sci. Rep. 2012, 2, 397. [Google Scholar] [CrossRef] [Green Version]
  31. Iasemidis, L.; Sackellares, J. Chaos theory and epilepsy. Neuroscientist 1996, 2, 118–126. [Google Scholar] [CrossRef]
  32. Duncan, J.S.; Sander, J.W.; Sisodiya, S.M.; Walker, M.C. Adult epilepsy. Lancet 2006, 367, 1087–1100. [Google Scholar] [CrossRef]
  33. Moshé, S.L.; Perucca, E.; Ryvlin, P.; Tomson, T. Epilepsy: New advances. Lancet 2015, 385, 884–898. [Google Scholar] [CrossRef]
  34. Smith, S.J. EEG in the diagnosis, classification, and management of patients with epilepsy. J. Neurol. Neurosurg. Psychiatry 2005, 76, ii2–ii7. [Google Scholar] [CrossRef] [PubMed] [Green Version]
  35. Acharya, U.R.; Sree, S.V.; Swapna, G.; Martis, R.J.; Suri, J.S. Automated EEG analysis of epilepsy: A review. Knowl. Syst. 2013, 45, 147–165. [Google Scholar] [CrossRef]
  36. Nigam, V.P.; Graupe, D. A neural-network-based detection of epilepsy. Neurol. Res. 2004, 26, 55–60. [Google Scholar] [CrossRef] [PubMed]
  37. Li, C.; Lammie, C.; Dong, X.; Amirsoleimani, A.; Azghadi, M.R.; Genov, R. Seizure Detection and Prediction by Parallel Memristive Convolutional Neural Networks. IEEE Trans. Biomed. Circuits Syst. 2022, 16, 609–625. [Google Scholar] [CrossRef] [PubMed]
  38. Sarić, R.; Jokić, D.; Beganović, N.; Pokvić, L.G.; Badnjević, A. FPGA-based real-time epileptic seizure classification using Artificial Neural Network. Biomed. Signal Process. Control 2020, 62, 102106. [Google Scholar] [CrossRef]
  39. Alhawarat, M.; Olde Scheper, T.; T Crook, N. Investigation of a Chaotic Spiking Neuron Model. Int. J. Comput. Appl. 2014, 99, 1–8. [Google Scholar] [CrossRef] [Green Version]
  40. Timofeev, I.; Bazhenov, M.; Seigneur, J.; Sejnowski, T. Neuronal synchronization and thalamocortical rhythms in sleep, wake and epilepsy. In Jasper’s Basic Mechanisms of the Epilepsies [Internet], 4th ed.; National Center for Biotechnology Information: Bethesda, MD, USA, 2012. [Google Scholar]
  41. Tsoutsouras, V.; Sirakoulis, G.C.; Pavlos, G.P.; Iliopoulos, A.C. Simulation of healthy and epileptiform brain activity using cellular automata. Int. J. Bifurc. Chaos 2012, 22, 1250229. [Google Scholar] [CrossRef]
  42. Karamani, R.E.; Fyrigos, I.A.; Ntinas, V.; Vourkas, I.; Sirakoulis, G.C.; Rubio, A. Memristive cellular automata for modeling of epileptic brain activity. In Proceedings of the 2018 IEEE International Symposium on Circuits and Systems (ISCAS), Florence, Italy, 27–30 May 2018; pp. 1–5. [Google Scholar]
  43. Chua, L.O.; Yang, L. Cellular neural networks: Theory. IEEE Trans. Circuits Syst. 1988, 35, 1257–1272. [Google Scholar] [CrossRef]
  44. Tetzlaff, R.; Niederhöfer, C.; Fischer, P. Automated detection of a preseizure state: Non-linear EEG analysis in epilepsy by Cellular Nonlinear Networks and Volterra systems. Int. J. Circuit Theory Appl. 2006, 34, 89–108. [Google Scholar] [CrossRef]
  45. Gollas, F.; Tetzlaff, R. Spatio-temporal analysis of brain electrical activity in epilepsy based on cellular nonlinear networks. In Proceedings of the Bioengineered and Bioinspired Systems IV, SPIE, Dresden, Germany, 4–6 May 2009; Volume 7365, pp. 132–143. [Google Scholar]
  46. Krug, D.; Chernihovskyi, A.; Osterhage, H.; Elger, C.; Lehnertz, K. Estimating generalized synchronization in brain electrical activity from epilepsy patients with Cellular Nonlinear Networks. In Proceedings of the 2006 10th International Workshop on Cellular Neural Networks and Their Applications, Istanbul, Turkey, 28–30 August 2006; pp. 1–5. [Google Scholar]
  47. Müller, J.; Müller, J.; Tetzlaff, R. A new cellular nonlinear network emulation on FPGA for EEG signal processing in epilepsy. In Proceedings of the Bioelectronics, Biomedical, and Bioinspired Systems V, and Nanotechnology V, Prague, Czech Republic, 18–20 April 2011; Volume 8068, pp. 199–206. [Google Scholar]
  48. Doelling, K.B.; Assaneo, M.F. Neural oscillations are a start toward understanding brain activity rather than the end. PLoS Biol. 2021, 19, e3001234. [Google Scholar] [CrossRef]
  49. Jacobs, J.; Kahana, M.J.; Ekstrom, A.D.; Fried, I. Brain oscillations control timing of single-neuron activity in humans. J. Neurosci. 2007, 27, 3839–3844. [Google Scholar] [CrossRef] [PubMed] [Green Version]
  50. Kahana, M.J. The cognitive correlates of human brain oscillations. J. Neurosci. 2006, 26, 1669–1672. [Google Scholar] [CrossRef] [PubMed]
  51. Kalitzin, S.; Petkov, G.; Suffczynski, P.; Grigorovsky, V.; Bardakjian, B.L.; da Silva, F.L.; Carlen, P.L. Epilepsy as a manifestation of a multistate network of oscillatory systems. Neurobiol. Dis. 2019, 130, 104488. [Google Scholar] [CrossRef] [PubMed]
  52. O’Sullivan-Greene, E.; Mareels, I.; Freestone, D.; Kulhmann, L.; Burkitt, A. A paradigm for epileptic seizure prediction using a coupled oscillator model of the brain. In Proceedings of the 2009 Annual International Conference of the IEEE Engineering in Medicine and Biology Society, Milan, Italy, 25–29 August 2009; pp. 6428–6431. [Google Scholar]
  53. Goodfellow, M.; Glendinning, P. Mechanisms of intermittent state transitions in a coupled heterogeneous oscillator model of epilepsy. J. Math. Neurosci. 2013, 3, 1–14. [Google Scholar] [CrossRef] [PubMed] [Green Version]
  54. Chua, L. Memristor-the missing circuit element. IEEE Trans. Circuit Theory 1971, 18, 507–519. [Google Scholar] [CrossRef]
  55. Stathopoulos, S.; Khiat, A.; Trapatseli, M.; Cortese, S.; Serb, A.; Valov, I.; Prodromakis, T. Multibit memory operation of metal-oxide bi-layer memristors. Sci. Rep. 2017, 7, 17532. [Google Scholar] [CrossRef] [Green Version]
  56. Tsigkourakos, M.; Bousoulas, P.; Aslanidis, V.; Skotadis, E.; Tsoukalas, D. Ultra-Low Power Multilevel Switching with Enhanced Uniformity in Forming Free TiO2- x-Based RRAM with Embedded Pt Nanocrystals. Phys. Status Solidi (A) 2017, 214, 1700570. [Google Scholar] [CrossRef]
  57. Mohammad, B.; Abi Jaoude, M.; Kumar, V.; Al Homouz, D.M.; Nahla, H.A.; Al-Qutayri, M.; Christoforou, N. State of the art of metal oxide memristor devices. Nanotechnol. Rev. 2016, 5, 311–329. [Google Scholar] [CrossRef]
  58. Xia, Q.; Yang, J.J. Memristive crossbar arrays for brain-inspired computing. Nat. Mater. 2019, 18, 309–323. [Google Scholar] [CrossRef]
  59. Liu, X.; Zeng, Z. Memristor crossbar architectures for implementing deep neural networks. Complex Intell. Syst. 2022, 8, 787–802. [Google Scholar] [CrossRef]
  60. Yakopcic, C.; Alom, M.Z.; Taha, T.M. Memristor crossbar deep network implementation based on a convolutional neural network. In Proceedings of the 2016 International Joint Conference on Neural Networks (IJCNN), Vancouver, BC, Canada, 24–29 July 2016; pp. 963–970. [Google Scholar]
  61. Zheng, N.; Mazumder, P. Learning in memristor crossbar-based spiking neural networks through modulation of weight-dependent spike-timing-dependent plasticity. IEEE Trans. Nanotechnol. 2018, 17, 520–532. [Google Scholar] [CrossRef]
  62. Fyrigos, I.A.; Ntinas, V.; Vasileiadis, N.; Sirakoulis, G.C.; Dimitrakis, P.; Zhang, Y.; Karafyllidis, I.G. Memristor Crossbar Arrays Performing Quantum Algorithms. IEEE Trans. Circuits Syst. I Regul. Pap. 2021, 69, 552–563. [Google Scholar] [CrossRef]
  63. Li, C.; Hu, M.; Li, Y.; Jiang, H.; Ge, N.; Montgomery, E.; Zhang, J.; Song, W.; Dávila, N.; Graves, C.E.; et al. Analogue signal and image processing with large memristor crossbars. Nat. Electron. 2018, 1, 52–59. [Google Scholar] [CrossRef]
  64. Li, H.; Wang, S.; Zhang, X.; Wang, W.; Yang, R.; Sun, Z.; Feng, W.; Lin, P.; Wang, Z.; Sun, L.; et al. Memristive crossbar arrays for storage and computing applications. Adv. Intell. Syst. 2021, 3, 2100017. [Google Scholar] [CrossRef]
  65. Kvatinsky, S.; Ramadan, M.; Friedman, E.G.; Kolodny, A. VTEAM: A general model for voltage-controlled memristors. IEEE Trans. Circuits Syst. II Express Briefs 2015, 62, 786–790. [Google Scholar] [CrossRef]
  66. Kvatinsky, S.; Friedman, E.G.; Kolodny, A.; Weiser, U.C. TEAM: Threshold adaptive memristor model. IEEE Trans. Circuits Syst. I Regul. Pap. 2012, 60, 211–221. [Google Scholar] [CrossRef]
  67. Kuramoto, Y.; Battogtokh, D. Coexistence of coherence and incoherence in nonlocally coupled phase oscillators. arXiv 2002, arXiv:cond-mat/0210694. [Google Scholar]
  68. Gerster, M.; Berner, R.; Sawicki, J.; Zakharova, A.; Škoch, A.; Hlinka, J.; Lehnertz, K.; Schöll, E. FitzHugh–Nagumo oscillators on complex networks mimic epileptic-seizure-related synchronization phenomena. Chaos Interdiscip. J. Nonlinear Sci. 2020, 30, 123130. [Google Scholar] [CrossRef]
  69. Tsakalis, K.; Chakravarthy, N.; Iasemidis, L. Control of epileptic seizures: Models of chaotic oscillator networks. In Proceedings of the 44th IEEE Conference on Decision and Control, Seville, Spain, 12–15 December 2005; pp. 2975–2981. [Google Scholar]
  70. Larter, R.; Speelman, B.; Worth, R.M. A coupled ordinary differential equation lattice model for the simulation of epileptic seizures. Chaos Interdiscip. J. Nonlinear Sci. 1999, 9, 795–804. [Google Scholar] [CrossRef]
Figure 1. Circuit design of a Chua’s Circuit oscillator unit highlighting the V 1 and V 2 nodes.
Symmetry 14 02325 g001
Figure 2. VTEAM (a) I-V characteristics showing the circuit schematic of a memristor device in the gray doted box. (b) Memristance update (bottom) in response to applied voltage (top).
Symmetry 14 02325 g002
Figure 3. (a) The 10 × 10 memristive crossbar array structure used for the coupling of 10 Chua’s Circuits (CCs) (b) the non-local coupling scheme used for the ring-based network of CC, where N is the network size and R equals the number of adjacent nodes from each side.
Symmetry 14 02325 g003
Figure 4. Simulation results for a network of 10 CCs with r = 0.2 and coupling strength c s = 1.68 . (a,b) are the connectivity matrices for the healthy and the epileptic grids, respectively. (c,d) present the time evolution of the voltage at nodes X 1 (top plot) and X 2 (bottom plot) for the healthy and the epileptic grids, respectively. Finally, (e,f) demonstrate the time evolution of the phases of all the CCs (top plot), the time evolution of the R s y n metric (middle plot) for the healthy and the epileptic grids and snapshots of the voltage at node X 1 for 25 different times (bottom plot).
Symmetry 14 02325 g004
Figure 5. Simulation results for a network of 300 CCs with r = 0.25 and coupling strength c s = 1.72 . (a,b) are the connectivity matrices for the healthy and the epileptic grids, respectively. (c,d) present the time evolution of the voltage at nodes X 1 (top plot) and X 2 (bottom plot) for the healthy and the epileptic grids, respectively. Finally, (e,f) demonstrate the time evolution of the phases of all the CCs (top plot), the time evolution of the R s y n metric (middle plot) for the healthy and the epileptic grids, and snapshots of the voltage at node X 1 for 25 different times (bottom plot).
Symmetry 14 02325 g005
Figure 6. Simulation results for a network of 300 CCs with r = 0.3 and coupling strength c s = 1.25 . (a,b) are the connectivity matrices for the healthy and the epileptic grids, respectively. (c,d) present the time evolution of the voltage at nodes X 1 (top plot) and X 2 (bottom plot) for the healthy and the epileptic grids, respectively. Finally, (e,f) demonstrate the time evolution of the phases of all the CCs (top plot), the time evolution of the R s y n metric (middle plot) for the healthy and the epileptic grids, and snapshots of the voltage at node X 1 for 25 different times (bottom plot).
Symmetry 14 02325 g006
Figure 7. Two cases of the R s y n metric time evolution within the same CC network for a varying threshold that determines the existence of irregularities, through its comparison with a randomly generated number (0.2 in red line, 0.4 in green, 0.6 in blue, and 0.8 in magenta) (a) c s = 1.1 (b) c s = 1.4 .
Symmetry 14 02325 g007
Figure 8. R s y n metric time evolution for varying area of irregularities within the same CC network, corresponding to increasing radius around the center CC (150th) where irregularities can exist. The threshold value was selected to be constant and equal to 0.5 .
Symmetry 14 02325 g008
Figure 9. Mean value of the R s y n metric and corresponding limits of the obtained minimum and maximum values for 10 different cases of initial conditions, for (a) 11 cases of irregularity radius and (b) 7 cases of thresholds. X-axis corresponds to the variable quantity and y-axis to the R s y n value.
Symmetry 14 02325 g009
Publisher’s Note: MDPI stays neutral with regard to jurisdictional claims in published maps and institutional affiliations.

