Article

Mathematical Assessment of the Impact of the Imperfect Vaccination on Diphtheria Transmission Dynamics

by
Siwaphorn Kanchanarat
,
Settapat Chinviriyasit
* and
Wirawan Chinviriyasit
*
Department of Mathematics, Faculty of Science, King Mongkut’s University of Technology Thonburi, Bangkok 10140, Thailand
*
Authors to whom correspondence should be addressed.
Symmetry 2022, 14(10), 2000; https://doi.org/10.3390/sym14102000
Submission received: 2 September 2022 / Revised: 18 September 2022 / Accepted: 20 September 2022 / Published: 24 September 2022
(This article belongs to the Topic Mathematical Modeling)

Abstract

:
Diphtheria is a vaccine-preventable disease in which the outbreaks will not occur if a high enough proportion of individuals in a population are immune. Recent reports reveal that vaccinated individuals with low coverage levels of immunity may be at risk of subclinical diphtheria infection. Therefore, the development of an epidemiology model that will predict the optimal vaccine coverage level needed to prevent the spread of these diseases is crucial. In this paper, a mathematical model for diphtheria transmission with asymptomatic infection, logistic growth, and vaccination is formulated and rigorously analyzed to gain insights into its global dynamical features. The study results show that the disease is eradicated whenever the vaccination coverage is greater than the optimal vaccination coverage level needed for diphtheria eradication. The reported cases of diphtheria in Thailand are applied to estimate the appropriate parameters of the model. Sensitivity analysis reveals the rate of vaccination and the asymptomatic infection are influential factors in controlling and preventing diphtheria. Numerical simulations are illustrated in the theoretical results and show that the incubation period of asymptomatic individuals has an impact on the optimal vaccination coverage level needed for diphtheria eradication.

1. Introduction

Diphtheria is an acute infectious disease of the respiratory system caused by bacteria and symptoms range from mild to severe. Severe cases can cause paralysis and death [1,2,3]. Vaccination against infectious diseases has been a commonly used method for controlling childhood diseases, especially diphtheria, which is one of the targets of vaccination programs. Despite the availability of highly effective childhood vaccines, diphtheria remains a public health concern in several countries because the most widely quoted diphtheria mortality rate can reach 5–10%. It may reach higher than 20% in children younger than 5 years and adults older than 40 years [4,5]. In Thailand, diphtheria is still an important cause of childhood morbidity and mortality, as reported during 2017–2019, diphtheria cases increased gradually with an incidence of 0.12–0.26 cases per 100,000 population [6]. Notably, a significant number of the population affected by these disease outbreaks were healthy adolescents, reflecting the waning protective levels of antibodies to the series of diphtheria vaccines over time [7].
Immunization induced by diphtheria vaccination has been effective in drastically decreasing childhood diseases over the last several decades, resulting in healthier children and, subsequently, adults [8]. Analysis of the incidence data [9] revealed that in countries with higher case counts, 66% of diphtheria cases are unvaccinated and 63% are less than 15 years of age. In countries with sporadic cases, 32% of diphtheria cases are unvaccinated and 66% are greater than 15 years of age, consistent with waning vaccine immunity. During 2016–2020, the reported diphtheria cases in Thailand increased gradually (with an incidence of 0.01–0.03 cases per 100,000 population) and the most commonly reported cases are children under 5 years old [6,10,11,12]. Thus, several studies [13,14,15] have investigated barriers to vaccination in populations that have lower than normal vaccine coverage. In addition, analysis of historical data showed that the causes of a resurgence of diphtheria in many countries were the low coverage of the diphtheria vaccine among children and the large gap in immunity among adults. It was also shown that a shift of the disease to older ages began before mass immunization was introduced [15,16,17,18,19]. Therefore, understanding the impact of imperfect coverage levels of vaccination on immunization is crucial for controlling and preventing diphtheria in the community which will be explored in this paper using a mathematical model.
Mathematical models in infectious disease epidemiology have been developed to gain insights into the transmission dynamics of some diseases which may induce permanent immunity against the diseases (see for instance and reference therein [20,21,22,23]). Earn et al. [24] presented the classical susceptible-exposed-infectious-removed (SEIR) model for providing a better understanding of measles complex dynamical transitions. However, it is well known that immunity induced by the preventive vaccines for some of the aforementioned diseases may wane over time [25,26]. For instance, Mossong et al. [27] estimated the mean duration of vaccine-induced protection against measles, in the absence of re-exposure, to be 25 years. For these reasons, many researchers modified the SEIR model by incorporating vaccination which has made key contributions to vaccination program design, from introducing the concept of herd immunity thresholds to predicting changes in post-vaccination epidemiology [28,29,30,31,32,33,34,35,36,37,38,39,40,41,42]. Moghadas and Gumel [33] presented an S V I R (susceptible-vaccinated-infected-recovered) epidemic model in order to predict the optimal vaccine coverage for controlling childhood disease. Wang et al. [34] developed a vaccination model to investigate the effect of delay in booster dose after primary vaccination on the long-term prevalence of Heamophilus influenzae serotype b. Ho et al. [37] formulated two deterministic SVIR models and investigated the effects of vaccination coverage and vaccine efficacy against different influenza subtypes in Hong Kong during the 2017–2018 winter. Zheng et al. [43] determined the optimal vaccine administration strategy in refugee camps considering maximum daily administration and limited total vaccine supply by using SEAIRD compartmental models. The purposed model was established to describe the epidemic dynamics with both single-dose and double-dose vaccine administration for COVID-19. In addition to the chemical treatment, Song et al. [44] investigated the symmetrical properties, as well as the stability and symmetry properties, in a variety of model parameters. The sensitivity analyses are used to suggest the chemotherapy drug-induced tumor mortality rate and the drug decay rate contribute significantly to the explanation of treatment. These studies indicate that vaccination coverage and time of booster dose are influential factors for disease control by vaccination. Although mathematical modeling has been extensively used to address questions of disease control by vaccination, those models are formulated under the assumption that the recruitment of the population into the community (assumed to be susceptible individuals) is a constant rate in the sense that a population grows proportionately with the population’s current size [29,33,45]. In fact, the population changes all the time but is not more than the maximum population size that a particular environment can support, which is called the carrying capacity ( K ) , see more details in [46,47]. In health care services, every country has a maximal capacity for the treatment of disease [48]. Therefore, it is reasonable to assume that the recruitment of the population into the community is a logistic growth rate: r N 1 N K , where r is the birth rate and N is the population size. More recent studies consider epidemic models with the logistic growth to provide deep insights into the aforementioned transmission dynamics of diseases and to evaluate control strategies (see, for instance, [23,35,47,49,50,51,52,53]). Nudee et al. [35] formulated a measles model with logistic growth and vaccination to study the effect of backward bifurcation on the first and second doses of the vaccination period of measles. Li et al. [49] introduced the saturated treatment and logistic growth rate into an SIR epidemic model with bilinear incidence for investigating a relatively long-lasting disease or a disease with a high death rate. Zou et al. [52] studied COVID-19 suppression dynamics in China by using a phenomenological logistic growth model. Wu et al. [53] compared the COVID-19 outbreak in China by using the generalized logistic growth model. Another important issue of interest, the occurrence of certain epidemic episodes encouraged either by incomplete protection for vaccination or by exogenous re-infection may be related to the role that symptomatic and asymptomatic individuals play in the community transmission of disease and in the development of herd immunity to prevent the disease, see more detail in [54,55] and reference therein. It is, therefore, crucial to understand the impact of logistic growth and asymptomatic infection in controlling and preventing diphtheria by vaccination.
Understanding transient phenomena in potential epidemiological scenarios are also an important issue of interest. Stability analyses of epidemic models, thus, are essential to understand the population dynamics that should be stable relative to finite perturbations of its initial state. The study of global stability is generally a nontrivial problem, but it is necessary to ensure effective control at a steady state, regardless of the initial situation [56]. In the event of an epidemic, the study of the globally asymptotic properties of epidemiological models can help design effective control strategies intended to permanently reduce disease spread, or even break the chain of disease transmission. To analyze the global stability of epidemic models, the most successful method is the direct Lyapunov method [57]. It is widely used by many authors (see for examples [22,35,58,59,60,61,62,63] and the references therein). However, the global stability of epidemic models with logistic growth, asymptomatic infection and vaccination has not yet been studied so far.
Based on the above discussions, the aim of this paper is to formulate the diphtheria model with asymptomatic infection, logistic growth, and vaccination in order to investigate the effects of the asymptomatic infection and the imperfect coverage of vaccination for controlling and preventing diphtheria. The paper is organized as follows. In Section 2, the diphtheria model with asymptomatic infection, logistic growth, and vaccination is formulated and rigorously analyzed in Section 3. The threshold value called the reproductive number under vaccination of the proposed model is derived by using the Next-Generation method. By constructing the suitable Lyapunov function and using LaSalle’s invariance principle, the global stabilities of equilibria of the proposed model are analyzed in order to determine the threshold vaccination coverage needed for diphtheria elimination. In Section 4, numerical simulations are reported to determine the appropriate model parameters for the diphtheria-vaccine model and to assess the effect of asymptomatic infection and imperfect vaccination coverage on disease control and prevention. Finally, discussions and conclusions are given in Section 5.

2. Model Formulation

A model of diphtheria is formulated based on the epidemiology of diphtheria and prevention by vaccines. To this end, the total population at any time t, denoted by N ( t ) , is divided into six subpopulations, namely, susceptible individuals ( S ) , vaccinated individuals ( V ) , exposed individuals ( E ) , asymptomatic individuals ( A ) , infected individuals ( I ) and recovered individuals ( R ) , respectively, so that,
N ( t ) = S ( t ) + V ( t ) + E ( t ) + A ( t ) + I ( t ) + R ( t ) .
It should be emphasized that individuals in the exposed (E) class are those early-infected individuals that are not able to transmit diphtheria infection to susceptible individuals. Furthermore, while individuals in the infected (I) class are those that show symptoms of diphtheria at the end of the incubation period, those in the asymptomatic (A) class are assumed to show mild or no clinical symptoms of the disease at the end of the incubation period. However, those in the A class are close to surviving the incubation period and are shedding the diphtheria virus. Hence, they are infectious (i.e., they are able to transmit diphtheria infection to susceptible individuals [1]). The recovered (R) class contains individuals who recover from diphtheria infection. However, recovered individuals do not have natural immunity so they need to receive a booster vaccine. Therefore, in this study, the vaccinated (V) class contains susceptible individuals who are vaccinated according to administering diphtheria including individuals whose recovery. The dynamics of each sub-population are described in the following. Due to the diphtheria vaccine being recommended for people of all ages in a community, it is then assumed that the recruitment rate of people into the population (assumed to be susceptible individuals) is the logistic growth rate r N 1 N K , where r is the birth rate and K denotes the carrying capacity (i.e., the maximum size population). It is also assumed that all sub-populations die at the same natural death rate μ with r > μ . According to reports in [1], diphtheria carriers as a reservoir are usually asymptomatic individuals and then diphtheria can be transmitted from both asymptomatic and infected individuals. Thus, the force of infection is defined by
λ = β ( δ A + I ) N ,
where β denotes the transmission rate and the modification parameter 0 < δ 1 accounts for the assumed reduction in transmissibility of asymptomatic individuals relative to the infectious population. The susceptible population increases at the logistic growth rate and due to the waning vaccine at the rate ε , respectively. This population decreases when they are vaccinated at a per capita rate ϕ , they infect diphtheria at the rate λ and die at the natural death rate μ , respectively. Further, the number of vaccinated individuals increases, when either susceptible individuals have been vaccinated at the rate ϕ or individuals in the R class are vaccinated after treatment at the rate θ , respectively. The vaccinated class decreases when they lose immunity at the rate of vaccine waning ε (that is 1 / ε is the duration of the loss of immunity acquired by preventive vaccine or by infection), and die at the natural death rate μ , respectively. On the other hand, when susceptible individuals acquire diphtheria infection by contact with asymptomatic and infected individuals, individuals in the E class then increase at the rate λ . The parameter σ represents the progression rate of individuals in the E class to either the I class or the A class at the end of the incubation period. Thus, the number of exposed individuals decreases when either they develop clinical symptoms of diphtheria (and move to the I class) at the rate a σ or they do not show clinical symptoms (and move to the A class) at the rate ( 1 a ) σ , and at the natural death rate μ , respectively. Hence, 0 a 1 is the proportion of symptomatic infectious individuals at the end of the incubation period. Meanwhile, the number of asymptomatic individuals decreases at the recovered rate γ and the natural death rate μ , respectively. In addition, the number of infected individuals decreases at the recovered rate τ , the natural death rate μ , and the diphtheria mortality rate α , respectively. After asymptomatic and infected individuals obtain the treatment they will move to recovered classes at the rate γ and τ , respectively. They also die at a natural death rate μ . Since diphtheria is a disease in which the patient loses immunity after treatment, the recovered individuals decrease when patients receive the boosting vaccine and move to the vaccinated class at the rate θ and the rate at which they die naturally to be μ , respectively. Based on the description above, the model of diphtheria transmission with logistic growth and vaccination is presented in the form of the system of non-linear first-order differential equations:
d S d t = r N 1 N K β S ( δ A + I ) N ( μ + ϕ ) S + ε V , d V d t = ϕ S + θ R ( μ + ε ) V , d E d t = β S ( δ A + I ) N ( μ + σ ) E , d A d t = ( 1 a ) σ E ( μ + γ ) A , d I d t = a σ E ( μ + α + τ ) I , d R d t = γ A + τ I ( μ + θ ) R .
The proposed model (1) is called the diphtheria-vaccine model. The diphtheria-vaccine model monitors human populations, all the state variables and parameters used are non-negative. The descriptions and the values of model parameters are given in Table 1.

3. Analysis of the Diphtheria-Vaccine Model

In this section, the diphtheria-vaccine model is analyzed for the existence and stability of its associated equilibria. This analysis allows us to determine the threshold vaccination coverage level needed for disease eradication.

3.1. Basic Properties

We claim the following lemma.
Lemma 1.
The closed set
D = ( S , V , E , A , I , R ) R + 6 | S + V + E + A + I + R K ( r μ ) r ,
is positively-invariant and attracting for the diphtheria-vaccine model (1).
Proof. 
Adding the equations in the system (1) yields
d N d t = r N 1 N K α I μ N .
Since
d N d t r N 1 N K μ N ,
it follows that d N d t < 0 if N ( t ) > K ( r μ ) r . Thus, by standard comparison theorem [67], it can be shown that
N ( t ) K ( r μ ) r + K ( r μ ) N ( 0 ) r e ( r μ ) t .
If N ( 0 ) K ( r μ ) r , then N ( t ) K ( r μ ) r . Thus, D is positively-invariant set under the flow described by the system (1). Further, if N ( t ) > K ( r μ ) r , then either the solution enters D in finite time, or N approaches K ( r μ ) r . Hence, D is attracting (i.e., all solutions in R + 6 eventually enter D). Therefore, it is sufficient to consider the dynamics of the model (1) in D. □
Hence, the model (1) is epidemiologically and mathematically well-posed in D [68]. Therefore, it is sufficient to study the dynamics of the model (1) in D.

3.2. Disease Free Equilibrium and Reproductive Number

In the absence of infection ( E = 0 , A = 0 , I = 0 ) , the diphtheria-vaccine model has a disease-free equilibrium denoted by P 0 and given by
P 0 = ( S 0 , V 0 , E 0 , A 0 , I 0 , R 0 ) = ( r μ ) ( μ + ε ) K r ( μ + ϕ + ε ) , ( r μ ) ϕ K r ( μ + ϕ + ε ) , 0 , 0 , 0 , 0 .
According to the next generation method [69], the model (1) is rewritten as
d x d t = F V ,
where x = ( E , A , I , R , S , V ) , V = V V + ,
F = β S ( δ A + I ) N 0 0 0 0 0 , V = ( μ + σ ) E ( μ + γ ) A ( μ + α + τ ) I ( μ + θ ) R β S ( δ A + I ) N + ( μ + ϕ ) S ( μ + ε ) V and V + = 0 ( 1 a ) σ E a σ E γ A + τ I r N ( 1 N K ) + ε V ϕ S + θ R ,
respectively. Clearly, x 0 = ( 0 , 0 , 0 , 0 , S 0 , V 0 ) is a disease-free equilibrium of (4) which is identical to a disease-free equilibrium of the model (1). Moreover, it can be shown that the system (4) satisfies the assumptions (A1)–(A5) in [69,70]. After partitioning the derivatives D F ( x 0 ) and D V ( x 0 ) , we obtain two matrices F and V, where
F = 0 β δ ( μ + ε ) μ + ϕ + ε β ( μ + ε ) μ + ϕ + ε 0 0 0 0 0 0 and V = μ + σ 0 0 ( 1 a ) σ μ + γ 0 a σ 0 μ + α + τ ,
respectively. Let R V = ρ ( F V 1 ) , where ρ is the spectral radius of the next generation matrix F V 1 , we have
R V = β σ ( μ + ε ) ( a ( μ + γ ) + δ ( 1 a ) ( μ + α + τ ) ) ( μ + σ ) ( μ + γ ) ( μ + α + τ ) ( μ + ϕ + ε ) .
According to Theorem 2 in [69,70], the following theorem is established.
Theorem 1.
The disease-free equilibrium P 0 of the diphtheria-vaccine model (1) is locally asymptotically stable if R V < 1 , and unstable if R V > 1 .
The result in Theorem 1 indicates that the threshold value R V is the reproductive number under vaccination of the diphtheria-vaccine model (1). It represents the average number of secondary cases caused by one primary case introduced into a population in which a proportion has been vaccinated [71]. In the context of epidemiological modeling (see [72]), if R V < 1 , then the disease-free equilibrium is locally asymptotically stable in the sense that the total number of infected individuals in the population can be reduced to zero if the initial sizes of the sub-populations of the model are in the basin of attraction of P 0 . This means that a small influx of infected individuals into the community will not generate a large number of infected individuals if R V < 1 (but will not do so if R V > 1 ). To ensure that the eradication of diphtheria outbreak when R V < 1 does not depend on the initial size of six state variables of the diphtheria-vaccine model, the following is established.
Theorem 2.
The disease-free equilibrium P 0 of the diphtheria-vaccine model (1) is globally asymptotically stable in D whenever R V 1 .
Proof. 
Consider the Lyapunov function
F = σ a ˜ δ d 1 + a d 3 E + δ d 1 d 2 A + d 2 d 3 I ,
where a ˜ = 1 a , d 1 = μ + α + τ , d 2 = μ + σ and d 3 = μ + γ , respectively. Its derivative along the solutions to the system (1) is
d F ( t ) d t = d 1 d 2 d 3 ( δ A + I ) σ a ˜ δ d 1 + a d 3 β S d 1 d 2 d 3 N 1 , d 1 d 2 d 3 ( δ A + I ) σ a ˜ δ d 1 + a d 3 β d 4 d 1 d 2 d 3 ( d 4 + ϕ ) 1 , = d 1 d 2 d 3 ( δ A + I ) R V 1 .
where d 4 = μ + ε . Clearly, d F ( t ) d t 0 whenever R V 1 . Furthermore, d F ( t ) d t = 0 only if A = I = 0 . The largest compact invariant set in ( S , V , E , A , I , R ) D d F ( t ) d t = 0 is the singleton P 0 . Therefore, by Lasalle’s Invariance Principle [73], every solution of the system (1) with initial conditions in D, approaches to P 0 as t . This completes the proof. □

3.3. Endemic Equilibrium and Local Stability

In the presence of infection ( E 0 , A 0 , I 0 ), the endemic equilibrium of the diphtheria-vaccine model (1) is explored as follows. At a steady state, let P = S , V , E , A , I , R be any positive endemic equilibrium of the system (1), let
λ = β ( δ A + I ) N
be the forces of infection and N is the total population size at the endemic steady state (that is N = S + V + E + A + I + R and N 0 ), respectively. Further, setting all derivatives in the system (1) to zero and solving for all state variables in terms of λ at steady state, gives
V = ϕ + σ θ Q 1 λ k 3 k 4 k 5 k 6 S k 2 , E = λ S k 3 , A = a ˜ σ λ S k 3 k 4 , I = a σ λ S k 3 k 5 , R = σ Q 1 λ S k 3 k 4 k 5 k 6
and
S ( a 1 S a 0 ) = 0 ,
where k 1 = μ + ϕ , k 2 = μ + ε , k 3 = μ + σ , k 4 = μ + γ , k 5 = μ + α + τ , k 6 = μ + θ , k 7 = μ + ε + ϕ , r ˜ = r μ and a ˜ = 1 a , respectively, with
a 0 = Q 3 λ + r ˜ k 3 k 4 k 5 k 6 k 7 k 2 k 3 k 4 k 5 k 6 K , a 1 = k 6 + ε σ Q 1 + k 2 k 6 σ Q 2 + k 4 k 5 λ + k 3 k 4 k 5 k 6 k 7 2 r , Q 1 = a τ k 4 + a ˜ γ k 5 , Q 2 = a k 4 + a ˜ k 5 , Q 3 = k 6 + ε r + ε θ σ Q 1 + k 2 k 4 k 5 k 6 + σ k 2 k 6 Q 2 r k 2 k 3 k 4 k 5 k 6 > 0 .
Clearly, S = 0 is the solution of (9), which corresponds to N = 0 . Consequently, the positive endemic equilibrium ( P ) does not exist in this case. Since we consider only the positive solution, it follows from (9) that
S = a 0 a 1 .
Substituting (8) and (10) into (7) gives the quadratic equation in term of λ :
λ ( b 1 λ b 0 ) = 0 ,
where b 0 = k 3 k 4 k 5 k 6 k 7 ( R V 1 ) , b 1 = σ k 2 k 6 Q 2 + σ k 6 + ε Q 1 + k 2 k 4 k 5 k 6 , respectively. The endemic equilibrium P of the model (1) is obtained by solving (11) for positive λ and then substituting λ into (8) and (10). The solutions of (11) are λ = 0 and λ = b 0 b 1 . Clearly, λ = 0 corresponds to disease-free equilibrium P 0 . Further, b 1 is always positive. While b 0 > 0 when R V > 1 , b 0 < 0 when R V < 1 , and b 0 = 0 when R V = 1 , respectively. Since we are only interested in the possible positive equilibrium of the model (1), only the case λ 0 is considered. It is found that λ > 0 if R V > 1 . For R V < 1 , then λ < 0 (which is biologically meaningless). The endemic equilibrium does not exist in this case. It should be noted that when R V = 1 , λ = 0 corresponds to disease-free equilibrium P 0 . These results are summarized below.
Theorem 3.
The diphtheria-vaccine model (1) has a unique endemic equilibrium P if R V > 1 , and no P if R V 1 .
The local stability of P is claimed and its proof is given in Appendix A.
Theorem 4.
The endemic equilibrium P of the diphtheria-vaccine model (1) is locally asymptotically stable whenever R V > 1 and is close to 1.

3.4. Global Stability Analysis

Global stability analysis confirms that the rates of long-term disease dynamics converge correctly to an equilibrium state irrespective of the initial sizes of the state variables. To this end, the direct Lyapunov method and LaSalle’s invariance principle, which is a criterion for the asymptotic stability of an autonomous dynamical system [35,45], are applied to analyze the long-term dynamical behavior of endemic equilibrium of the diphtheria-vaccine model whenever R V > 1 . The following theorem is claimed.
Theorem 5.
The endemic equilibrium P of diphtheria-vaccine model (1) exists and is globally asymptotically whenever R V > 1 .
Proof. 
Consider the following Lyapunov function
L ( t ) = S S S ln S S + V V V ln V V + E E E ln E E + G A A A A ln A A + G I I I I ln I I ,
where G A = r β S δ A K ( r μ ) ( 1 a ) E and G I = r β S I K ( r μ ) a E , respectively.
The Lyapunov derivative computed along solutions of the system (1) is given by
d L ( t ) d t = 1 S S r N 1 N K β S ( δ A + I ) N ( μ + ϕ ) S + ε V + 1 V V ϕ S + θ R ( μ + ε ) V + 1 E E β S ( δ A + I ) N ( μ + σ ) E + G A 1 A A ( 1 a ) σ E ( μ + γ ) A + G I 1 I I a σ E ( μ + α + τ ) I .
From (2), we have
d L ( t ) d t 1 S S K μ ( r μ ) r r β S ( δ A + I ) K ( r μ ) ( μ + ϕ ) S + ε V + 1 V V ϕ S + θ R ( μ + ε ) V + 1 E E r β S ( δ A + I ) K ( r μ ) ( μ + σ ) E + G A 1 A A ( 1 a ) σ E ( μ + γ ) A + G I 1 I I a σ E ( μ + α + τ ) I .
By Theorem 4 and (12) at steady state, we have
K μ ( r μ ) r = r β S ( δ A + I ) K ( r μ ) + ( μ + ϕ ) S ε V , ( μ + ε ) V = ϕ S + θ R , ( μ + σ ) E = r β S ( δ A + I ) K ( r μ ) , ( μ + γ ) A = ( 1 a ) σ E , ( μ + α + τ ) I = a σ E .
Clearly, from the second Equation in (13), that
ε V < ϕ S + θ R .
Substituting the expressions (13) and (14) into (12), we obtain
d L ( t ) d t μ S 2 S S S S + ϕ S 2 S V S V S V S V + r β S I K ( r μ ) 3 S S E I E I S E I S E I + r β S δ A K ( r μ ) 3 S S E A E A S E A S E A + θ R 1 S V R S V R 1 V V .
Since the arithmetic mean is greater than or equal to the geometric mean, the following inequalities hold:
2 S S S S 0 , 2 S V S V S V S V 0 , 3 S S E A E A S E A S E A 0 , 3 S S E I E I S E I S E I 0 .
In addition, V ( t ) is an increasing (decreasing) function while S ( t ) and R ( t ) are decreasing (increasing) functions, which implies
1 S V R S V R 1 V V 0 .
Since all state variables and model parameters are non-negative, the conditions (15) and (16) ensure that d L ( t ) d t 0 for R V > 1 , and d L ( t ) d t = 0 when S = S , E = E , A = A , I = I , R = R and V = V . The largest compact invariant set in { ( S , V , E , A , I , R ) d L / d t = 0 } is the singleton { P } . Therefore, by LaSalle’s invariance principle [73], all solutions of the system (1), with initial conditions in D, approach the unique endemic equilibrium, P , as t , whenever R V > 1 . The proof is completed. □

3.5. Vaccine-Induced Herd Immunity Threshold

For vaccine-preventable diphtheria, not all susceptible individuals can be immunized for various reasons, for example, either children have not been fully vaccinated or adolescents and adults are not continuously getting the booster vaccine causing no immunity to prevent the disease. When a patient with diphtheria is found, it can spread to these people as well as spreading the virus to children who have not been vaccinated. The question then is what is the minimum proportion of the population that has to be vaccinated to eliminate the spread of diphtheria. The notion of herd immunity (also called community immunity) in the transmission dynamics is indirect protection. It is associated with when enough people are vaccinated against a disease, it is harder for the disease to spread. The consequence of herd immunity is that individuals who are not immune (e.g., those who cannot be vaccinated or those who have not been infected yet) receive some protection against the acquisition of the disease due to natural recovery from prior infection or vaccination [74,75]. Therefore, the safest and fastest way to achieve herd immunity is obviously vaccination. To this end, a theoretical condition for achieving vaccine-induced herd immunity is derived. Rewriting R V , we have
R V = μ + ε μ + ε + ϕ R 0 ,
where
R 0 = β σ ( a ( μ + γ ) + δ ( 1 a ) ( μ + α + τ ) ) ( μ + σ ) ( μ + γ ) ( μ + α + τ ) .
It follows that R V | ε = 0 , ϕ = 0 = R 0 . This expression clearly shows that R 0 is the basic reproductive number of infection for the vaccination-free model ( ε = 0 , ϕ = 0 ). In another word, R 0 is the basic reproductive number of the model (1) in the absence of vaccination in the community. In this case, R 0 represents the average number of secondary cases caused by one primary case introduced into a population that is wholly susceptible during the duration of his/her infectiousness [71]. Further, define
p = V 0 N 0
be the fraction of vaccinated individuals at the disease-free steady state. For a perfect vaccine that confers life-long protection,
R V = ( 1 p ) R 0 .
The critical vaccination proportion that will achieve eradication, p c , is that for which the basic reproductive number under vaccination R V = 1 . This yields:
p c : = p = 1 1 R 0 .
It follows from (20) and (21) that R V < ( > ) 1 whenever p > ( < ) p c . According to Theorems 2 and 5, the following result is established.
Corollary 1.
If p p c , the disease is eradicated and will persist in the community if p < p c .
This corollary verifies that the quality p c is the optimal vaccination coverage level needed for diphtheria eradication (also called vaccine-induced herd immunity threshold) of the model (1). Moreover, it is observed that the threshold vaccination coverage ( p c ) is identical to the formula of herd immunity [76], which is a new result found in this study. Furthermore, solving R V = 1 for ϕ gives
ϕ c = ϕ = ( μ + ε ) ( R 0 1 ) ,
It follows, from (17), that R V is a decreasing function of the rate of vaccination ϕ , thus ϕ > ϕ c whenever R V < 1 . According to Theorems 2 and 5, the following lemmas are established.
Lemma 2.
The unique disease-free equilibrium, P 0 , of the diphtheria-vaccine model (1) is globally asymptotically stable whenever ϕ ϕ c and unstable whenever ϕ < ϕ c .
Lemma 3.
The unique endemic equilibrium, P , of diphtheria-vaccine model (1) is globally asymptotically stable whenever ϕ < ϕ c and unstable whenever ϕ ϕ c .
Lemmas 2 and 3 verify that ϕ c is the bifurcation value and is called the critical rate of vaccination rate for diphtheria eradication. It is seen, from (21) and (22), that the rate of vaccination ϕ corresponds to the vaccination coverage level p. Therefore, the following corollary is claimed.
Corollary 2.
If ϕ ϕ c , the disease is eradicated and will persist in the community if ϕ < ϕ c .

4. Numerical Simulations

4.1. Appropriate Model Parameters

The diphtheria-vaccine model (1) is simulated by using the fourth-order Runge–Kutta method with the parameter values given in Table 1 for predicting the infected individuals (diphtheria cases). The results obtained are used to compute the cumulative number of diphtheria cases by solving the differential equation [35]:
d C d t = ψ I
where C denotes the predicted cumulative number of diphtheria cases and ψ is the rate of duration from diagnosis to treatment, respectively. The value ψ = 1 corresponds to data collection per month. The vaccine parameters used: ϕ = 0.0406 and ε = 0.0083 correspond to the vaccination coverage 81.2% [10] and the vaccine-induced waning immunity every 10 years [1], respectively. The results obtained are compared with the cumulative number of diphtheria cases reported by the Ministry of Public Health in Thailand, 2018 [6]. It is found, from Figure 1, that the predicted cases fit well with the reported cases, which is confirmed by the statistical test (the coefficient of determination denoted by R 2 [77]) R 2 = 0.9920 . This study result verifies that the values of model parameters in Table 1 are appropriate for the diphtheria-vaccine model (1). Therefore, these values will be used to illustrate theoretical results and to investigate the effect of imperfect vaccination coverage in preventing the transmission of diphtheria in Thailand.

4.2. Sensitivity Analysis of the Reproductive Number

The sensitivity analysis [29] is applied to determine the relative importance of model parameters to diphtheria transmission and prevention, which are related to the reproductive number, R V . To this end, the sensitivity indices of R V , denoted by ζ φ R V , with respect to a model parameter φ is given by
ζ φ R V = R V φ · φ R V .
The resulting sensitivity indices of R V with respect to each of the ten different parameters in Table 1 are shown in Figure 2. The positive (negative) sign of ζ φ R V means increasing (decreasing) the value of model parameter φ would increase (decrease) the value of R V . It is found, from Figure 2, that the most sensitive parameter to increasing R V is ε and followed by β , β δ , μ and a σ , respectively. On the other hand, the most sensitive parameter to decreasing R V is ϕ and followed by τ , γ , ( 1 a ) σ , and α , respectively. These study results indicate that the major factors in controlling diphtheria are the rate of vaccine waning ( ε ) , the transmission rate ( β ) , the rate of infection by asymptomatic individuals ( δ β ) and the rate of progression from primary to symptomatic state ( a σ ) , respectively. On the other hand, the major factors in preventing diphtheria are the rate of vaccination ( ϕ ), the recovery rates for infected individuals ( τ ), the recovery rate for asymptomatic individuals ( γ ) and the rate of progression from primary to asymptomatic state ( ( 1 a ) σ ) , respectively.
The combined effect of two model parameters with respect to R V are explored by plotting the contour plots of R V , as shown in Figure 3 and Figure 4. Figure 3 shows a marked decrease in R V with increasing the rate of vaccination ϕ and decreasing the transmission rate by infected individuals ( β ) and asymptomatic individuals ( δ β ). This result interprets that increasing the rate of vaccination will be decreasing the risk to cause infection by infected individuals and asymptomatic individuals. Further, increasing ϕ , the recovered rates of infected ( τ ) and asymptomatic individuals ( γ ) would decrease R V (achieve R V < 1 ). Figure 4a,b show that increasing the rate of vaccination ϕ , the recovered rates of infected ( τ ) and asymptomatic individuals ( γ ) would decrease R V (achieve R V < 1 ). On the other hand, it is observed that R V is not less than unity even though the recovered rates of infected and asymptomatic individuals are increasing, see Figure 4c.

4.3. Effect of Vaccination Rate

Due to the rate of vaccination ϕ being most sensitive to R V , the effect of ϕ on diphtheria prevalence then is explored with various ϕ . With the baseline model parameter values in Table 1, the critical value of vaccination rate for diphtheria elimination is ϕ c = 0.0597 (see (22)), which corresponds to the threshold vaccination coverage level for diphtheria eradication p c = 0.864 (see (21)). In the following, numerical simulations are illustrated for ϕ < ϕ c and ϕ > ϕ c , respectively.
This verifies that good treatments for infected and asymptomatic individuals are necessary but insufficient in controlling and preventing diphtheria. Thus, this study suggests when infected individuals recover, they should get a booster vaccine against diphtheria. Meanwhile, asymptomatic individuals should get a diphtheria vaccine at an opportunity or a booster vaccine against diphtheria every 10 years. These causes lead to an increase in the number of people who need to receive a booster vaccine. Therefore, the study results verify that a high rate of vaccination would be needed to effectively control diphtheria spread. The following section will explore the evidence in more detail.
For ϕ = 0.0618 > ϕ c and the other model parameters given in Table 1, we obtain R V = 0.9709 < 1 . The diphtheria-vaccine model is first simulated with different initial conditions for all sub-populations. The profiles of all sub-populations are displayed in Figure 5. It is found that all solutions of a diphtheria-vaccine model approach the correct disease-free equilibrium irrespective of the initial sizes of the six state variables whenever R V < 1 as guaranteed by Theorem 2. The phase space of susceptible, vaccinated and infected individuals is also supported by this study result, see Figure 6. Therefore, it is verified that diphtheria is eradicated whenever ϕ > ϕ c is guaranteed by Lemma 2. Further, it is found that even the profiles of infectious populations decline to zero irrespective of the initial sizes of all state variables, see Figure 5c–e, the profiles of vaccinated individuals are slowest convergent to their steady state (see Figure 5b and confirmed in Figure 6). This is due to the effect of the fluctuations of the initial sizes of sub-populations, especially the initial size of vaccinated individuals, that impact the effectiveness of vaccination strategy which will investigate in the next section.
For ϕ = 0.0406 < ϕ c and the other model parameters given in Table 1, we obtain R V = 1.3826 > 1 . Figure 7 and Figure 8 show all solutions of the diphtheria-vaccine model approach to a unique endemic equilibrium for different initial sizes of sub-populations whenever R V > 1 . It is seen that when all sub-populations are varied at the initial time will be effective in the fluctuation of infectious populations in the sense that the number of infected individuals found is faster or slower, see Figure 7d,e. This result indicates that diphtheria still persists in the community. It is also observed that the fluctuations of initial sizes of susceptible and vaccinated individuals (see Figure 7a,b) impact increasing the number of infectious populations (infected and asymptomatic individuals), which eventually would increase the number of recovered populations, see Figure 7f. Thus, if recovered individuals get the diphtheria vaccine, they will move to the vaccinated class, that is, the vaccination coverage is maintained. However, if this population does not get the diphtheria vaccine, they will become susceptible to diphtheria which would increase the number of infected and asymptomatic individuals. Therefore, it can be concluded that diphtheria persists in the community whenever R V > 1 ; that is, ϕ < ϕ c as in line with Theorem 5 and Lemma 3. Moreover, the vaccination strategy is effective if the rate of vaccination is equal to or greater than the threshold value level needed for diphtheria elimination.

4.4. Effect of Asymptomatic Individuals on Spreading Diphtheria

The results obtained in Section 4.2 reveal that the rate of progression from primary to asymptomatic state ( a ˜ σ ) is one of the main factors to decrease (or increase) the diphtheria prevalence. To investigate the effect of asymptomatic individuals on spreading diphtheria, the diphtheria-vaccine model is then simulated using the baseline parameter values in Table 1 and various a ˜ σ . With the baseline parameter values in Table 1, ϕ = 0.0406 , then we obtain the baseline values: R V = 1.3826 > 1 , a ˜ σ = 2.7 , ϕ c = 0.0597 and p c = 0.864 , respectively. The value a ˜ σ is chosen to be 5.94 , 4.26 , 2.7 , 2.1 , 1.26 , which correspond to the incubation period of asymptomatic individuals for 5, 7, 11, 14 and 24 days, respectively.
Let S , V , E , A , I and R be the number of sub-populations at steady state. Further, let p ˜ = V S + V represents the vaccination proportion induced by the rate of vaccination ϕ = 0.0406 . The results in Table 2 show that as a ˜ σ increase, it is found that R V is decreased resulting in decreasing the numbers of E and I , while the number of A increase. These results indicate that the diphtheria prevalence is decreased, but not eradicated. Further, the results in Table 2 also show increasing a ˜ σ has an impact on decreasing the threshold values of ϕ c , p c , and p ˜ . Although p ˜ is decreased, it is less than p c which is caused by ϕ = 0.0406 less than each ϕ c . To support these findings, the model is simulated with the parameters given in Table 1 and p = 0.812 , which corresponds to the 81.2% vaccination coverage of DTP5 (Diphthera –Tetanus–Pertussis Vaccine for only children younger than 7 years old [78]) in Thailand 2017. The dynamics of the fraction of asymptomatic and infected individuals (denoted the A / N and I / N ) are shown in Figure 9. It is found, from Figure 9c,d, that diphtheria is eliminated for approximately 3 years, which is quite a short period. When % p increases to 83.8%, 84.6% and 84.8%, it is found that the timing of eliminated diphtheria is eliminated for approximately 6, 9, and 11 years, respectively. To explore the cause of this finding, the effects of p = 0.812 and p = 0.846 are compared in the first year after immunization. For p = 0.812 , it is found that the I / N decreases at the beginning, then continuously increases after approximately two months, see a red curve in Figure 9b. This is caused by continuously increasing the A / N , see a red curve in Figure 9a. However, the values of the A / N and I / N are quite small compared with the values at the beginning of the first epidemic curve after 36 months, see a red curve in Figure 9c,d.
This is due to asymptomatic carriers contributing to the spread of the disease, which is the cause of covert infections in a community in that time period. In addition, children get DTP5 at 4–6 years old and Td (Tetanus, Diphtheria Vaccine for children 7 years and older, adolescents and adults [79]) dose at 11–12 years old, the DTP5 coverage is the cause to have a gap of age groups that will become a risk group for Td vaccine dose [6]. Therefore, the study results verify that asymptomatic individuals are influential in the effectiveness of the vaccination strategy.

5. Discussion and Conclusions

To maintain adequate levels of controlling diphtheria when immunity from previous doses wanes off and the recommended booster vaccinations in different years of ages [80]. This fact, the reported diphtheria cases and the proportion of vaccinated individuals have been increasingly interested in the long-term effects of vaccination on population immunity [5,6]. The diphtheria model with asymptomatic infection, logistic growth, and vaccination is formulated for assessing the impact of imperfect vaccination coverage against the diphtheria outbreak. The proposed model is rigorously analyzed to gain insights into its dynamical features and the main results obtained are as follows.
(i)
The threshold value called the basic reproductive number under vaccination of the diphtheria-vaccine model, denoted by R V , is derived by using the next generation method. It is found that the disease-free equilibrium of the diphtheria-vaccine model is globally asymptomatically stable whenever R V 1 in the sense that routine vaccination against diphtheria can lead to the effective control or elimination of diphtheria if it can bring (and maintain) R V 1 . Furthermore, the critical rate of vaccination ( ϕ c ) and the threshold vaccine-induced community herd immunity of the proposed model ( p c ) are derived. It is found that p c is identical to the formula of herd immunity (also called community immunity) which is a new result found in this study.
(ii)
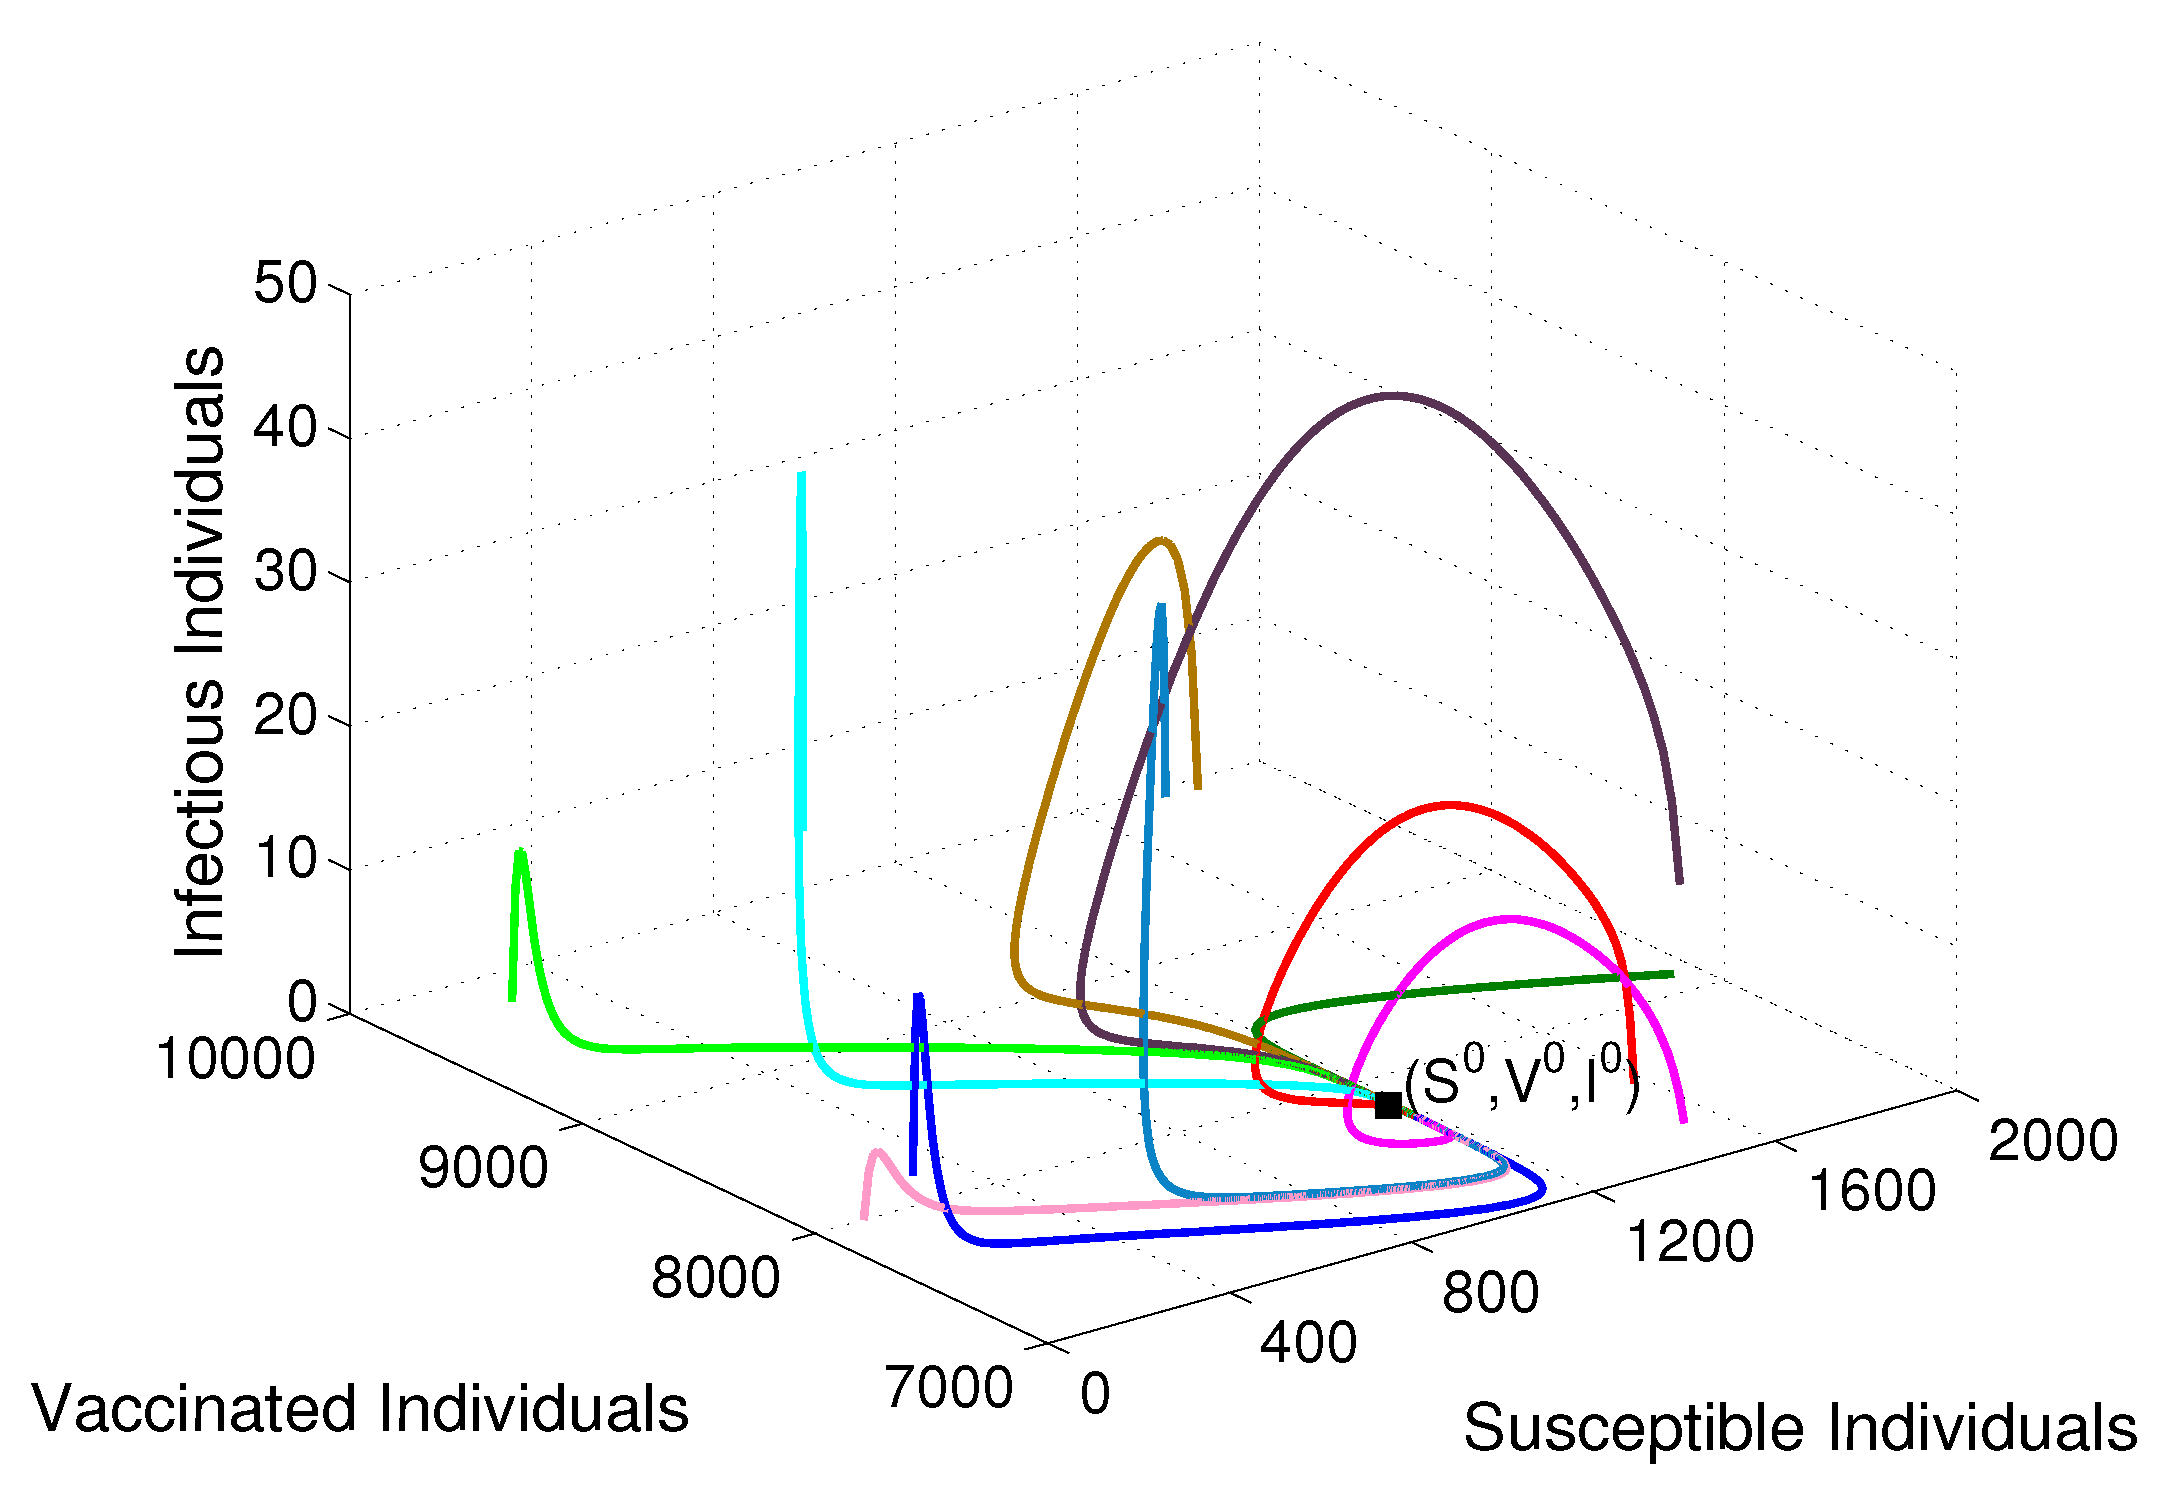
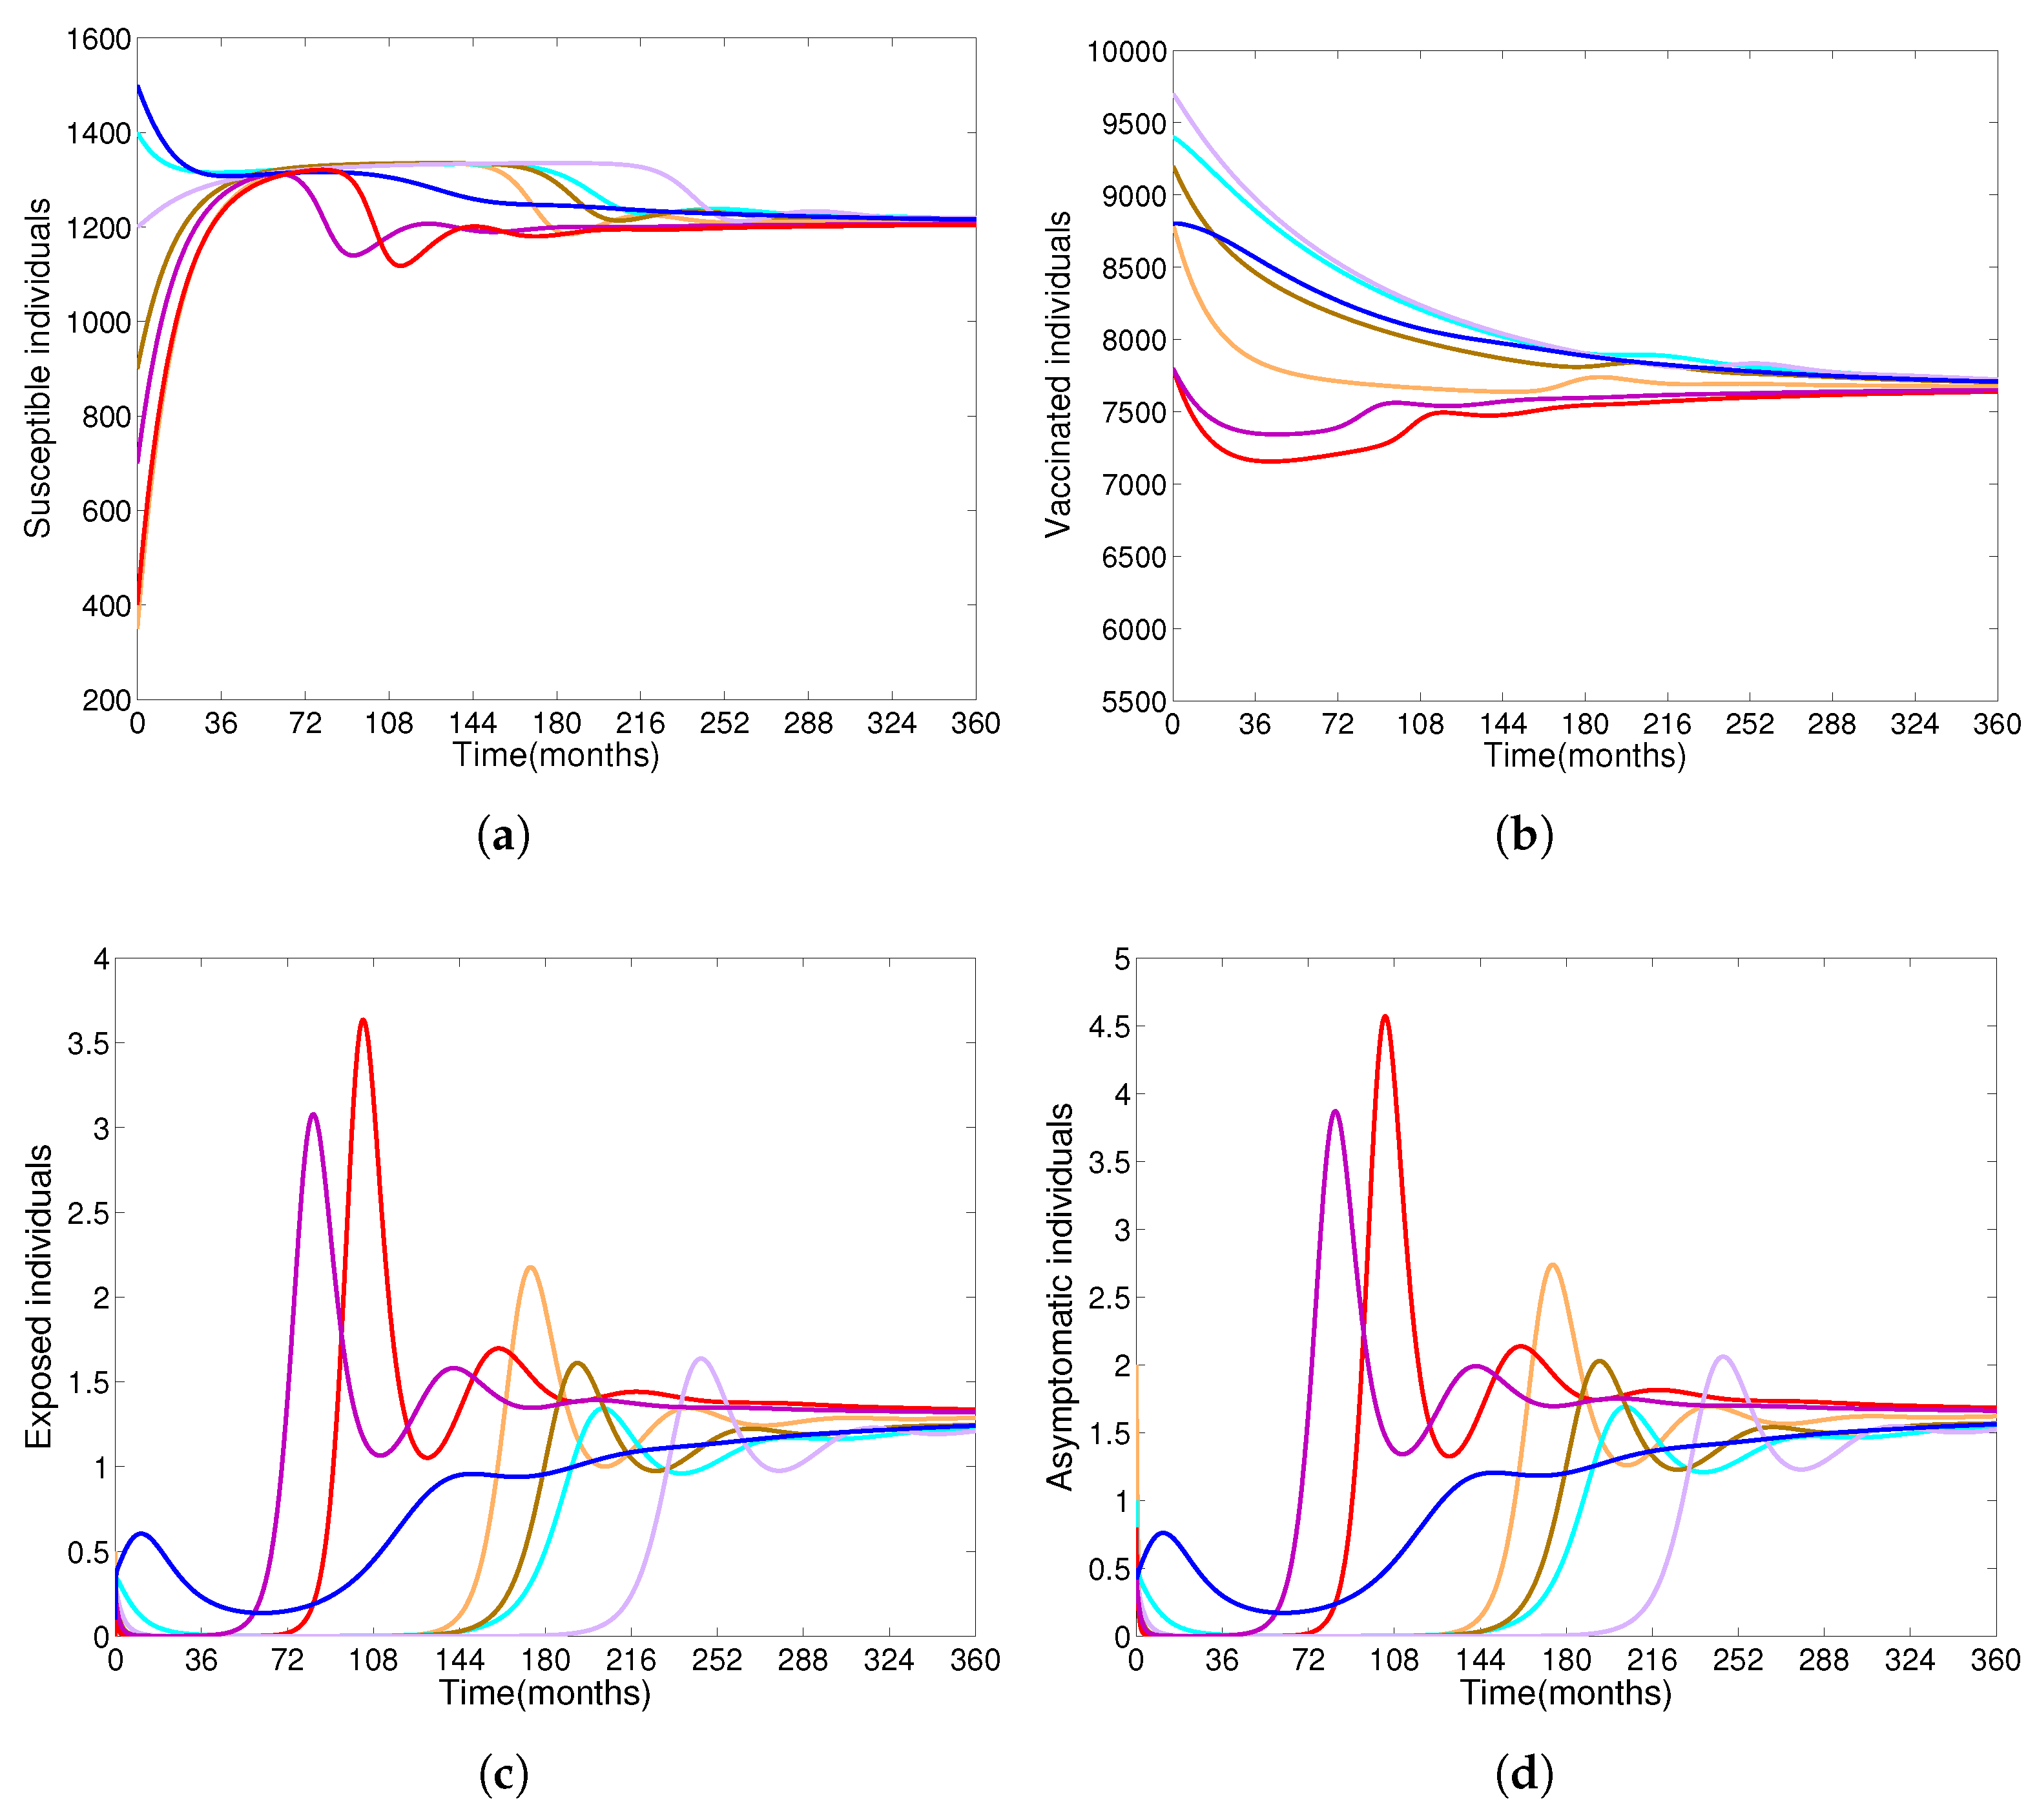
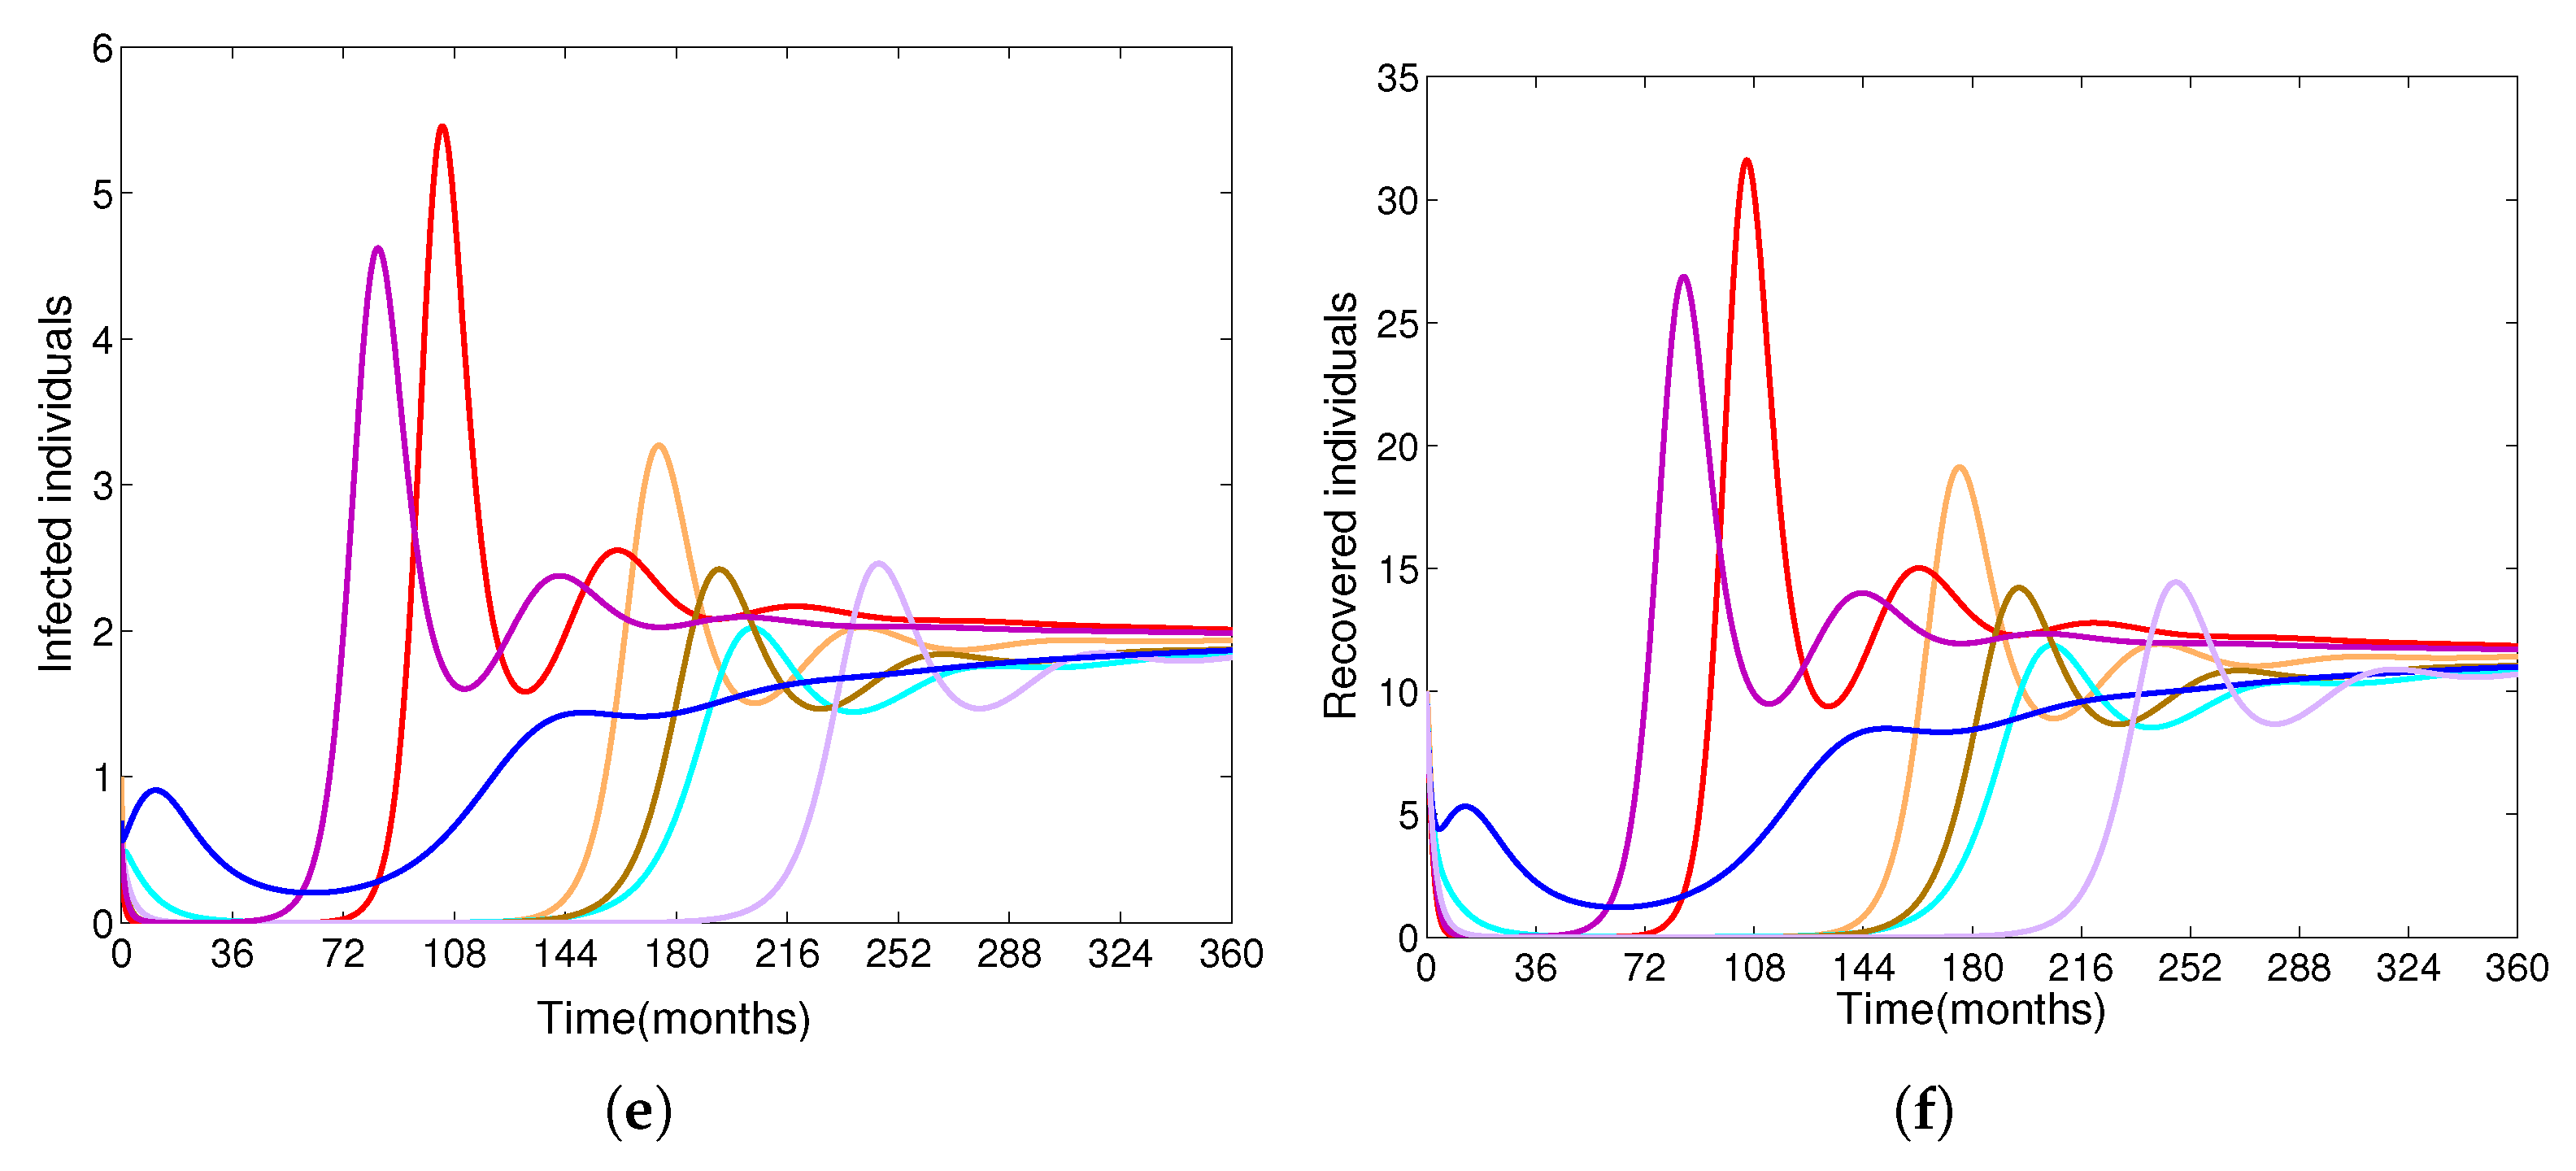
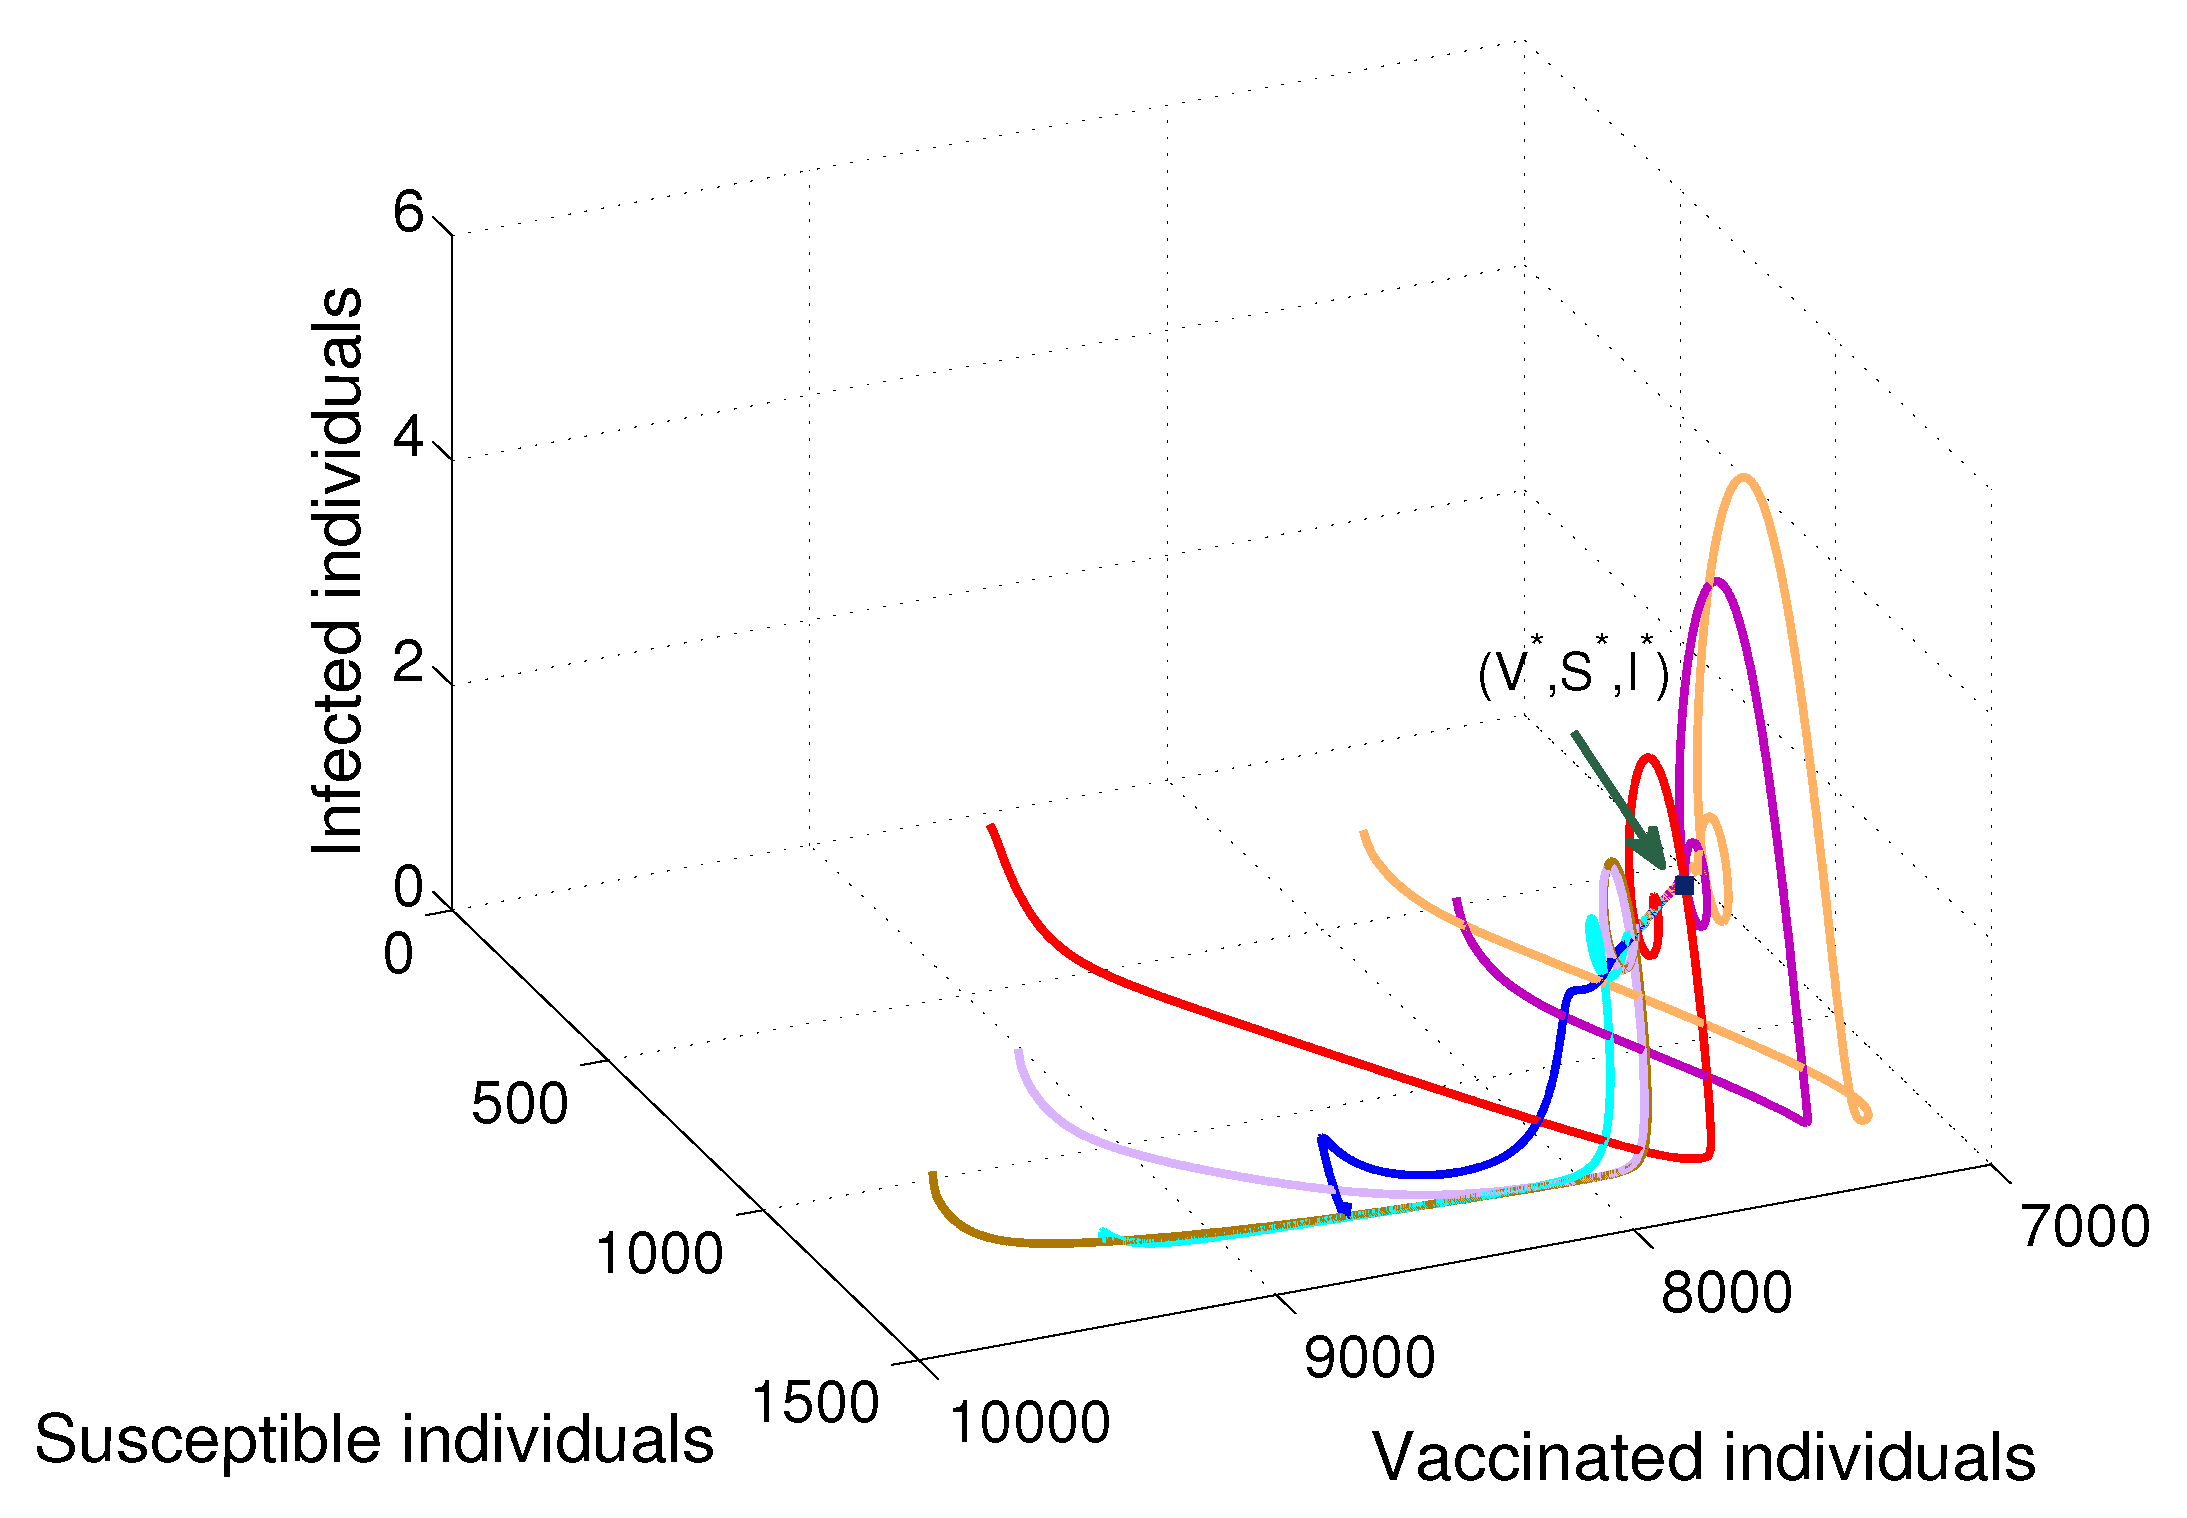
Based on constructing the suitable Lyapunov functions, it is found that the endemic equilibrium of the proposed model is globally asymptotically stable whenever R V > 1 . The epidemiological implication of these results is that the community transmission of diphtheria can be significantly curtailed if R V 1 and the disease still persists in the community if R V > 1 , that is, the vaccination program adopted is not effective. The implication of global stability of equilibrium is verified that the solution of the diphtheria-vaccine model converges to the correct equilibria irrespective of the initial sizes of the six state variables. Our simulations show that if the initial sizes of sub-populations have fluctuated, they will affect fast (slow) convergence to a correct equilibrium. This finding is interesting because the initial sizes of sub-populations, especially, susceptible and vaccinated individuals are major factors in either eliminating diphtheria or controlling diphtheria spreads before the next vaccine type is taken.
(iii)
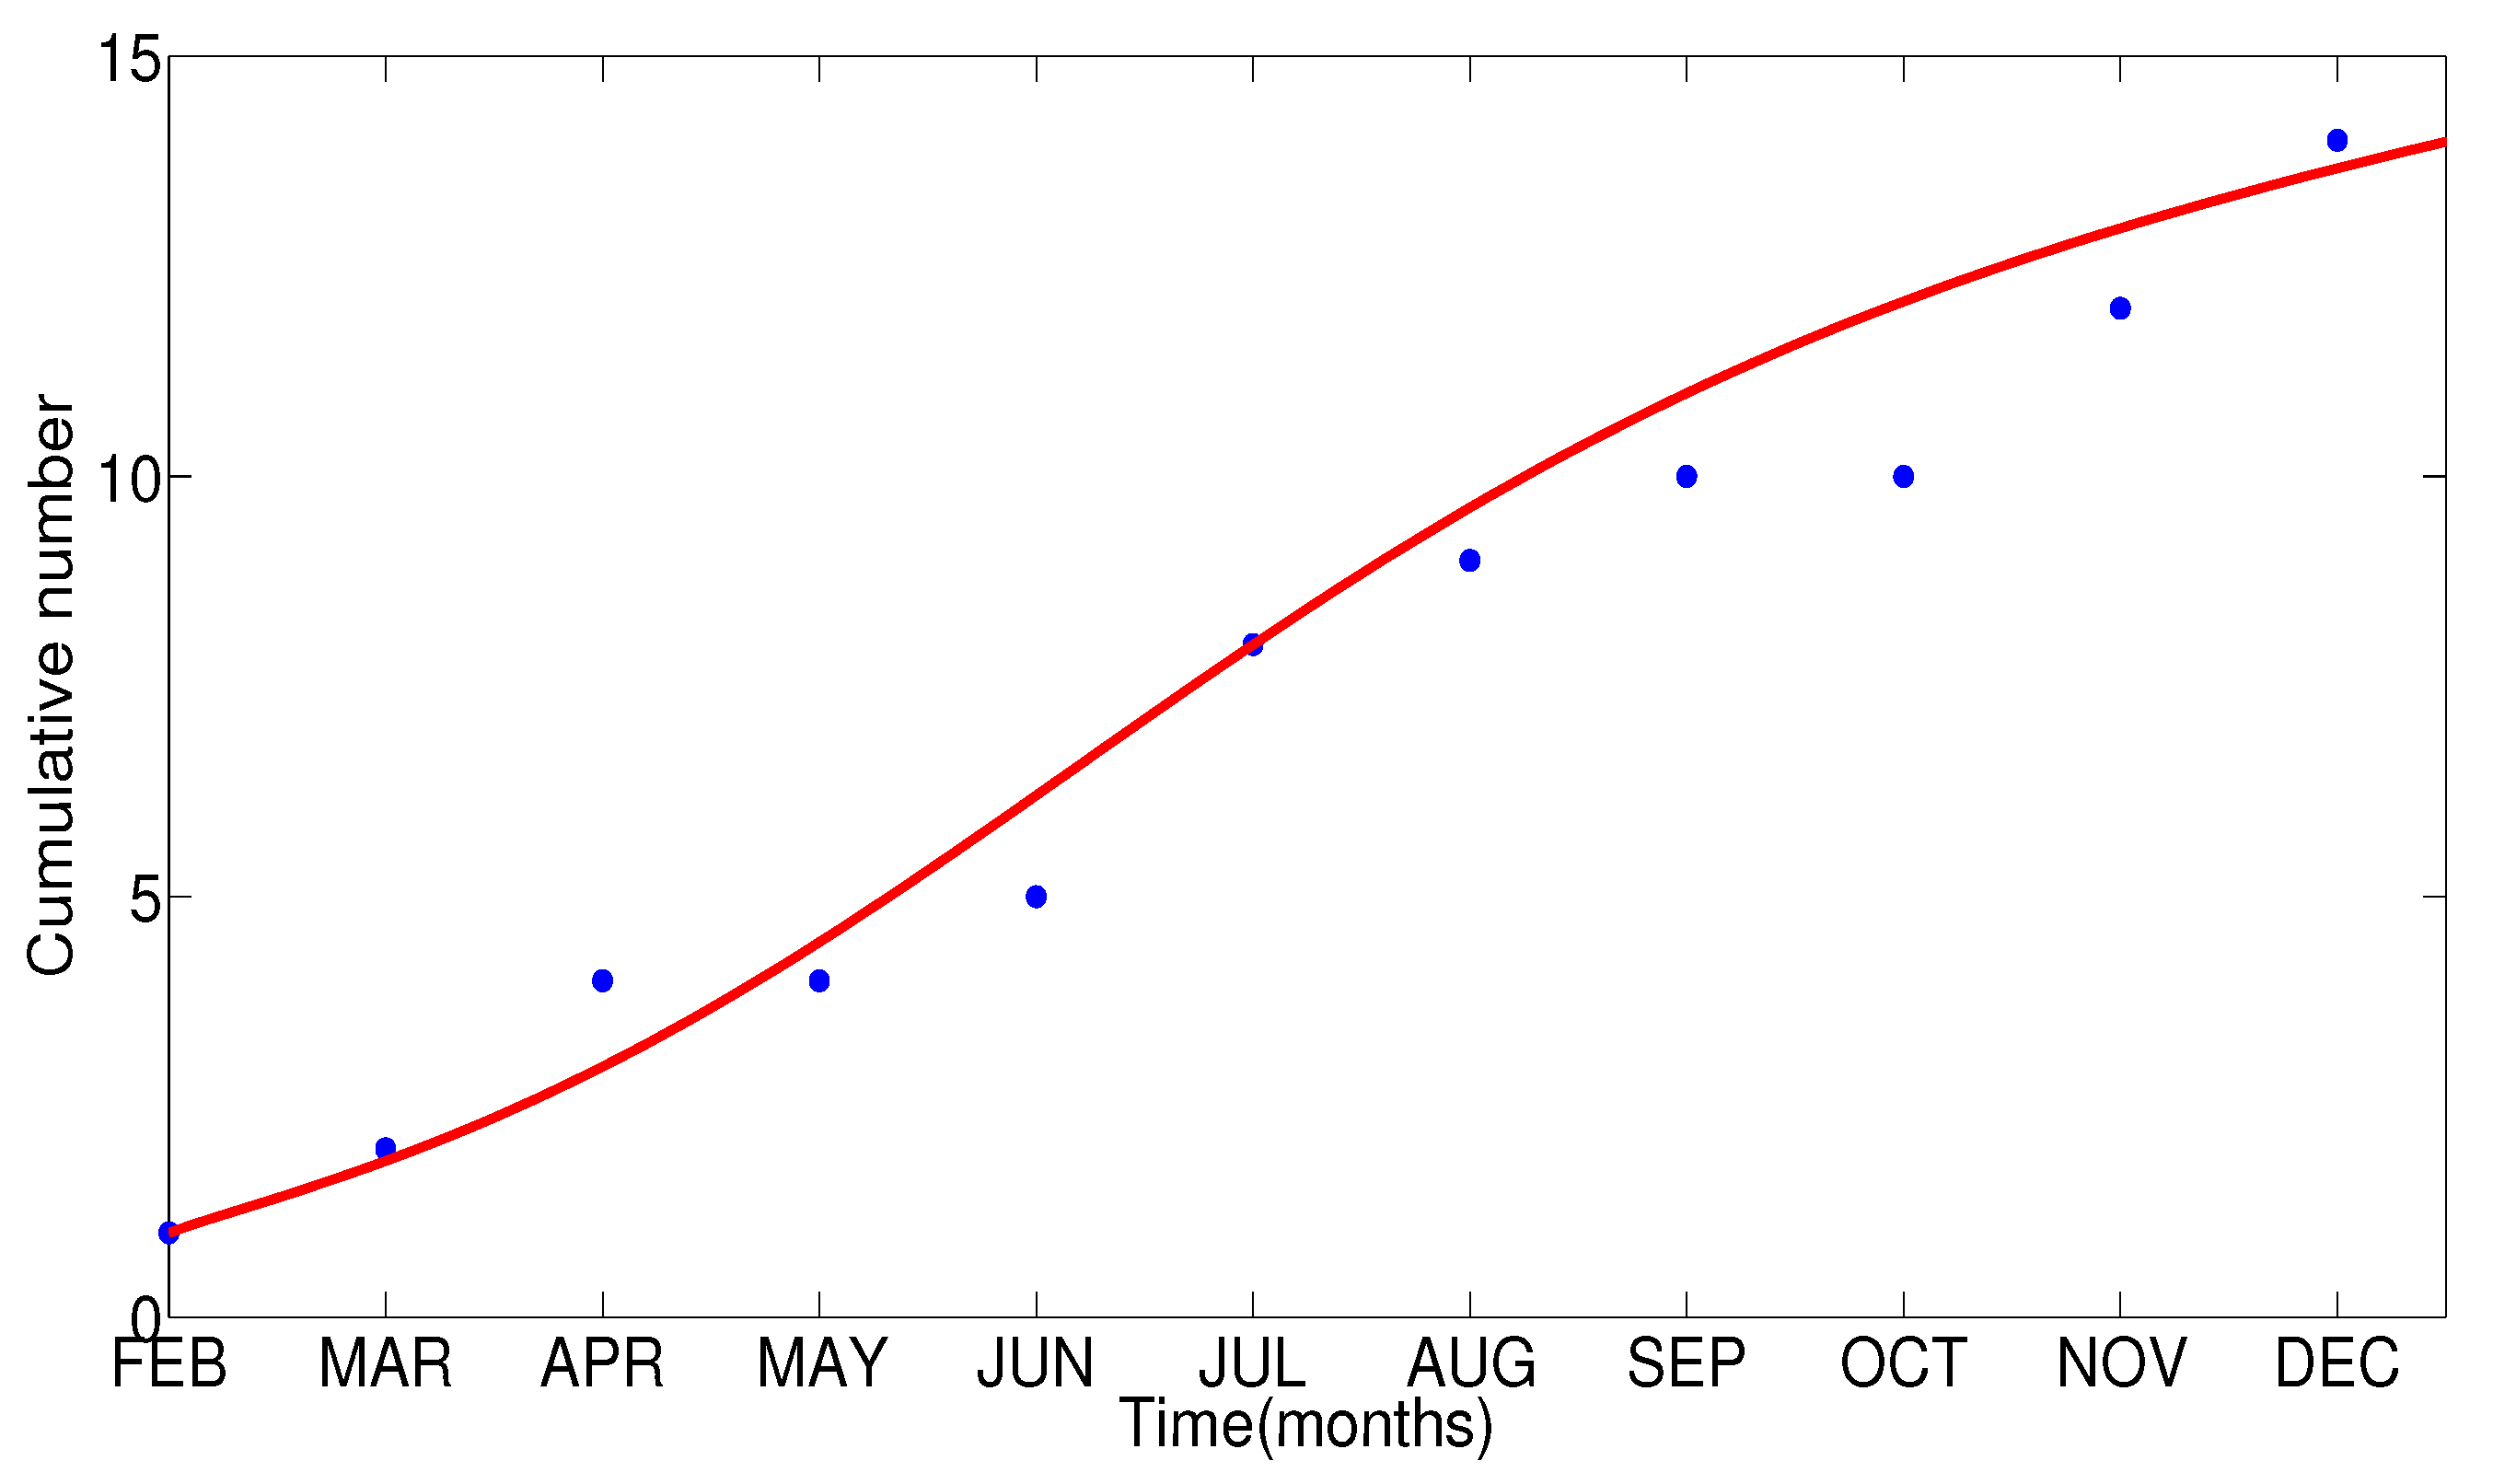
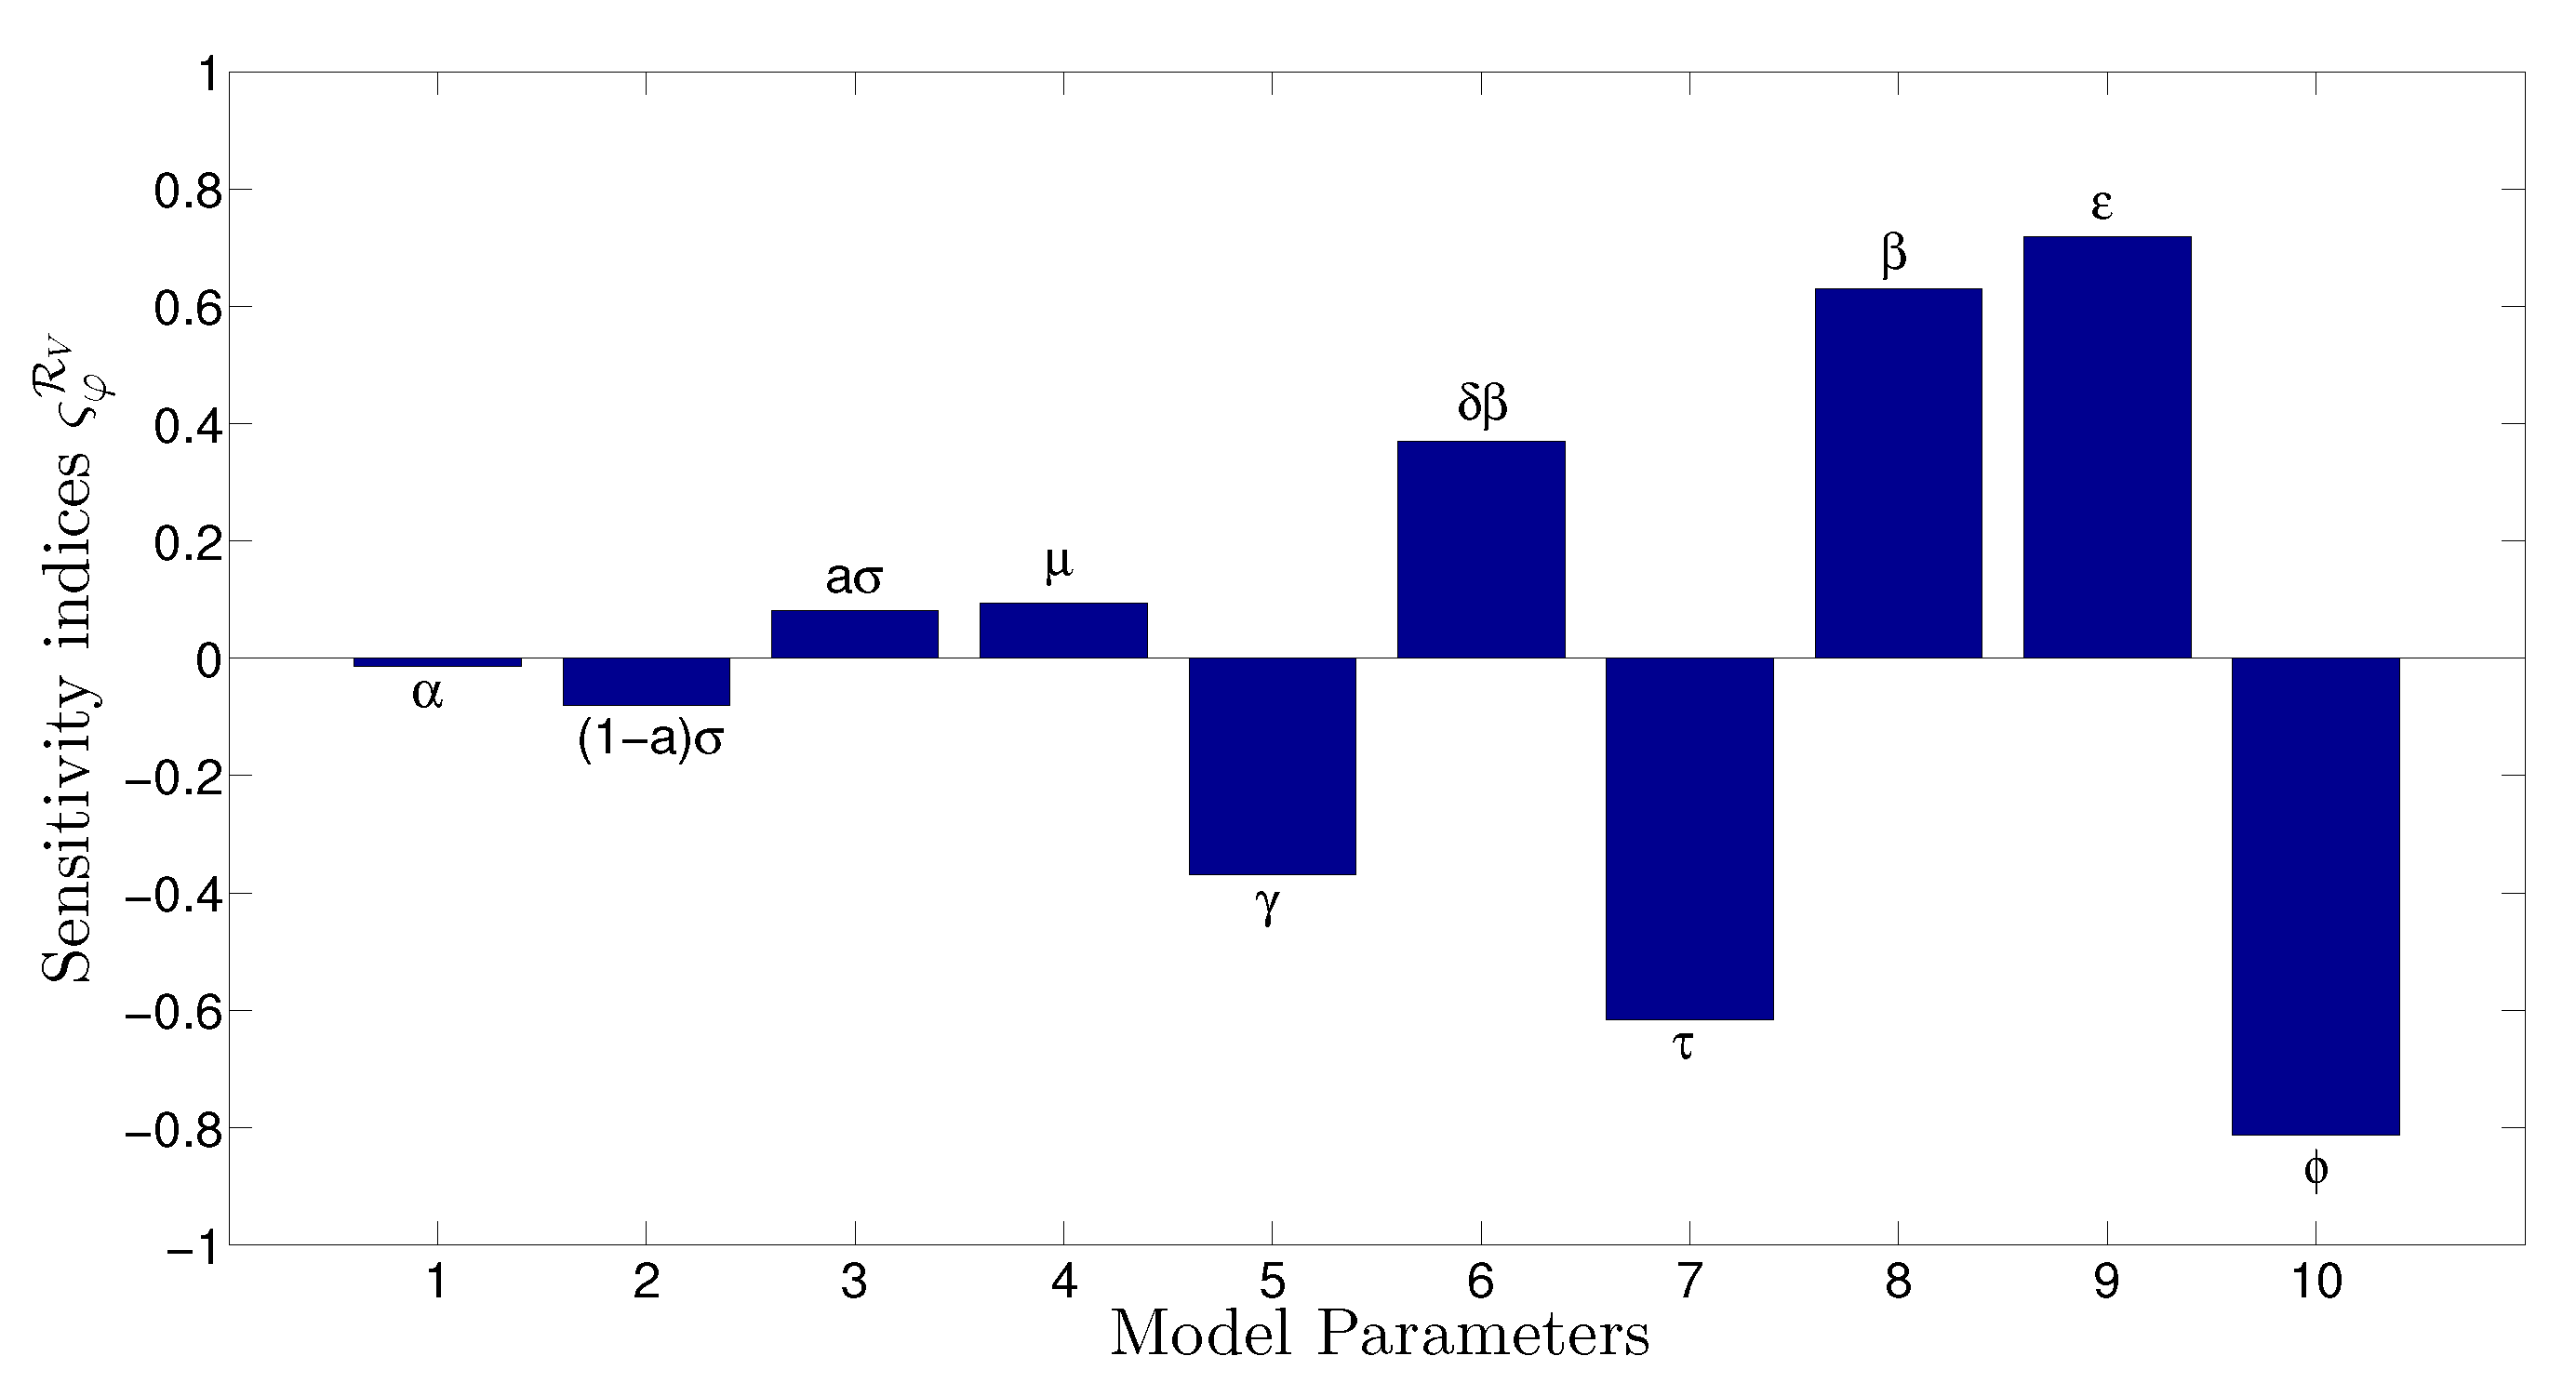
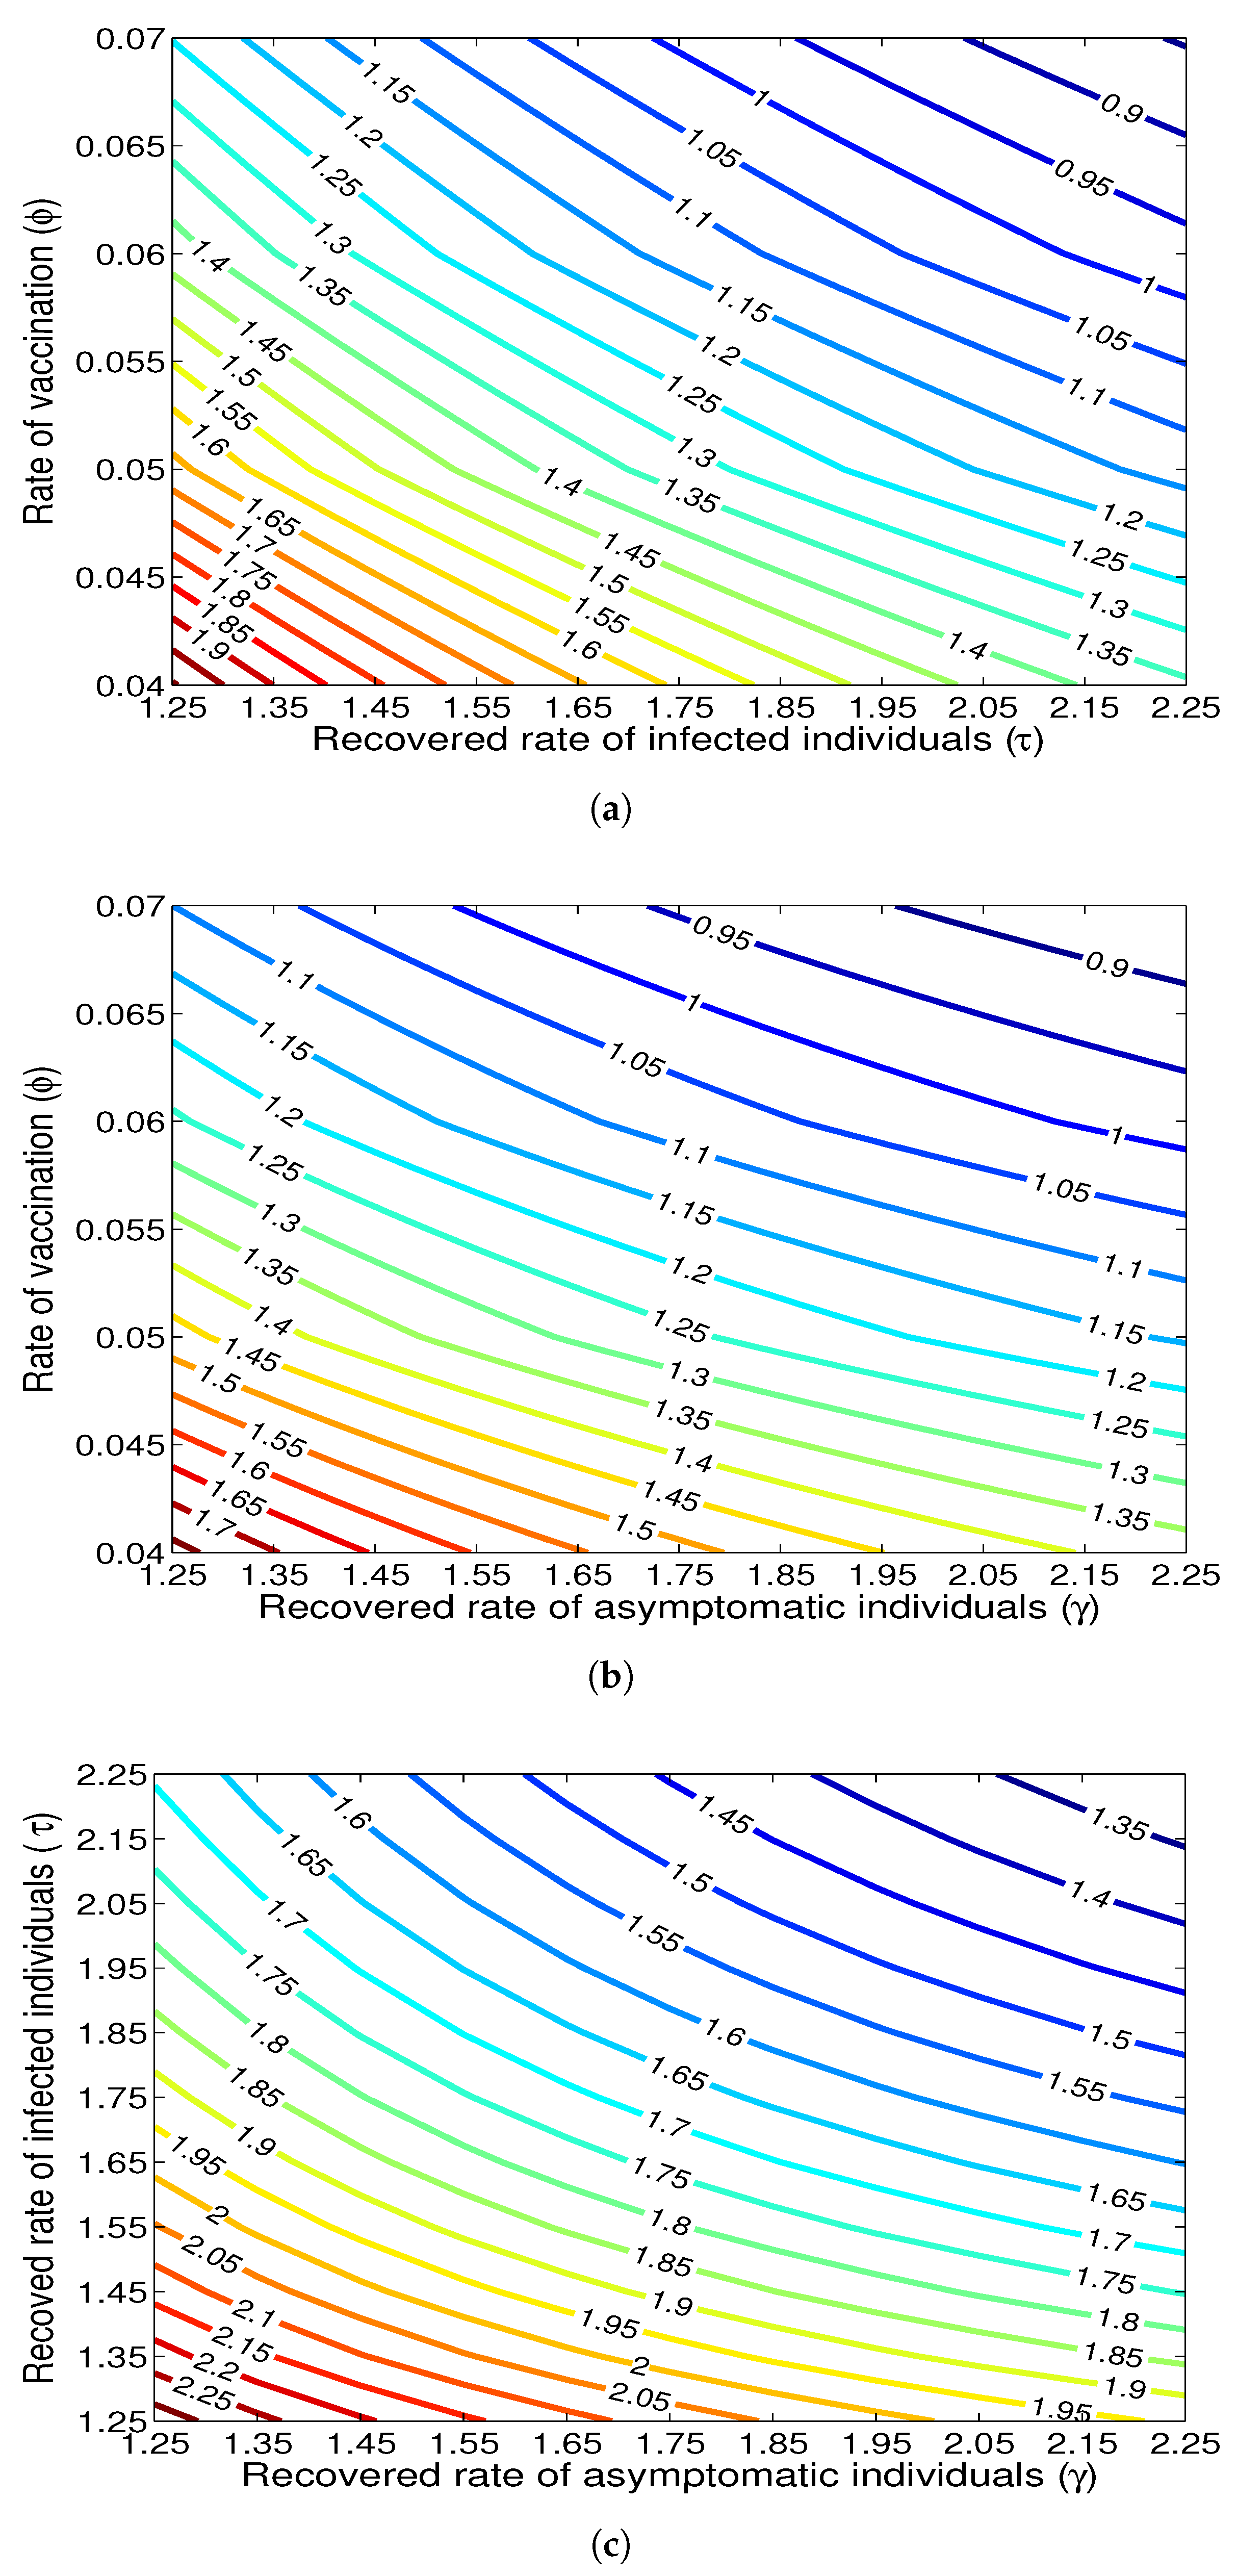
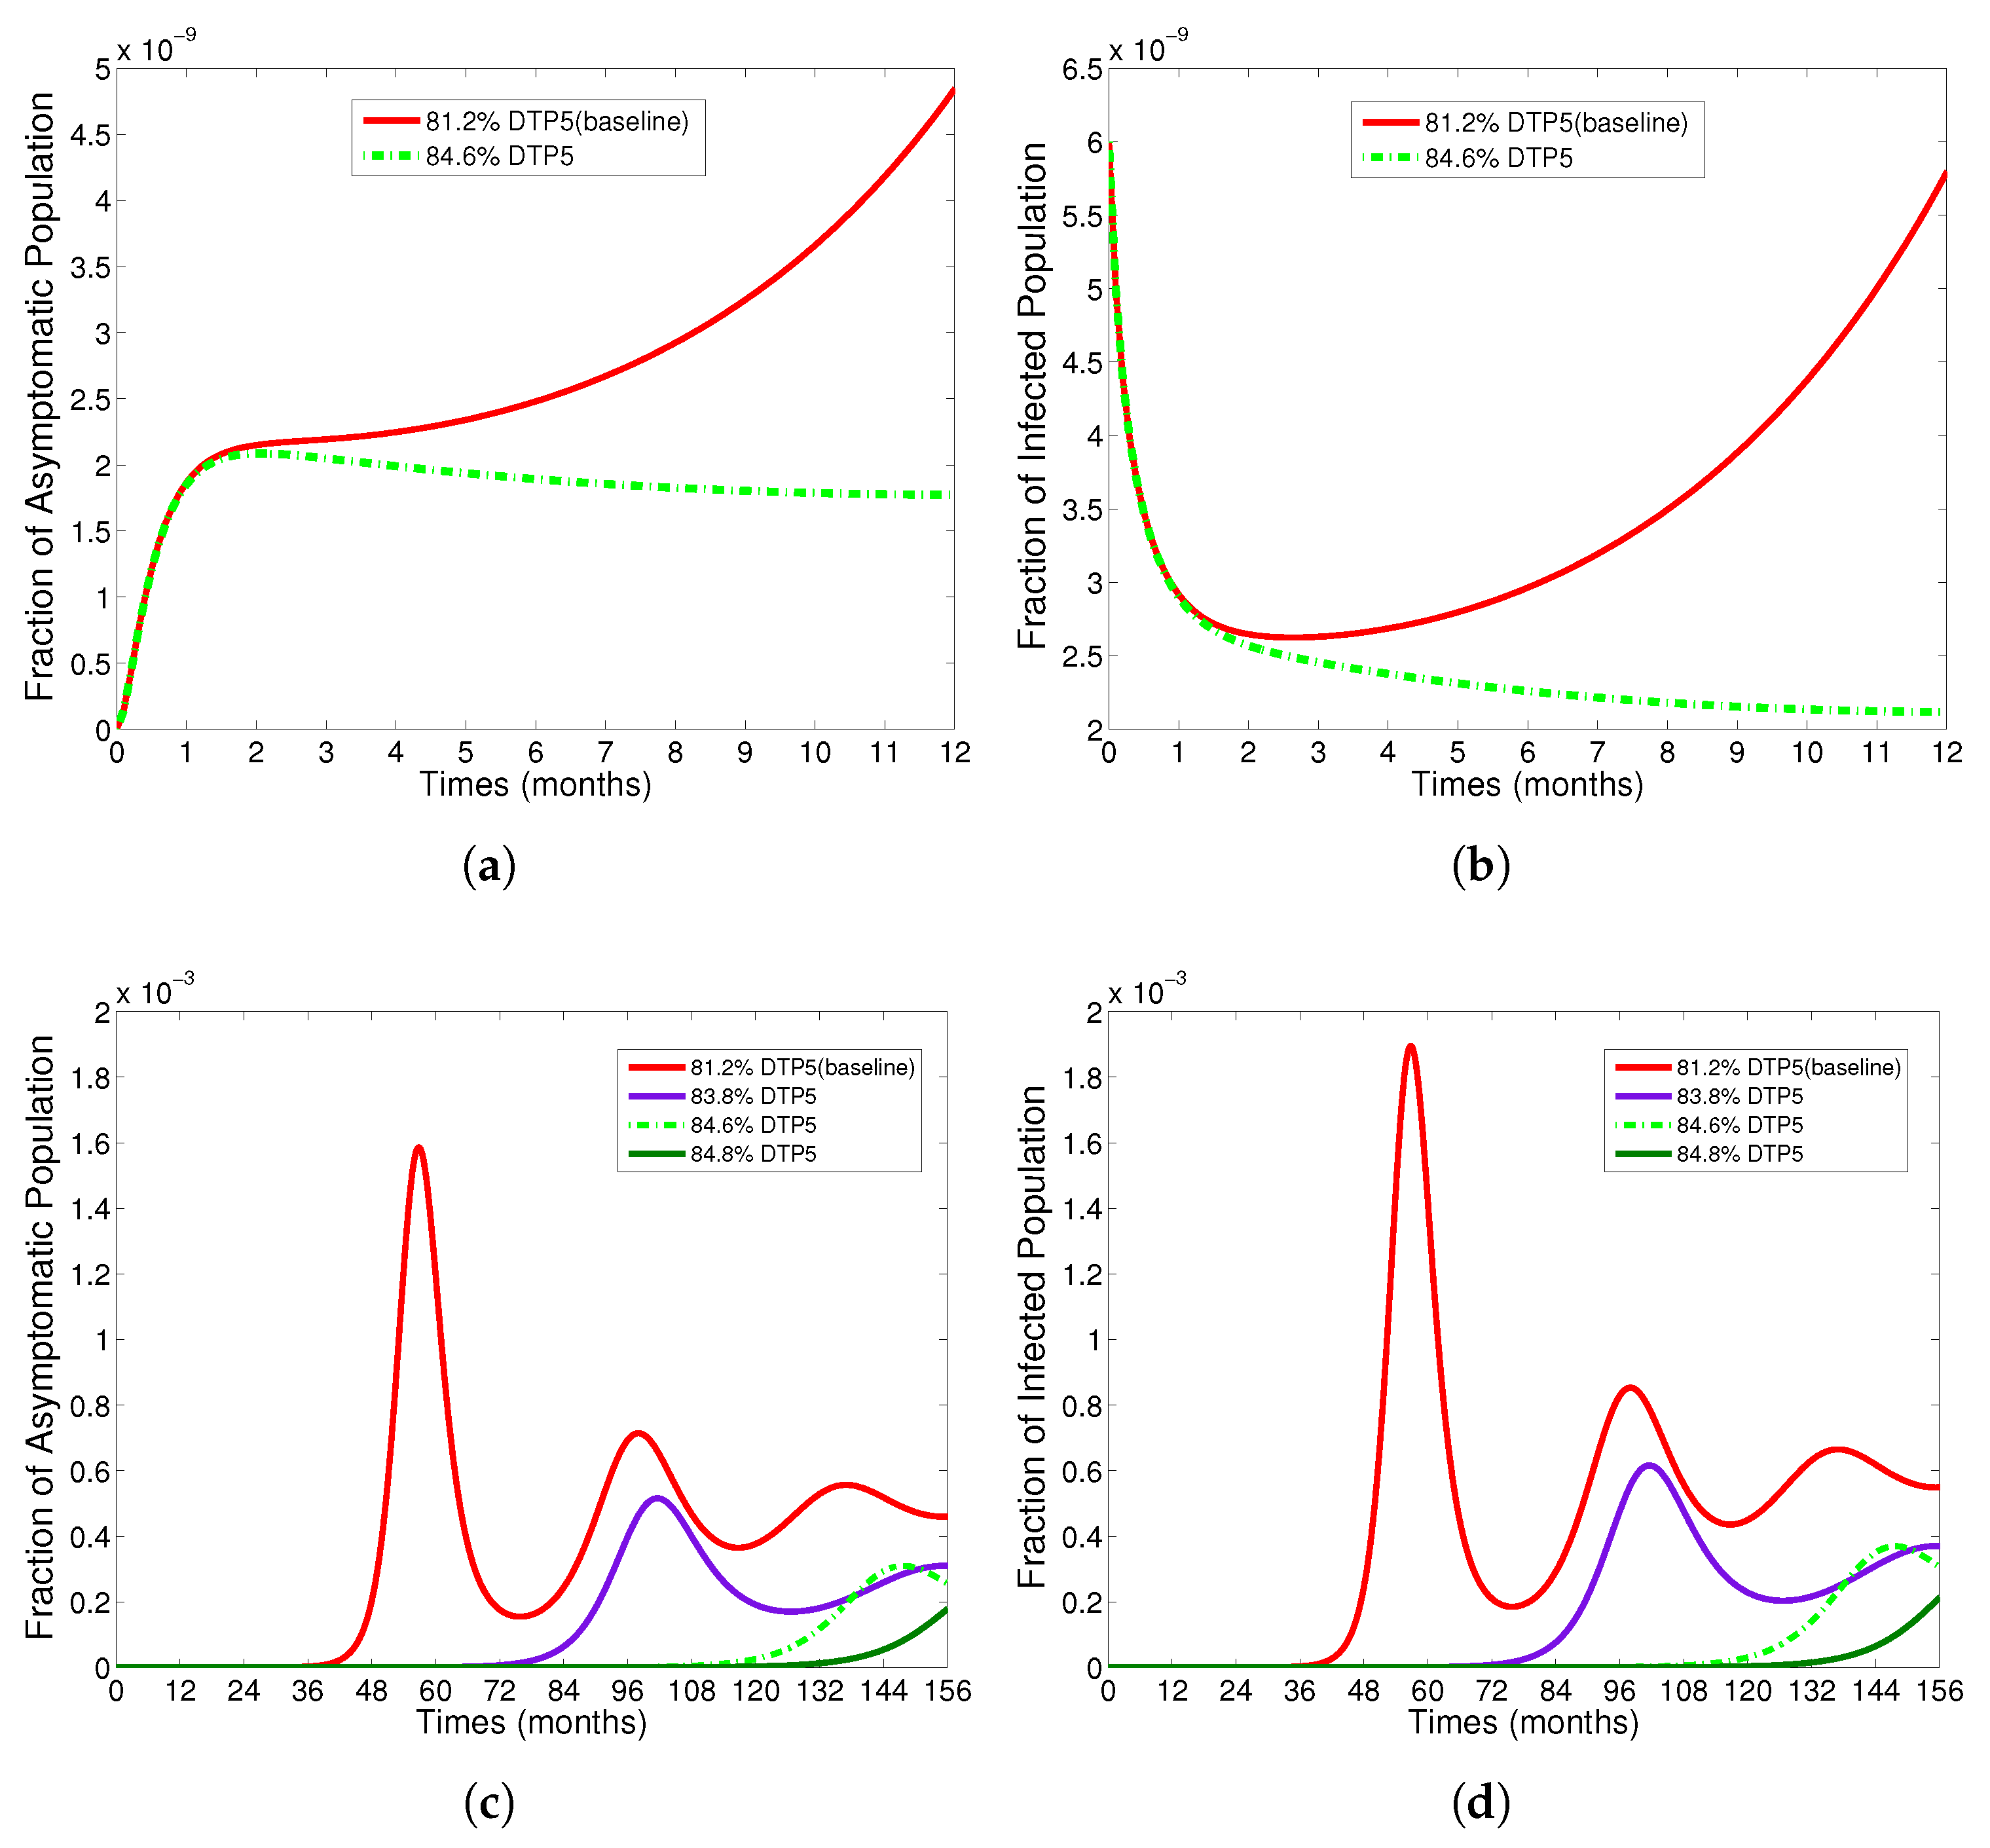
The appropriate model parameters given in Table 1 are obtained by comparing the cumulative number of diphtheria cases produced by the diphtheria-vaccine model with the real cases in Thailand in 2018. The sensitivity analysis of R V has demonstrated that the rate of vaccination is the most sensitive to R V . Contour plots of R V suggest the combined control measures should be addressed on the rate of vaccination and the incubation period of asymptomatic individuals. Further, we consider the asymptomatic class as a separate population because this population can spread the infection without being sick themselves. The study results obtained indicate that the incubation period of asymptomatic individuals has an impact on the optimal vaccination coverage level needed for diphtheria eradication, see Table 2. Our simulations also show that when the vaccination coverage level is greater than the threshold value ϕ c , asymptomatic individuals still persist in the community for some period of time, even though the infected individuals decrease and are eventually eliminated. In epidemiology, this result supports the possibility of asymptomatic infection being related to antibody decay due to waning and not boosting immunity [54]. Although it is well known that a low rate of vaccination has had an impact on the vaccination proportion resulting in the duration of diphtheria protection, this is the first time to investigate the impact of asymptomatic infection on the vaccination coverage for the past and recent vaccination coverage levels have an effect on the duration of diphtheria’s protection, and it is also the cause of discovering the patients in the different age groups [6]. Therefore, our study suggests that the officers involving disease control should be concerned not only with maintaining the coverage level needed for the primary vaccination but they should be concerned to maintain the boosting vaccination coverage level for all adults every 10 years at least the threshold coverage level ( p c ) in order to significantly halt the spread of diphtheria in the community.
On the other views, with all the international travel in the world these days, it is important to keep vaccines, or immunizations, up to date as the asymptomatic population is one of the main factors that are difficult to control. If this population group travels, diphtheria will spread quickly. For this reason, the most careful factor of diphtheria disease would be the traveler, especially inadequately vaccinated people who travel internationally or have contact with people from less-developed countries. Therefore, the optimal vaccination coverage for each age group with a transport-related infection needs to be included in the model, which will be our future work.

Author Contributions

Writing—original draft preparation, S.K., S.C. and W.C.; writing—review and editing, S.K., S.C. and W.C.; funding acquisition, S.K., S.C. and W.C. All authors have read and agreed to the published version of the manuscript.

Funding

This project is supported by the Health Systems Research Institute (P-13-50148) under the project management of the National Science and Technology Development Agency (NSTDA), Thailand and the Petchra Pra Jom Klao Ph.D. research scholarship, King Mongkut’s University of Technology Thonburi (KMUTT), under contract No. 31/2557.

Institutional Review Board Statement

Not applicable.

Informed Consent Statement

Not applicable.

Data Availability Statement

Not applicable.

Acknowledgments

The first author Siwaphorn Kanchanarat is grateful to the Petchra Pra Jom Klao Ph.D. research scholarship, King Mongkut’s University of Technology Thonburi (KMUTT), under contract No. 31/2557 for the financial support during her study doctor of philosophy. The authors would like to express our gratitude to thank the editor and the anonymous referees for their valuable comments and suggestions that greatly improved our original manuscript.

Conflicts of Interest

The authors declare no conflict of interest.

Appendix A. Proof of Theorem 4

Proof. 
To apply the Centre Manifold theory [81] and Theorem 4.1 in [82], let x = ( x 1 , x 2 , x 3 , x 4 , x 5 , x 6 ) T with S = x 1 , V = x 2 , E = x 3 , A = x 4 , I = x 5 , R = x 6 , so that N = x 1 + x 2 + x 3 + x 4 + x 5 + x 6 . Further, the system (1) is first rewritten in the form
d x d t = f ( x ) ,
where f ( x ) = ( f 1 ( x ) , f 2 ( x ) , f 3 ( x ) , f 4 ( x ) , f 5 ( x ) , f 6 ( x ) ) T ,
f 1 ( x ) = r N 1 N K β x 1 ( δ x 4 + x 5 ) N k 1 x 1 + ε x 2 , f 2 ( x ) = ϕ x 1 + θ x 6 k 2 x 2 , f 3 ( x ) = β x 1 ( δ x 4 + x 5 ) N k 3 x 3 , f 4 ( x ) = ( 1 a ) σ x 3 k 4 x 4 , f 5 ( x ) = a σ x 3 k 5 x 5 , f 6 ( x ) = γ x 4 + τ x 5 k 6 x 6 .
The Jacobian of the system (A1) evaluated at P 0 is given by
J ( P 0 ) = A B C D ,
where k 8 = r 2 μ ,
A = ( k 1 + k 8 ) ε k 8 k 8 ϕ k 2 0 0 0 k 3 , B = β δ k 2 + k 7 k 8 k 7 β k 2 + k 7 k 8 k 7 k 8 0 0 θ β δ k 2 k 7 β k 2 k 7 0 , C = 0 0 a ˜ σ 0 0 a σ 0 0 0 and D = k 4 0 0 0 k 5 0 γ τ k 6 , respectively .
It follows, from (5), that R V = 1 is equivalent to
β = β = k 3 k 4 k 5 k 7 k 2 σ ( a k 4 + a ˜ δ k 5 ) ,
and the DFE, P 0 , is locally asymptotically stable when β < β and unstable when β > β as guaranteed by Theorem 1. Hence, β = β is a bifurcation parameter. Furthermore, it can be shown that the system (A1) with β = β has at least one non-hyperbolic equilibrium point; that is, the assumption (A1) of Theorem 4.1 in [82] is verified. Using the notations in [82], the right eigenvector of J ( P 0 ) with β = β is given by w = [ w 1 , w 2 , w 3 , w 4 , w 5 , w 6 ] T , where
w 1 = k 5 a ˜ + a k 4 σ ε θ + k 2 k 4 k 5 k 6 + σ k 4 k 2 + θ μ + τ + a ˜ α r ˜ + a σ α k 2 k 4 k 6 w 5 a r ˜ σ k 4 k 6 k 7 , w 2 = ϕ a τ + Q 1 θ σ r ˜ σ k 6 + γ a ˜ k 5 + a τ + k 4 k 6 k 5 + a σ ϕ r ˜ a ϕ σ α k 4 k 6 w 5 a r ˜ σ k 4 k 6 k 7 , w 3 = k 5 w 5 a σ , w 4 = a ˜ k 5 w 5 a k 4 , w 6 = γ a ˜ k 5 + a τ k 4 w 5 a k 4 k 6 , w 5 = w 5 > 0 .
Further, the left eigenvector of J ( P 0 ) with β = β is given by v = [ v 1 , v 2 , v 3 , v 4 , v 5 , v 6 ] , where
v 1 = v 2 = v 6 = 0 , v 3 = ( a k 4 + a ˜ δ k 5 ) σ v 5 k 3 k 4 , v 4 = δ k 5 v 5 k 4 , v 5 = v 5 > 0 .
Finally, evaluating the associated non-zero partial derivatives of f i , i = 1 , 2 , . . . , 6 (given in (A2)) at P 0 with β = β and using the expressions in (A4) and (A5), the coefficients A and B defined in [82] are given by
A = k , i , j = 1 6 υ k ω i ω j 2 f k x i x j ( P 0 , β ) , = 2 r k 5 Q 2 σ k 2 k 6 a k 4 + a ˜ k 5 + Q 1 k 2 + θ + k 2 k 4 k 5 k 6 v 5 w 5 2 r ˜ σ k 2 k 4 2 k 6 a 2 K , B = k , i = 1 6 υ k ω i 2 f k x i β ( P 0 , β ) = Q 2 2 σ k 2 w 5 v 5 a k 3 k 4 2 k 7 ,
Clearly, A is negative and B is positive. By Theorem 3 and Theorem 4.1 in [82], the unique endemic equilibrium point P , therefore, is locally asymptotically stable whenever R V > 1 and β > β with β close to β . □

References

  1. Diphtheria. Available online: https://www.cdc.gov/vaccines/pubs/pinkbook/downloads/dip.pdf (accessed on 10 June 2021).
  2. Immunization Vaccines and Biologicals Diphtheria. Available online: https://www.who.int/data/gho/data/themes/immunization (accessed on 11 March 2021).
  3. Choe, Y.J.; Vidor, E.; Manson, C. Post-marketing surveillance of Tetravalent Diphtheria-Tetanus-Acellular pertussis and inactivated poliovirus (DTaP-IPV) vaccine in South Korea, 2009 to 2015. Infect Dis. Ther. 2022, 11, 1479–1492. [Google Scholar] [CrossRef]
  4. Hamborsky, J.; Kroger, A.; Wolfe, C. Diphtheria. In Epidemiology and Prevention of Vaccine-Preventable Diseases, 5th ed.; CDC: Atlanta, GA, USA, 2015; pp. 107–118. [Google Scholar]
  5. World Health Organization. Diphtheria Reported Cases. 2019. Available online: https://apps.who.int/gho/data/view.main.1520_41?lang=en (accessed on 14 August 2021).
  6. National Disease Surveillance. (Report 506), Bureau of Epidemiology, Ministry of Public Health, Thailand. Diphtheria. Available online: http://doe.moph.go.th/surdata/disease.php?dcontent=old&ds=23 (accessed on 15 December 2021).
  7. Wanlapakorn, N.; Ngaovithunvong, V.; Thongmee, T.; Vichaiwattana, P.; Vongpunsawad, S.; Poovorawan, Y. Seroprevalence of antibodies to pertussis toxin among different age groups in Thailand after 37 years of universal whole-cell pertussis vaccination. PLoS ONE 2016, 12, e0148338. [Google Scholar] [CrossRef]
  8. World Health Organization. Global Vaccine Action Plan 2011–2020; WHO: Geneva, Switzerland, 2013. [Google Scholar]
  9. Clarke, K.E.N.; MacNeil, A.; Hadler, S.; Scott, C.; Tiwari, T.S.P.; Cherian, T. Global epidemiology of diphtheria, 2000–2017. Emerg. Infect. Dis. 2019, 25, 1834–1842. [Google Scholar] [CrossRef]
  10. Annual Report. 2017. Available online: https://apps-doe.moph.go.th/boeeng/download/AESR-6112-24.pdf (accessed on 10 January 2021).
  11. Annaul Epidemiological Surveillance Report. 2018. Available online: https://apps-doe.moph.go.th/boeeng/download/AW_Annual_Mix%206212_14_r1.pdf (accessed on 1 March 2021).
  12. Annual Epidemiological Surveillance Report. 2019. Available online: https://apps-doe.moph.go.th/boeeng/download/MIX_AESR_2562.pdf (accessed on 8 May 2021).
  13. Nanthavong, N.; Black, A.; Nouanthong, P.; Souvannaso, C.; Vilivong, K.; Muller, C.; Goossens, S.; Quet, F.; Buisson, Y. Diphtheria in Lao PDR: Insufficient coverage or ineffective vaccine? PLoS ONE 2015, 10, e0121749. [Google Scholar] [CrossRef] [PubMed]
  14. Kaji, A.; Parker, D.; Chu, C.; Thayatkawin, W.; Suelaor, J.; Charatrueangrongkun, R.; Salathibuppha, K.; Nosten, F.; McGready, R. Immunization Coverage in Migrant School Children Along the Thailand-Myanmar Border. J. Immigr. Minor. Health 2016, 18, 1038–1045. [Google Scholar] [CrossRef] [PubMed]
  15. Hanvatananukul, P.; Prasarakee, C.; Sarachai, S.; Aurpibul, L.; Sintupat, K.; Khampan, R.; Saheng, J.; Sudjaritruk, T. Seroprevalence of antibodies against diphtheria, tetanus, and pertussis among healthy Thai adolescents. Int. J. Infect. Dis. 2020, 96, 422–430. [Google Scholar] [CrossRef]
  16. Sein, C.; Tiwari, T.; Macneil, A.; Wannemuehler, K.; Soulaphy, C.; Souliphone, P.; Reyburn, R.; Gonzalez, A.R.; Watkins, M.; Goodson, J.L. Diphtheria outbreak in Lao People’s Democratic Republic, 2012–2013. Vaccine 2016, 34, 4321–4326. [Google Scholar] [CrossRef]
  17. Ohyver, M.; Pudjihastuti, H. Modeling the number of diphtheria cases in East Java province using zero-inflated poisson regression. Procedia Comput. Sci. 2018, 135, 643–647. [Google Scholar] [CrossRef]
  18. Jhancy, M.; Satyavani, A.; Manikyamba, D.; Deepthi, K.T. Re-emergence of diphtheria—An outbreak from east Godavari District, Andhra Pradesh. Pediatr. Infect. Dis. 2015, 7, 33–35. [Google Scholar] [CrossRef]
  19. Operational Guidelines of Prevention, Control and Treatment of Diphtheria. 2020. Available online: https://ddc.moph.go.th/uploads/files/1161920200220072136.pdf (accessed on 9 October 2021).
  20. Sen, M.; Ibeas, A.; Quesada, S. On vaccination controls for the SEIR epidemic model. Commun. Nonlinear Sci. Numer. Simul. 2012, 17, 2637–2658. [Google Scholar] [CrossRef]
  21. Bai, Z.; Zhou, Y. Global dynamics of an SEIRS epidemic model with periodic vaccination and seasonal contact rate. Nonlinear Anal. Real World Appl. 2012, 13, 1060–1068. [Google Scholar] [CrossRef]
  22. Bentaleb, D.; Amine, S. Lyapunov function and global stability for a two-strain SEIR model with bilinear and nonmonotone incidence. Int. J. Biomath. 2019, 12, 1950021. [Google Scholar] [CrossRef]
  23. Xu, R.; Wang, Z.; Zhang, F. Global stability and hopf bifurcations of an SEIR epidemiological model with logistic growth and time delay. Appl. Math. Comput. 2015, 269, 332–342. [Google Scholar] [CrossRef]
  24. Earn, D.; Rohani, P.; Bolker, B.; Grenfell, B. A simple model for complex dynamical transitions in epidemics. Science 2000, 287, 667–670. [Google Scholar] [CrossRef]
  25. Teitelbaulm, M.; Edmunds, M. Immunization and vaccine-preventable illness, Unites States, 1992–1997. Stat. Bull. Metrop. Insur. Co. 1999, 80, 13–20. [Google Scholar]
  26. Wright, S. Pertussis infection in adults. South. Med. J. 1998, 91, 702–708. [Google Scholar] [CrossRef]
  27. Mossong, J.; Nokes, D.; Edmunds, W.; Cox, M.; Ratman, S.; Muller, C. Modelling the impact of subclinical measles transmission in vaccinated populations with waning immunity. Am. J. Epidemiol. 1999, 150, 1238–1249. [Google Scholar] [CrossRef]
  28. Knox, E.G. Strategy for rubella vaccination. Int. J. Epidemiol. 1980, 9, 13–23. [Google Scholar] [CrossRef]
  29. Samsuzzoha, M.; Singh, M.; Lucy, D. Uncertainty and sensitivity Analysis of the basic reproduction number of a vaccinated epidemic model of Influenza. Appl. Math. Model. 2013, 37, 903–915. [Google Scholar] [CrossRef]
  30. Tan, X.; Yuan, L.; Zhou, J.; Zheng, Y.; Yang, F. Modeling the initial transmission dynamics of influenza A H1N1 in Guangdong Province, China. Int. J. Infect. Dis. 2013, 17, e479–e484. [Google Scholar] [CrossRef]
  31. Kermack, W.O.; McKendrick, A.G. A contribution to the mathematical theory of epidemics. Proc. R. Soc. Lond. A 1927, 115, 700–721. [Google Scholar]
  32. Alexander, M.E.; Moghadas, S.M.; Rohani, P.; Summers, A.R. Modelling the effect of a booster vaccination on disease epidemiology. J. Math. Biol. 2006, 52, 290–306. [Google Scholar] [CrossRef]
  33. Moghadas, S.M.; Gumel, A.B. A mathematical study of a model for childhood diseases with non-permanent immunity. J. Comput. Appl. Math. 2003, 157, 347–363. [Google Scholar] [CrossRef]
  34. Wang, Z.; Röst, G.; Moghadas, S.M. Delay in booster schedule as a control parameter in vaccination dynamics. J. Math. Biol. 2019, 79, 2157–2182. [Google Scholar] [CrossRef]
  35. Nudee, K.; Chinviriyasit, W.; Chinviriyasit, S. The effect of backward bifurcation in controlling measles transmission by vaccination. Chaos Solit. Fractals 2019, 123, 400–412. [Google Scholar] [CrossRef]
  36. Béraud, G. Mathematical models and vaccination strategies. Vaccine 2018, 36, 5366–5372. [Google Scholar] [CrossRef]
  37. Ho, S.H.; He, D.; Eftimie, R. Mathematical models of transmission dynamics and vaccine strategies in Hong Kong during the 2017–2018 winter influenza season. J. Theor. Biol. 2019, 476, 74–94. [Google Scholar] [CrossRef]
  38. Zaman, G.; Kang, Y.H.; Cho, G.; Jung, I.H. Optimal strategy of vaccination & treatment in an SIR epidemic model. Math. Comput. Simul. 2017, 136, 63–77. [Google Scholar]
  39. Huang, S.; Chen, F.; Chen, L. Global dynamics of a network-based SIQRS epidemic model with demographics and vaccination. Commun. Nonlinear Sci. Numer. Simul. 2017, 43, 296–310. [Google Scholar] [CrossRef]
  40. Liu, Q.; Jiang, D.; Hayat, T.; Alsaedi, A. Stationary distribution of a stochastic delayed SVEIR epidemic model with vaccination and saturation incidence. Phys. A Stat. Mech. Appl. 2018, 512, 849–863. [Google Scholar] [CrossRef]
  41. De la Sen, M.; Quesada, S.A.; Ibeas, A.; Nistal, R. On an SEIADR epidemic model with vaccination, treatment and dead-infectious corpses removal controls. Math. Comput. Simul. 2019, 163, 47–79. [Google Scholar]
  42. Zhou, L.; Wang, Y.; Xiao, Y.; Li, M.Y. Global dynamics of a discrete age-structured SIR epidemic model with applications to measles vaccination strategies. Math. Biosci. 2019, 308, 27–37. [Google Scholar] [CrossRef] [PubMed]
  43. Zheng, Q.; Wang, X.; Pan, Q.; Wang, L. Optimal strategy for a dose-escalation vaccination against COVID-19 in refugee camps. AIMS Math. 2022, 7, 9288–9310. [Google Scholar] [CrossRef]
  44. Song, G.; Liang, G.; Tian, T.; Zhang, X. Mathematical modeling and analysis of tumor chemotherapy. Symmetry 2022, 14, 704. [Google Scholar] [CrossRef]
  45. Korobeinikov, A. Lyapunov functions and global properties for SEIR and SEIS epidemic models. Math. Med. Biol. 2004, 21, 75–83. [Google Scholar] [CrossRef]
  46. Logistic Growth Model, Mathematical Association of America. Available online: https://www.maa.org/press/periodicals/loci/joma/logistic-growth-model (accessed on 10 January 2021).
  47. Tsoularis, A.; Wallace, J. Analysis of logistic growth models. Math Biosci. 2002, 179, 21–55. [Google Scholar] [CrossRef]
  48. Zhonghua, Z.; Yaohong, S. Qualitative analysis of a SIR epidemic model with saturated treatment rate. J. Appl. Math. Comput. 2010, 34, 177–194. [Google Scholar] [CrossRef]
  49. Li, J.; Teng, Z.; Wang, G.; Zhang, L.; Hu, C. Stability and bifurcation analysis of an SIR epidemic model with logistic growth and saturated treatment. Chaos Solit. Fractals 2017, 99, 63–71. [Google Scholar] [CrossRef]
  50. Arenasa, A.R.; Thackara, N.B.; Haskellb, E.C. The logistic growth model as an approximating model for viral load measurements of influenza A virus. Math. Comput. Simul. 2017, 133, 206–222. [Google Scholar] [CrossRef]
  51. Guo, Z.K.; Huo, H.F.; Xiang, H. Hopf bifurcation of an age-structured HIV infection model with logistic target-cell growth. J. Biol. Dyn. 2019, 13, 362–384. [Google Scholar] [CrossRef] [PubMed]
  52. Zou, Y.; Pan, S.; Zhao, P.; Han, L.; Wang, X.; Hemerik, L.; Knops, J.; van der Werf, W. Outbreak analysis with a logistic growth model shows COVID-19 suppression dynamics in China. PLoS ONE 2020, 15, e0235247. [Google Scholar] [CrossRef]
  53. Wu, K.; Darcet, D.; Wang, Q.; Sornette, D. Generalized logistic growth modeling of the COVID-19 outbreak: Comparing the dynamics in the 29 provinces in China and in the rest of the world. Nonlinear Dyn. 2020, 101, 1561. [Google Scholar] [CrossRef]
  54. Glass, K.; Grenfell, B. Waning immunity and subclinical measles infections in England. Vaccine 2004, 22, 4110–4116. [Google Scholar] [CrossRef]
  55. Leung, K.; Trapman, P.; Britton, T. Who is the infector? Epidemic models with symptomatic and asymptomatic cases. Math. Biosci. 2018, 301, 190–198. [Google Scholar] [CrossRef]
  56. Zhou, T. Encyclopedia of Systems Biology; Springer: New York, NY, USA, 2013. [Google Scholar]
  57. Lyapunov, A.M. The General Problem of the Stability of Motion; Taylor & Francis: London, UK, 1992. [Google Scholar]
  58. Korobeinikov, A.; Wake, G.C. Lyapunov functions and global stability for SIR, SIRS, and SIS epidemiological models. Appl. Math. Lett. 2002, 15, 955–960. [Google Scholar] [CrossRef]
  59. Magal, P.; McCluskey, C.C.; Webb, G.F. Lyapunov functional and global asymptotic stability for an infection-age model. Appl. Anal. 2010, 89, 1109–1140. [Google Scholar] [CrossRef]
  60. Enatsu, Y.; Nakata, Y.; Muroya, Y. Lyapunov functional techniques for the global stability analysis of a delayed SIRS epidemic model. Nonlinear Anal. Real World Appl. 2012, 13, 2120–2133. [Google Scholar] [CrossRef]
  61. Shuai, Z.; van den Driessche, P. Global stability of infectious disease models using lyapunov functions. SIAM J. Appl. Math. 2013, 73, 1513–1532. [Google Scholar] [CrossRef]
  62. Kuniya, T.; Wang, J. Lyapunov functions and global stability for a spatially diffusive SIR epidemic model. Appl. Anal. 2016, 96, 1935–1960. [Google Scholar] [CrossRef]
  63. Islam, Z.; Ahmed, S.; Rahman, M.M.; Karim, M.F.; Amin, M. Global stability analysis and parameter estimation for a diphtheria model: A case study of an epidemic in Rohingya refugee camp in Bangladesh. Comput. Math. Methods Med. 2022, 2022, 6545179. [Google Scholar] [CrossRef]
  64. Truelove, S.A.; Keegan, L.T.; Moss, W.J.; Macher, L.H.C.E.; Azman, A.S.; Lessler, J. Clinical and epidemiological aspects of diphtheria: A systematic review and pooled analysis. Clin. Infect. Dis. 2020, 71, 89–97. [Google Scholar] [CrossRef]
  65. Number of Births from Registration by Sex Region Province: 2010–2019. Available online: http://statbbi.nso.go.th/staticreport/page/sector/en/01.aspx (accessed on 18 October 2021).
  66. Public Health Statistics. 2017. Available online: http://www.pcko.moph.go.th/Health-Statistics/stratistics60.pdf (accessed on 17 August 2021).
  67. Lakshmikantham, V.; Leela, S.; Martynyuk, A.A. Stability Analysis of Nonlinear Systems; Marcel Dekker Inc.: Abington, UK, 1989. [Google Scholar]
  68. Hethcote, H.W. The mathematics of infectious disease. SIAM Rev. 2000, 42, 599–653. [Google Scholar] [CrossRef]
  69. van den Driessche, P.; Watmough, J. Reproduction numbers and sub-treshold endemic equilibria for compartmental models of disease transmission. Math. Biosci. 2002, 180, 29–48. [Google Scholar] [CrossRef]
  70. Diekmann, O.; Heesterbeek, J.A.P.; Metz, J.A.J. On the Definition and the Computation of the Basic Reproduction Ratio R0 in Models for Infectious Diseases in Heterogeneous Populations. J. Math. Biol. 1990, 28, 365–382. [Google Scholar] [CrossRef] [PubMed] [Green Version]
  71. Scherer, A.; McLean, A. Mathematical models of vaccination. Br. Med. Bull. 2002, 62, 187–199. [Google Scholar] [CrossRef] [PubMed]
  72. Anderson, R.M.; May, R.M. Infectious Diseases of Humans Dynamics and Control, 2nd ed.; Oxford University Press Inc.: Oxford, UK, 1991. [Google Scholar]
  73. LaSalle, J.P. The Stability of Dynamical Systems; Hamilton Press: Venice, CA, USA, 1976. [Google Scholar]
  74. Anderson, R.M.; May, R.M. Vaccination and herd immunity to infectious diseases. Nature 1985, 318, 323–329. [Google Scholar] [CrossRef] [PubMed]
  75. Anderson, R.M. The concept of herd immunity and the design of community-based immunization programmes. Vaccine 1992, 10, 928–935. [Google Scholar] [CrossRef]
  76. Murray, J.D. Mathematical Biology; Springer: New York, NU, USA, 1989; pp. 702–704. [Google Scholar]
  77. Draper, N.R.; Smith, H. Applied Regression Analysis; John Wiley & Sons: Hoboken, NJ, USA, 2014. [Google Scholar]
  78. Vaccine Information Statement DTP. Available online: https://www.cdc.gov/vaccines/hcp/vis/vis-statements/dtap.html (accessed on 7 November 2021).
  79. Vaccine Information Statement Td. Available online: https://www.cdc.gov/vaccines/hcp/vis/vis-statements/td.pdf (accessed on 1 May 2021).
  80. US Centers for Disease Control and Prevention. Review of the Epidemiology of Diphtheria-2000-2016. Available online: https://cdn.who.int/media/docs/default-source/immunization/sage/2017/sage-meeting-of-april-2017/background-docs/session-diphtheria/1.-review-of-the-epidemiology-of-diphtheria—2000-2016-pdf-829kb.pdf?sfvrsn=9ba4f061_3k (accessed on 17 August 2021).
  81. Carr, J. Applications Centre Manifold Theory; Spinger: New York, NY, USA, 1981. [Google Scholar]
  82. Castillo-Chavez, C.; Song, B. Dynamical Models of Tuberculosis and Their Applications. Math. Biosci. Eng. 2004, 1, 361–404. [Google Scholar] [CrossRef] [PubMed]
Figure 1. Comparison of the cumulative numbers of diphtheria produced by the diphtheria-vaccine model and reported cases in Thailand 2018 [6].
Symmetry 14 02000 g001
Figure 2. Sensitivity indices of R V to each of the ten different model parameters for the diphtheria-vaccine model, evaluated at the based line values given in Table 1.
Symmetry 14 02000 g002
Figure 3. Contour plots of the surface R V as the functions of the influential model parameters to the value R V . The values of other model parameters used are given in Table 1. (a) R V is a function of β and ϕ ; (b) R V is a function of δ β and ϕ .
Symmetry 14 02000 g003
Figure 4. Contour plots of the surface R V as the functions of the influential model parameters to the value R V . The values of other model parameters used are given in Table 1. (a) R V is a function of τ and ϕ ; (b) R V is a function of γ and ϕ ; (c) R V is a function of γ and τ .
Symmetry 14 02000 g004
Figure 5. Time series plots of all sub-populations produced by a diphtheria-vaccine model (1) with different initial conditions of state variables. The parameter values used are given in Table 1 with ϕ = 0.0618 > ϕ c so that R V = 0.9709 < 1 . (a) Profiles of susceptible individuals; (b) Profiles of vaccinated individuals; (c) Profiles of exposed individuals; (d) Profiles of asymptomatic individuals; (e) Profiles of infected individuals; (f) Profiles of recovered individuals.
Symmetry 14 02000 g005
Figure 6. Phase space of susceptible, vaccinated and infected individuals produced by a diphtheria-vaccine model with different initial conditions of state variables. The parameter values used are given in Table 1 with ϕ = 0.0618 > ϕ c so that R V = 0.9709 < 1 .
Symmetry 14 02000 g006
Figure 7. Time series plots of all sub-populations produced by a diphtheria-vaccine model with different initial conditions of all state variables. The parameter values used are given in Table 1 with ϕ = 0.0406 < ϕ c so that R V = 1.3826 > 1 . (a) Profile of susceptible individuals; (b) Profile of vaccinated individuals; (c) Profile of exposed individuals; (d) Profile of asymptomatic individuals; (e) Profile of infected individuals; (f) Profile of recovered individuals.
Symmetry 14 02000 g007aSymmetry 14 02000 g007b
Figure 8. Phase space of susceptible, vaccinated and infected individuals produced by a diphtheria-vaccine model with different initial conditions of all state variables. The parameter values used are given in Table 1 with ϕ = 0.0406 < ϕ c so that R V = 1.3826 > 1 .
Symmetry 14 02000 g008
Figure 9. Time series plots showing the impact of a DTP5 coverage on the proportions of infectious populations predicted by the diphtheria-vaccine model. The model parameter values used are given in Table 1: (a) Dynamics at first year of vaccination; (b) Dynamics at first year of vaccination; (c) Dynamics after a DTP5 immunization; (d) Dynamics after a DTP5 immunization.
Symmetry 14 02000 g009
Table 1. Description and parameter values of the diphtheria-vaccine model.
ParameterDefinitionValueReference
β Transmission rate18.5data fit
aProportion of infectious population, 0 < a 1 0.55[64]
δ Modification parameter, 0 < δ 1 0.7[64]
ϕ Rate of vaccination0.0406[10]
rBirth rate0.0101[65]
σ Rate of progression from the exposed class to either the asymptomatic class or the infected class6[1]
μ Natural death rate0.0011[66]
α Diphtheria mortality rate 0.05 [1]
ε Rate of waning vaccine 0.0083 [1]
θ Rate of progression from the recovered class to the vaccinated class 0.6667 [1]
γ Recovered rate of asymptomatic individuals 2.1429 [1]
τ Recovered rate of infected individuals 2.1429 [1]
KCarrying capacity 10,000 -
Table 2. Effect of a ˜ σ on R V , ϕ c , p c , p ˜ and the number of diphtheria cases at steady state.
a ˜ σ R V ϕ c p c p ˜ E A I
5.941.13980.04760.83510.8347140
4.261.26570.05390.85150.8509362
2.701.38260.05970.86400.8633456
2.101.42760.06190.86830.8675447
1.261.49050.06510.87390.87305310
Publisher’s Note: MDPI stays neutral with regard to jurisdictional claims in published maps and institutional affiliations.

