

Analysis of Electro-Optical Behavior in Liquid Crystal Cells with Asymmetric Anchoring Strength

Abstract
:1. Introduction
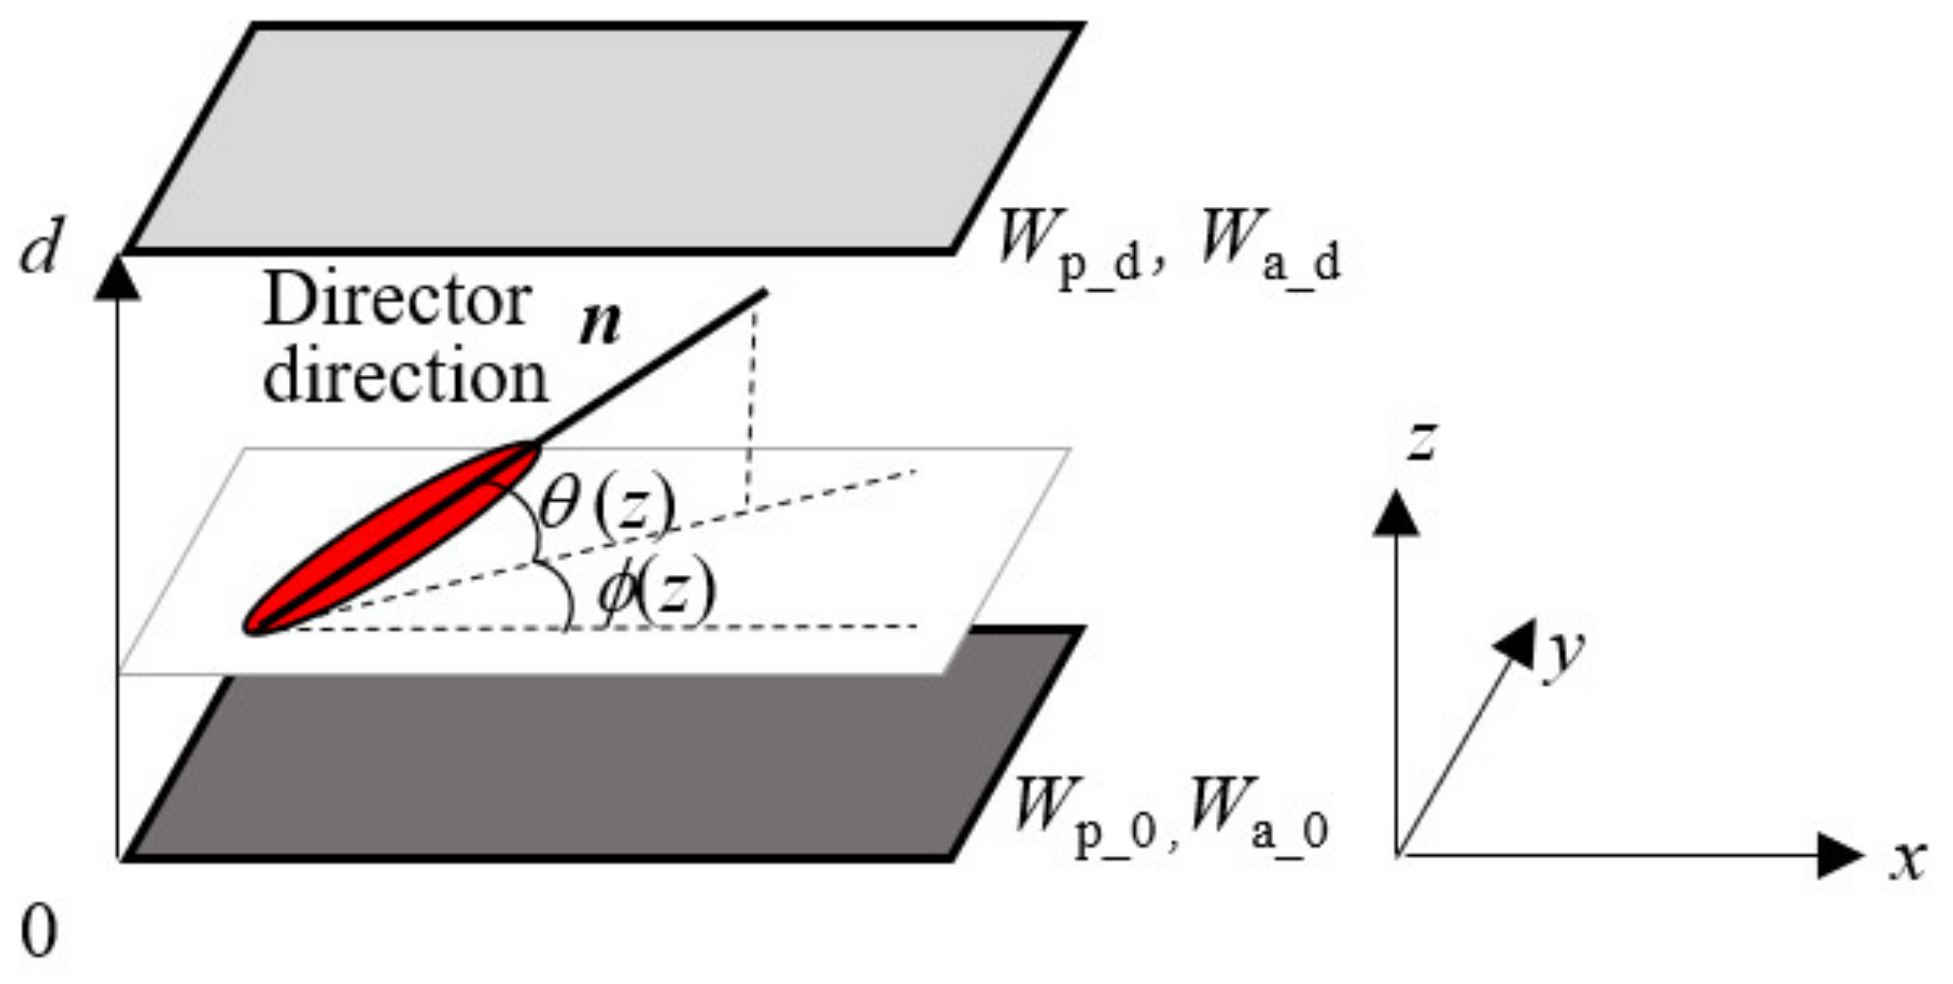
2. Principle
2.1. Free Energy of LC Cells
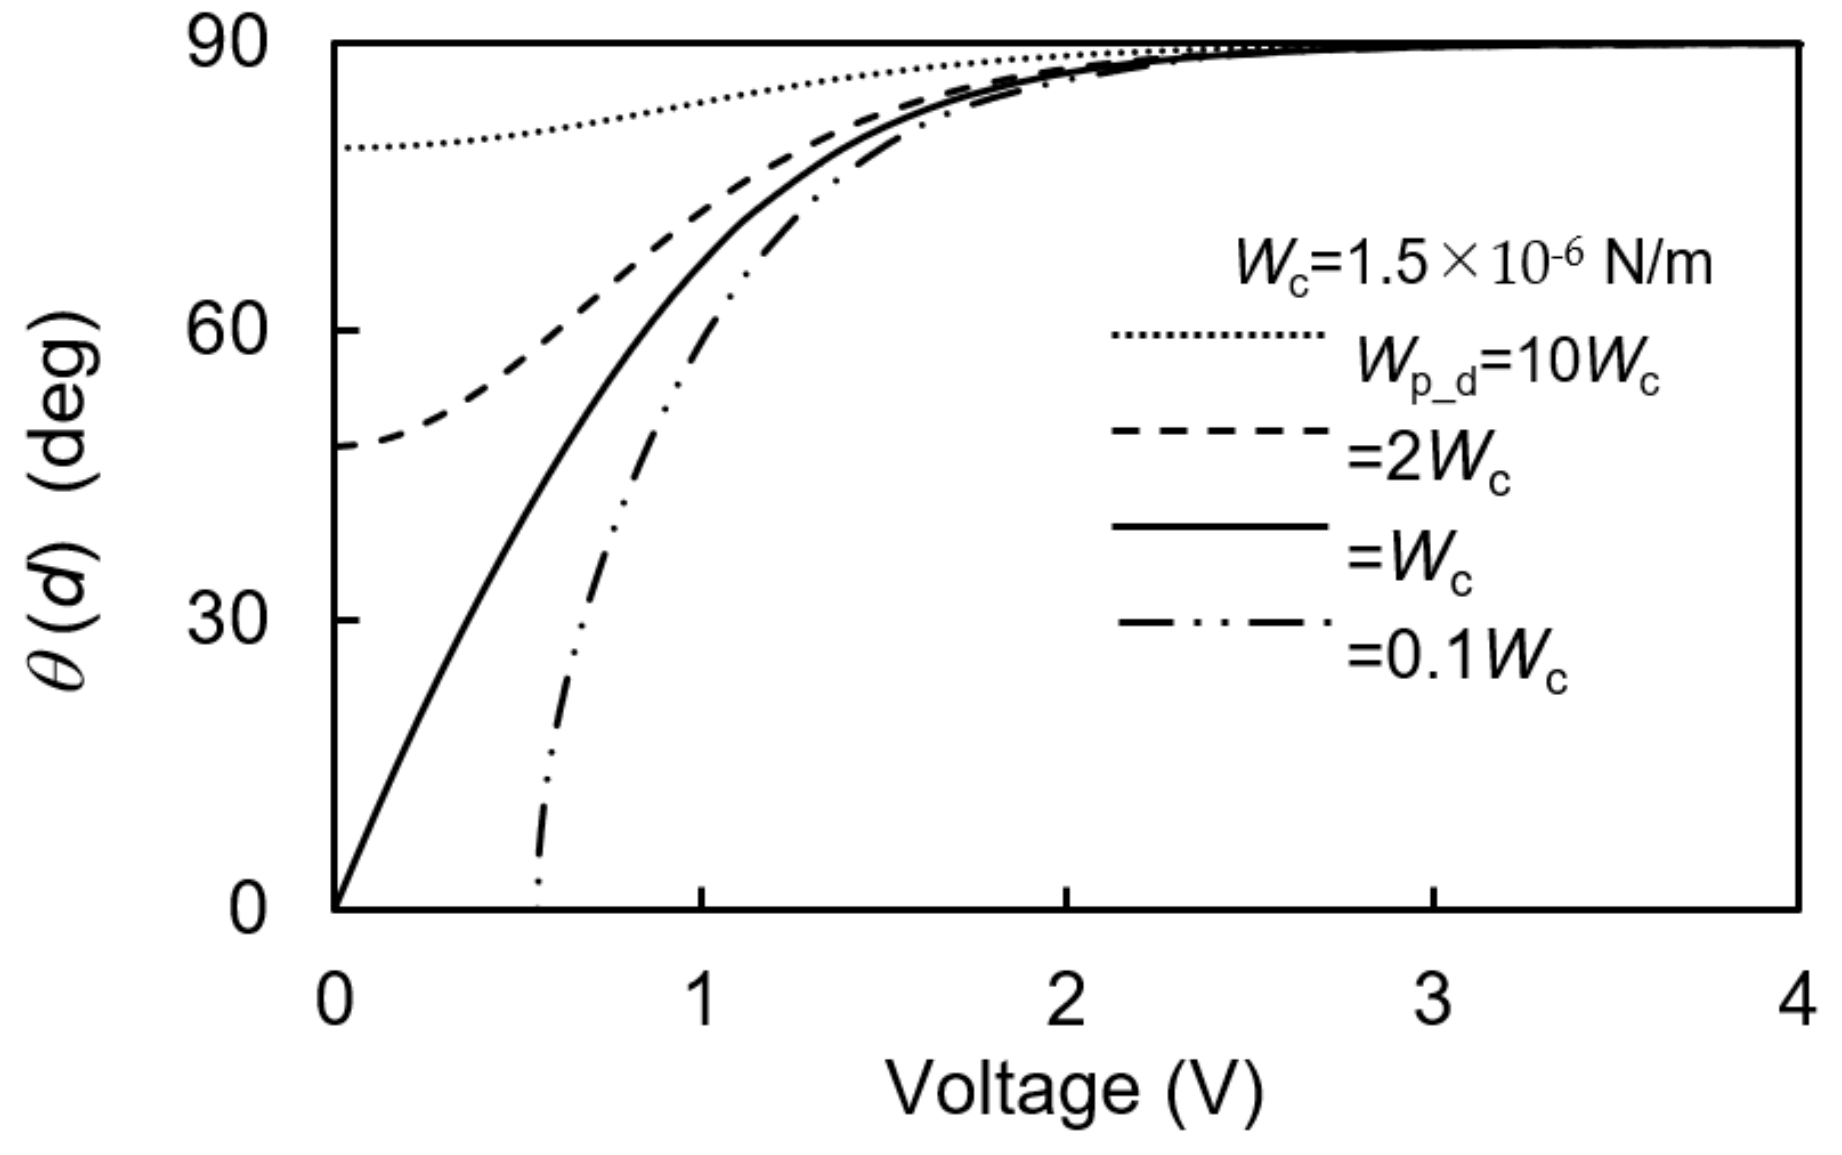
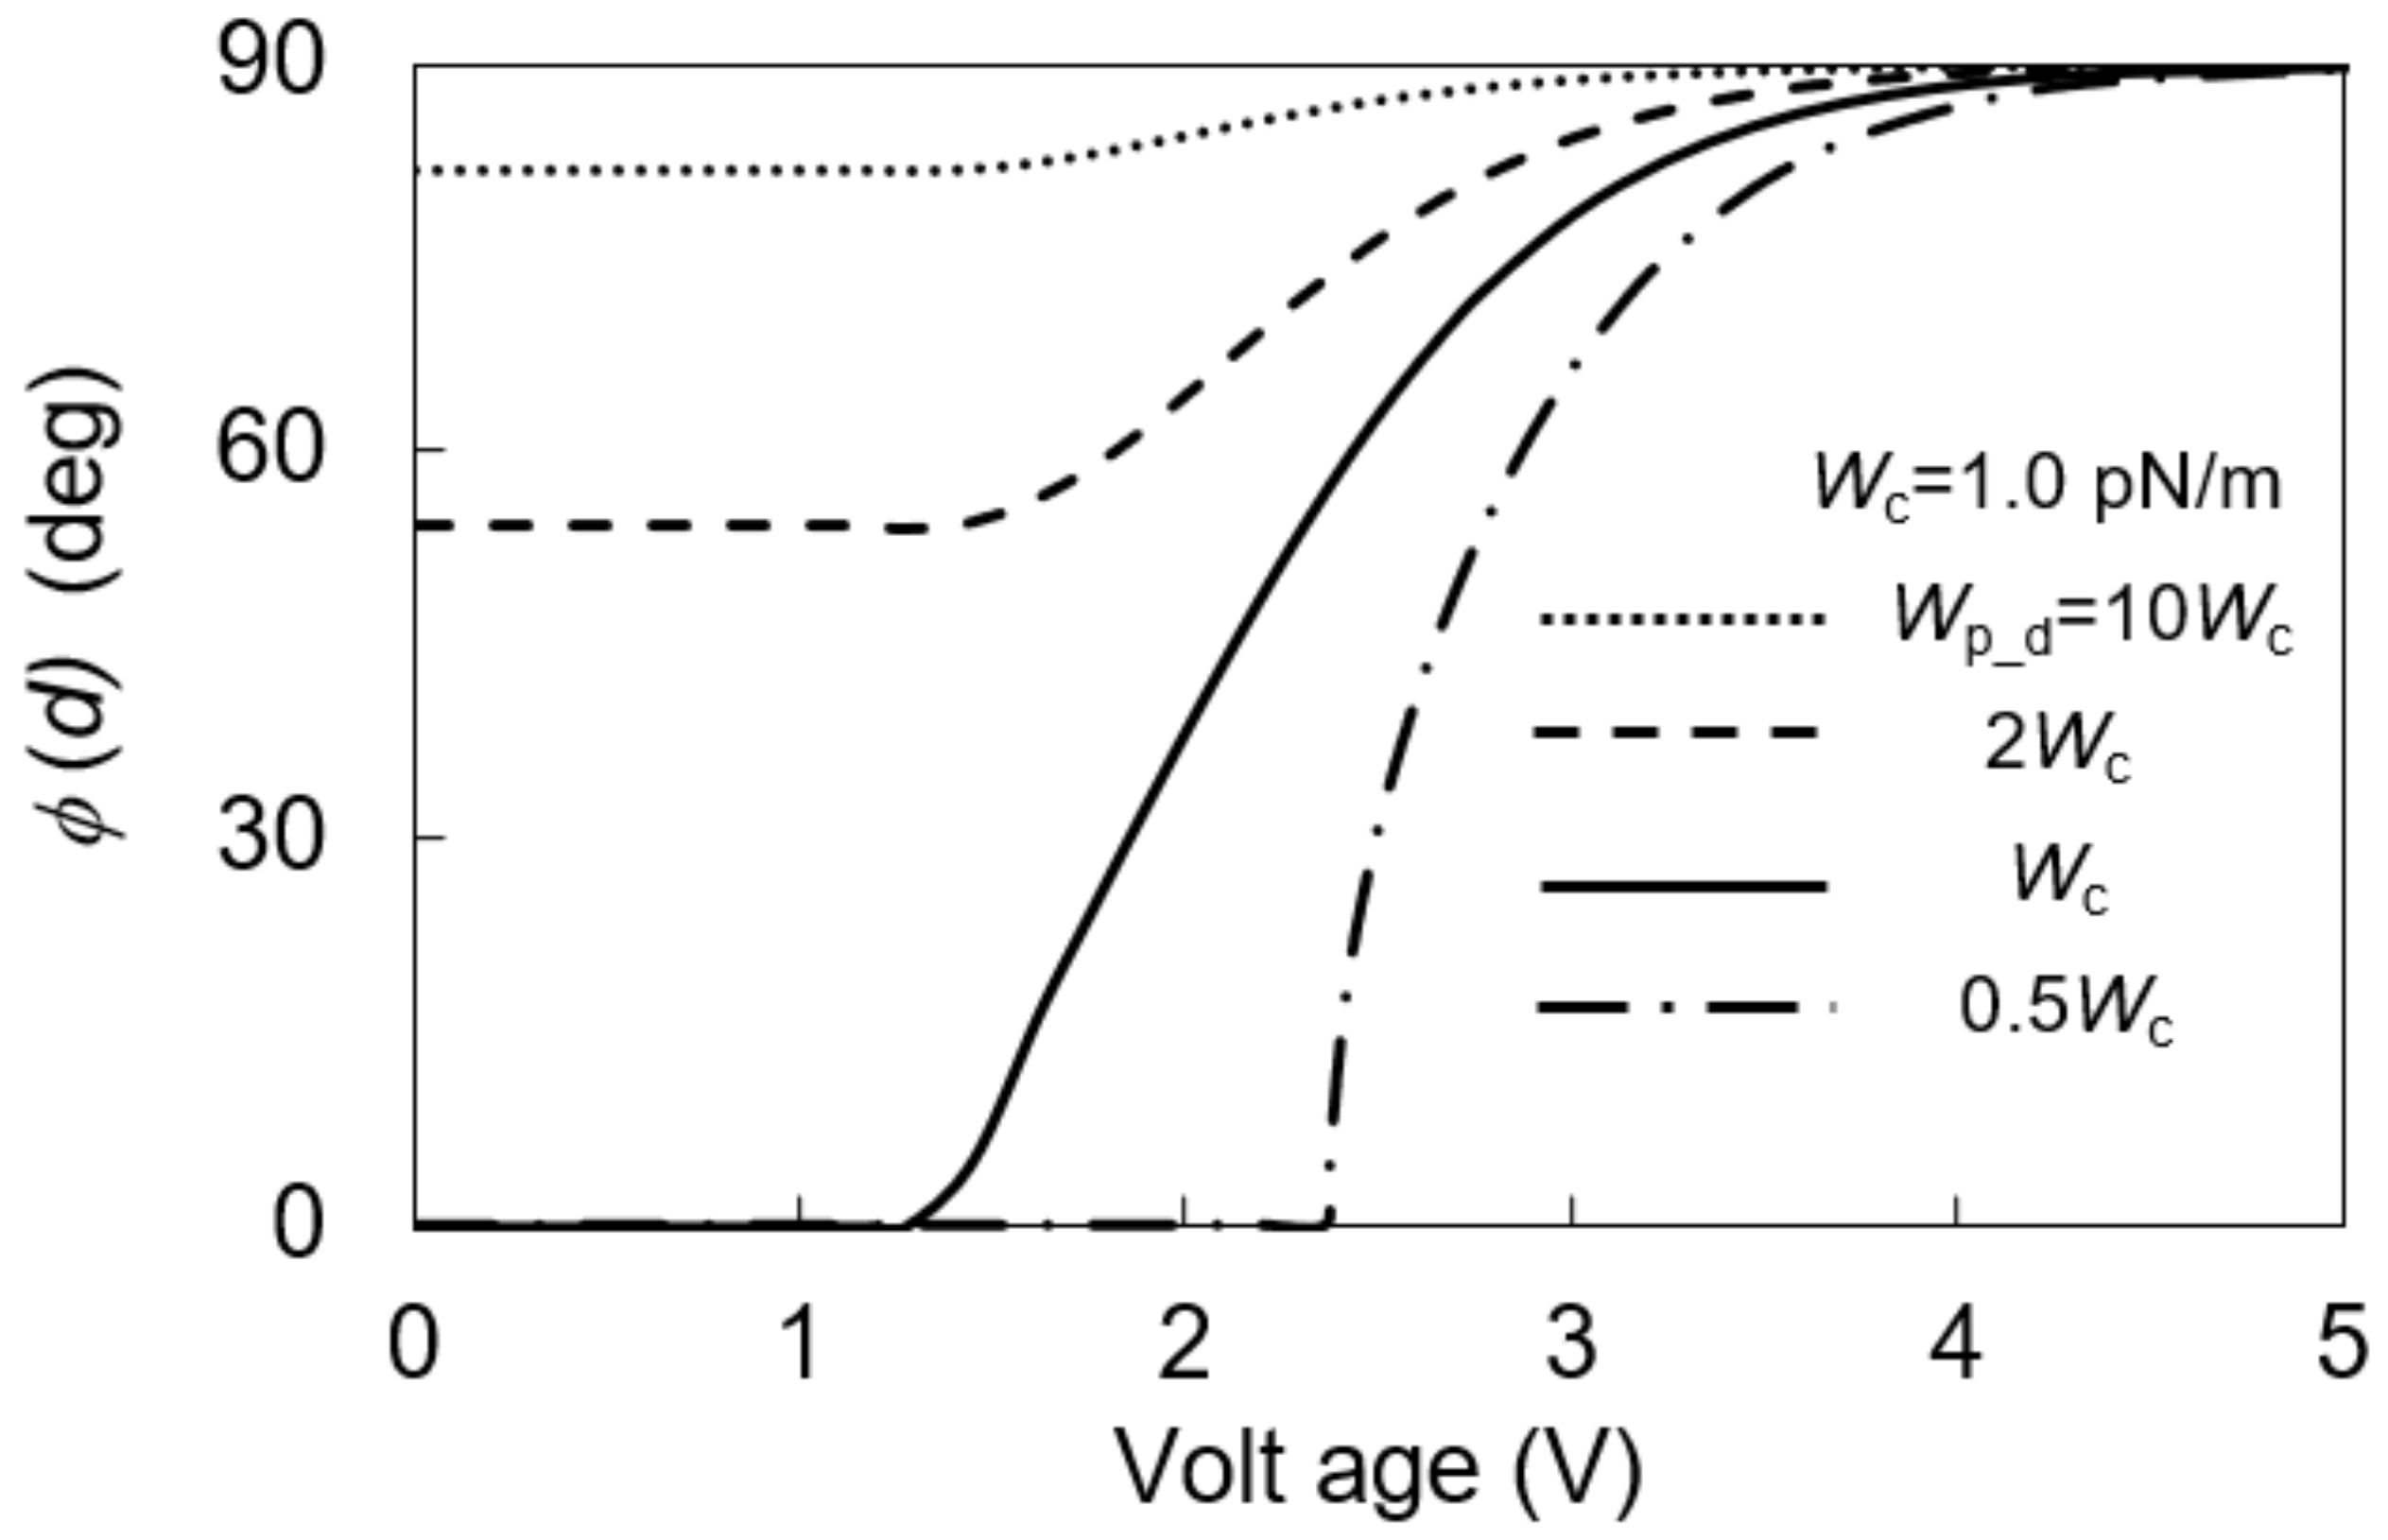
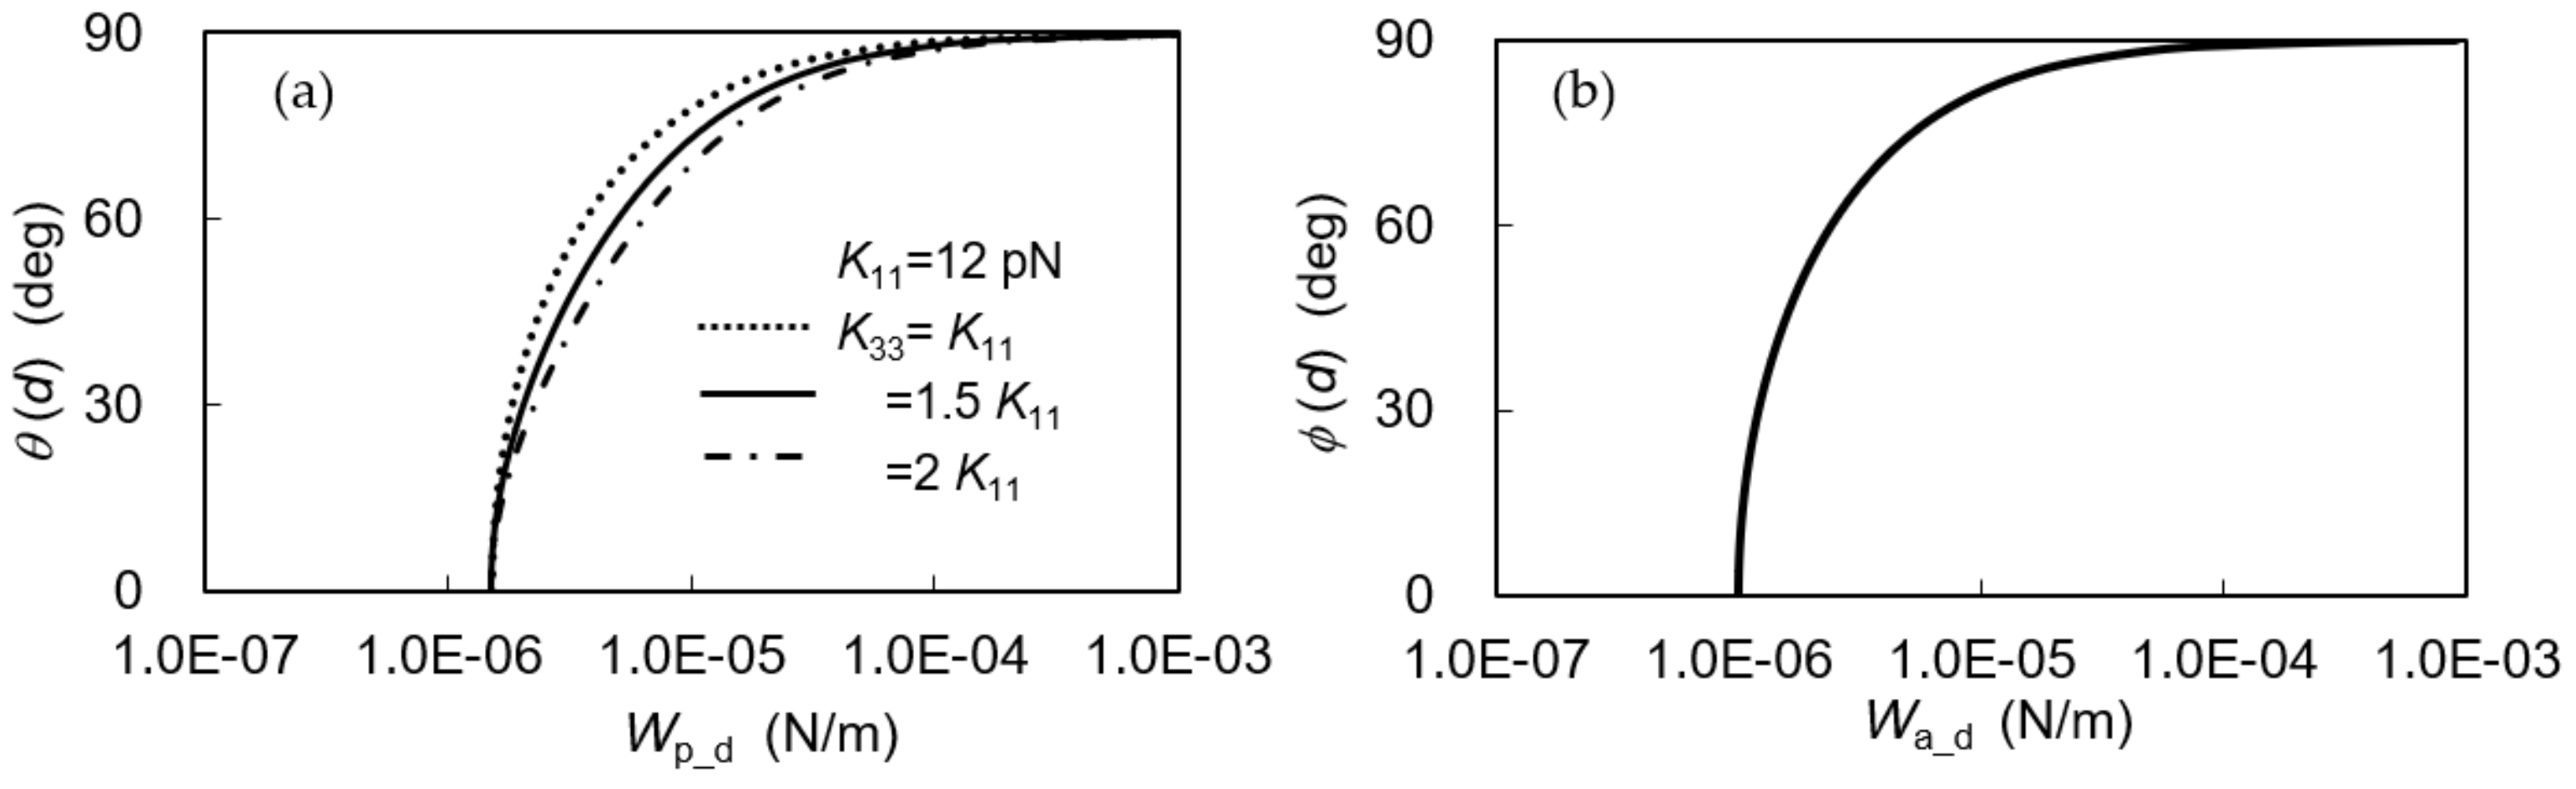
2.2. Critical Anchoring
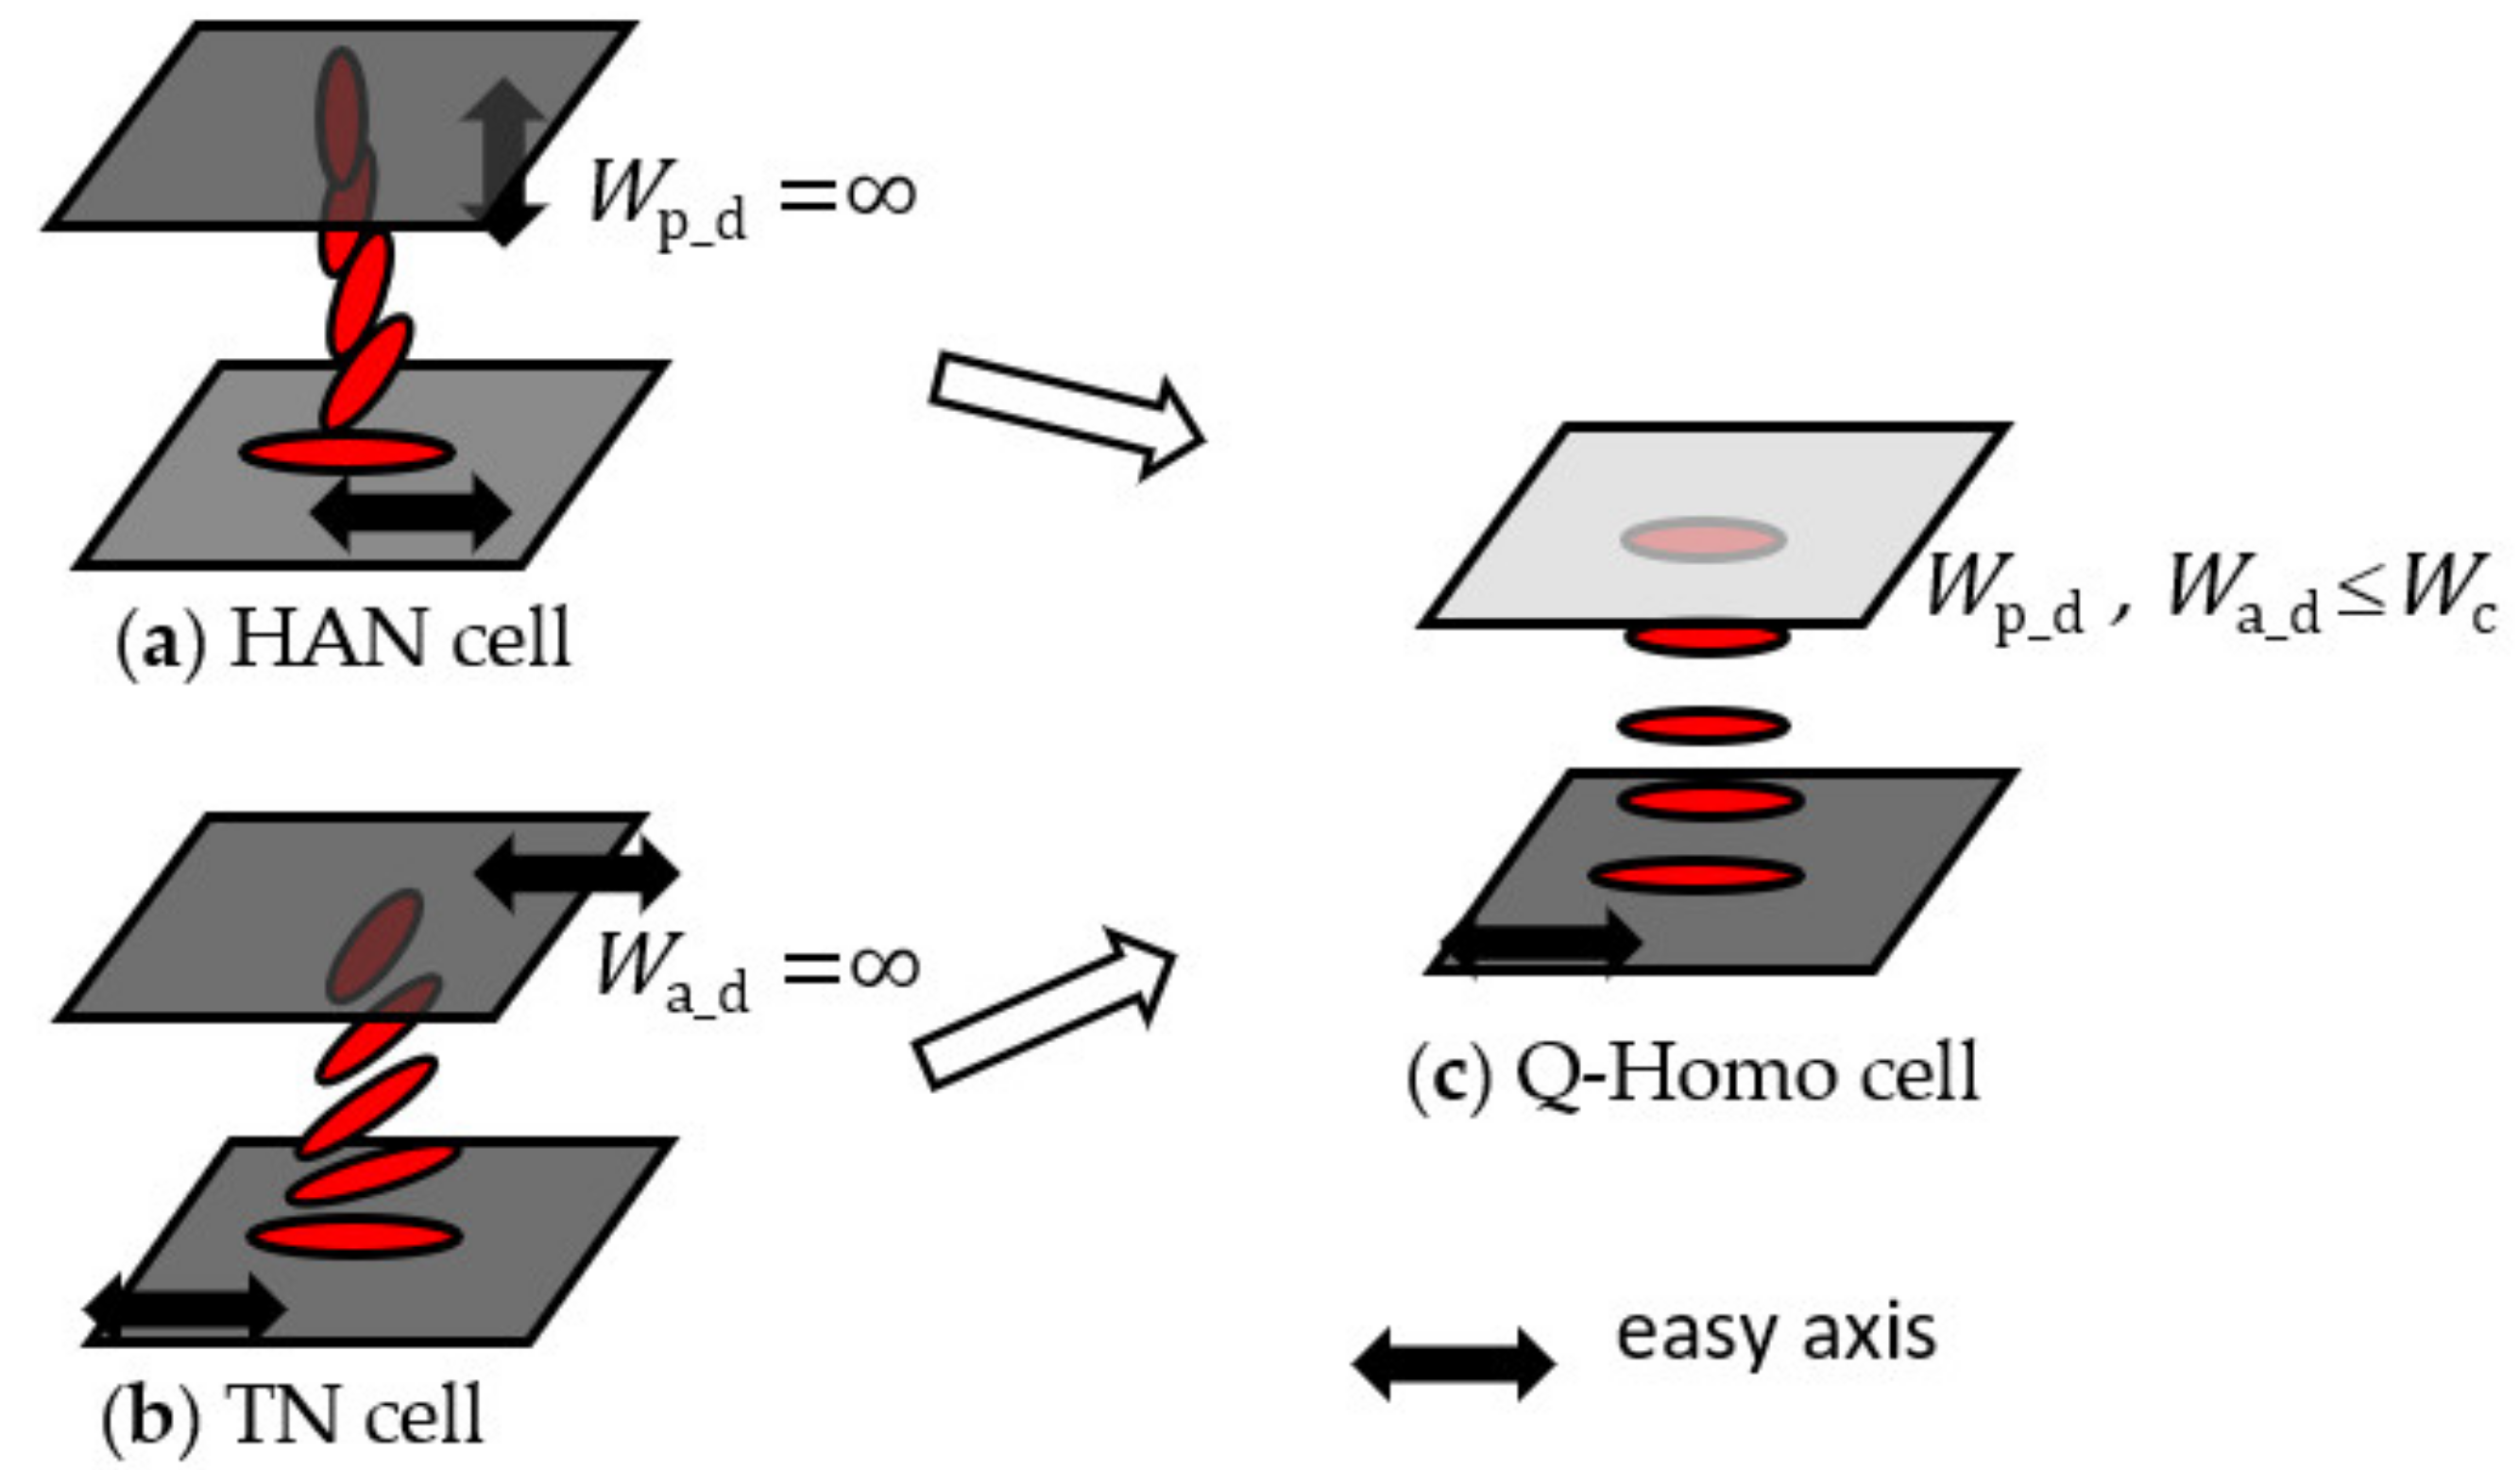
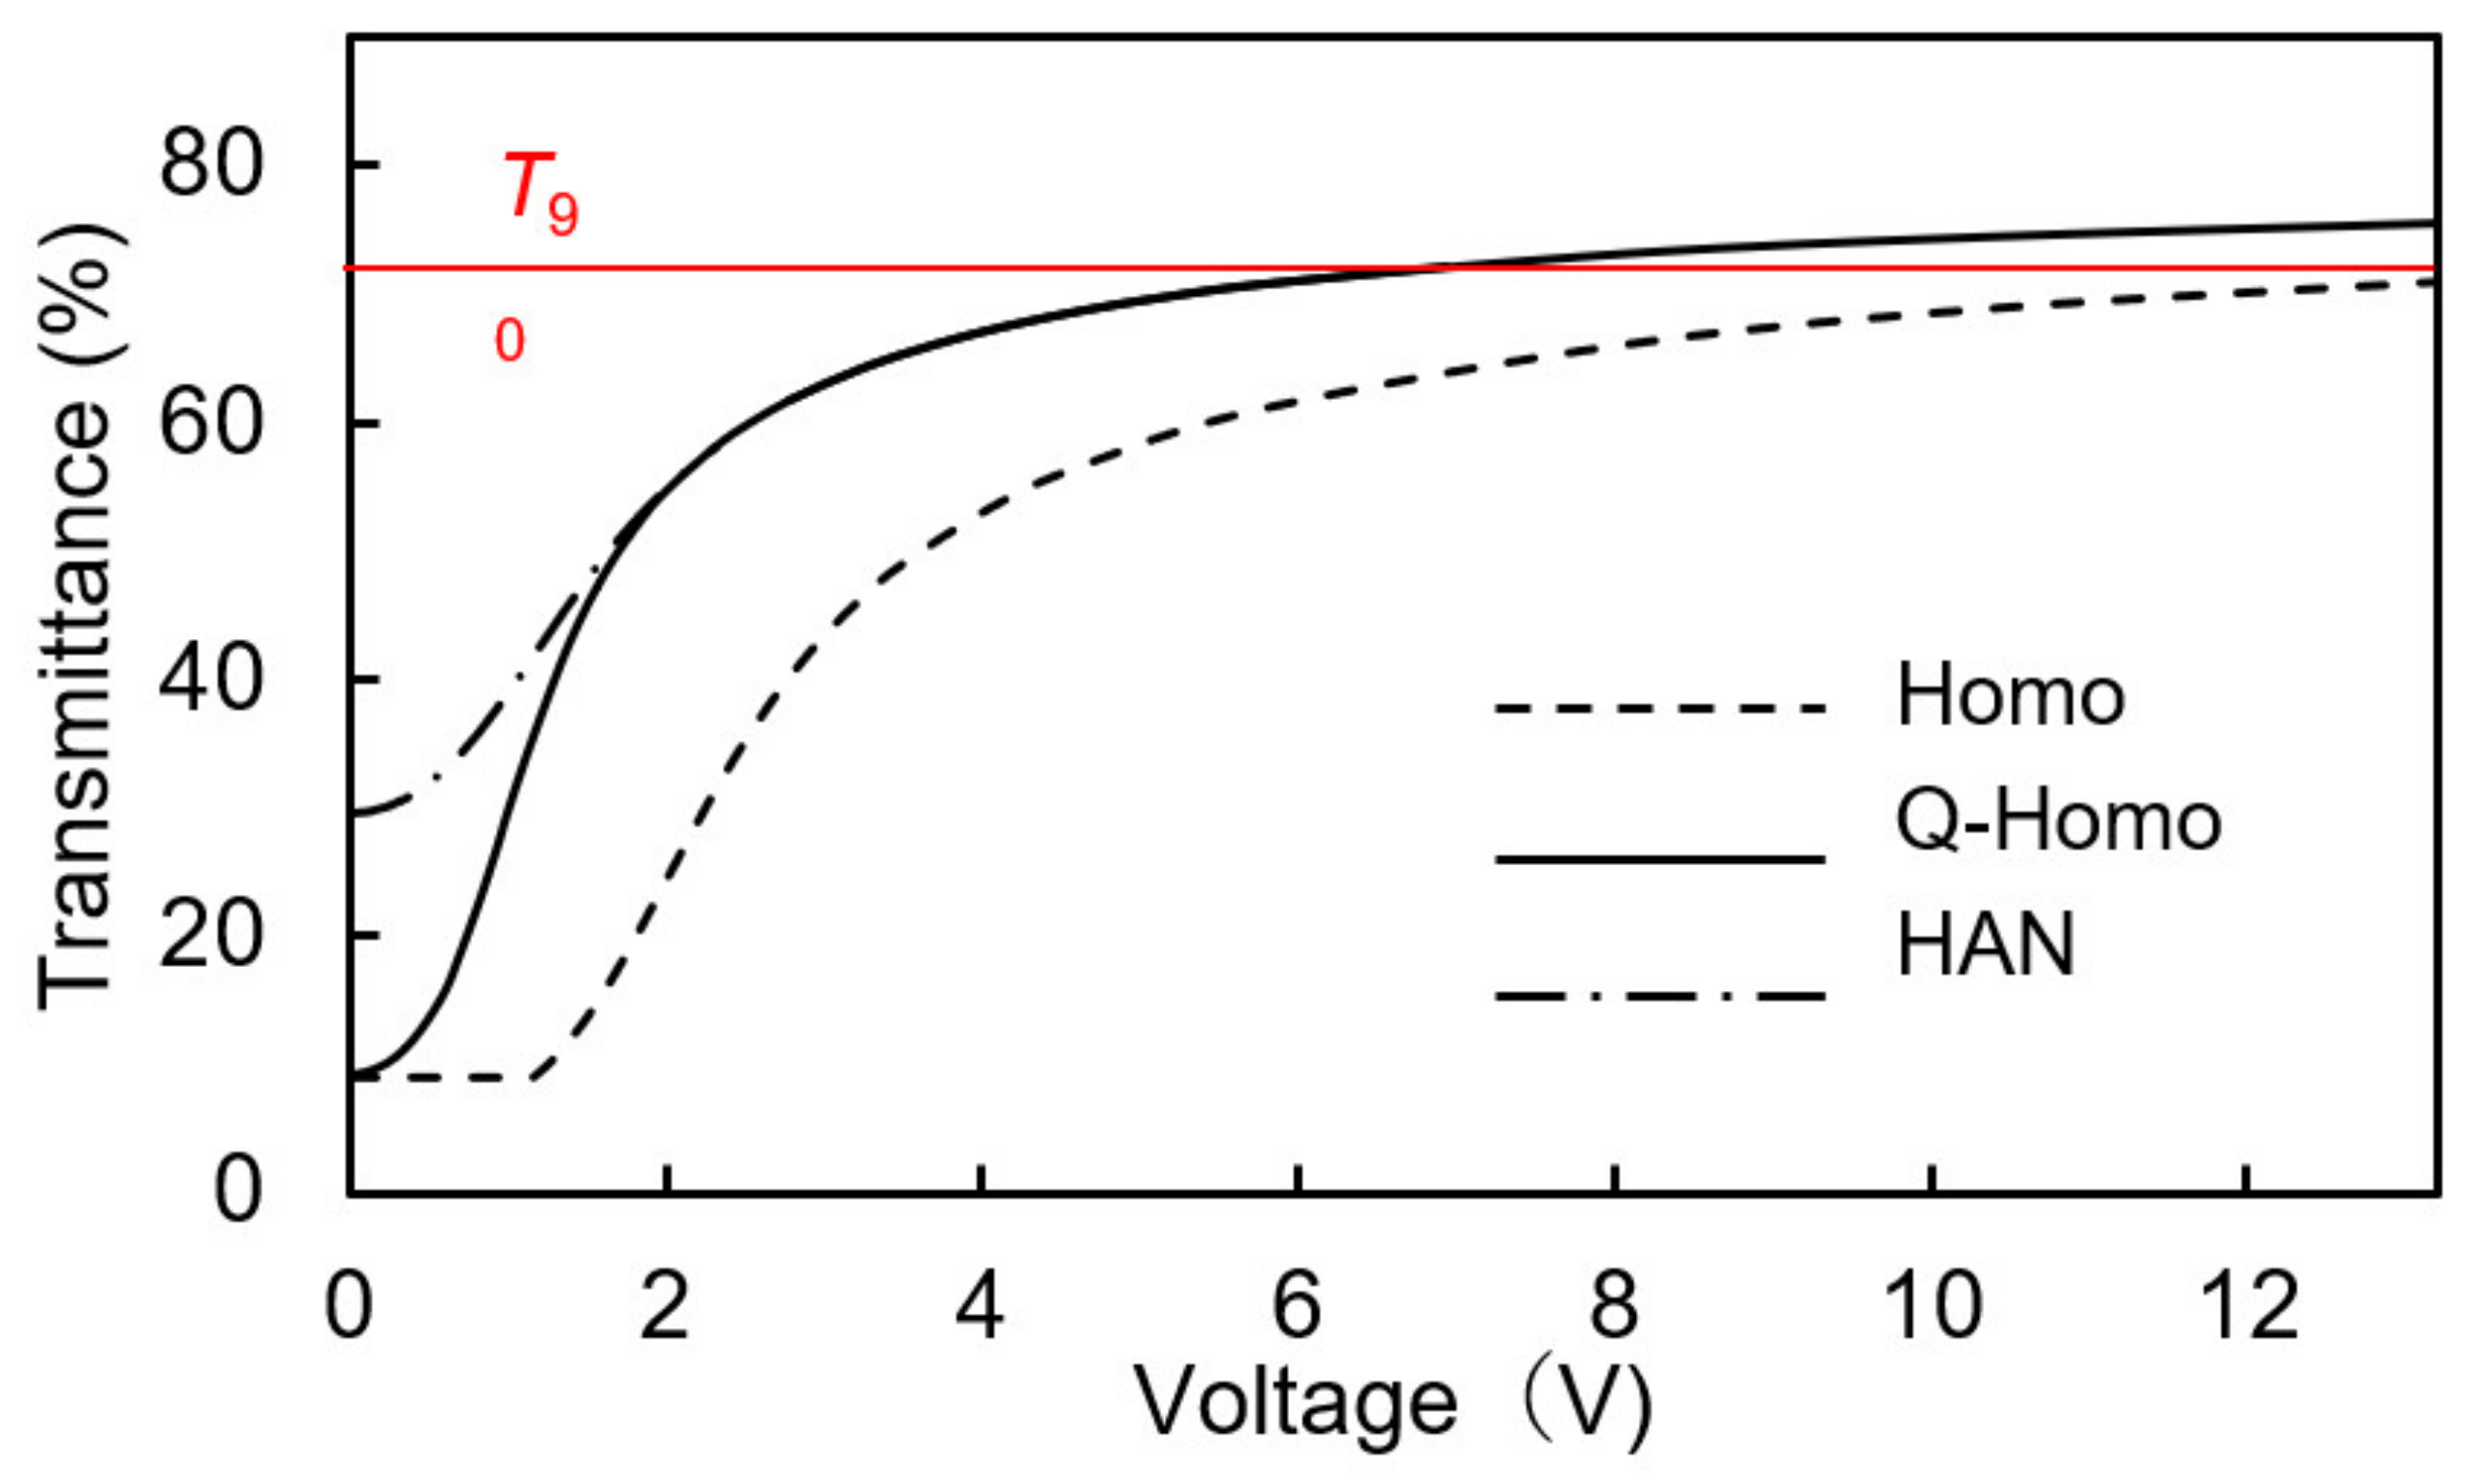
3. Electro-Optical Property in the Q-Homo Cell
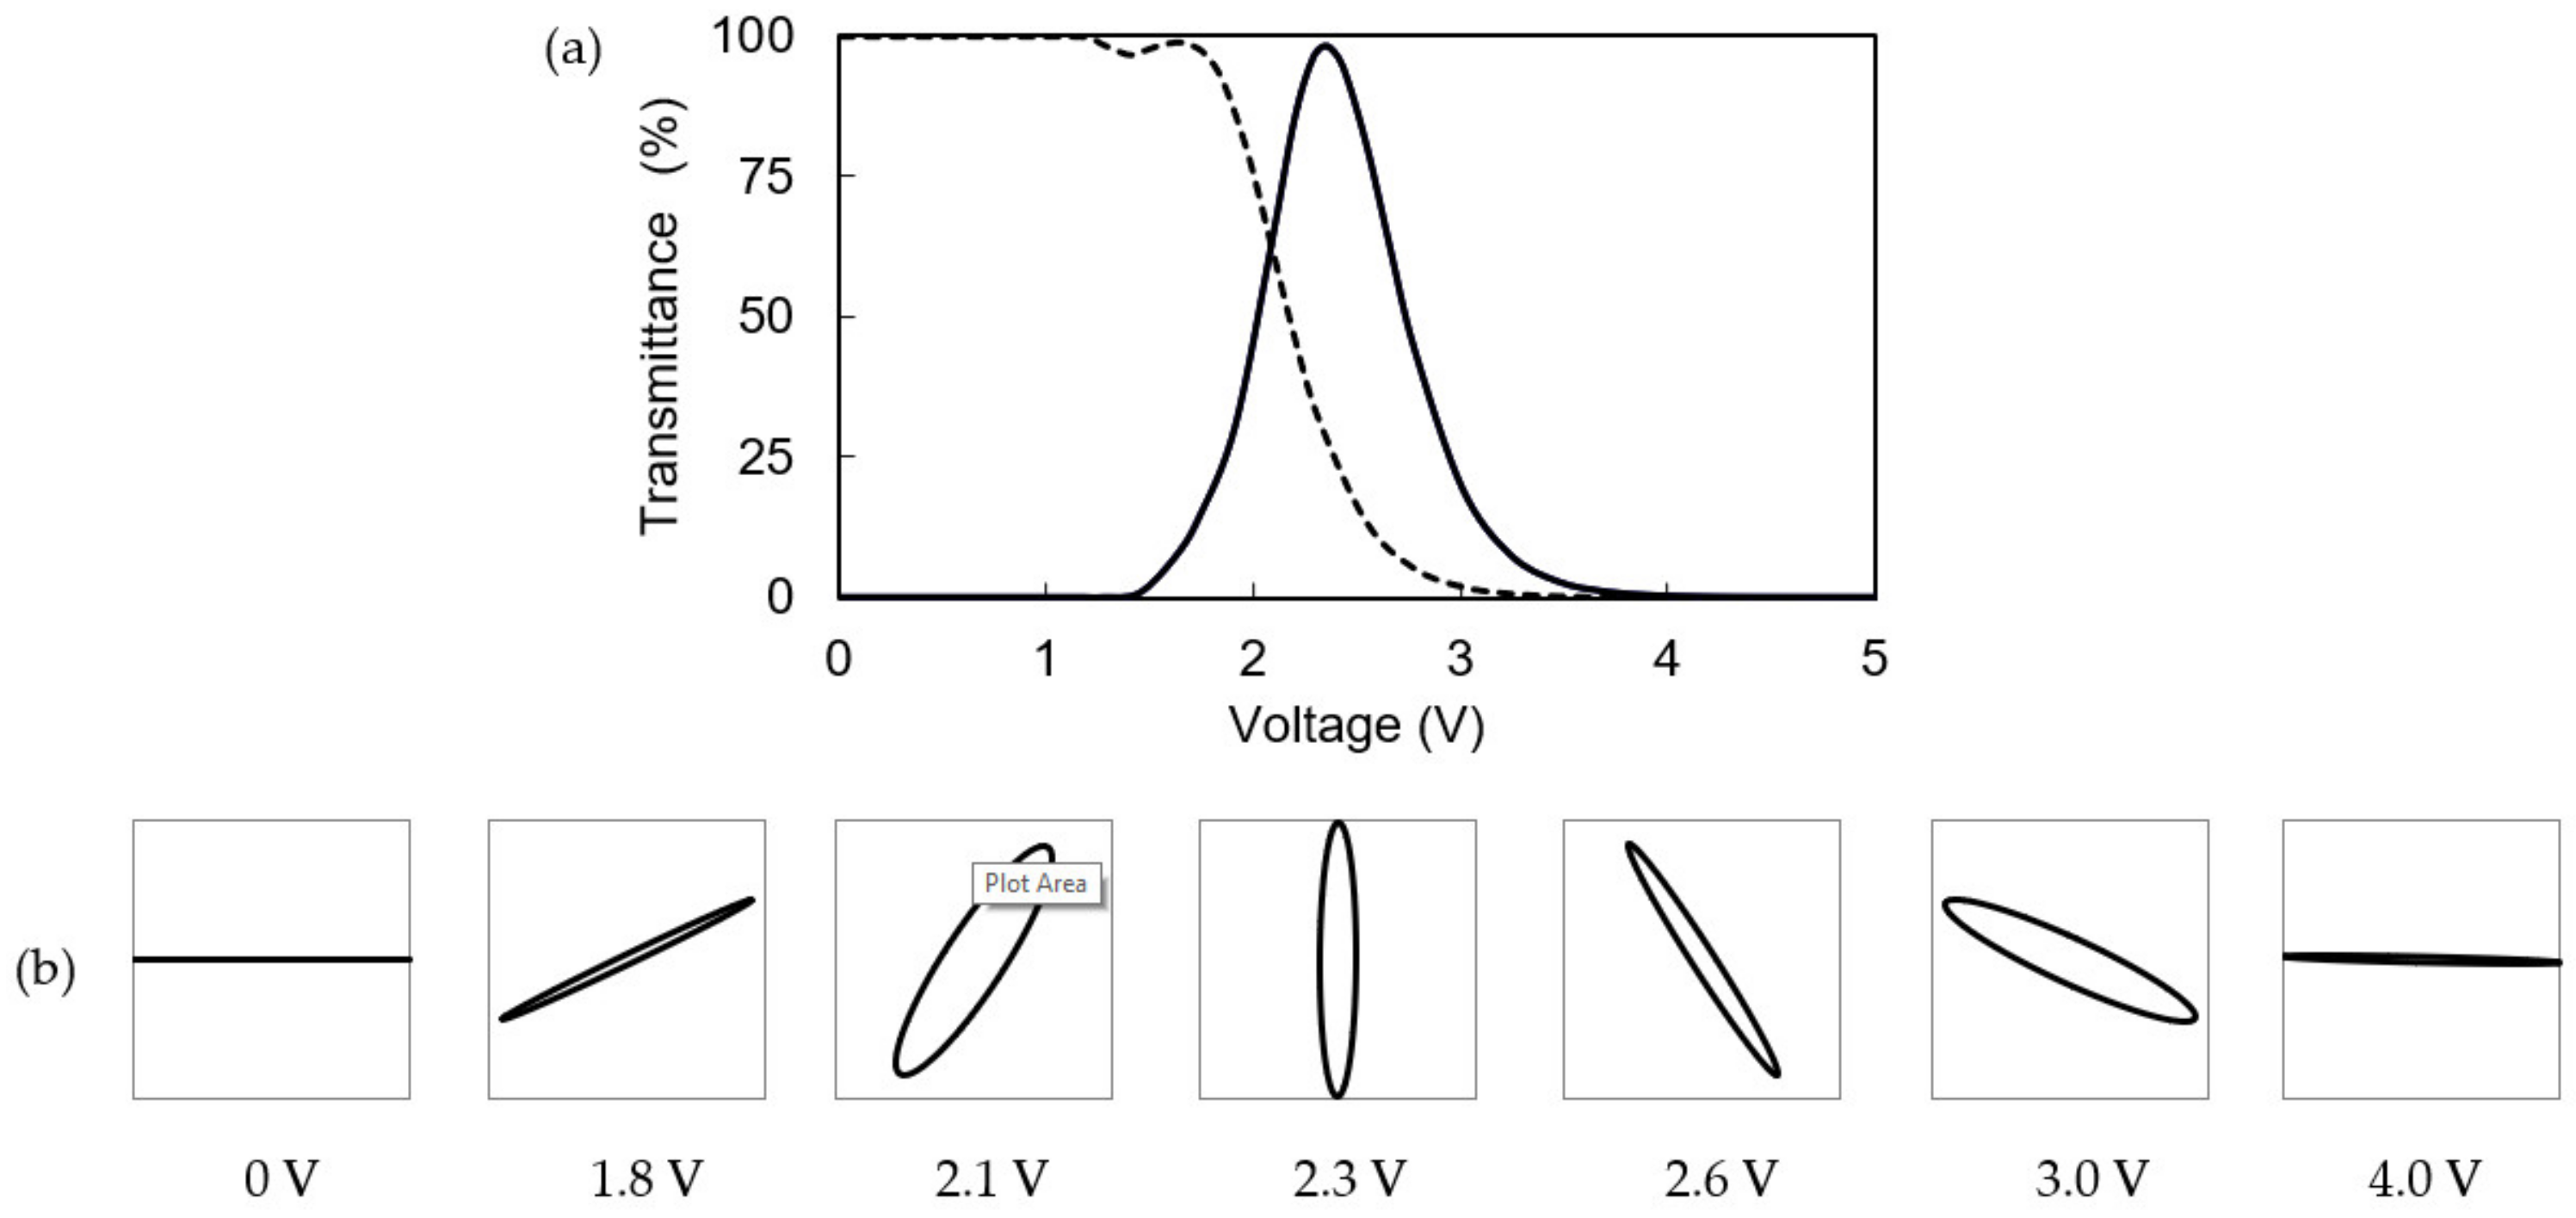
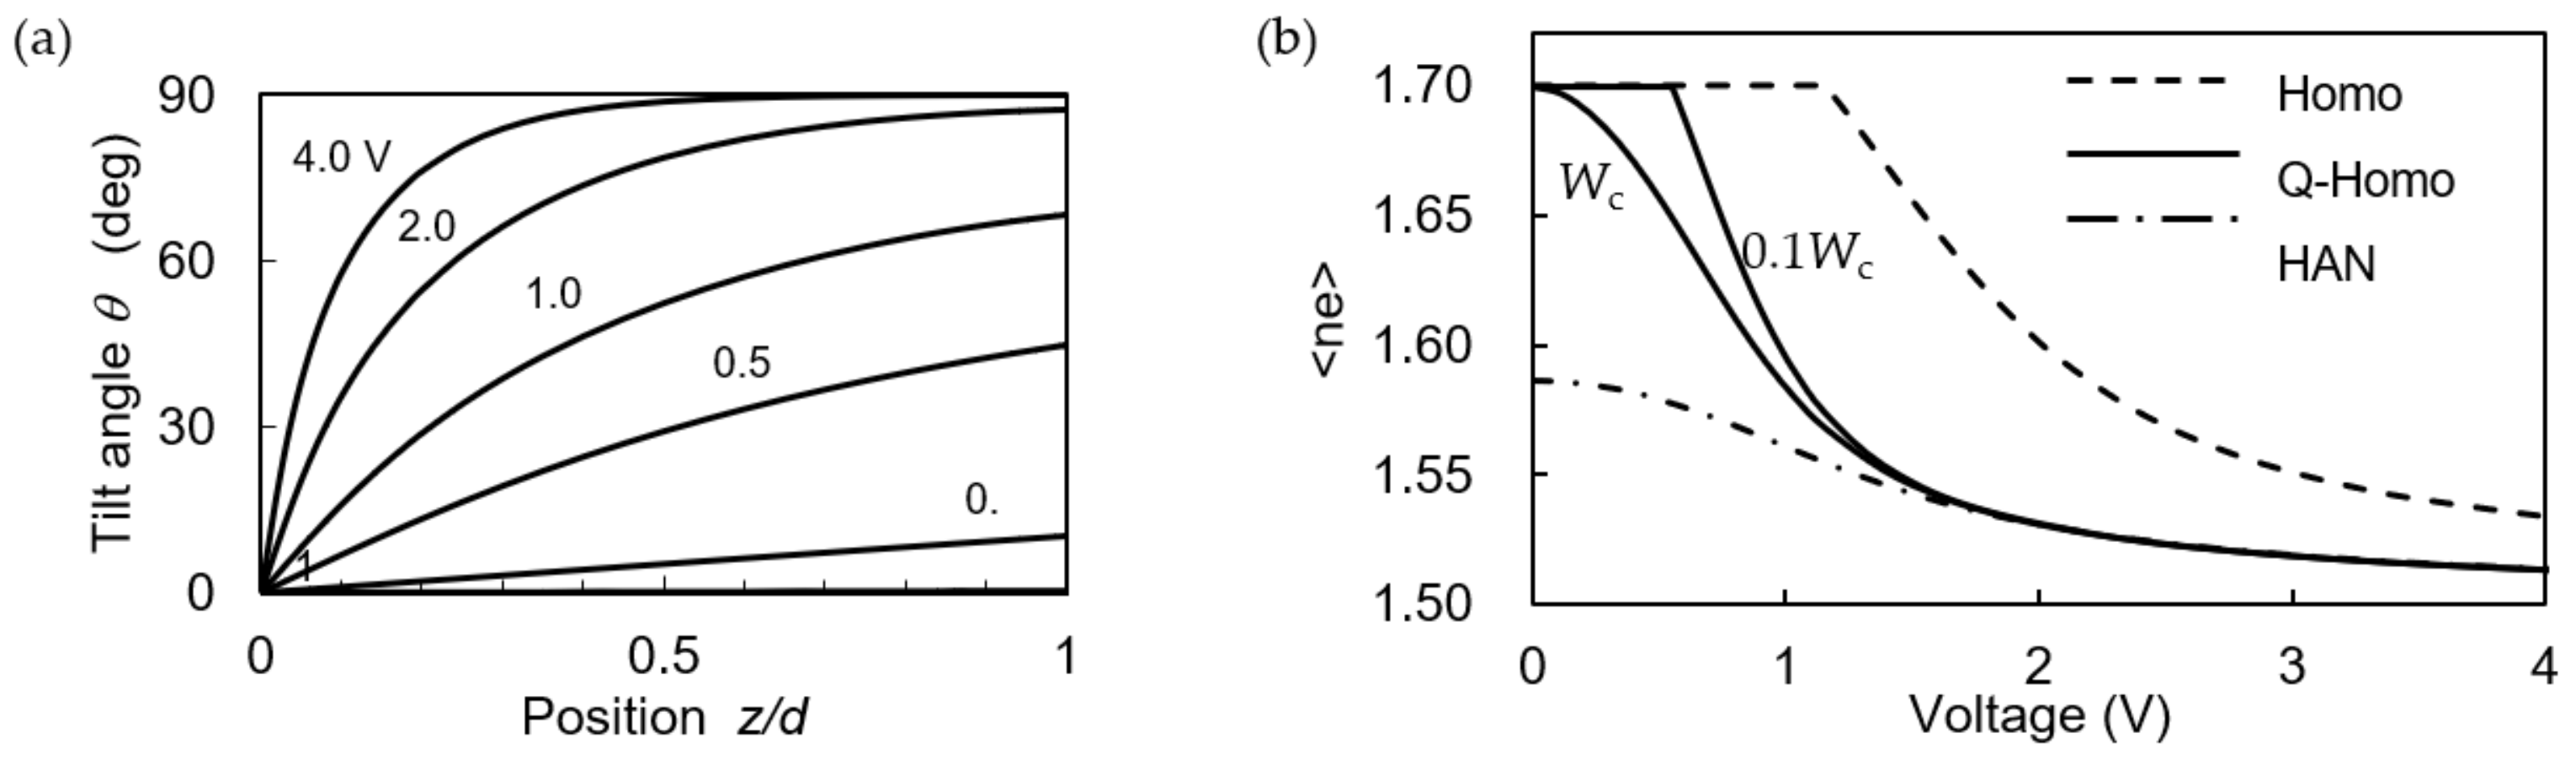
3.1. Q-Homo–HAN Cell
3.2. Q-Homo-TN Cell
4. Conclusions
Funding
Institutional Review Board Statement
Informed Consent Statement
Data Availability Statement
Conflicts of Interest
References
- Jaroszewicz, L.; Bennis, N. Liquid Crystal Optical Device; MDPI: Basel, Switzerland, 2020. [Google Scholar] [CrossRef]
- Frederick, V.K.; Zolina, V. Forces causing the orientation of an anisotropic liquid. Trans. Faraday Soc. 1933, 29, 919–930. [Google Scholar] [CrossRef]
- Yoneya, M.; Iwasaki, K.; Tomioka, Y.; Kondo, K. Cell gap margin enlargement of in-plane switching mode liquid crystal displays using weak-anchoring effects. Appl. Phys. Lett. 1999, 74, 803–805. [Google Scholar] [CrossRef]
- Bryan-Brown, G.P.; Wood, E.L.; Sage, I.C. Weak surface anchoring of liquid crystals. Nature 1999, 399, 338–340. [Google Scholar] [CrossRef]
- Andrienko, D.; Barbet, F.; Bormann, D.; Kurioz, Y.; Kwon, S.-B.; Reznikov, Y.; Warenghem, M. Electrically controlled director slippage over a photosensitive aligning surface; in-plane sliding mode. Liq. Crysts. 2000, 27, 365–370. [Google Scholar] [CrossRef]
- Sato, O.; Iwata, N.; Kawamura, J.; Maeda, T.; Tsujii, Y.; Watanabe, J.; Tokita, M. An in-plane switching liquid crystal cell with weakly anchored liquid crystals on the electrode substrate. J. Mater. Chem. C 2017, 5, 4384–4387. [Google Scholar] [CrossRef]
- Choi, Y.; Oh, S.-W.; Choi, T.-H.; Sohn, H.-J.; Do, S.-M.; Yoon, T.-H. Liquid crystal cell asymmetrically anchored for high transmittance and triggered with a vertical field for fast switching. Opt. Express 2020, 28, 20553–20562. [Google Scholar] [CrossRef] [PubMed]
- Sato, O.; Okuno, H.; Adachi, I.; Goto, K.; Noda, T.; Tsutsui, K. A high transmittance and fast response in-plane switching liquid crystal display with the zero-azimuth anchoring layers on the electrodes. J. Phys. D Appl. Phys. 2020, 53, 15LT02. [Google Scholar] [CrossRef]
- Yamaguchi, R.; Yamanaka, T.; Sato, S. Liquid-Crystal Optical Rotator Using Weak Azimuthal Anchoring Surface. Jpn. J. Appl. Phys. 2001, 40, 6522–6525. [Google Scholar] [CrossRef]
- Barbero, G.; Barberi, R. Critical thickness of a hybrid aligned nematic liquid crystal cell. J. Phys. 1983, 44, 609–616. [Google Scholar] [CrossRef]
- Barbero, G.; Bartolino, R. Remarks on critical thickness of a hybrid aligned nematic cell with large elastic anisotropy. Mol. Cryst. Liq. Cryst. 1983, 99, 89–97. [Google Scholar] [CrossRef]
- Strigazzi, A. Second order elasticity and critical thickness of hybrid aligned nematics strongly anchored on the planar side. Mol. Cryst. Liq. Cryst. 1990, 179, 425–433. [Google Scholar] [CrossRef]
- Madhusudana, N.V.; Durand, G. Linear flexo-electro-optic effect in a hybrid aligned nematic liquid crystal cell. J. Phys. Lett. 1985, 46, 195–200. [Google Scholar] [CrossRef]
- Strigazzi, A. On the critical thickness of a twisted nematic cell. J. Phys. 1985, 46, 1507–1512. [Google Scholar] [CrossRef]
- Yamaguchi, R.; Sato, S. Continuous grey scale image printing on the liquid crystal cell. Appl. Phys. Lett. 2005, 86, 031913. [Google Scholar] [CrossRef]
- Uchida, T.; Wada, M. Guest-Host Type Liquid Crystal Displays. Mol. Cryst. Liq. Cryst. 1981, 63, 19–44. [Google Scholar] [CrossRef]
- Allia, P.; Oldano, C.; Trossi, L. Polarization transfer matrix for the transmission of light through liquid-crystal slabs. J. Opt. Soc. Am. B 1988, 5, 2452–2461. [Google Scholar] [CrossRef]
- Lien, A. Extended Jones matrix representation for the twisted nematic liquid-crystal display at oblique incidence. Appl. Phys. Lett. 1990, 57, 2767. [Google Scholar] [CrossRef]


| K11 | K22 | K33 (pN) | ε// | ε// | no | ne |
|---|---|---|---|---|---|---|
| 12 | 8 | 18 | 15 | 5 | 1.5 | 1.7 |
Publisher’s Note: MDPI stays neutral with regard to jurisdictional claims in published maps and institutional affiliations. |
© 2022 by the author. Licensee MDPI, Basel, Switzerland. This article is an open access article distributed under the terms and conditions of the Creative Commons Attribution (CC BY) license (https://creativecommons.org/licenses/by/4.0/).
Share and Cite
Yamaguchi, R. Analysis of Electro-Optical Behavior in Liquid Crystal Cells with Asymmetric Anchoring Strength. Symmetry 2022, 14, 85. https://doi.org/10.3390/sym14010085
Yamaguchi R. Analysis of Electro-Optical Behavior in Liquid Crystal Cells with Asymmetric Anchoring Strength. Symmetry. 2022; 14(1):85. https://doi.org/10.3390/sym14010085
Chicago/Turabian StyleYamaguchi, Rumiko. 2022. "Analysis of Electro-Optical Behavior in Liquid Crystal Cells with Asymmetric Anchoring Strength" Symmetry 14, no. 1: 85. https://doi.org/10.3390/sym14010085
APA StyleYamaguchi, R. (2022). Analysis of Electro-Optical Behavior in Liquid Crystal Cells with Asymmetric Anchoring Strength. Symmetry, 14(1), 85. https://doi.org/10.3390/sym14010085