Article

An Alternative Perturbation and Observation Modifier Maximum Power Point Tracking of PV Systems

by
Anuchit Aurairat
and
Boonyang Plangklang
*
Department of Electrical Engineering, Faculty of Engineering, Rajamangala University of Technology Thanyaburi, Khlong Luang 12110, Pathum Thani, Thailand
*
Author to whom correspondence should be addressed.
Symmetry 2022, 14(1), 44; https://doi.org/10.3390/sym14010044
Submission received: 3 December 2021 / Revised: 20 December 2021 / Accepted: 27 December 2021 / Published: 30 December 2021
(This article belongs to the Special Issue Solar Cells and Symmetry)

Abstract

:
Under the current situation, it is necessary to harness solar energy to generate more electricity. However, the disadvantage of solar energy is that it takes a lot of space to install solar panels. An option to optimize PV systems is to improve the maximum power point tracking (MPPT) algorithm based on symmetrical management has the advantage of being easy to use without updating the devices. The improved algorithm achieves symmetry between the maximum power point (MPP) and the output of the PV array, resulting in less power loss and increased system efficiency. This paper presents the MPPT of photovoltaic using the current control modifier perturbation and observation plus fuzzy logic control (CCMP&O−FLC MPPT). The algorithm of CCMP&O−FLC MPPT is applied to reduce the setting time and to reduce oscillation around the set-point at a steady state. This concept was experimented with using a boost converter with MATLAB/Simulink software package and implemented by STM32F4VGA microcontroller. The simulation and experiment results are obtained by comparison with traditional P&O under similar operating conditions. The CCMP&O−FLC MPPT can track MPP faster when the irradiation is rapidly changing and, therefore, can reduce the PV system losses. In addition, the advantages of this proposed method can also be applied to improve the performance of existing systems without modifying existing equipment, unlike modern methods that cannot be applied to older systems. The results showed that the MPPT time and the power output efficiency of the proposed algorithm were 146 milliseconds and 99.5%, respectively.

1. Introduction

Solar energy is an energy that humans can use indefinitely, and in addition, we can find it easily. It appears and can be received everywhere and has high energy stability [1], although the problem is that the price for us to convert energy to use in a manner like fossil energy is still high. However, it is not the main problem because energy can change depending on market factors. We need to study and develop research to make solar energy use more stable and cost-effective. For this reason, currently, many countries around the world are developing and using more and more solar energy [2,3,4] because solar energy is clean energy with no fuel costs [5], and it is also very safe compared to fossil and nuclear power [6]. It is cost-effective, simple, clean, noise-free, and environmentally friendly to operate and maintain. Solar energy usage patterns are broadly divided into two forms, depending on the method of capturing light energy, transformation into another form of energy, and redistribution of that energy. The first form, known as active solar, is a photovoltaic method, or solar thermal, to capture and convert solar energy directly into electrical or thermal energy. Another form of passive solar is an indirect method of utilization included building designs in cold countries to maximize the sunlight or installing thermal mass-sensitive materials [7]. It can be applied to balance the indoor air, installing materials with light-diffusing properties, designing a space naturally circulating air. Solar photovoltaic is to convert solar energy into electrical energy [8,9]. The use of solar cells was first produced in 1883 by Charles Fritz and started using selenium in 1941 [10]. Monomolecular silicon solar panels relatively have high production costs. The use of solar panels in the early days focused on space applications such as satellites. After experiencing rising oil prices in 1973 and 1979, the developed countries turned their attention to solar energy improved more seriously. Photovoltaic (PV) is currently considered the most popular renewable energy [11,12,13] due to its many advantages. However, there are still some disadvantages compared to conventional power sources [14], particularly the high production costs, low power conversion [15,16,17], and nonlinear I-V and P-V characteristics, as shown in Figure 1. The equivalent circuit of photovoltaic cells is shown in Figure 2. Therefore, it is difficult to harvest energy from solar cells to achieve maximum efficiency. PV systems are now widely used in battery charging, water pumping, and grid-connected [18,19]. Various algorithms such as perturbation and observation (P&O) to optimize the PV system, increment conductance (INC), fuzzy logic (FL), particle swarm optimization (PSO), and hybrid are used [20].
Although these methods are effective in solving the problems of nonlinear I-V curves, detailed calculations are required, which limits the capabilities of these methods. Although, these methods are effective in solving the problems of nonlinear I−V curves. Detailed calculations are required and limit the capabilities of these methods. Using a fixed iterative step size with conventional perturbation and observation (P&O), the incremental conductance (INC) method is simple to provide good performance. However, they have a disadvantage of the slow tracking of the maximum power point when irradiation and temperature change rapidly. This problem can be solved with a large step size allowing the fast maximized power tracking but causing PV energy oscillations around the MPP. The oscillation can be reduced by using a smaller step size. But it slows the speed of the maximum power point tracking. However, to solve the problem with the fixed step size method, the obtained maximum power point tracking speed is still slow. To overcome the drawbacks and fast response of the maximum power point tracking, therefore, an adapted algorithm with variable step size is proposed. The step size is automatically adjusted according to the power to voltage derivative of the PV array (dP/dV).
Juber Ahmed and Zainal Salam introduced enhanced adaptive perturbation and observation (EA-P&O) MPPT for tracking the MPPT under partial shading on PV panel so that it has a good tracking and high efficiency [9]. The soft-MPPT was introduced by Shamik Bhattacharyya et al. to track the MPPT under rapid changes in irradiance, which is fast-tracking [21]. John Macaulay and Zhongfu Zhou proposed a modified perturbation and observation of MPPT under changes in irradiance, where the algorithm has fast response and low steady-state oscillation around MPP [22]. Kamarn Ali et al. used a neuro-fuzzy for high MPPT performance under changing irradiance and temperature [23]. Hegazy Rezk et al. used adaptive fuzzy logic-based MPPT (AFL-MPPT) with high tracking efficiency and fast dynamics [24]. A comparison of the maximum power point tracking based on P&O and fuzzy logic algorithms discussed above is summarized in Table 1. In addition, many DC/DC boost converters are also used in PV array systems to track the maximum power point [21,25]. Due to its simple structure, the number of semiconductor switches can be reduced, resulting in low cost [26].
In this paper, the CCMP&O−FLC MPPT is proposed. The MATLAB/Simulink program is applied to test, validate and compare the results obtained from the proposed P&O and traditional P&O MPPT methods. An experimental prototype of the MPPT system using a DC/DC boost converter controlled by the STM32F4VGA microcontroller-based control circuit was developed. A comparative study between the proposed P&O and the traditional P&O method under similar operating conditions was presented. Many efficiency parameters such as PV array output power efficiency, response time, tracking accuracy, and ripple have been suggested.

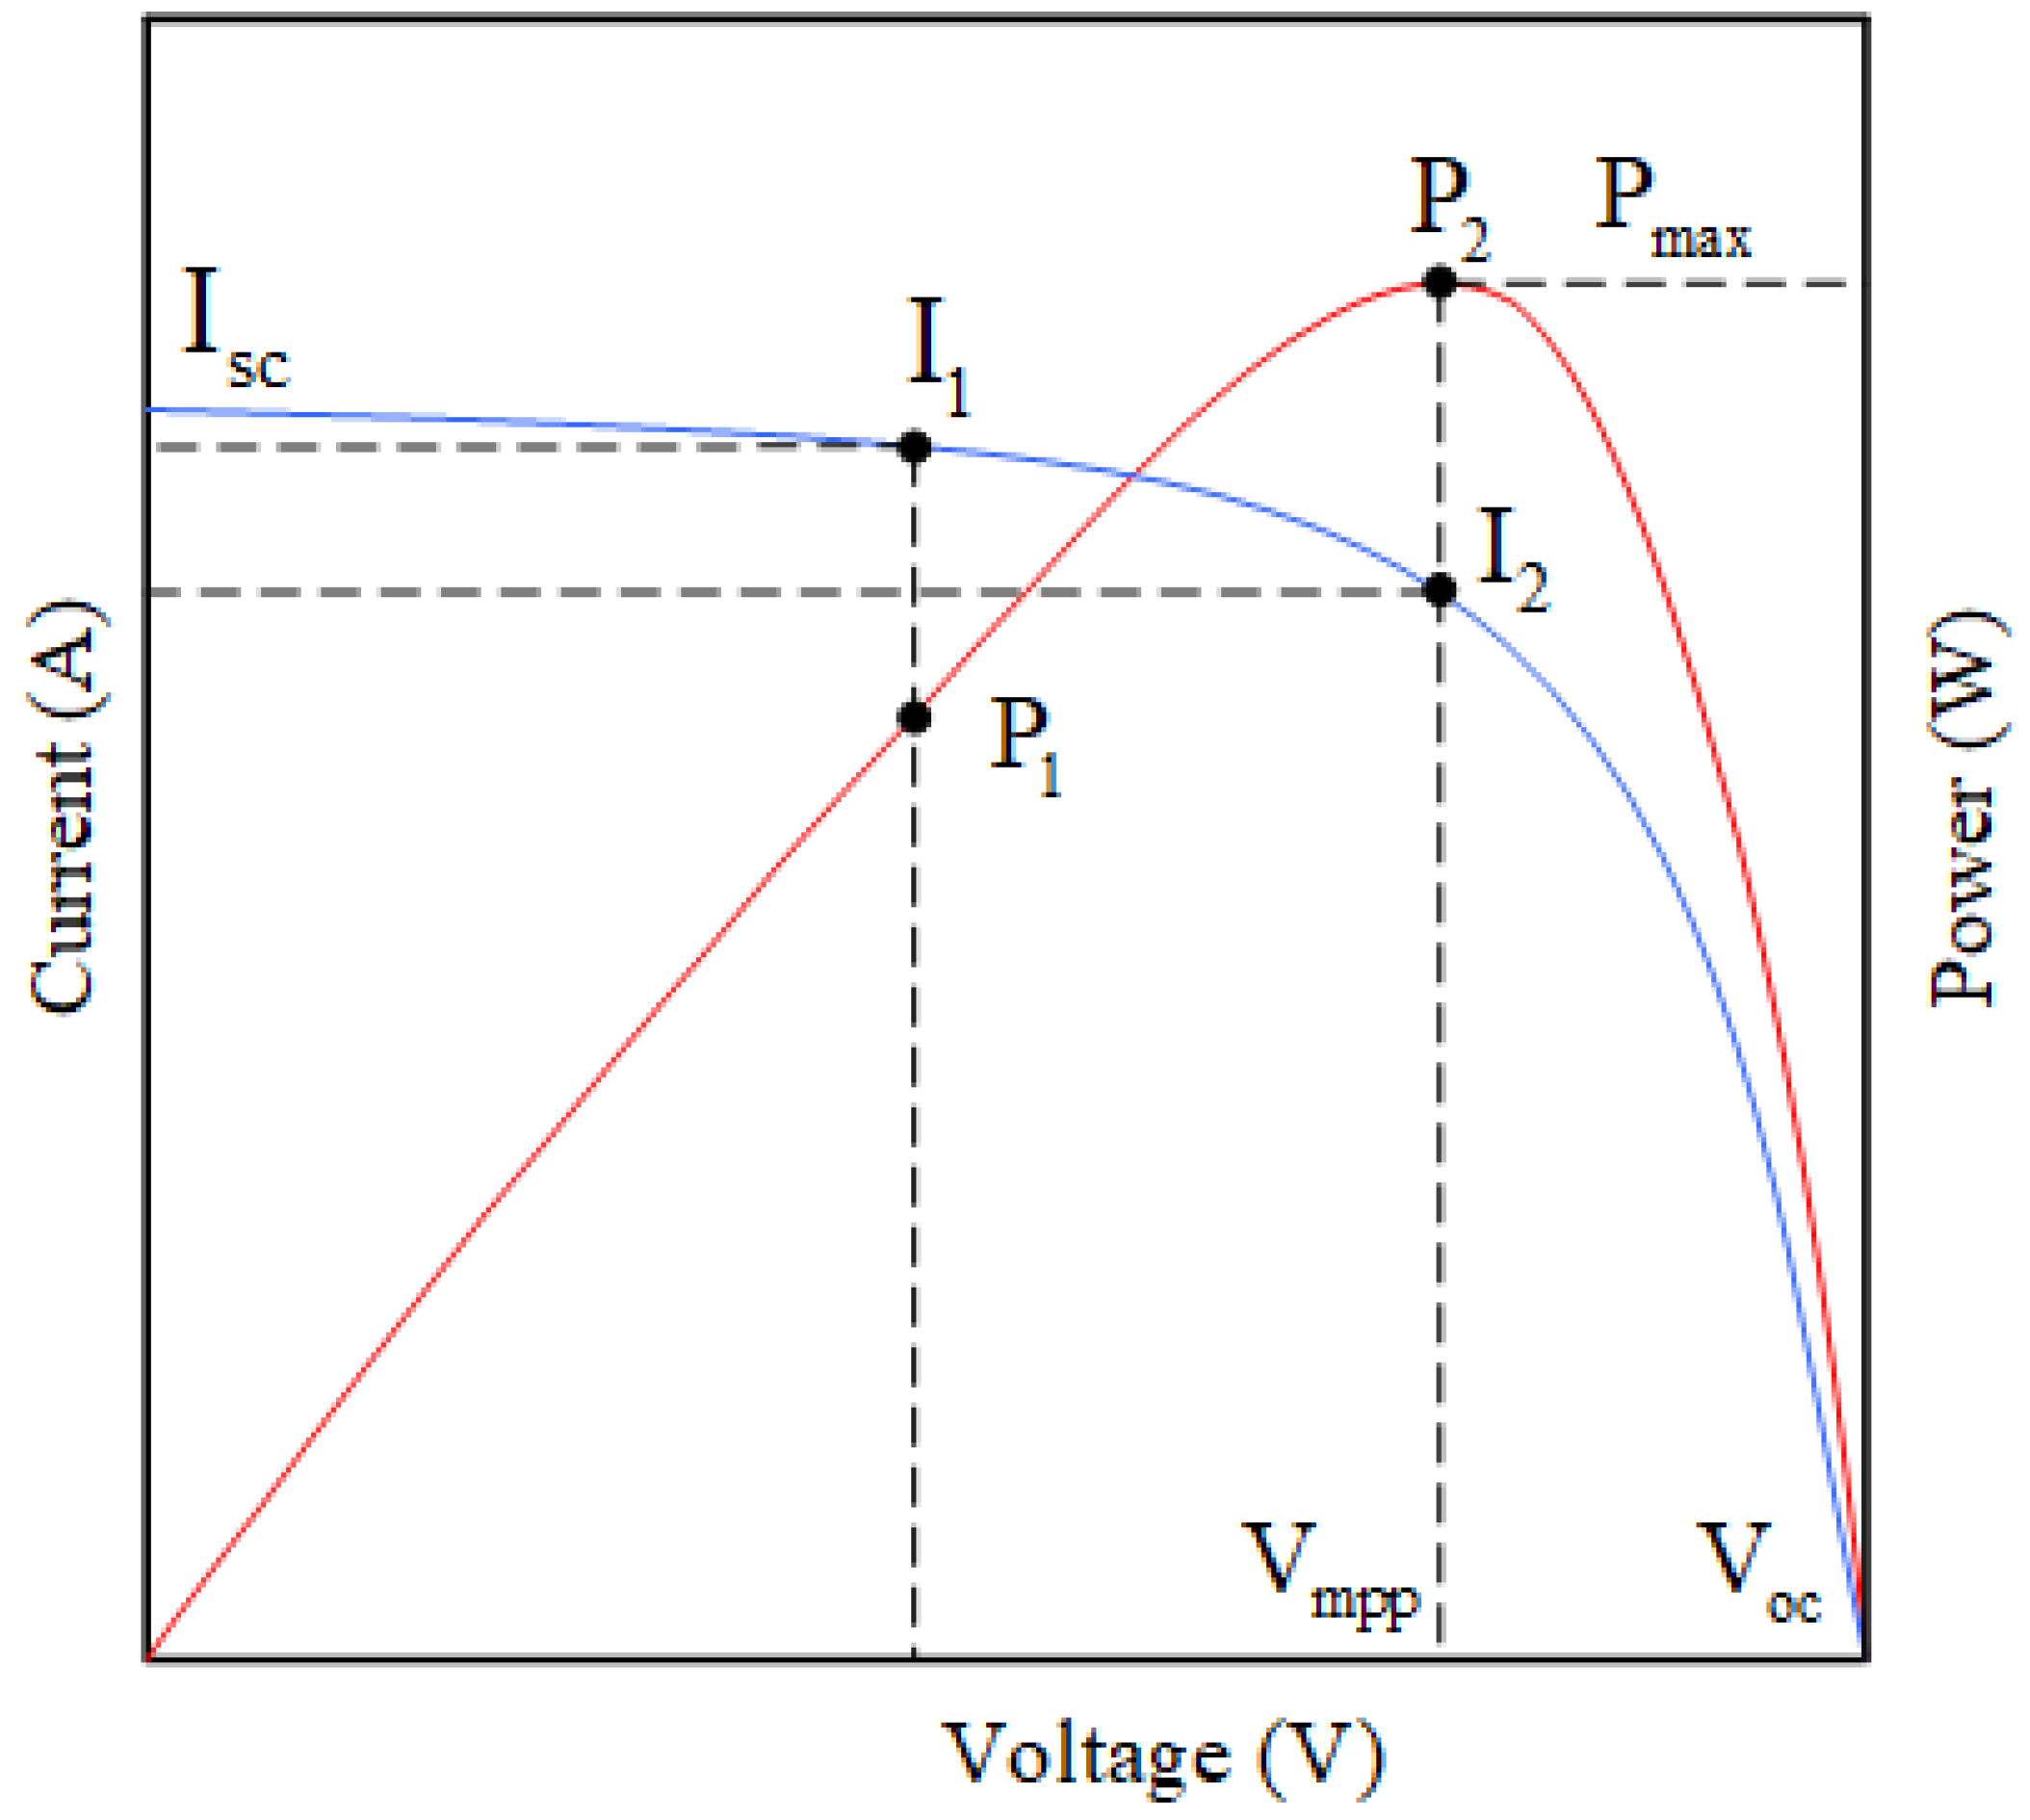
2. Maximum Power Point

From the experiment, the understanding of characteristic curves of a solar cell can be assumed like a curve as opposed to a diode property because of the power caused by current and voltage.
Therefore, the transmission curve of the solar cell can be afforded depending on the level of light received. According to the I−V property curve opposite the diode according to Figure 1, which has a maximum power called maximum power point (MPP). Even with a high current value at the short-circuit point, when the voltage is equal to zero. Therefore, the power value is also zero, where vice versa, at the opening of the circuit, the power at this point is also zero, while the effect of the combination of current and voltage causes the value of power to be close to the maximum value. We call the maximum power point (MPP) that is the point where the solar cells work by receiving the light intensity and transmitting the maximized power. When considering the I−V curves, the Vmpp and Impp values can be calculated from Voc and Isc.
V m p p     ( 0.75 0.9 ) V o c
I m p p     ( 0.85 0.95 ) I s c
The fill factor (FF) is the value considered properties of the solar cell with the following values.
F F = V m p p I m p p / V o c I s c
The fill factor value refers to the value that represents the quality of the solar cell. Typically, silicon cells are approximately 0.7–0.8, and the output power of the solar cell is shown in Equation (3).
P m p p = V m p p I m p p = V o c I o c F F
Therefore, the efficiency of the solar cell is the ratio of the output electric energy to the solar input (Pin), which has the following relationship.
η = V o c I s c F F / P i n
At present, the maximum efficiency of silicon solar cells at 1000 W/m2 from laboratory tests is approximately 24%, and in general, use is 10–14%, although theoretically, the value is 26–27%.
From Figure 1, it is observed that when the current is I1, the electric power is P1. The electric current is I2, the electric power is P2, which is the maximum power. Therefore, we have to harness the electricity to keep the solar cells at the maximized power all the time.

3. Conventional Perturbation and Observation Algorithm

Today, one of the most popular MPPT methods is the P&O method, which has operated for a long time. According to the characteristic curve, the perturbation and observation techniques are applied to adjust the voltage of the photovoltaic system in the direction of constantly increasing power. When the maximum power is reached, the voltage is constantly changing and fluctuating around the maximized power. This algorithm is suitable for slow changes in irradiation and temperature. The disadvantage is an output oscillation on the maximum power. Furthermore, the speed of convergence to a maximized power point depends on the step size (D: delta of duty cycle). The small step size has low oscillations on maximum power and big tracking time. The big step size has high oscillations on maximum power point and low tracking time. A diagram of the perturbation and observation maximized power point tracking (P&O MPPT) method is shown in Figure 3.
The basic equations of P&O method are as follows:
P P V ( k ) = V P V ( k ) I P V ( k )
Δ P = P _ P V   ( k ) P _ P V   ( k 1 )
Δ V = V P V ( k ) V P V ( k 1 )
Δ P = 0       a t       M P P
Δ P < 0       a n d       Δ V < 0       a t       l e f t       o f       M P P
D ( k ) = D ( k 1 ) Δ D       d e c r e a s e       V o u t
Δ P < 0       a n d       Δ V > 0       a t       r i g h t       o f       M P P
D ( k ) = D ( k 1 ) + Δ D       i n c r e a s e       V o u t
Δ P > 0       a n d       Δ V < 0       at       right       of       MPP
D ( k ) = D ( k 1 ) + Δ D       i n c r e a s e       V o u t
Δ P > 0       a n d       Δ V > 0       a t       l e f t       o f       M P P
D ( k ) = D ( k 1 ) Δ D       d e c r e a s e       V o u t

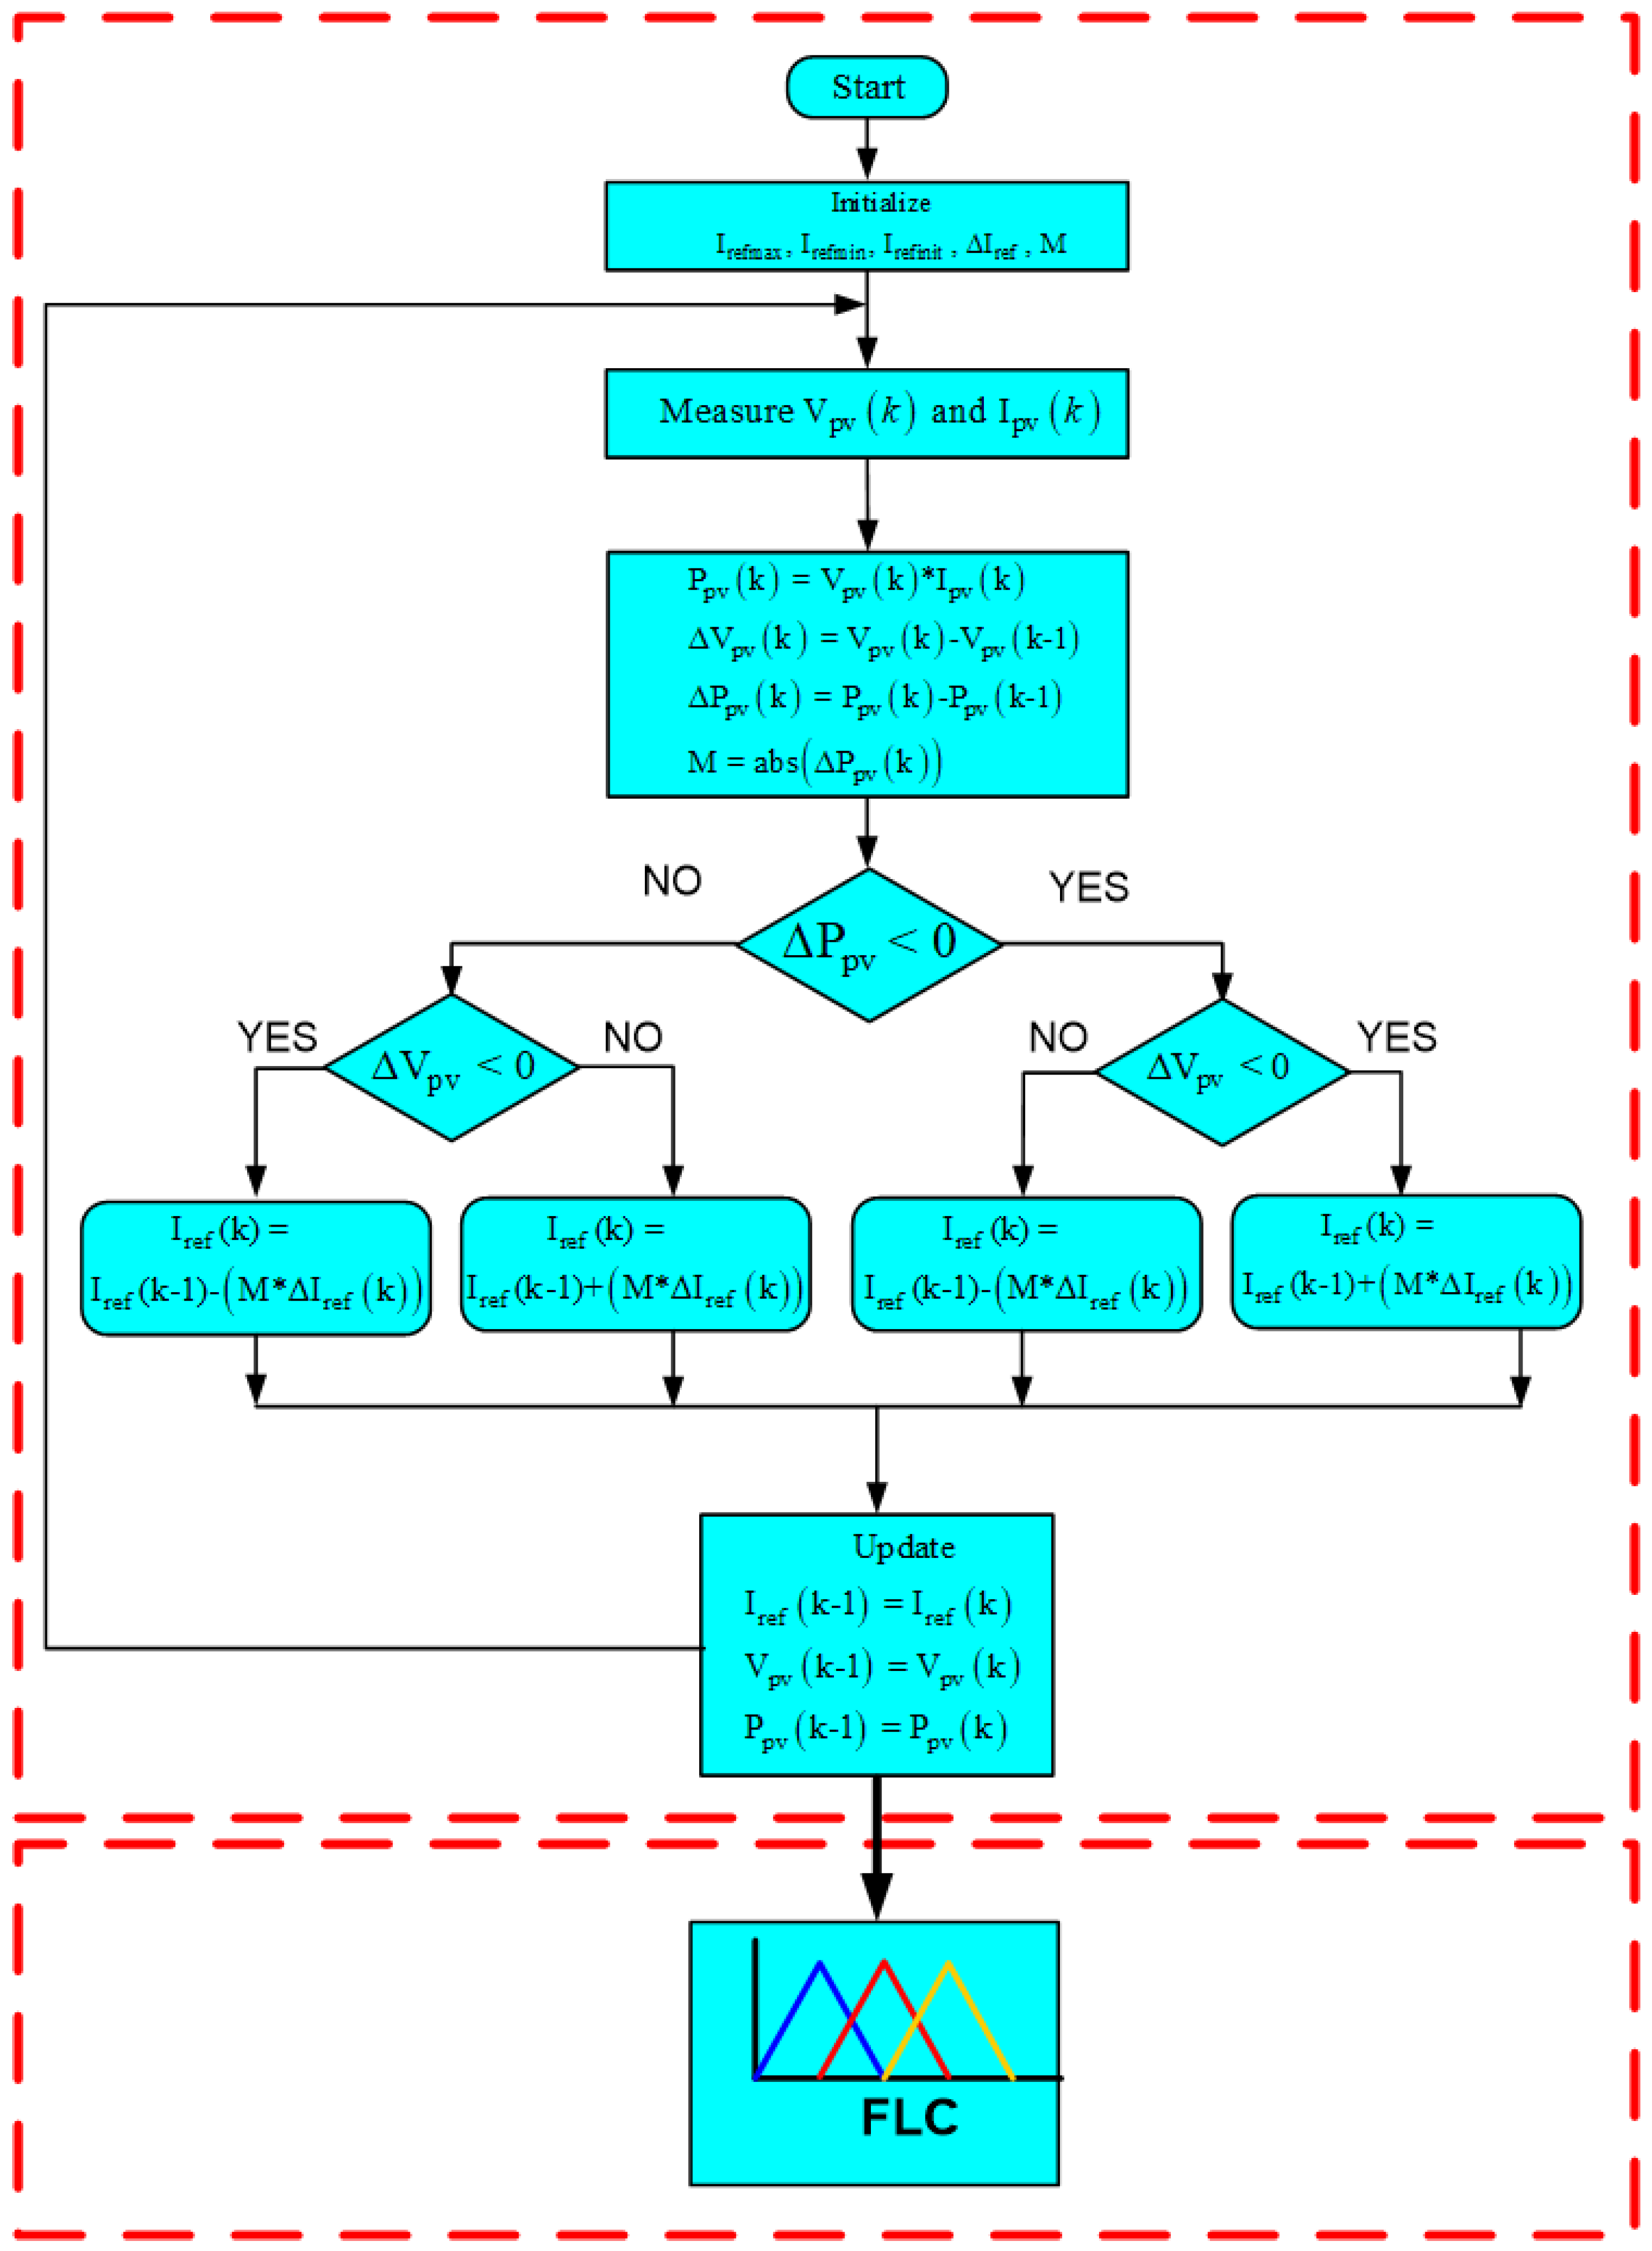
4. Modified Perturbation and Observation Algorithm

The advantages of the traditional perturbation and observation MPPT algorithm are simple and effective. However, the weakness of this algorithm is that its operation may fail under rapidly changing irradiation and temperature conditions, leading to MPP tracking in the wrong direction. Fast-tracking can be performed with larger step sizes. But excessive steady-state oscillation is inevitable, where the smaller the step size can reduce the slower dynamic shaking. Many solutions to these conflicts have been presented using variable and progressive step sizes that cannot be achieved where the algorithm automatically changes the step size based on the PV array style. Depending on the individual operating conditions, the size of the step should provide a satisfying exchange between the dynamics and oscillation. Therefore, based on the basic principles of MPPT, this article presents a modifier perturbation and observation MPPT algorithm, which has a more simple character, faster response time, and less oscillation. The chart of modifier perturbation and observation algorithm is shown in Figure 4. In solving the perturbation and observation problems, the CCMP&O−FLC MPPT methods are proposed based on Equation (17), where Iph is related to solar radiation.
I p h = λ ( I s c + k i ( T T r e f ) )
where
λ is the solar irradiation intensity; kW/m2,
Iph is the electric current generated by solar irradiation; A,
Isc is the shot-circuit current of the cell; A,
Ki is the temperature coefficient of the short-circuit current; A/°C,
T is the temperature at the cell junction; °K,
Tref is the reference temperature of the cell.
Figure 4. Diagram of modifier perturbation and observation fuzzy MPPT method.
Symmetry 14 00044 g004
The current control modifier perturbation and observation plus fuzzy logic control maximum power point tracking method proposed is given as follows:
P P V ( k ) = V P V ( k ) I P V ( k )  
Δ P = P P V ( k ) P P V ( k 1 )  
Δ V = V P V ( k ) V P V ( k 1 )  
M = a b s ( Δ P P V ( k ) )       v a r i a b l e       s t e p       s i z e  
Δ P = 0       a t       M P P  
Δ P < 0       a n d       Δ V < 0       a t       l e f t       o f       M P P  
I r e f ( k ) = I r e f ( k 1 ) ( M Δ I r e f ( k ) )       d e c r e a s e       V o u t  
Δ P < 0       a n d       Δ V > 0       a t       r i g h t       o f       M P P  
I r e f ( k ) = I r e f ( k 1 ) + ( M Δ I r e f ( k ) )       i n c r e a s e       V o u t  
Δ P > 0       a n d       Δ V < 0       a t       r i g h t       o f       M P P  
I r e f ( k ) = I r e f ( k 1 ) + ( M Δ I r e f ( k ) )       i n c r e a s e       V o u t  
Δ P > 0       a n d       Δ V > 0       a t       l e f t       o f       M P P  
I r e f ( k ) = I r e f ( k 1 ) ( M Δ I r e f ( k ) )       d e c r e a s e       V o u t  
where
Ppv(k), Vpv(k), and Ipv(k) are the PV array output power, voltage, and current at the instant (k).
Ppv(k − 1), Vpv(k − 1) are the PV array output power and voltage at the instant (k − 1).
M is the absolute value of the ΔPpv(k).
Iref(k) is the initial current at the instant (k).
Iref(k − 1) is the initial current at the instant (k − 1).
To control the duty cycle of the boost converter, fuzzy logic control (FLC) is used. The nine rule of FLC is illustrated in Table 2.
By using the symmetry fuzzy rule, the input and output membership function of fuzzy logic are shown in Figure 5. In order to reduce the oscillations around the MPP, therefore, the regions of the Iref, dIref and duty cycle are defined as −20 to 20, −1 to 1, and 0 to 100, respectively.

5. Simulation Results

To illustrate the MPPT, response time, ripple, and efficiency of the CCMP & O−FLC MPPT method. A comparative study between P&O and CCMP & O−FLC MPPT methods have been demonstrated. Therefore, MATLAB/Simulink was applied to simulate the system at the beginning of this research. To track the maximum power, the DC/DC boost converter was applied to transfer the electrical power from the PV array to the load. The 1Soltech 1STH−215P was used in the simulation. The PV module specifications and the DC/DC boost converter parameter of the simulation system are illustrated in Table 3 and Table 4, respectively.

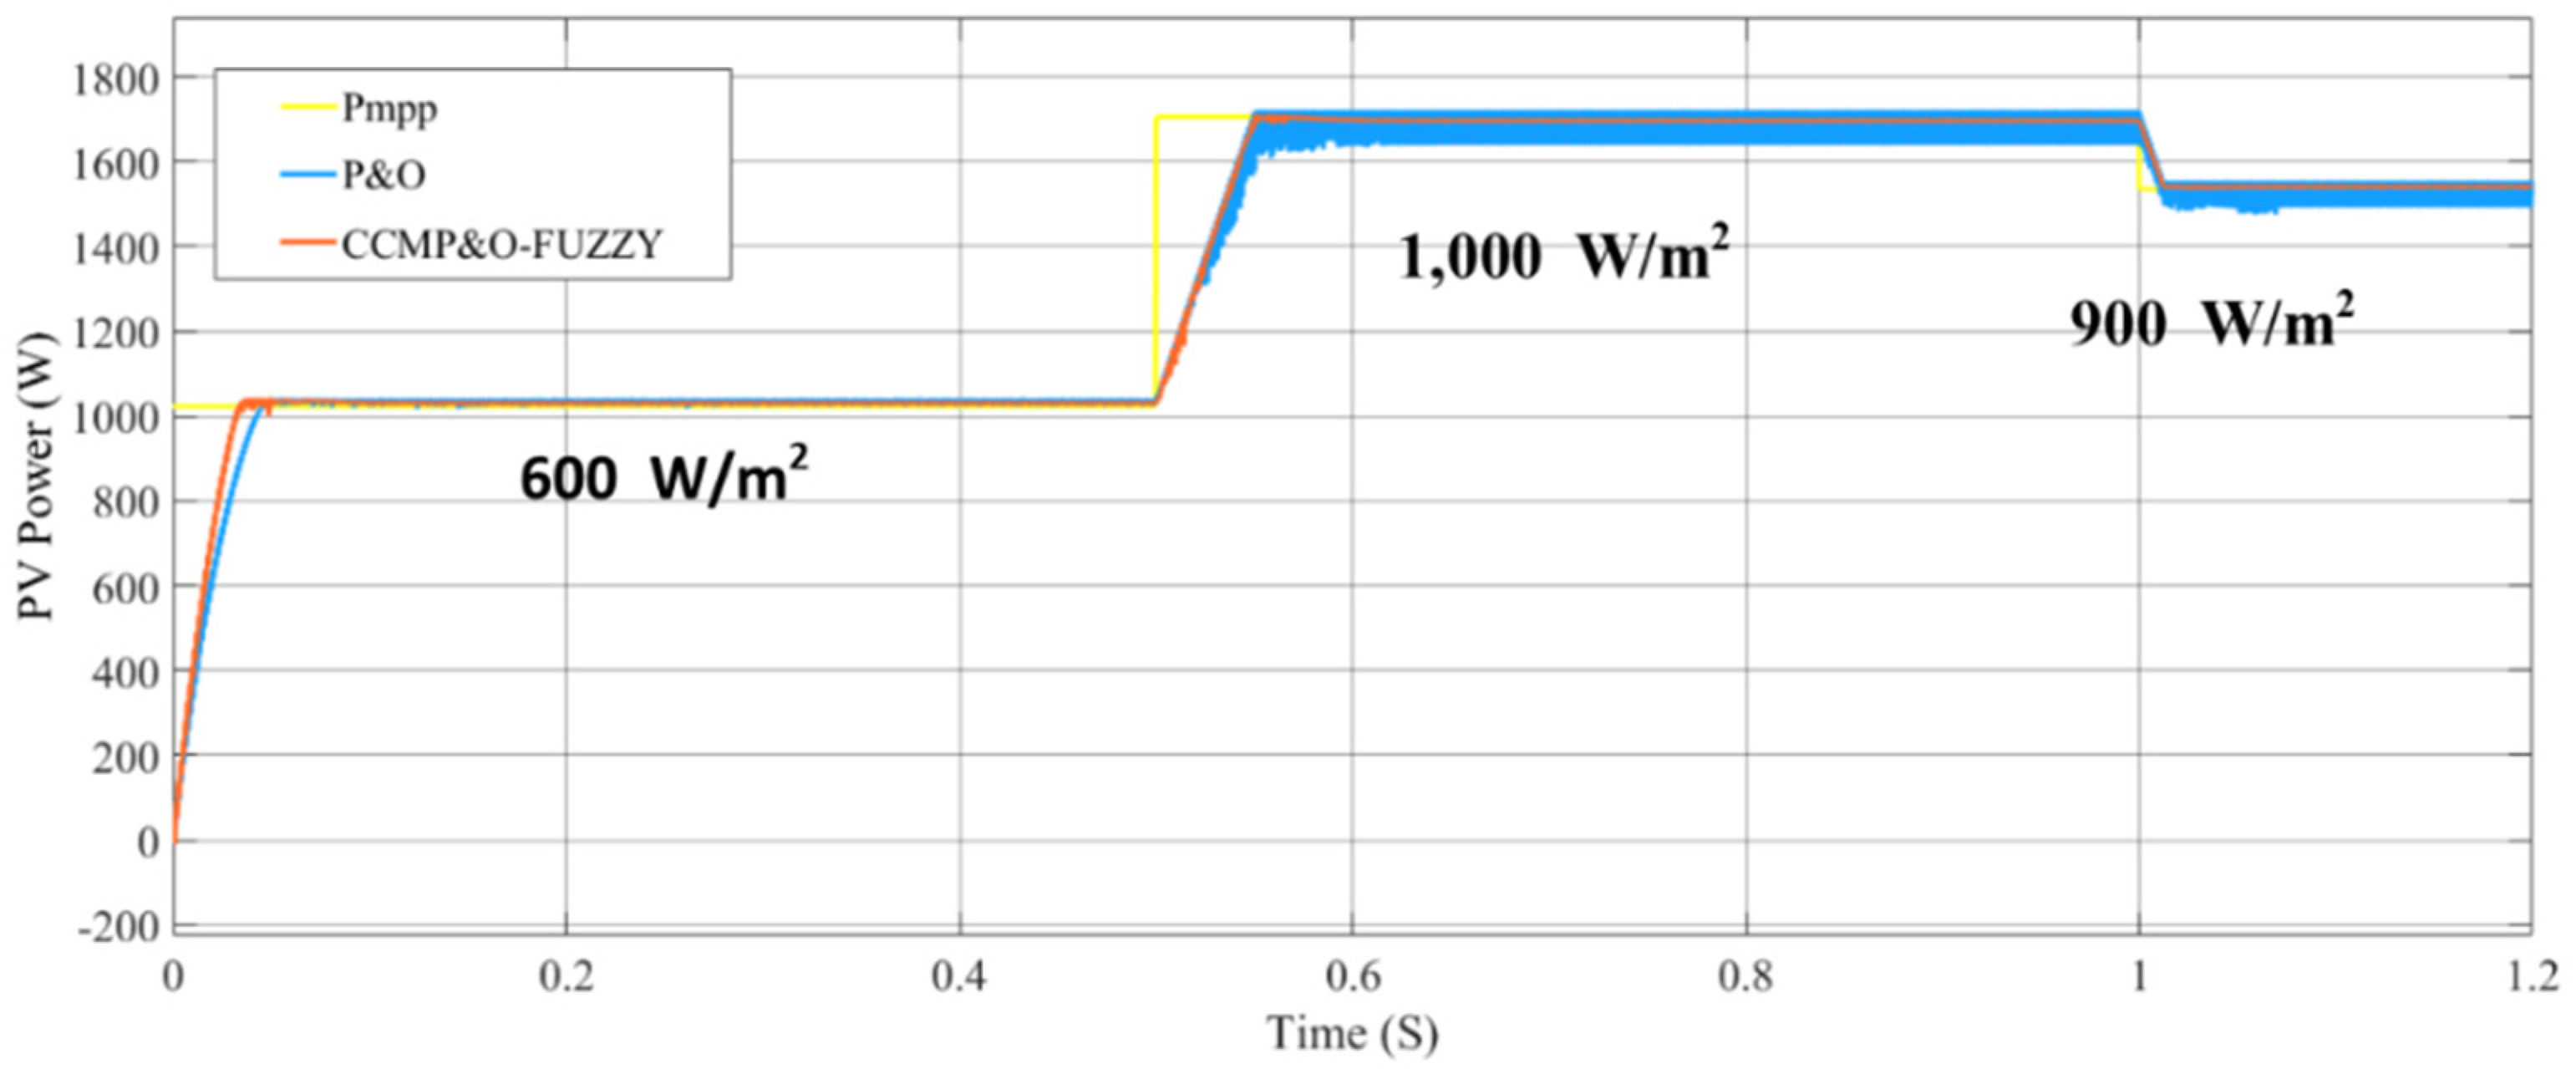
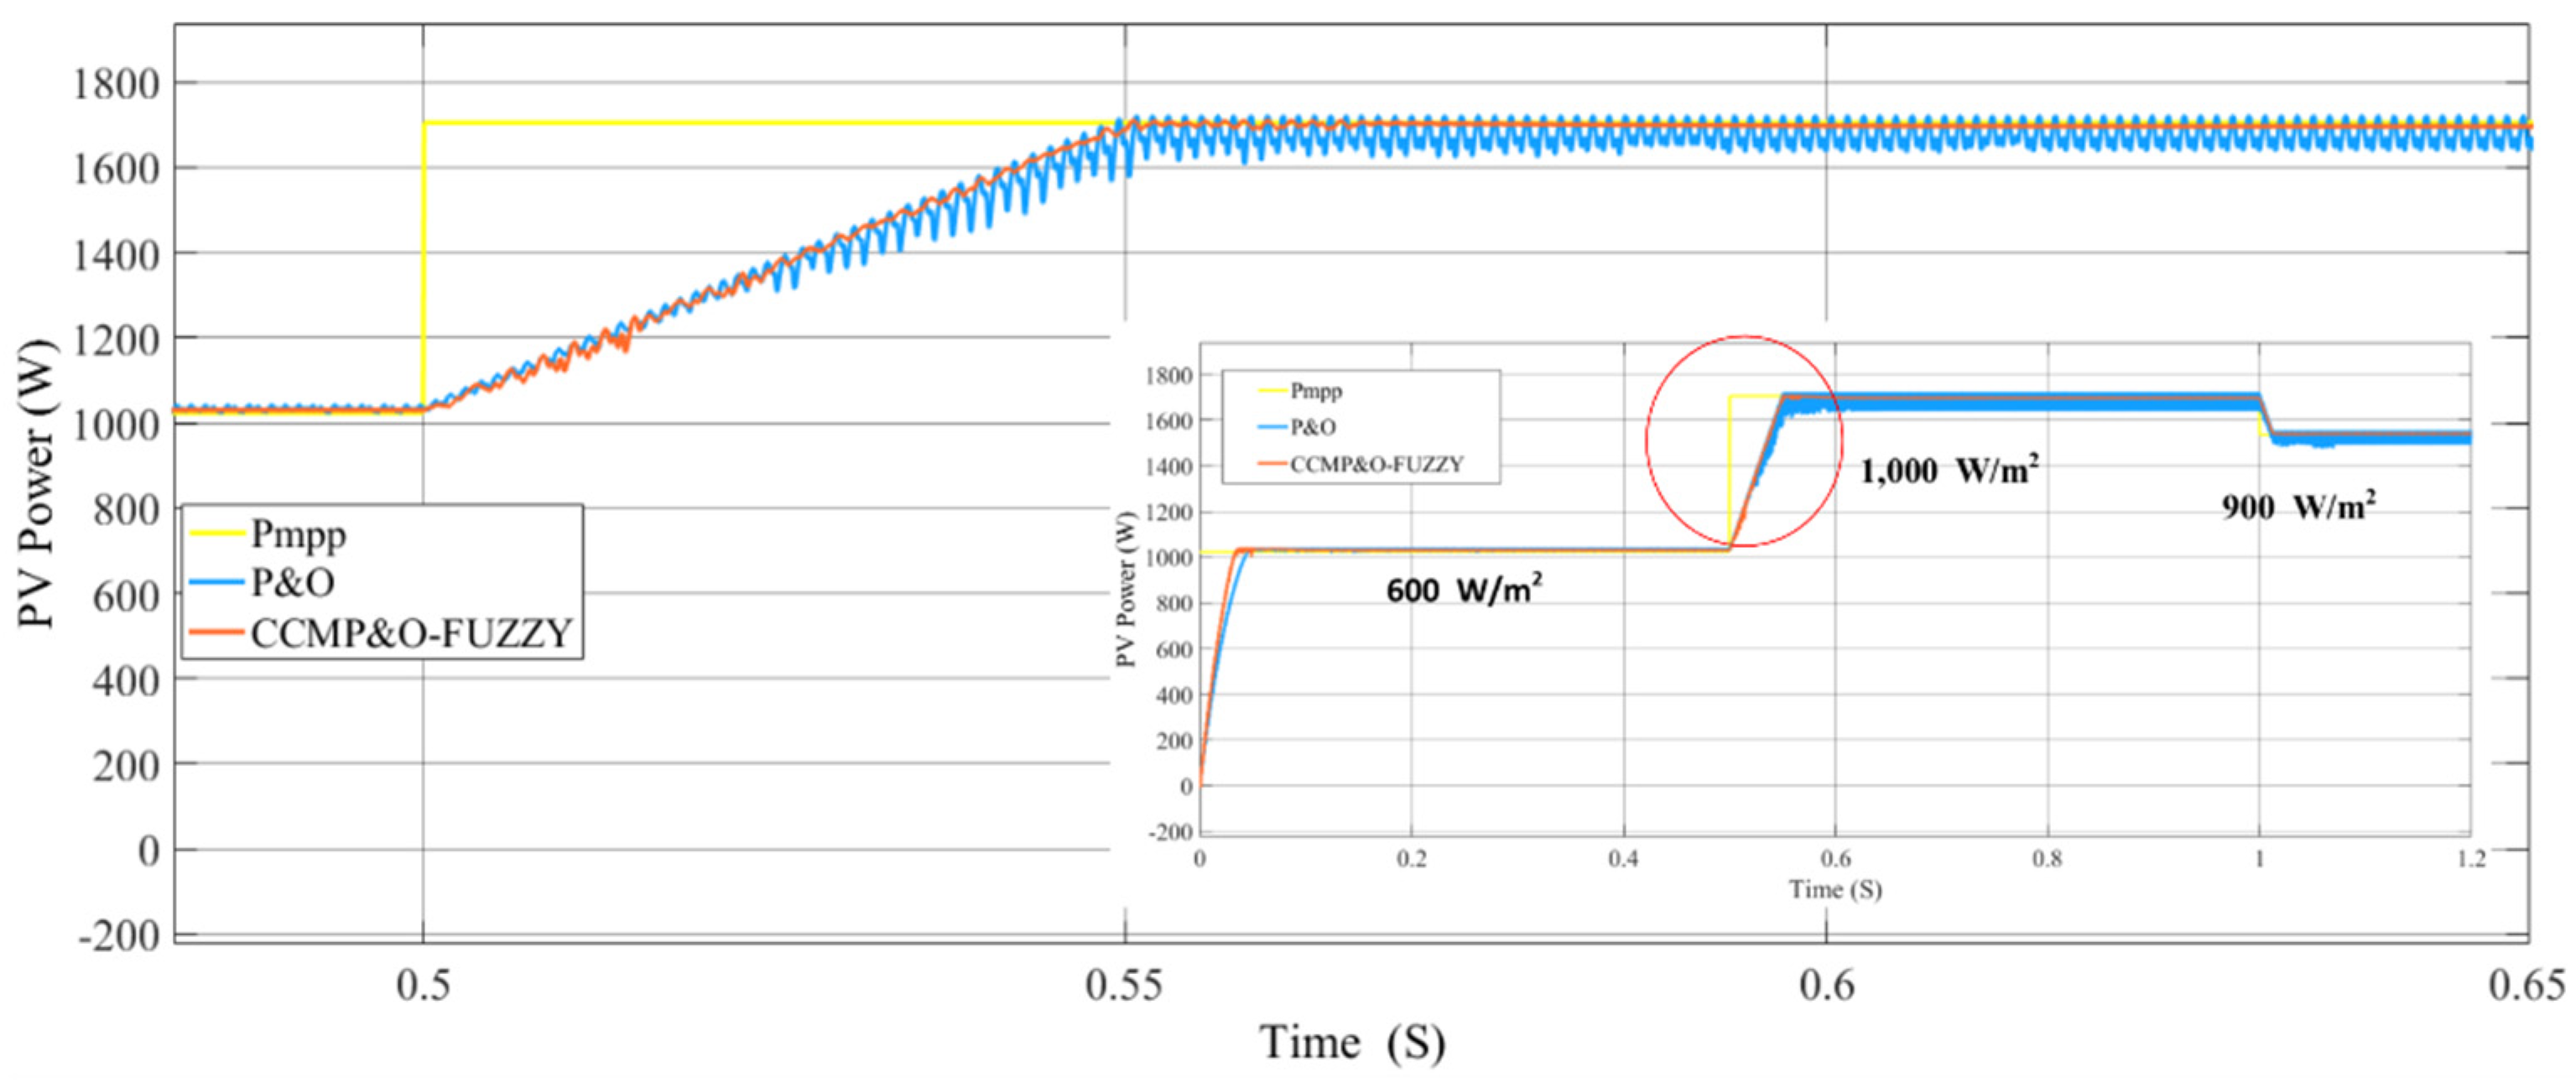
5.1. Maximum Power Point Tracking

The perturbation and observation maximum power point tracking (P&O MPPT) method and current control modifier perturbation and observation plus fuzzy logic control maximized power point tracking (CCMP&O−FLC MPPT) was tested by simulation the rapid change irradiation levels as follow 600, 1000, and 900 W/m2. The simulation results showed that the MPPT algorithm mentioned in this article is very accurate. The energy values determined by both methods converge to the theoretical values corresponding to the rapid change irradiation level, as shown in Figure 6.

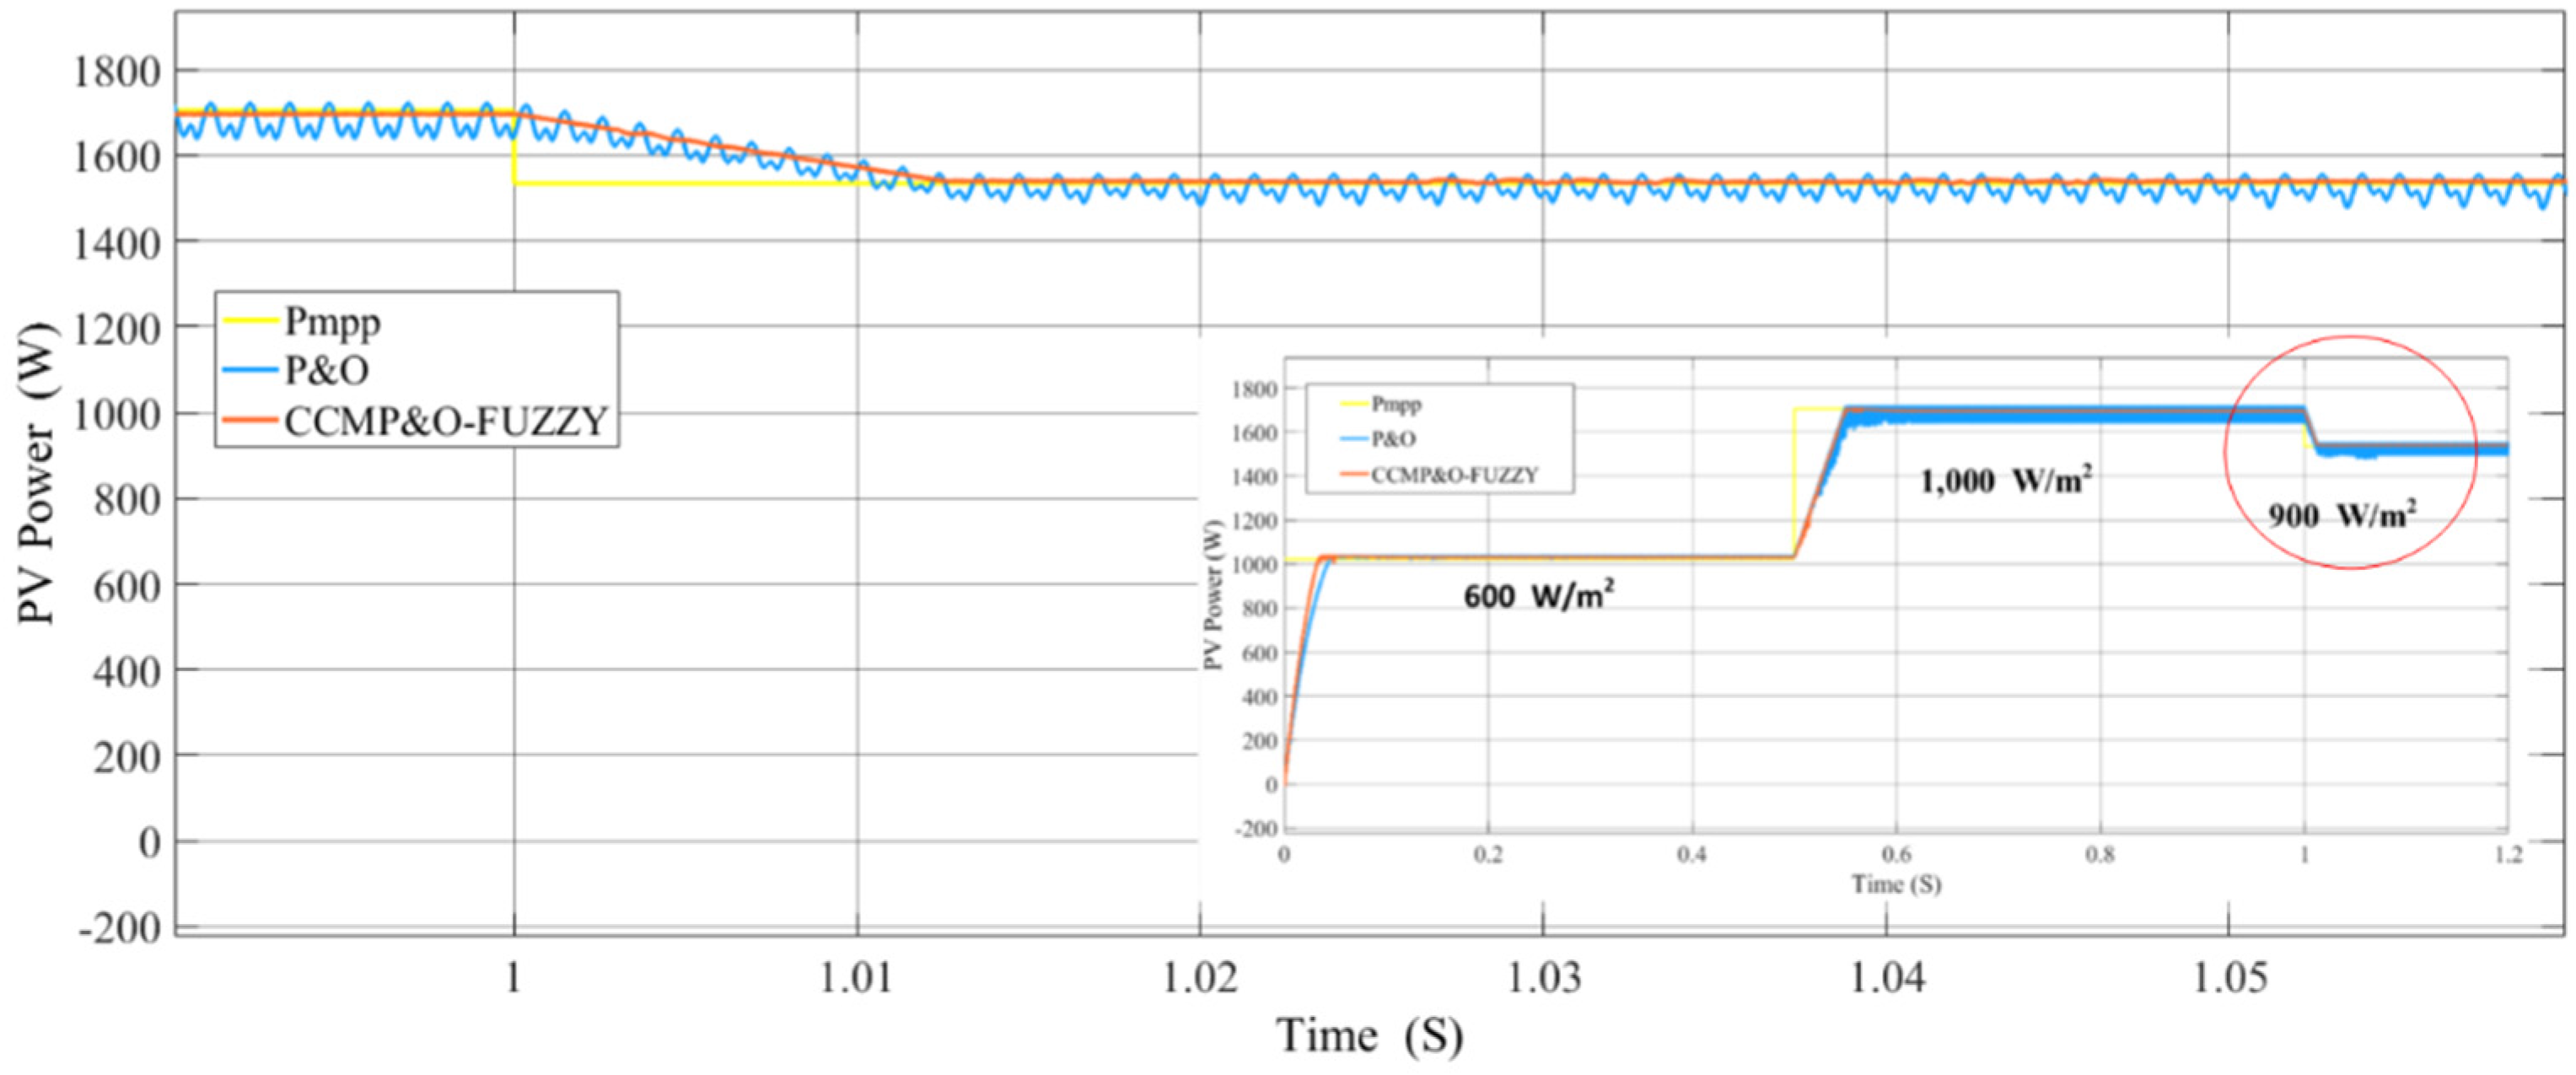
5.2. Comparison of Response Time

A comparison of the maximum power point tracking between proposed and traditional P&O MPPT methods is shown in Figure 7. The proposed CCMP&O−FLC MPPT method can reduce energy loss more than traditional P&O methods due to less maximum power tracking time.
Figure 8 and Figure 9 show the output power of the PV array due to the sudden rise and fall of irradiation. It can be noted that the response time with the proposed MPPT algorithm is significantly better when using the traditional P&O MPPT algorithm, especially around the MPPT point.

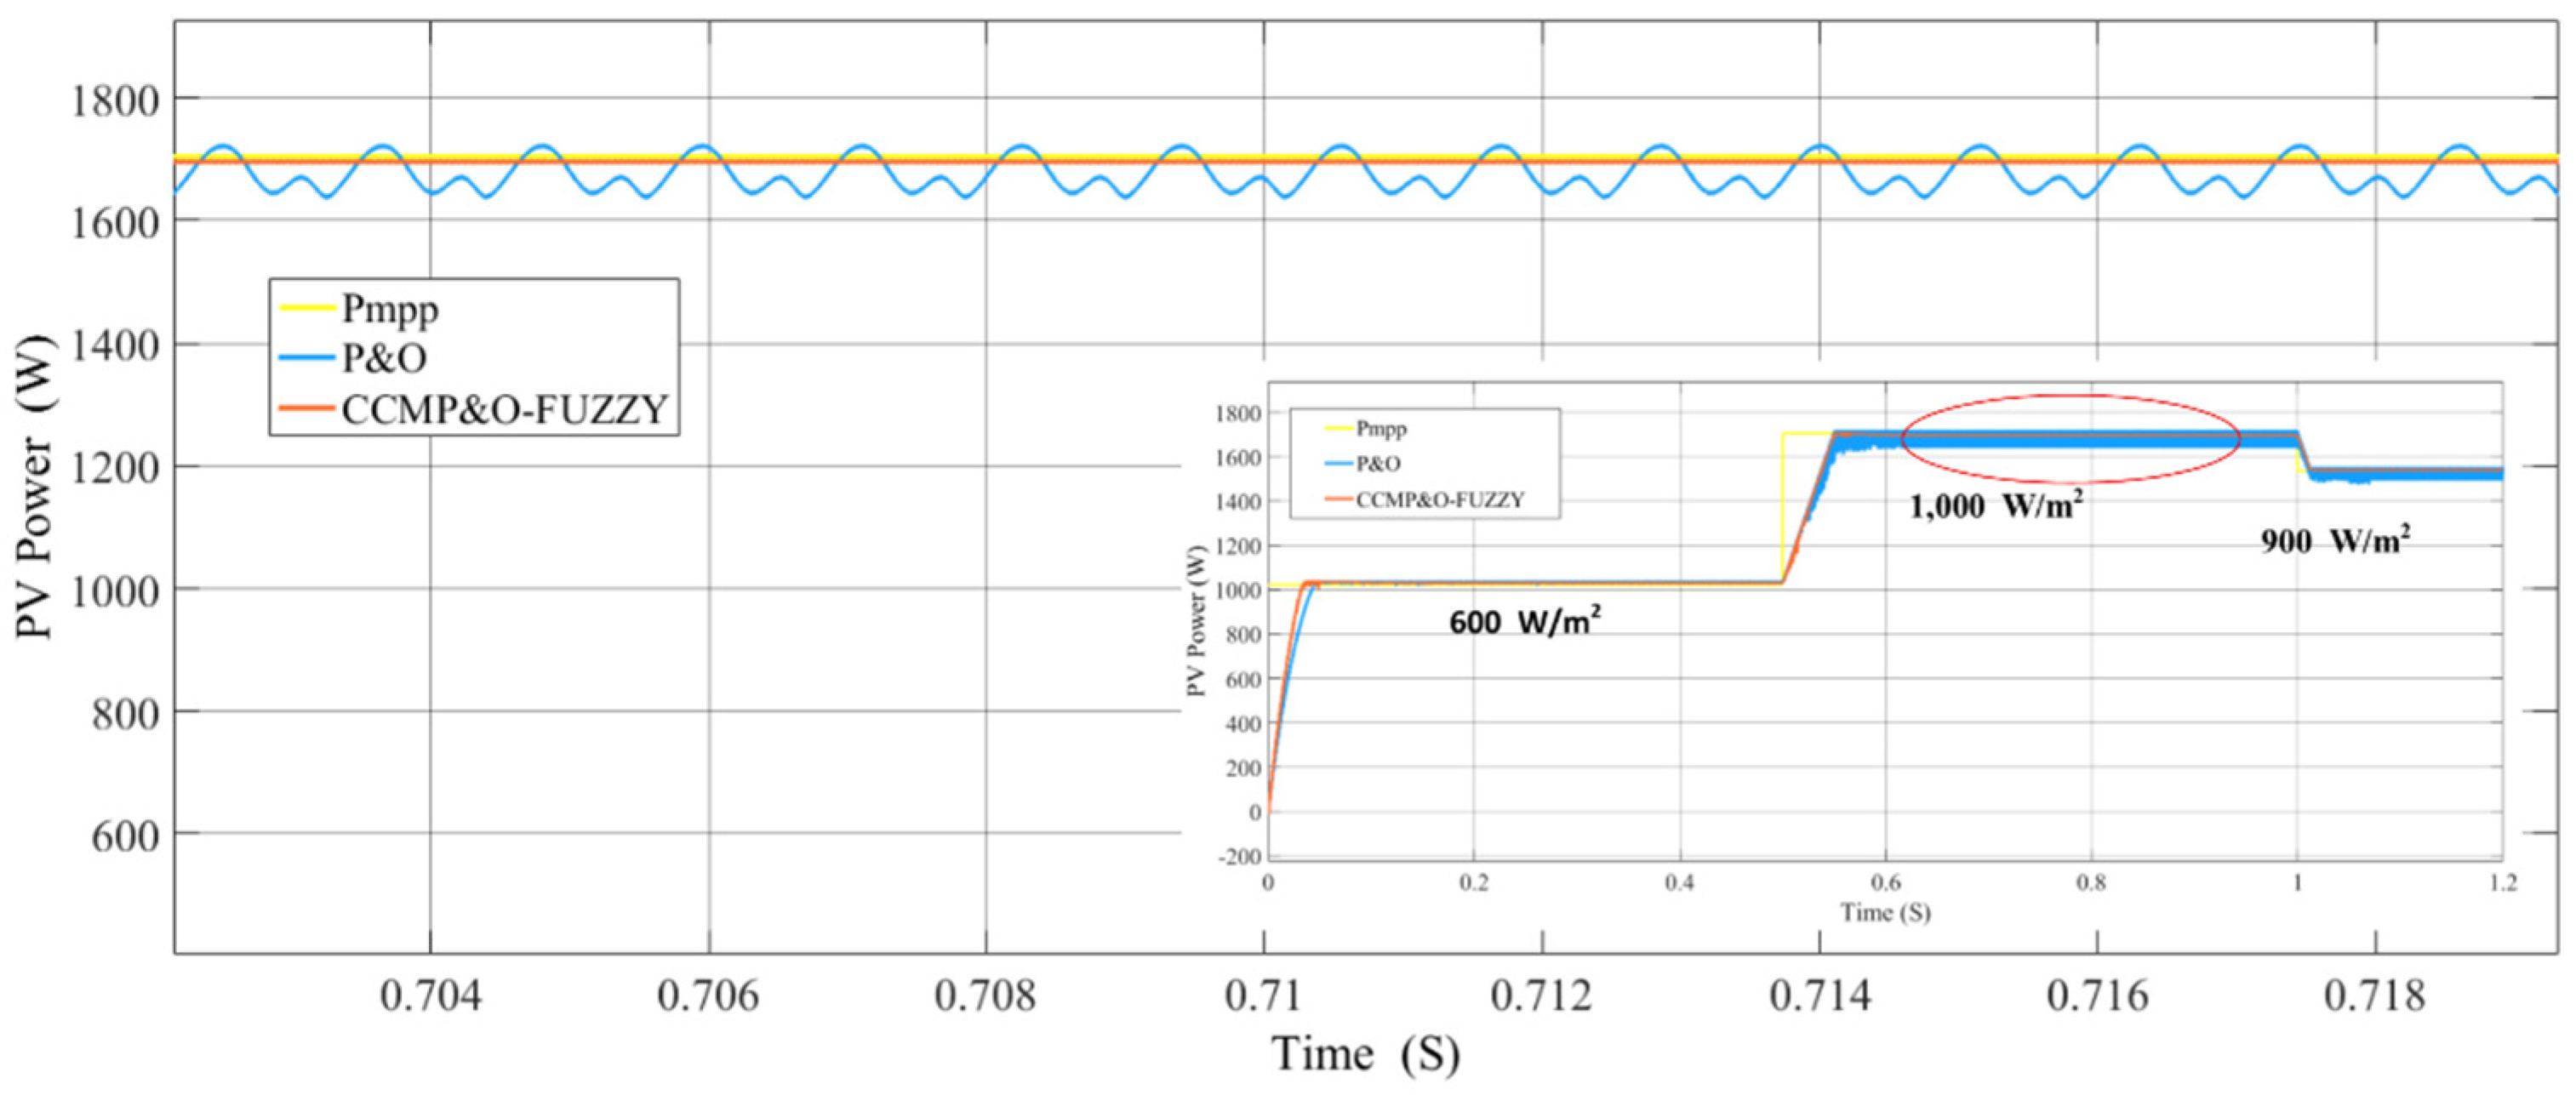
5.3. Comparison of Ripple

Figure 10 shows a noticeable decrease in the electrical power ripple of the proposed system compared to traditional P&O methods.

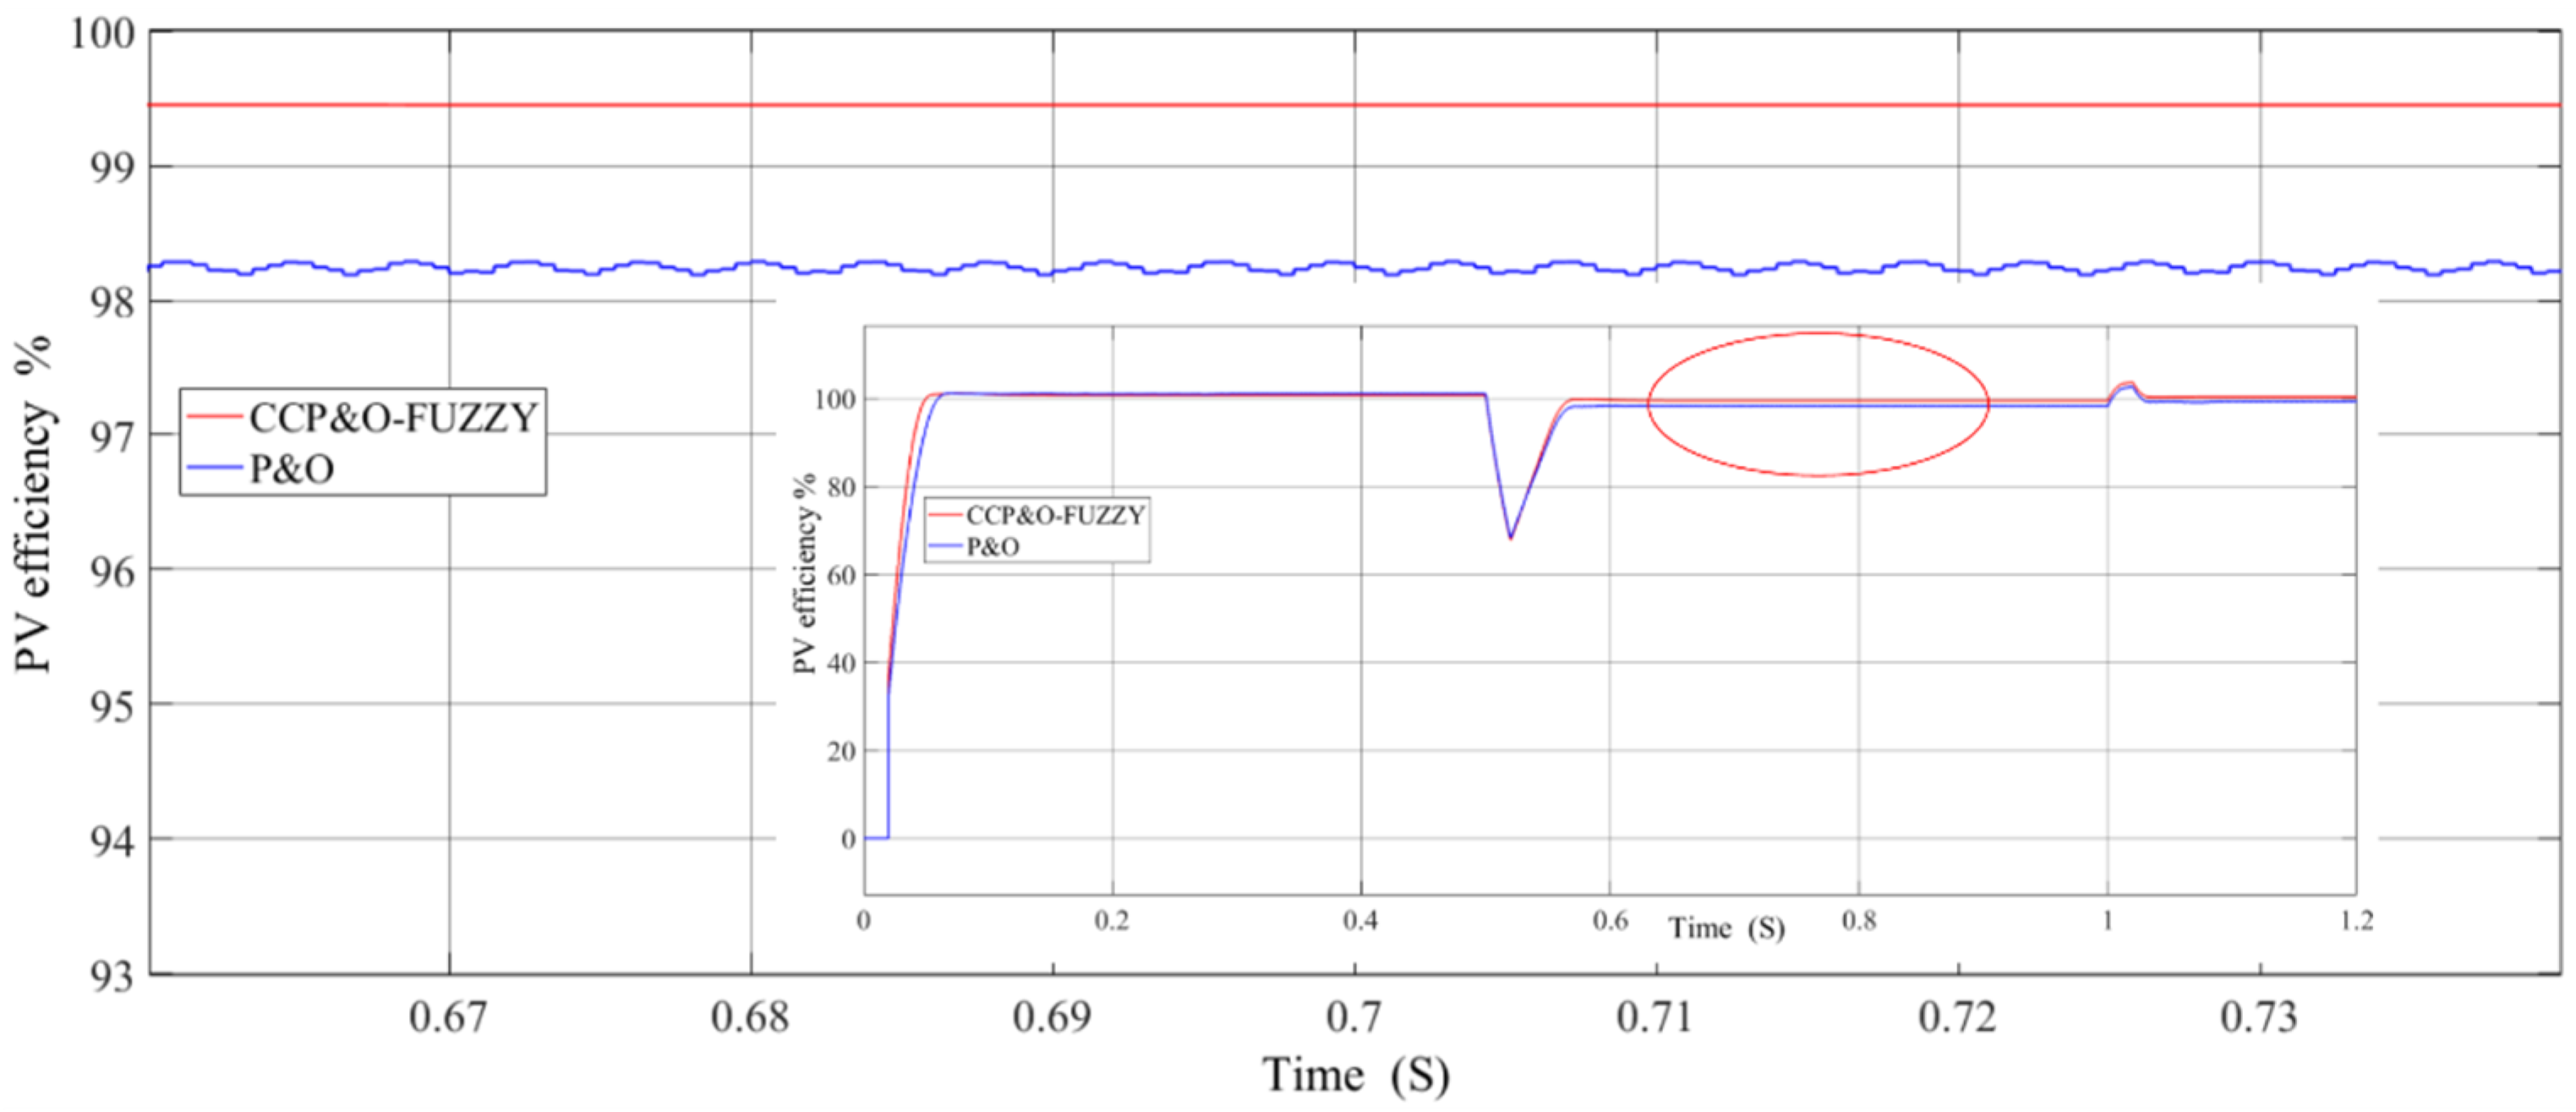
5.4. Comparison of Efficiency

From Figure 11, it can be observed that the efficiency of the PV output of the proposed algorithms is greater than the traditional P&O algorithms. Since there is no oscillation around the maximum power point, the efficiency of the proposed method is higher than that of the traditional method. The power output efficiency of the proposed algorithm is 99.5%.

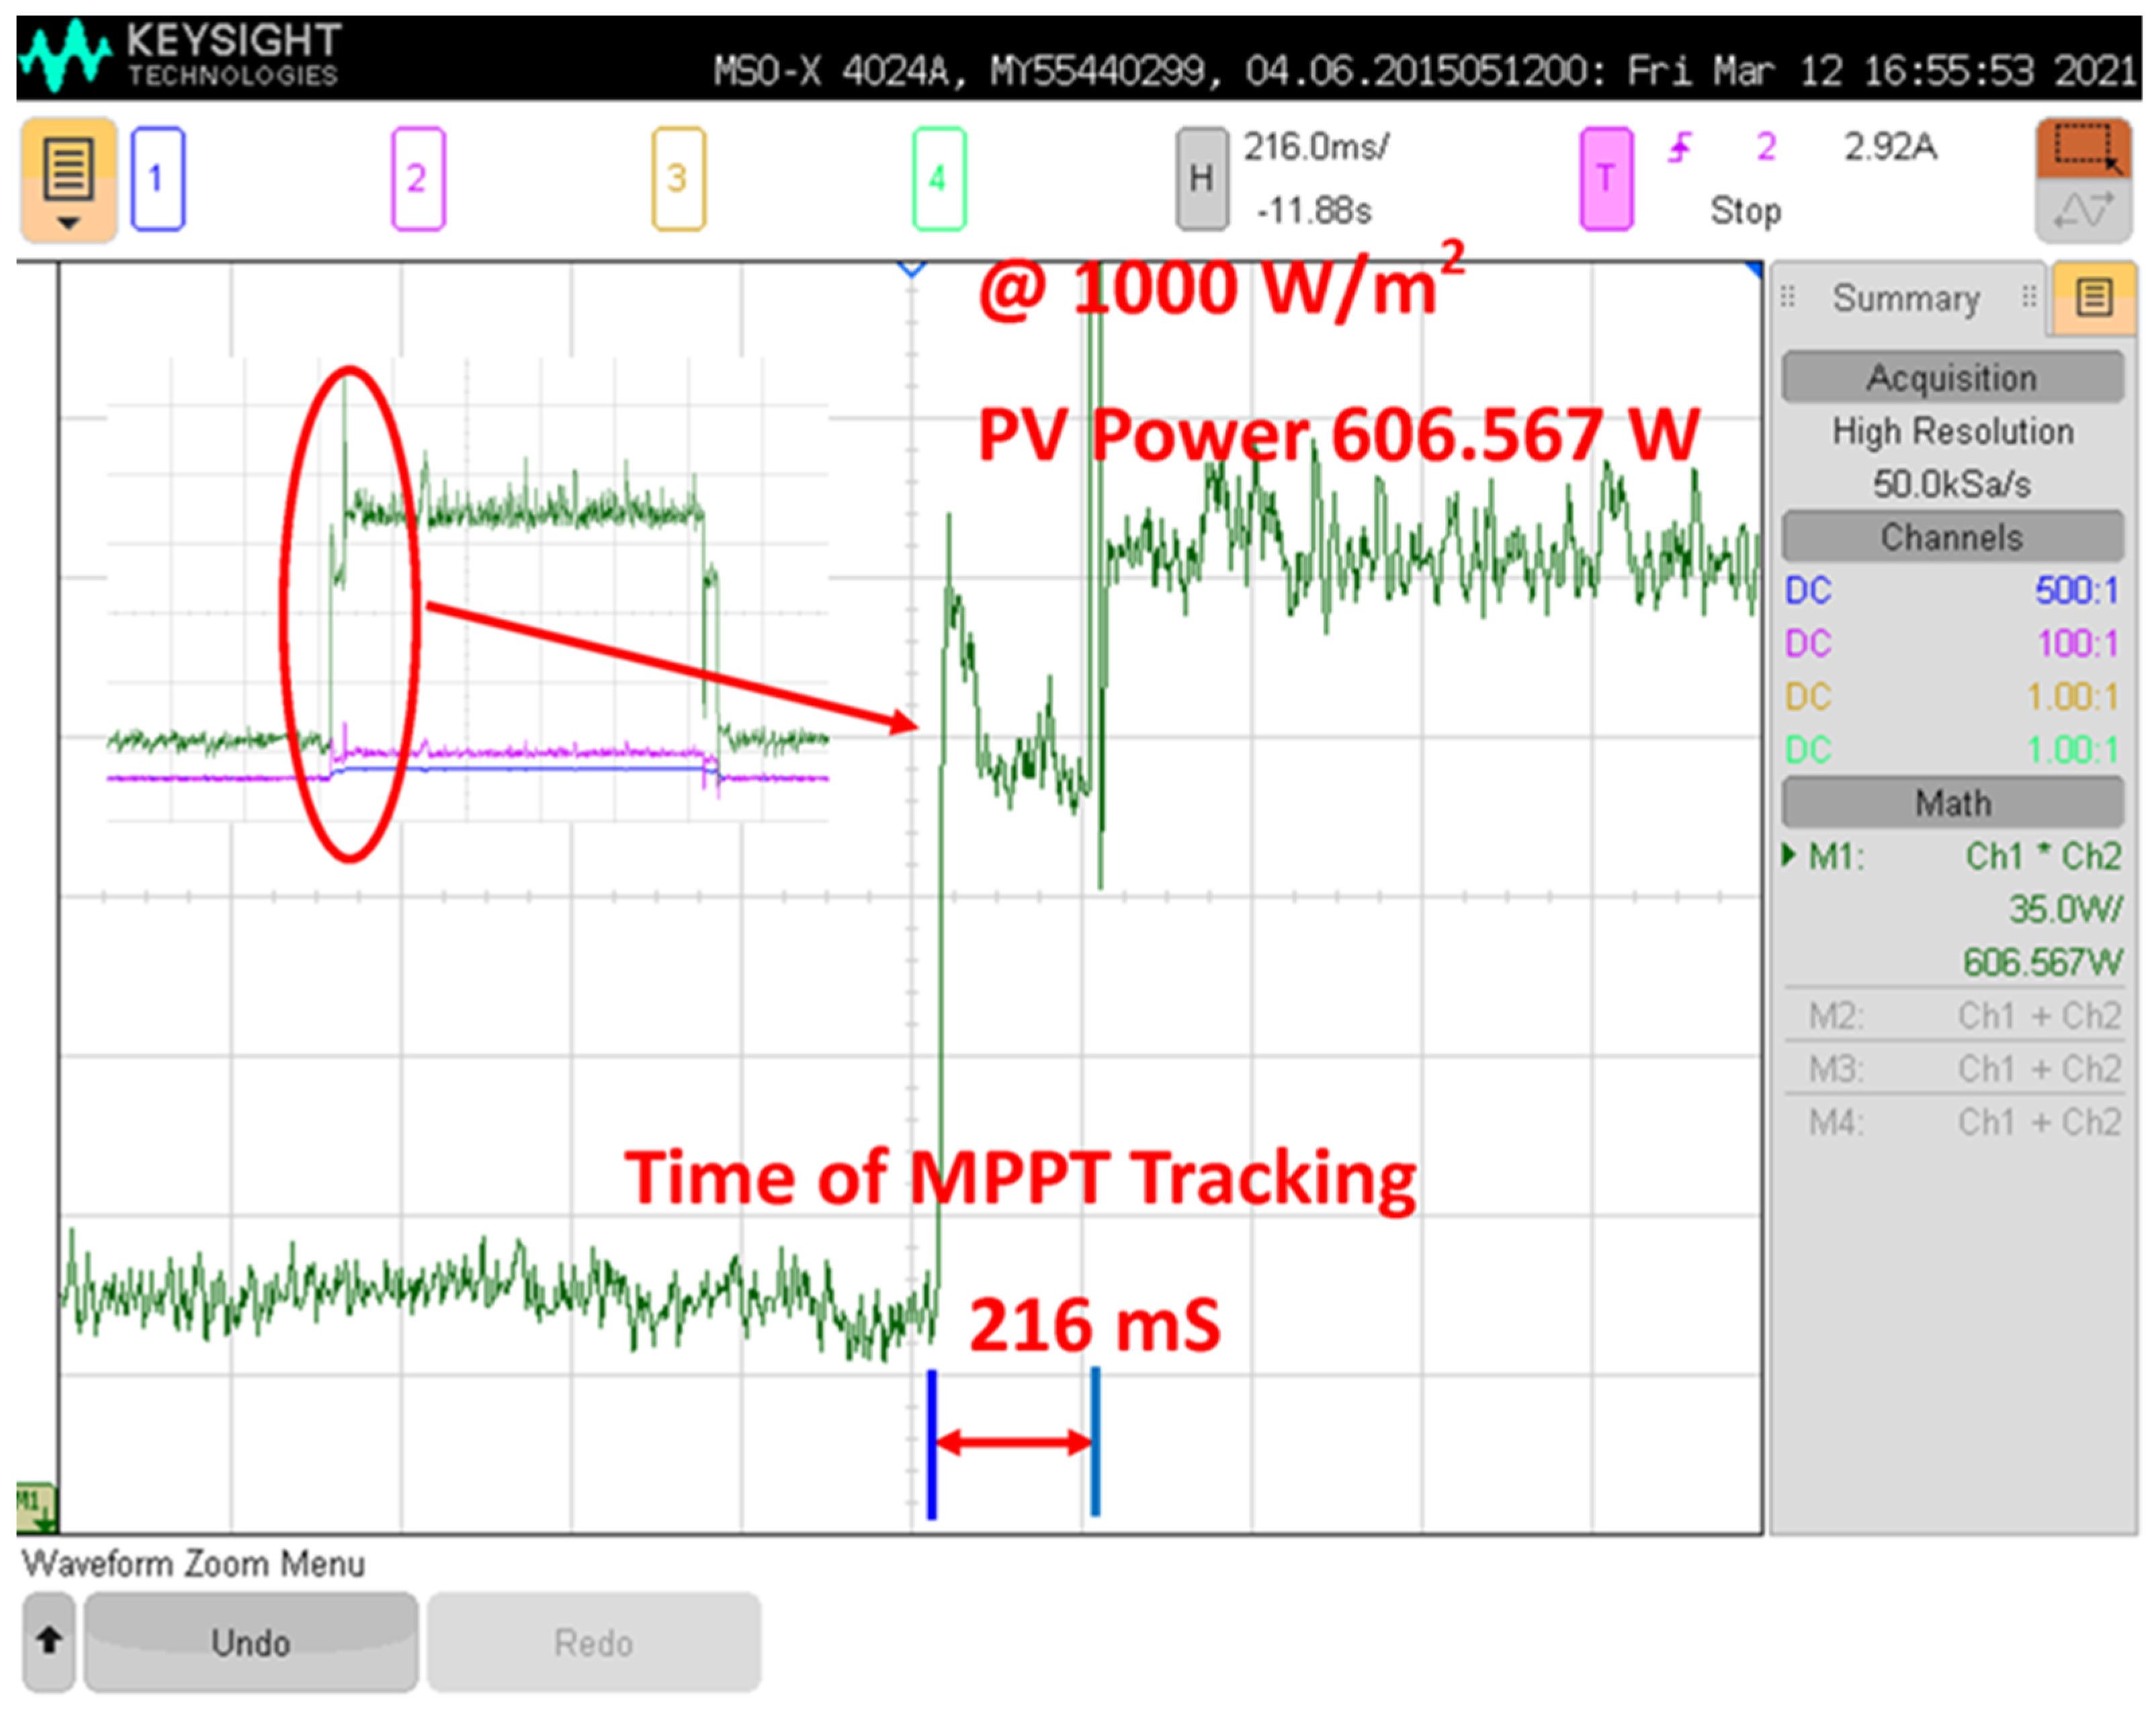
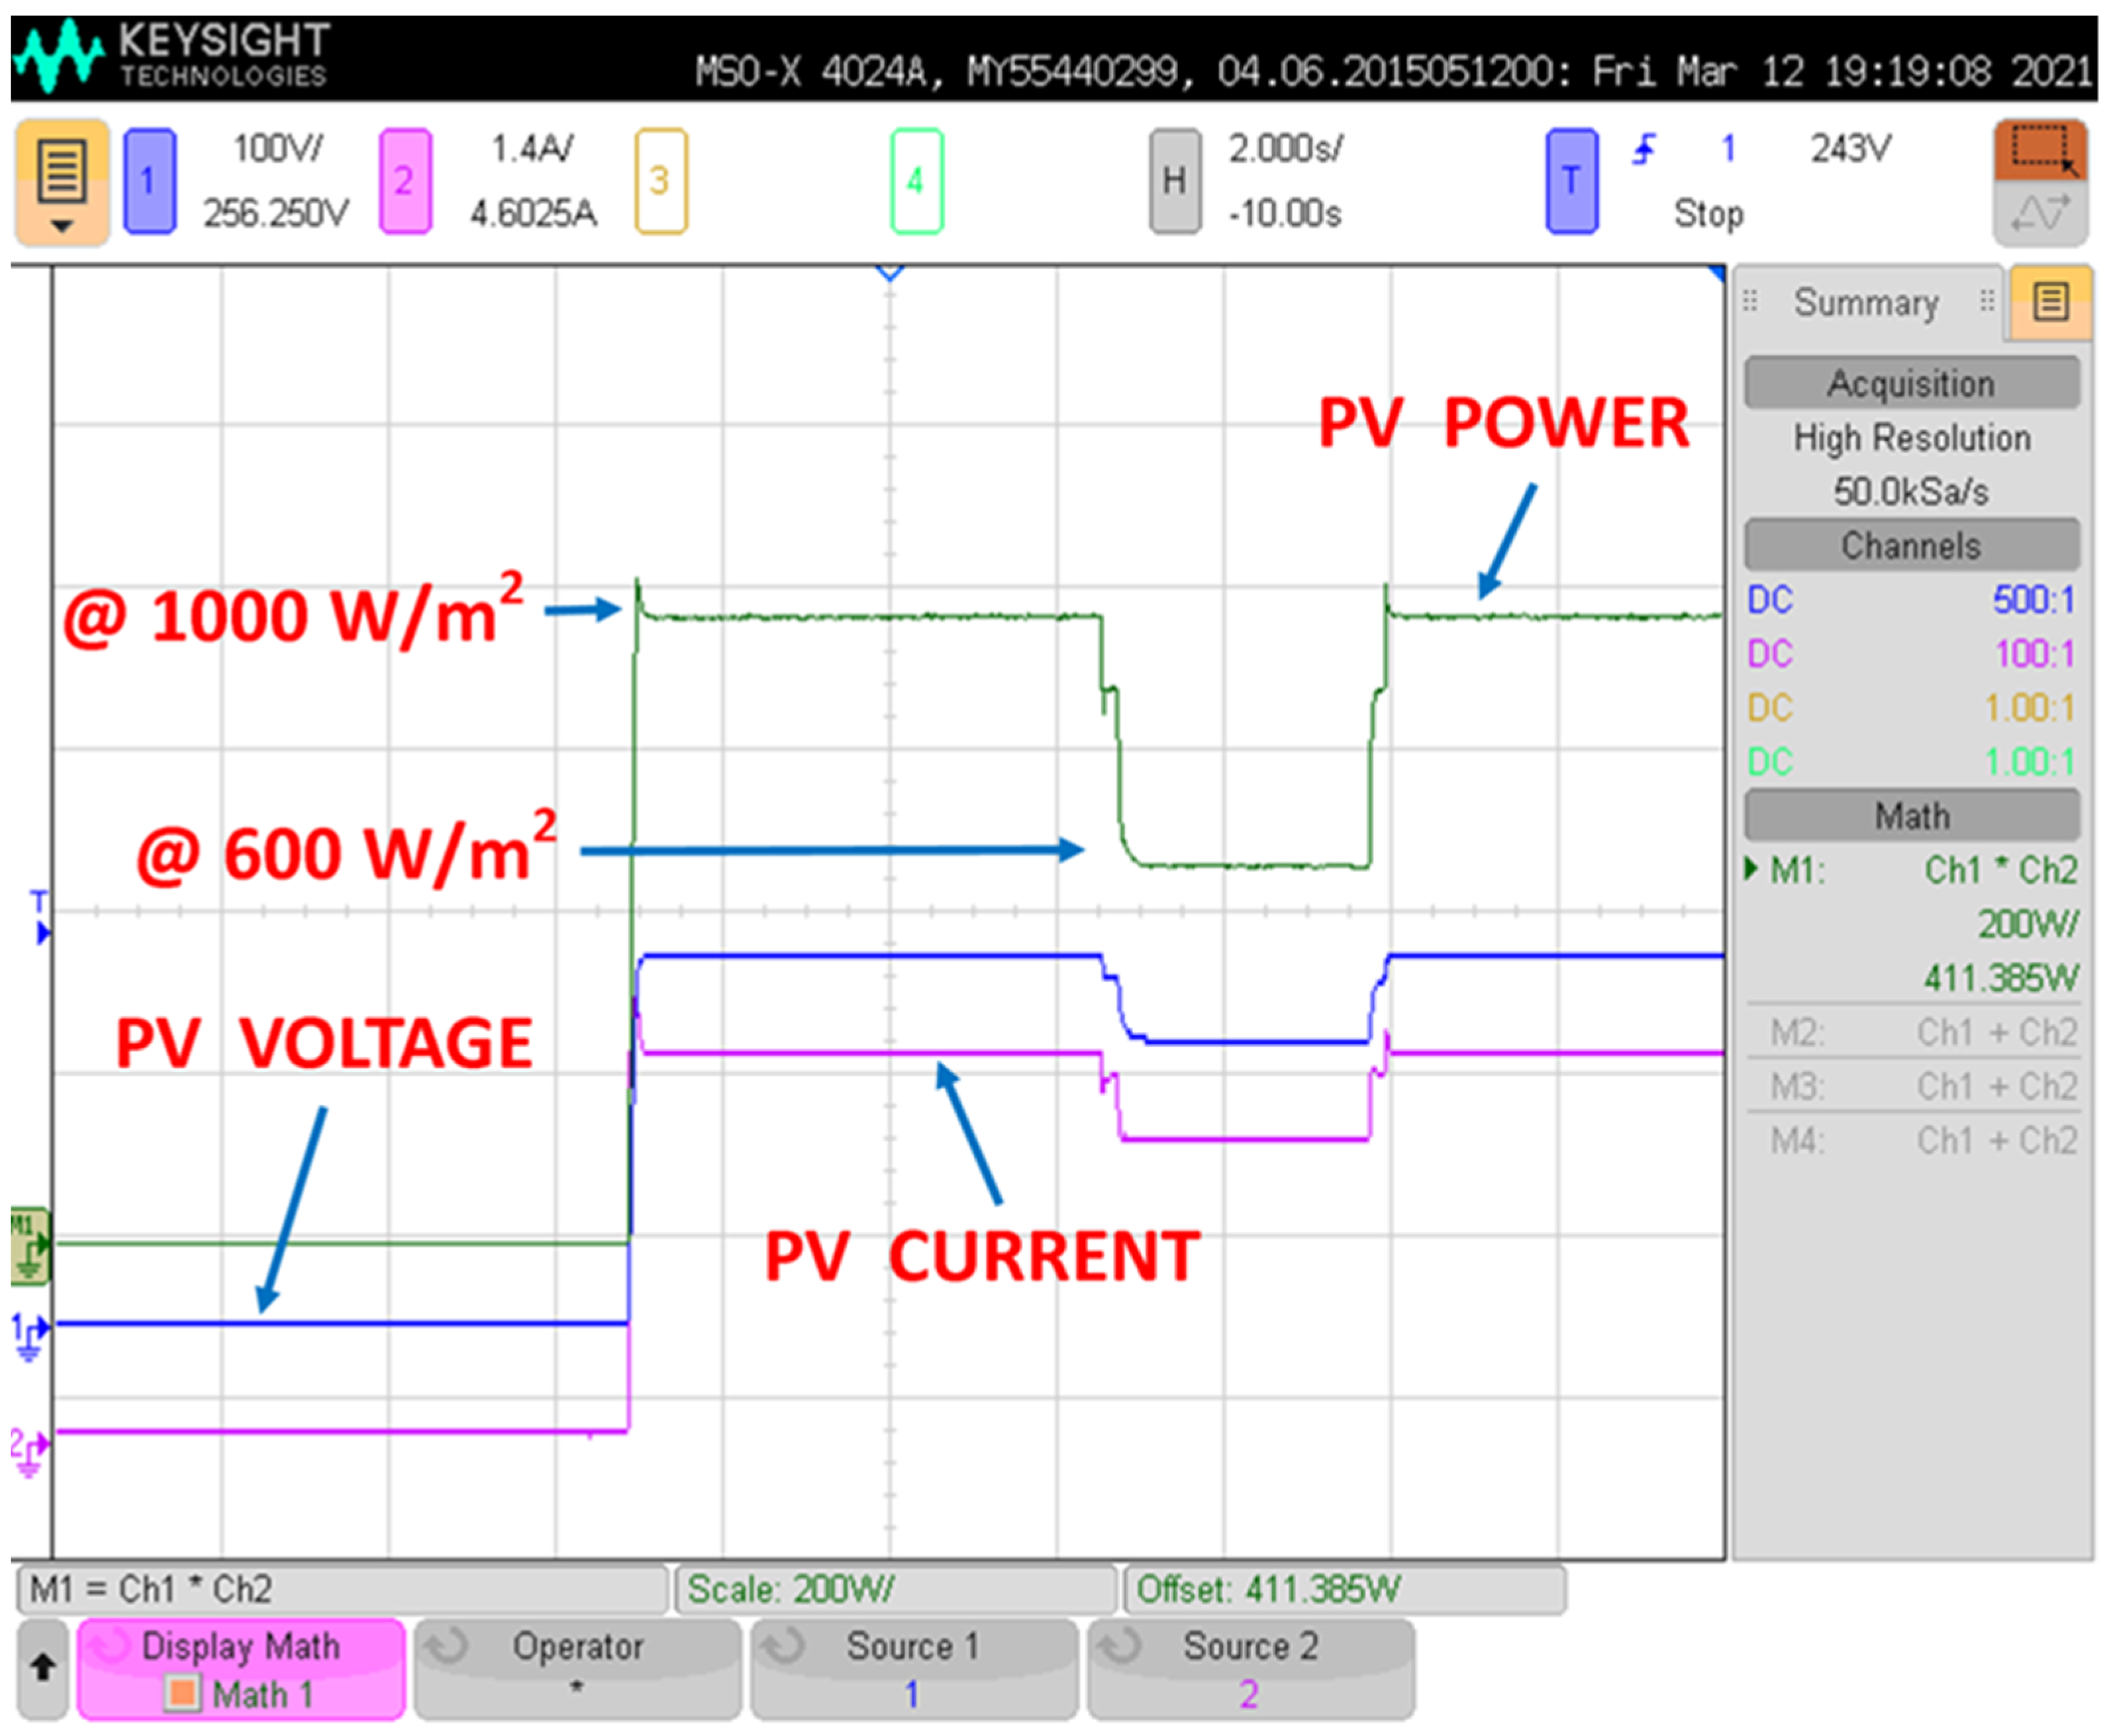
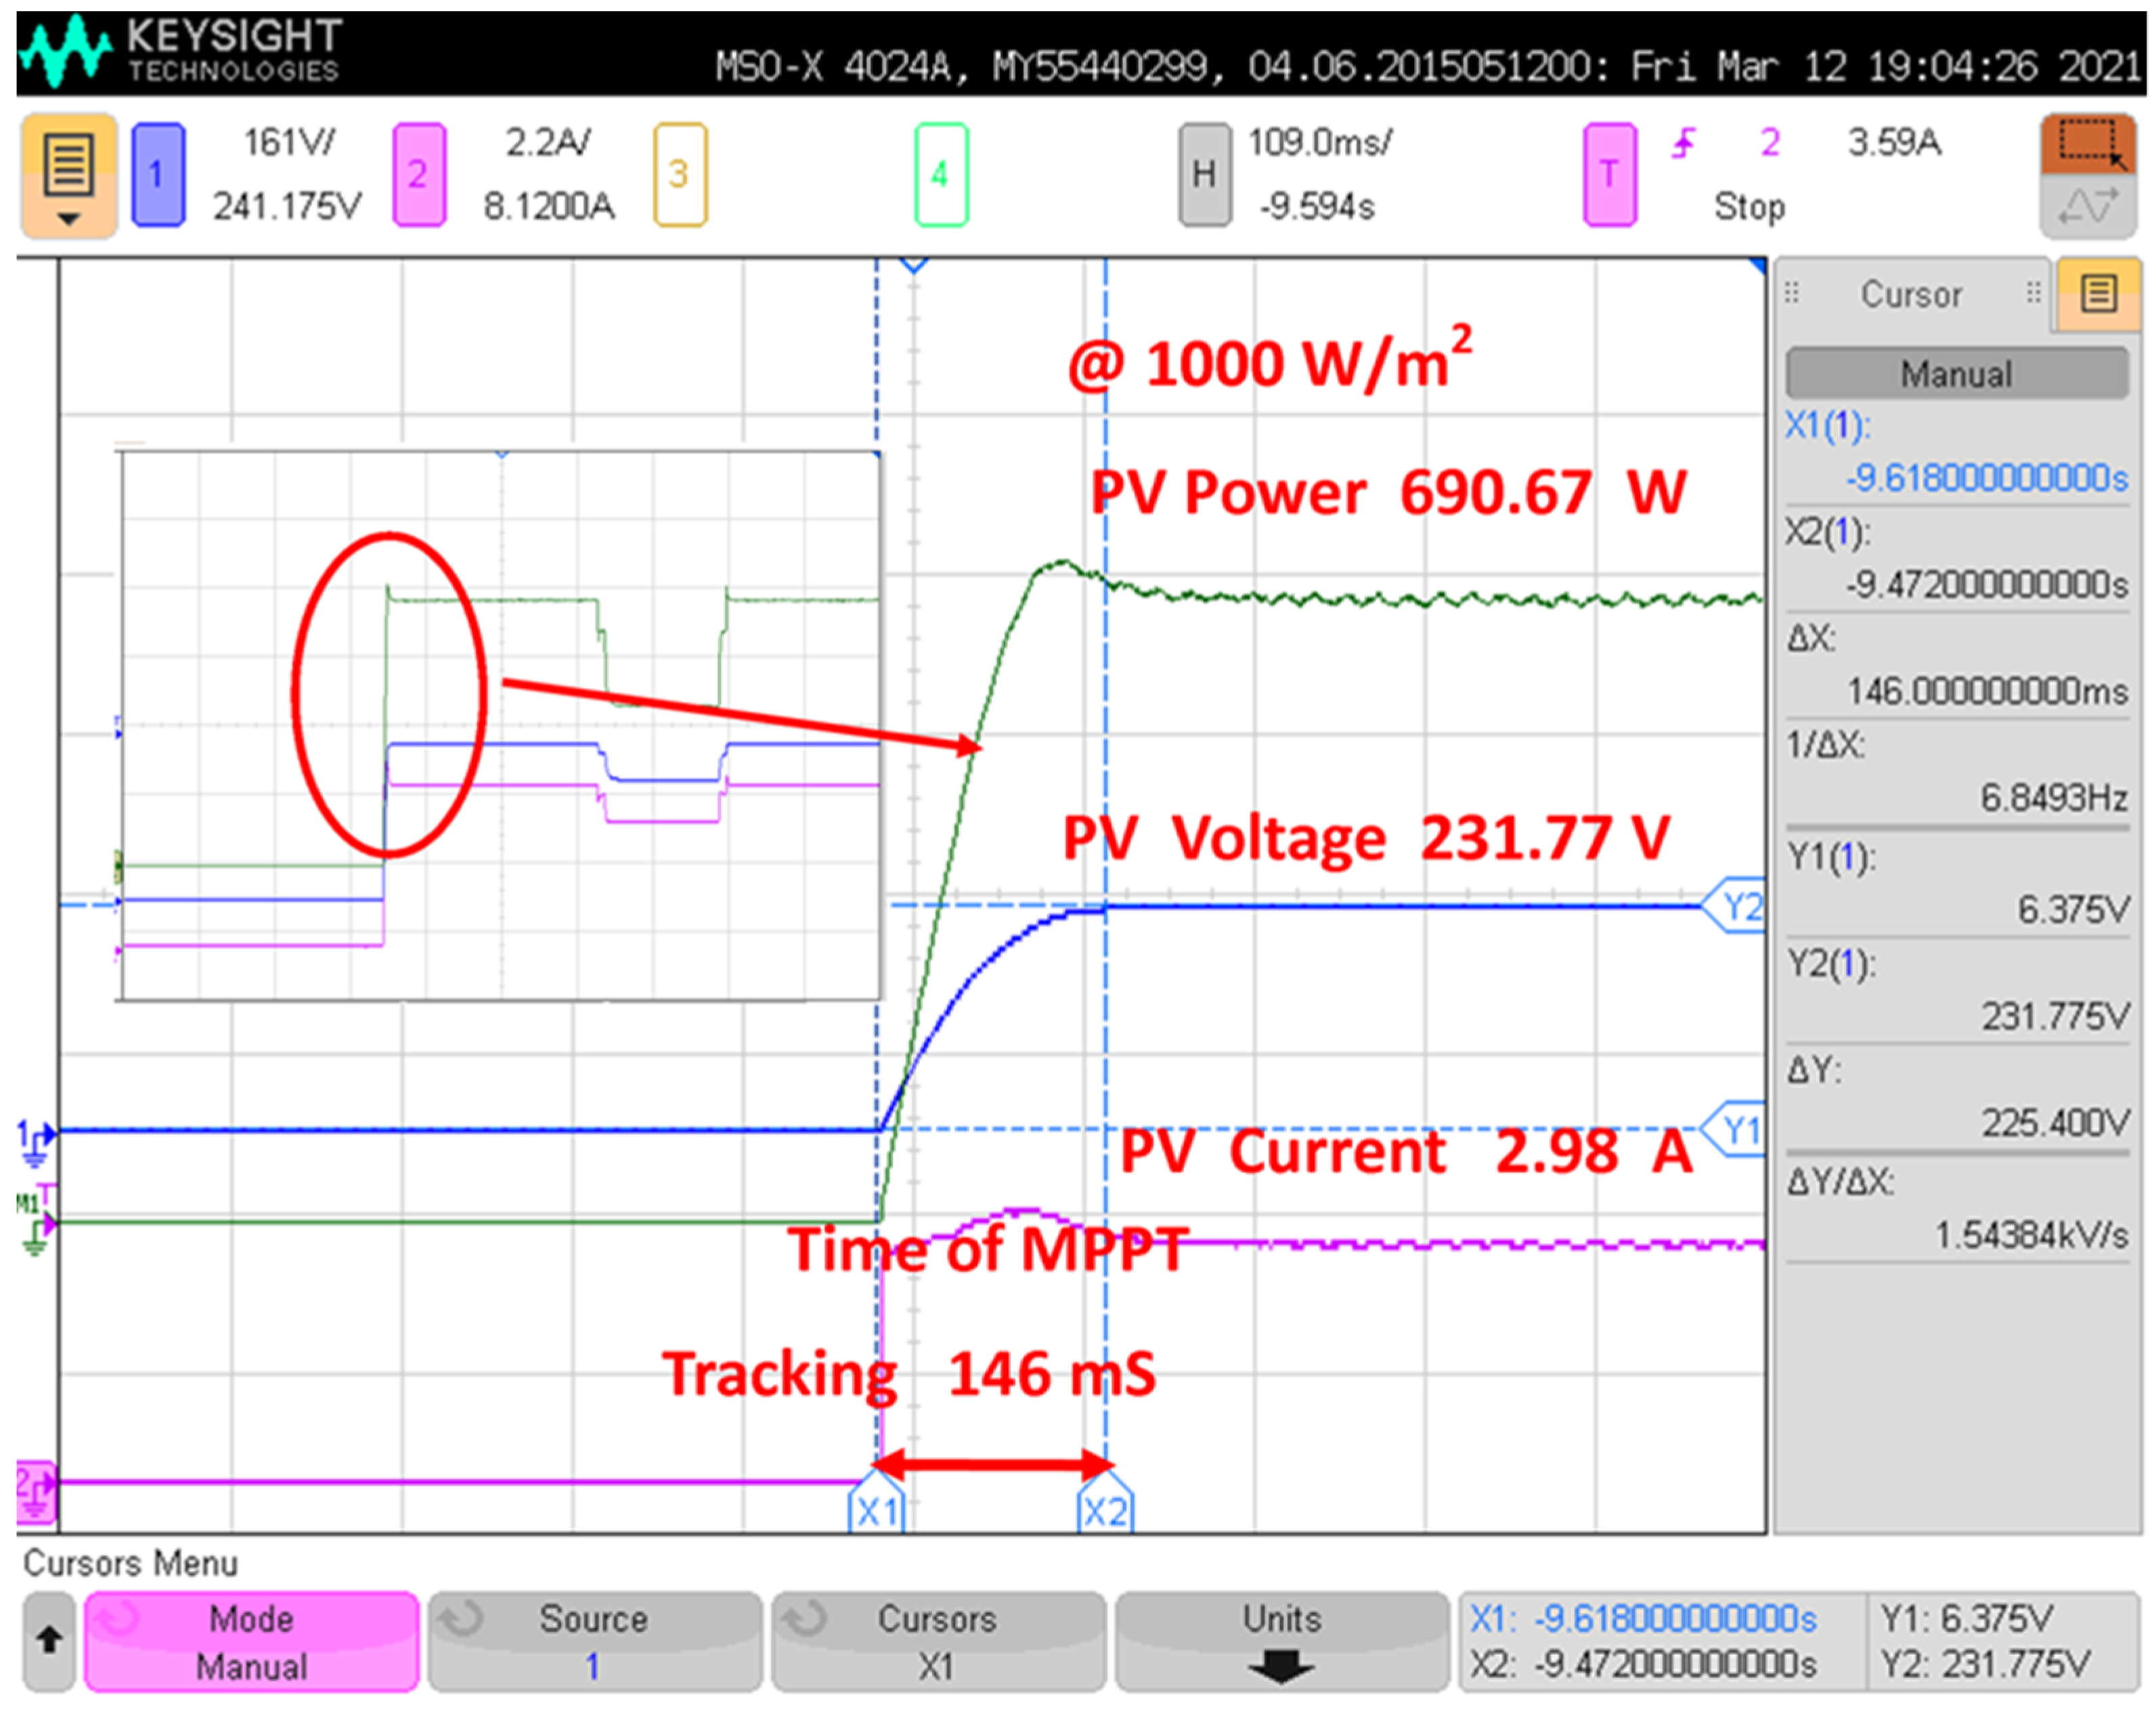
6. PV MPPT System Experiment Results

The experimental methods are performed to evaluate and verify the effectiveness of the CCMP&O−FLC MPPT. The prototype circuit used in the experiment and the experiment diagram of the system is shown in Figure 12 and Figure 13, respectively. The specifications are listed in Table 5 and Table 6, respectively. The STM32F4VGA is used to provide the control signal for the boost converter, resistance as load, emulated PV source SM300−10D PV simulator, and SM300−20 programming power supply have been used as a source instead of a PV. The results of the proposed algorithm were then compared with the results of the traditional P&O algorithm. Figure 14 and Figure 15 show the PV output voltage, PV output current, and PV output power obtained by traditional P&O methods corresponding to 600 and 1000 W/m2. Figure 16 and Figure 17 show the PV array output performance of the CCMP&O−FLC method with irradiation 600 and 1000 W/m2. From the experimental results in Figure 14, Figure 15, Figure 16 and Figure 17, we can see that the two MPPT algorithms mentioned in this article are highly accurate. The energy, voltage, and current values obtained by the proposed methods and traditional P&O methods are consistent with radiation levels and theoretically correct. Comparison of the response time of the proposed algorithm with the traditional algorithm showed that the proposed algorithm is approximately 146 milliseconds, the traditional P&O method is around 216 milliseconds, indicating that the proposed method tracks maximum power faster than the traditional one. Figure 15 and Figure 17 show the PV output power of the traditional algorithm and the proposed algorithm at 1000 W/m2. The PV output power of the traditional algorithm and the proposed algorithm are 606.567 W/m2 and 690.67 W/m2, respectively. Since there is a little bit of oscillation around the maximum power point, the efficiency of the proposed method is higher than that of the traditional method. The experimental results of the proposed method are very accurate compared to the traditional method because it has a faster convergence speed and less response time. There is no static vibration around the MPP, which is suitable for real-world conditions.

7. Conclusions

In this paper, the CCMP&O−FLC is laid out, the proposed schemes are discussed in detail, and simplified design rules are proposed. Comparative studies have been shown between the proposed method and traditional method under the same operating and environmental conditions. The simulation and experimentation results show a significant contribution to steady-state performance and dynamic response. The response time of the maximum power point tracking cannot be reduced by a traditional method. The CCMP&O−FLC is confirmed, in which the energy loss of the converter is reduced. Additionally, the improvements of the traditional MPPT to approach ripple and overload are undeniable. The experimental results of the proposed MPPT algorithm showed high accuracy, rapid convergence, a little bit of oscillation around MPP, less noise, and no difference from MPP points. The proposed algorithm achieves symmetry between the MPP and the output of the PV array resulting in less power loss and increased system efficiency. Compared to the other methods, as shown in Table 1, the MPP tracking of the proposed method is good as others. In comparison, in terms of complexity, the proposed method is much less complicated. Compared to modern methods such as neuro-fuzzy, it is clear that the proposed method is applicable to conventional microcontrollers, unlike most modern methods that are not compatible with conventional microcontrollers. Hence the CCMP&O−FLC presented as the result of the proposed method is very effective.

Author Contributions

A.A.: conceptualization, methodology, software, writing original draft preparation, formal analysis; A.A.: investigation, validation, writing review; B.P.: conceptualization, editing, visualization, supervision. All authors have read and agreed to the published version of the manuscript.

Funding

This research received no external funding.

Institutional Review Board Statement

Not applicable.

Informed Consent Statement

Not applicable.

Data Availability Statement

Not applicable.

Acknowledgments

The authors would like to thank the Department of Electrical Engineering, Faculty of Engineering, Rajamangala University of Technology, Thanyaburi, for its strong support of the laboratory instruments.

Conflicts of Interest

The authors declare no conflict of interest.

References

  1. Özbay, H. PDM-MPPT based solar powered induction heating system. Eng. Sci. Technol. Int. J. 2020, 23, 1397–1414. [Google Scholar] [CrossRef]
  2. Ebrahim, M.A.; Osama, A.; Kotb, K.M.; Bendary, F. Whale inspired algorithm based MPPT controllers for grid-connected solar photovoltaic system. Energy Procedia 2019, 162, 77–86. [Google Scholar] [CrossRef]
  3. Bielskis, E.; Baskys, A.; Valiulis, G. Controller for the Grid-Connected Microinverter Output Current Tracking. Symmetry 2020, 12, 112. [Google Scholar] [CrossRef] [Green Version]
  4. Prabpal, P.; Kongjeen, Y.; Bhumkittipich, K. Optimal Battery Energy Storage System Based on VAR Control Strategies Using Particle Swarm Optimization for Power Distribution System. Symmetry 2021, 13, 1692. [Google Scholar] [CrossRef]
  5. Mao, M.; Cui, L.; Zhang, Q.; Guo, K.; Zhou, L.; Huang, H. Classification and summarization of solar photovoltaic MPPT techniques: A review based on traditional and intelligent control strategies. Energy Rep. 2020, 6, 1312–1327. [Google Scholar] [CrossRef]
  6. Yap, K.Y.; Sarimuthu, C.R.; Lim, J.M.Y. Artificial Intelligence Based MPPT Techniques for Solar Power System: A review. J. Mod. Power Syst. Clean Energy 2020, 8, 1043–1059. [Google Scholar]
  7. Benhadouga, S.; Meddad, M.; Eddiai, A.; Boukhetala, D.; Khenfer, R. Sliding Mode Control for MPPT of a Thermogenerator. J. Electron. Mater. 2019, 48, 2103–2111. [Google Scholar] [CrossRef]
  8. Abdullah, M.A.; Al-Hadhrami, T.; Tan, C.W.; Yatim, A.H. Towards Green Energy for Smart Cities: Particle Swarm Optimization Based MPPT Approach. IEEE Access 2018, 6, 58427–58438. [Google Scholar] [CrossRef]
  9. Ahmed, J.; Salam, Z. An Enhanced Adaptive P&O MPPT for Fast and Efficient Tracking under Varying Environmental Conditions. IEEE Trans. Sustain. Energy 2018, 9, 1487–1496. [Google Scholar]
  10. Zhou, C.G.; Huang, L.; Ling, Z.X.; Cui, Y.B. Research on MPPT control strategy of photovoltaic cells under multi-peak. Energy Rep. 2021, 7, 283–292. [Google Scholar] [CrossRef]
  11. Jately, V.; Azzopardi, B.; Joshi, J.; Venkateswaran, V.B.; Sharma, A.; Arora, S. Experimental Analysis of hill-climbing MPPT algorithms under low irradiance levels. Renew. Sustain. Energy Rev. 2021, 150, 111467. [Google Scholar] [CrossRef]
  12. Javed, K.; Ashfaq, H.; Singh, R. An improved MPPT algorithm to minimize transient and steady state oscillation conditions for small SPV systems. Int. J. Renew. Energy Dev. 2018, 7, 191–197. [Google Scholar] [CrossRef] [Green Version]
  13. Li, X.; Wen, H.; Hu, Y.; Jiang, L. A novel beta parameter based fuzzy-logic controller for photovoltaic MPPT application. Renew. Energy 2018, 130, 416–427. [Google Scholar] [CrossRef]
  14. Verma, P.; Garg, R.; Mahajan, P. Asymmetrical interval type-2 fuzzy logic control based MPPT tuning for PV system under partial shading condition. ISA Trans. 2020, 100, 251–263. [Google Scholar] [CrossRef] [PubMed]
  15. Chihaia, R.A.; Vasile, I.; Cîrciumaru, G.; Nicolaie, S.; Tudor, E.; Dumitru, C. Improving the Energy Conversion Efficiency for Hydrokinetic Turbines Using MPPT Controller. Appl. Sci. 2020, 10, 7560. [Google Scholar] [CrossRef]
  16. Li, S. A variable-weather-parameter MPPT control strategy based on MPPT constraint conditions of PV system with inverter. Energy Convers. Manag. 2019, 197, 111873. [Google Scholar] [CrossRef]
  17. Zhao, Z.; Cheng, R.; Yan, B.; Zhang, J.; Zhang, Z.; Zhang, M.; Lai, L.L. A dynamic particles MPPT method for photovoltaic systems under partial shading conditions. Energy Convers. Manag. 2020, 220, 113070. [Google Scholar] [CrossRef]
  18. De Brito, M.A.G.; Alves, M.G.; Canesin, C.A. Hybrid MPPT Solution for Double-Stage Photovoltaic Inverter. J. Control Autom. Electr. Syst. 2019, 30, 253–265. [Google Scholar] [CrossRef]
  19. Ge, X.; Ahmed, F.W.; Rezvani, A.; Aljojo, N.; Samad, S.; Foong, L.K. Implementation of a novel hybrid BAT-Fuzzy controller based MPPT for grid-connected PV-battery system. Control Eng. Pract. 2020, 98, 104380. [Google Scholar] [CrossRef]
  20. Jiang, M.; Ghahremani, M.; Dadfar, S.; Chi, H.; Abdallah, Y.N.; Furukawa, N. A novel combinatorial hybrid SFL–PS algorithm based neural network with perturb and observe for the MPPT controller of a hybrid PV-storage system. Control Eng. Pract. 2021, 114, 104880. [Google Scholar] [CrossRef]
  21. Bhattacharyya, S.; Kumar, P.D.S.; Samanta, S.; Mishra, S. Steady Output and Fast Tracking MPPT (SOFT-MPPT) for P&O and InC Algorithms. IEEE Trans. Sustain. Energy 2021, 12, 293–302. [Google Scholar]
  22. Macaulay, J.; Zhou, Z. A Fuzzy Logical-Based Variable Step Size P&O MPPT Algorithm for Photovoltaic System. Energy 2018, 11, 1340. [Google Scholar]
  23. Ali, K.; Khan, L.; Khan, Q.; Ullah, S.; Ali, N. Neurofuzzy robust backstepping based MPPT control for photovoltaic system. Turk. J. Electr. Eng. Comput. Sci. 2021, 29, 421–436. [Google Scholar] [CrossRef]
  24. Rezk, H.; Aly, M.; Al-Dhaifallah, M.; Shoyama, M. Design and Hardware Implementation of New Adaptive Fuzzy Logic-Based MPPT Control Method for Photovoltaic Applications. IEEE Access 2019, 7, 106427–106438. [Google Scholar] [CrossRef]
  25. Priyadarshi, N.; Padmanaban, S.; Holm-Nielsen, J.B.; Blaabjerg, F.; Bhaskar, M.S. An Experimental Estimation of Hybrid ANFIS–PSO-Based MPPT for PV Grid Integration under Fluctuating Sun Irradiance. IEEE Syst. J. 2020, 14, 1218–1229. [Google Scholar] [CrossRef]
  26. Zhang, L.; Wang, Z.; Cao, P.; Zhang, S. A Maximum Power Point Tracking Algorithm of Load Current Maximization-Perturbation and Observation Method with Variable Step Size. Symmetry 2020, 12, 244. [Google Scholar] [CrossRef] [Green Version]
Figure 1. Control of PV power.
Symmetry 14 00044 g001
Figure 2. Equivalent circuit of photovoltaic cells.
Symmetry 14 00044 g002
Figure 3. Diagram of perturbation and observation MPPT method.
Symmetry 14 00044 g003
Figure 5. Input and output membership function of fuzzy logic; (a) Iref, (b) dIref, (c) Duty.
Symmetry 14 00044 g005aSymmetry 14 00044 g005b
Figure 6. A comparison of the PV array output power between proposed and P&O MPPT methods.
Symmetry 14 00044 g006
Figure 7. A comparison of the PV array output power response time between proposed and P&O MPPT methods.
Symmetry 14 00044 g007
Figure 8. A comparison of the PV array output power due to sudden increase in irradiation between proposed and P&O MPPT methods.
Symmetry 14 00044 g008
Figure 9. A comparison of the PV array output power due to sudden decrease in irradiation between proposed and P&O MPPT methods.
Symmetry 14 00044 g009
Figure 10. A comparison of the PV array output power ripple between proposed and P&O MPPT methods.
Symmetry 14 00044 g010
Figure 11. A comparison of the PV array output power efficiency between proposed and P&O MPPT methods.
Symmetry 14 00044 g011
Figure 12. Prototype laboratory experiments of the MPPT system.
Symmetry 14 00044 g012
Figure 13. Experiment diagram.
Symmetry 14 00044 g013
Figure 14. The PV output voltage, current, and power of experiments with traditional P&O methods.
Symmetry 14 00044 g014
Figure 15. The experiments of the PV MPPT tracking with traditional P&O methods.
Symmetry 14 00044 g015
Figure 16. The PV output voltage, current, and power of experiments with proposed P&O methods.
Symmetry 14 00044 g016
Figure 17. The experiments result of the PV MPPT tracking with proposed P&O methods.
Symmetry 14 00044 g017
Table 1. Comparison of the maximum power point tracking based on P&O and FL algorithms.
MPPT MethodConverterEquipmentOutcomesRef
EA-P&Obuck-boostMATLAB/Simulink
DS1104 DSP
Good tracking under partial shading High efficiency[9]
SOFT-MPPTboostArduino mega 2560 microcontrollerFast-tracking under changing irradiance[21]
MP&O-FLCboostMATLAB/Simulink
dSPACE
Fast response under changing irradiance
Low steady-state oscillation around MPPT
[22]
Neuro-Fuzzybuck-boostMATLAB/SimulinkHigh performance under changing irradiance[23]
AFL-MPPTboostTMS320F28335 microcontrollerHigh tracking efficiency
Fast dynamics
[24]
Table 2. Fuzzy logic control rule.
dErrNZP
Err
NZZZ
ZZZS
PSML
Where Z, S, M, and L are zero, small, medium, and large size of duty cycle, respectively. N, Z, and P are negative, zero, and positive, respectively.
Table 3. PV module specifications.
Emulated PV Source SpecificationsValue
Voltage at MPP (Vmpp)29 V
Current at MPP (Impp)7.35 A
Short circuit current (Isc)7.84 A
Open circuit voltage (Vsc)36.3 V
Maximum power at standard temperature condition213.15 W
Parallel strings1
Series-connected modules per string8
Table 4. DC/DC Boost converter parameter of the simulation system.
Converter ParameterValue
Switching frequency (fsw)20 kHz
Input filter capacitor (Cin)100 μF
Output filter capacitor (Co)280 μF
Input filter inductor (Lin)420 mH
Table 5. PV source specifications.
Emulated PV Source SpecificationsValue
Voltage at MPP (Vmpp)230 V
Current at MPP (Impp)3 A
Short circuit current (Isc)4 A
Open circuit voltage (Vsc)245 V
Temperature coefficient (Tk)−1000 °C
Table 6. DC/DC Boost converter parameter of experiment system.
DC/DC Boost Converter ParameterValue
Switching frequency (fw)20 kHz
Input filter capacitor (Cin)100 μF
Output filter capacitor (Co)280 μF
Input filter inductor (Lin)420 mH
Publisher’s Note: MDPI stays neutral with regard to jurisdictional claims in published maps and institutional affiliations.

