
Experimental and Numerical Peeling Investigation on Aged Multi-Layer Anti-Shatter Safety Films (ASFs) for Structural Glass Retrofit


Abstract
:1. Introduction
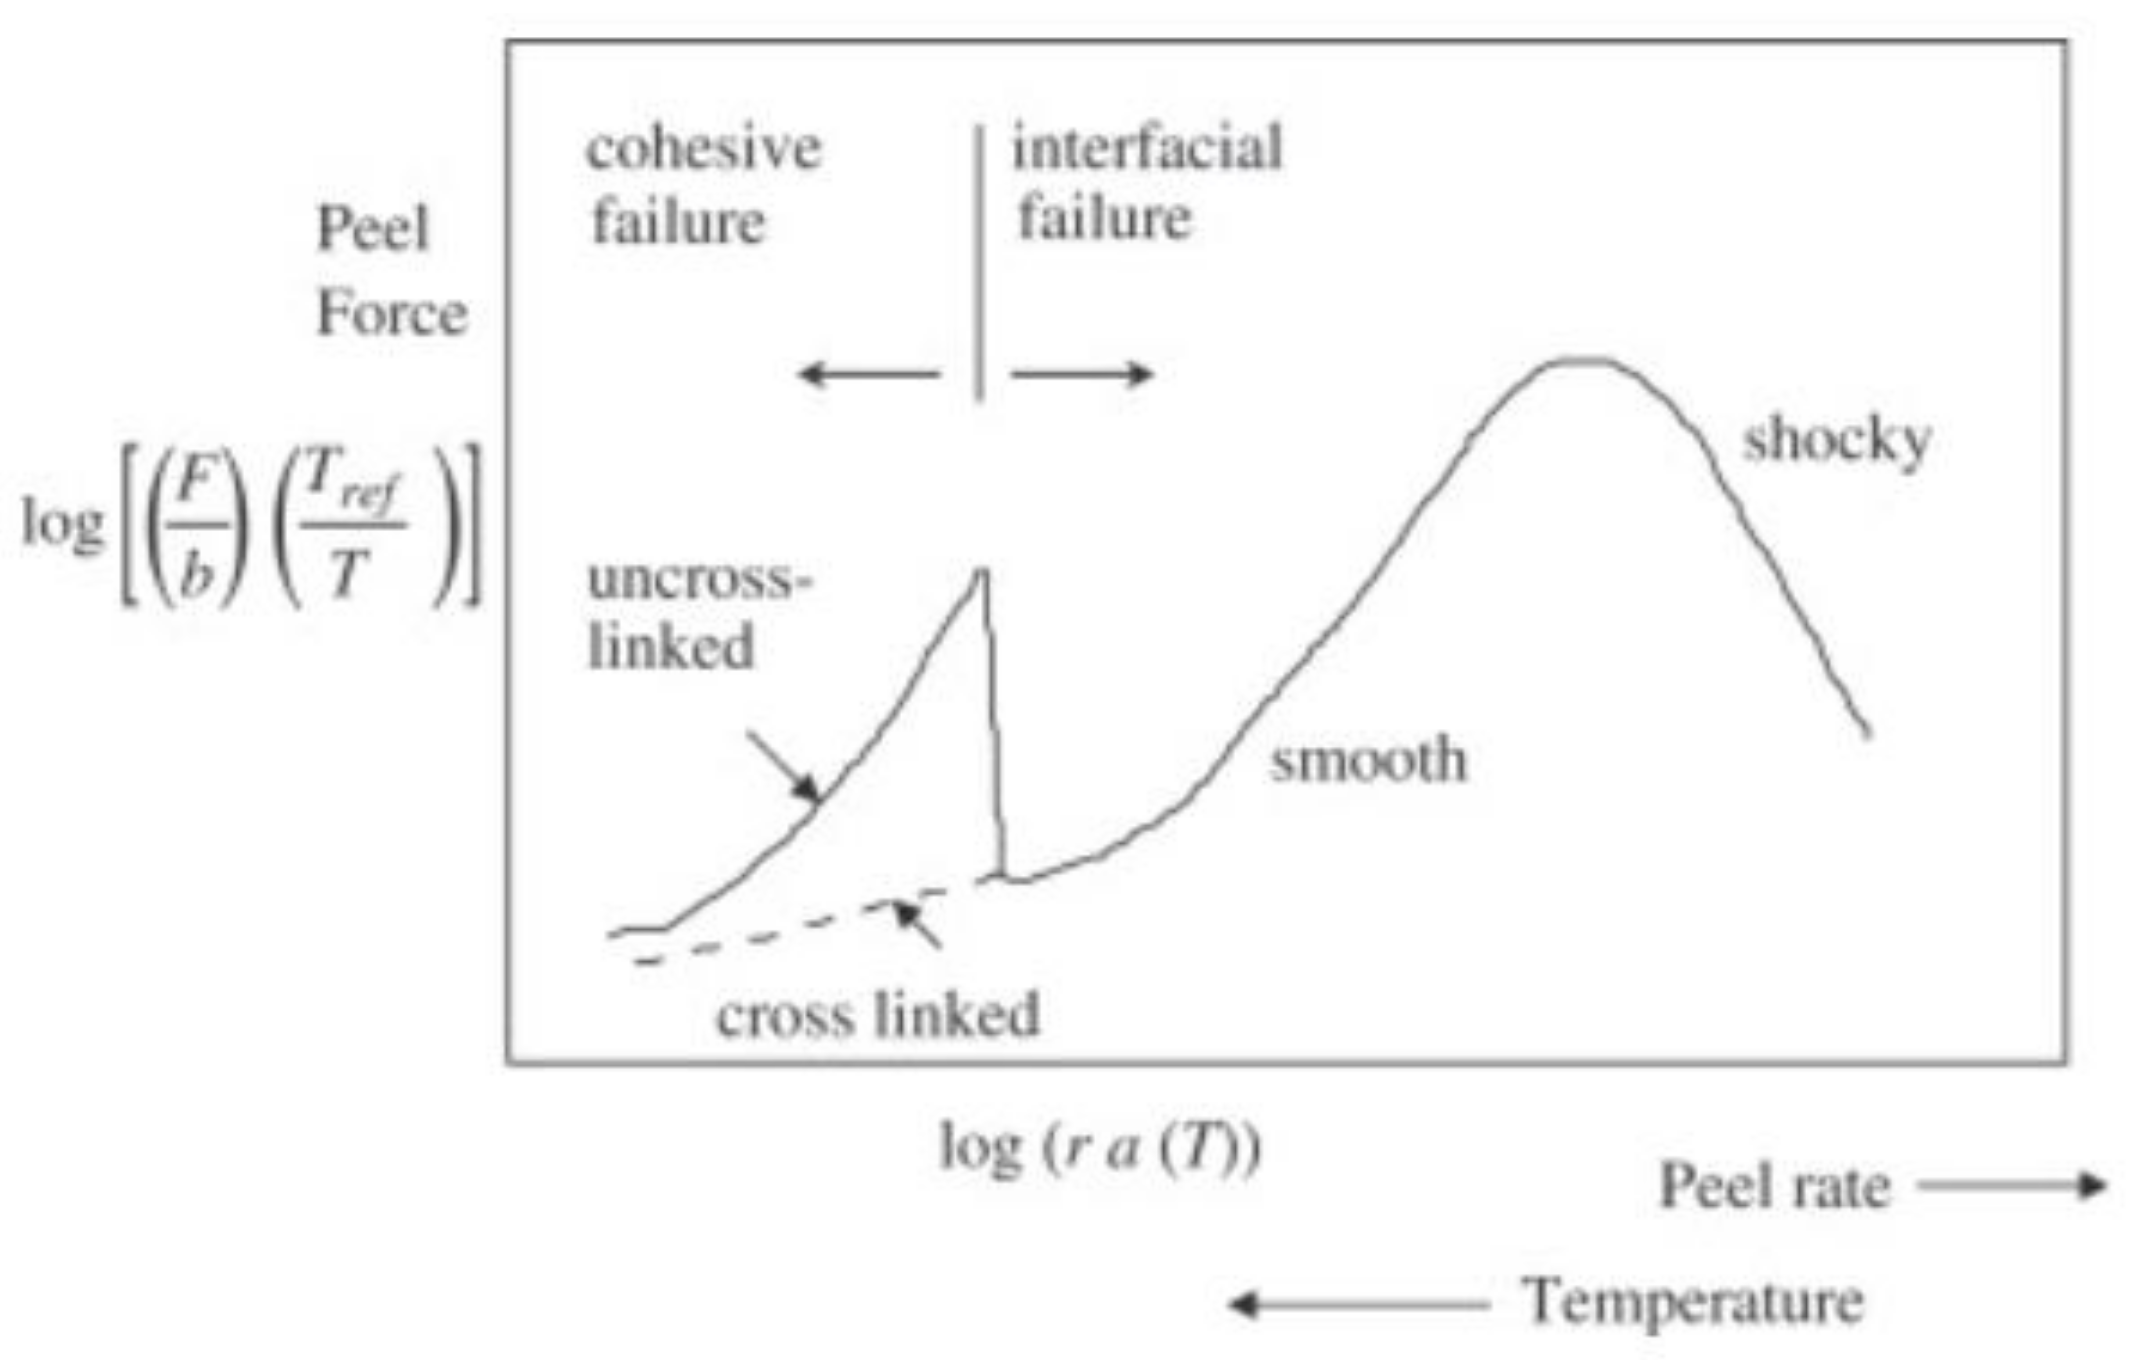
2. Background of Peeling Mechanics and Current Approach
- Case #1—Elastic deformation during bending loading and unloading:
- Case #2—Plastic deformation during bending loading and elastic deformation during bending unloading:
- Case #3—Plastic deformation during bending loading and unloading:where k0 represents the rate between R1, the radius of curvature related to the initial yielding of peeling arm, and R0, the actual radius of the curvature at the peel tip position. Furthermore, f1 and f2 are a function of k0 and the work-hardening parameter α according to the Kinloch method [22].
3. Experimental Investigation
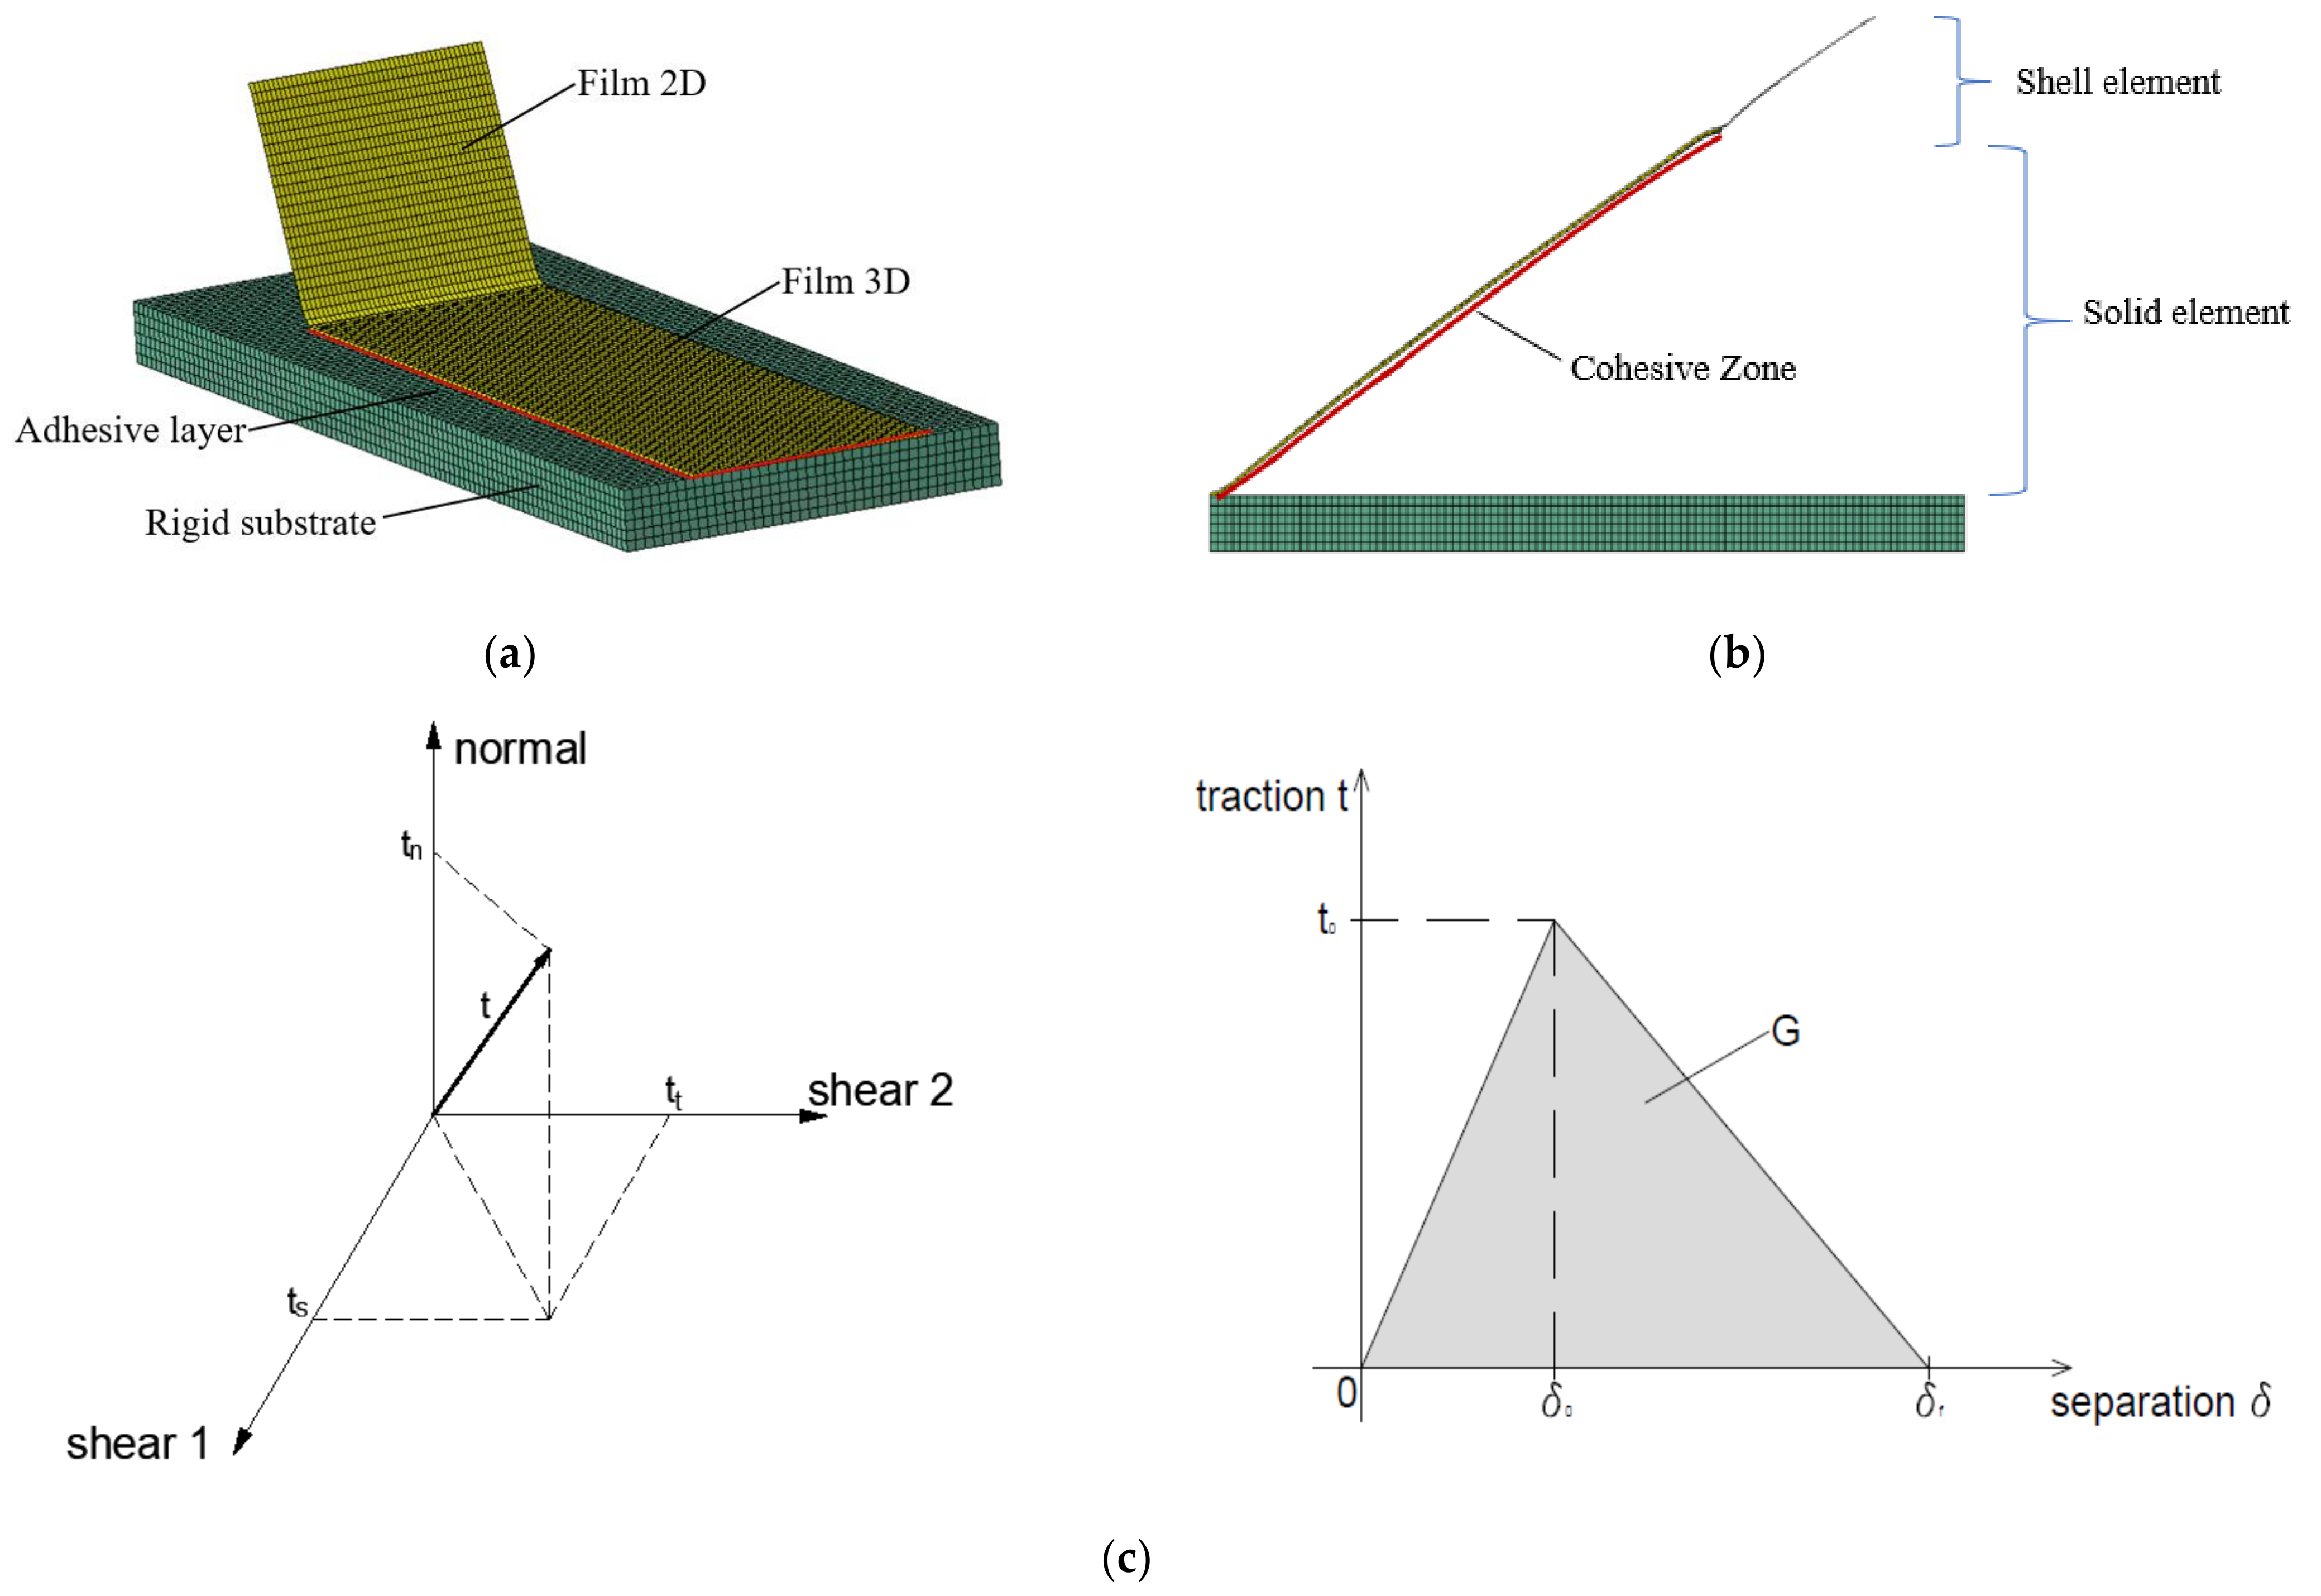
4. Numerical Analysis
5. Discussion of Experimental Results
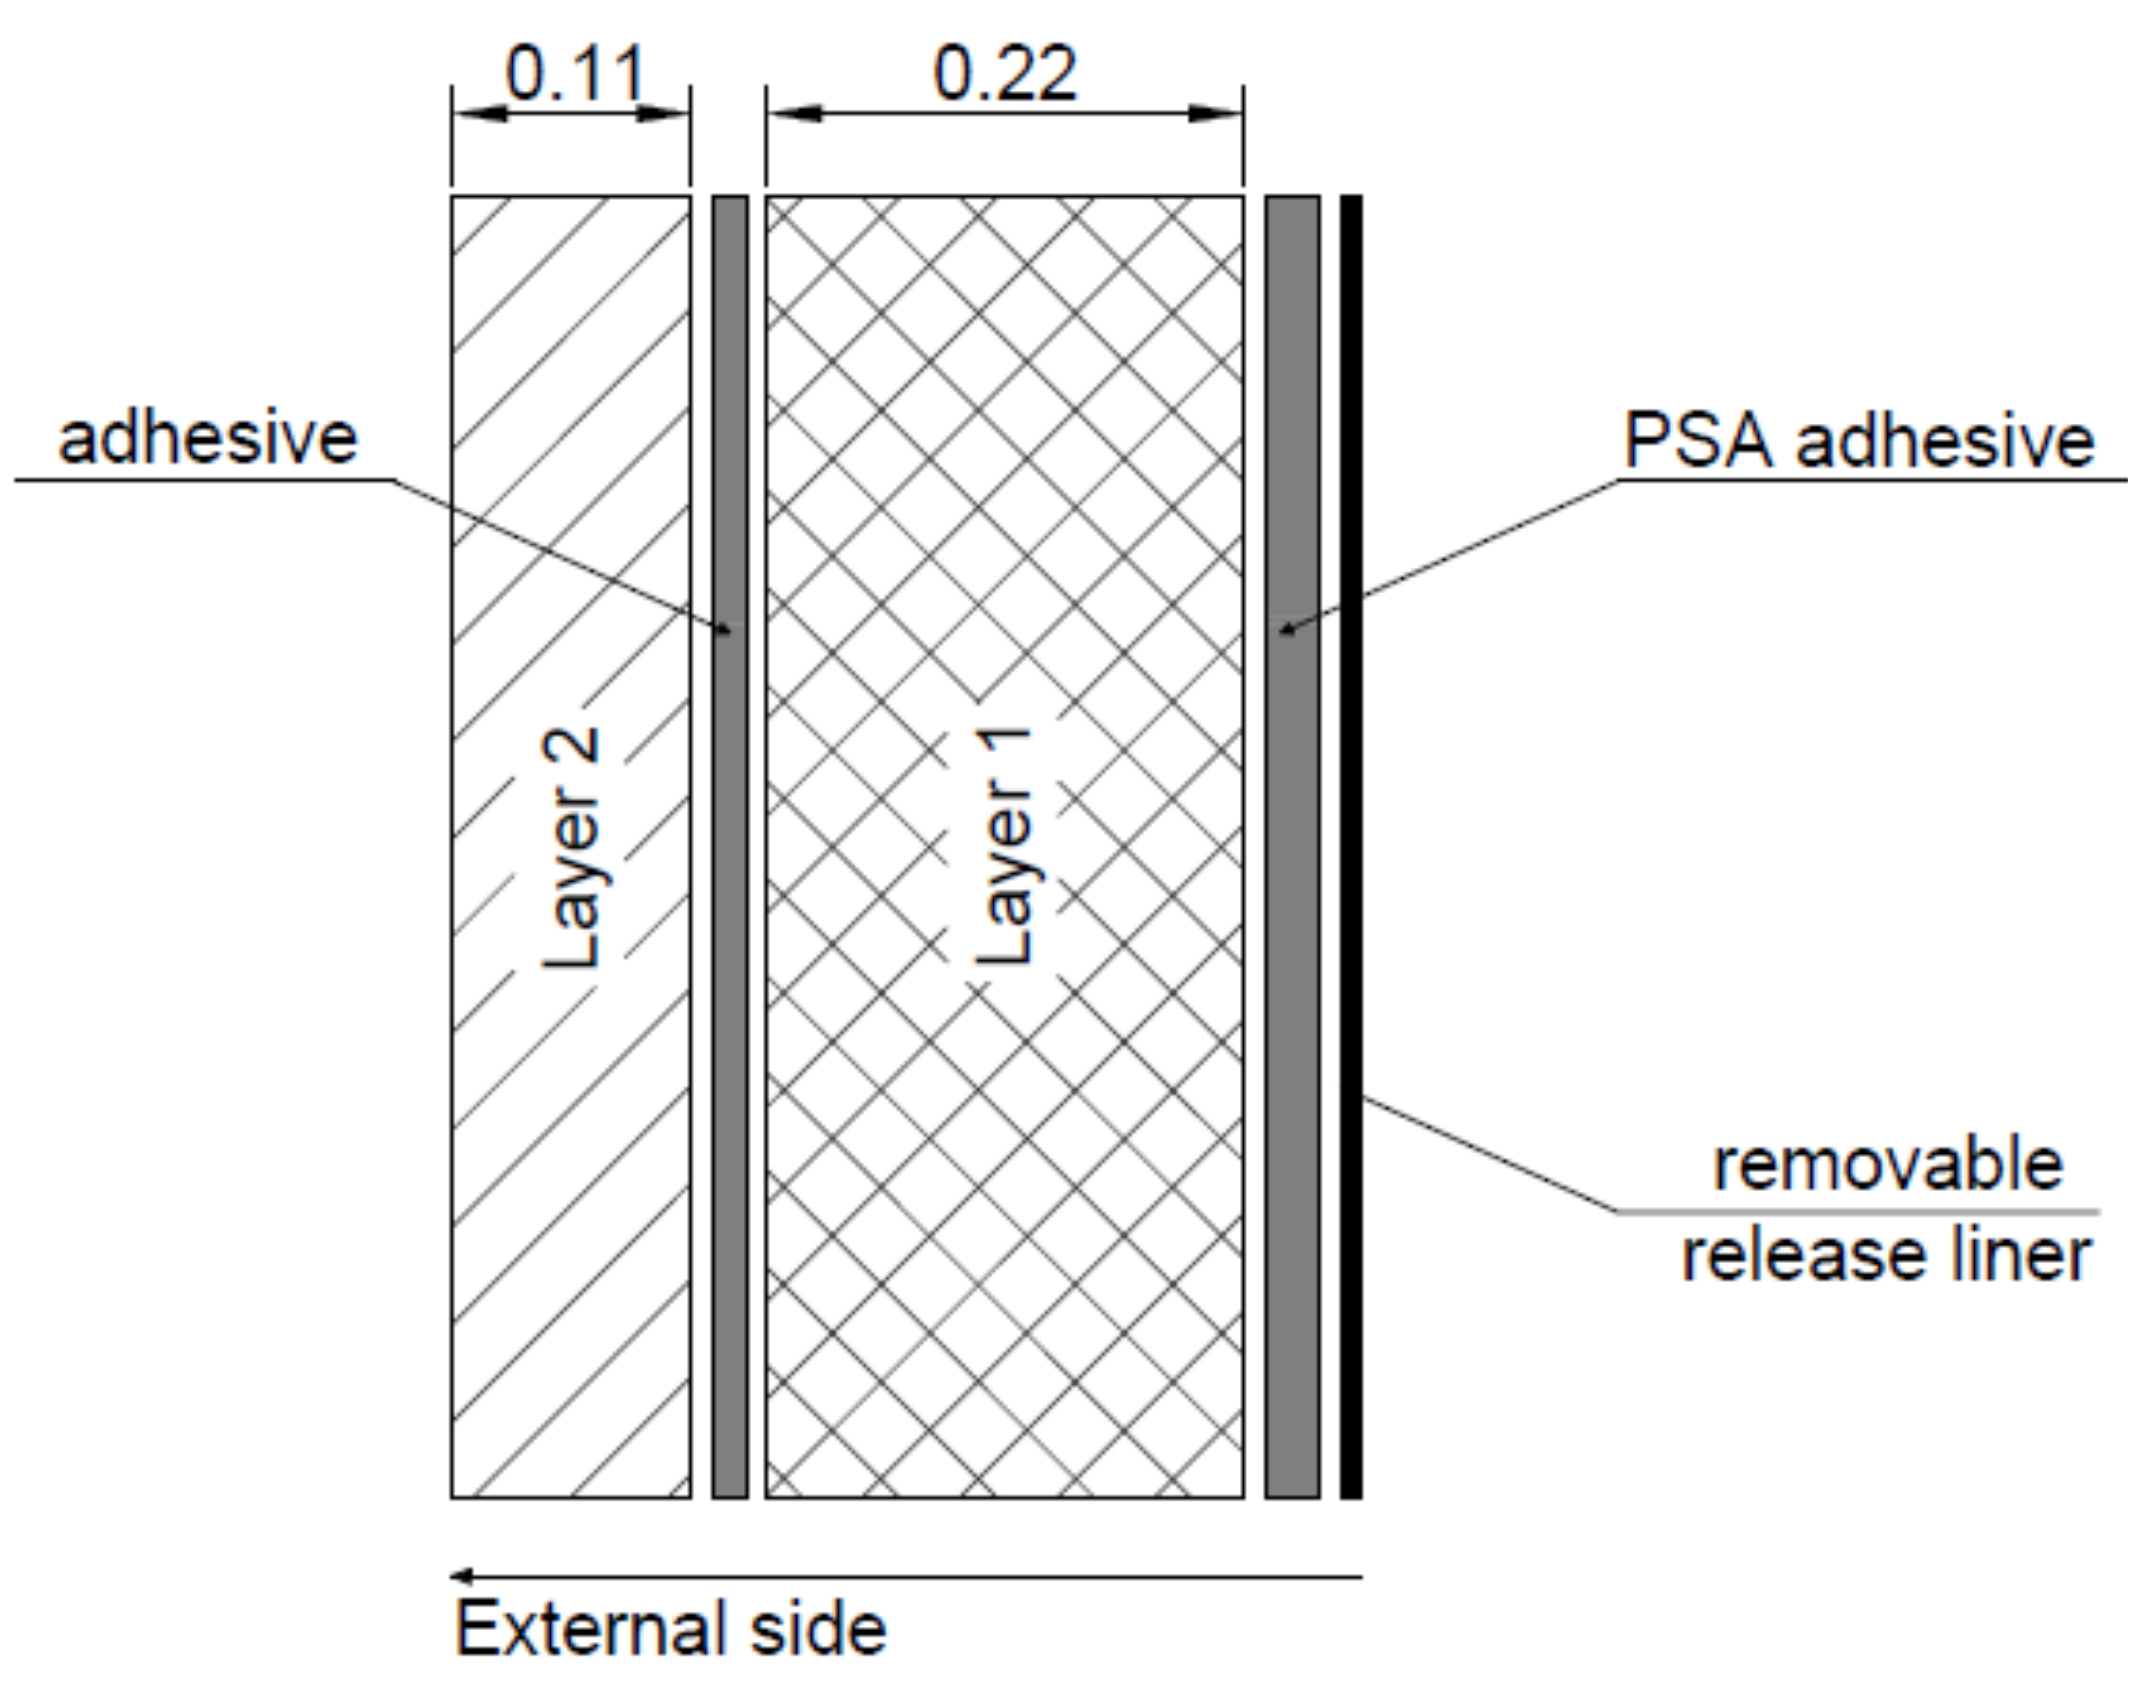
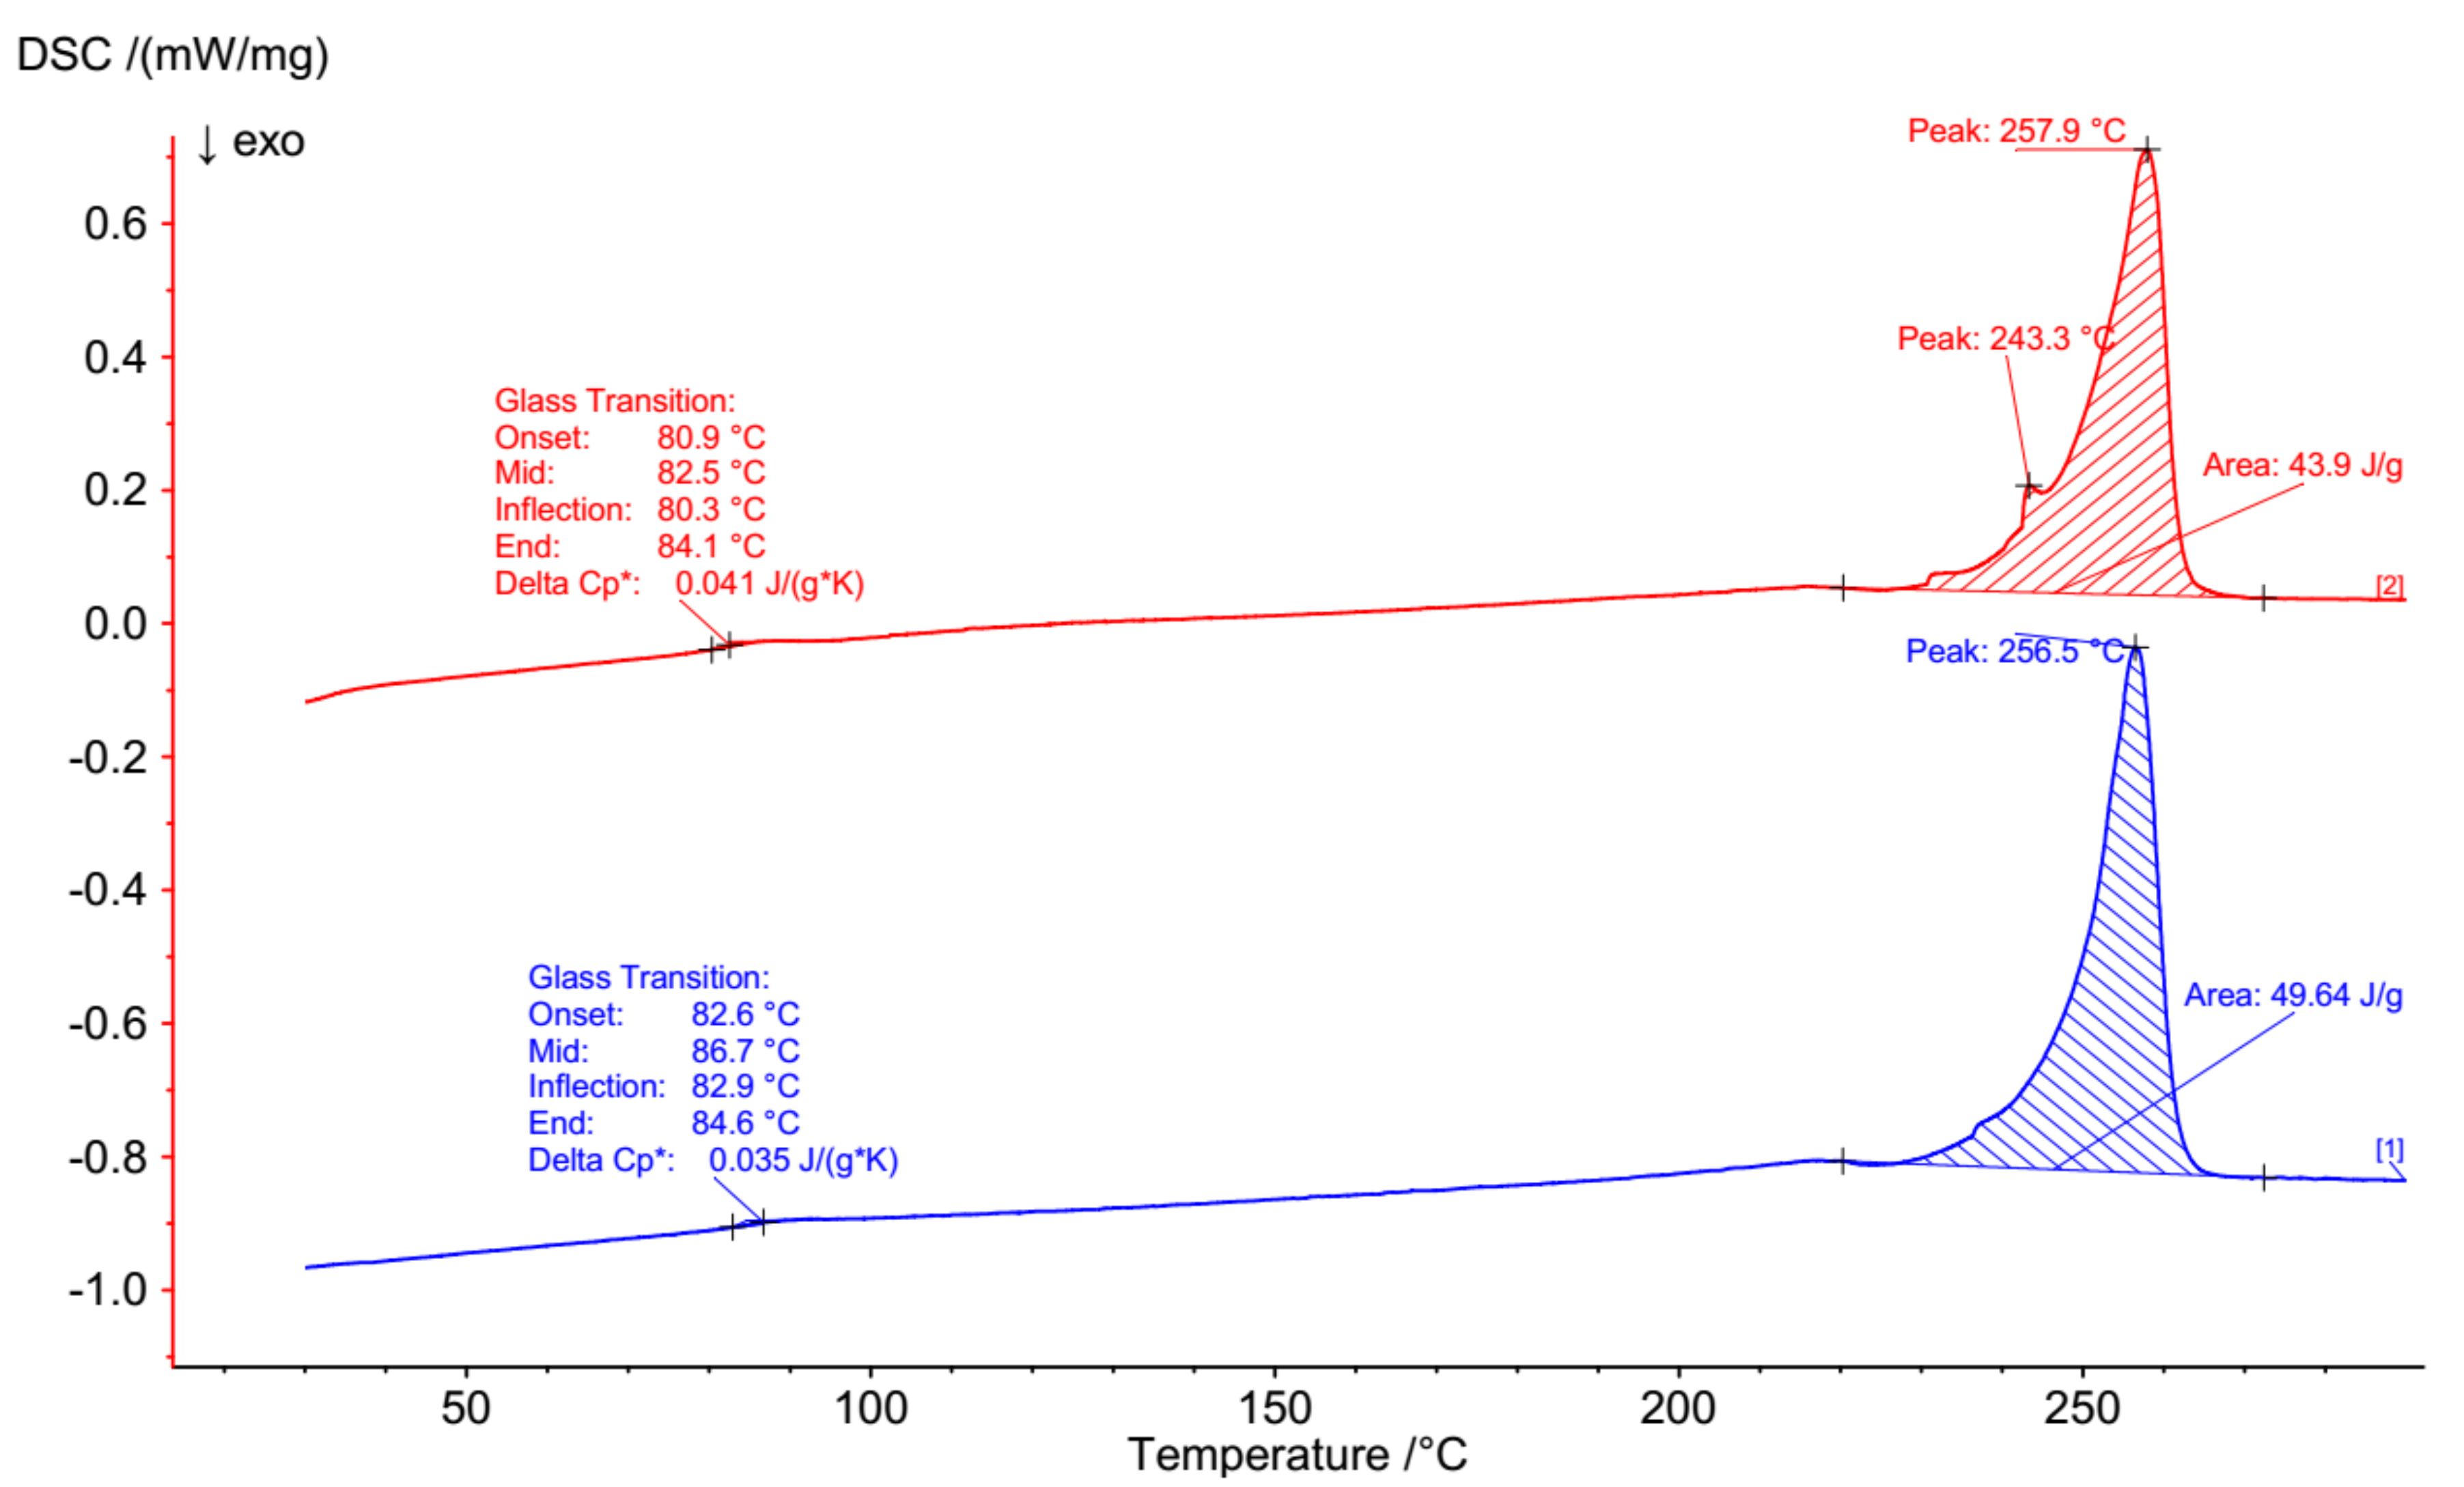
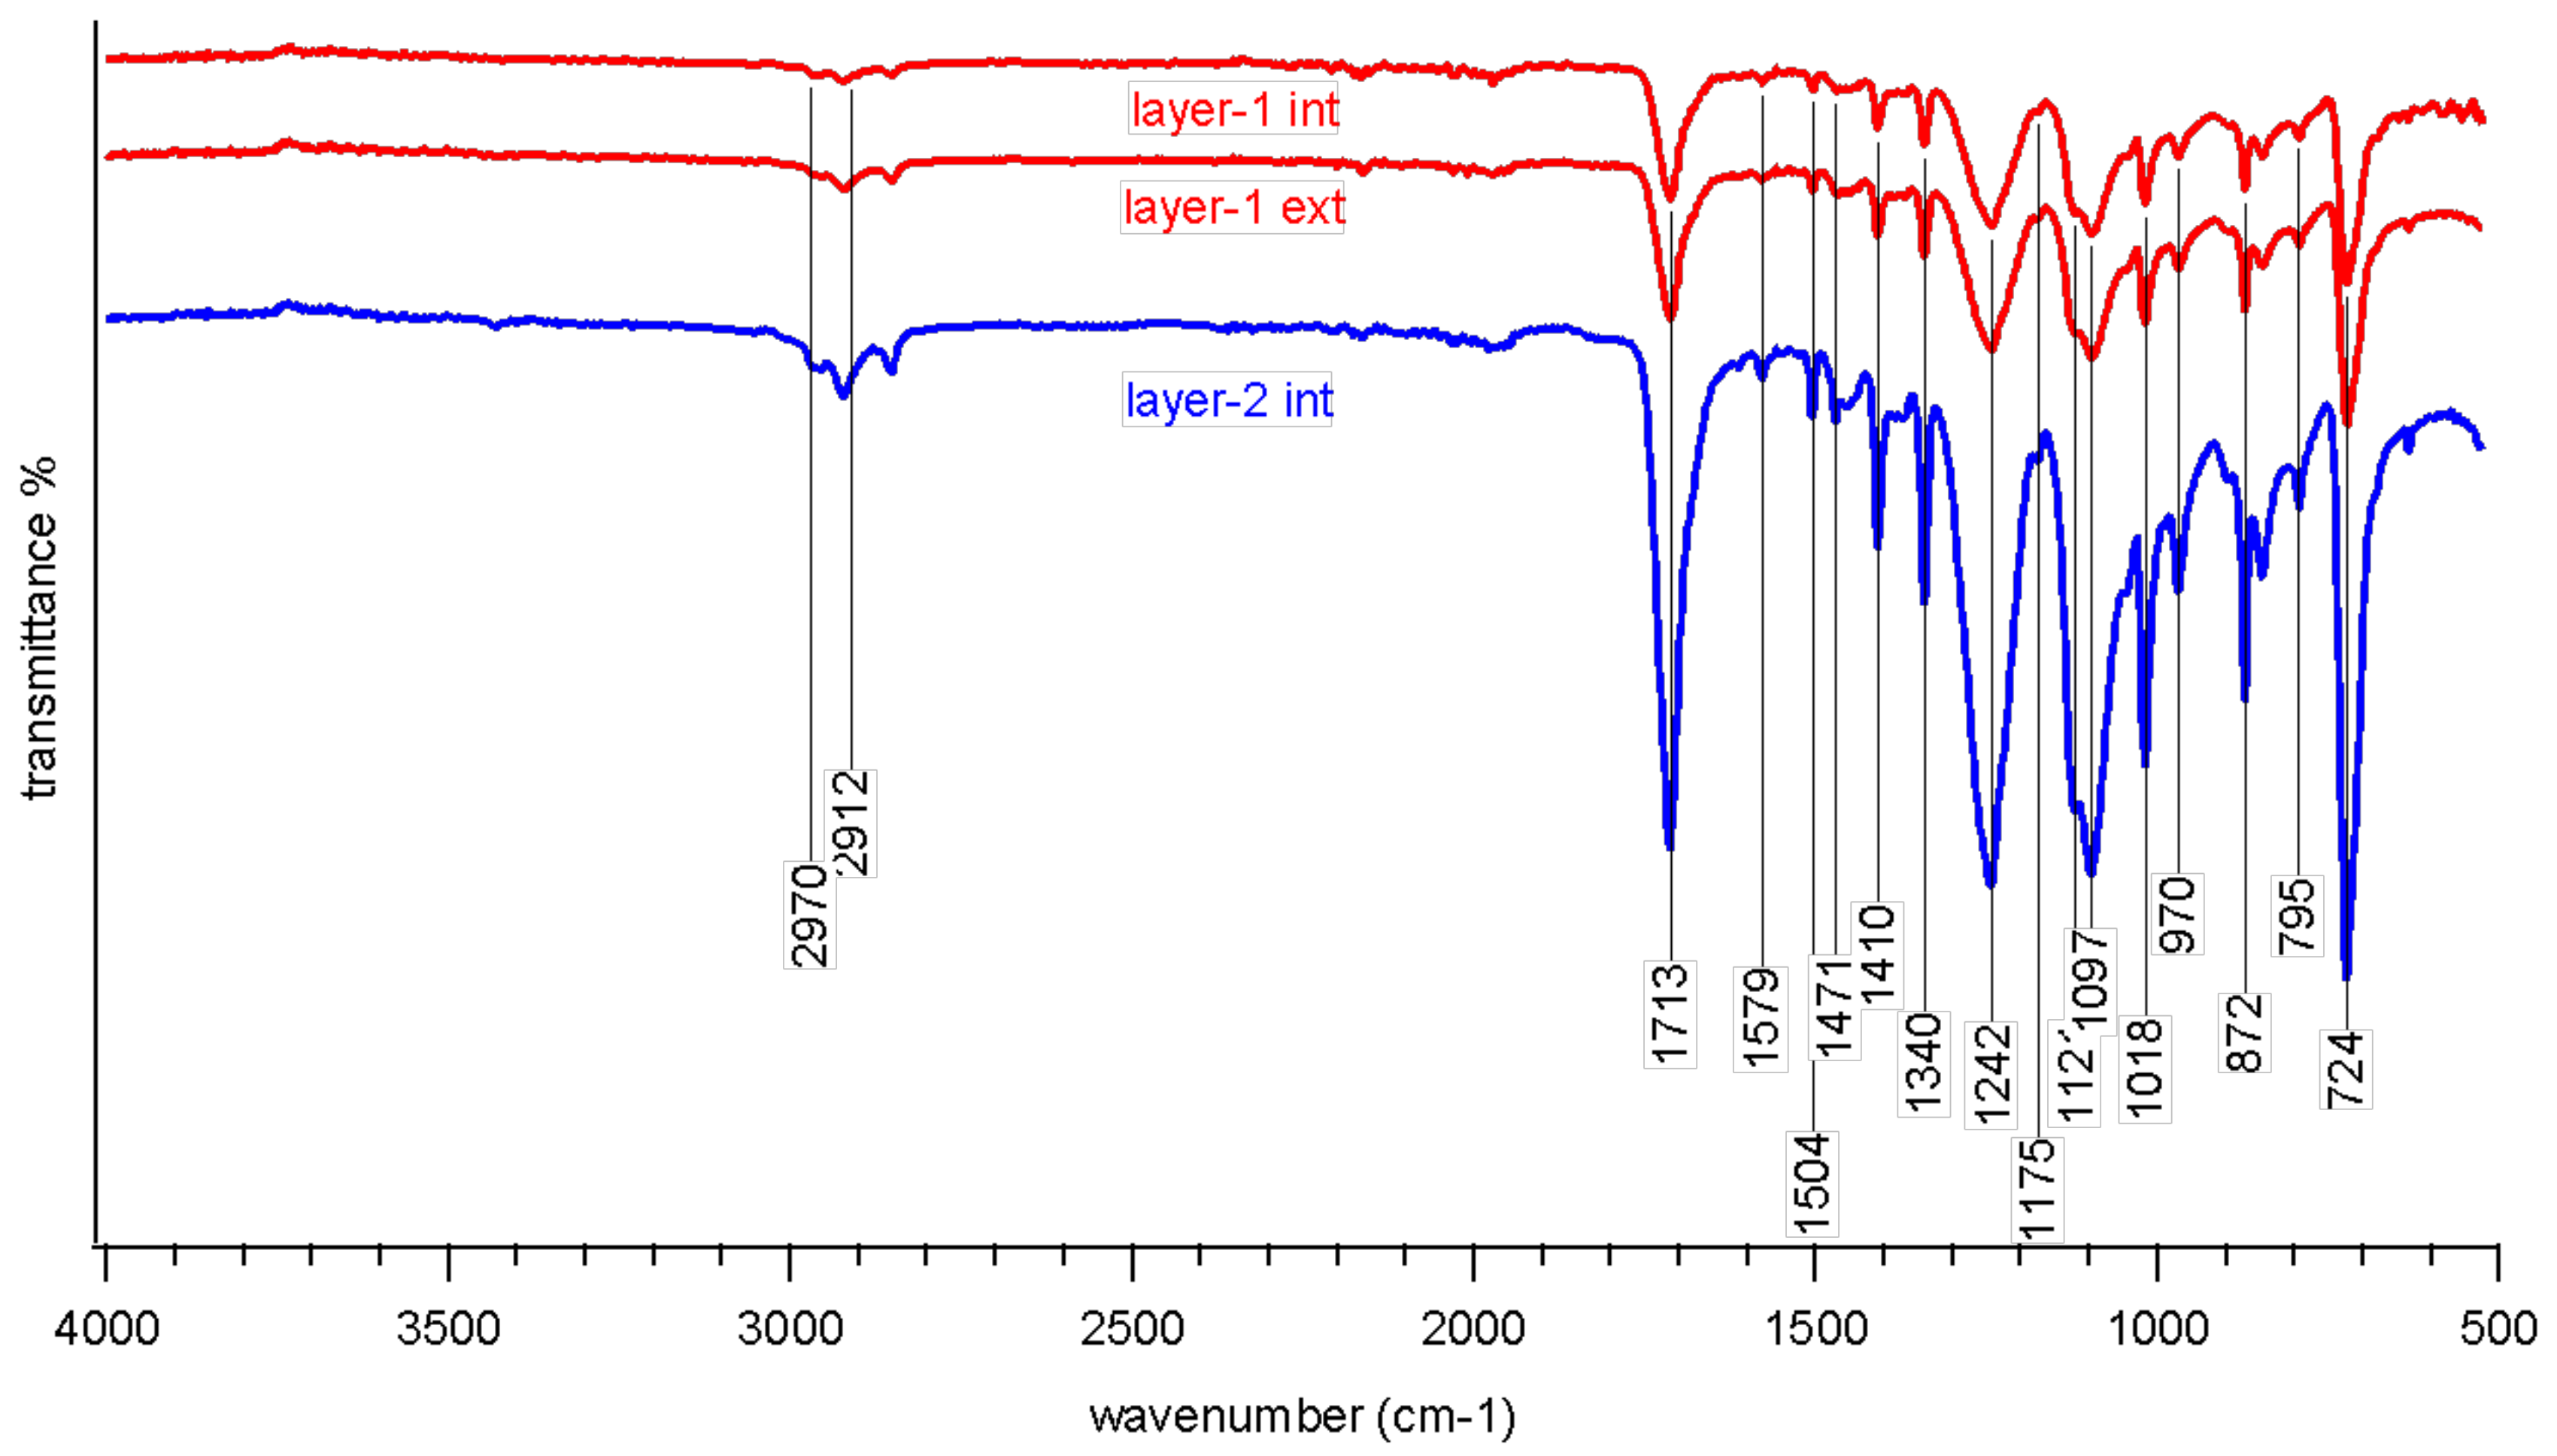
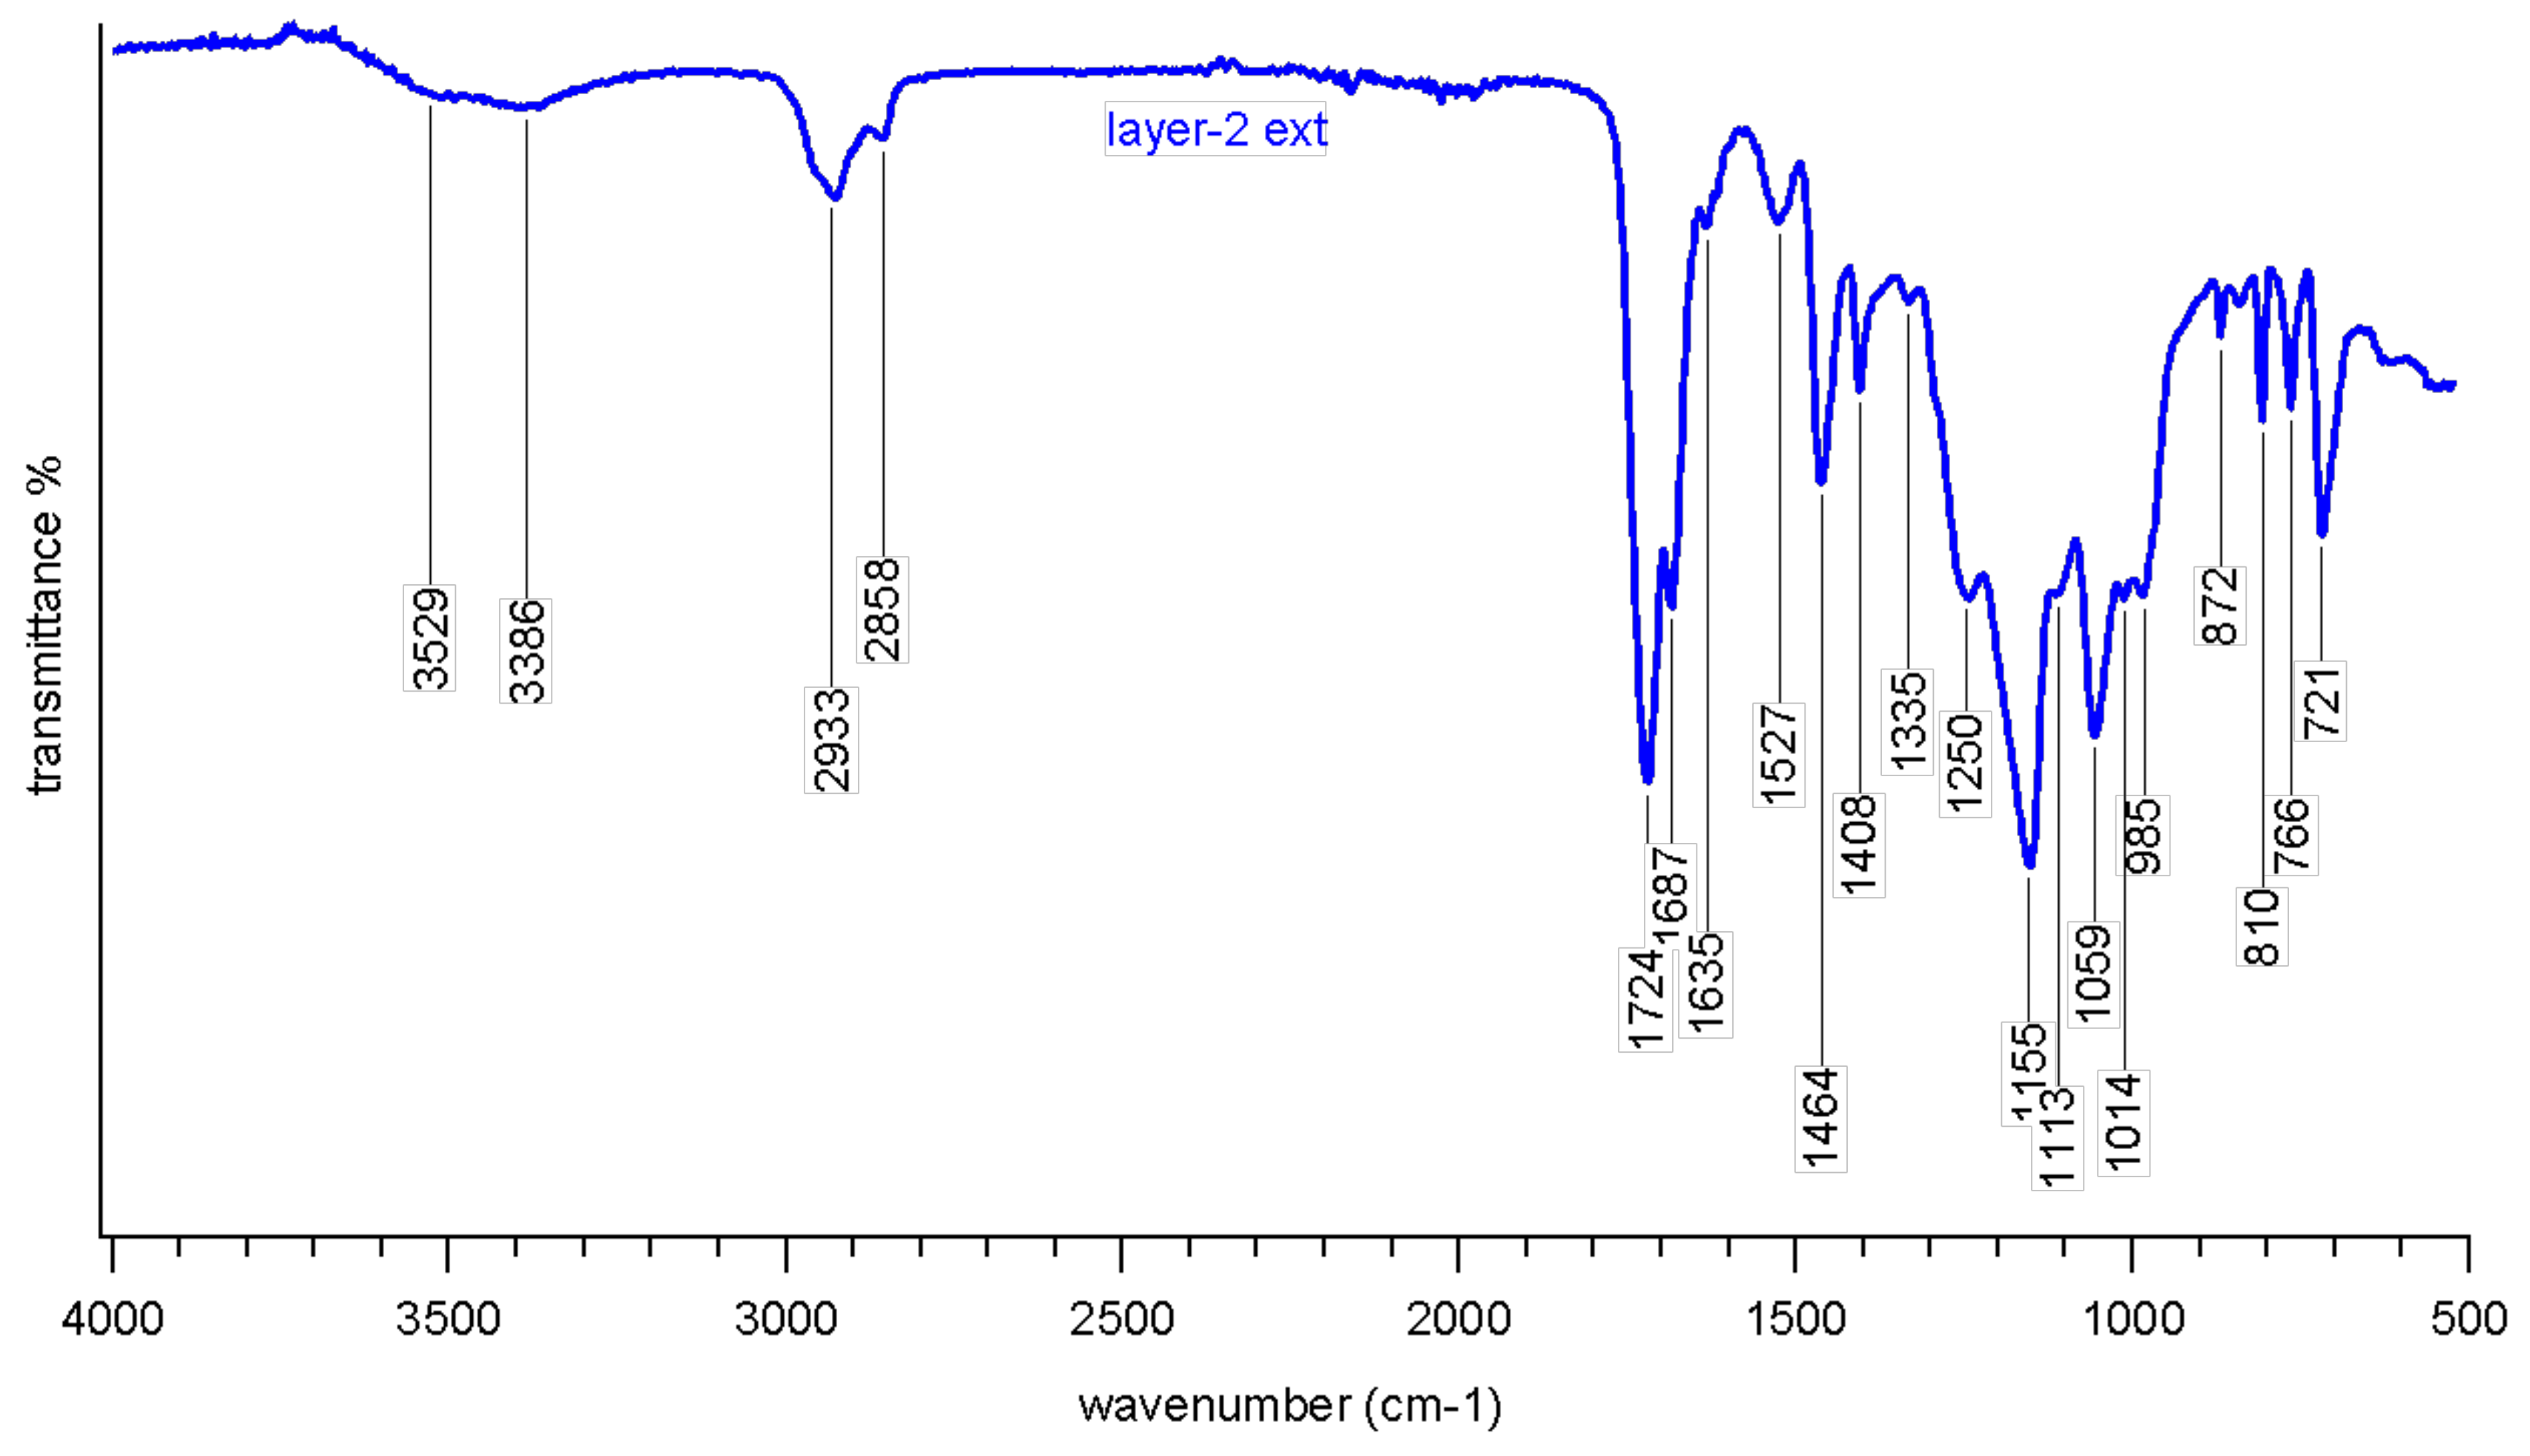
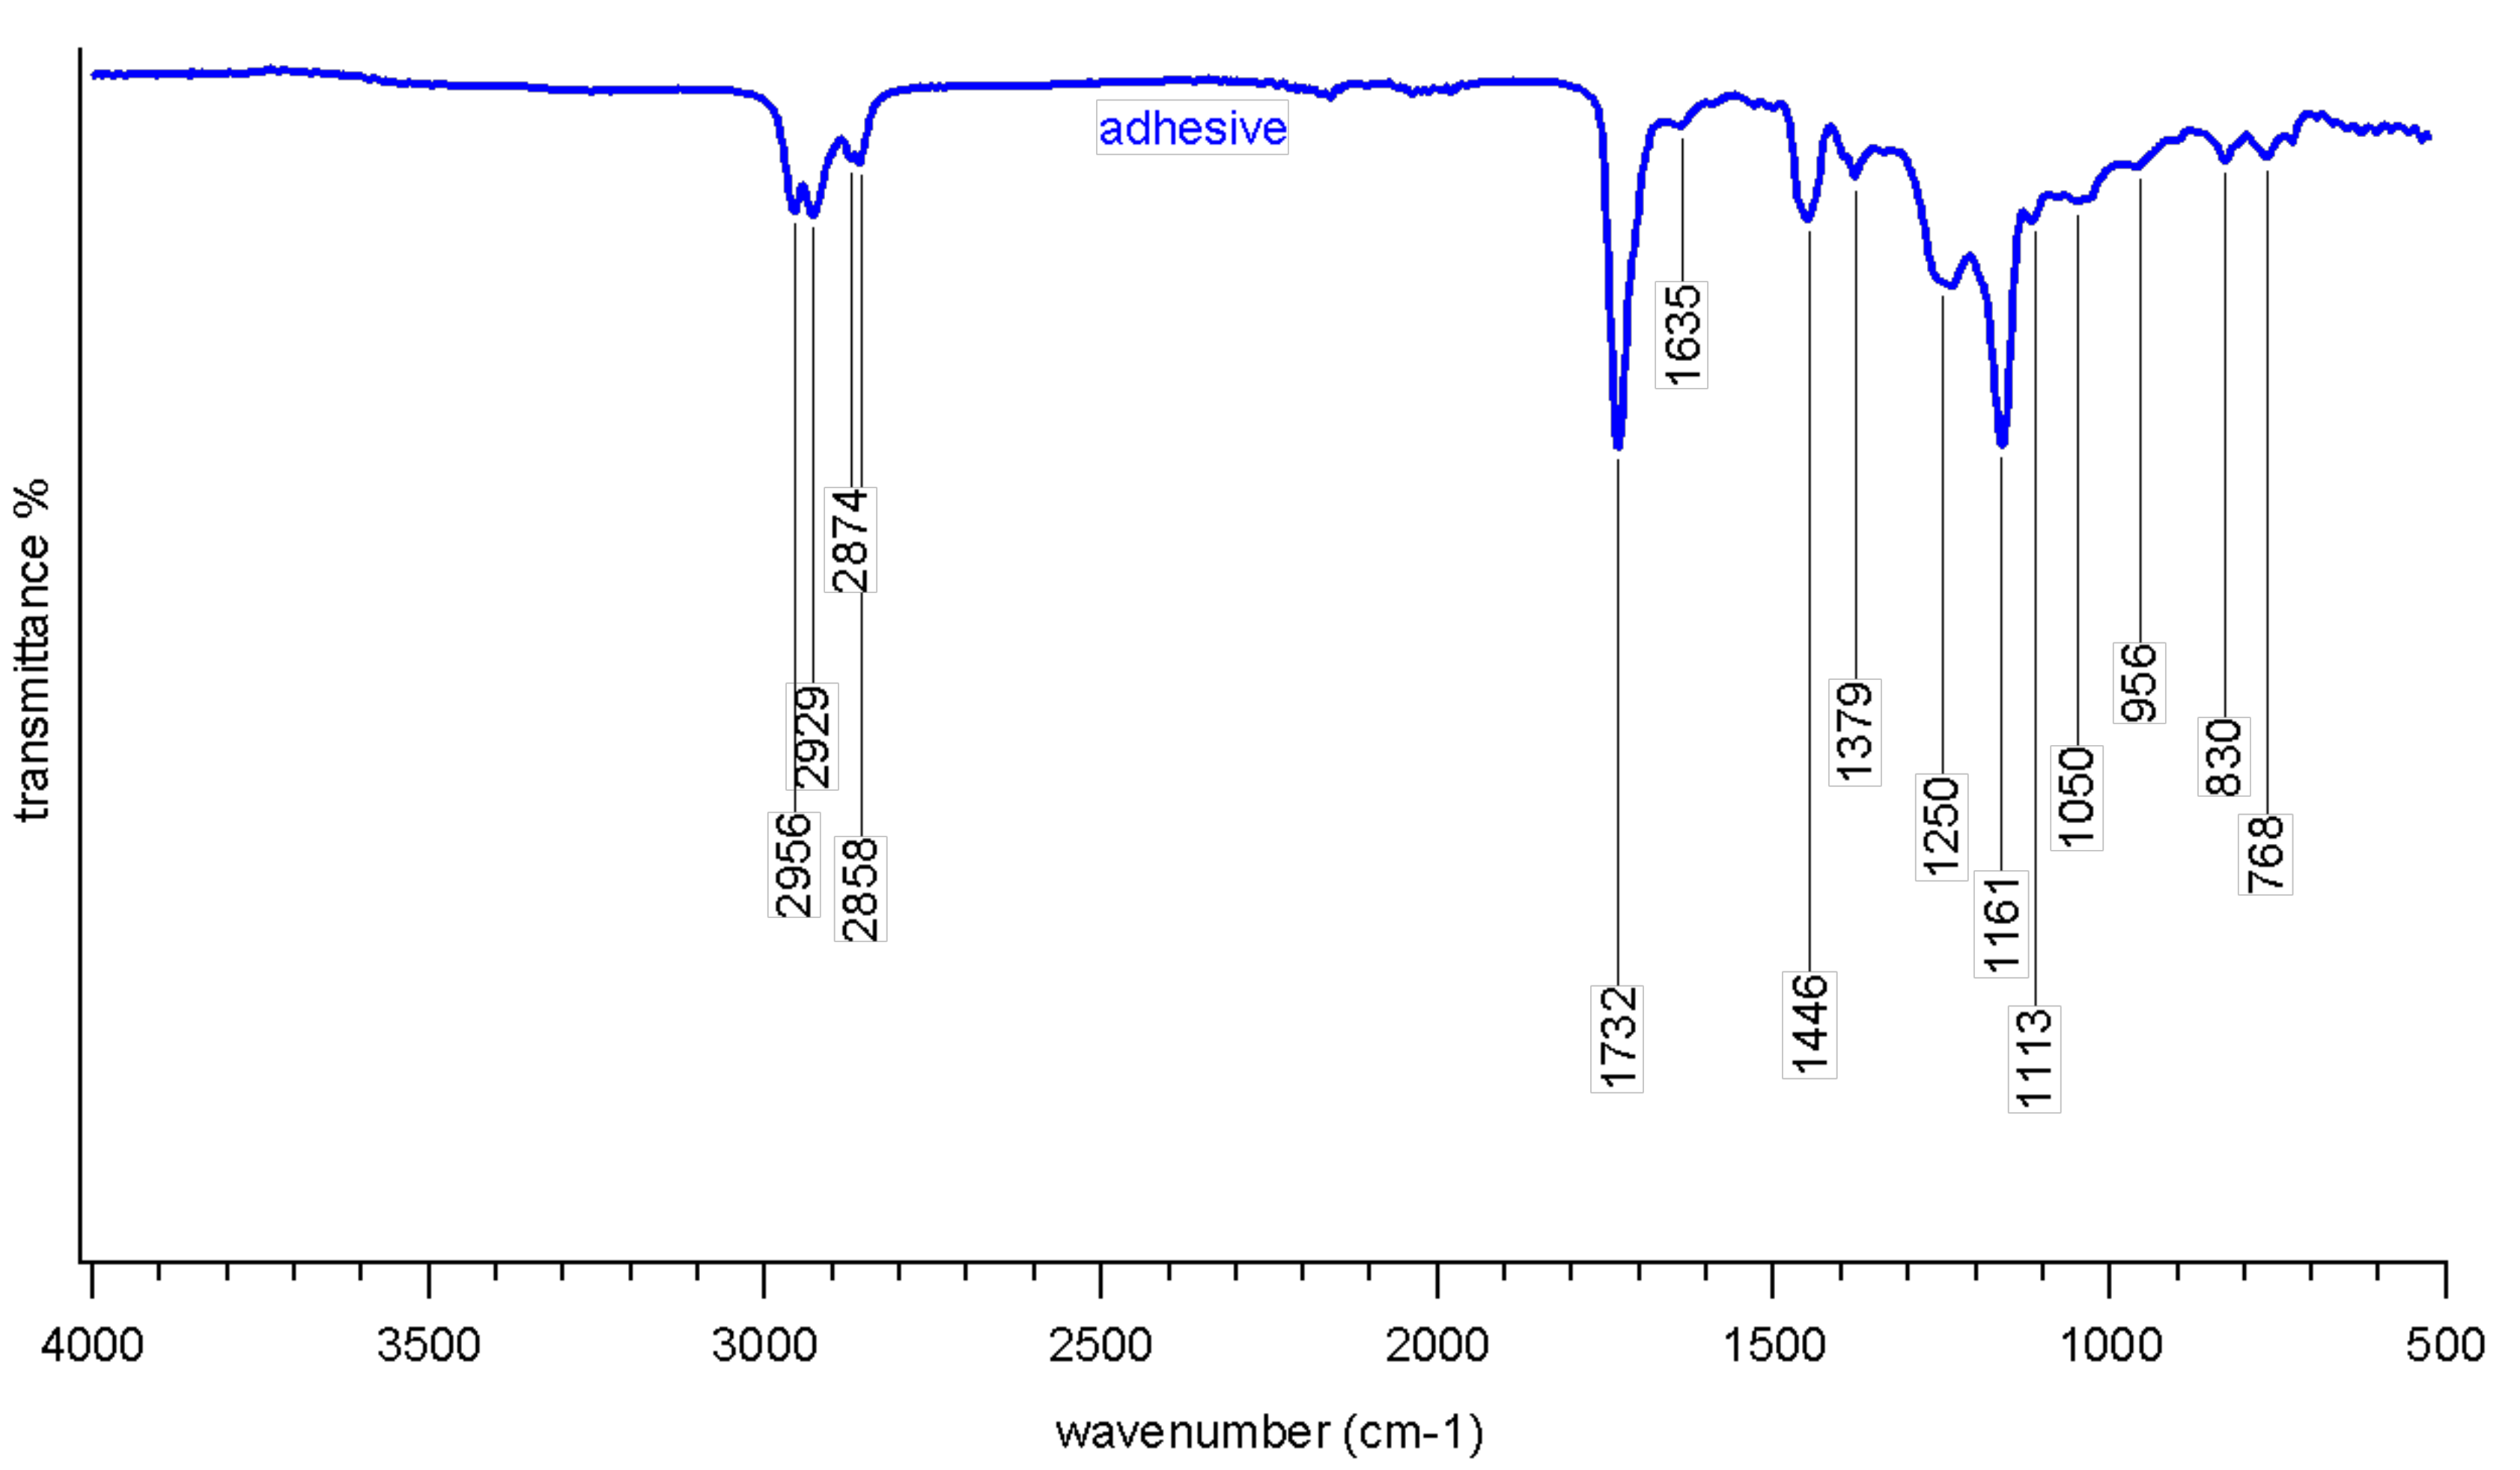
5.1. Materials Investigations
5.2. Mechanical Investigation
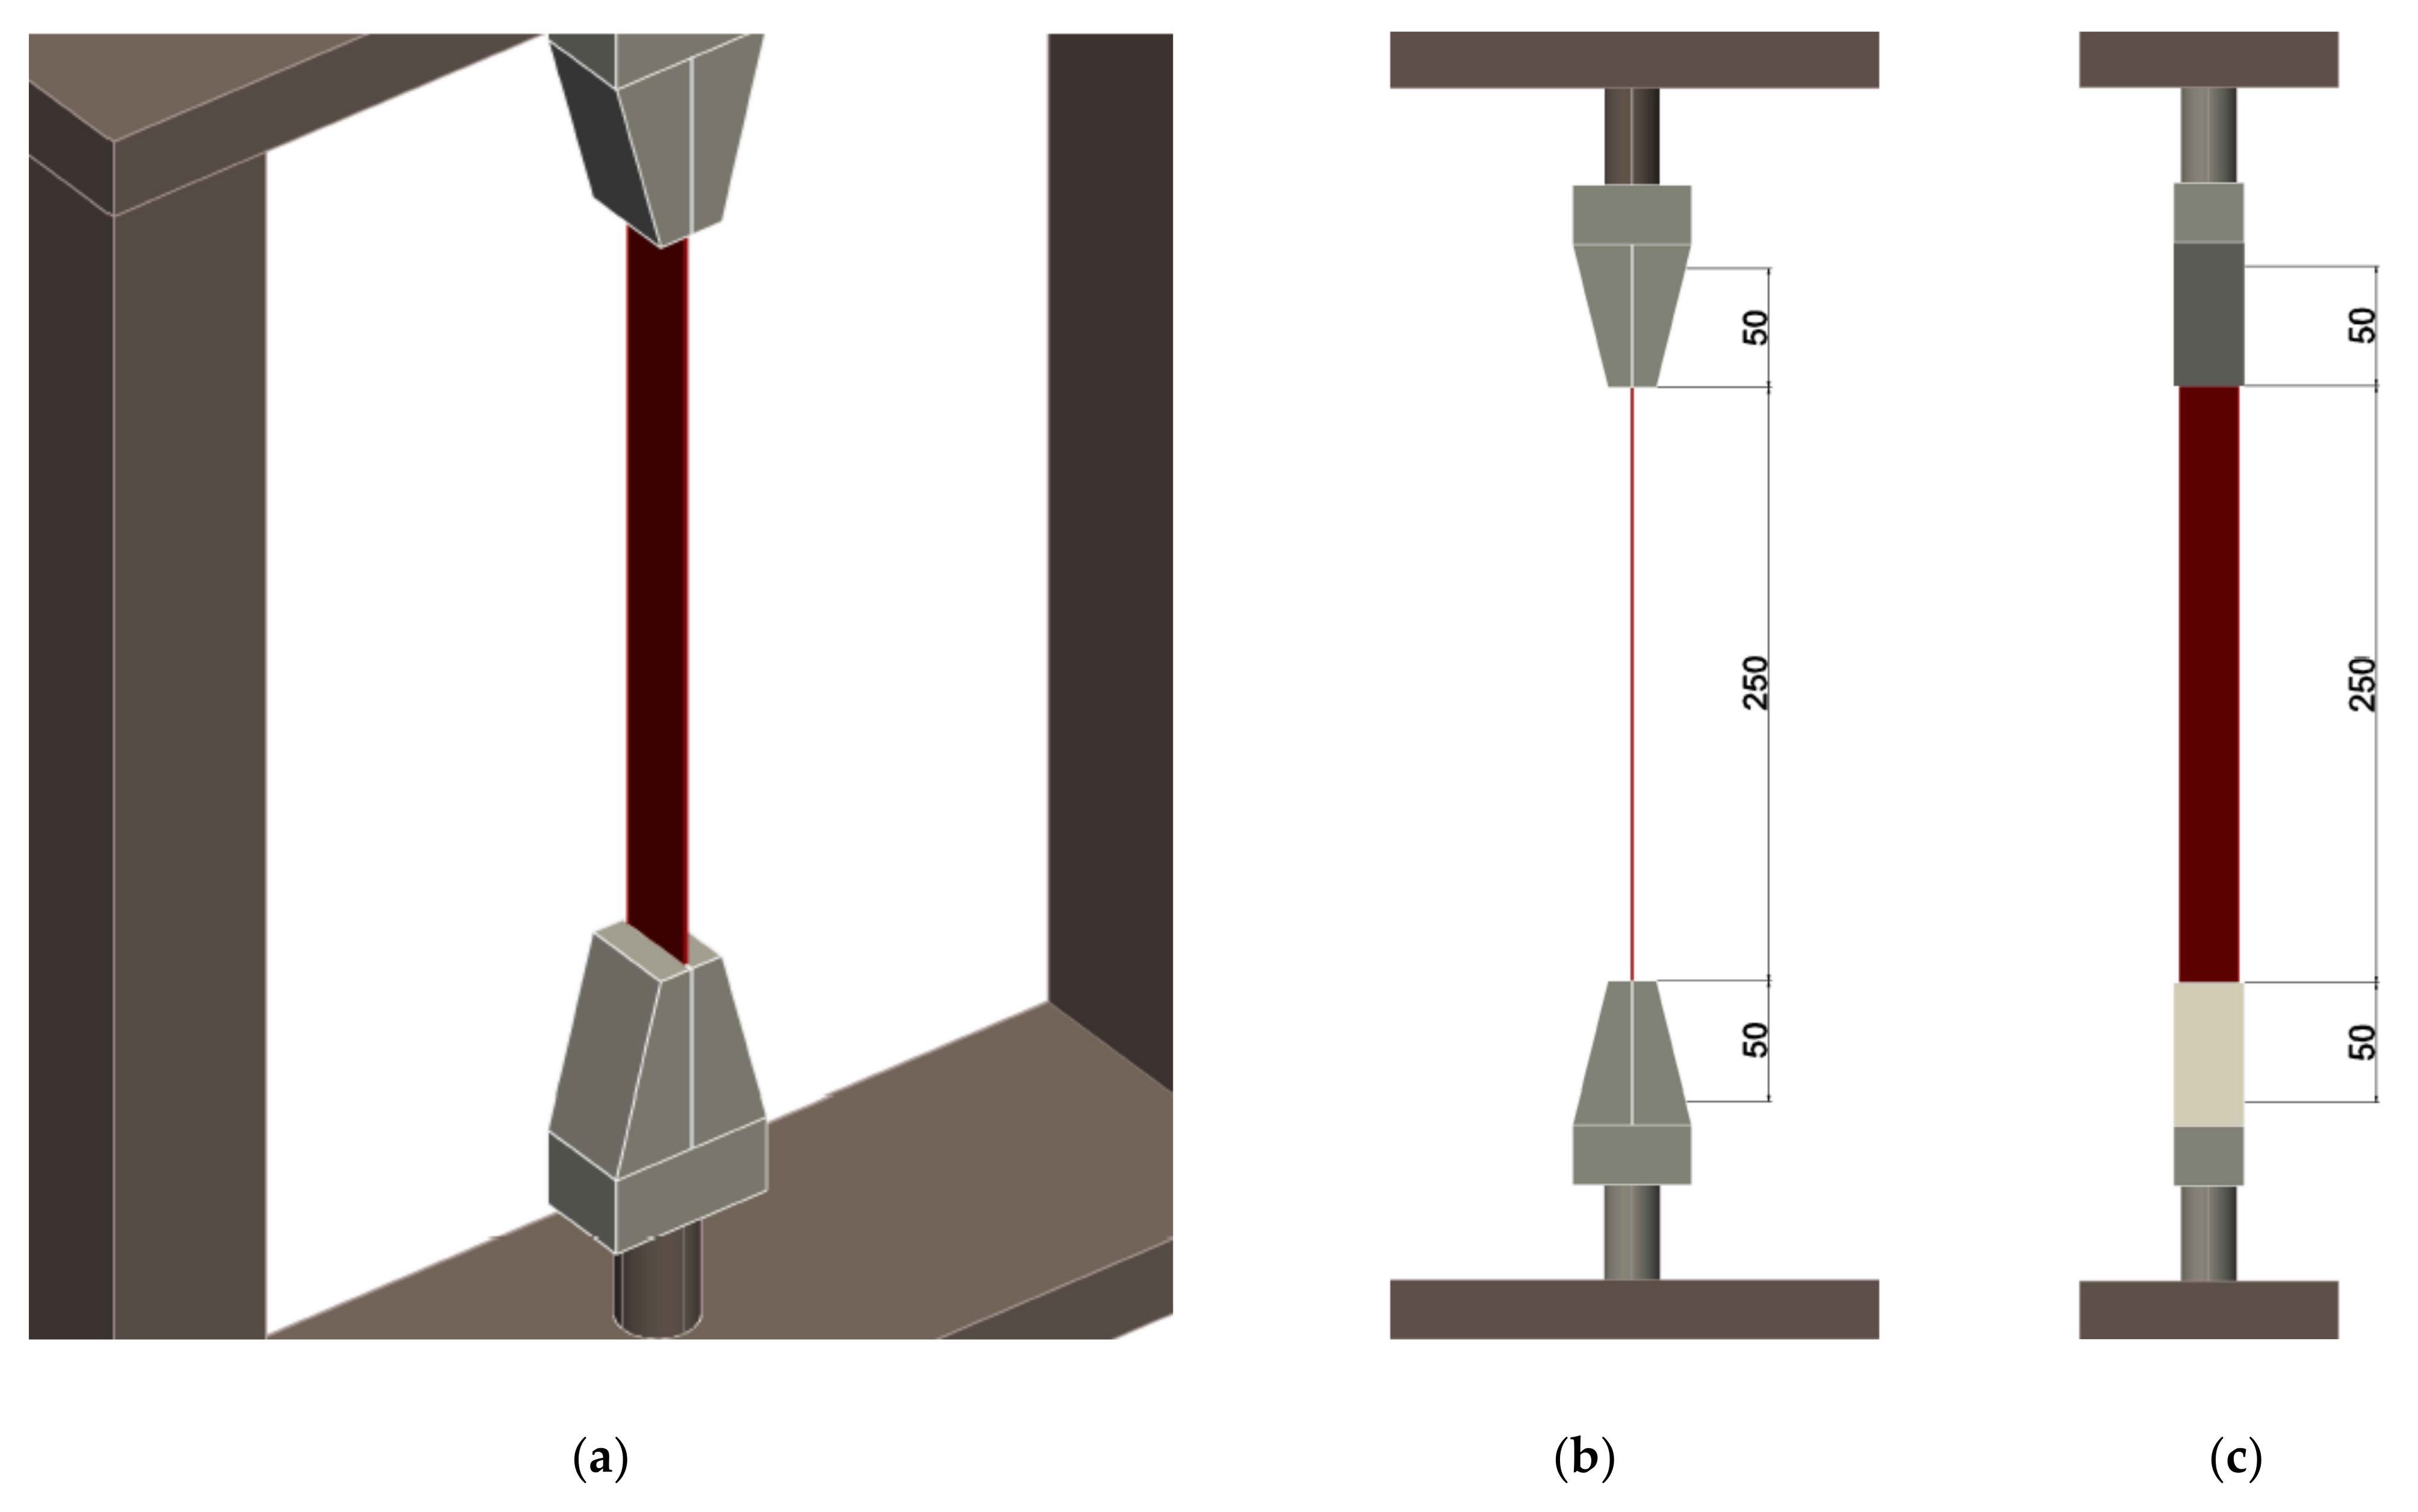
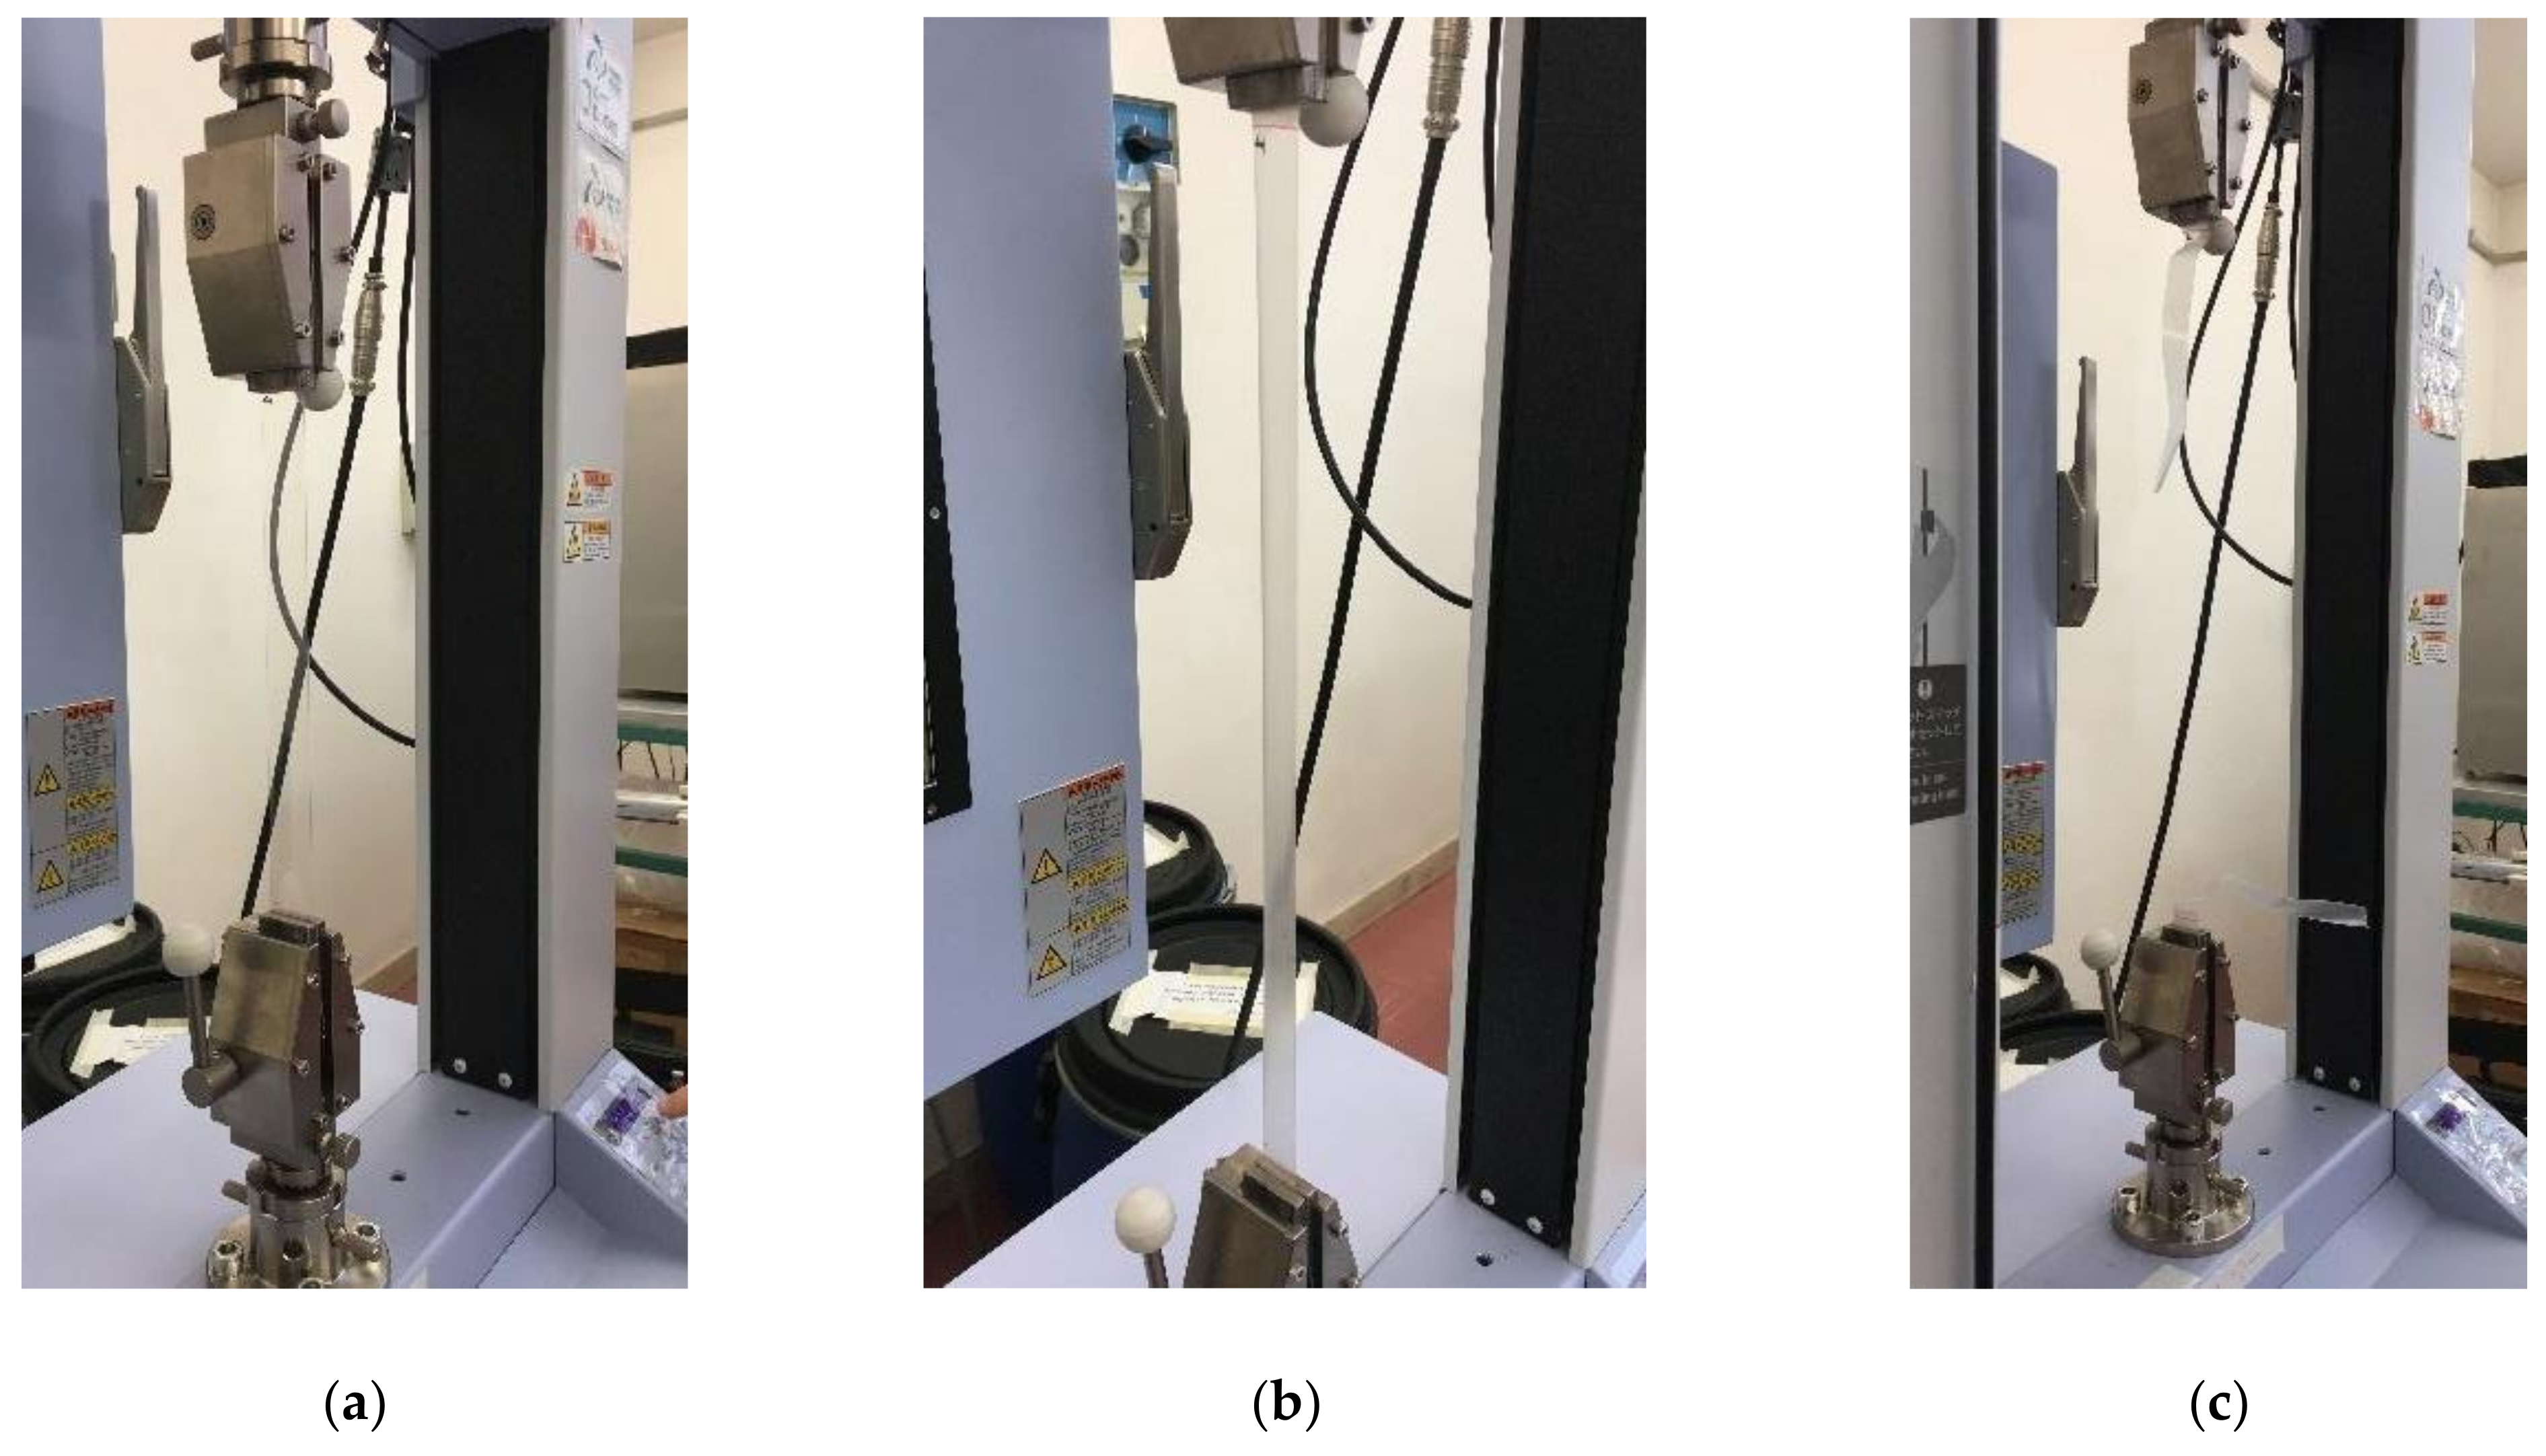
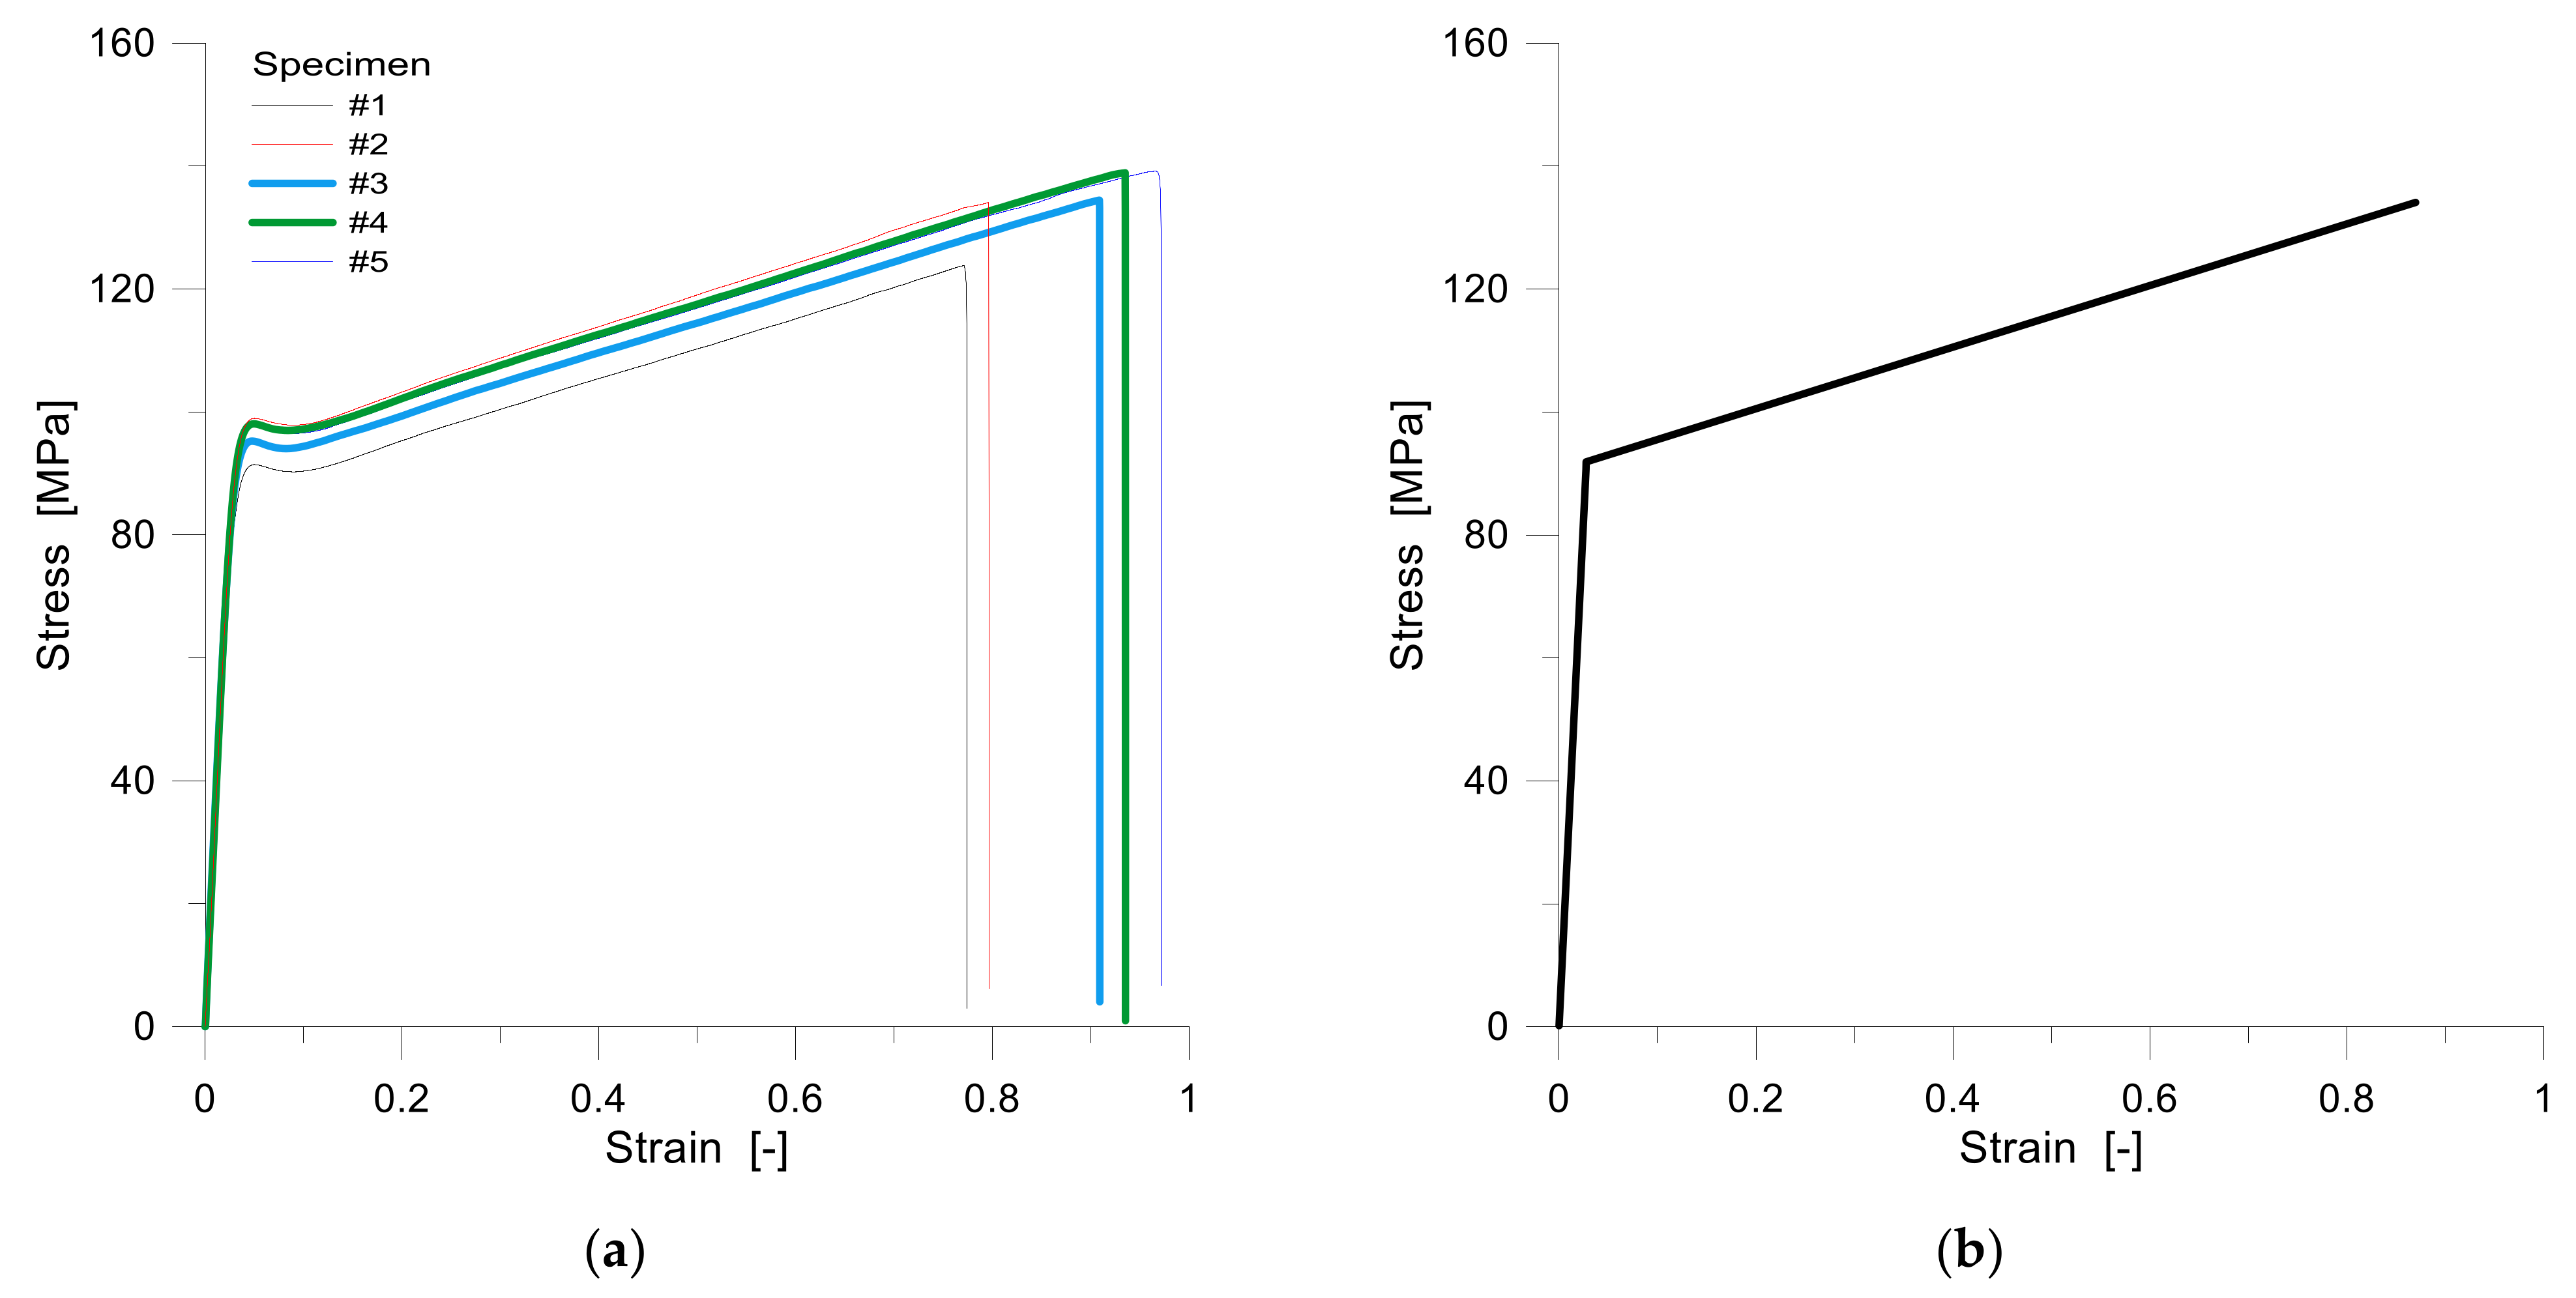
5.2.1. Tensile Test
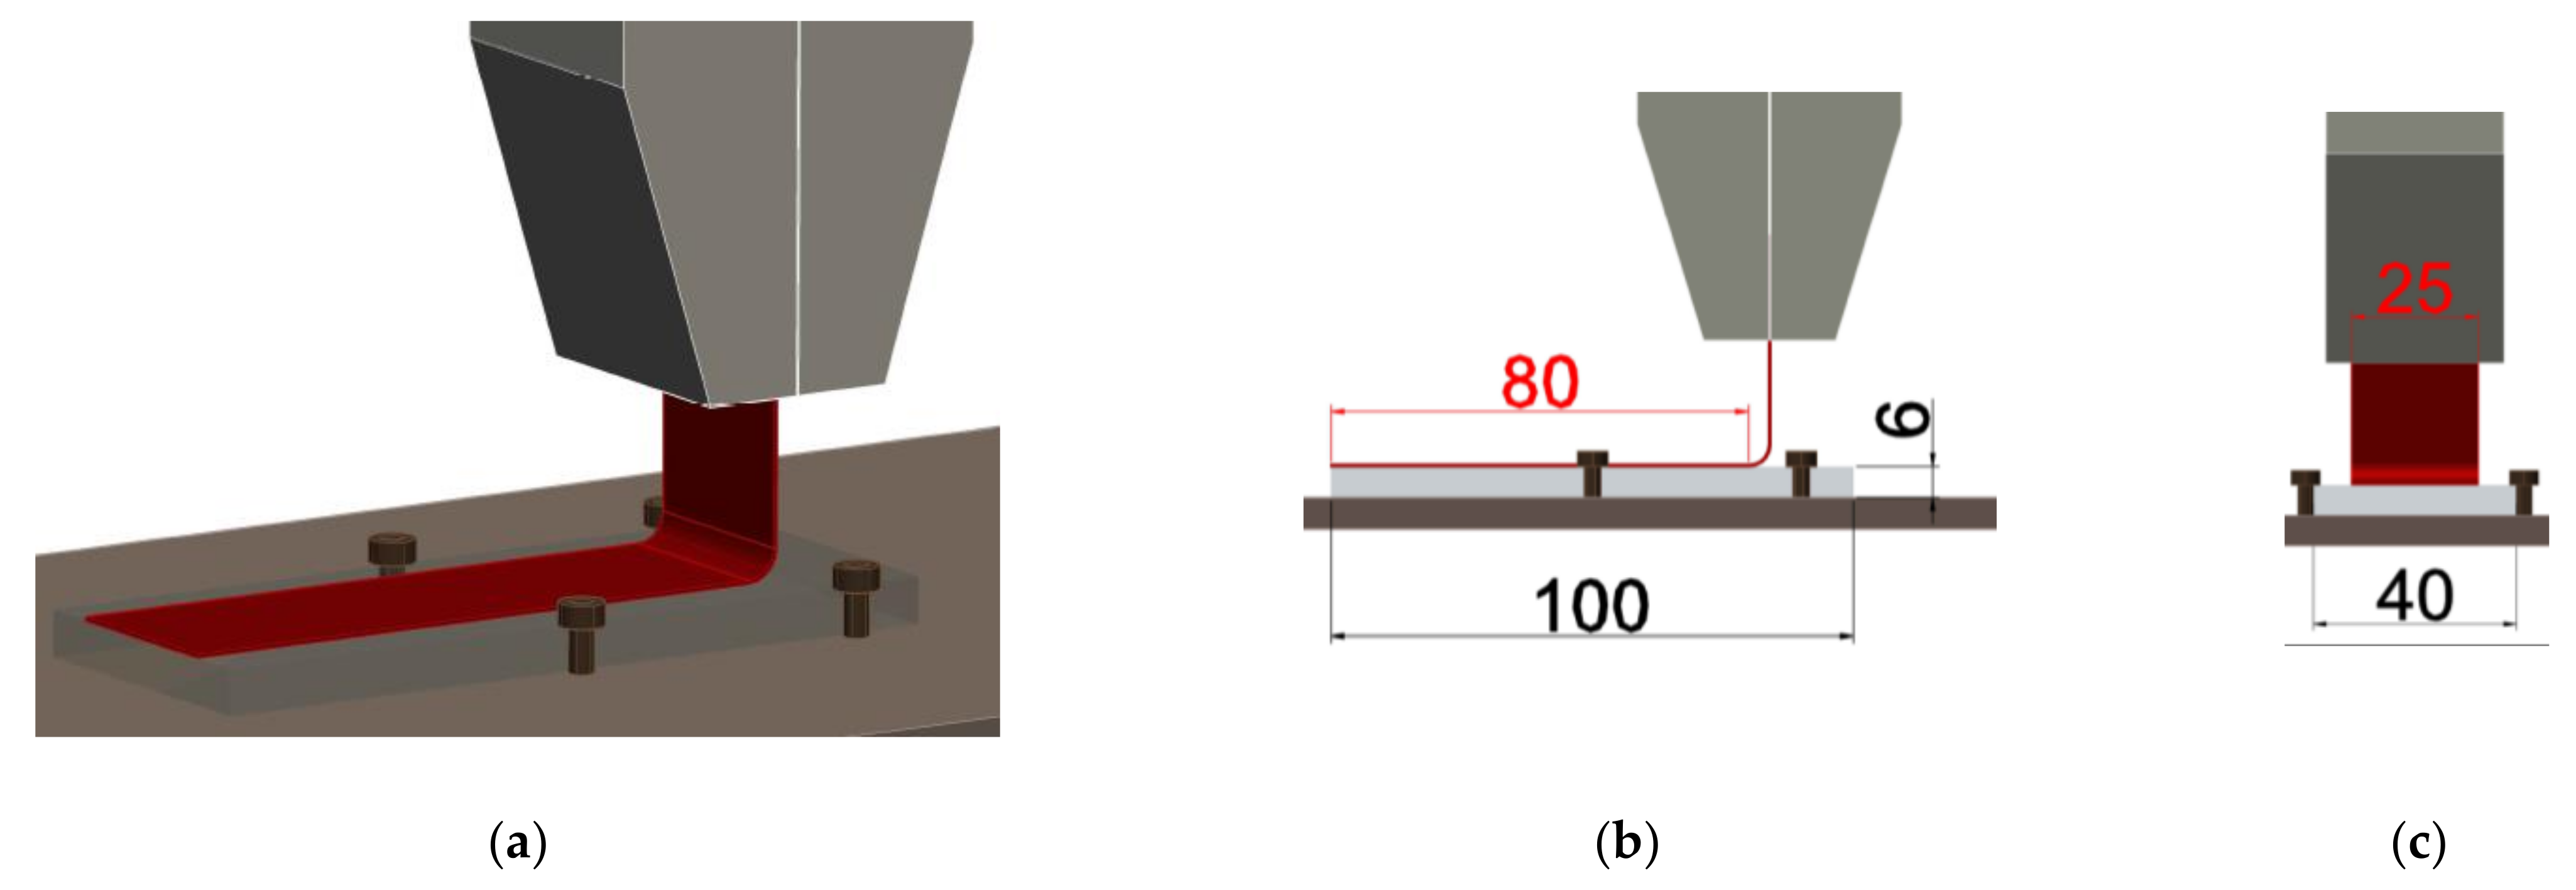
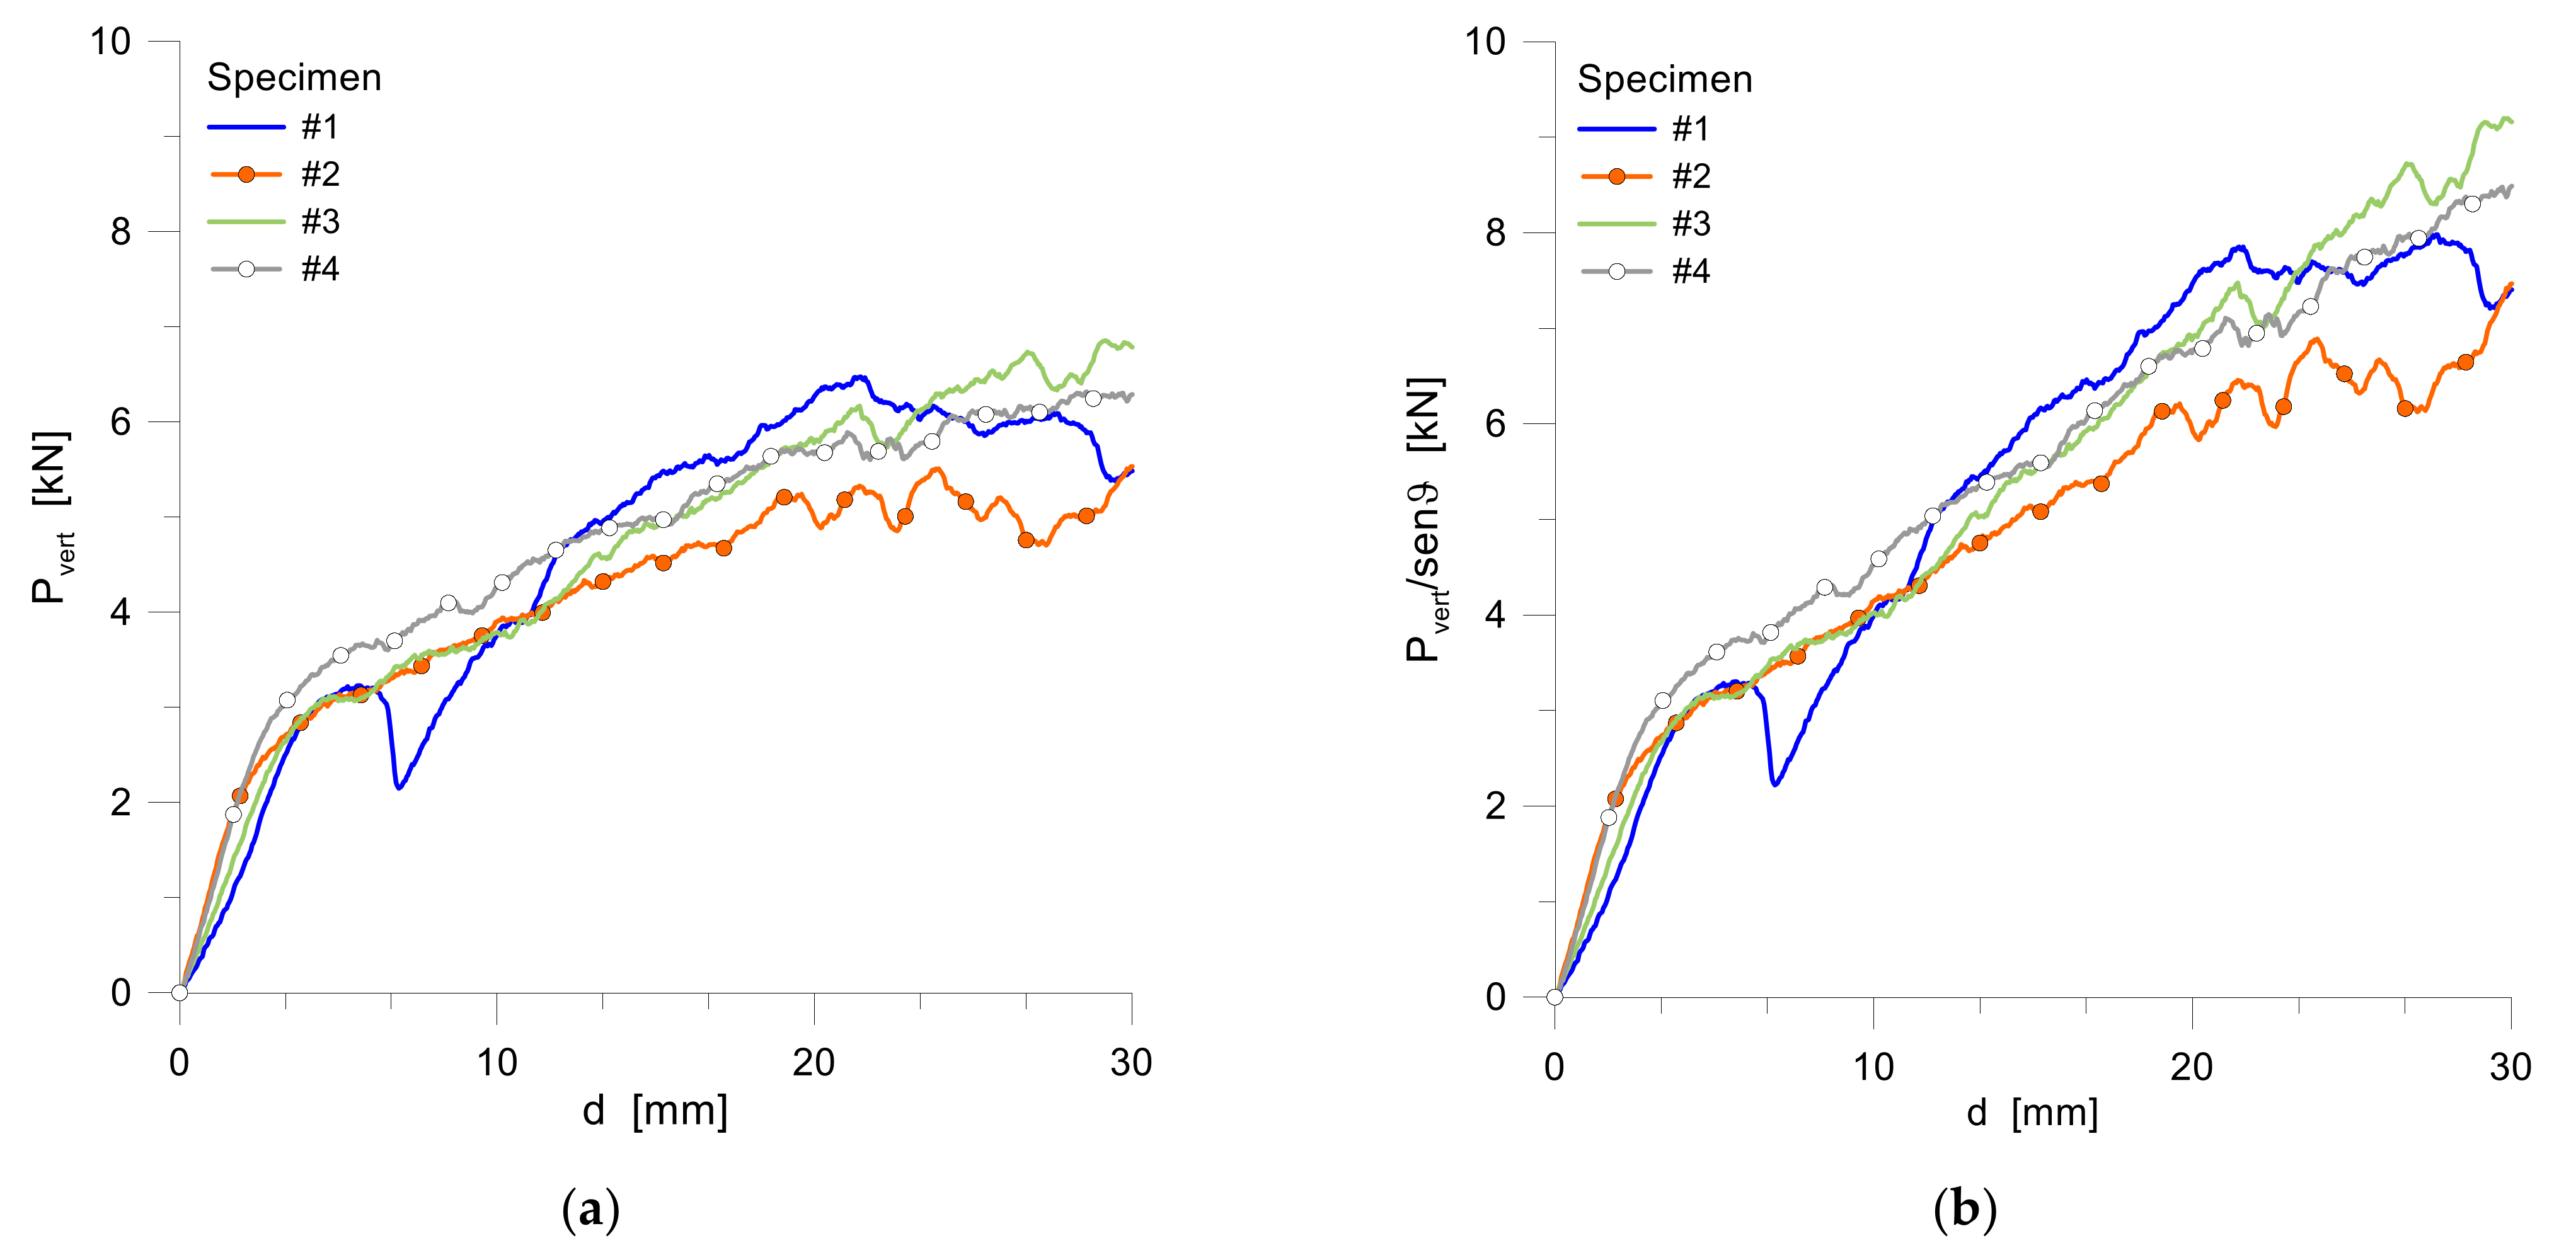
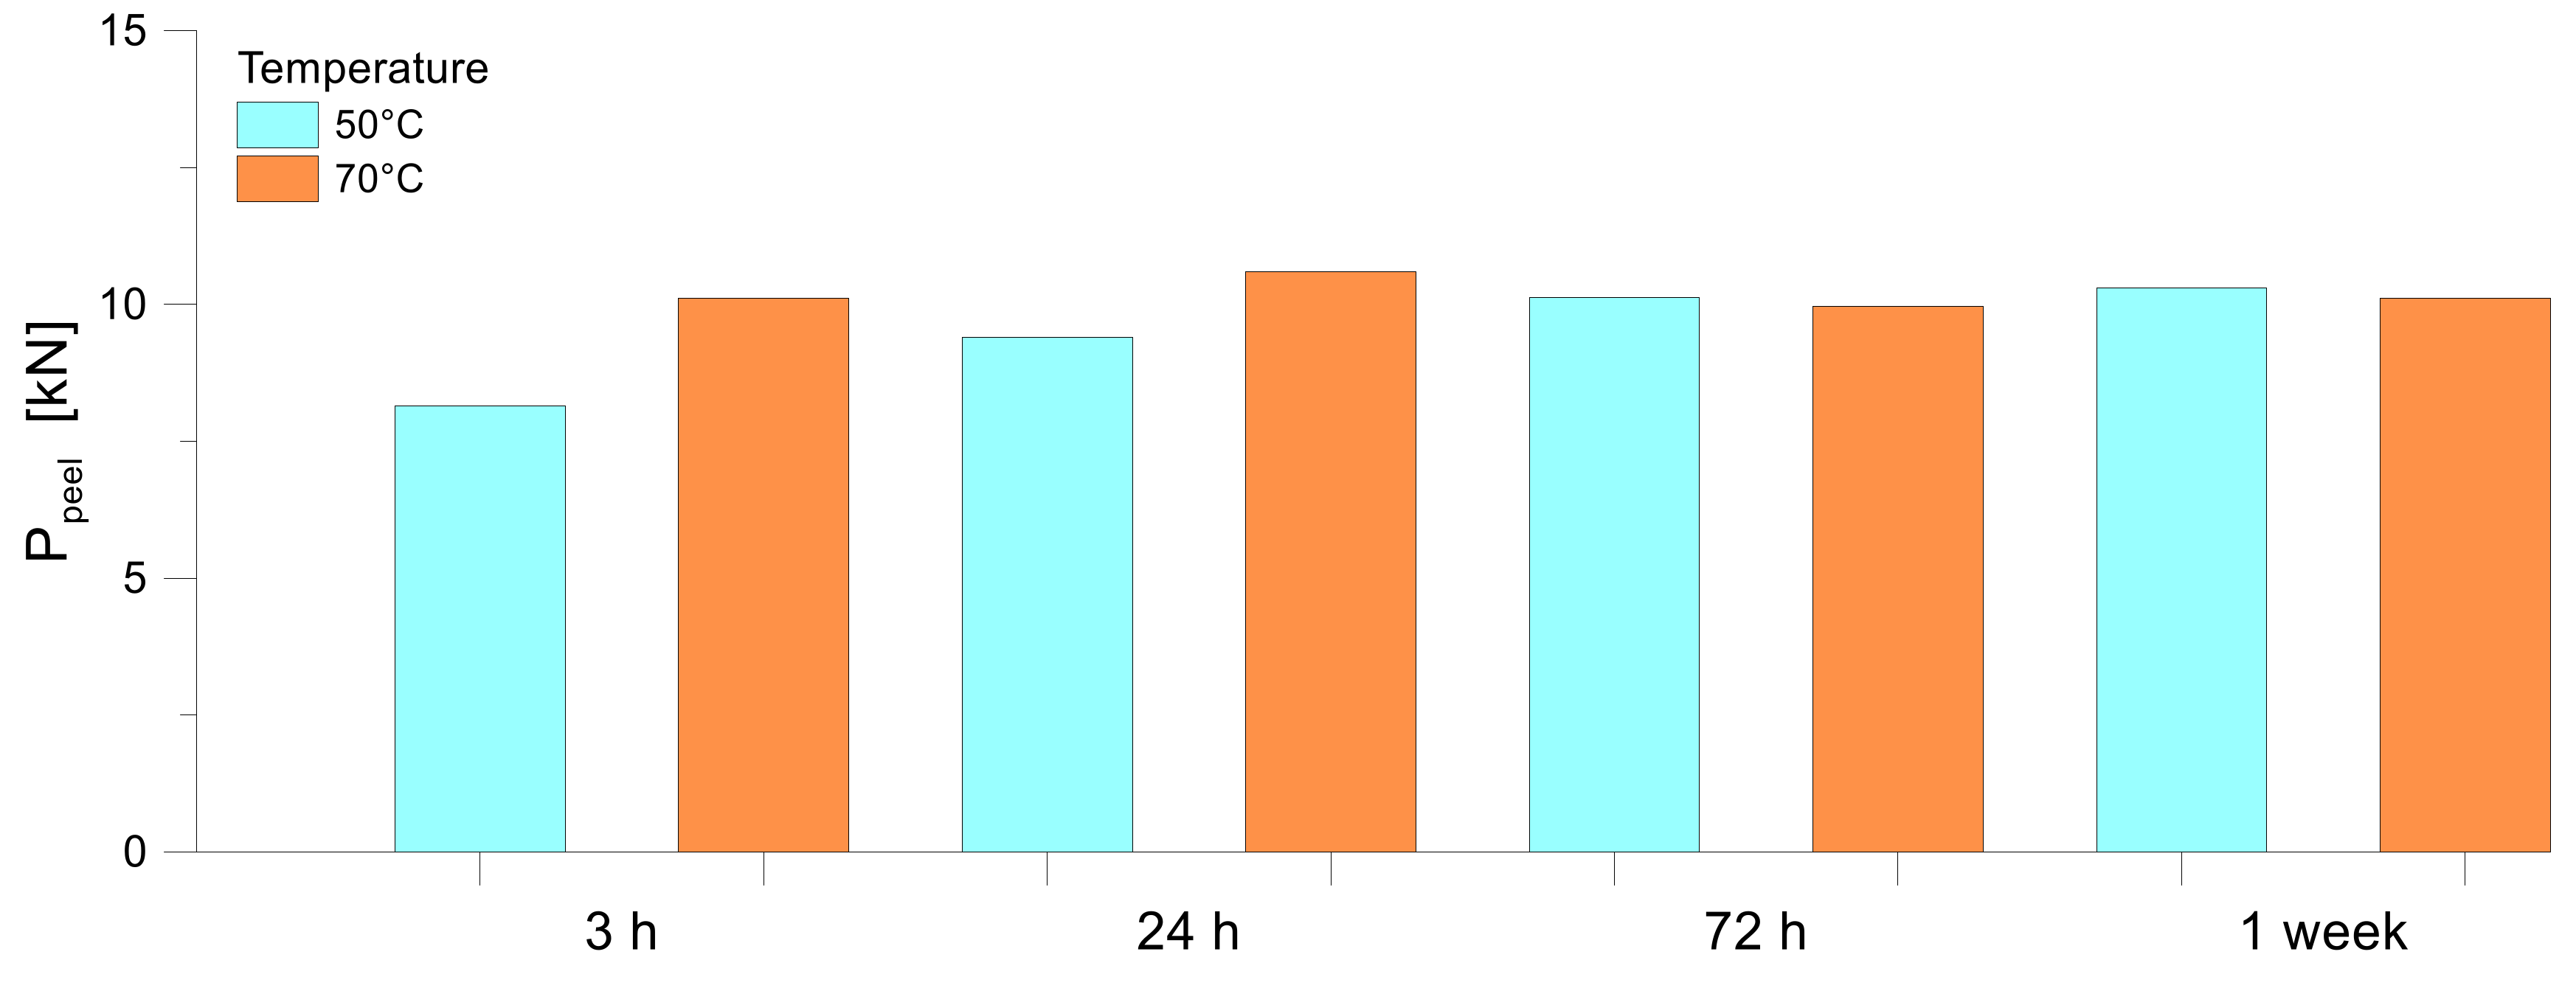
5.2.2. Peel Test
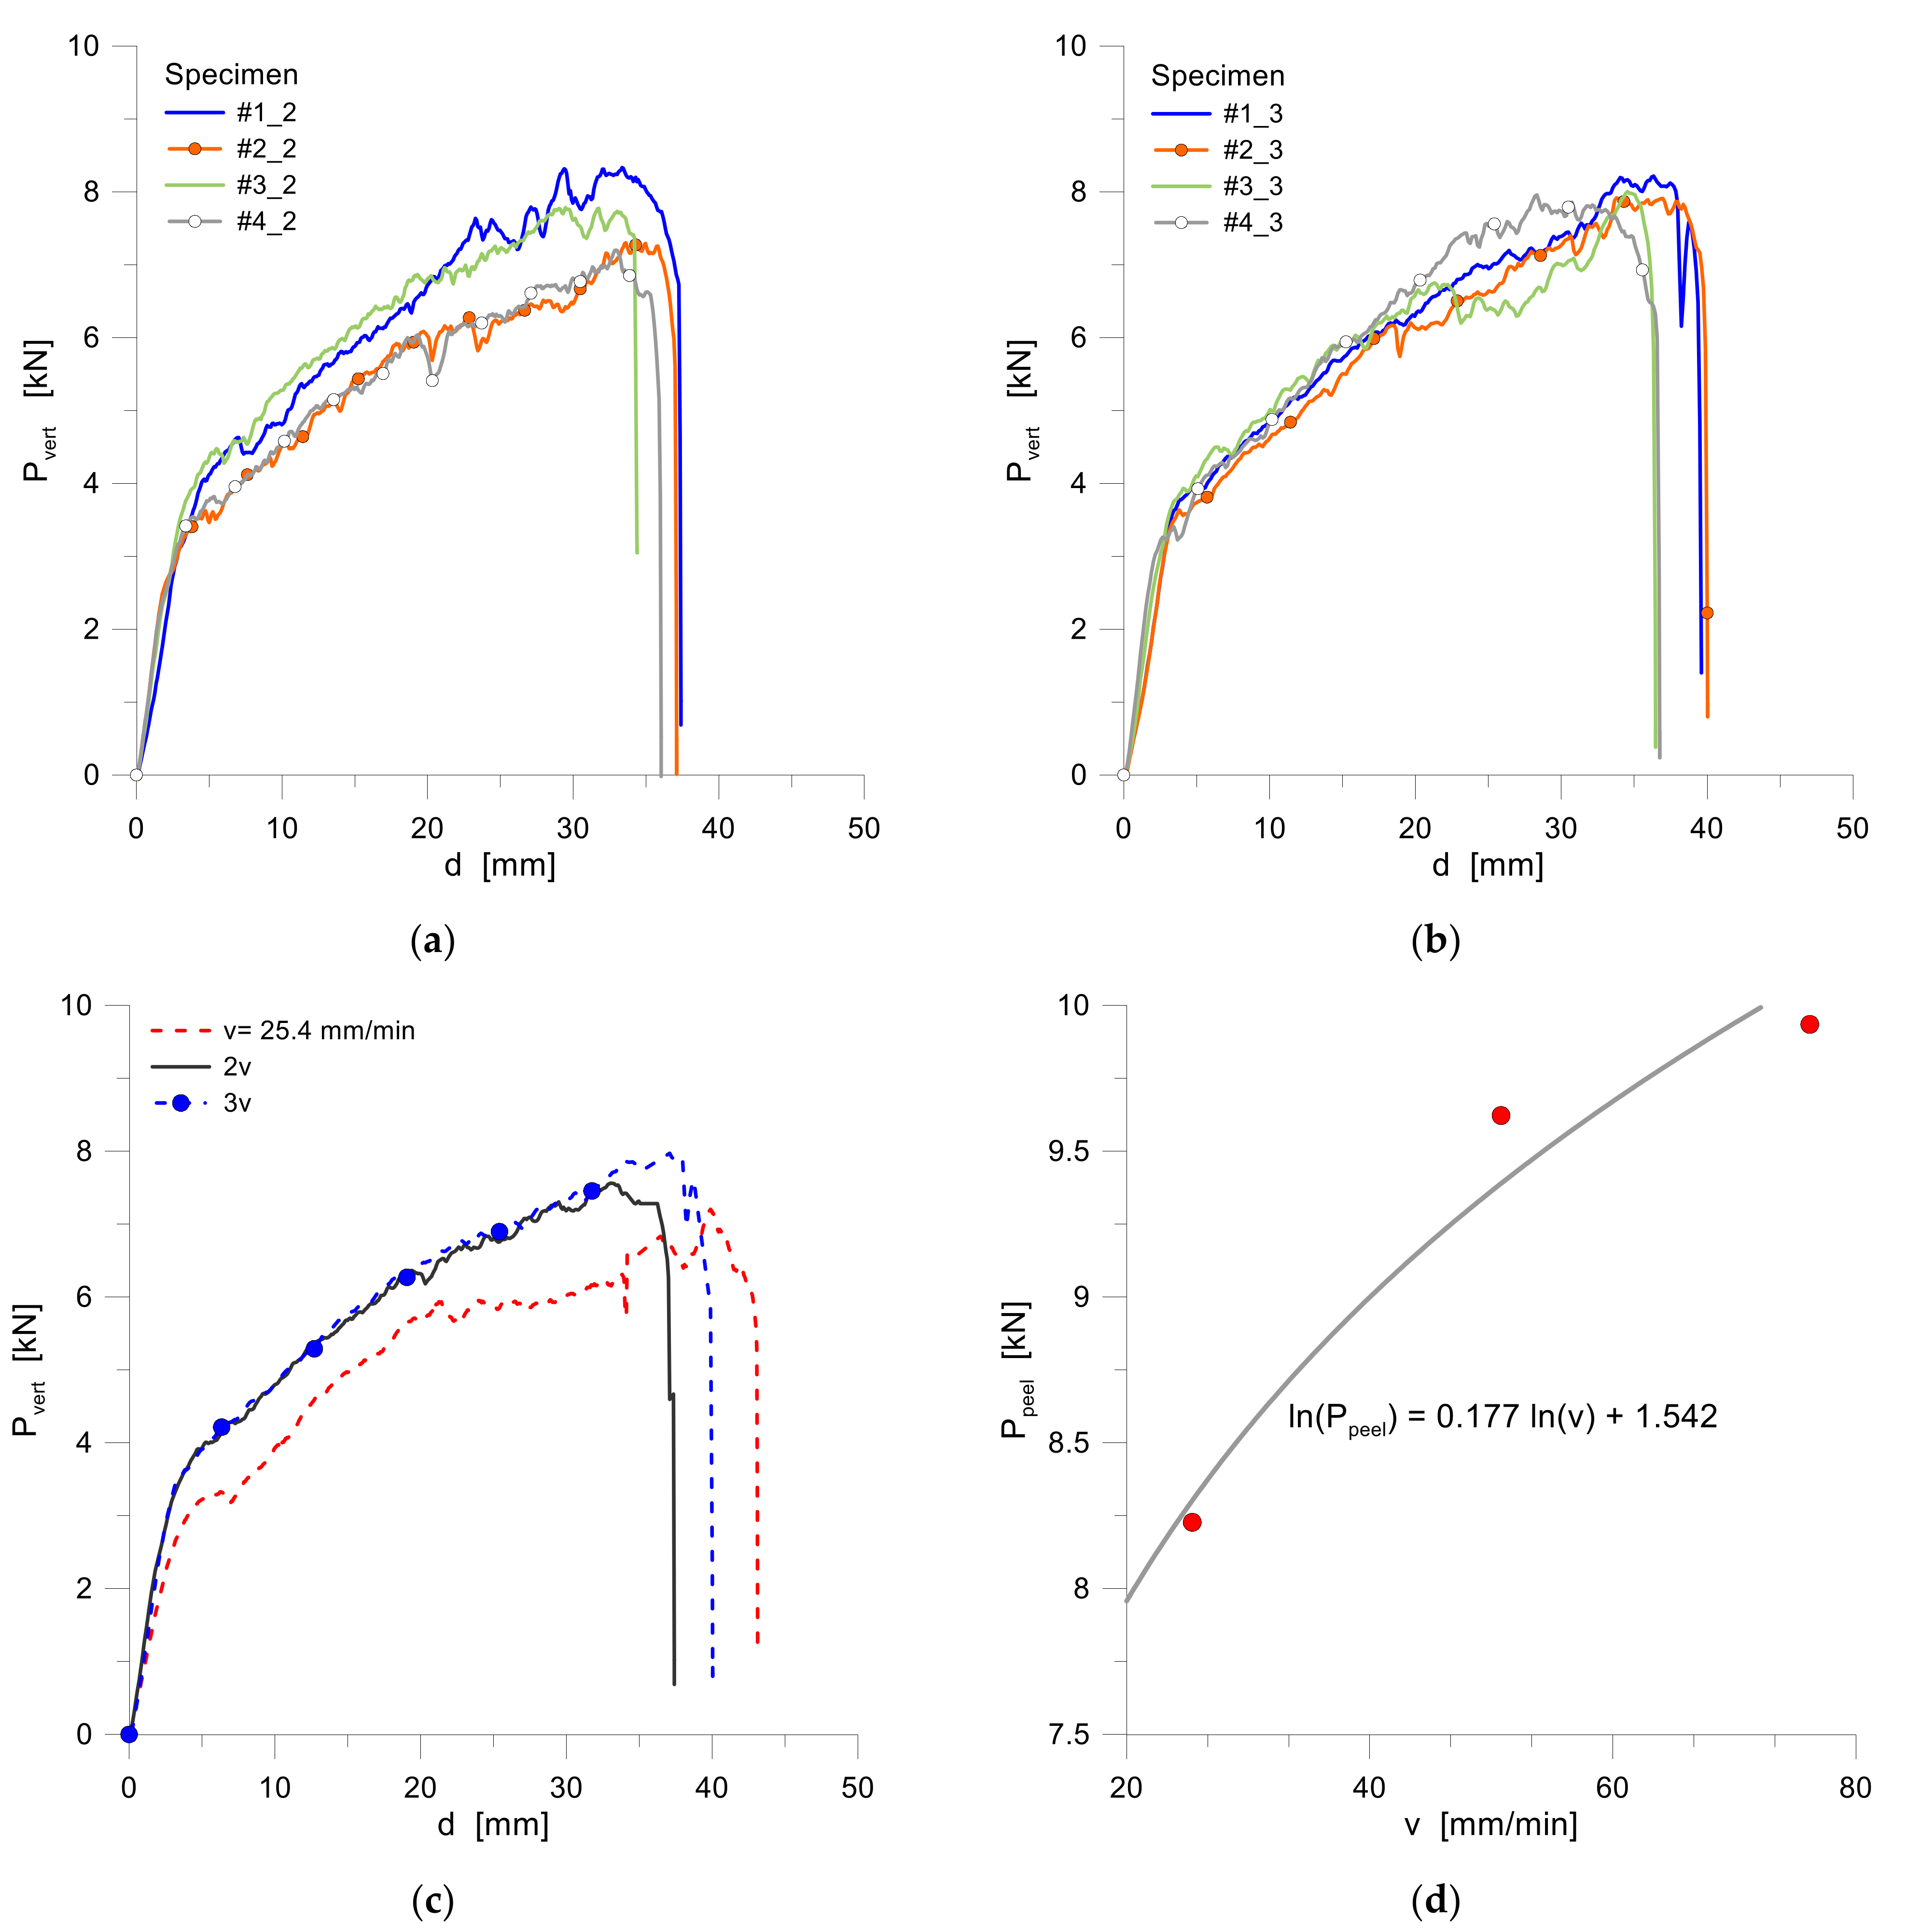
5.2.3. Effect of Peel-Rate and Ageing
6. Coupled Experimental and Numerical Analysis
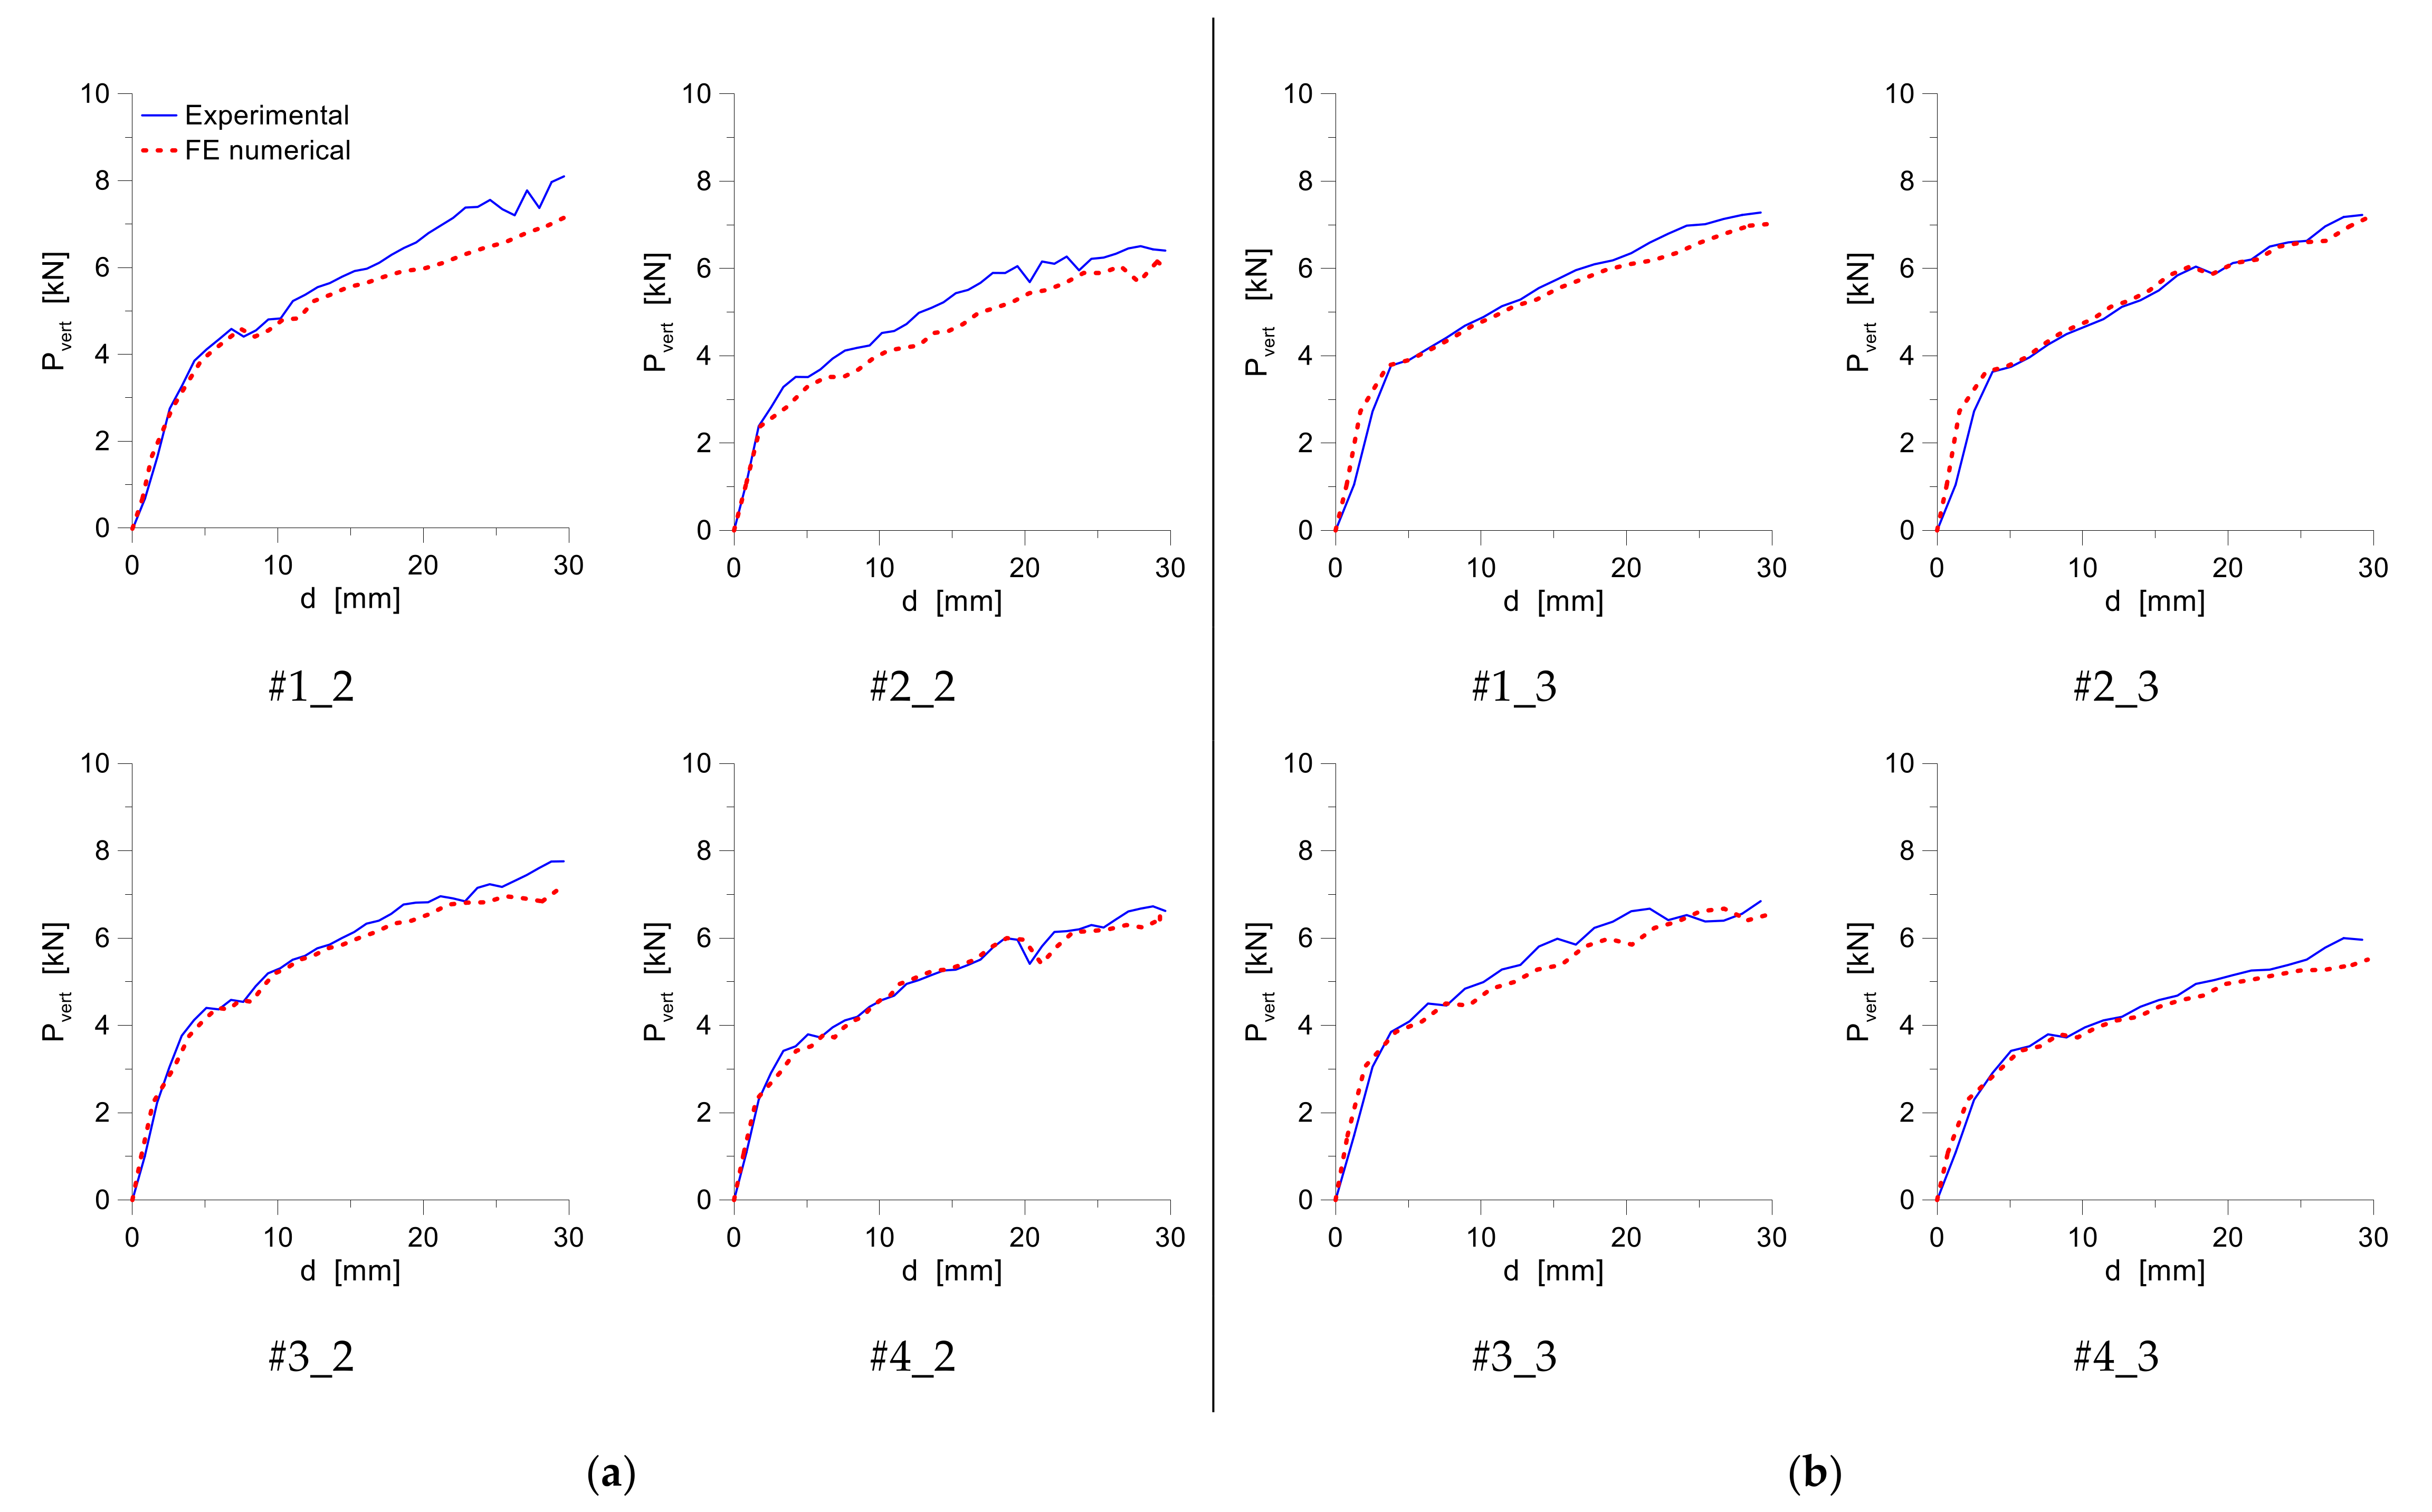
6.1. Peel Rate
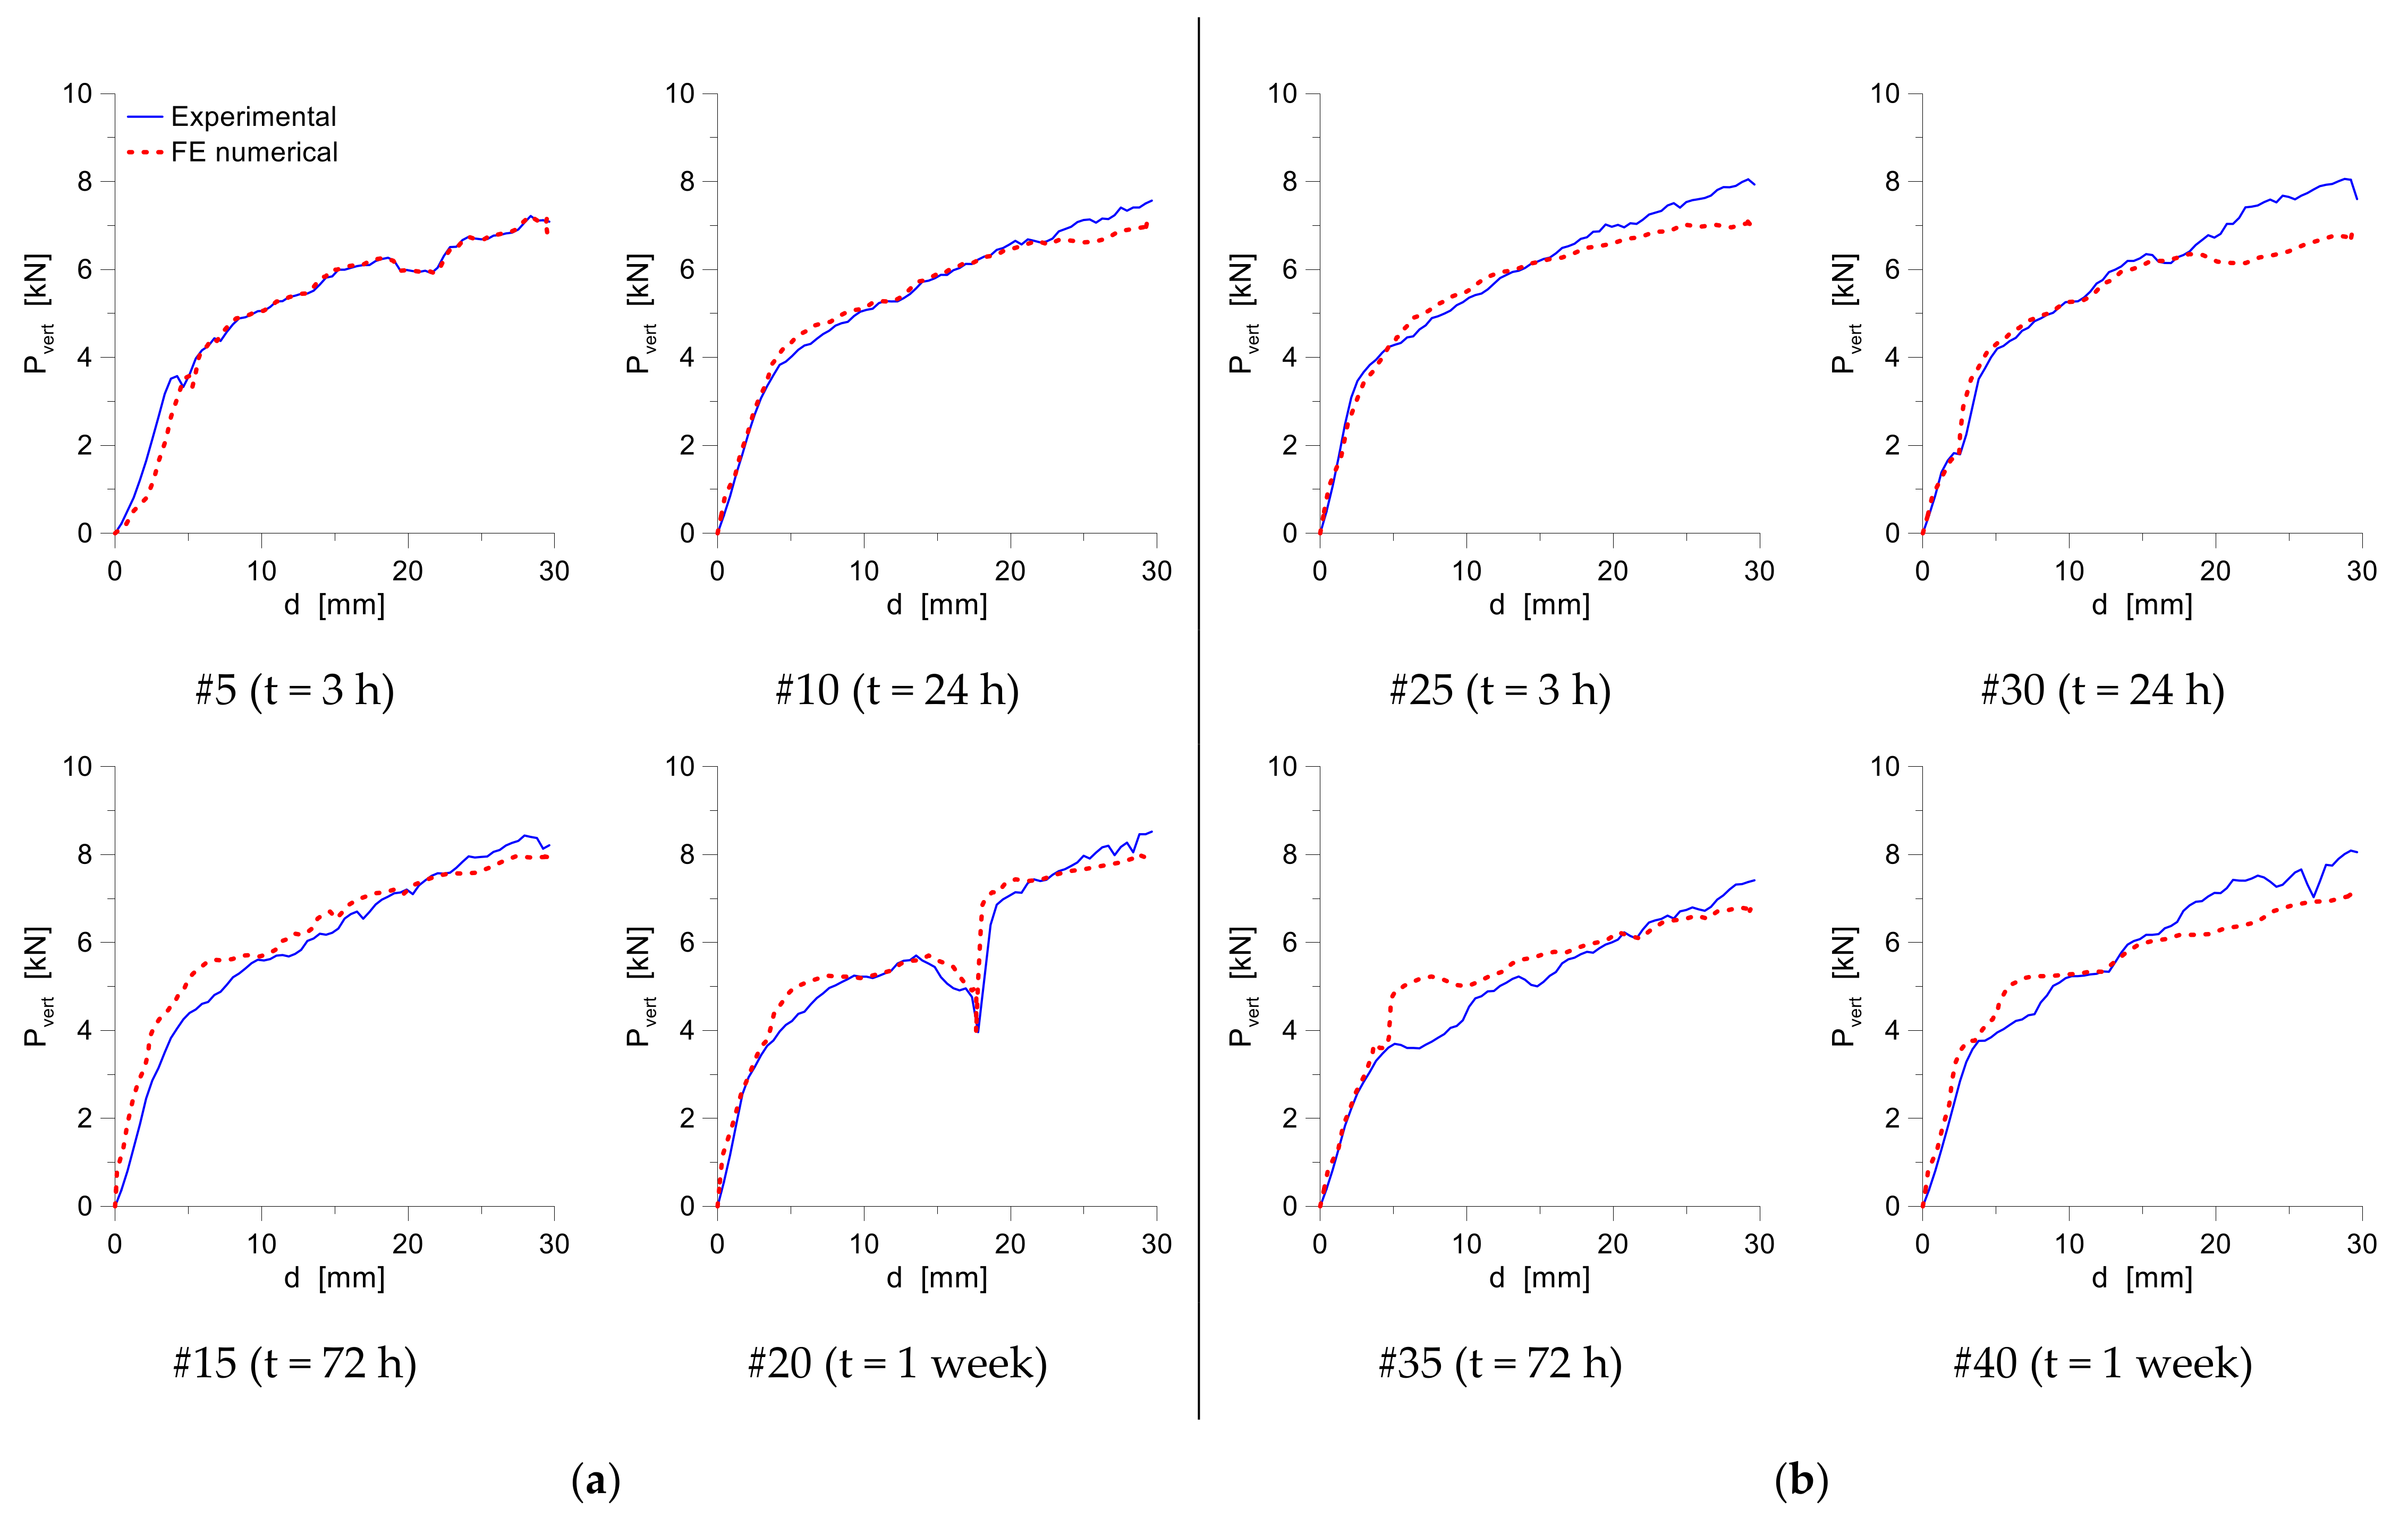
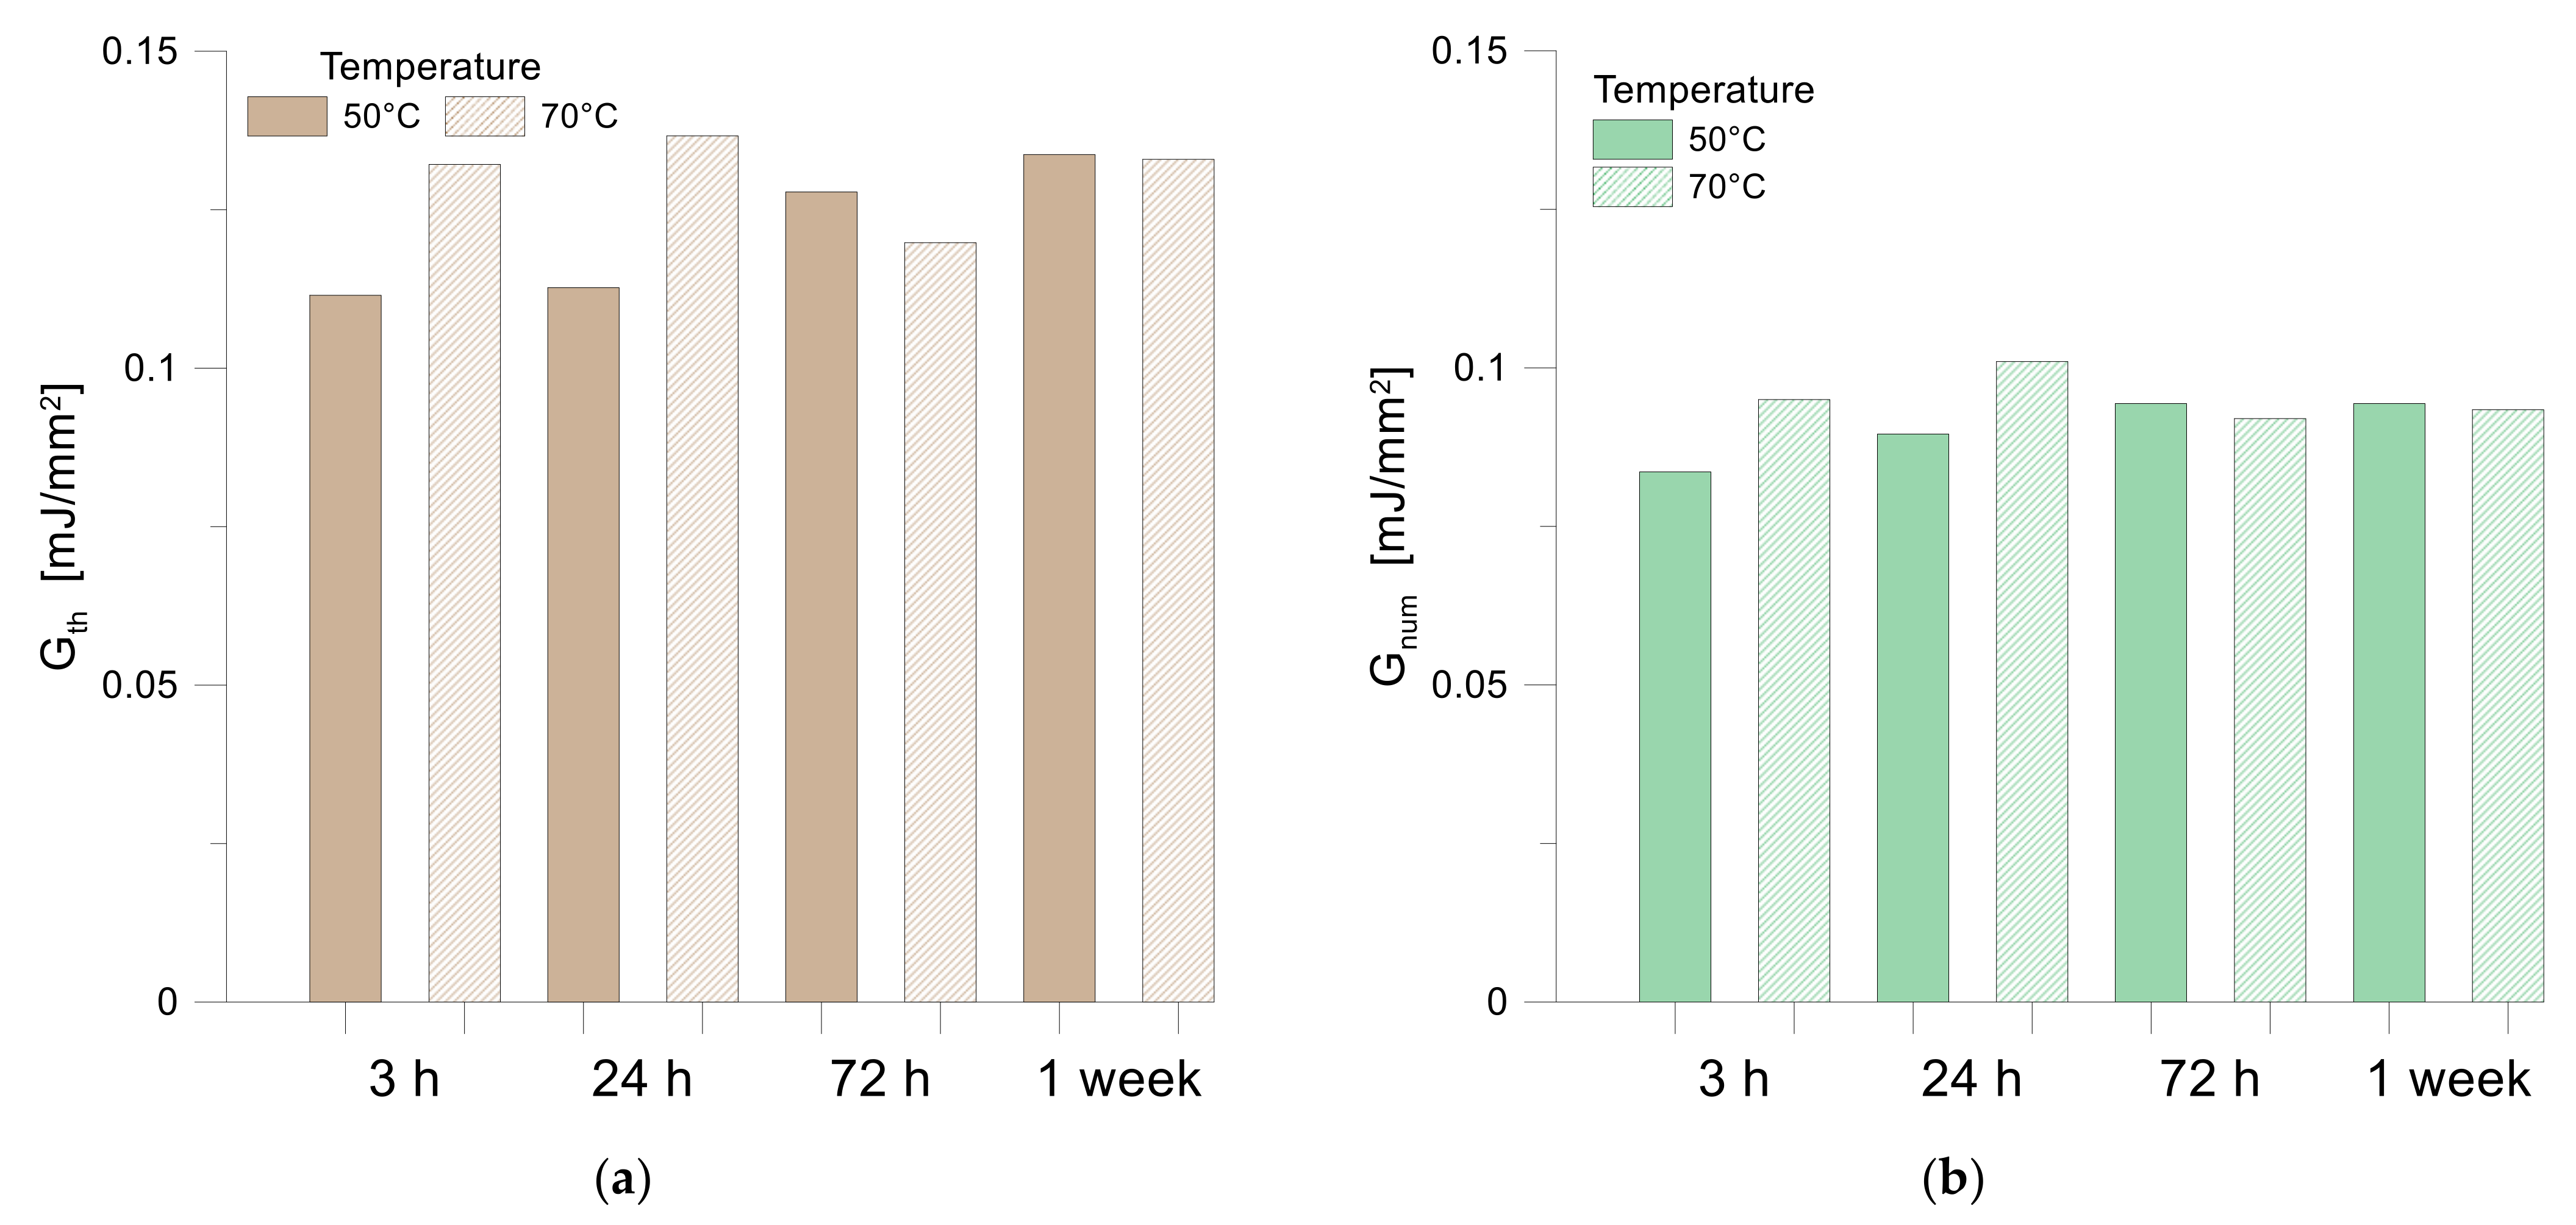
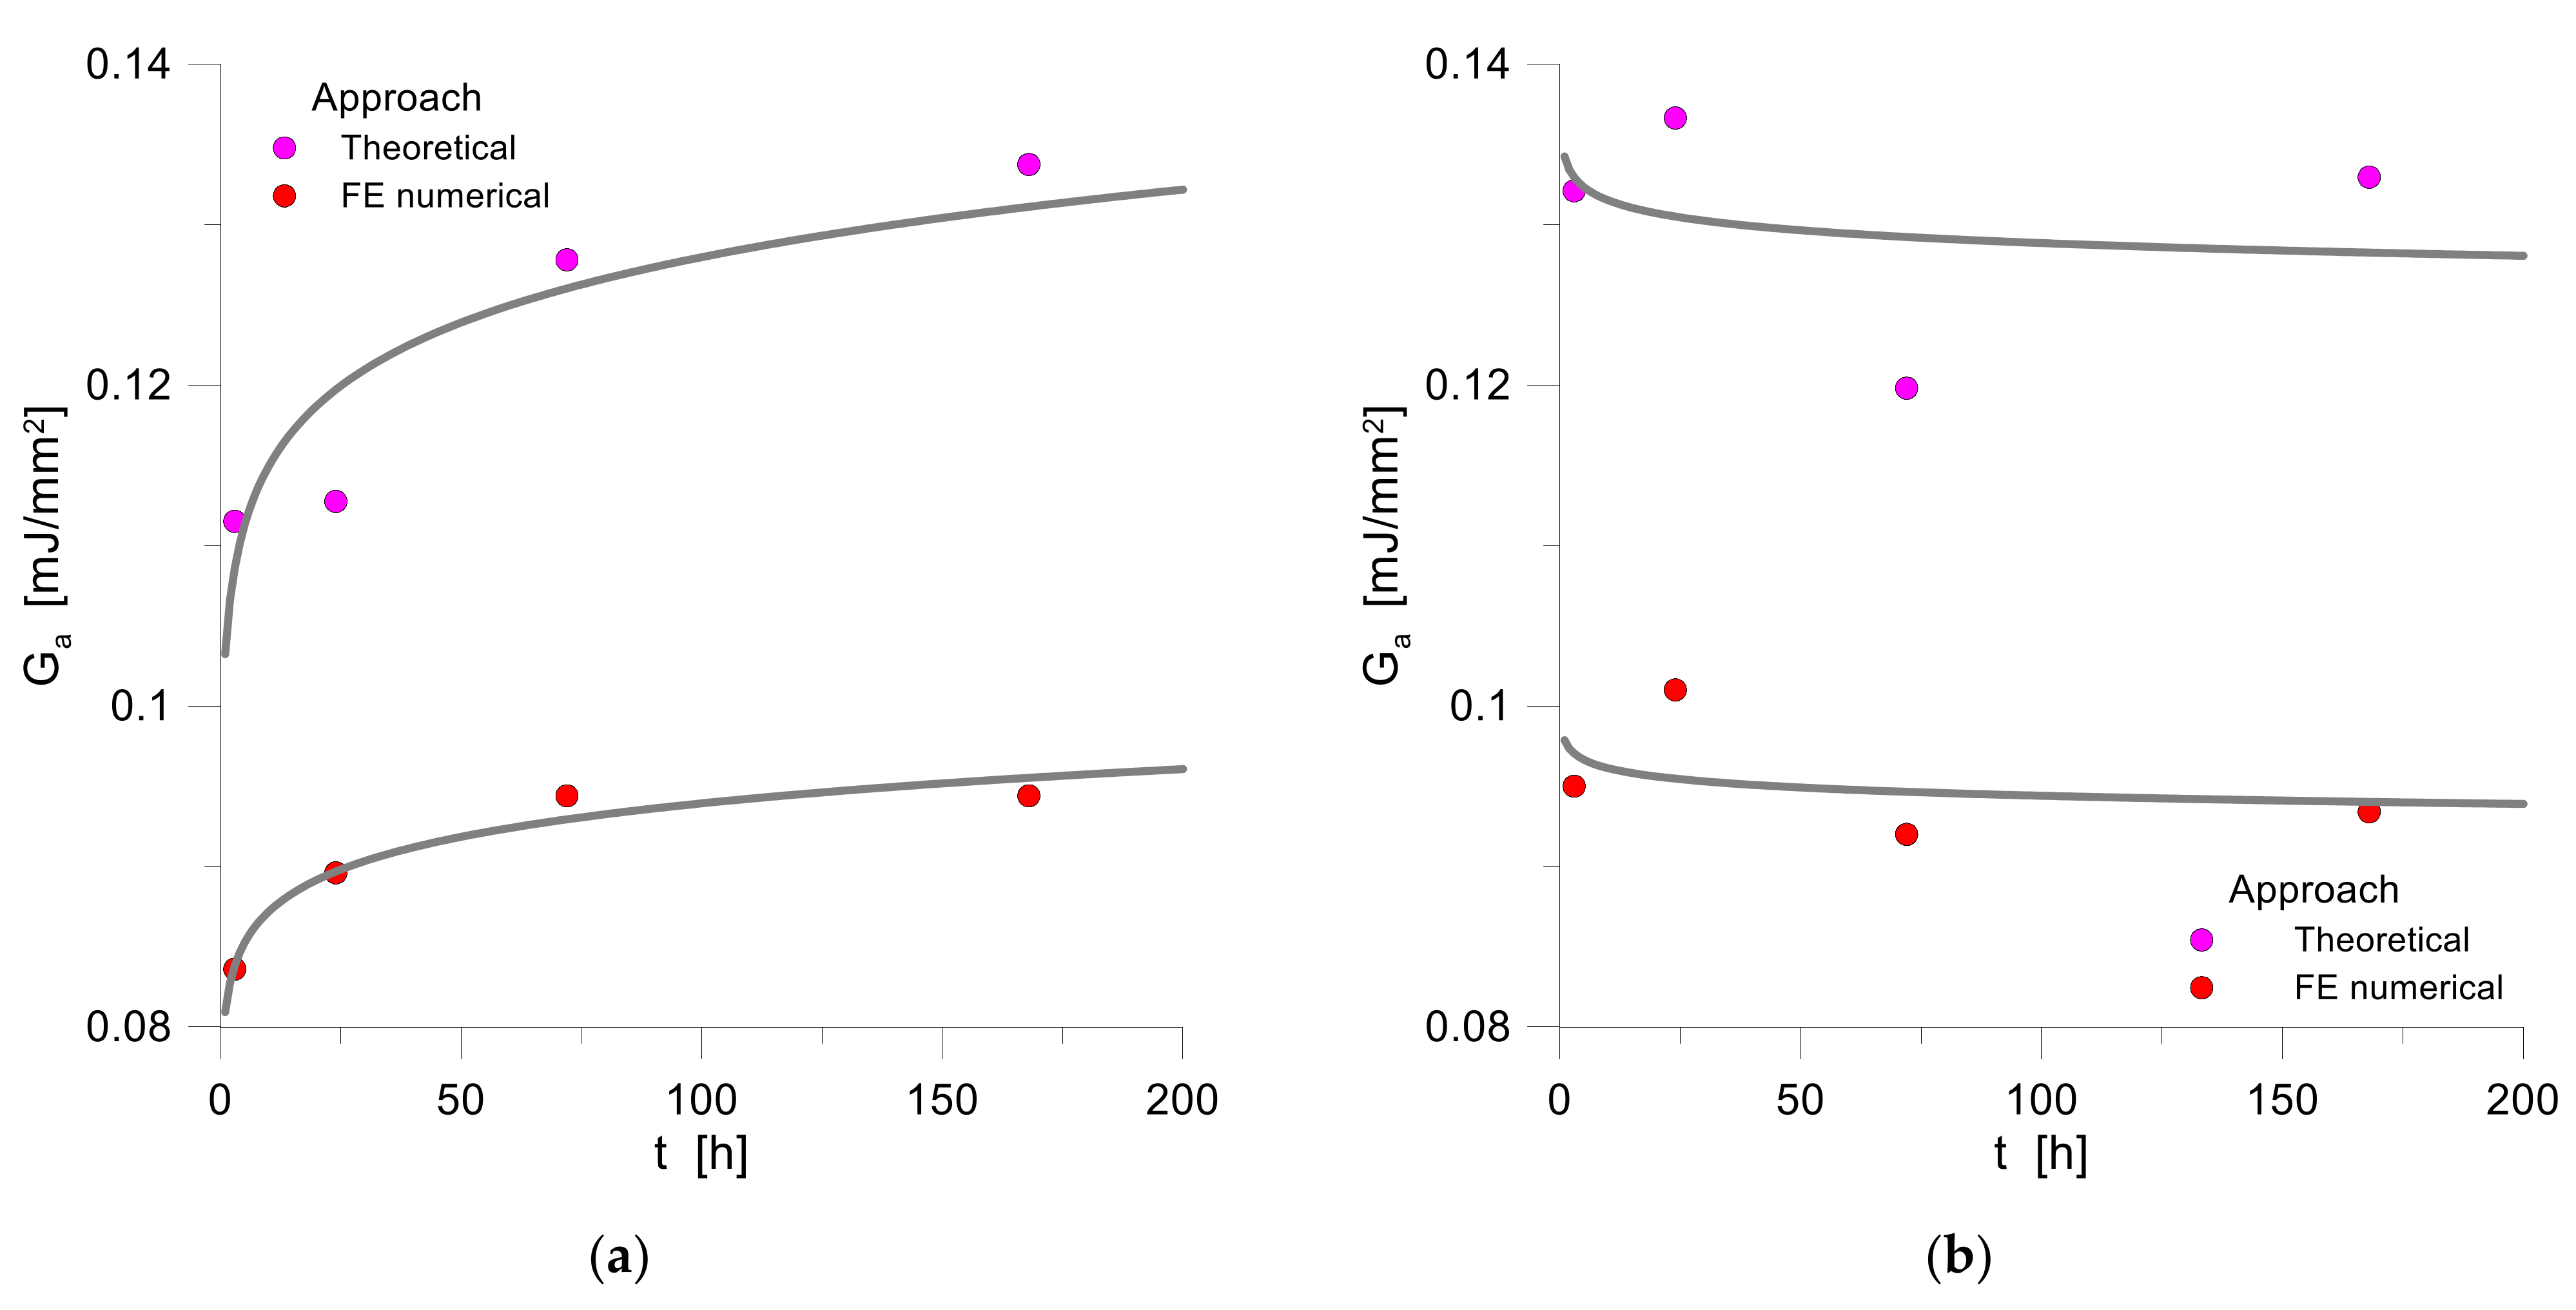
6.2. Ageing
7. Conclusions
Author Contributions
Funding
Institutional Review Board Statement
Informed Consent Statement
Data Availability Statement
Acknowledgments
Conflicts of Interest
References
- Matias, Á.A.; Lima, M.S.; Pereira, J.; Pereira, P.; Barros, R.; Coelho, J.F.; Serra, A.C. Use of recycled polypropylene/poly (ethylene terephthalate) blends to manufacture water pipes: An industrial scale study. Waste Manag. 2020, 101, 250–258. [Google Scholar] [CrossRef] [PubMed]
- Simpson, D.M.; Vaughan, G.A. Ethylene polymers, LLDPE. Encycl. Polym. Sci. Technol. 2002, 2. [Google Scholar]
- Behr, R.A.; Belarbi, A.; Brown, A.T. Seismic performance of architectural glass in a storefront wall system. Earthq. Spectra 1995, 11, 367–391. [Google Scholar] [CrossRef]
- Baird, A.; Palermo, A.; Pampanin, S. Facade damage assessment of multi-storey buildings in the 2011 Christchurch earthquake. Bull. N. Z. Soc. Earthq. Eng. 2011, 44, 368–376. [Google Scholar] [CrossRef] [Green Version]
- Martins, L.; Delgado, R.; Camposinhos, R.; Silva, T. Seismic Behaviour of Point Supported Glass Panels. In Challenging Glass 3: Conference on Architectural and Structural Applications of Glass; Faculty of Civil Engineering and Geosciences, Delft University of Technology: Delft, The Netherlands, 2012; p. 281. [Google Scholar]
- Koper, K.D.; Wallace, T.C.; Hollnack, D. Seismic analysis of the 7 August 1998 truck-bomb blast at the American embassy in Nairobi, Kenya. Seism. Res. Lett. 1999, 70, 512–521. [Google Scholar] [CrossRef]
- Van Dam, S.; Pelfrene, J.; De Pauw, S.; Van Paepegem, W. Experimental study on the dynamic behaviour of glass fitted with safety window film with a small-scale drop weight set-up. Int. J. Impact Eng. 2014, 73, 101–111. [Google Scholar] [CrossRef]
- Figuli, L.; Papan, D.; Papanova, S.; Bedon, C. Experimental mechanical analysis of traditional in-service glass windows subjected to dynamic tests and hard body impact. Smart Struct. Syst. 2021, 27, 365–378. [Google Scholar]
- Caterino, N.; Del Zoppo, M.; Maddaloni, G.; Bonati, A.; Cavanna, G.; Occhiuzzi, A. Seismic assessment and finite element modelling of glazed curtain walls. Struct. Eng. Mech. 2017, 61, 77–90. [Google Scholar] [CrossRef]
- Brueggeman, J.L.; Behr, R.A.; Wulfert, H.; Memari, A.M.; Kremer, P.A. Dynamic racking performance of an earthquake-isolated curtain wall system. Earthq. Spectra 2000, 16, 735–756. [Google Scholar] [CrossRef]
- Bárány, T.; Ronkay, F.; Karger-Kocsis, J.; Czigány, T. In-plane and out-of-plane fracture toughness of physically aged polyesters as assessed by the essential work of fracture (EWF) method. Int. J. Fract. 2005, 135, 251–265. [Google Scholar] [CrossRef]
- Thurston, S.J.; King, A.B. Two-Directional Cyclic Racking of Corner Curtain Wall Glazing; Building Research Association of New Zealand: Wellington, New Zealand, 1992. [Google Scholar]
- Hutchinson, T.C.; Zhang, J.; Eva, C. Development of a drift protocol for seismic performance evaluation considering a damage index concept. Earthq. Spectra 2011, 27, 1049–1076. [Google Scholar] [CrossRef]
- Memari, A.M.; Behr, R.A.; Kremer, P.A. Dynamic racking crescendo tests on architectural glass fitted with anchored pet film. J. Archit. Eng. 2004, 10, 5–14. [Google Scholar] [CrossRef]
- Centre for the Protection of National Infrastructure. Guidance Note: Peel Adhesion Testing and Assessment of Anti-Shatter Film (ASF); Centre for the Protection of National Infrastructure: London, UK, 2013. [Google Scholar]
- Gent, A.N.; Hamed, G.R. Peel Mechanics. J. Adhes. 1975, 7, 91–95. [Google Scholar] [CrossRef]
- Kaelble, D.H. Theory and analysis of peel adhesion: Mechanisms and mechanics. Trans. Soc. Rheol. 1959, 3, 161–180. [Google Scholar] [CrossRef]
- Kaelble, D.H. Theory and analysis of peel adhesion: Bond stresses and distributions. Trans. Soc. Rheol. 1960, 4, 45–73. [Google Scholar] [CrossRef]
- Kaelble, D.H. Peel adhesion: Micro-fracture mechanics of interfacial unbonding of Polymers. Trans. Soc. Rheol. 1965, 9, 125–163. [Google Scholar] [CrossRef]
- Kaelble, D.H. Theory and Analysis of peel adhesion: Rate-temperature dependence of viscoelastic interlayers. J. Colloid Sci. 1964, 19, 413–424. [Google Scholar] [CrossRef]
- Gent, A.N.; Petrich, R.P. Adhesion of viscoelastic materials to rigid substrates. Proc. R. Soc. A 1969, 310, 433–448. [Google Scholar]
- Kinloch, A.J.; Lau, C.C.; Williams, J.G. The peeling of flexible laminates. Int. J. Fract. 1994, 66, 45–70. [Google Scholar] [CrossRef]
- Kinloch, A.J. Adhesive in engineering. Proc. Inst. Mech. Eng. Part G J. Aerosp. Eng. 1997, 211, 307–335. [Google Scholar] [CrossRef] [Green Version]
- Anderson, T.L. Fracture Mechanics: Fundamentals and Applications, 3rd ed.; CRC press: Boca Raton, FL, USA, 2005. [Google Scholar]
- Kinloch, A.J. The science of adhesion. J. Mater. Sci. 1980, 15, 2141–2166. [Google Scholar] [CrossRef]
- IC_Peel. Adhesion, Adhesives and Composites Group, Imperial College, London, UK. Available online: http://www3.imperial.ac.uk/meadhesion/estprotocols/peel (accessed on 12 January 2022).
- ASTM D882-02. Standard Test Method for Tensile Properties of Thin Plastic Sheeting. p. 9. Available online: https://doi.org/10.1520/D0882-02 (accessed on 12 January 2022).
- Bedon, C.; Mattei, S. Multistep Experimental Calibration of Mechanical Parameters for Modelling Multilayer Antishatter Safety Films in Structural Glass Protection. Math. Probl. Eng. 2021, 2021, 14. [Google Scholar] [CrossRef]
- Simulia. ABAQUS v. 6.12 Computer Software and Online Documentation; Dassault Systems: Providence, RI, USA, 2017. [Google Scholar]
- GRANTA Design. CES Selector Software Materials Data Set, 2012. In Polymer Data Handbook, 2nd ed.; Oxford Press: Oxford, UK, 1999. [Google Scholar]
- JRC Scientific and Policy Reports. Fibre Labelling Polytrimethylene Terephthalate—PTT-DuPont; European Union: Luxembourg, 2013; Available online: https://doi.org/10.2788/82737 (accessed on 12 January 2022).
- Socrates, G. Infrared and Raman Characteristic Group Frequencies: Tables and Charts; John Wiley & Sons: Hoboken, NJ, USA, 2004. [Google Scholar]
- Aflori, M. Plasma processing of surfaces and particles. In Proceedings of the 28th International Conference on Phenomena in Ionized Gases (ICPIG), Prague, Czech Republic, 15–20 July 2007. [Google Scholar]
- Arkhireyeva, A.; Hashemi, S. Effect of temperature on fracture properties of an amorphous poly(ethylene terephthalate) (PET) film. J. Mater. Sci. Technol. 2002, 37, 3675–3683. [Google Scholar]
- Funabashi, M.; Ninomiya, F.; Oishi, A.; Ouchi, A.; Hagihara, H.; Suda, H.; Kunioka, M. Poly (ethylene terephthalate) Film Using Xenon Lamp with Heating System. J. Polym. 2016, 2016, 8547524. [Google Scholar]
- Gupta, S.; Dixit, M.; Sharma, K.; Saxena, N.S. Mechanical study of metallized polyethylene terephthalate (PET) films. Surf. Coat. Technol. 2009, 204, 661–666. [Google Scholar] [CrossRef]
- Gohil, R.M. Morphology-Property Relationship in Oriented PET Films: Microstrudural Reorganization during Heat Treatment. J. Appl. Polym. Sci. 1994, 52, 925–944. [Google Scholar] [CrossRef]
- Kanuga, K. Degradation of polyester film exposed to acerated indoor damp heat aging. In Conference Record of the IEEE Photovoltaic Specialists Conference; IEEE: Piscataway, NJ, USA, 2011; pp. 96–100. [Google Scholar]
- Mohandesi, J.A.; Refahi, A.; Meresht, E.S.; Berenji, S. Effect of temperature and particle weight fraction on mechanical and micromechanical properties of sand-polyethylene terephthalate composites: A laboratory and discrete element method study. Compos. Part B 2011, 42, 1461–1467. [Google Scholar] [CrossRef]
- Oreski, G.; Wallner, G.M. Delamination behaviour of multi-layer films for PV encapsulation. Sol. Energy Mater. Sol. Cells 2005, 89, 139–151. [Google Scholar] [CrossRef]
- ASTM D1876—08(2015)e1—Standard Test Method for Peel Resistance of Adhesives (T-Peel Test); ASTM International: West Conshohocken, PA, USA, 2015.
- ASTM D903—98(2017)—Standard Test Method for Peel or Stripping Strength of Adhesive Bonds; ASTM International: West Conshohocken, PA, USA, 2017.
- ISO 11339:2010—Adhesives—T-Peel Test for Flexible-to-Flexible Bonded Assemblies; ASTM International: West Conshohocken, PA, USA, 2010.
- Kovalchick, C.; Molinari, A.; Ravichandran, G. Rate Dependent Adhesion Energy and Nonsteady Peeling of Inextensible Tapes. J. Appl. Mech. 2014, 81, 041016. [Google Scholar] [CrossRef] [Green Version]
- Musto, M.; Alfano, G. A novel rate-dependent cohesive-zone model combining damage and visco-elasticity. Comput. Struct. 2013, 118, 126–133. [Google Scholar] [CrossRef] [Green Version]
- Musto, M.; Alfano, G. A fractional rate-dependent cohesive zone model. Int. J. Numer. Methods Eng. 2015, 103, 313–341. [Google Scholar] [CrossRef] [Green Version]
- ISO 9142:2003—Adhesives—Guide to the Selection of Standard Laboratory Ageing Conditions for Testing Bonded Joints; ASTM International: West Conshohocken, PA, USA, 2003.
- McGuiggan, P.M.; Chiche, A.; Filliben, J.J.; Yarusso, D.J. Peel of an adhesive tape from a temperature-gradient surface. Int. J. Adhes. Adhes. 2008, 28, 185. [Google Scholar] [CrossRef]
- Yarusso, D.J. Effect of Rheology on PSA Performance. In Chapter 13 in ‘The Mechanics of Adhesion’; Elsevier: Amsterdam, The Netherlands, 2002; pp. 499–533. ISBN 0444511407. [Google Scholar]


| Specimen # | T | Ageing Time | Displacement Rate |
|---|---|---|---|
| [°C] | [h] | [mm/min] | |
| 1–4 | 23 | - | 25.4 |
| 1_2–4_2 | 23 | - | 50.8 |
| 1_3–4_3 | 23 | - | 71.6 |
| 5–9 | 50 | 3 | 25.4 |
| 10–14 | 50 | 24 | 25.4 |
| 15–19 | 50 | 72 | 25.4 |
| 20–24 | 50 | 168 | 25.4 |
| 25–29 | 70 | 3 | 25.4 |
| 30–34 | 70 | 24 | 25.4 |
| 35–39 | 70 | 72 | 25.4 |
| 40–44 | 70 | 168 | 25.4 |
Publisher’s Note: MDPI stays neutral with regard to jurisdictional claims in published maps and institutional affiliations. |
© 2022 by the authors. Licensee MDPI, Basel, Switzerland. This article is an open access article distributed under the terms and conditions of the Creative Commons Attribution (CC BY) license (https://creativecommons.org/licenses/by/4.0/).
Share and Cite
Mattei, S.; Cozzarini, L.; Bedon, C. Experimental and Numerical Peeling Investigation on Aged Multi-Layer Anti-Shatter Safety Films (ASFs) for Structural Glass Retrofit. Symmetry 2022, 14, 162. https://doi.org/10.3390/sym14010162
Mattei S, Cozzarini L, Bedon C. Experimental and Numerical Peeling Investigation on Aged Multi-Layer Anti-Shatter Safety Films (ASFs) for Structural Glass Retrofit. Symmetry. 2022; 14(1):162. https://doi.org/10.3390/sym14010162
Chicago/Turabian StyleMattei, Silvana, Luca Cozzarini, and Chiara Bedon. 2022. "Experimental and Numerical Peeling Investigation on Aged Multi-Layer Anti-Shatter Safety Films (ASFs) for Structural Glass Retrofit" Symmetry 14, no. 1: 162. https://doi.org/10.3390/sym14010162
APA StyleMattei, S., Cozzarini, L., & Bedon, C. (2022). Experimental and Numerical Peeling Investigation on Aged Multi-Layer Anti-Shatter Safety Films (ASFs) for Structural Glass Retrofit. Symmetry, 14(1), 162. https://doi.org/10.3390/sym14010162